Embed Size (px)
Citation preview
Hochschild Mining plc
Sell Side Roundtable
Ignacio Bustamante, CEO
Ramon Barúa, CFO
Isabel Lutgendorf, Head of IR
1
Disclaimer
Some statements contained in this presentation or in documents referred to in it are or may be forward‐
looking statements. Actual results may differ from those expressed in such statements, depending on a
variety of factors.
Past performance of the Company or its shares cannot be relied on as a guide to future performance.
Any forward‐looking information contained in this presentation has been prepared on the basis of a
number of assumptions which may prove to be incorrect, and accordingly, actual results may vary.
This presentation does not constitute, or form part of or contain any invitation or offer to any person to
underwrite, subscribe for, otherwise acquire, or dispose of any shares in Hochschild Mining plc or advise
persons to do so in any jurisdiction, nor shall it, or any part of it, form the basis of or be relied on in any
connection with or act as an inducement to enter into any contract or commitment therefore. No reliance
may be placed for any purpose whatsoever on the information or opinions contained in this document or
on its completeness and no liability whatsoever is accepted for any loss howsoever arising from any use of
this document or its contents otherwise in connection therewith.
Nothing in this presentation is to be
construed as a profit forecast.
This presentation has been prepared in compliance with English law and English courts will have exclusive
jurisdiction over any disputes arising from or connected with this presentation.
2
Lake Shore Gold (35%)
Gold Resource Corp (30%)Moris (100%)
Arcata (100%)
Ares (100%)
Pallancata (60%)
San José (51%)
Josnitoro
Crespo
Azuca
Inmaculada
Victoria
Mosquito
Current operations
Strategic investments
Exploration projects
Offices
Astana Farallon
Cerro Blanco
Los Pinos
Sabina
Mercurio
•
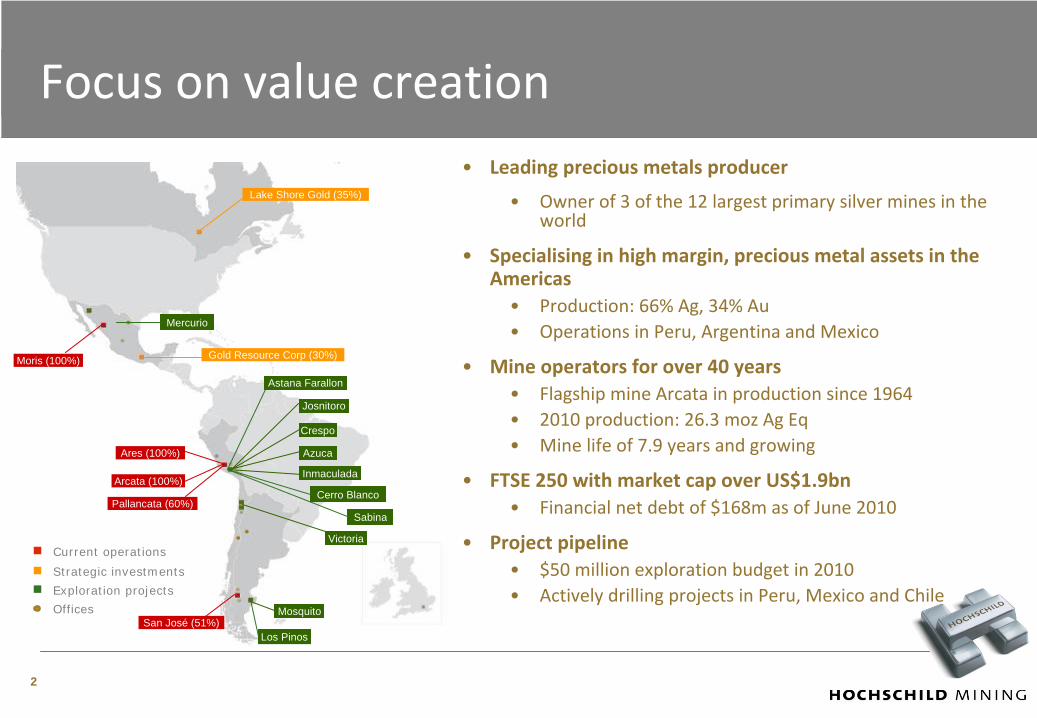
Leading precious metals producer
•
Owner of 3 of the 12 largest primary silver mines in the
world
•
Specialising in high margin, precious metal assets in the
Americas•
Production: 66% Ag, 34% Au•
Operations in Peru, Argentina and Mexico
•
Mine operators for over 40 years•
Flagship mine Arcata in production since 1964•
2010 production: 26.3 moz
Ag Eq•
Mine life of 7.9 years and growing
•
FTSE 250 with market cap over US$1.9bn•
Financial net debt of $168m as of June 2010
•
Project pipeline•
$50 million exploration budget in 2010•
Actively drilling projects in Peru, Mexico and Chile
Focus on value creation
3
Mission & Vision
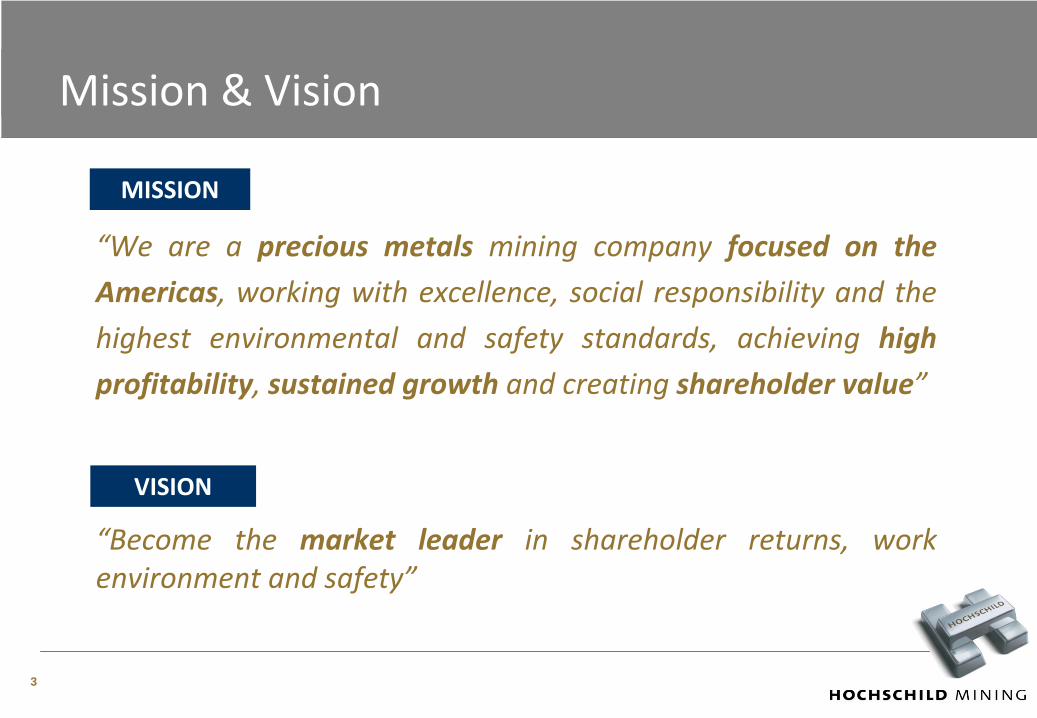
“We
are
a
precious
metals
mining
company
focused
on
the Americas,
working
with
excellence,
social
responsibility
and
the
highest
environmental
and
safety
standards,
achieving
high profitability, sustained growth
and creating shareholder value”
MISSION
VISION
“Become
the
market
leader
in
shareholder
returns,
work environment and safety”
4
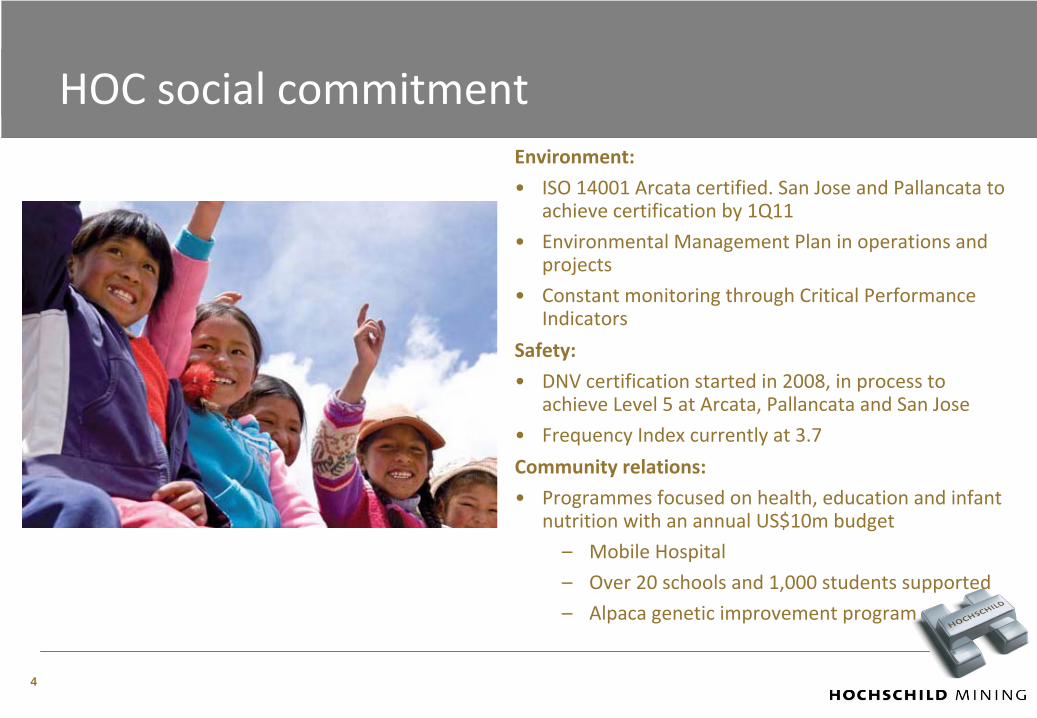
HOC social commitment Environment:
•
ISO 14001 Arcata certified. San Jose and Pallancata
to
achieve certification by 1Q11
•
Environmental Management Plan in operations and
projects
•
Constant monitoring through Critical Performance
Indicators
Safety:
•
DNV certification started in 2008, in process to
achieve Level 5 at Arcata, Pallancata
and San Jose
•
Frequency Index currently at 3.7
Community relations:
•
Programmes
focused on health, education and infant
nutrition with an annual US$10m budget
–
Mobile Hospital
–
Over 20 schools and 1,000 students supported
–
Alpaca genetic improvement program
•
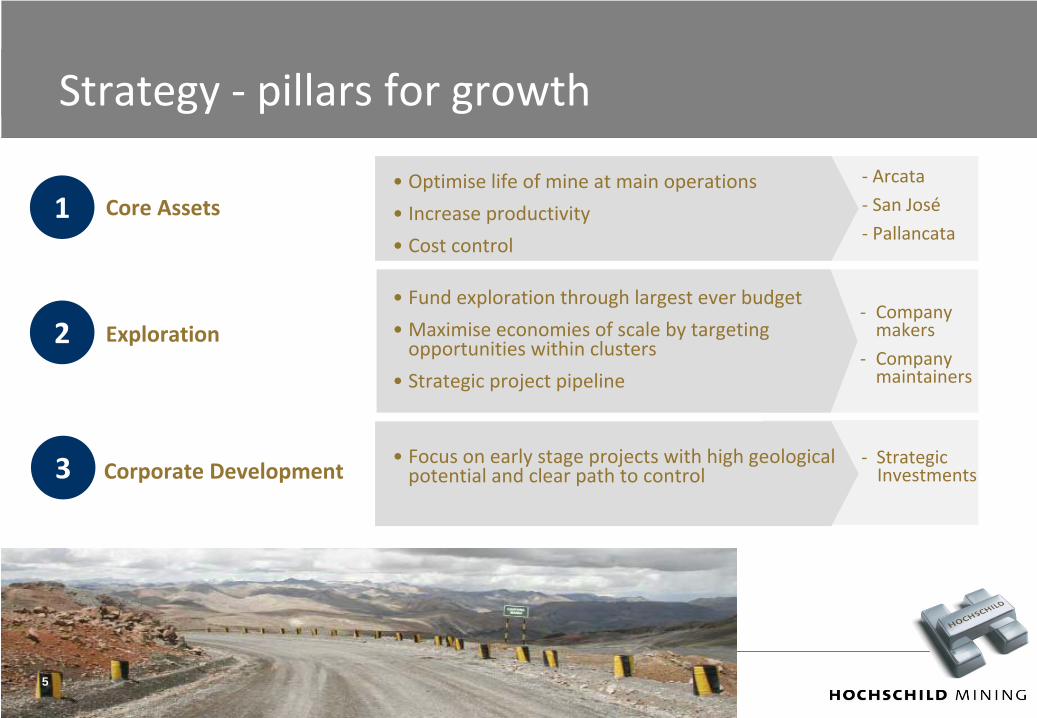
Optimise
life of mine at main operations
•
Increase productivity
•
Cost control
‐
Arcata ‐
San José
‐
PallancataCore Assets
Exploration
Corporate Development
•
Fund exploration through largest ever budget
•
Maximise
economies of scale by targeting
opportunities within clusters
•
Strategic project pipeline
•
Focus on early stage projects with high geological
potential and clear path to control
Strategy ‐
pillars for growth
‐
Company
makers
‐
Company
maintainers
‐
Strategic
Investments
1
2
3
5
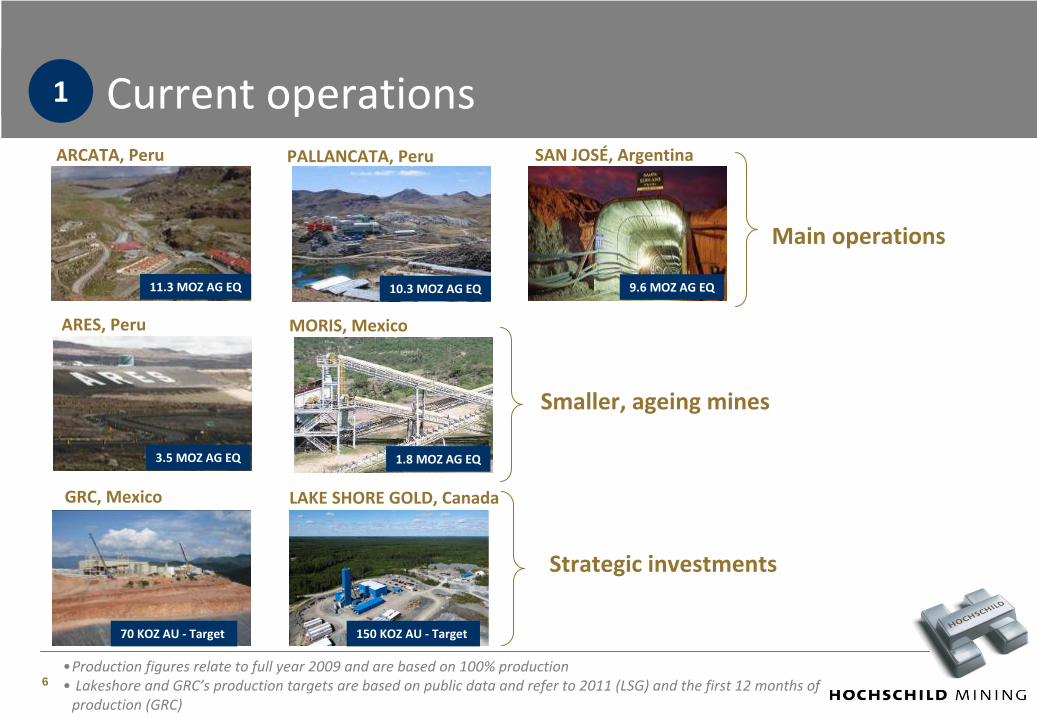
Current operationsARCATA, Peru SAN JOSÉ, ArgentinaPALLANCATA, Peru
ARES, Peru MORIS, Mexico
GRC, Mexico LAKE SHORE GOLD, Canada
Main operations
Smaller, ageing mines
Strategic investments
1
11.3 MOZ AG EQ 10.3 MOZ AG EQ 9.6 MOZ AG EQ
1.8 MOZ AG EQ3.5 MOZ AG EQ
•Production figures relate to full year 2009 and are based on 100% production • Lakeshore and GRC’s
production targets are based on public data and refer to 2011 (LSG) and the first 12 months of
production (GRC)
150 KOZ AU ‐
Target 70 KOZ AU ‐
Target
6
7
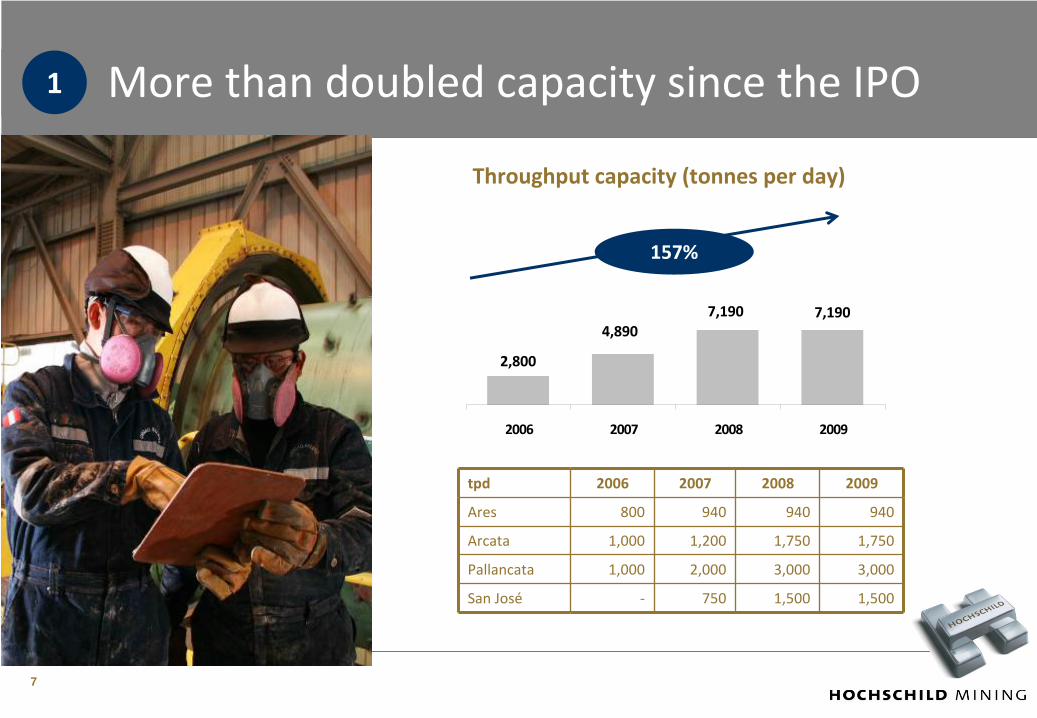
More than doubled capacity since the IPO1
2,800
4,8907,190 7,190
2006 2007 2008 2009
157%
tpd 2006 2007 2008 2009
Ares 800 940 940 940
Arcata 1,000 1,200 1,750 1,750
Pallancata 1,000 2,000 3,000 3,000
San José ‐ 750 1,500 1,500
Throughput capacity (tonnes
per day)
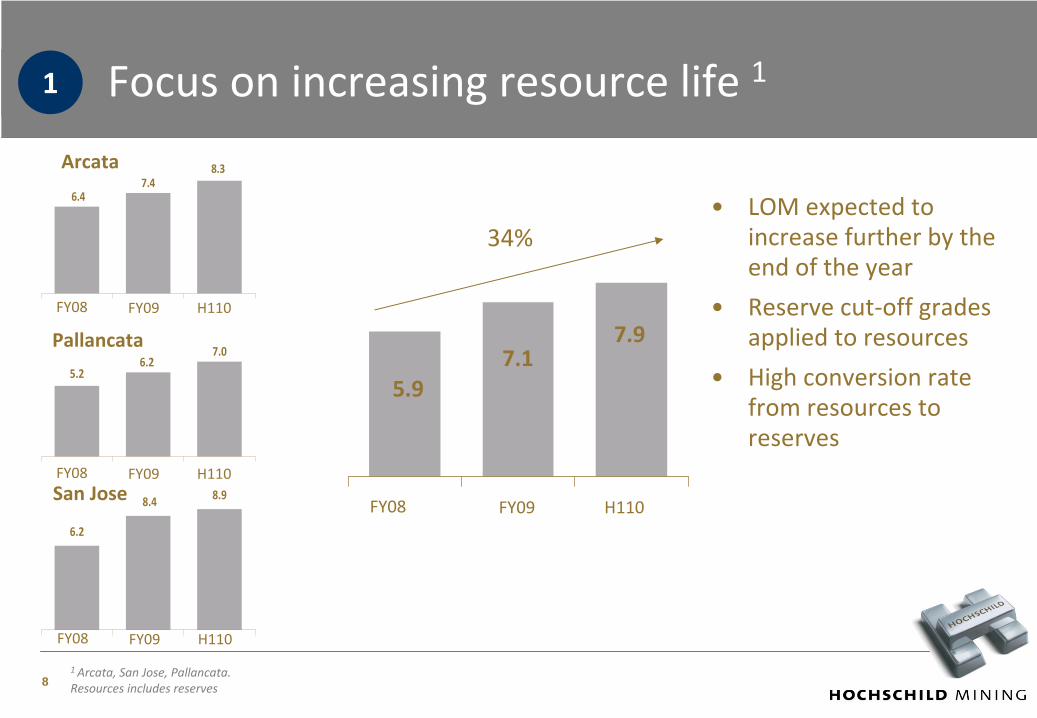
7.9
5.97.1
FY08 H110FY09
•
LOM expected to increase further by the
end of the year
•
Reserve cut‐off grades applied to resources
•
High conversion rate from resources to
reserves
7.0
5.26.2
8.9
6.2
8.4
Arcata
Pallancata
San Jose
34%
FY08 H110FY09
FY08 H110FY09
FY08 H110FY09
7.46.4
8.3
Focus on increasing resource life 11
81 Arcata, San Jose, Pallancata. Resources includes reserves
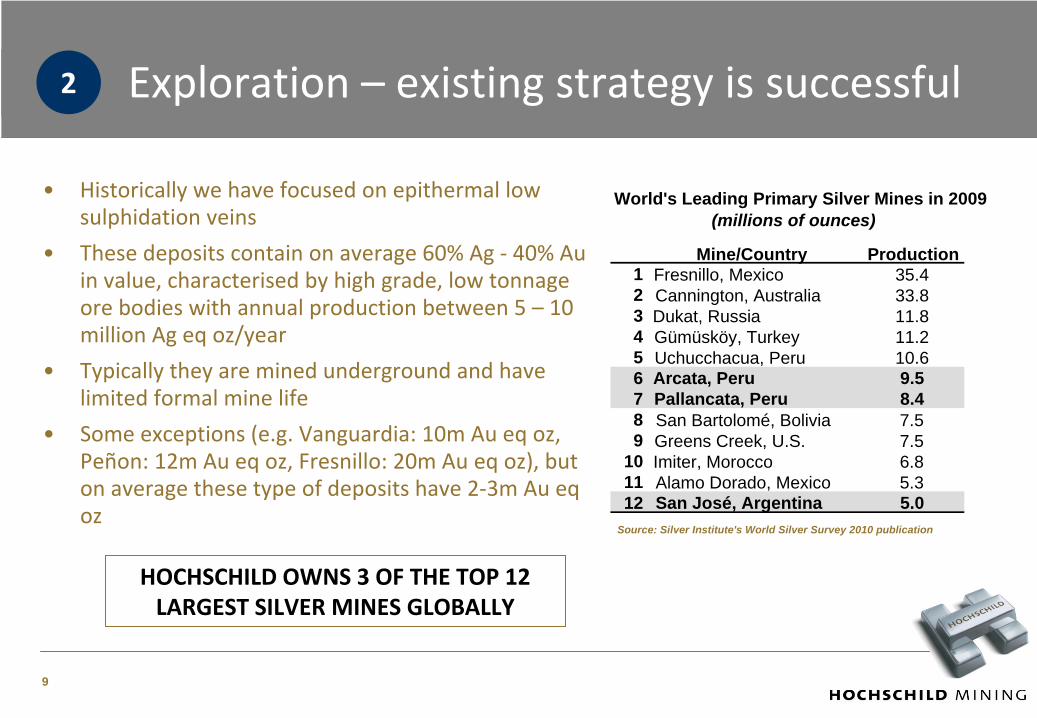
Exploration – existing strategy is successful
•
Historically we have focused on epithermal low
sulphidation veins
•
These deposits contain on average 60% Ag ‐
40% Au
in value, characterised
by high grade, low tonnage
ore bodies with annual production between 5 – 10
million Ag eq
oz/year
•
Typically they are mined underground and have
limited formal mine life
•
Some exceptions (e.g. Vanguardia: 10m Au eq
oz,
Peñon: 12m Au eq
oz, Fresnillo: 20m Au eq
oz), but
on average these type of deposits have 2‐3m Au eq
ozSource: Silver Institute's World Silver Survey 2010 publication
Mine/Country Production1 Fresnillo, Mexico 35.42 Cannington, Australia 33.83 Dukat, Russia 11.84 Gümüsköy, Turkey 11.25 Uchucchacua, Peru 10.66 Arcata, Peru 9.57 Pallancata, Peru 8.48 San Bartolomé, Bolivia 7.59 Greens Creek, U.S. 7.5
10 Imiter, Morocco 6.811 Alamo Dorado, Mexico 5.312 San José, Argentina 5.0
(millions of ounces)World's Leading Primary Silver Mines in 2009
2
HOCHSCHILD OWNS 3 OF THE TOP 12
LARGEST SILVER MINES GLOBALLY
9
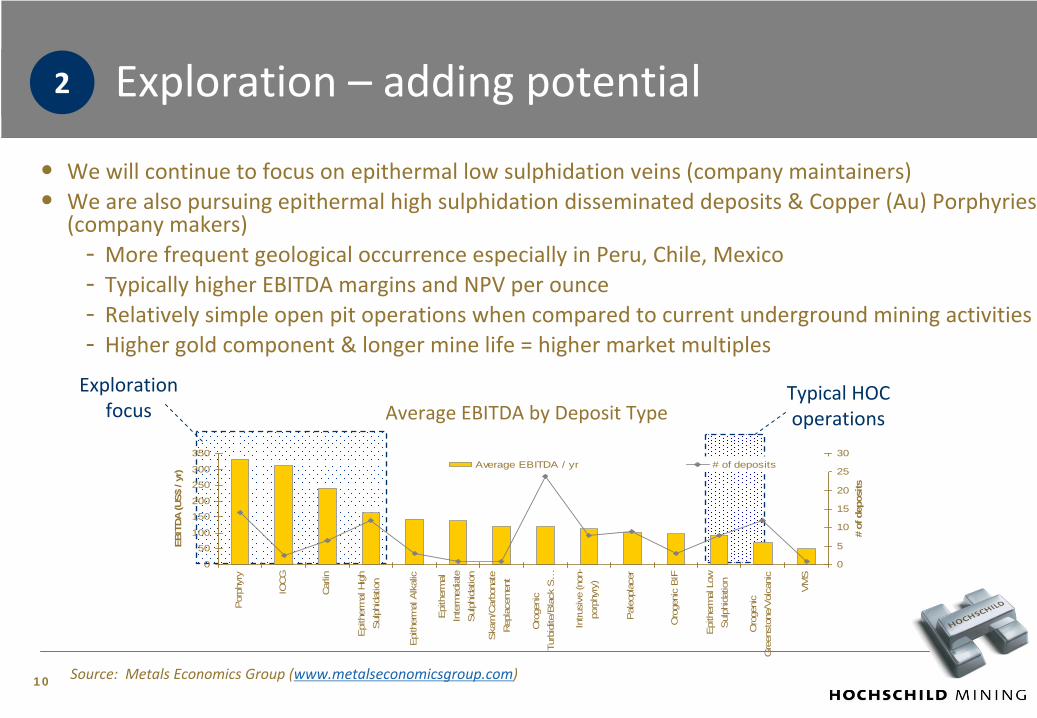
Exploration –
adding potential
•
We will continue to focus on epithermal low sulphidation veins (company maintainers)•
We are also pursuing epithermal high sulphidation disseminated deposits & Copper (Au) Porphyries
(company makers)‐
More frequent geological occurrence especially in Peru, Chile, Mexico
‐
Typically higher EBITDA margins and NPV per ounce‐
Relatively simple open pit operations when compared to current underground mining activities
‐
Higher gold component & longer mine life = higher market multiples
2
Average EBITDA by Deposit TypeExploration
focusTypical HOC
operations
0
50
100
150
200
250
300
350
Por
phyr
y
IOC
G
Car
lin
Epi
ther
mal
Hig
hS
ulph
idat
ion
Epi
ther
mal
Alk
alic
Epi
ther
mal
Inte
rmed
iate
Sul
phid
atio
n
Ska
rn/C
arbo
nate
Rep
lace
men
t
Oro
geni
cTu
rbid
ite/B
lack
S…
Intru
sive
(non
-po
rphy
ry)
Pal
eopl
acer
Oro
geni
c B
IF
Epi
ther
mal
Low
Sul
phid
atio
n
Oro
geni
cG
reen
ston
e/V
olca
nic
VM
S
EBIT
DA (U
S$ /
yr)
0
5
10
15
20
25
30
# of
dep
osits
Average EBITDA / yr # of deposits
Source: Metals Economics Group (www.metalseconomicsgroup.com)10
-
25
50
75
100
Sukh
ayba
rat
Kem
ess
Cen
tral
Pier
ina
Wha
rfAn
govi
aM
orila
Bron
zew
ing
Rub
y H
illLa
Coi
paC
orra
les
Ree
fton
Kals
aka
Bogo
so/P
res
Lega
Dem
biG
edab
ekLa
Lib
erta
d ItyBe
rezi
tovo
yeSa
n An
dres
C C
reek
-La
verto
nVo
roLe
fa C
orrid
orKu
mto
rBo
nikr
oLa
Her
radu
raEl
Cha
nate
Nor
th M
ara
El C
astill
oPe
njom
Cha
tree
Mar
icun
gaSo
leda
d-Sa
diol
a H
illSa
mira
Hill
Ahaf
oH
idde
nSi
guiri
Cha
pada
Bodd
ingt
onC
hoco
Nav
acha
bAn
daco
lloSu
kari
Mid
delv
eiM
aika
inzo
loto
Bere
znya
ki
Reserve LOM Resource LOM
-
25
50
75
100
Anta
pite
Ishi
huin
caM
arth
aSh
ila-P
aula
Dia
blito
San
Topi
aQ
uiru
vilc
aC
olom
bia
Ares
Julc
ani
Rec
uper
adM
ina
Palla
ncat
aPi
men
ton
Gua
naju
ato
Kettl
e R
-BEn
cant
ada
Pogo
Arca
taN
. Sen
ora
Gua
nace
viEl
Pen
onSa
n Jo
seG
uana
juat
o LaSa
n M
artin
Co-
OSi
lver
Zaru
ma
Cay
llom
aR
ossi
Troy
Min
eG
reen
sC
ubo-
La C
iene
gaSa
n D
imas
Mor
ococ
haFr
esni
lloH
uaro
nLu
cky
Bola
nos
Reserve LOM Resource LOM
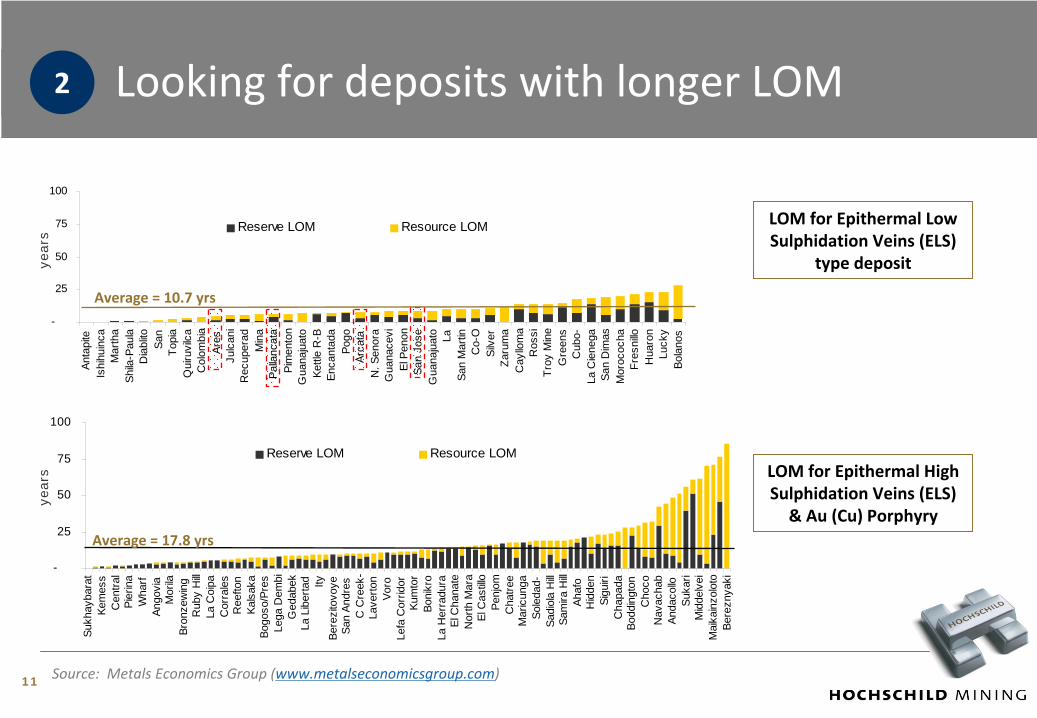
11
Average = 10.7 yrs
LOM for Epithermal Low
Sulphidation Veins (ELS)
type deposit
Average = 17.8 yrs
LOM for Epithermal High
Sulphidation Veins (ELS)
& Au (Cu) Porphyry
year
sye
ars
Source: Metals Economics Group (www.metalseconomicsgroup.com)
Looking for deposits with longer LOM 2
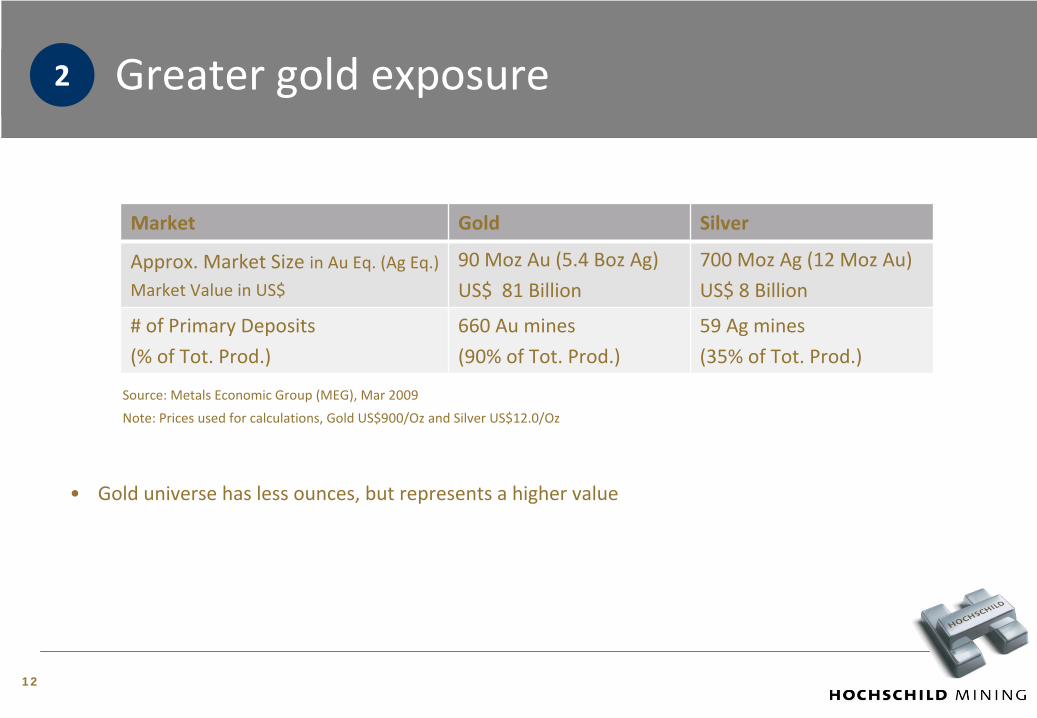
12
Market Gold Silver
Approx. Market Size in Au Eq. (Ag Eq.)Market Value in US$
90 Moz
Au (5.4 Boz
Ag)
US$ 81 Billion
700 Moz
Ag (12 Moz
Au)
US$ 8 Billion
# of Primary Deposits
(% of Tot. Prod.)
660 Au mines
(90% of Tot. Prod.)
59 Ag mines
(35% of Tot. Prod.)
•
Gold universe has less ounces, but represents a higher value
Source: Metals Economic Group (MEG), Mar 2009
Note: Prices used for calculations, Gold US$900/Oz and Silver US$12.0/Oz
Greater gold exposure2
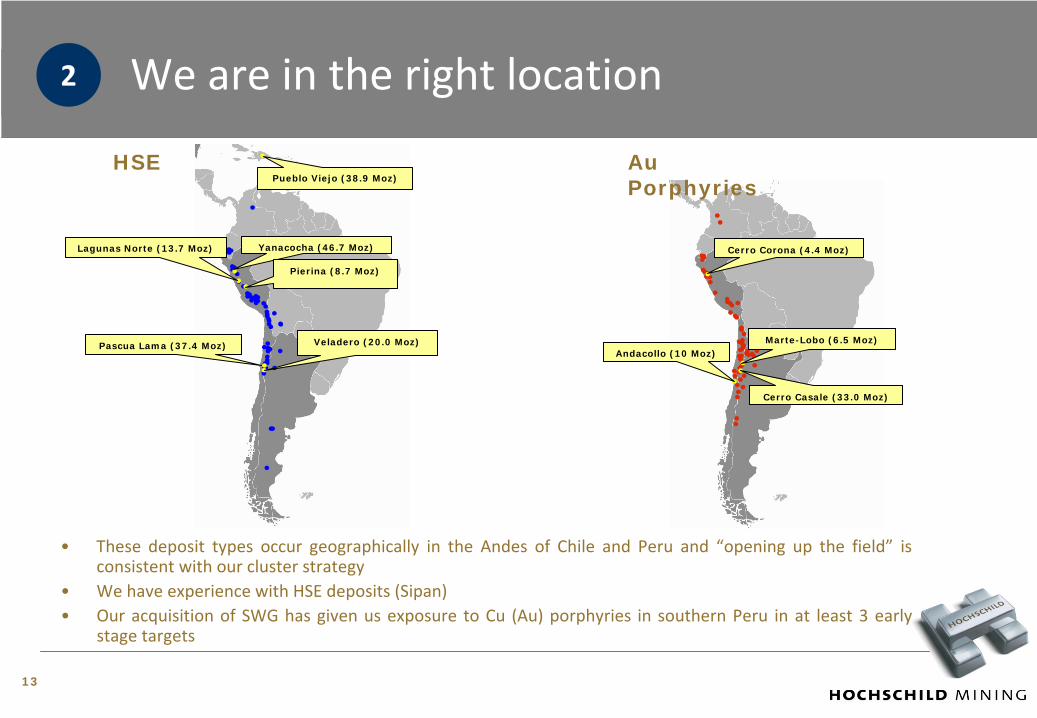
•
These
deposit
types
occur
geographically
in
the
Andes
of
Chile
and
Peru
and
“opening
up
the
field”
is
consistent with our cluster strategy
•
We have experience with HSE deposits (Sipan)•
Our
acquisition
of
SWG
has
given
us
exposure
to
Cu
(Au)
porphyries
in
southern
Peru
in
at
least
3
early
stage targets
We are in the right location
Au Porphyries
Cerro Corona (4.4 Moz)
Marte-Lobo (6.5 Moz)Andacollo (10 Moz)
Cerro Casale (33.0 Moz)
HSEPueblo Viejo (38.9 Moz)
Yanacocha (46.7 Moz)Lagunas Norte (13.7 Moz)
Pierina (8.7 Moz)
Pascua Lama (37.4 Moz) Veladero (20.0 Moz)
13
2
141414
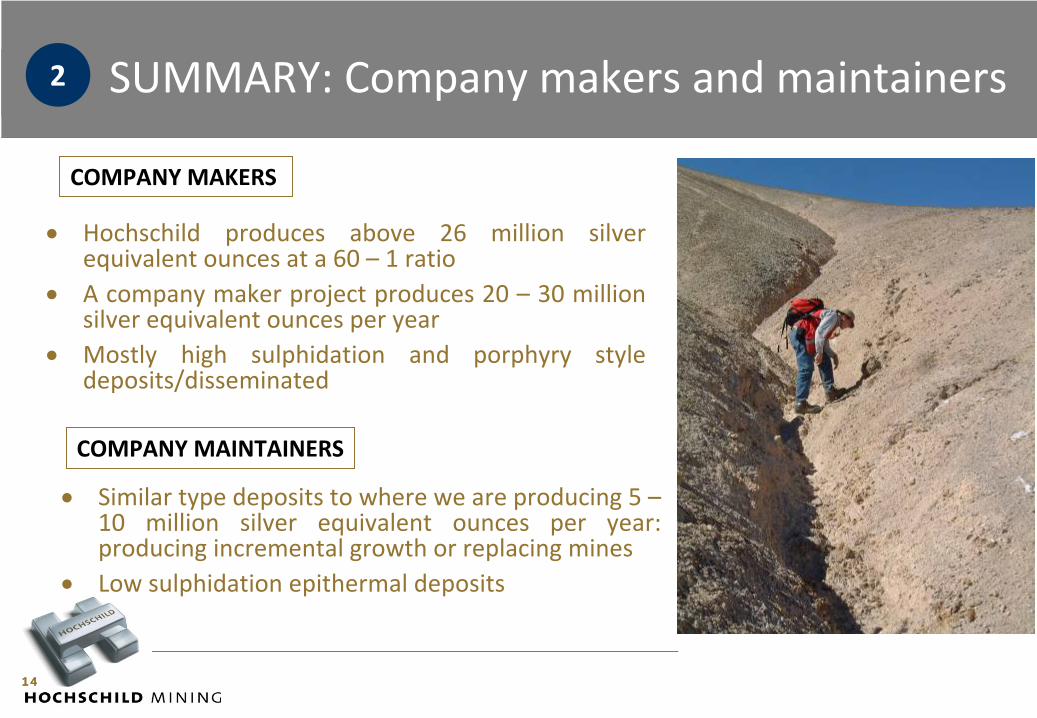
SUMMARY: Company makers and maintainers
•
Hochschild
produces
above
26
million
silver equivalent ounces at a 60 – 1 ratio
•
A company maker project produces 20 – 30 million silver equivalent ounces per year
•
Mostly
high
sulphidation
and
porphyry
style deposits/disseminated
COMPANY MAKERS
COMPANY MAINTAINERS
•
Similar type deposits to where we are producing 5 – 10
million
silver
equivalent
ounces
per
year:
producing incremental growth or replacing mines•
Low sulphidation epithermal deposits
2
1515
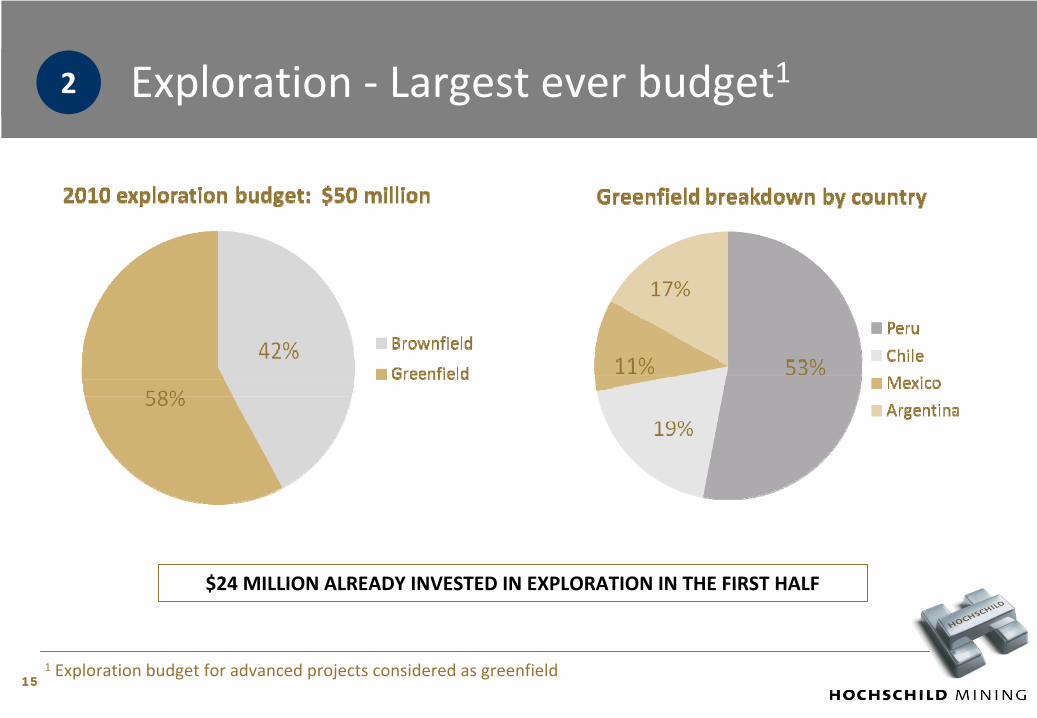
Exploration ‐
Largest ever budget12
$24 MILLION ALREADY INVESTED IN EXPLORATION IN THE FIRST HALF
1
Exploration
budget
for
advanced
projects
considered
as greenfield
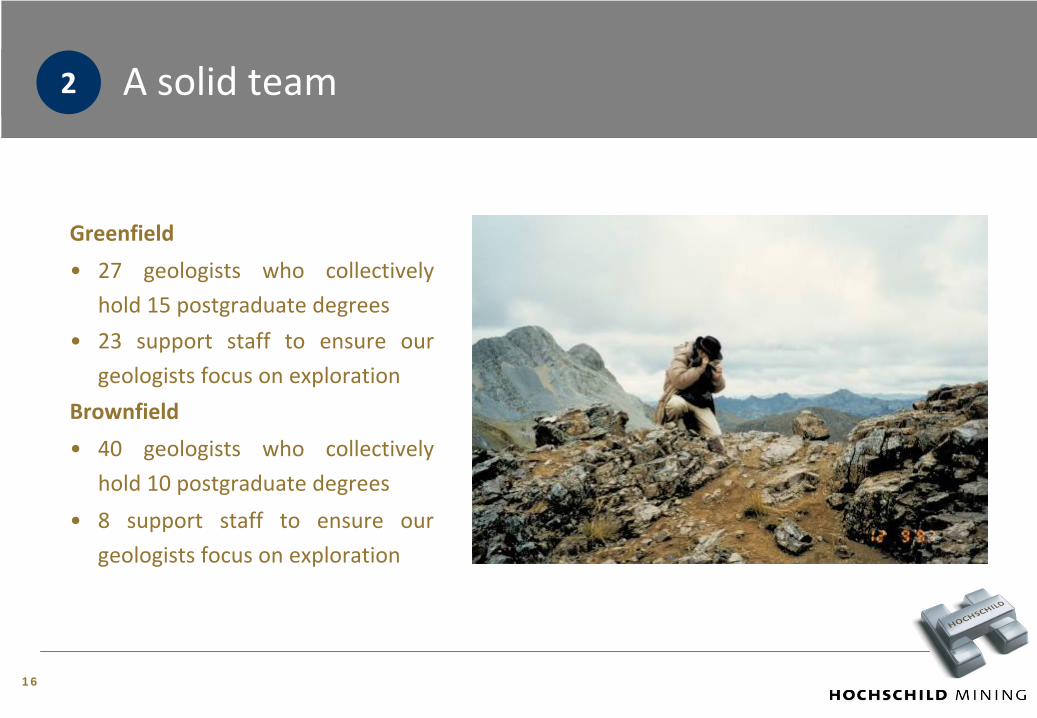
16
Greenfield
•
27
geologists
who
collectively
hold 15 postgraduate degrees
•
23
support
staff
to
ensure
our
geologists focus on exploration
Brownfield
•
40
geologists
who
collectively
hold 10 postgraduate degrees
•
8
support
staff
to
ensure
our
geologists focus on exploration
A solid team2
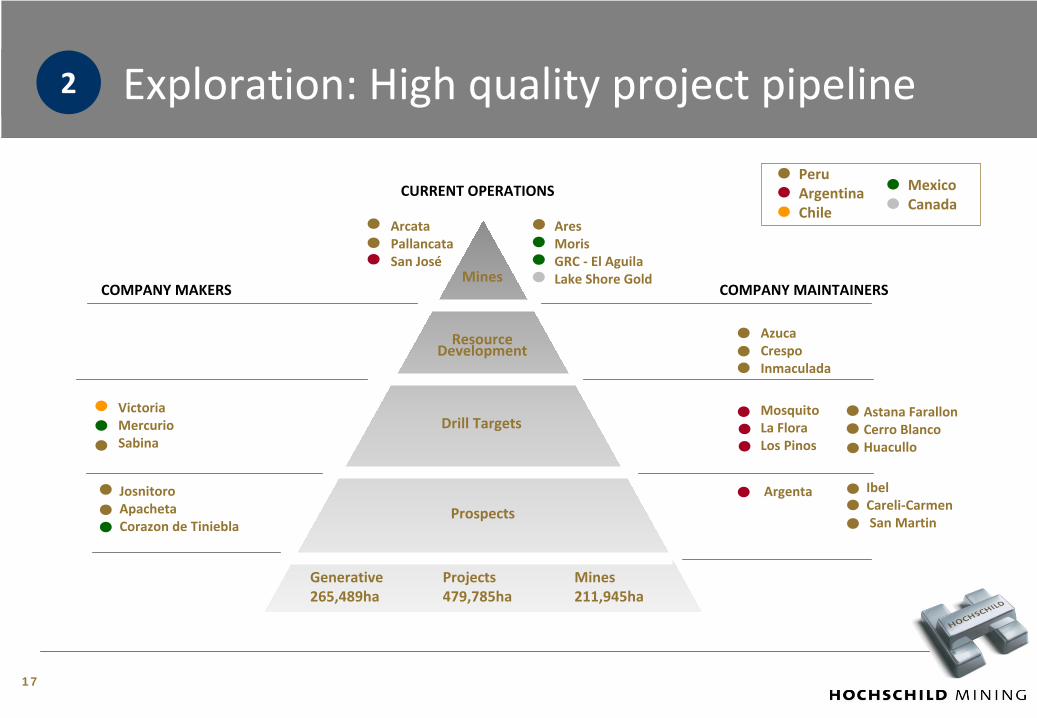
Exploration: High quality project pipeline
JosnitoroApachetaCorazon de Tiniebla
IbelCareli‐CarmenSan Martin
CURRENT OPERATIONS
ArcataPallancataSan José
VictoriaMercurioSabina
Projects479,785ha
Prospects
Drill Targets
Resource
Development
Mines
AresMorisGRC ‐
El AguilaLake Shore Gold
COMPANY MAINTAINERS
AzucaCrespoInmaculada
MosquitoLa FloraLos Pinos
Astana FarallonCerro BlancoHuacullo
COMPANY MAKERS
Argenta
PeruArgentinaChile
MexicoCanada
Mines211,945ha
Generative265,489ha
2
17

Company maintainers AZUCA, Peru CRESPO, Peru
MOSQUITO, Argentina
INMACULADA, Peru
Scoping stage
2
LA FLORA, Argentina
ASTANA FARALLON, Peru
CERRO BLANCO, Peru
Drilling underwayduring 2010
Target preparation
18
LOS PINOS, Argentina HUACULLO, Peru
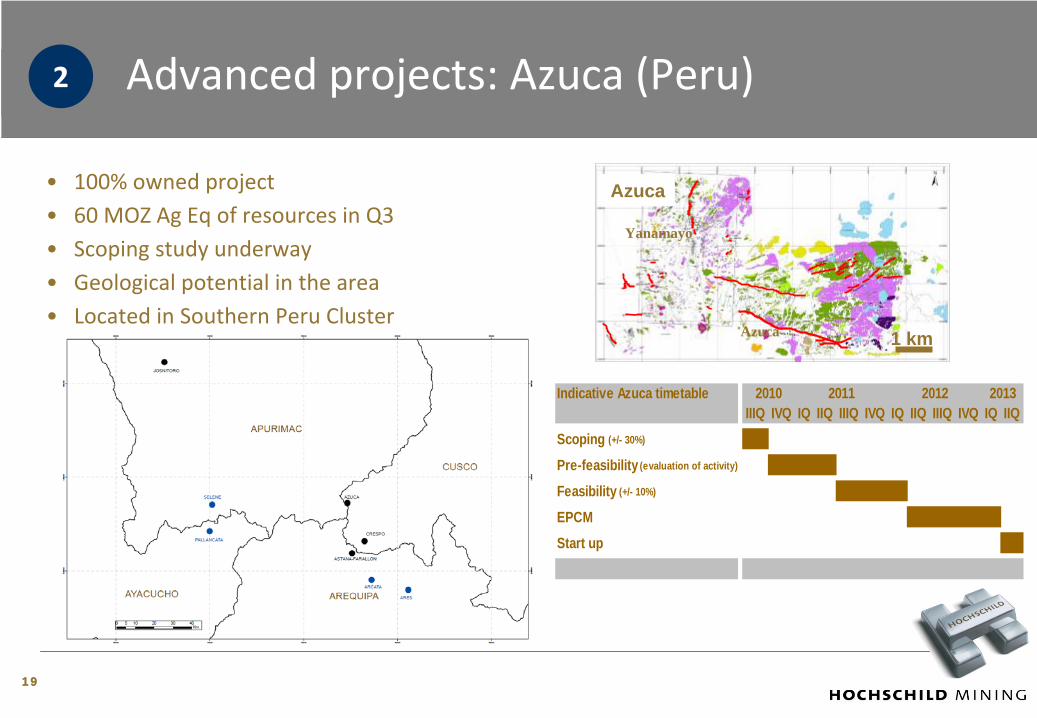
1919
•
100% owned project
•
60 MOZ Ag Eq
of resources in Q3
•
Scoping study underway
•
Geological potential in the area
•
Located in Southern Peru Cluster
Advanced projects: Azuca
(Peru)
1 km
Azuca
Azuca
Yanamayo
2
Indicative Azuca timetable 2010 2011 2012 2013IIIQ IVQ IQ IIQ IIIQ IVQ IQ IIQ IIIQ IVQ IQ IIQ
Scoping (+/- 30%)
Pre-feasibility (evaluation of activity)
Feasibility (+/- 10%)
EPCMStart up
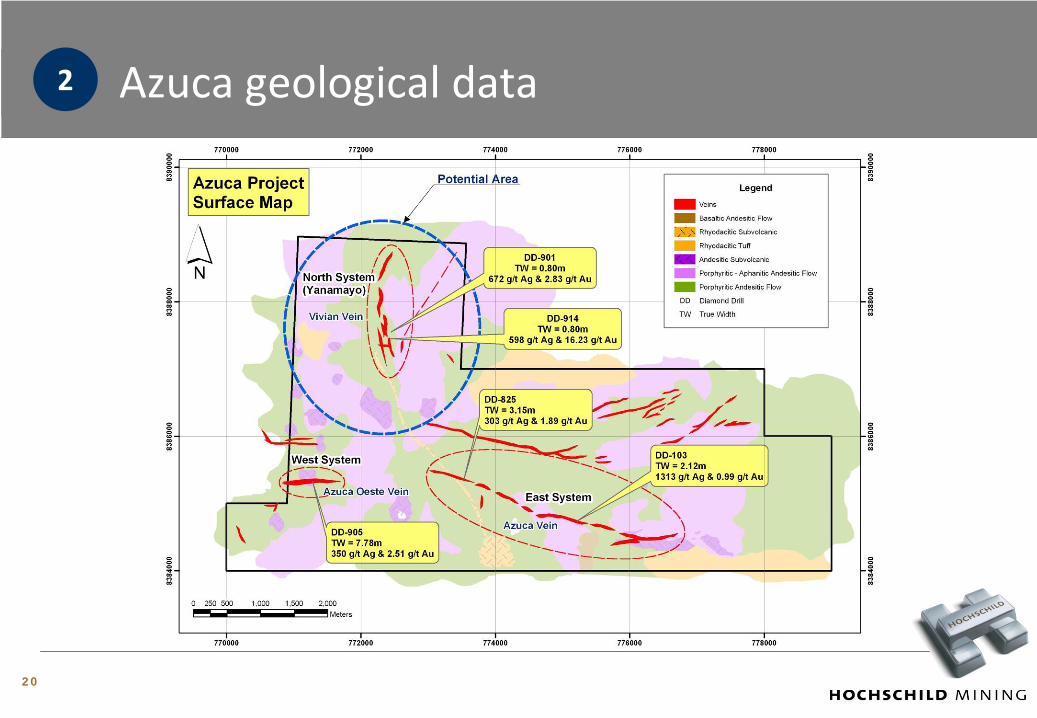
20
Azuca
geological data2
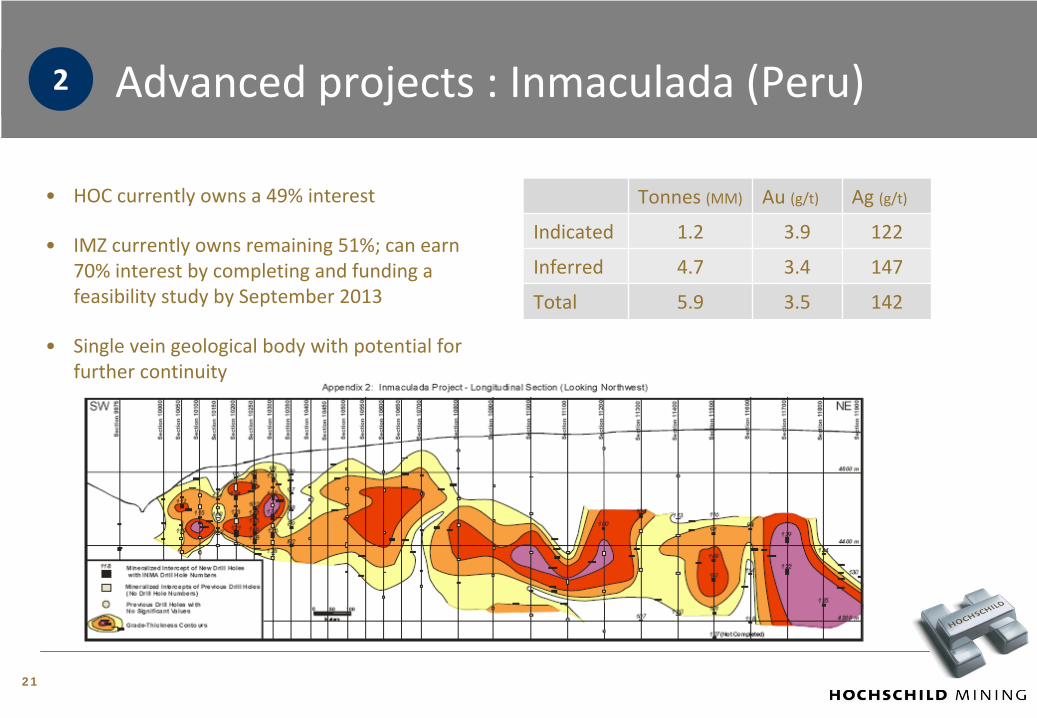
21
•
HOC currently owns a 49% interest
•
IMZ currently owns remaining 51%; can earn
70% interest by completing and funding a
feasibility study by September 2013
•
Single vein geological body with potential for
further continuity
Tonnes
(MM) Au (g/t) Ag (g/t)
Indicated 1.2 3.9 122
Inferred 4.7 3.4 147
Total 5.9 3.5 142
Advanced projects : Inmaculada
(Peru)2
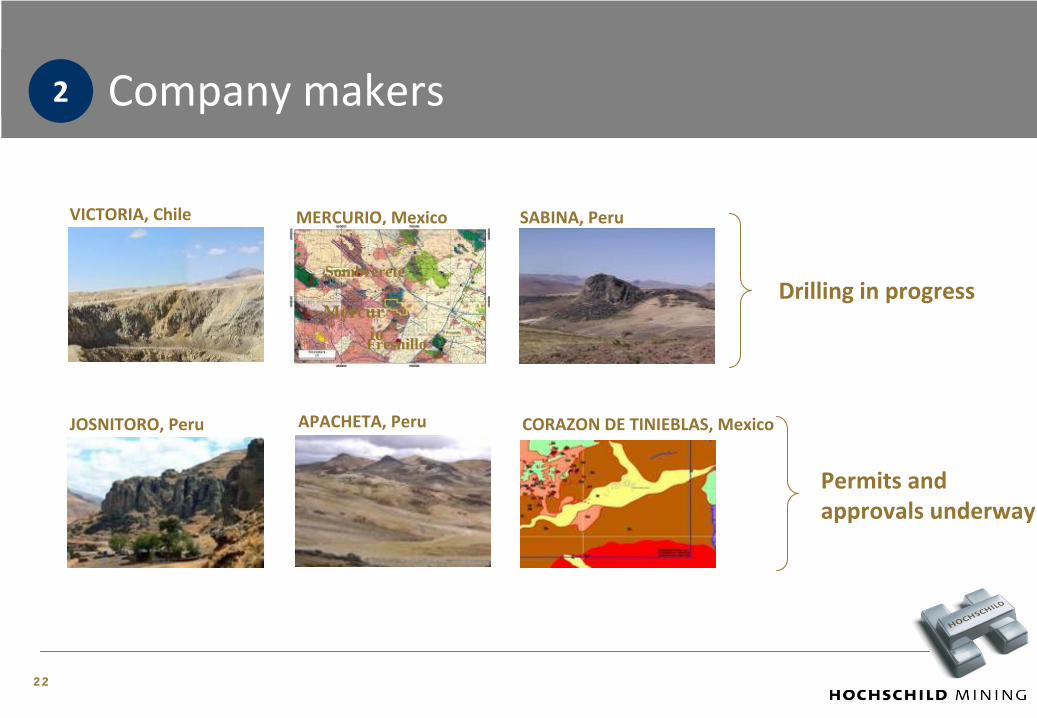
Company makers
MERCURIO, Mexico SABINA, Peru VICTORIA, Chile
Drilling in progress
2
JOSNITORO, Peru CORAZON DE TINIEBLAS, Mexico APACHETA, Peru
Permits and
approvals underway
Mercur io
Sombrerete
Fresnillo
22
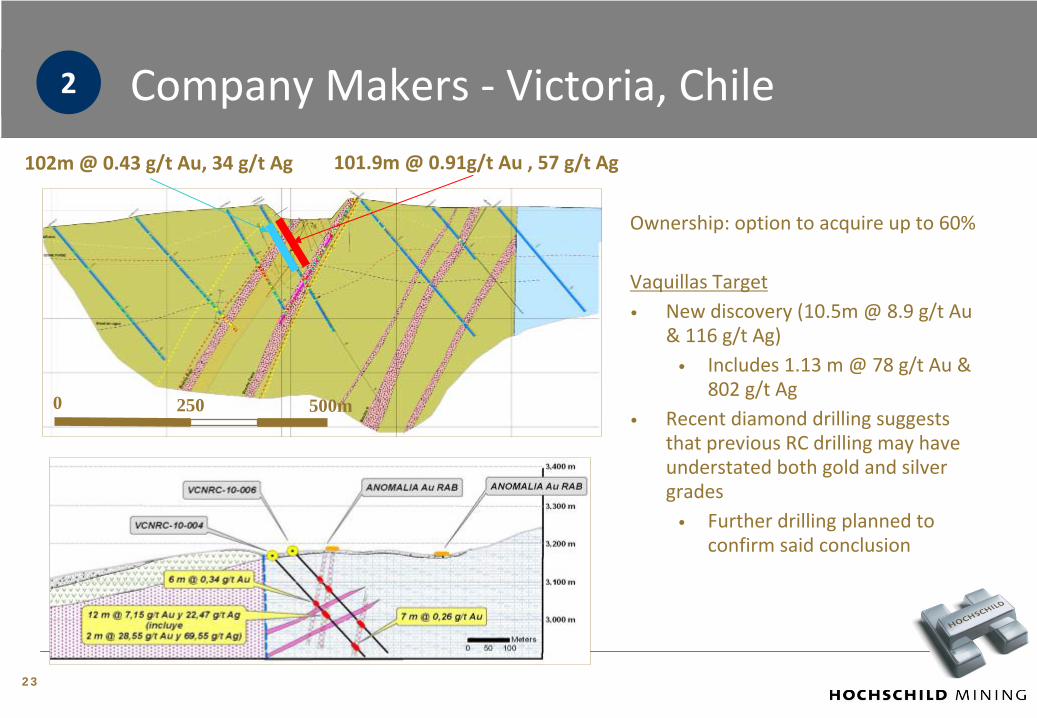
101.9m @ 0.91g/t Au , 57 g/t Ag102m @ 0.43 g/t Au, 34 g/t Ag
0 250 500m
Company Makers ‐
Victoria, Chile
Ownership: option to acquire up to 60%
Vaquillas
Target•
New discovery (10.5m @ 8.9 g/t
Au
& 116 g/t
Ag)•
Includes 1.13 m @ 78 g/t
Au &
802 g/t
Ag•
Recent diamond drilling suggests
that previous RC drilling may have
understated both gold and silver
grades•
Further drilling planned to
confirm said conclusion
2
23
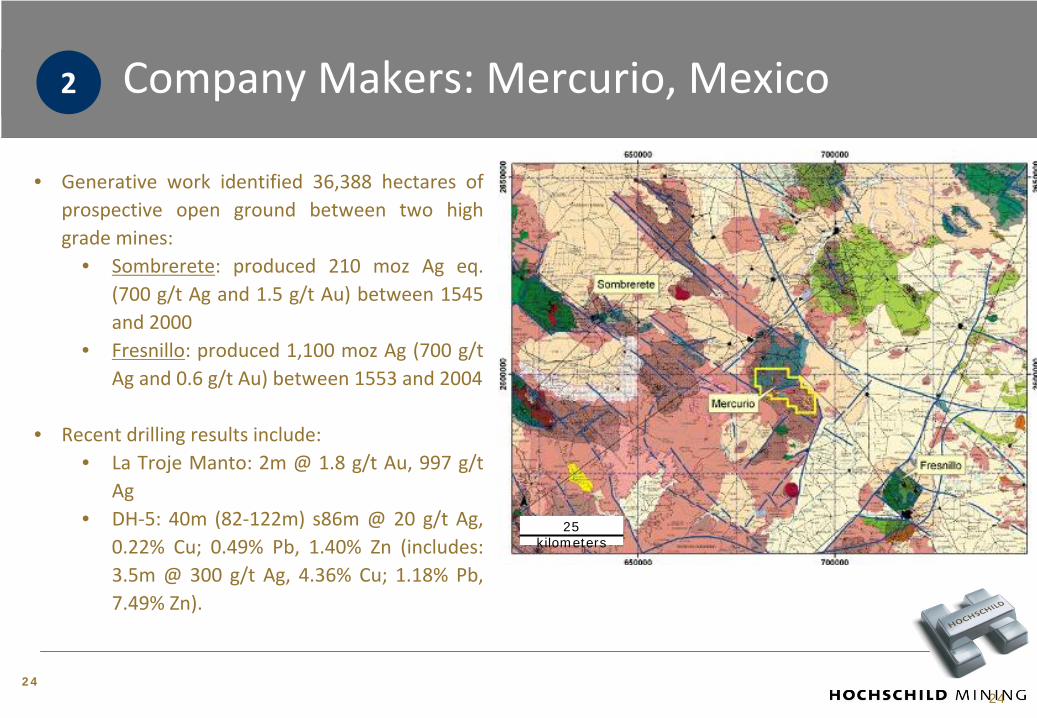
Company Makers: Mercurio, Mexico
24
2
24
• Generative
work
identified
36,388
hectares
of
prospective
open
ground
between
two
high
grade mines:• Sombrerete:
produced
210
moz
Ag
eq.
(700
g/t
Ag and
1.5
g/t
Au)
between
1545
and 2000 • Fresnillo:
produced
1,100
moz
Ag
(700
g/t
Ag and 0.6 g/t
Au) between 1553 and 2004
• Recent drilling results include:• La
Troje
Manto:
2m
@
1.8
g/t
Au,
997
g/t
Ag• DH‐5:
40m
(82‐122m)
s86m
@
20
g/t
Ag,
0.22%
Cu;
0.49%
Pb,
1.40%
Zn
(includes:
3.5m
@
300
g/t
Ag,
4.36%
Cu;
1.18%
Pb,
7.49% Zn).
25 kilometers
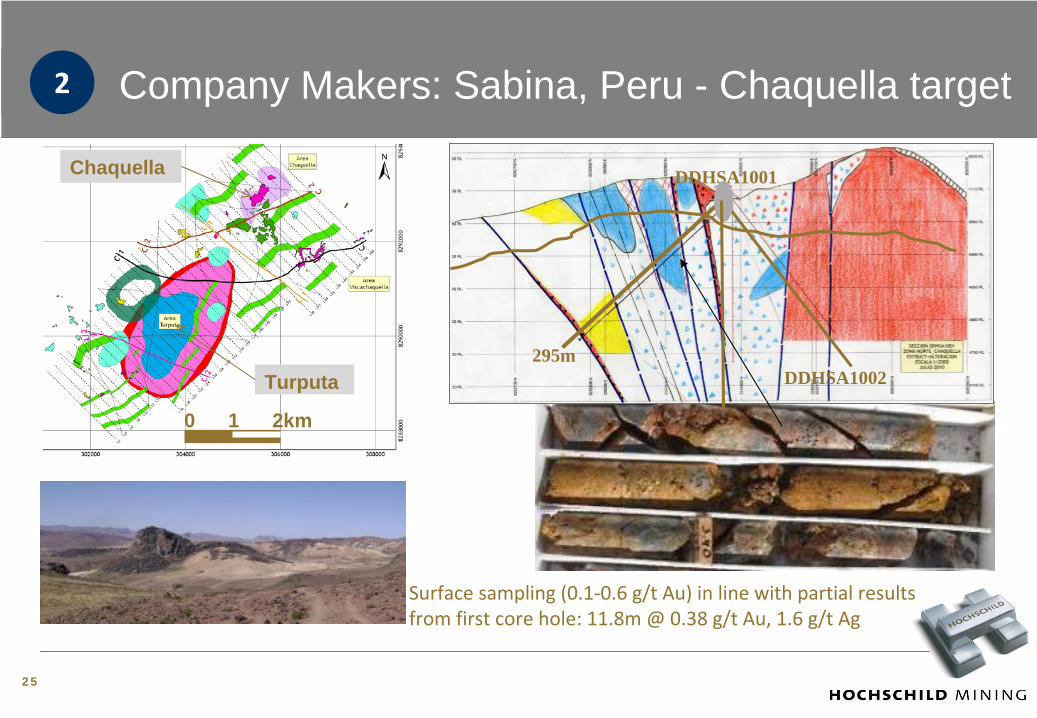
Company Makers: Sabina, Peru - Chaquella target
Surface sampling (0.1‐0.6 g/t
Au) in line with partial results
from first core hole: 11.8m @ 0.38 g/t
Au, 1.6 g/t
Ag
295m
DDHSA1001
DDHSA1002
Chaquella
Turputa
0 1 2km
2
25
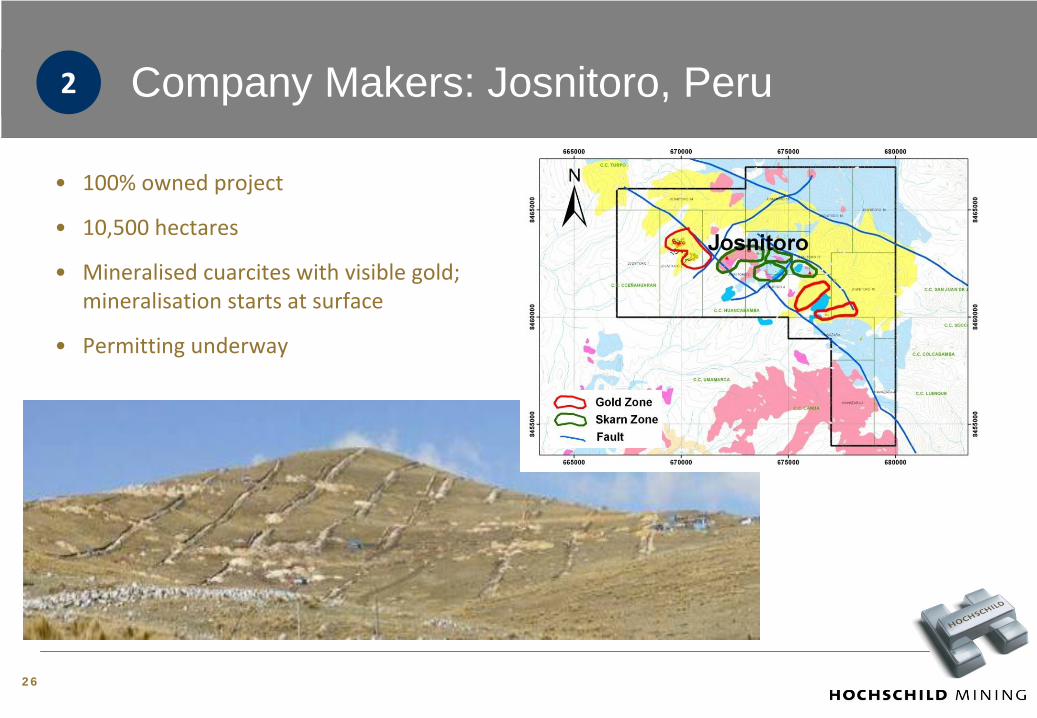
Company Makers: Josnitoro, Peru2
26
•
100% owned project
•
10,500 hectares
•
Mineralised cuarcites
with visible gold;
mineralisation starts at surface
•
Permitting underway
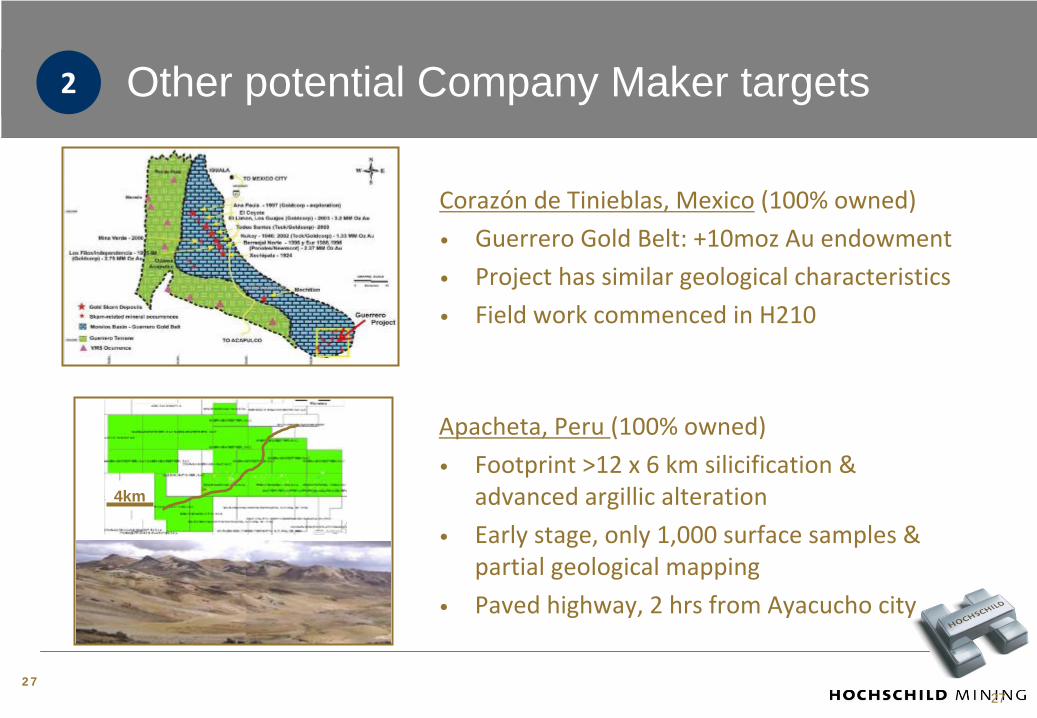
Other potential Company Maker targets
27
Corazón
de Tinieblas, Mexico
(100% owned)
•
Guerrero Gold Belt: +10moz Au endowment
•
Project has similar geological characteristics
•
Field work commenced in H210
Apacheta, Peru (100% owned)
•
Footprint >12 x 6 km silicification
& advanced argillic
alteration
•
Early stage, only 1,000 surface samples & partial geological mapping
•
Paved highway, 2 hrs from Ayacucho city
4km
2
27
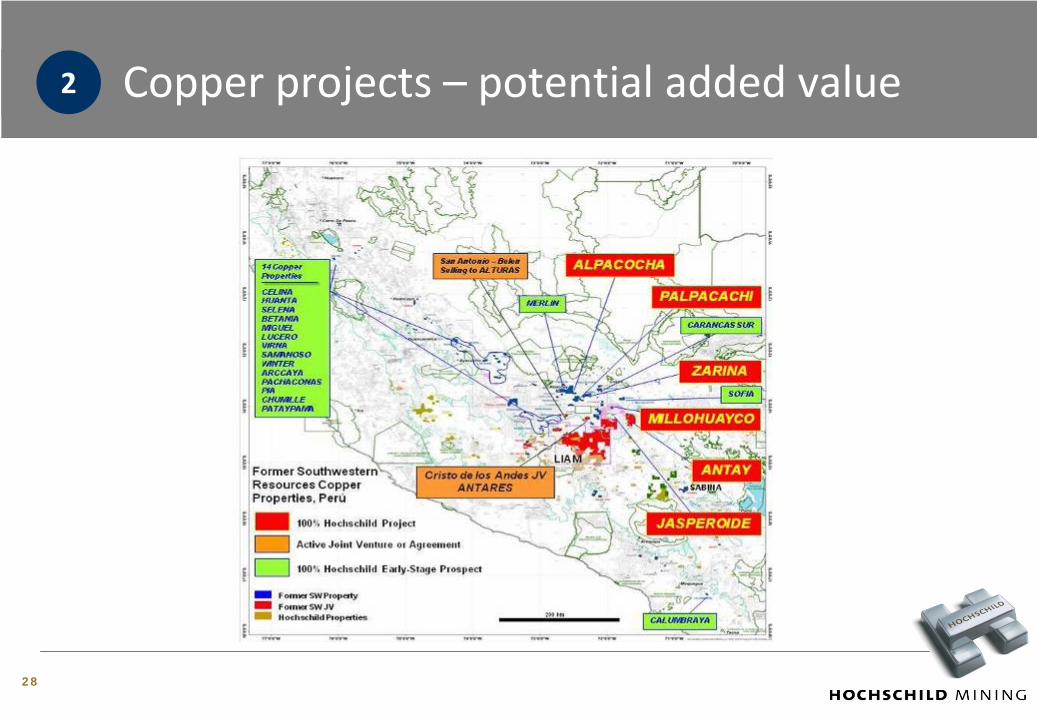
Copper projects –
potential added value
28
2
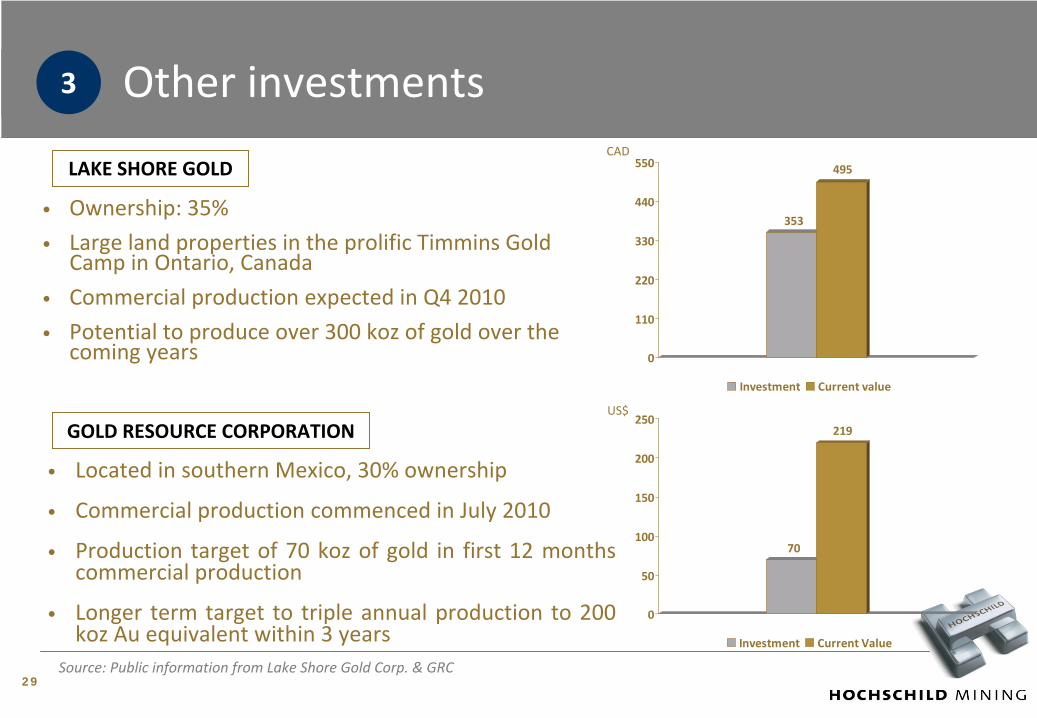
29
•
Ownership: 35%
•
Large land properties in the prolific Timmins Gold
Camp in Ontario, Canada
•
Commercial production expected in Q4 2010
•
Potential to produce over 300 koz
of gold over the
coming years
Source: Public information from Lake Shore Gold Corp. & GRC
Other investments 3
•
Located in southern Mexico, 30% ownership
•
Commercial production commenced in July 2010
•
Production
target
of
70
koz
of
gold
in
first
12
months
commercial production
•
Longer
term
target
to
triple
annual
production
to
200
koz
Au equivalent within 3 years
LAKE SHORE GOLD
GOLD RESOURCE CORPORATION
353
495
0
110
220
330
440
550
Investment Current value
70
219
0
50
100
150
200
250
Investment Current Value
CAD
US$
30
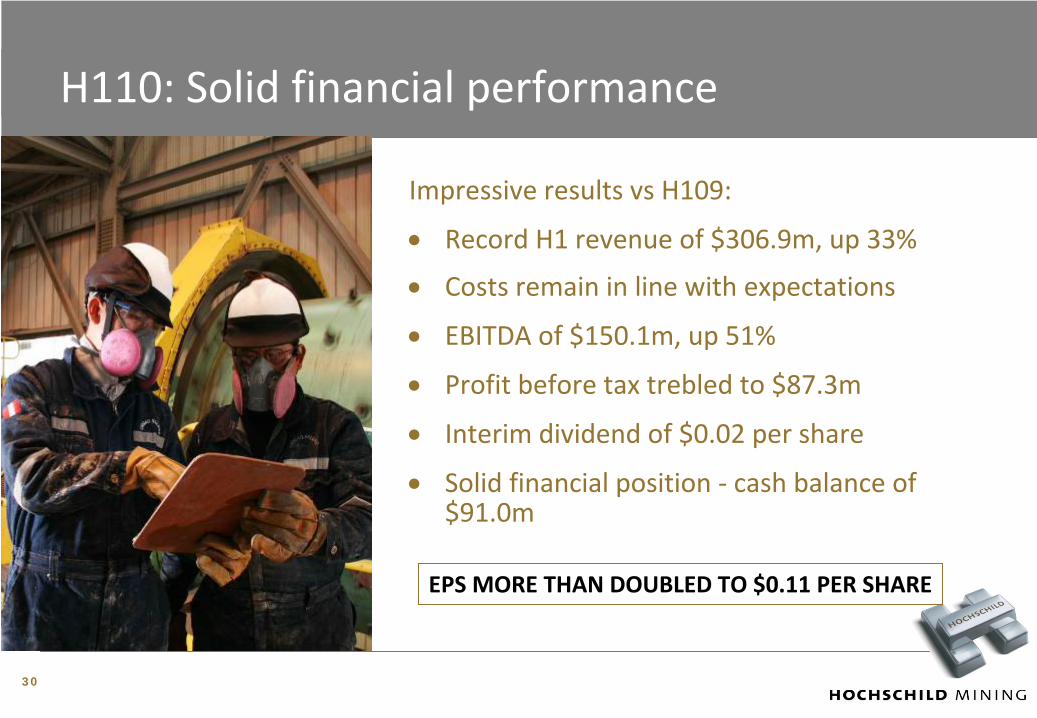
H110: Solid financial performance
Impressive results vs
H109:
•
Record H1 revenue of $306.9m, up 33%
•
Costs remain in line with expectations
•
EBITDA of $150.1m, up 51%
•
Profit before tax trebled to $87.3m
•
Interim dividend of $0.02 per share
•
Solid financial position ‐
cash balance of $91.0m
EPS MORE THAN DOUBLED TO $0.11 PER SHARE
3131
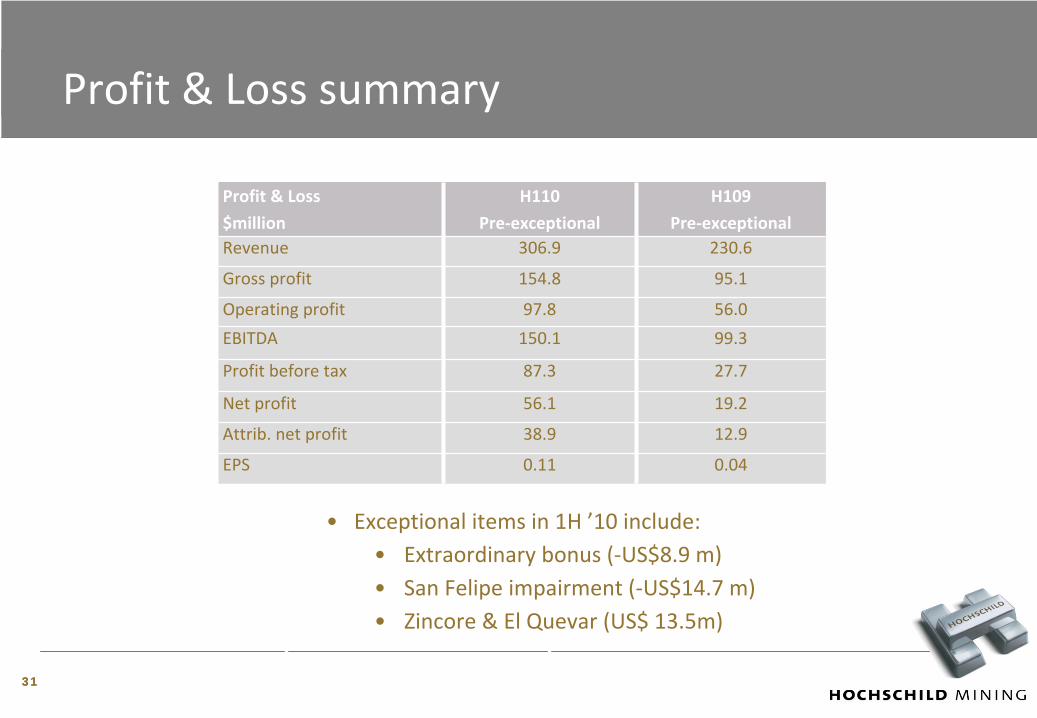
Profit & Loss summary
Profit & Loss
$million
H110
Pre‐exceptional
H109
Pre‐exceptionalRevenue 306.9 230.6
Gross profit 154.8 95.1
Operating profit 97.8 56.0
EBITDA 150.1 99.3
Profit before tax 87.3 27.7
Net profit 56.1 19.2
Attrib. net profit 38.9 12.9
EPS 0.11 0.04
•
Exceptional items in 1H ’10 include:•
Extraordinary bonus (‐US$8.9 m)
•
San Felipe impairment (‐US$14.7 m)
•
Zincore
& El Quevar
(US$ 13.5m)
3232
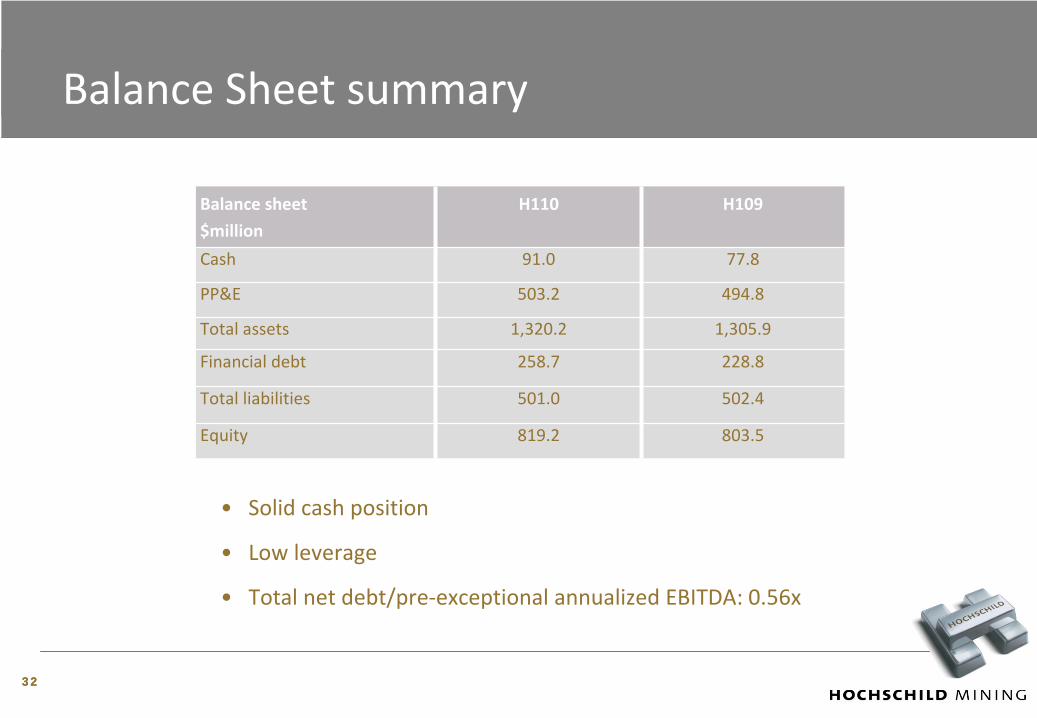
Balance Sheet summary
Balance sheet
$million
H110 H109
Cash 91.0 77.8
PP&E 503.2 494.8
Total assets 1,320.2 1,305.9
Financial debt 258.7 228.8
Total liabilities 501.0 502.4
Equity 819.2 803.5
•
Solid cash position
•
Low leverage
•
Total net debt/pre‐exceptional annualized EBITDA: 0.56x
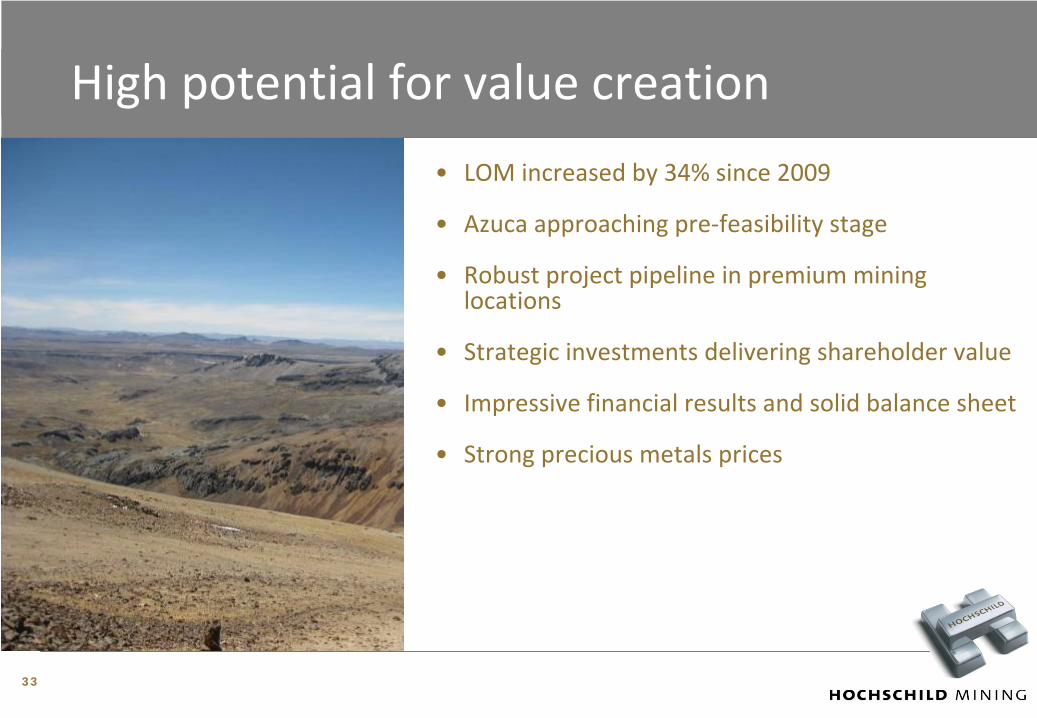
High potential for value creation
•
LOM increased by 34% since 2009
•
Azuca
approaching pre‐feasibility stage
•
Robust project pipeline in premium mining locations
•
Strategic investments delivering shareholder value
•
Impressive financial results and solid balance sheet
•
Strong precious metals prices
33
34
Appendix
CONTACT US
Isabel Lutgendorf
Head of Investor Relations
+44 207 907 2934
![Hochschild (co)homology and Koszul duality - arXiv · 2015. 12. 8. · arXiv:1405.2247v2 [math.KT] 6 Dec 2015 Hochschild (co)homology and Koszul duality Estanislao Herscovich ∗](https://img.dokumen.tips/doc/110x75/60bce131fe07f4245000d5a2/hochschild-cohomology-and-koszul-duality-arxiv-2015-12-8-arxiv14052247v2.jpg)