Embed Size (px)
Citation preview

© Hitachi, Ltd. 2018. All rights reserved.
Hitachi IR Day 2018
Power and Energy
Business Strategy
Atsushi Oda Vice President and Executive Officer, CEO of Power Business Unit
Hidetoshi TakeharaVice President and Executive Officer, CEO of Nuclear Energy Business Unit
Hitachi, Ltd.
June 8, 2018

© Hitachi, Ltd. 2018. All rights reserved.
Contents
Power and Energy Business Strategy
1. Power and Energy Business Updates
2. Business Strategy of Power Business Unit
3. Summary
4. Status of Nuclear Energy Business
5. Business Performance Data and Glossary
2
© Hitachi, Ltd. 2018. All rights reserved.
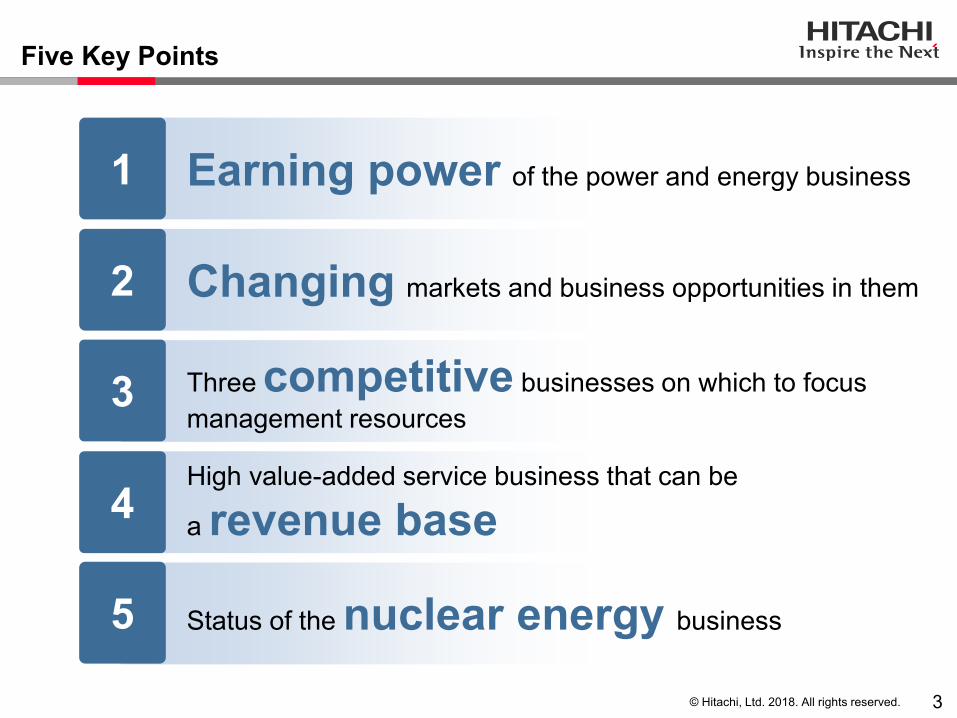
Earning power of the power and energy business
Changing markets and business opportunities in them
Three competitive businesses on which to focus
management resources
High value-added service business that can be
a revenue base
Status of the nuclear energy business
Five Key Points
1
2
3
4
5
3

© Hitachi, Ltd. 2018. All rights reserved.
Nuclear Power Plant (ABWR )
Small-scale dual-arm heavy machinery type robot
1-1. Progress of Mid-term Management Plan (1) Business Overview
4
42%
450.9Billion Yen *1
FY2017Revenues
Power Business UnitNuclear Energy Business Unit
*1 Figures reflect the effect of reorganization implemented on April 1, 2018
Fuel transport and storage casks
58%
Substation GIS Transformer
Control systemmaintenance services
Wind turbine
RenewableEnergy Solutions
16%
Grid Solutions
13%
Services
23%
Provide solutions based on collaborative creation
to all customers in the energy value chain
1. Power and Energy Business Updates
Social and
Environmental
Values
Contribute to industrial development and the realization
of a sustainable society by providing energy systems
that do not produce CO2 emissions during
power generation
Corresponding SDGs
Others 6%

© Hitachi, Ltd. 2018. All rights reserved.
FY2017
FY2018
Profitability of Power and Energy Business is improving steadily
1-1. Progress of Mid-term Management Plan (2) Review of FY2017
5Figures for FY2017 (results) and FY2018 (forecast) reflect the effect of reorganization implemented on April 1, 2018.
Although high profitability measures was given priority and revenue fell year over year,
the adjusted operating income ratio rose 3.9 points year over year
due to business structure reforms
Adjusted operating income ratio is expected to improve 0.6 points year over year,
reflecting continued prioritization of higher profits
495.7
1.8%
490.0
3.5%
450.9
5.7%
456.0
6.3%
FY2016
(Results)
FY2017
(Results)
FY2018
(Forecast)
2.0%
4.0%
6.0%
8.0%
10.0%
Adjusted
Operating
Income Ratio
519.5
2.2%
FY2015
(Results)
590.0
7.5%
ResultPrevious forecast,
target[Jun. 2016]
Current forecast[Jun. 2018]
Revenue
Adjusted
Operating
income Ratio
Revenue
Adjusted
Operating
income Ratio
Revenue
Adjusted
Operating
Income ratio
Legend
The size of the circle corresponds to the scale of revenue (billion yen).
(i) Business structure
reforms and
reorganization
(ii) Slow expansion of the
offshore wind power
market in Japan
Main reasons for deviation
between previous
and current
FY2018 forecasts
1. Power and Energy Business Updates

© Hitachi, Ltd. 2018. All rights reserved. 6
Implement business
structure reforms
Structure reforms for revitalization were completed,
putting business on growth track
Complete GDA as planned in the UK
Implement initiatives for resumption of
operations of BWRs in Japan
Continue negotiations with UK government
Renewable Energy Solutions Business
Grid Solutions Business
Maintain largest share of wind power market
in Japan
Enter overseas offshore wind power market
Expand top line (revenue)
Services Business
Nuclear Energy Business
Power Business Unit Nuclear Energy Business Unit
Power and Energy Business
1-1. Progress of Mid-term Management Plan (3)
Achieved in FY2017 Ongoing
Complete reconstruction of transmission
and distribution systems business
and move into profitability
Expand services business
Expand orders received for grid
connections
Expand high added value services
Profit share-type
Prognostic and predictive diagnosis
Expand collaborative creation with customers
Expand comprehensive services
by strengthening maintenance platform
Strengthen solutions business Further strengthen cost competitiveness
Review of FY2017
(Achievements)
1. Power and Energy Business Updates

© Hitachi, Ltd. 2018. All rights reserved. 7
Phase Shifting Transformer in Japan
(August 2017)
Order received for 21 wind turbines
for Taiwan Power Company’s
Changhua Offshore
Wind Farm Project
(February 2018)
Completion of
generic design assessment
of UK ABWR
(December 2017)
Order received for upgrade
gas turbines with AGP
from Ohgishima Power Co., Ltd.
(February 2018)
Transformers from
Manila Electric Company (Meralco)
in the Philippines
(market development)
(September 2017)
Completion of Ichigo
Showa Village Ogose ECO
Power Plant
(October 2017)
Orders Received for Large Projects
Progress of Projects
Ceremony to pray for
safety of construction of
A-wind Katagami Wind Farm
(October 2017)
Order received for predictive
diagnosis services for air conditioning
and refrigeration products
(March 2018)
Major projects progressed steadily and
orders for large projects were also received
Image of 9FA type
gas turbine
1-1. Progress of Mid-term Management Plan (4)
1. Power and Energy Business Updates Review of FY2017
(Major Achievements)

© Hitachi, Ltd. 2018. All rights reserved.
Orders Received Order Backlog
Revenue Adjusted Operating Income Adjusted Operating
Income Ratio
8
450.9 456.0 25.6 28.9 5.7% 6.3%
495.9 443.5
FY2017 FY2018
FY2017 FY2018 FY2017 FY2018
683.8 671.3
FY2017 FY2018 FY2017 FY2018
RevenueNuclear Energy Business revenue will decrease slightly,
while Power Business revenue will remain firm
Adjusted Operating
Income
Various structural reforms, cost-cutting activities and other initiatives
will boost income
Orders Received
and Order Backlog
Orders will be affected by compliance with new nuclear regulatory requirements
and decrease in orders related to services in thermal power business
Both revenues and adjusted operating income are expected to
exceed year-ago levels
1-1. Progress of Mid-term Management Plan (5)
1. Power and Energy Business Updates FY2018 Outlook
(Overview)
billion yenbillion yen billion yenbillion yen
billion yenbillion yen billion yenbillion yen
Figures for FY2017 (results) and FY2018 (forecast) reflect the effect of reorganization implemented on April 1, 2018.Figures for orders received for FY2017 (results) are retroactively revised.

© Hitachi, Ltd. 2018. All rights reserved. 9
0
50
100
2015 2020 2023 2025
Low-carbon/recycling/
harmony with nature are essential for
the realization of a sustainable society
Renewables will become leading
energy sources
Nuclear power will be maintained
as an base load energy source
Increase introduction of wind turbine and
photovoltaic
With the decentralization of energy sources,
investment to increase the resilience and
stability of transmission and
distribution systems will expand
The need for regional solutions
will increase
Investment in new markets
and investment to improve
profitability will increase
Players from other sectors will
enter the energy sector in earnest
and power companies will develop
a range of services
De-carbonization
Decentralization
Digitalization
Global power generation capacity
North American distributed
energy generation market sizeBillion
dollars
Gas & Steam
Turbines
Fuel Cells
Gas Engines
Wind Turbine
Billion
dollars
Market for Digitalization
in Energy Sector
O&M for
thermal power
Smart meters
Distribution
automation
HEMS
Others
Source: Grand View Research
Year
Source: Bloomberg
Year
Source: World Energy Outlook 2017
0
50
2017 2020 2023 2025
Photovoltaic
1-2. Market Environment (1)
1. Power and Energy Business UpdatesTransformation of the Power
and Energy Market by the 3Ds
0
5000
10000
2015 2025 2030 2035
Thermal
Nuclear
Renewable
Energy
Year
GW

© Hitachi, Ltd. 2018. All rights reserved. 10
Renewables as leading energy source
Digitalization of Energy Sector
Baseload electricity sources
Regional Solutions
Power systems for society that will be realized under Society 5.0 strategy
Provide high added value solutions using
digital technologies through collaborative creation
Collaborative Creation/
Solutions
Services
1-2. Market Environment (2)
1. Power and Energy Business UpdatesNew Business Opportunities Arising
from Market Transformation
Mega solar plantsWind farms
Pumped-storage power plants Central load
dispatching centers
Aggregation (DR,VPP)
Connect& Manage
Microgrids
Decentralized power sources
High voltage, direct current transmission
Storage batteries
Digitalsubstations
Nuclearenergy
IoT, AI
© Hitachi, Ltd. 2018. All rights reserved. 11
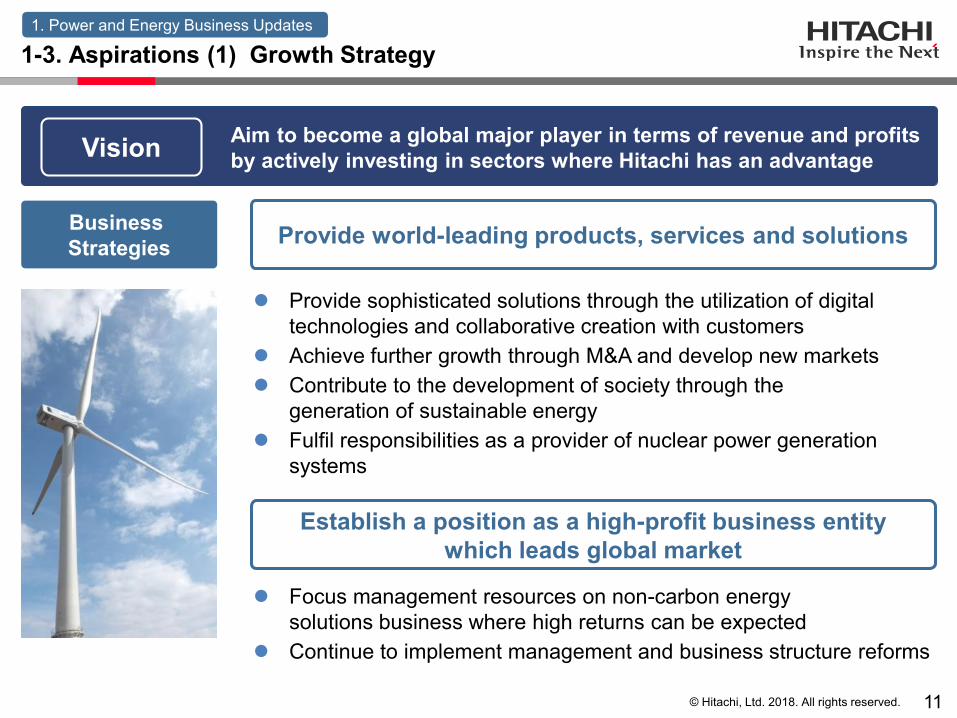
Vision
Focus management resources on non-carbon energy
solutions business where high returns can be expected
Continue to implement management and business structure reforms
Aim to become a global major player in terms of revenue and profits
by actively investing in sectors where Hitachi has an advantage
Business
Strategies
Provide sophisticated solutions through the utilization of digital
technologies and collaborative creation with customers
Achieve further growth through M&A and develop new markets
Contribute to the development of society through the
generation of sustainable energy
Fulfil responsibilities as a provider of nuclear power generation
systems
Establish a position as a high-profit business entity
which leads global market
Provide world-leading products, services and solutions
1-3. Aspirations (1) Growth Strategy
1. Power and Energy Business Updates

© Hitachi, Ltd. 2018. All rights reserved.
Over
800.0Over
10.0%
12
Adjusted Operating Income Ratio
Adjusted Operating Income (Billion Yen)
The size of the circle corresponds to the scale of revenue (billion yen).
FY2016
(Results)
FY2018
(Forecast)
FY2021
(Target)
495.7
456.0
1.8%
6.3%
FY2017
(Results)
5.7%
450.9
FY2018
(Forecast)
FY2021
(Target)
Nuclear
Energy
38%
Power
62%
Nuclear
Energy
30%
Power
70%
FY2017
(Results)
Nuclear
Energy
42%
Power
58%
FY2016
(Results)
Nuclear
Energy
41%
Power
59%
0%
2.0%
4.0%
6.0%
8.0%
10.0%
0 20.0 40.0 60.0 80.0 100.0
Further growth through additional investment,
acquisitions, etc. in addition to organic growth
Ratios of Nuclear Energy and Power Businesses
Figures for FY2017 (results) and FY2018 (forecast) reflect the effect of reorganization implemented on April 1, 2018.
Become a business that is expected to contribute
to Group growth both in terms of revenue and adjusted operating income
1-3. Aspirations (2) Target Business Scale and Profits (FY2021 Targets)
1. Power and Energy Business Updates
© Hitachi, Ltd. 2018. All rights reserved.
Contents
Power and Energy Business Strategy
1. Power and Energy Business Updates
2. Business Strategy of Power Business Unit
3. Summary
4. Status of Nuclear Energy Business
5. Business Performance Data and Glossary
13

© Hitachi, Ltd. 2018. All rights reserved. 14
Renewable Energy
Solutions Business
Grid Solutions
Business
High-value Added
Services Business
Enter global market and expand business
Maintain largest share of wind power market
in Japan and generate higher profits
Expand solutions services business
Promote decentralized power sources business
Expand total solutions business from
bulk power grid to grid edge
Increase rate of maintenance coverage of
installed equipment
Develop more sophisticated,
high added value services
Expand business based on collaborative creation
through utilization of wide range of channels
Promote business by strengthening core
technologies
Expand comprehensive services
business
Figures for each business include transactions between businesses.
Focus management resources on three businesses
where high returns can be expected
2-1. Priority Areas for Achievement of Targets
2. Business Strategy of Power Business Unit
FY 2018 2021
Revenues 80.0 billion yen over 400.0 billion yen
FY 2018 2021
Revenues 75.0 billion yen over 120.0 billion yen
FY 2018 2021
Revenues 120.0 billion yen over 160.0 billion yen

© Hitachi, Ltd. 2018. All rights reserved. 15
Business selection and concentration New investment for growth - Evolution into global business
FY2016 FY2017 FY2018 FY2021
Sale of steel roll business
Downsizing of business
of selling electricity, etc.
Structural reform of grid
business, etc.
Strengthening of services
business
Intensive investment in high profit products and solutions
Partnering (offshore wind power, etc.)
Realization of high capacity utilization through use of digital
technologies
Strengthening of prognostic and predictive diagnosis services
Revenue
Adjusted Operating Income
FY2019 FY2020
Implement structural reforms to focus on businesses
where Hitachi has an advantage
2-2. Steps to Becoming a High Profit Business
2. Business Strategy of Power Business Unit
Investment to increase scale, including M&A related to wind power
business
Expansion of grid solutions and services
Promotion of collaborative creation with customers (established
energy business
co-creation and
promotion division)
© Hitachi, Ltd. 2018. All rights reserved.
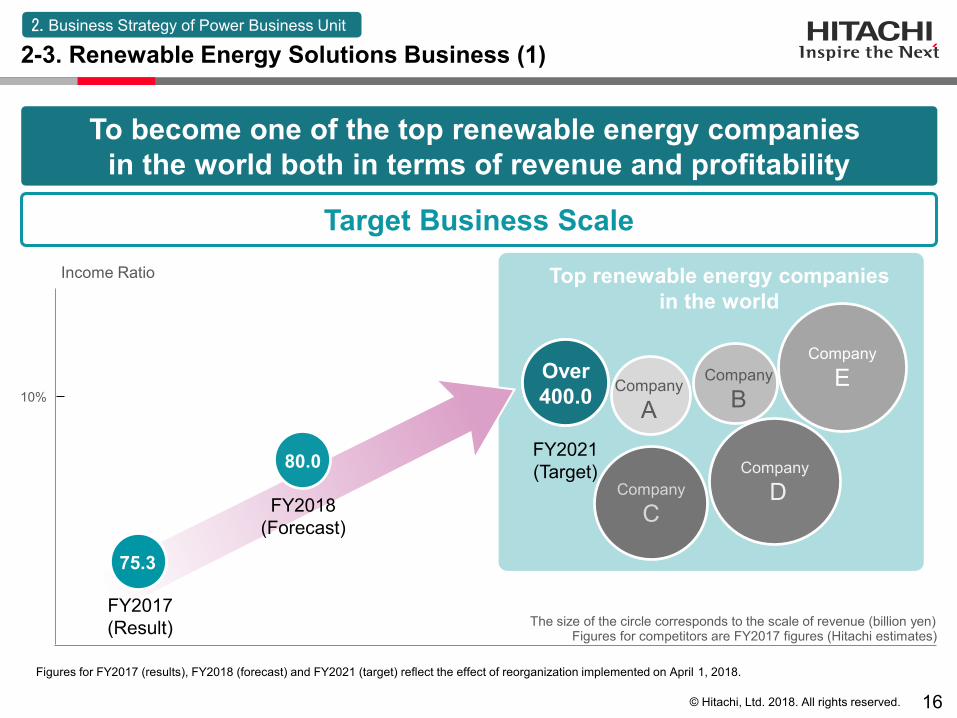
Company
C
Company
D
16
Target Business Scale
Company
E
FY2021
(Target)
Income Ratio
The size of the circle corresponds to the scale of revenue (billion yen)
10%
Over
400.0
Figures for competitors are FY2017 figures (Hitachi estimates)
Top renewable energy companies
in the world
Figures for FY2017 (results), FY2018 (forecast) and FY2021 (target) reflect the effect of reorganization implemented on April 1, 2018.
To become one of the top renewable energy companies
in the world both in terms of revenue and profitability
FY2018
(Forecast)
FY2017
(Result)
80.0
75.3
2-3. Renewable Energy Solutions Business (1)
2. Business Strategy of Power Business Unit
Company
BCompany
A

© Hitachi, Ltd. 2018. All rights reserved. 17
Shin-Aoyama Kogen Wind Farm
Aoyama-Kogen Wind Farm Co., Ltd.
Signing ceremony for
Taiwan Power Company’s
Changhua Offshore
Wind Farm Project
Maintain largest share
of market in Japan
Generate higher profits
Enter overseas
markets
Strengthen market
activities to get orders
Use wind turbine line-up and features
in activities to win orders
Promote utilization of digital
technologies and VEC, and
reduce LCoE through partnering
Leverage capability to withstand
typhoons to gain entry to overseas
markets
Steadily promote projects through
utilization of partnering
Compete with major global companies
through use of alliances and M&A
in revenue
from FY2018 to FY2021
Make use of downwind wind turbines
to expand business and improve profitability
2-3. Renewable Energy Solutions Business (2)
2. Business Strategy of Power Business Unit
Increase of
250 billion yen

© Hitachi, Ltd. 2018. All rights reserved.
Decentralized power sources
(Example of components)
Collaborative creation
with Saibugas Co., Ltd.
(Ene Seed Kitakyushu
Wind Power Plant)
Expand solutions
and
services business
Promote decentralized
power sources
solutions business
Expand business to wide range of customers
including new power companies, general
industry and local government
Solve customer problems with
regional solutions based on collaborative
creation
Expand solutions business with wind turbines
at core
Improve customer satisfaction by strengthening
LTSA business(Strengthen competitiveness by combining OT and IT)
Enter market for services for
other companies’ products through
third-party maintenance capability
in revenue
from FY2018 to FY2021
in revenue
from FY2018 to FY2021
18
Improve profitability through expansion of solutions business
e.g. Project for construction of compact energy
network in Hioki, Kagoshima Prefecture, Japan
(from August 2017)
Photograph:Toru Nagao
Wind turbine Storage battery system
Photovoltaic generation
system
2-3. Renewable Energy Solutions Business (3)
2. Business Strategy of Power Business Unit
Increase of
10 billion yen
Increase of
60 billion yen

© Hitachi, Ltd. 2018. All rights reserved.
Top grid solutions companies in the world
19
Target Business Scale
Income Ratio
XXX
75.0
60.5
FY2018
(Forecast)
FY2021
(Target)
FY2017
(Result)
Company
B
Company
C10%
Figures for FY2017 (results), FY2018 (forecast) and FY2021 (target) reflect the effect of reorganization implemented on April 1, 2018.
To become one of the top grid solutions companies in the world
by proposing total solutions and expanding services business
Over
120.0
The size of the circle corresponds to the
scale of revenue (billion yen)
Figures for competitors are FY2017 figures
(Hitachi estimates)
Company
D
Company
A
Company
E
2-4. Grid Solutions Business (1)
2. Business Strategy of Power Business Unit

© Hitachi, Ltd. 2018. All rights reserved. 20
Propose solutions
using core products Strengthen competitive equipment for bulk systems
such as HVDC (Japan, Asia) and UHV (Asia).
Strengthen solution proposals through utilization of IT
and partnering.In revenue
from FY2018 to FY2021
Large-scale grids
EMS
Multi-directional
flow of
powerDecentralizedpower sources
Users
Mega solar power plants
Wind farms
Substations
Switching stations
Large-scale power sources
Provide solutions for achieving co-existence of
decentralized systems with large-scale grids
Decentralized systems
2-4. Grid Solutions Business (2)
2. Business Strategy of Power Business Unit
Increase of
20 billion yen

© Hitachi, Ltd. 2018. All rights reserved. 21
Provide OPEX-reducing services
utilizing IoT and digital technologies(remote monitoring, oil leak diagnosis,
digital substations, etc.)
Promote total maintenance, and
maintenance of
other companies’ products
Improve maintenance
coverage ratio
for existing
equipment
Develop
sophisticated,
high added value
services
*1 Number of transformers and switchgears over 15 years old delivered by Hitachi.
*2 Ratio of installed equipment for which Hitachi carried out statutory inspection from FY2014 to FY2016
in revenue
from FY2018 to FY2021
GIS substation
Image of GIS diagnosis system
Improve profitability by expanding services business
Monitoring
room
Local substation
Take full advantage of opportunity to
provide maintenance services for
large amount of installed equipment
- Number of installed units*1
- Coverage ratio of maintenance and inspection *2
Strengthen maintenance platform in key regions (partnering with local enterprises, M&A)
: Around 22,000 units
: Around 10%
2-4. Grid Solutions Business (3)
2. Business Strategy of Power Business Unit
Increase of
30 billion yen
© Hitachi, Ltd. 2018. All rights reserved. 22
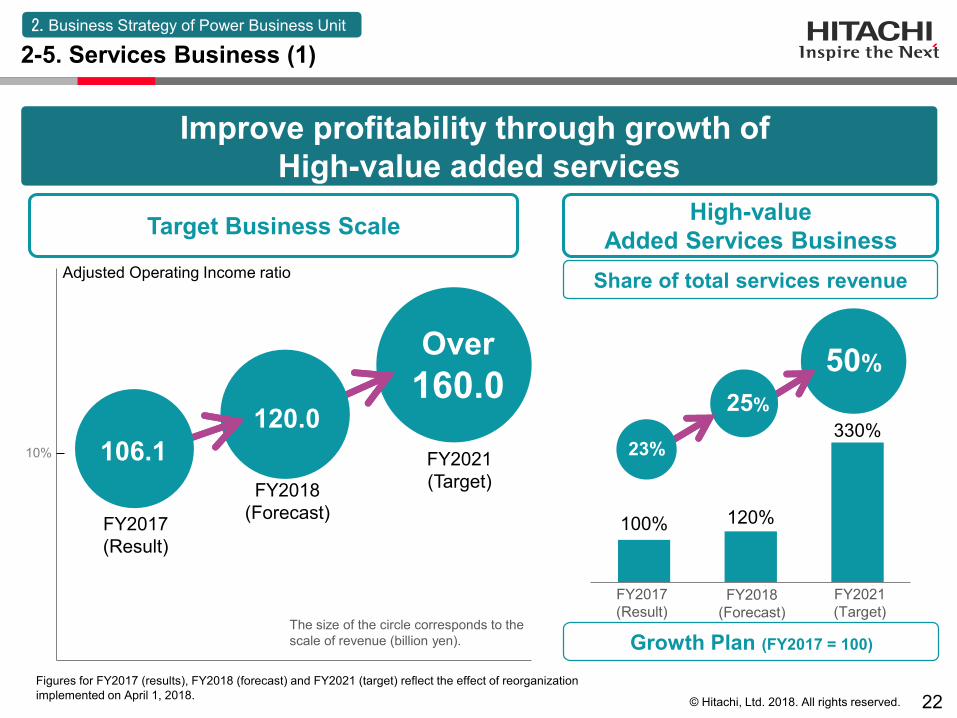
100% 120%
330%
2017年(実績)
2018年(見通し)
2021年(目標)
50%
The size of the circle corresponds to the
scale of revenue (billion yen).
Target Business Scale
25%
23%
Adjusted Operating Income ratio
Over
160.0
FY2018
(Forecast)
FY2021
(Target)
FY2017
(Result)
120.0
106.110%
Share of total services revenue
Growth Plan (FY2017 = 100)
High-value
Added Services Business
Improve profitability through growth of
High-value added services
2-5. Services Business (1)
2. Business Strategy of Power Business Unit
FY2018
(Forecast)
FY2021
(Target)
FY2017
(Result)
Figures for FY2017 (results), FY2018 (forecast) and FY2021 (target) reflect the effect of reorganization
implemented on April 1, 2018.

© Hitachi, Ltd. 2018. All rights reserved.
Newly developed
maintenance support solution
23
Shift focus away from maintenance services for
own products in Japan and expand global
services for other companies’ products and profit-
share-type services
Utilize channel of around 6,000 customers
established through maintenance services
Expand business based
on collaborative creation
by utilizing a wide range
of channels
Further improve customer value by adding
prognostic algorithms to predictive diagnosis
Expand scope of equipment covered by
prognostic and predictive diagnosis, and enhance
applied service menu
Strengthen core
technologies
Expand BPO-type maintenance services through
cooperation with Group companies
Acquire capability to maintain products of other
companies through utilization of M&A
Expand comprehensive
services
Increase of
25 billion yen
in revenue
from FY2018 to FY2021
Increase of
15 billion yen
in revenue
from FY2018 to FY2021
Control system maintenance
Remote monitoring and
support center
Achieve growth through utilization of
strong business base and core technologies
2-5. Services Business (2)
2. Business Strategy of Power Business Unit

© Hitachi, Ltd. 2018. All rights reserved.
Contents
Power and Energy Business Strategy
1. Power and Energy Business Updates
2. Business Strategy of Power Business Unit
3. Summary
4. Status of Nuclear Energy Business
5. Business Performance Data and Glossary
24

© Hitachi, Ltd. 2018. All rights reserved. 25
FY2018 (Forecast)*1 Vs FY2015*2 FY2021 (Target)*1 Vs FY2018
Revenues 456.0 billion yen 88% Over 800.0 billion yen 175%
Nuclear Energy
BU182.0 billion yen 97% Over 250.0 billion yen 137%
Power BU 284.0 billion yen 105% Over 550.0 billion yen 194%
Adjusted Operating
Income (Ratio)28.9 billion yen
(6.3%)
258%
+4.1pt
Over 80.0 billion yen
(Over 10.0%)
277%
+3.7pt
*2 Revenues and adjusted operating income for FY2015 include revenue of Energy Solutions BU.
*1 Figures for FY2018 (forecast) and FY2021 (target) reflect the effect of reorganization implemented on April 1, 2018.
FY2021 Target
3-1. FY2021 Targets
3. Summary
Contribute to industrial development and the realization of
a sustainable society by providing energy systems
that do not produce CO2 emissions during power generation

© Hitachi, Ltd. 2018. All rights reserved.
Contents
Power and Energy Business Strategy
1. Power and Energy Business Updates
2. Business Strategy of Power Business Unit
3. Summary
4. Status of Nuclear Energy Business
5. Business Performance Data and Glossary
26

© Hitachi, Ltd. 2018. All rights reserved. 27
4-1. Business Strategy
Improve profitability, positioning domestic business as a core
business and overseas business as a growing business
4. Nuclear Energy Business Trends
Domestic
Business Promote an early restart of BWRs, response to new regulatory
standards and decommissioning of Fukushima Daiichi
Provide solutions to improve plant operational efficiency and
extend plant lifetime
Lead a nuclear industry based on
reliability and technical expertise
Make steady progress with the UK’s
Horizon Project
Make good progress with the project and enhance business
value
Make final investment decision, after applying project
assessment in terms of economic rationality
Overseas
Business

© Hitachi, Ltd. 2018. All rights reserved. 28
4-2. Domestic Business
4. 原子力事業動向
Strengthen an early restart of BWRs and Decommissioning of
Fukushima Daiichi Nuclear Power Station
4. Nuclear Energy Business Trends
Strengthen an early restart
of BWRs
and long-term stable operation
Make steady progress with
engineering works for compliance
with new regulatory requirements
and license approval
Provide customer support for early
restart operations
Decommissioning
Business
Support electric power companies
from examination/planning stage
Conclude cooperation agreements
with experienced overseas
manufacturers to utilize their
experience and knowledge
Support improvement in plant
Operational efficiency through O&M
based on collaborative creation
with customers
Utilize the IoT platform to achieve
integrated management
Support customers for meeting
demands of society (security etc.)
Fuel cycle business
Provide customer support for early
completion of the Rokkasho
Reprocessing Plant
Expand orders received for fuel
transport and storage casks
Decommissioning of
Fukushima Daiichi
Nuclear Power Station
Completion of construction for
two series of Purification Facility
such as sub drain facility
(December, 2017)
Completion of dismantling
construction for unit 1 reactor
building cover (January, 2018)
Development of advanced
technology for retrieval of fuel
debris
Higashihara’s visit to Fukushima Nuclear Power Station

© Hitachi, Ltd. 2018. All rights reserved.
Wylfa Newydd
(Planned site) Gloucester
(Head Office)
Oldbury
(Planned site)
29
Outline of Horizon Nuclear Power Limited
Name of Company
Overview of Horizon Project (Phase 1 Project)
• 2 ABWRs are planned to be constructed in Wylfa’s site
(southern area of the existing nuclear power plant)
as the phase 1 project (Wylfa Newydd Project)
Horizon Nuclear Power Limited
CEO Duncan HawthorneAssumed office on May 1, 2016; previously President & CEO at Bruce Power L.P.
Gloucester, UK
January 2009Acquired by Hitachi from UK subsidiary
of German utility companies E.On and RWE in November 2012
Hitachi, Ltd. (100%)
4-3. Overview of Horizon Project
4. Nuclear Energy Business Trends
Shareholder
Representative
Head Office
Date of Establishment

© Hitachi, Ltd. 2018. All rights reserved.
Negotiations regarding financial support, etc.
with the UK government continue
30
Ministerial statement at the Parliament:
Greg Clark, Secretary of State for Business,
Energy and Industrial Strategy (Summary)(June 4, 2018)
4-4. Negotiations with the UK Government (1) Ministerial Statement
I am pleased to confirm today that Hitachi and the UK Government
have decided to enter into negotiations in relation to the proposed
Wylfa Newydd project.
This is an important next step for the project, although no decision
has been taken yet to proceed with the project.
Both the National Audit Office and Public Accounts Committee have
recommended that the Government consider variations from the
Hinkley Point C*1 financing model in order to reduce costs to
consumers.
In line with the NAO and PAC’s clear findings and recommendations,
for this project the Government will be considering direct investment
alongside Hitachi, Japanese Government agencies and other parties.*1 Hinkley Point C is a project to construct a nuclear power station with two EPR reactors conducted by EDF in Somerset, UK
4. Nuclear Energy Business Trends
Greg Clark , Secretary
of State for Business

© Hitachi, Ltd. 2018. All rights reserved.
Final investment decision to be made from the aspect of
economic rationality as a private company
31
4-5. Negotiations with the UK Government (2) Hitachi Policy
The business sustainability judgment criteria includes but not limited to:
• Financing model on the premise for making Horizon project off-balance-sheet
• Secure reasonable returns as a private company
• Investment amount will be decided with an acceptable range as a private company
(including cost overrun)
4. Nuclear Energy Business Trends
Hitachi policy in negotiating with UK government
Details will be discussed in due course, Hitachi has welcomed the statement
from Greg Clark, UK Secretary of State for Business, Energy and Industrial
Strategy, on 4 June (GMT) on the new nuclear power construction project at
Wylfa Newydd on Isle of Anglesey (Horizon Project), which indicates progress
in the discussions to date between the parties.
Hitachi will make its final investment decision for Horizon Project, after
applying project assessment in terms of economic rationality as a private
company while keeping below judgment criteria with the same business policy.

© Hitachi, Ltd. 2018. All rights reserved. 32
Overseas
Revenue Ratio
184.7 181.0 173.0200.0
7.5 6.5 9.0
50.0
0
1,000
2,000
3,000
2016年度
(実績)
2017年度
(実績)
2018年度
(見通し)
2021年度
(目標)
187.5 182.0
Over 250.0
Revenue
(Billion yen)
Overseas
Japan
192.2
4% 3% 5% 20%
[ FY2018 target
in previous year *1]
[200.0][(Japan 185.0,
Overseas 15.0)]
*1 Announced on June 8, 2017.
4-6. Revenue Trend by Business Unit (Nuclear Energy Business Unit)
0
FY2016(Results)
FY2017(Results)
FY2018(Forecast)
FY2021(Target)
300.0
200.0
100.0
0
4. Nuclear Energy Business Trends

© Hitachi, Ltd. 2018. All rights reserved.
Contents
Power and Energy Business Strategy
1. Power and Energy Business Updates
2. Business Strategy of Power Business Unit
3. Summary
4. Status of Nuclear Energy Business
5. Business Performance Data and Glossary
33

© Hitachi, Ltd. 2018. All rights reserved. 34
FY2016Previous
Forecast*1*2(1)FY2017*2(2)
Difference
(2)-(1)FY2017*3
Revenues 495.7 billion yen 490.0 billion yen 465.0 billion yen (25.0) billion yen 450.9 billion yen
Overseas revenue
ratio9% 10% 8% - 9%
Adjusted Operating
Income8.8 billion yen 17.0 billion yen 25.0 billion yen +8.0 billion yen 25.6 billion yen
Adjusted Operating
Income Ratio1.8% 3.5% 5.4% - 5.7%
EBIT (57.2) billion yen 29.0 billion yen 39.9 billion yen +10.9 billion yen 40.1 billion yen
EBIT Ratio (11.5)% 5.9% 8.6% - 8.9%
CCC 82.0 days 81.0 days 75.0 days - 75.0 days
Orders Received*4 540.5 billion yen 454.4 billion yen 512.4 billion yen +58.0 billion yen 495.9 billion yen
Order Backlog 746.1 billion yen 717.5 billion yen 695.8 billion yen (21.7) billion yen 683.8 billion yen
5-1. FY2017 Results (Power and Energy Business)
5. Business Performance Data and Glossary
*1 Announced on June 8, 2017.
*2 Figures do not reflect the effect of reorganization implemented on April 1, 2018.
*3 Figures reflect the effect of reorganization implemented on April 1, 2018.
*4 Figures for orders received are retroactively revised.

© Hitachi, Ltd. 2018. All rights reserved.
0
500
3,000
4,000
5,000
6,000
35
FY2018 (Target) FY2018 (Forecast)
590.0(Billion yen)
~~
0
(Billion yen)
490.0
17.0
44.0
Improvement of profitability of transmission and distribution systems business+8.0
Figures for FY2017 (result) and FY2018 (forecast) reflect the effect of reorganization implemented on April 1, 2018.
456.0
FY2018 (Target) FY2018 (Forecast)
28.9
FY2017 (Result)
FY2017 (Result)
450.9
25.6
Reorganization, etc. (14.1)
Reorganization, etc.+0.6
Adjusted Operating Income
RevenueSlow expansion of the offshore wind power market in JapanChange in timing of recording revenue from certain projects in domestic nuclear energy business, etc.(25.0)
Slow expansion of the offshore wind power market in JapanChange in timing of recording revenue from certain projects in domestic nuclear energybusinessReorganization
(134.0)
Decrease in revenue(15.1)
[June 2017]
[June 2017]
[June 2017]
[June 2016]
5-2. Difference Between FY2017 Results and FY2018 Targets
5. Business Performance Data and Glossary(Power and Energy Business)
500
400
0
50
0FY2017 (Previous Forecast)
FY2017(Previous Forecast)

© Hitachi, Ltd. 2018. All rights reserved. 36
AdjustedOperating Income/EBIT(Billion yen)
Orders Received
Order Backlog
590.8 billion yen 540.5 billion yen
642.8 billion yen 746.1 billion yen
495.9 billion yen
683.8 billion yen
9% 9% 9% 11%
Revenue(Billion yen)
28.9[6.3%]
36.6[8.0%]
Overseas Revenue Ratio
■ Revenue ■ Adjusted Operating Income ([ ] Adjusted Operating Income Ratio) ■ EBIT ([ ] EBIT Ratio)
25.6[5.7%]
8.8[1.8%]
40.1[8.9%]
(57.2)[(11.5)%]
600.0 60.0
400.0
200.0
0 0
40.0
20.0
11.2[2.2%]
5.6[1.1%]
[590.0]
[44.0][7.5%]
[75.0][12.7%]
[FY2018 target in previous year*1]
443.5 billion yen
671.3 billion yen
)
FY2015(Results)
FY2016(Results)
FY2017(Results)
FY2018(Forecast)
519.5 495.7450.9 456.0
5-3. Business Performance Trends (Power and Energy Business)
5. Business Performance Data and Glossary
Figures for FY2017 (result) and FY2018 (forecast) reflect the effect of reorganization implemented on April 1, 2018.Figures for orders received until FY2017 (result) are retroactively revised.*1 Announced on June 8, 2017

© Hitachi, Ltd. 2018. All rights reserved. 37
0.0
3.8 4.4
0.1 0.2
SG&A Ratio
Gross Profit Margin
FY2016(Result)
0
FY2017(Result)
FY2018(Forecast)
82.0
75.0
70.0
2016年度
(実績)
2017年度
(実績)
2018年度
(見通し)
Improvement Points
(%)
Reduce indirect costs through work
style reform
Promote project pipeline management
Overhaul fixed costs in Japan
Reduce procurement costs through
Value Chain Innovation activities
Reduce loss costs by strengthening
project management
Promote cost reduction activities
Improve contract terms and speed up
conclusion of contracts
Thoroughly implement cash flow
management of individual projects
Improve CCC by reducing total assets
SG
&A
ex
pe
ns
e
CCC (Days)
Improvement Points in Gross Profitand SG&A Margin
Ca
sh
Ge
ne
ratio
nG
ros
s P
rofit
Figures for FY2017 (result) and FY2018 (forecast) reflect the effect of reorganization implemented on April 1, 2018.
5-4. SG&A expense, Gross Profit and CCC (Power and Energy Business)
5. Business Performance Data and Glossary
FY2016(Result)
FY2017(Result)
FY2018(Forecast)

© Hitachi, Ltd. 2018. All rights reserved. 38
FY2016FY2017
(Forecast)*1*2(1)
FY2017
(Results)*2(2)
Difference
(2)-(1)
FY2017
(Results)*3
Nuclear Energy Business Unit
192.2 billion yen 196.0 billion yen 187.5 billion yen (8.5) billion yen 187.5 billion yen
Power BusinessUnit
276.9 billion yen 267.0 billion yen 249.1 billion yen (17.9) billion yen 273.1 billion yen
Energy SolutionsBusiness Unit
78.2 billion yen 74.0 billion yen 71.8 billion yen (2.2) billion yen -
FY2017 Results
Business Performance Trend
FY2016 (Results) FY2017 (Results)*3 FY2018 (Forecast)*3 FY2021 (Target)
Nuclear Energy Business Unit 192.2 billion yen 187.5 billion yen 182.0 billion yen Over 250.0 billion yen
Power Business Unit 276.9 billion yen 273.1 billion yen 284.0 billion yen Over 550.0 billion yen
*1 Announced on June 8, 2017.
*2 Figures do not reflect the effect of reorganization implemented on April 1, 2018.
*3 Figures reflect the effect of reorganization implemented on April 1, 2018.
*4 Figures include IT systems business for the power and energy sector recorded in the Information and Telecommunication Systems segment.
*5 As a result of the restructuring in April 2018, the business of the Energy Solutions Business Unit was transferred to the Power Business Unit and Social
Infrastructure Systems Business Unit (Information and Telecommunications Systems segment).
*4
*5
5-5. Revenues by Business Unit
5. Business Performance Data and Glossary

© Hitachi, Ltd. 2018. All rights reserved. 39
Overseas
Revenue Ratio
184.7 181.0 173.0200.0
7.5 6.5 9.0
50.0
0
1,000
2,000
3,000
2016年度
(実績)
2017年度
(実績)
2018年度
(見通し)
2021年度
(目標)
187.5 182.0
Over 250.0
Revenue
(Billion yen)
Overseas
Japan
192.2
4% 3% 5% 20%
[ FY2018 target
in previous year *1]
[200.0][(Japan 185.0,
Overseas 15.0)]
*1 Announced on June 8, 2017.
5-6. Revenue Trend by Business Unit (Nuclear Energy Business Unit)
5. Business Performance Data and Glossary
0
FY2016(Results)
FY2017(Results)
FY2018(Forecast)
FY2021(Target)
300.0
200.0
100.0
0

© Hitachi, Ltd. 2018. All rights reserved. 40
サービス
発電ソリューション
送変電システム
その他
0
1000
2000
3000
4000
5000
6000
2016年度
(実績)
2017年度
(実績)
2018年度
(見通し)
2021年度
(目標)
273.1 284.0
Over 550.0
298.6*1
*1
38% 39% 42%Services
Business
19% 22%26%
Grid
Solutions
Business30% 28%
28%
Renewable
Energy
Solutions
Business
2016年度(実績)
2017年度(実績)
2018年度(見通し)
2021年度(目標)
13%11%
4%
Other
[FY2018 target in
previous year *2][320.0]
*1
*1 Figures reflect the effect of reorganization implemented on April 1, 2018.
*2 Announced on June 8, 2017.
5-6. Revenue Trend by Business Unit (Power Business Unit)
5. Business Performance Data and Glossary
FY2016(Results)
FY2017(Results)
FY2018(Forecast)
FY2021(Target)
Overseas
Revenue Ratio9% 9% 14% Over 40%
Revenue
(Billion yen)
600.0
500.0
400.0
300.0
200.0
100.0
0

© Hitachi, Ltd. 2018. All rights reserved. 41
5.
ABWR
AGP
BPO
CCC
DR
EBIT
EDF
EGAT
EPC
EPR
GDA
GIS
Advanced Boiling Water Reactor
Advanced Gas Path
Business Process Outsourcing
Cash Conversion Cycle
Demand Response
Earnings Before Interest and Taxes
Électricité de France
Electricity Generating Authority of Thailand
Engineering Procurement Construction
European Pressure Reactor
Generic Design Assessment
Gas Insulated Switchgear
:
:
:
:
:
:
:
:
:
:
:
:
5. Performance Data and Terminology
5-7. Terminology (1)

© Hitachi, Ltd. 2018. All rights reserved. 42
HEMS
HVDC
IoT
LCoE
LTSA
NAO
O&M
OPEX
PAC
SDGs
UHV
VEC
VPP
Home Energy Management System
High Voltage Direct Current
Internet of Things
Levelized Cost of Electricity
Long Term Service Agreement
National Audit Office
Operation & Maintenance
Operating Expense
Public Accounts Committee
Sustainable Development Goals
Ultra High Voltage
Value Engineering for Customers
Virtual Power Plant
:
:
:
:
:
:
:
:
:
:
:
:
:
5. Performance Data and Terminology
5-8. Terminology (2)

© Hitachi, Ltd. 2018. All rights reserved.
Cautionary Statement
43
Certain statements found in this document may constitute “forward-looking statements” as defined in the U.S. Private Securities Litigation Reform Act of 1995. Such “forward-looking
statements” reflect management’s current views with respect to certain future events and financial performance and include any statement that does not directly relate to any historical or
current fact. Words such as “anticipate,” “believe,” “expect,” “estimate,” “forecast,” “intend,” “plan,” “project” and similar expressions which indicate future events and trends may identify
“forward-looking statements.” Such statements are based on currently available information and are subject to various risks and uncertainties that could cause actual results to differ
materially from those projected or implied in the “forward-looking statements” and from historical trends. Certain “forward-looking statements” are based upon current assumptions of future
events which may not prove to be accurate. Undue reliance should not be placed on “forward-looking statements,” as such statements speak only as of the date of this document.
Factors that could cause actual results to differ materially from those projected or implied in any “forward-looking statement” and from historical trends include, but are not limited to:
economic conditions, including consumer spending and plant and equipment investment in Hitachi’s major markets, particularly Japan, Asia, the United States and Europe, as well as
levels of demand in the major industrial sectors Hitachi serves;
exchange rate fluctuations of the yen against other currencies in which Hitachi makes significant sales or in which Hitachi’s assets and liabilities are denominated;
uncertainty as to Hitachi’s ability to access, or access on favorable terms, liquidity or long-term financing;
uncertainty as to general market price levels for equity securities, declines in which may require Hitachi to write down equity securities that it holds;
fluctuations in the price of raw materials including, without limitation, petroleum and other materials, such as copper, steel, aluminum, synthetic resins, rare metals and rare-earth minerals,
or shortages of materials, parts and components;
the possibility of cost fluctuations during the lifetime of, or cancellation of, long-term contracts for which Hitachi uses the percentage-of-completion method to recognize revenue from
sales;
credit conditions of Hitachi’s customers and suppliers;
fluctuations in product demand and industry capacity;
uncertainty as to Hitachi’s ability to implement measures to reduce the potential negative impact of fluctuations in product demand, exchange rates and/or price of raw materials or
shortages of materials, parts and components;
uncertainty as to Hitachi’s ability to continue to develop and market products that incorporate new technologies on a timely and cost-effective basis and to achieve market acceptance for
such products;
increased commoditization of and intensifying price competition for products;
uncertainty as to Hitachi’s ability to attract and retain skilled personnel;
uncertainty as to Hitachi’s ability to achieve the anticipated benefits of its strategy to strengthen its Social Innovation Business;
uncertainty as to the success of acquisitions of other companies, joint ventures and strategic alliances and the possibility of incurring related expenses;
uncertainty as to the success of restructuring efforts to improve management efficiency by divesting or otherwise exiting underperforming businesses and to strengthen competitiveness;
the potential for significant losses on Hitachi’s investments in equity-method associates and joint ventures;
general socioeconomic and political conditions and the regulatory and trade environment of countries where Hitachi conducts business, particularly Japan, Asia, the United States and
Europe, including, without limitation, direct or indirect restrictions by other nations on imports and differences in commercial and business customs including, without limitation, contract
terms and conditions and labor relations;
uncertainty as to the success of cost structure overhaul;
uncertainty as to Hitachi’s access to, or ability to protect, certain intellectual property;
uncertainty as to the outcome of litigation, regulatory investigations and other legal proceedings of which the Company, its subsidiaries or its equity-method associates and joint ventures
have become or may become parties;
the possibility of incurring expenses resulting from any defects in products or services of Hitachi;
the possibility of disruption of Hitachi’s operations by natural disasters such as earthquakes and tsunamis, the spread of infectious diseases, and geopolitical and social instability such as
terrorism and conflict;
uncertainty as to Hitachi’s ability to maintain the integrity of its information systems, as well as Hitachi’s ability to protect its confidential information or that of its customers; and
uncertainty as to the accuracy of key assumptions Hitachi uses to evaluate its employee benefit-related costs.
The factors listed above are not all-inclusive and are in addition to other factors contained in other materials published by Hitachi.

© Hitachi, Ltd. 2018. All rights reserved.