Embed Size (px)
Citation preview
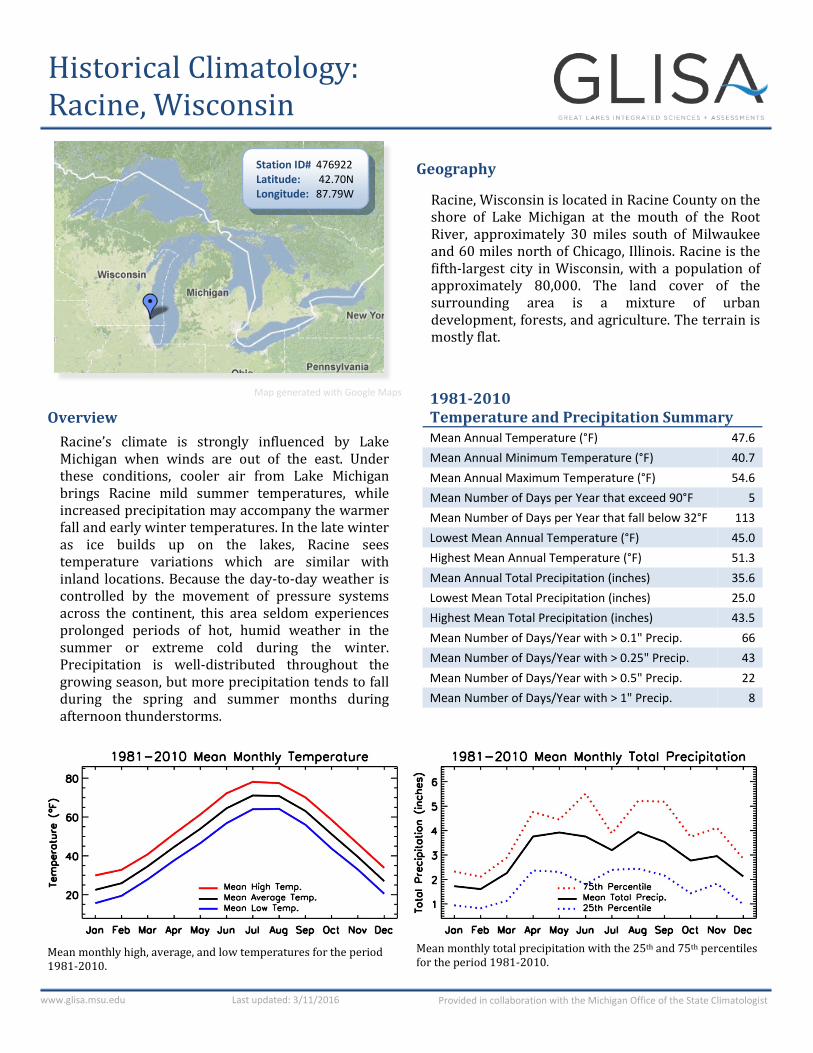
Historical Climatology: Racine, Wisconsin
Provided in collaboration with the Michigan Office of the State Climatologist www.glisa.msu.edu Last updated: 3/11/2016
Map generated with Google Maps
Geography
Racine, Wisconsin is located in Racine County on the shore of Lake Michigan at the mouth of the Root River, approximately 30 miles south of Milwaukee and 60 miles north of Chicago, Illinois. Racine is the fifth-largest city in Wisconsin, with a population of approximately 80,000. The land cover of the surrounding area is a mixture of urban development, forests, and agriculture. The terrain is mostly flat.
1981-2010 Temperature and Precipitation Summary Mean Annual Temperature (°F) 47.6 Mean Annual Minimum Temperature (°F) 40.7 Mean Annual Maximum Temperature (°F) 54.6 Mean Number of Days per Year that exceed 90°F 5 Mean Number of Days per Year that fall below 32°F 113 Lowest Mean Annual Temperature (°F) 45.0 Highest Mean Annual Temperature (°F) 51.3 Mean Annual Total Precipitation (inches) 35.6 Lowest Mean Total Precipitation (inches) 25.0 Highest Mean Total Precipitation (inches) 43.5 Mean Number of Days/Year with > 0.1" Precip. 66 Mean Number of Days/Year with > 0.25" Precip. 43 Mean Number of Days/Year with > 0.5" Precip. 22 Mean Number of Days/Year with > 1" Precip. 8
Overview
Racine’s climate is strongly influenced by Lake Michigan when winds are out of the east. Under these conditions, cooler air from Lake Michigan brings Racine mild summer temperatures, while increased precipitation may accompany the warmer fall and early winter temperatures. In the late winter as ice builds up on the lakes, Racine sees temperature variations which are similar with inland locations. Because the day-to-day weather is controlled by the movement of pressure systems across the continent, this area seldom experiences prolonged periods of hot, humid weather in the summer or extreme cold during the winter. Precipitation is well-distributed throughout the growing season, but more precipitation tends to fall during the spring and summer months during afternoon thunderstorms.
Mean monthly high, average, and low temperatures for the period 1981-2010.
Mean monthly total precipitation with the 25th and 75th percentiles for the period 1981-2010.
Station ID# 476922 Latitude: 42.70N Longitude: 87.79W
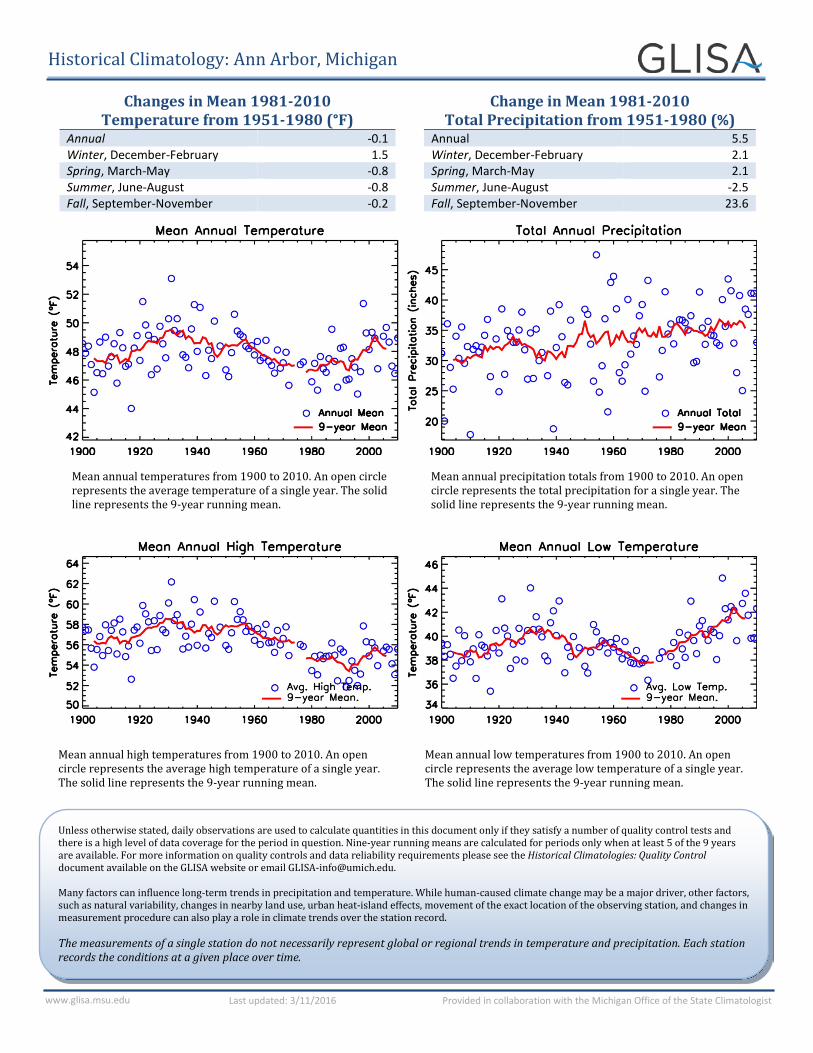
Historical Climatology: Ann Arbor, Michigan
www.glisa.msu.edu Provided in collaboration with the Michigan Office of the State Climatologist Last updated: 3/11/2016
Changes in Mean 1981-2010 Temperature from 1951-1980 (°F)
Annual -0.1 Winter, December-February 1.5 Spring, March-May -0.8 Summer, June-August -0.8 Fall, September-November -0.2
Change in Mean 1981-2010 Total Precipitation from 1951-1980 (%)
Annual 5.5 Winter, December-February 2.1 Spring, March-May 2.1 Summer, June-August -2.5 Fall, September-November 23.6
Mean annual temperatures from 1900 to 2010. An open circle represents the average temperature of a single year. The solid line represents the 9-year running mean.
Mean annual precipitation totals from 1900 to 2010. An open circle represents the total precipitation for a single year. The solid line represents the 9-year running mean.
Mean annual high temperatures from 1900 to 2010. An open circle represents the average high temperature of a single year. The solid line represents the 9-year running mean.
Mean annual low temperatures from 1900 to 2010. An open circle represents the average low temperature of a single year. The solid line represents the 9-year running mean.
Unless otherwise stated, daily observations are used to calculate quantities in this document only if they satisfy a number of quality control tests and there is a high level of data coverage for the period in question. Nine-year running means are calculated for periods only when at least 5 of the 9 years are available. For more information on quality controls and data reliability requirements please see the Historical Climatologies: Quality Control document available on the GLISA website or email [email protected]. Many factors can influence long-term trends in precipitation and temperature. While human-caused climate change may be a major driver, other factors, such as natural variability, changes in nearby land use, urban heat-island effects, movement of the exact location of the observing station, and changes in measurement procedure can also play a role in climate trends over the station record. The measurements of a single station do not necessarily represent global or regional trends in temperature and precipitation. Each station records the conditions at a given place over time.
Historical Climatology: Ann Arbor, Michigan
www.glisa.msu.edu Provided in collaboration with the Michigan Office of the State Climatologist Last updated: 3/11/2016
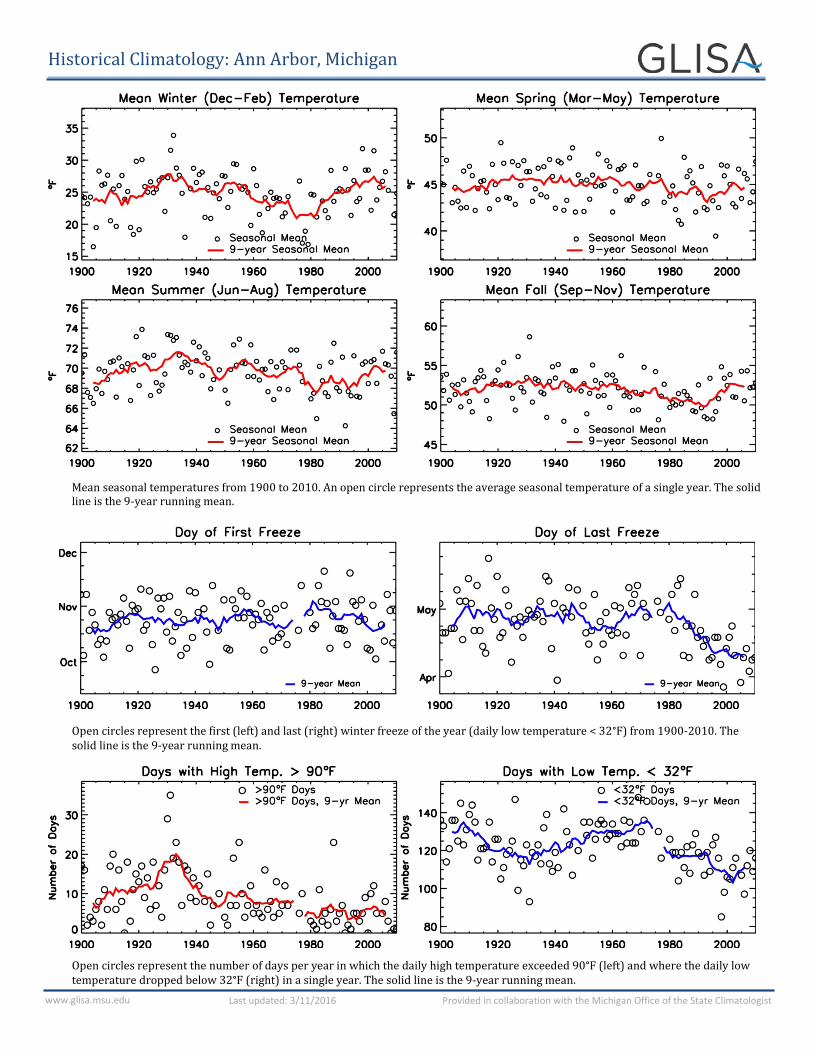
Mean seasonal temperatures from 1900 to 2010. An open circle represents the average seasonal temperature of a single year. The solid line is the 9-year running mean.
Open circles represent the first (left) and last (right) winter freeze of the year (daily low temperature < 32°F) from 1900-2010. The solid line is the 9-year running mean.
Open circles represent the number of days per year in which the daily high temperature exceeded 90°F (left) and where the daily low temperature dropped below 32°F (right) in a single year. The solid line is the 9-year running mean.
Historical Climatology: Ann Arbor, Michigan
www.glisa.msu.edu Provided in collaboration with the Michigan Office of the State Climatologist Last updated: 3/11/2016
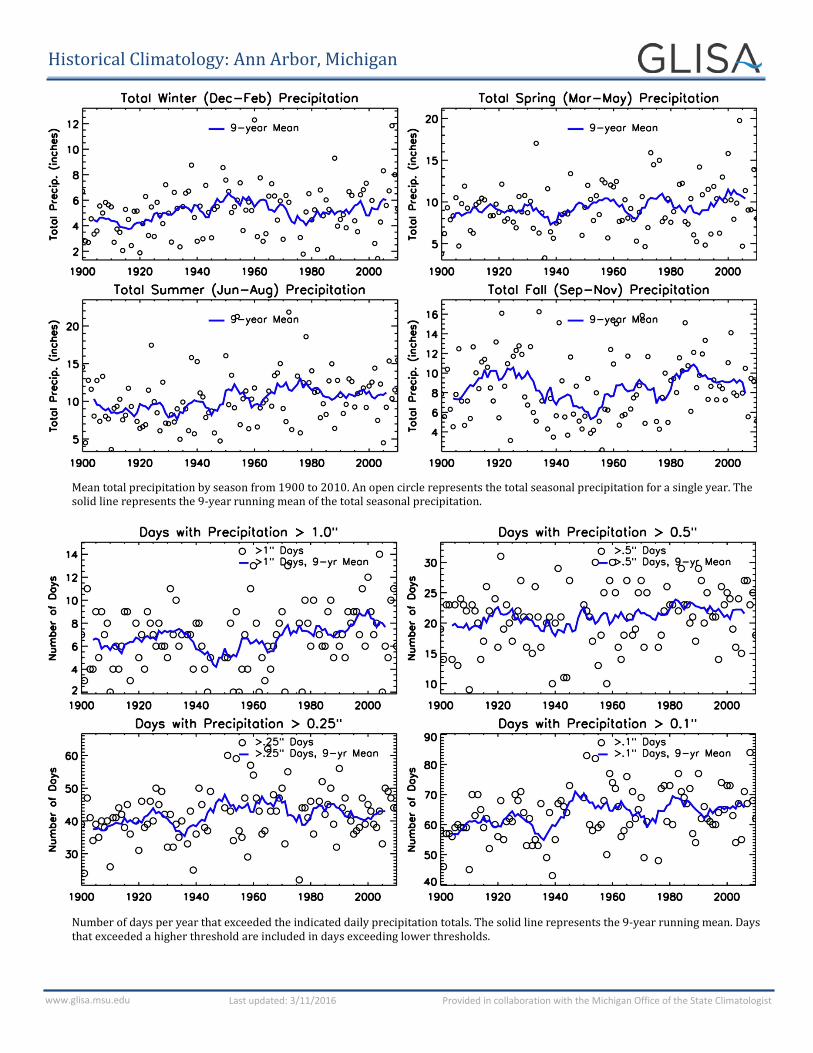
Mean total precipitation by season from 1900 to 2010. An open circle represents the total seasonal precipitation for a single year. The solid line represents the 9-year running mean of the total seasonal precipitation.
Number of days per year that exceeded the indicated daily precipitation totals. The solid line represents the 9-year running mean. Days that exceeded a higher threshold are included in days exceeding lower thresholds.


![Manuscript Collection Inventory - library.illinois.edu · Case Plow Works building, Racine, Wisconsin 61. Correspondence, expenses, ... Photographs [2] Chisholm residence (proposed)](https://img.dokumen.tips/doc/110x75/5b3fb7b17f8b9a91078c6ea4/manuscript-collection-inventory-case-plow-works-building-racine-wisconsin.jpg)