Embed Size (px)
Citation preview

evier.com/locate/ypmed
Preventive Medicine 42
Hispanic acculturation and utilization of cervical cancer screening in the US
Mona Shah, Kangmin Zhu *, Hongyu Wu, John Potter
United States Military Cancer Institute, Walter Reed Army Medical Center, Building 1, Suite E-111, 6900 Georgia Avenue, NW, Washington, DC 20307-5001, USA
Available online 16 November 2005
Abstract
Background. Hispanic women have an incidence rate of invasive cervical cancer that is twice as high as that of non-Hispanic White women.
Previous investigations have reported that Hispanics are less likely to utilize cancer screening services. Using data from the 2000 National Health
Interview Survey, this study examined whether acculturation of Hispanic women was associated with cervical cancer screening.
Methods. The subjects included 2307 Hispanic women aged 21–70 who did not have a history of cervical cancer or a hysterectomy. Women
were analyzed by acculturation level according to whether or not they ever had a Pap smear and had one in the previous year and previous 3 years.
Results. Acculturation levels tended to be inversely correlated with no Pap smear. Compared to lower acculturated women, women who were
more acculturated were less likely to never had a Pap smear (OR = 0.86; 95% CI = 0.58–1.27 for moderate acculturated women and OR = 0.51;
95% CI = 0.29–0.89 for higher acculturated women). Similar results were found for having no Pap smear within the past 3 years (OR = 0.83; 95%
CI = 0.61–1.13 for moderate acculturated women and OR = 0.73; 95% CI = 0.49–1.08 for higher acculturated women).
Conclusion. The findings show that lower acculturation was associated with the under use of cervical cancer screening and suggest that these
women might have barriers in accessing and utilizing Pap smears.
D 2005 Published by Elsevier Inc.
Keywords: Hispanics; Women; Cervical Cancer; Screening; Acculturation
Introduction
The mortality and incidence rates from cervical cancer are
higher among Hispanic women than non-Hispanic women in
the United States (Centers for Disease Control and Prevention,
2002). However, Hispanic women are less likely to utilize
Papanicolau (Pap) smears compared to non-Hispanic Blacks
and Whites (Coughlin and Uhler, 2002). The CDC reported
that in 1998 the prevalence of Pap testing within the preceding
3 years was 80% for non-Hispanic white women, 83% for non-
Hispanic black women, but only 74% for Hispanic women
(Coughlin and Uhler, 2002).
One of the factors that may influence cervical cancer
screening use by Hispanics is acculturation, a process whereby
one whose learning was in one culture then adopts attitudes,
values, and behaviors of another culture (Suarez, 1994). The
1982–1984 Hispanic Health and Nutrition Examination
Survey (HHANES) showed that acculturation was associated
with Pap smear screening (Solis et al., 1990). However, to our
0091-7435/$ - see front matter D 2005 Published by Elsevier Inc.
doi:10.1016/j.ypmed.2005.10.002
* Corresponding author. Fax: +1 202 782 5833.
E-mail address: [email protected] (K. Zhu).
best knowledge, there have been no large population-based
studies that further examine the acculturation/cervical cancer
screening relationship since that study during which there have
been national efforts in increasing cervical cancer screening
(Centers for Disease Control and Prevention, 2005). The
purpose of this paper was to examine the relationship between
acculturation and Pap smear utilization in a population-based
sample of Hispanic women in the United States.
Methods
The data for our analyses were collected in the National Health
Interview Survey (NHIS) in 2000, which used a sampling plan based on
a multistage area probability design that permitted a representative sampling
of households. Black and Hispanic/Latino populations were over-sampled to
increase the precision of estimates for those subgroups (National Center for
Health Statistics, 2002). Our analyses were restricted to women between the
age of 21 and 70 (the aged range recommended for cervical cancer
screening based on the most recent American Cancer Society guidelines
(Early detection of cervical cancer, 2002)) who self-identified themselves as
Hispanic and reported that they never were diagnosed with cervical cancer.
Women with a hysterectomy were excluded because the cervix may have
been removed.
Data were collected through in-person telephone interviews. Hispanic
acculturation was defined based on a series of questions on language usage,
(2006) 146 – 149
www.els
M. Shah et al. / Preventive Medicine 42 (2006) 146–149 147
both in childhood and adult. Respondents were asked to name the language in
which they generally spoke and the language that they were better able to read.
They were also asked to name the language they usually used when speaking at
home, when talking with friends, while thinking, when watching television, and
when listening to radio programs. We used the acculturation scale based on the
revised Marin and Marin Short Acculturation Scale (Marin and Marin, 1991),
for which the answers to the language questions were summed constituting a
score. The score was evenly divided into three groups or a tertilesa depending
on their summed score. The lowest tertile represents low acculturation; the
middle is moderate and the highest represents high acculturation. Pap smear
utilization was determined by whether they had ever had a Pap smear; those
who responded positively were then asked when they had their most recent
examination.
We used the logistic regression method in data analysis. Odds ratios and
95% confidence intervals were adjusted for demographic factors and other
potential confounding variables that were based on their relationship to the use
of Pap smear in the past 3 years and the acculturation levels in women who had
a Pap smear in the last 3 years.
Results
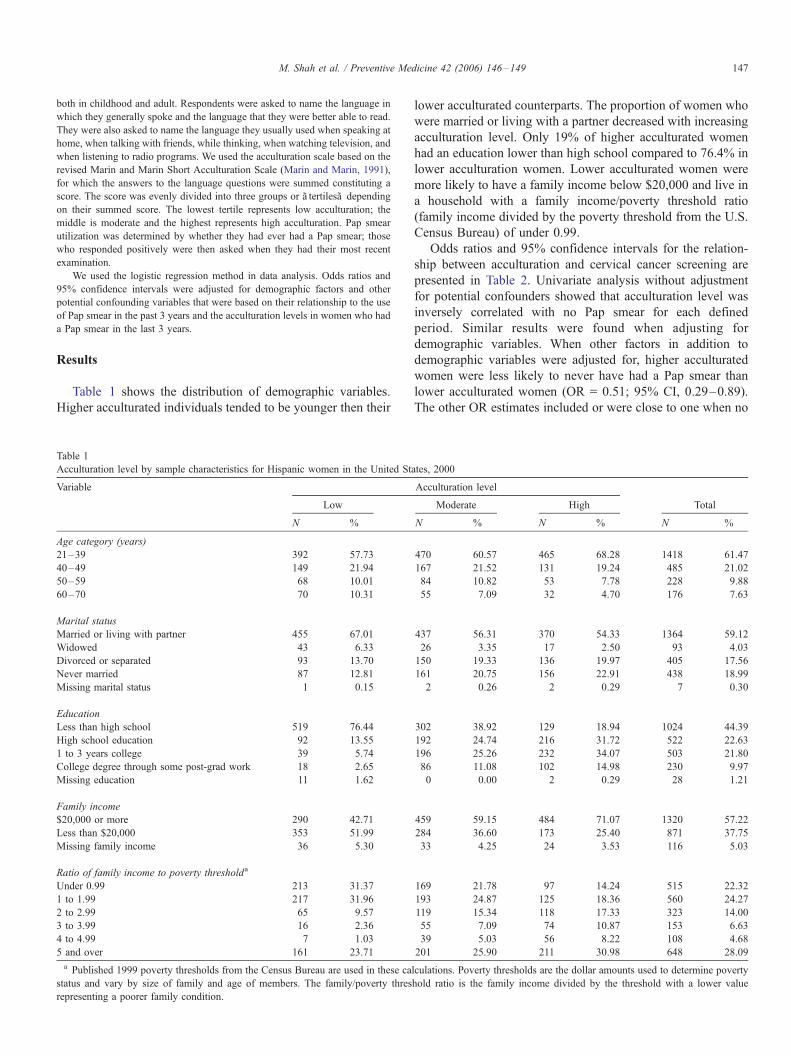
Table 1 shows the distribution of demographic variables.
Higher acculturated individuals tended to be younger then their
Table 1
Acculturation level by sample characteristics for Hispanic women in the United St
Variable
Low
N %
Age category (years)
21–39 392 57.73
40–49 149 21.94
50–59 68 10.01
60–70 70 10.31
Marital status
Married or living with partner 455 67.01
Widowed 43 6.33
Divorced or separated 93 13.70
Never married 87 12.81
Missing marital status 1 0.15
Education
Less than high school 519 76.44
High school education 92 13.55
1 to 3 years college 39 5.74
College degree through some post-grad work 18 2.65
Missing education 11 1.62
Family income
$20,000 or more 290 42.71
Less than $20,000 353 51.99
Missing family income 36 5.30
Ratio of family income to poverty thresholda
Under 0.99 213 31.37
1 to 1.99 217 31.96
2 to 2.99 65 9.57
3 to 3.99 16 2.36
4 to 4.99 7 1.03
5 and over 161 23.71
a Published 1999 poverty thresholds from the Census Bureau are used in these ca
status and vary by size of family and age of members. The family/poverty thres
representing a poorer family condition.
lower acculturated counterparts. The proportion of women who
were married or living with a partner decreased with increasing
acculturation level. Only 19% of higher acculturated women
had an education lower than high school compared to 76.4% in
lower acculturation women. Lower acculturated women were
more likely to have a family income below $20,000 and live in
a household with a family income/poverty threshold ratio
(family income divided by the poverty threshold from the U.S.
Census Bureau) of under 0.99.
Odds ratios and 95% confidence intervals for the relation-
ship between acculturation and cervical cancer screening are
presented in Table 2. Univariate analysis without adjustment
for potential confounders showed that acculturation level was
inversely correlated with no Pap smear for each defined
period. Similar results were found when adjusting for
demographic variables. When other factors in addition to
demographic variables were adjusted for, higher acculturated
women were less likely to never have had a Pap smear than
lower acculturated women (OR = 0.51; 95% CI, 0.29–0.89).
The other OR estimates included or were close to one when no
ates, 2000
Acculturation level
Moderate High Total
N % N % N %
470 60.57 465 68.28 1418 61.47
167 21.52 131 19.24 485 21.02
84 10.82 53 7.78 228 9.88
55 7.09 32 4.70 176 7.63
437 56.31 370 54.33 1364 59.12
26 3.35 17 2.50 93 4.03
150 19.33 136 19.97 405 17.56
161 20.75 156 22.91 438 18.99
2 0.26 2 0.29 7 0.30
302 38.92 129 18.94 1024 44.39
192 24.74 216 31.72 522 22.63
196 25.26 232 34.07 503 21.80
86 11.08 102 14.98 230 9.97
0 0.00 2 0.29 28 1.21
459 59.15 484 71.07 1320 57.22
284 36.60 173 25.40 871 37.75
33 4.25 24 3.53 116 5.03
169 21.78 97 14.24 515 22.32
193 24.87 125 18.36 560 24.27
119 15.34 118 17.33 323 14.00
55 7.09 74 10.87 153 6.63
39 5.03 56 8.22 108 4.68
201 25.90 211 30.98 648 28.09
lculations. Poverty thresholds are the dollar amounts used to determine poverty
hold ratio is the family income divided by the threshold with a lower value

Table 2
Odds ratios (95% confidence intervals) of having never had a pap smear, not having a pap smear within past 3 years and past year by acculturation level: United
States, 2000
Never had a Pap smeara No Pap smear within past 3 yearsa No Pap smear within past yeara
Number of
observations
OR (95% CI) P value
for trend
Number of
observations
OR (95% CI) P value
for trend
Number of
observations
OR (95% CI) P value
for trend
Univariate
Low acculturation 147 1.00 218 1.00 341 1.00
Moderate acculturation 106 0.70 (0.52–0.94) 163 0.64 (0.50–0.82) 330 0.80 (0.65–1.00)
High acculturation 46 0.24 (0.16–0.37) <0.001 96 0.36 (0.27–0.48) <0.001 241 0.58 (0.47–0.73) <0.001
Adjusted for sociodemographic factorsb
Low acculturation 147 1.00 218 1.00 341 1.00
Moderate acculturation 106 0.61 (0.43–0.86) 163 0.61 (0.46–0.81) 330 0.84 (0.67–1.06)
High acculturation 46 0.19 (0.12–0.31) <0.001 96 0.35 (0.25–0.49) <0.001 241 0.65 (0.50–0.84) 0.001
Adjusted for sociodemographic and other factorsc
Low acculturation 147 1.00 218 1.00 341 1.00
Moderate acculturation 106 0.86 (0.58–1.27) 163 0.83 (0.61–1.13) 330 1.12 (0.87–1.43)
High acculturation 46 0.51 (0.29–0.89) <0.001 96 0.73 (0.49–1.08) 0.104 241 1.07 (0.80–1.45) 0.648
a The total numbers of low, moderate, and highly acculturated women were 642, 758, and 664 when having never had a Pap smear was the outcome. The
corresponding numbers were 631, 757, and 662 when no Pap smear within the past 3 years or within the past year was the outcome.b Adjusted for age, marital status, family income, education, and ratio of family income to poverty threshold.c Adjusted for demographic variables, smoking status, alcohol consumption, amount of vigorous exercise a week, ever having the chicken pox, visiting a general
physician in the last 12 months, had the hepatitis B vaccine, ever donated blood, ever been tested for HIV, ever used birth control pills, ever given birth to a live baby,
ever heard of genetic testing for cancer, and personal thoughts on risk of getting cancer in the future.
M. Shah et al. / Preventive Medicine 42 (2006) 146–149148
Pap smear within the past 1 or 3 years was used as the
outcome.
Discussion
Our analyses unveiled differences in cervical cancer
screening patterns among the different acculturation levels
in Hispanic women. Lower acculturated women were less
likely to have had a Pap smear ever, in the past 3 years,
and in the past year. These results are consistent with those
from some previous studies that demonstrated a correlation
between acculturation and cancer screening in Hispanic
women (Suarez, 1994). Awareness and knowledge underlie
appropriate beliefs and attitudes toward cancer screening.
Language and cultural barriers in lower acculturated women
may prevent the establishment of appropriate beliefs, thus
relevant actions in seeking Pap smear tests cannot be taken
(Fernandez-Esquer et al., 2003).
Our analyses showed that acculturation seemed not related
to the use of Pap smear in the preceding year (the odds ratio
of Pap smear screening approached one) when adjusting for
all potential confounders. We tested the effects of these
factors on the odds ratio estimates by taking each of them out
of the model and found that having visited a general
physician in the same time period had the greatest effects
on the odds ratio estimates, the odds ratio of Pap smear
screening approached one when excluded. Visiting a doctor
might be highly related to the acculturation/Pap smear
association. In fact, a Pap smear may be recommended when
a woman visits her doctor. The under use of cervical
screening may partly result from a lower frequency of visiting
a doctor in Hispanic women.
There were several limitations to our study. The question-
naire was self-reported so the data obtained might not be
completely accurate. This may be particularly true for a study
on acculturation because people with different acculturation
levels have different language abilities and different compre-
hension of health-related questions. However, studies have
showed that there are yea-saying tendencies (when person
being surveyed responds affirmatively or agrees to please the
interviewer) in Hispanic people (Aday et al., 1980). This may
be more likely for less acculturated Hispanic individuals. If this
were true, the association identified in this study would be
diluted because cancer screening may be overestimated in this
group of people. The other potential limitation of this study is
the inability to distinguish Hispanic groups. Hispanic people
encompass diverse communities. These communities may vary
in language ability and culture, which may lead to different
understanding of health-related issues. If the distribution of the
communities varies according to acculturation levels in this
study, the results might have been influenced. We are unable to
assess this possibility because of lack of the information on
Hispanic origins.
In conclusion, our findings suggest that lower acculturated
women have barriers to using Pap smears. These results
reinforce the need to address acculturation for increasing
cervical cancer screening in the Hispanic population.
Acknowledgments
We would like to thank Dr. David Berrigan from the
Division of Cancer Control and Population Sciences National
Cancer Institute for his assistance on this study and Reena Shah
for her comments on the manuscript.

M. Shah et al. / Preventive Medicine 42 (2006) 146–149 149
References
Aday, L.A., Chiwu, G.Y., Anderson, R., 1980. Methodological issues in health
care surveys of the Spanish heritage population. Am. J. Public Health 70,
367–374.
Centers for Disease Control and Prevention (CDC), 2002. Invasive cervical
cancer among Hispanic and non-Hispanic womenaUnited States, 1992–
1999. Morb. Mortal. Wkly. Rep. 51 (47), 1067–1070.
Centers for Disease Control and Prevention, 2005. National Breast and Cervical
Cancer Early Detection Program-Reducing Mortality Through Screening.
National Center for Chronic Disease Prevention and Health Promotion,
Centers for Disease Control and Prevention [online], Atlanta (GA).
Available at: http://www.cdc.gov/cancer/nbccedp/index.htm. Accessed on
January 11, 2005.
Coughlin, S.S., Uhler, R.J., 2002. Breast and cervical cancer screening practices
among Hispanic women in the United States and Puerto Rico, 1998–1999.
Prev. Med. 34, 242–251.
Early detection of cervical cancer. CA Cancer J. Clin. 52, 375–376.
Fernandez-Esquer, M.E., Espinoza, P., Ramirez, A.G., McAlister, A.L., 2003.
Repeated Pap smear screening among Mexican–American women. Health
Educ. Res. 18 (4), 477–487.
Marin, G., Marin, B.V., 1991. Research with Hispanic populations. Sage
Publications, Newbury Park, CA.
National Center for Health Statistics, 2002. 2000 National Health Interview
Survey (NHIS) Public Use Data Release, NHIS Survey Description. Vol.
2001. Hyattsville, MD. Available at: ftp://ftp.cdc.gov/pub/Health_Statistics/
NCHS/Dataset_Documentation/NHIS/2000/srvydesc.pdf. Accessed Janu-
ary 11, 2005.
Solis, J.M., Marks, G., Garcia, M., Shelton, D., 1990. Acculturation, access to
care, and use of preventive services by Hispanics: finding from HHANES
1982–84. Am. J. Public Health 80, 11–19.
Suarez, L., 1994. Pap smear and mammogram screening in Mexican-
American women: the effects of acculturation. Am. J. Public Health 84,
742–746.