Embed Size (px)
Citation preview
Yerbilimleri, 2016, 37 (3), 271-284Hacettepe Üniversitesi Yerbilimleri Uygulama ve Araştırma Merkezi BülteniBulletin of the Earth Sciences Application and Research Centre of Hacettepe University
Analytic Notch Filter Design Using the Hyperbolic Secant Function
Hiperbolik Sekant Fonksiyonlar ile Analitik Çentik Süzgeç Tasarımı
ERTAN PEKŞEN 1*, FATİH SEVİM 2 1Kocaeli University, Faculty of Engineering, Department of Geophysical Engineering, İzmit, Kocaeli 2TÜBİTAK MAM Gebze, Kocaeli
Geliş (received) : 15 Şubat (February) 2016 Kabul (accepted) : 15 Ekim (October) 2016
ABSTRACTA notch filter can be analytically designed by using the hyperbolic secant function. This paper investigates notch filters in both
time and frequency domains. Generally, the purpose of a notch filter design is to filter some unwanted signal (usually interference
at 50 or 60 Hz) from observed data. In this study, the impulse response of a notch filter in the time domain was obtained by using
its frequency domain expression. A cascaded-notch filter was analytically designed as well. Numerical examples were conside-
red for a single notch filter and a cascaded-notch filter in the time and frequency domain. The frequency response and the im-
pulse response of proposed notch filter were derived. Finally, the new designed filter was successfully applied to a field data set.
Keywords: Cascaded Notch Filter, Hyperbolic Secant Function, Notch Filter, Seismograms.
ÖZHiperbolik sekant fonksiyonlar ile çentik süzgeç tasarlanabilir. Bu çalışmada zaman ve frekans ortamlarında çentik süzgeçler incelenmektedir. Genel olarak, çentik süzgeç tasarımının amacı ölçülen verilerden istenmeyen (genellikle 50 veya 60 Hz lik girişimler) kısımların süzülmesidir. Bu çalışmada zaman ortamındaki çentik süzgeç fonksiyonu, çentik süzgeç fonksiyonunun fre-kans ortamındaki ifadesinden türetilmiştir. Basamaklı çentik süzgeci de analitik olarak tasarlanmıştır. Sayısal örneklerde çentik ve basamaklı çentik süzgeçler zaman ve frekans ortamında dikkate alınmıştır. Önerilen çentik süzgecin birim dürtü ve frekans tepki bağıntıları türetilmiştir. Son olarak, yeni tasarlanan filtre başarılı bir şekilde arazi verisine uygulanmıştır.
Anahtar Kelimeler: Basamaklı Çentik Süzgeci , Hiperbolik Sekant Fonksiyon, Çentik Süzgeci, Sismogram.
*E. Pekşene-posta: [email protected]
INTRODUCTION
The design of a digital notch filter is important in geo-physics, electronics, biomedical sciences and other sciences. In geophysics, measured field data can be often contaminated by the frequency of power-line, therefore, the frequencies of power lines and from other sources need to be filtered out from the meas-ured field data to make the measured data contami-nated free – signals. An ideal notch filter is used in re-moving the power-line frequency from seismograms, or some other types of signals.
There have been numerous publications about fil-ter design in literature (e.g. Deshpande et al., 2008; Piskorowski, 2013; Stancic and Nikolic, 2013; Piskorowski, 2012). There are many filter designing options, for instance, a notch filter can be designed with z-Transform method (pole-zero placement method) (Cadzow, 1973), and hyperbolic tangent function can be used for designing various digital fil-ters (Johensen and Sorensen, 1979; Başokur, 1998; Başokur, 2011). A notch filter is not the only method use in filtering out a single harmonic from a data set, subtraction noise from signal can also be used for filtering purpose (Butler and Russell, 1993).
Since the power-line frequency is known e.g. 50 Hz or 60 Hz, these frequencies can be subtracted from geophysical records. However, the disadvantage of this method is that, the power-line frequency is not always at 50 Hz or 60 Hz. There are always some deviations of the mean value of the power-line fre-quency (Figure 1). To get rid of these sorts of sto-chastic noise from the corresponding data, adaptive filtering methods may be applied (Butler and Russell, 1993; Hattingh, 1988; Haykin, 1991).
The main aim of this work is to develop an analytic digital notch filter. This paper is organized in three sections as follows; the first section contains the derivation of an analytic expression for the notch filter and numerical examples of the notch filter. In the second part, demonstration of how this method can be applied to a cascaded-notch filter is shown. And in the final section, the presented notch filter was applied to a field data set.
DIGITAL NOTCH FILTER
Notch Filter Design
The behavior of the hyperbolic secant function is shown in Figure 2. To obtain an analytic expression
for a notch filter, the Fourier pairs of the hyperbolic secant function can be used. The Fourier pair of the hyperbolic secant function is given by Gradshteyn and Ryzhik (1994) as shown below;
Aşağıdaki denklemlerde c ve t veya f ve c üst üste binmiş. Denklemlerde herhangi bir değişiklik yapılmayıp sadece fc parametresinde c alt indis olarak düzeltilmiştir.
)(sec ) (sec)(2
fNc
fhc
tchtn
(1) (272. Sayfa)
cff
hcc
ffh
cfH cc )(
sec)(
sec)(22
(2) (272. Sayfa)
cff
hcc
ffh
ccfH cc )(
sec)(
sec)(22
(3) (272. Sayfa)
cc ffNffNAfH )( (4) (272. Sayfa)
) (sec)2cos(2)()( tchtftAth c (6) (272. Sayfa)
Sayfa 274 birinci sütundaki denklem 8 de c ve t arasına bir boşluk verildi. Aşağıdaki ile değiştirilmelidir.
ctchtftAtb cn sin) (sec)2cos(2)()( (8)
Sayfa 274 birinci sütundaki denklem 9 da c ve n delta t arasına bir boşluk verildi. Aşağıdaki ile değiştirilmelidir.
) (sec)2cos(12
)2sin()( tnchtnf
ftnftnf
Atnb cNN
Nn
(9)
(1)
where t is time (s) and f is a frequency (Hz). c is a con-stant, which mainly controls the slope of the function. Figure 2 displays the behavior of the hyperbolic se-cant function in the frequency domain for various c values. It could be observed that, increasing in the value of c, decreases the slope of the hyperbolic se-cant function. Thus, it is possible to choose an op-timum c for filtering out an unwanted signal from a given data and to control the band width. The lower panel of Figure 2 illustrates normalized amplitudes.
Using the Fourier pairs of Equation 1 and combining the hyperbolic secant functions gives
Aşağıdaki denklemlerde c ve t veya f ve c üst üste binmiş. Denklemlerde herhangi bir değişiklik yapılmayıp sadece fc parametresinde c alt indis olarak düzeltilmiştir.
)(sec ) (sec)(2
fNc
fhc
tchtn
(1) (272. Sayfa)
cff
hcc
ffh
cfH cc )(
sec)(
sec)(22
(2) (272. Sayfa)
cff
hcc
ffh
ccfH cc )(
sec)(
sec)(22
(3) (272. Sayfa)
cc ffNffNAfH )( (4) (272. Sayfa)
) (sec)2cos(2)()( tchtftAth c (6) (272. Sayfa)
Sayfa 274 birinci sütundaki denklem 8 de c ve t arasına bir boşluk verildi. Aşağıdaki ile değiştirilmelidir.
ctchtftAtb cn sin) (sec)2cos(2)()( (8)
Sayfa 274 birinci sütundaki denklem 9 da c ve n delta t arasına bir boşluk verildi. Aşağıdaki ile değiştirilmelidir.
) (sec)2cos(12
)2sin()( tnchtnf
ftnftnf
Atnb cNN
Nn
(9)
(2)
where cf is the cut-off frequency. If Equation 2 is subtracted from a constant, it yields
Aşağıdaki denklemlerde c ve t veya f ve c üst üste binmiş. Denklemlerde herhangi bir değişiklik yapılmayıp sadece fc parametresinde c alt indis olarak düzeltilmiştir.
)(sec ) (sec)(2
fNc
fhc
tchtn
(1) (272. Sayfa)
cff
hcc
ffh
cfH cc )(
sec)(
sec)(22
(2) (272. Sayfa)
cff
hcc
ffh
ccfH cc )(
sec)(
sec)(22
(3) (272. Sayfa)
cc ffNffNAfH )( (4) (272. Sayfa)
) (sec)2cos(2)()( tchtftAth c (6) (272. Sayfa)
Sayfa 274 birinci sütundaki denklem 8 de c ve t arasına bir boşluk verildi. Aşağıdaki ile değiştirilmelidir.
ctchtftAtb cn sin) (sec)2cos(2)()( (8)
Sayfa 274 birinci sütundaki denklem 9 da c ve n delta t arasına bir boşluk verildi. Aşağıdaki ile değiştirilmelidir.
) (sec)2cos(12
)2sin()( tnchtnf
ftnftnf
Atnb cNN
Nn
(9)
(3)
Equation 3 is the frequency response of the notch filter. Figure 3 demonstrates how the hyperbolic se-cant functions behave in the frequency domain. Fig-ure 3 (a) displays a constant value. Figure 3 (b) illus-trates the behaviors of the filter characteristic. Finally, the last panel of the Figure 3 (c) shows the behavior of a desired notch filter. As seen in Figure 3, the fre-quency response of the hyperbolic secant function notches the signal at the cut-off frequency, which is at 15 Hz. In this example, c is chosen as 5.
Equation 3 can be rewritten as
Aşağıdaki denklemlerde c ve t veya f ve c üst üste binmiş. Denklemlerde herhangi bir değişiklik yapılmayıp sadece fc parametresinde c alt indis olarak düzeltilmiştir.
)(sec ) (sec)(2
fNc
fhc
tchtn
(1) (272. Sayfa)
cff
hcc
ffh
cfH cc )(
sec)(
sec)(22
(2) (272. Sayfa)
cff
hcc
ffh
ccfH cc )(
sec)(
sec)(22
(3) (272. Sayfa)
cc ffNffNAfH )( (4) (272. Sayfa)
) (sec)2cos(2)()( tchtftAth c (6) (272. Sayfa)
Sayfa 274 birinci sütundaki denklem 8 de c ve t arasına bir boşluk verildi. Aşağıdaki ile değiştirilmelidir.
ctchtftAtb cn sin) (sec)2cos(2)()( (8)
Sayfa 274 birinci sütundaki denklem 9 da c ve n delta t arasına bir boşluk verildi. Aşağıdaki ile değiştirilmelidir.
) (sec)2cos(12
)2sin()( tnchtnf
ftnftnf
Atnb cNN
Nn
(9)
(4)
where cA π= . The shift theorem for the Fourier transform (Bracewell, 1965) may be used for deriving an expression for the notch filter. Thus, Equation 4 can then be written in the form
( ) ( ){ }tnetnetAth tfitfi cc ππδ 22)()( +−= − (5)
where )(tδ is the Dirac delta function. Consider )2sin()2cos(2 tfitfe cc
tfi c πππ ±=± then substi-
tute the Euler identity into Equation 5, results in
Pekşen ve Sevim / Yerbilimleri, 2016, 37 (3), 271-284272
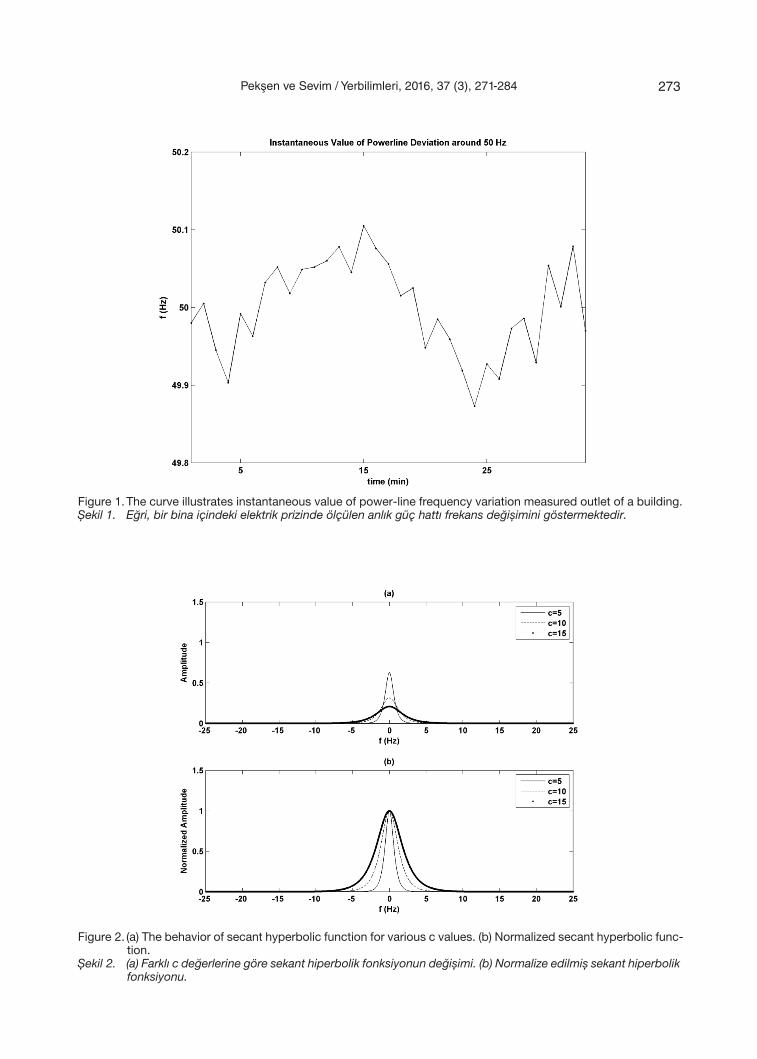
Figure 1. The curve illustrates instantaneous value of power-line frequency variation measured outlet of a building. Şekil 1. Eğri, bir bina içindeki elektrik prizinde ölçülen anlık güç hattı frekans değişimini göstermektedir.
Figure 2. (a) The behavior of secant hyperbolic function for various c values. (b) Normalized secant hyperbolic func-tion.
Şekil 2. (a) Farklı c değerlerine göre sekant hiperbolik fonksiyonun değişimi. (b) Normalize edilmiş sekant hiperbolik fonksiyonu.
Pekşen ve Sevim / Yerbilimleri, 2016, 37 (3), 271-284 273

Aşağıdaki denklemlerde c ve t veya f ve c üst üste binmiş. Denklemlerde herhangi bir değişiklik yapılmayıp sadece fc parametresinde c alt indis olarak düzeltilmiştir.
)(sec ) (sec)(2
fNc
fhc
tchtn
(1) (272. Sayfa)
cff
hcc
ffh
cfH cc )(
sec)(
sec)(22
(2) (272. Sayfa)
cff
hcc
ffh
ccfH cc )(
sec)(
sec)(22
(3) (272. Sayfa)
cc ffNffNAfH )( (4) (272. Sayfa)
) (sec)2cos(2)()( tchtftAth c (6) (272. Sayfa)
Sayfa 274 birinci sütundaki denklem 8 de c ve t arasına bir boşluk verildi. Aşağıdaki ile değiştirilmelidir.
ctchtftAtb cn sin) (sec)2cos(2)()( (8)
Sayfa 274 birinci sütundaki denklem 9 da c ve n delta t arasına bir boşluk verildi. Aşağıdaki ile değiştirilmelidir.
) (sec)2cos(12
)2sin()( tnchtnf
ftnftnf
Atnb cNN
Nn
(9)
(6)
Equation 6 is called the impulse response of the filter. To calculate notch filter coefficients, Equation 6 is convolved with a sin c function. Thus, the result can be written
cthtbn sin)()( ∗= (7)
where ∗ stands for the convolution process. Substi-tute Equation 6 into Equation 7 which yields
Aşağıdaki denklemlerde c ve t veya f ve c üst üste binmiş. Denklemlerde herhangi bir değişiklik yapılmayıp sadece fc parametresinde c alt indis olarak düzeltilmiştir.
)(sec ) (sec)(2
fNc
fhc
tchtn
(1) (272. Sayfa)
cff
hcc
ffh
cfH cc )(
sec)(
sec)(22
(2) (272. Sayfa)
cff
hcc
ffh
ccfH cc )(
sec)(
sec)(22
(3) (272. Sayfa)
cc ffNffNAfH )( (4) (272. Sayfa)
) (sec)2cos(2)()( tchtftAth c (6) (272. Sayfa)
Sayfa 274 birinci sütundaki denklem 8 de c ve t arasına bir boşluk verildi. Aşağıdaki ile değiştirilmelidir.
ctchtftAtb cn sin) (sec)2cos(2)()( (8)
Sayfa 274 birinci sütundaki denklem 9 da c ve n delta t arasına bir boşluk verildi. Aşağıdaki ile değiştirilmelidir.
) (sec)2cos(12
)2sin()( tnchtnf
ftnftnf
Atnb cNN
Nn
(9)
(8)
where the sinc function is given by
tftfc
N
Nπ
π2
)2sin(sin = . Finally, the filter coef-
ficients of a notch filter is calculated by using the fol-lowing expression
Aşağıdaki denklemlerde c ve t veya f ve c üst üste binmiş. Denklemlerde herhangi bir değişiklik yapılmayıp sadece fc parametresinde c alt indis olarak düzeltilmiştir.
)(sec ) (sec)(2
fNc
fhc
tchtn
(1) (272. Sayfa)
cff
hcc
ffh
cfH cc )(
sec)(
sec)(22
(2) (272. Sayfa)
cff
hcc
ffh
ccfH cc )(
sec)(
sec)(22
(3) (272. Sayfa)
cc ffNffNAfH )( (4) (272. Sayfa)
) (sec)2cos(2)()( tchtftAth c (6) (272. Sayfa)
Sayfa 274 birinci sütundaki denklem 8 de c ve t arasına bir boşluk verildi. Aşağıdaki ile değiştirilmelidir.
ctchtftAtb cn sin) (sec)2cos(2)()( (8)
Sayfa 274 birinci sütundaki denklem 9 da c ve n delta t arasına bir boşluk verildi. Aşağıdaki ile değiştirilmelidir.
) (sec)2cos(12
)2sin()( tnchtnf
ftnftnf
Atnb cNN
Nn
(9)
(9)
where Nf is the Nyquist frequency and cf is the cut-off frequency. t∆ is the time-step size with a
corresponding index number n. From Equation 9, one can calculate notch filter coefficients. Equation 9 has a singularity point at t=0. So it is evaluated by using the limit theorem (Abromowitz and Stegun,
1965). When
Sayfa 274 birinci sütunda 1)sin(lim
0
xx
x denklemi üst satıra bindiğinden bu
denklem 1)sin(lim
0
x
xx
şeklinde yazılırsa belki üst satıra gelmez.
Sayfa 275 te birinci sütundaki 12 ve 13. üncü denklemlerde c ve n delta t arasında boşluk konuldu. Aşağıdaki şekilde değiştirilirse denklemde c ve t üst üste gelmez.
) (sec)2cos()2cos(12
)2sin()( 21 tnchtnftnf
ftnftnf
AtnbNN
Ncas
(12)
) (sec)2cos(12
)2sin()(
1tnchtnf
ftnftnf
AtnbM
mm
NN
NG
(13)
) 10 cos(5.2)cos(5.1)( tttg (14)
) 30 cos() 10 cos(5.1) 5 cos(5.2)( ttttgcas (15)
Sayfa 276 Figure 5 ve Şekil 5 yazıları eksik. Aşağıdaki şekil yazısı şeklin altına eklenmelidir.
Figure 5. Relative errors of Hyperbolic secant function, Bartlett, Parzen, Tukey, and Kaiser windows.
Şekil 5. Hiperbolik sekant fonksiyonu, Bartlett, Parzen, Tukey, ve Kaiser pencerelerinin göreceli
hataları.
considered, the fol-
lowing expression is used for estimating b(0) filter
coefficient:
Nn f
Ab 1)0( −= (10)
The rest of the coefficients is calculated by using Equation 9, except at t=0 point.
Cascaded-Notch Filter Design
The method used in the previous section may be extended to cascaded-notch filter design. It is pos-sible to filter out a couple of harmonics from a data set rather than one specific frequency. Cascading helps in designing a filter for that kind of purpose. The idea of what have been done so far in the previ-ous section can be extended then in the design of a cascaded-filter.
Figure 3. (a) A constant value, (b) The behavior of the filter characteristic for 5=c , (c) The difference between constant and two secant hyperbolic functions which give an expression of a notch filter in the frequency domain.
Şekil 3. (a) Sabit değer, (b) c=5 için süzgeç karakteristiği değişimini, (c) Sabit bir değer ve iki sekant fonksiyonu arasındaki fark frekans ortamında çentik süzgeci fonksiyonunu vermektedir.
Pekşen ve Sevim / Yerbilimleri, 2016, 37 (3), 271-284274
Suppose that, data are contaminated with 1f and
2f frequencies. These frequencies need to be fil-tered out from the data. In this case, the frequency response can be derived as
)2(2
sec)2(2
sec
)1(2
sec)1(2
sec)(
−
+
+
+
−
+
+
−=
c
ffh
cc
ffh
c
c
ffh
cc
ffh
cAfH
ππππ
ππππ (11)
where c
A π= . An expression of the filter coefficient
is obtained by using the same process as in the pre-vious section. After a straightforward derivation, the filter coefficients are calculated by
Sayfa 274 birinci sütunda 1)sin(lim
0
xx
x denklemi üst satıra bindiğinden bu
denklem 1)sin(lim
0
x
xx
şeklinde yazılırsa belki üst satıra gelmez.
Sayfa 275 te birinci sütundaki 12 ve 13. üncü denklemlerde c ve n delta t arasında boşluk konuldu. Aşağıdaki şekilde değiştirilirse denklemde c ve t üst üste gelmez.
) (sec)2cos()2cos(12
)2sin()( 21 tnchtnftnf
ftnftnf
AtnbNN
Ncas
(12)
) (sec)2cos(12
)2sin()(
1tnchtnf
ftnftnf
AtnbM
mm
NN
NG
(13)
) 10 cos(5.2)cos(5.1)( tttg (14)
) 30 cos() 10 cos(5.1) 5 cos(5.2)( ttttgcas (15)
Sayfa 276 Figure 5 ve Şekil 5 yazıları eksik. Aşağıdaki şekil yazısı şeklin altına eklenmelidir.
Figure 5. Relative errors of Hyperbolic secant function, Bartlett, Parzen, Tukey, and Kaiser windows.
Şekil 5. Hiperbolik sekant fonksiyonu, Bartlett, Parzen, Tukey, ve Kaiser pencerelerinin göreceli
hataları.
(12)
Equation 12 can be written in a more general case. Thus, a general expression for cascaded-notch filter can be
Sayfa 274 birinci sütunda 1)sin(lim
0
xx
x denklemi üst satıra bindiğinden bu
denklem 1)sin(lim
0
x
xx
şeklinde yazılırsa belki üst satıra gelmez.
Sayfa 275 te birinci sütundaki 12 ve 13. üncü denklemlerde c ve n delta t arasında boşluk konuldu. Aşağıdaki şekilde değiştirilirse denklemde c ve t üst üste gelmez.
) (sec)2cos()2cos(12
)2sin()( 21 tnchtnftnf
ftnftnf
AtnbNN
Ncas
(12)
) (sec)2cos(12
)2sin()(
1tnchtnf
ftnftnf
AtnbM
mm
NN
NG
(13)
) 10 cos(5.2)cos(5.1)( tttg (14)
) 30 cos() 10 cos(5.1) 5 cos(5.2)( ttttgcas (15)
Sayfa 276 Figure 5 ve Şekil 5 yazıları eksik. Aşağıdaki şekil yazısı şeklin altına eklenmelidir.
Figure 5. Relative errors of Hyperbolic secant function, Bartlett, Parzen, Tukey, and Kaiser windows.
Şekil 5. Hiperbolik sekant fonksiyonu, Bartlett, Parzen, Tukey, ve Kaiser pencerelerinin göreceli
hataları.
(13)
where m is an index number and M is a number of frequencies which needs to be eliminated from the corresponding signal.
Comparison of Some Common Windows
In signal processing, windowing is used for filter de-sign and reducing the spectral leakage from a sig-nal. The main purpose of using windows for the filter design is to increase the main-lobe and reducing the side-lobe effects of a signal (Hayes, 1999). Here, the comparison was conducted the results obtained with some common windows in signal processing such as Bartlett, Parzen, Tukey, and Kaiser. Figure 4 shows the filter coefficient calculated using these windows. One can see that the filter coefficients il-lustrated in Figure 4 are very close to each other’s. To distinguish the differences between these results, the relative errors are shown in Figure 5. From these numerical calculations, it can be figured out that the signal filtered using Tukey and Kaiser windows gave better results based on the relative errors. The for-mulas used in this study for Bartlett, Parzen, Tukey, and Kaiser windows are given in Appendix.
In general, the signal is multiplied by some windows before Fourier transform to reduce the spectral leak-age. The spectral leakage occurs, since the signal is measured some internal without knowing the exact
period of events (Ertürk, 2009). Figure 6 illustrates effects of windows on the signal. From these numeri-cal experiments, it is easy to see that the Tukey and Kaiser windows reduce the spectral leakage effect significantly. However, Bartlett and Parzen windows cannot reduce the spectral leakage successfully.
NUMERICAL EXAMPLES
Time domain
The applicability of the notch filter was tested by using a simple numerical example. Figure 7 (a) illus-trates the signal. The signal consists of two harmon-ics at 0.5 and 5 Hz frequencies. The synthetic data in Figure 7 (a) is generated by
Sayfa 274 birinci sütunda 1)sin(lim
0
xx
x denklemi üst satıra bindiğinden bu
denklem 1)sin(lim
0
x
xx
şeklinde yazılırsa belki üst satıra gelmez.
Sayfa 275 te birinci sütundaki 12 ve 13. üncü denklemlerde c ve n delta t arasında boşluk konuldu. Aşağıdaki şekilde değiştirilirse denklemde c ve t üst üste gelmez.
) (sec)2cos()2cos(12
)2sin()( 21 tnchtnftnf
ftnftnf
AtnbNN
Ncas
(12)
) (sec)2cos(12
)2sin()(
1tnchtnf
ftnftnf
AtnbM
mm
NN
NG
(13)
) 10 cos(5.2)cos(5.1)( tttg (14)
) 30 cos() 10 cos(5.1) 5 cos(5.2)( ttttgcas (15)
Sayfa 276 Figure 5 ve Şekil 5 yazıları eksik. Aşağıdaki şekil yazısı şeklin altına eklenmelidir.
Figure 5. Relative errors of Hyperbolic secant function, Bartlett, Parzen, Tukey, and Kaiser windows.
Şekil 5. Hiperbolik sekant fonksiyonu, Bartlett, Parzen, Tukey, ve Kaiser pencerelerinin göreceli
hataları.
(14)
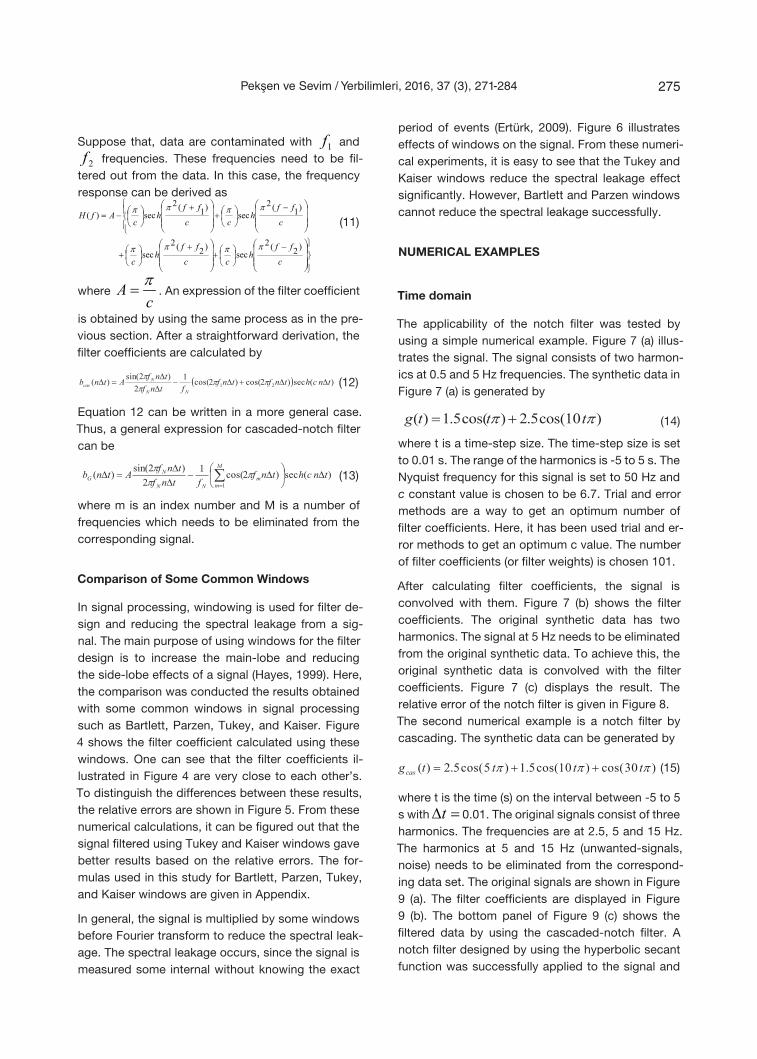
where t is a time-step size. The time-step size is set to 0.01 s. The range of the harmonics is -5 to 5 s. The Nyquist frequency for this signal is set to 50 Hz and c constant value is chosen to be 6.7. Trial and error methods are a way to get an optimum number of filter coefficients. Here, it has been used trial and er-ror methods to get an optimum c value. The number of filter coefficients (or filter weights) is chosen 101.
After calculating filter coefficients, the signal is convolved with them. Figure 7 (b) shows the filter coefficients. The original synthetic data has two harmonics. The signal at 5 Hz needs to be eliminated from the original synthetic data. To achieve this, the original synthetic data is convolved with the filter coefficients. Figure 7 (c) displays the result. The relative error of the notch filter is given in Figure 8.The second numerical example is a notch filter by cascading. The synthetic data can be generated by
Sayfa 274 birinci sütunda 1)sin(lim
0
xx
x denklemi üst satıra bindiğinden bu
denklem 1)sin(lim
0
x
xx
şeklinde yazılırsa belki üst satıra gelmez.
Sayfa 275 te birinci sütundaki 12 ve 13. üncü denklemlerde c ve n delta t arasında boşluk konuldu. Aşağıdaki şekilde değiştirilirse denklemde c ve t üst üste gelmez.
) (sec)2cos()2cos(12
)2sin()( 21 tnchtnftnf
ftnftnf
AtnbNN
Ncas
(12)
) (sec)2cos(12
)2sin()(
1tnchtnf
ftnftnf
AtnbM
mm
NN
NG
(13)
) 10 cos(5.2)cos(5.1)( tttg (14)
) 30 cos() 10 cos(5.1) 5 cos(5.2)( ttttgcas (15)
Sayfa 276 Figure 5 ve Şekil 5 yazıları eksik. Aşağıdaki şekil yazısı şeklin altına eklenmelidir.
Figure 5. Relative errors of Hyperbolic secant function, Bartlett, Parzen, Tukey, and Kaiser windows.
Şekil 5. Hiperbolik sekant fonksiyonu, Bartlett, Parzen, Tukey, ve Kaiser pencerelerinin göreceli
hataları.
(15)
where t is the time (s) on the interval between -5 to 5 s with 01.0=∆t 0.01. The original signals consist of three harmonics. The frequencies are at 2.5, 5 and 15 Hz. The harmonics at 5 and 15 Hz (unwanted-signals, noise) needs to be eliminated from the correspond-ing data set. The original signals are shown in Figure 9 (a). The filter coefficients are displayed in Figure 9 (b). The bottom panel of Figure 9 (c) shows the filtered data by using the cascaded-notch filter. A notch filter designed by using the hyperbolic secant function was successfully applied to the signal and
Pekşen ve Sevim / Yerbilimleri, 2016, 37 (3), 271-284 275
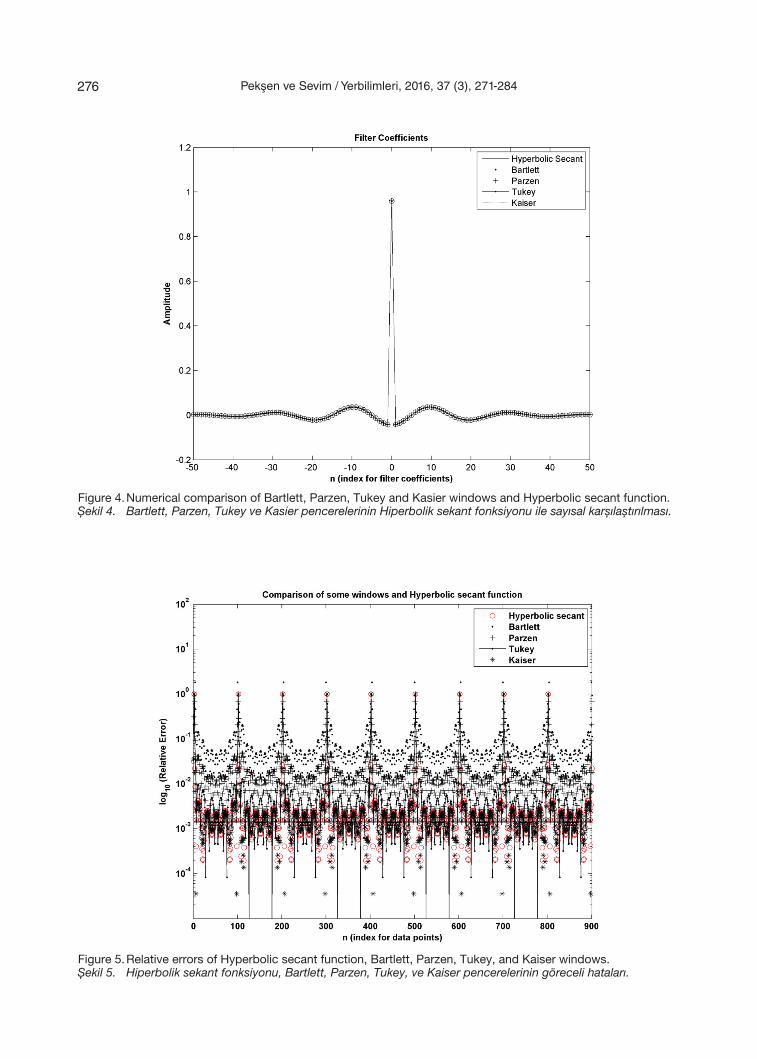
Figure 4. Numerical comparison of Bartlett, Parzen, Tukey and Kasier windows and Hyperbolic secant function. Şekil 4. Bartlett, Parzen, Tukey ve Kasier pencerelerinin Hiperbolik sekant fonksiyonu ile sayısal karşılaştırılması.
Figure 5. Relative errors of Hyperbolic secant function, Bartlett, Parzen, Tukey, and Kaiser windows. Şekil 5. Hiperbolik sekant fonksiyonu, Bartlett, Parzen, Tukey, ve Kaiser pencerelerinin göreceli hataları.
Pekşen ve Sevim / Yerbilimleri, 2016, 37 (3), 271-284276
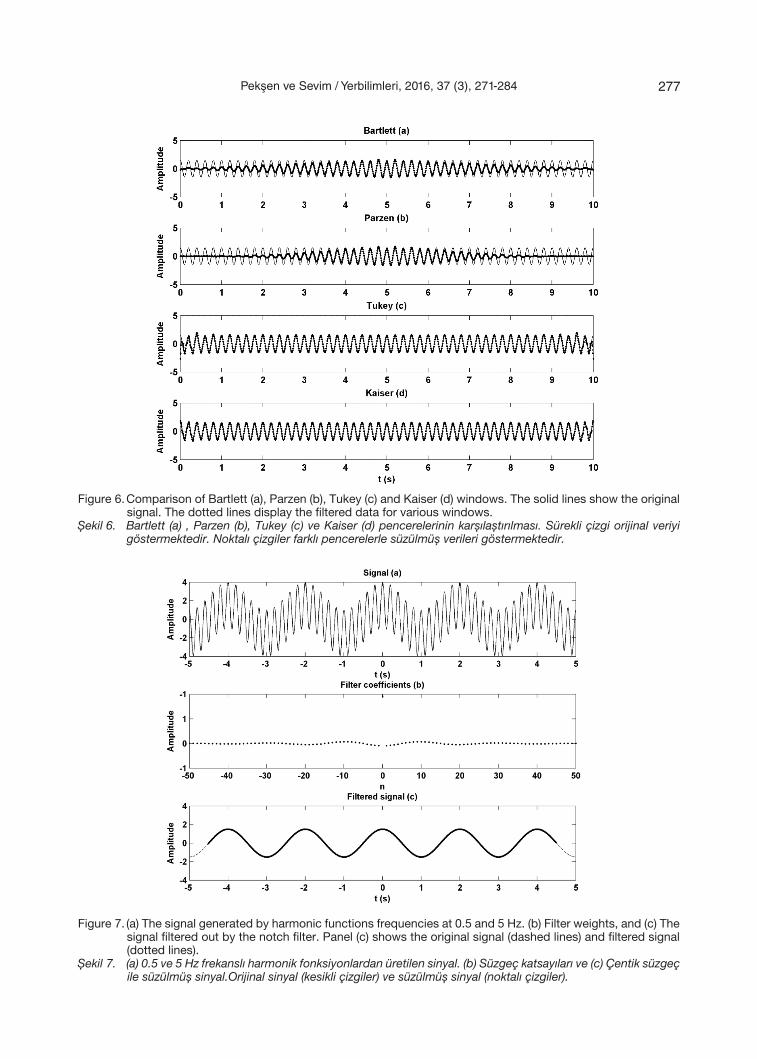
Figure 6. Comparison of Bartlett (a), Parzen (b), Tukey (c) and Kaiser (d) windows. The solid lines show the original signal. The dotted lines display the filtered data for various windows.
Şekil 6. Bartlett (a) , Parzen (b), Tukey (c) ve Kaiser (d) pencerelerinin karşılaştırılması. Sürekli çizgi orijinal veriyi göstermektedir. Noktalı çizgiler farklı pencerelerle süzülmüş verileri göstermektedir.
Figure 7. (a) The signal generated by harmonic functions frequencies at 0.5 and 5 Hz. (b) Filter weights, and (c) The signal filtered out by the notch filter. Panel (c) shows the original signal (dashed lines) and filtered signal (dotted lines).
Şekil 7. (a) 0.5 ve 5 Hz frekanslı harmonik fonksiyonlardan üretilen sinyal. (b) Süzgeç katsayıları ve (c) Çentik süzgeç ile süzülmüş sinyal.Orijinal sinyal (kesikli çizgiler) ve süzülmüş sinyal (noktalı çizgiler).
Sayfa 277 de şekil yanlış. Aşağıdaki şekil konulmalıdır.
Sayfa 279 daki denklemin doğrusu (16)
)15(21)15(
21
)5(25.1)5(
25.1)5.2(
25.2)5.2(
25.2)(
ff
fffffG
(16)
Pekşen ve Sevim / Yerbilimleri, 2016, 37 (3), 271-284 277

Figure 8. The relative errors of the notch filter. Şekil 8. Çentik süzgecin göreceli hatası.
Figure 9. A notch filter applied of a signal is shown. (a) The signal generated by harmonic functions at 2.5, 5, and 15 Hz. (b) Filter weights is shown in the middle panel, and (c) The signal can be filtered out by the notch filter. Panel (c) shows the original signal (dashed lines) and filtered signal (dotted lines).
Şekil 9. Çentik süzgeç uygulanmış bir sinyal gösterilmektedir (a) 2.5, 5 ve 15 Hz frekanslı harmonik fonksiyonlardan üretilen sinyal (b) Filtre katsayıları orta panelde gösterilmektedir. Sinyal çentik süzgeç ile süzülebilir. (c) Orijinal sinyal (kesikli çizgiler) ve süzülmüş sinyal (noktalı çizgiler).
Pekşen ve Sevim / Yerbilimleri, 2016, 37 (3), 271-284278
the signal was filtered out two frequencies from the data.
Comparison of band-stop and notch filters
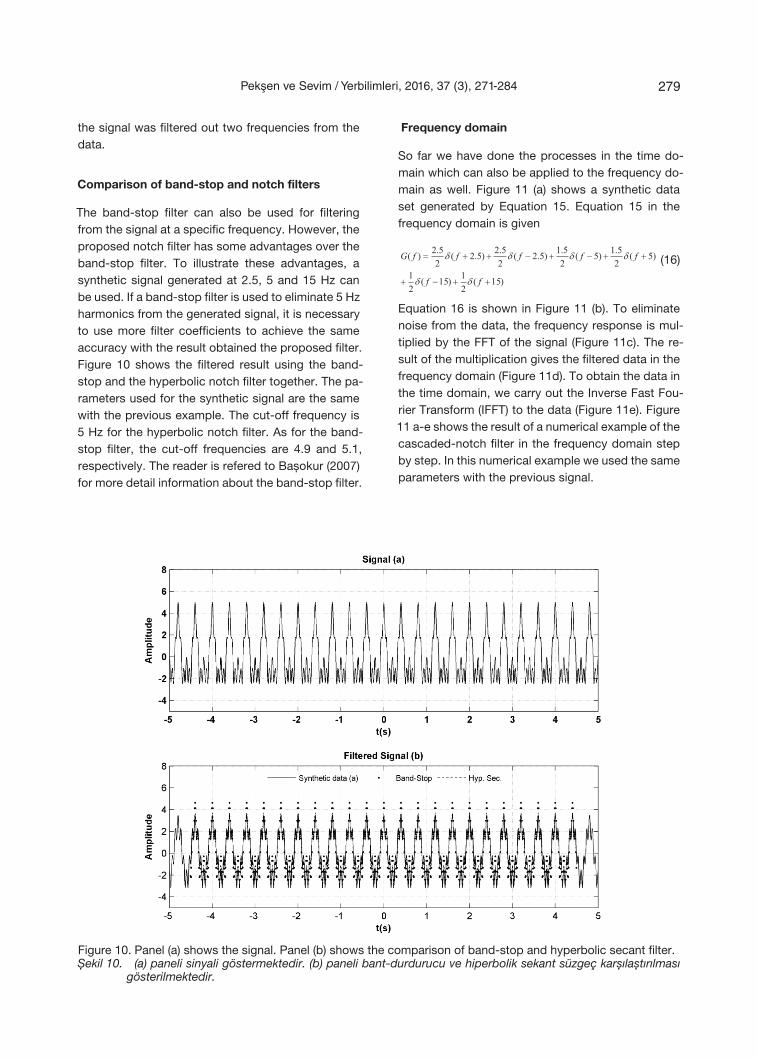
The band-stop filter can also be used for filtering from the signal at a specific frequency. However, the proposed notch filter has some advantages over the band-stop filter. To illustrate these advantages, a synthetic signal generated at 2.5, 5 and 15 Hz can be used. If a band-stop filter is used to eliminate 5 Hz harmonics from the generated signal, it is necessary to use more filter coefficients to achieve the same accuracy with the result obtained the proposed filter. Figure 10 shows the filtered result using the band-stop and the hyperbolic notch filter together. The pa-rameters used for the synthetic signal are the same with the previous example. The cut-off frequency is 5 Hz for the hyperbolic notch filter. As for the band-stop filter, the cut-off frequencies are 4.9 and 5.1, respectively. The reader is refered to Başokur (2007) for more detail information about the band-stop filter.
Frequency domain
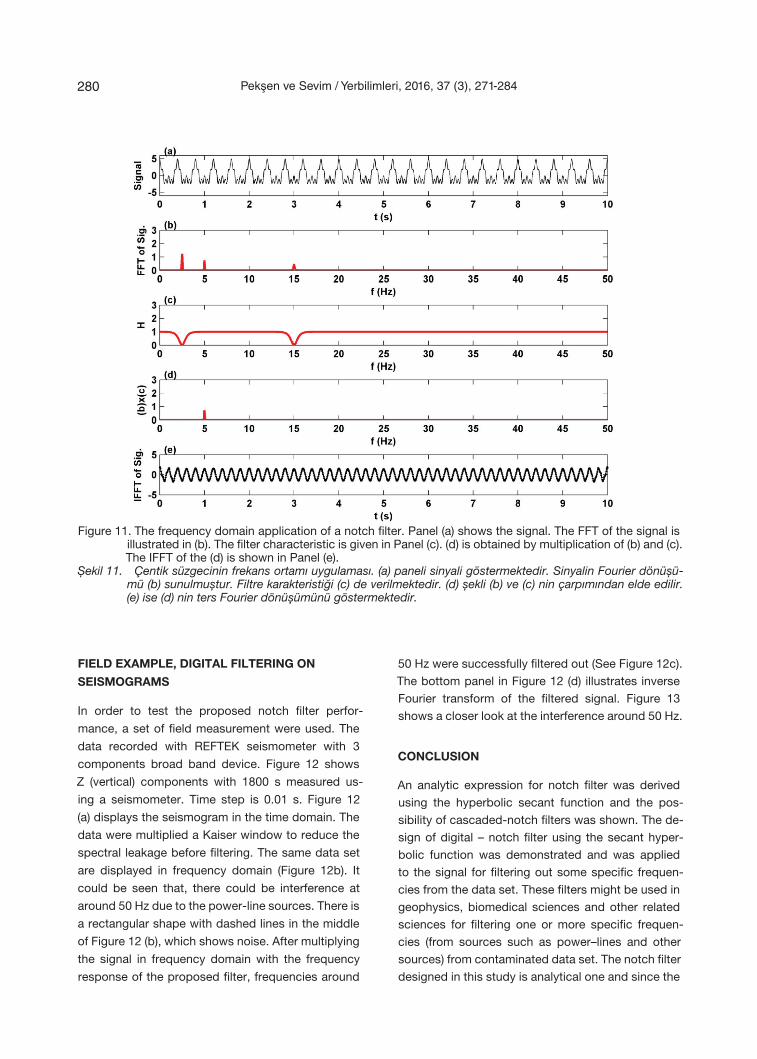
So far we have done the processes in the time do-main which can also be applied to the frequency do-main as well. Figure 11 (a) shows a synthetic data set generated by Equation 15. Equation 15 in the frequency domain is given
Sayfa 277 de şekil yanlış. Aşağıdaki şekil konulmalıdır.
Sayfa 279 daki denklemin doğrusu (16)
)15(21)15(
21
)5(25.1)5(
25.1)5.2(
25.2)5.2(
25.2)(
ff
fffffG
(16)
(16)
Equation 16 is shown in Figure 11 (b). To eliminate noise from the data, the frequency response is mul-tiplied by the FFT of the signal (Figure 11c). The re-sult of the multiplication gives the filtered data in the frequency domain (Figure 11d). To obtain the data in the time domain, we carry out the Inverse Fast Fou-rier Transform (IFFT) to the data (Figure 11e). Figure 11 a-e shows the result of a numerical example of the cascaded-notch filter in the frequency domain step by step. In this numerical example we used the same parameters with the previous signal.
Figure 10. Panel (a) shows the signal. Panel (b) shows the comparison of band-stop and hyperbolic secant filter. Şekil 10. (a) paneli sinyali göstermektedir. (b) paneli bant-durdurucu ve hiperbolik sekant süzgeç karşılaştırılması
gösterilmektedir.
Pekşen ve Sevim / Yerbilimleri, 2016, 37 (3), 271-284 279
FIELD EXAMPLE, DIGITAL FILTERING ON
SEISMOGRAMS
In order to test the proposed notch filter perfor-
mance, a set of field measurement were used. The
data recorded with REFTEK seismometer with 3
components broad band device. Figure 12 shows
Z (vertical) components with 1800 s measured us-
ing a seismometer. Time step is 0.01 s. Figure 12
(a) displays the seismogram in the time domain. The
data were multiplied a Kaiser window to reduce the
spectral leakage before filtering. The same data set
are displayed in frequency domain (Figure 12b). It
could be seen that, there could be interference at
around 50 Hz due to the power-line sources. There is
a rectangular shape with dashed lines in the middle
of Figure 12 (b), which shows noise. After multiplying
the signal in frequency domain with the frequency
response of the proposed filter, frequencies around
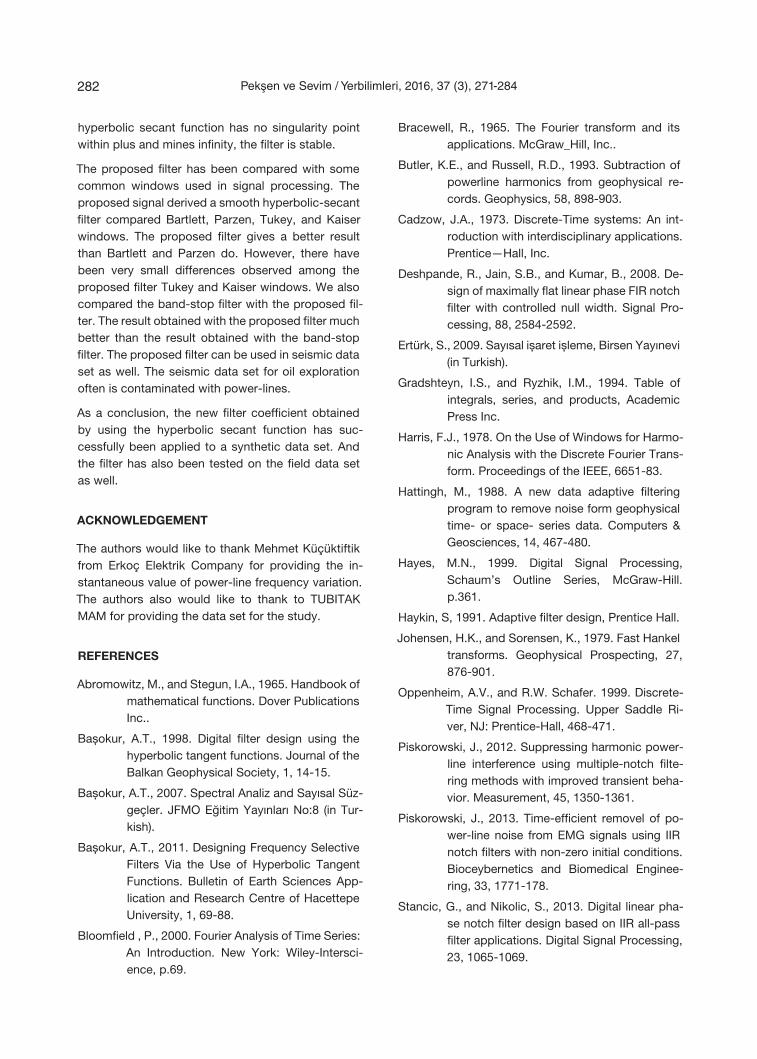
50 Hz were successfully filtered out (See Figure 12c). The bottom panel in Figure 12 (d) illustrates inverse Fourier transform of the filtered signal. Figure 13 shows a closer look at the interference around 50 Hz.
CONCLUSION
An analytic expression for notch filter was derived using the hyperbolic secant function and the pos-sibility of cascaded-notch filters was shown. The de-sign of digital – notch filter using the secant hyper-bolic function was demonstrated and was applied to the signal for filtering out some specific frequen-cies from the data set. These filters might be used in geophysics, biomedical sciences and other related sciences for filtering one or more specific frequen-cies (from sources such as power–lines and other sources) from contaminated data set. The notch filter designed in this study is analytical one and since the
Figure 11. The frequency domain application of a notch filter. Panel (a) shows the signal. The FFT of the signal is illustrated in (b). The filter characteristic is given in Panel (c). (d) is obtained by multiplication of (b) and (c). The IFFT of the (d) is shown in Panel (e).
Şekil 11. Çentik süzgecinin frekans ortamı uygulaması. (a) paneli sinyali göstermektedir. Sinyalin Fourier dönüşü-mü (b) sunulmuştur. Filtre karakteristiği (c) de verilmektedir. (d) şekli (b) ve (c) nin çarpımından elde edilir. (e) ise (d) nin ters Fourier dönüşümünü göstermektedir.
Pekşen ve Sevim / Yerbilimleri, 2016, 37 (3), 271-284280
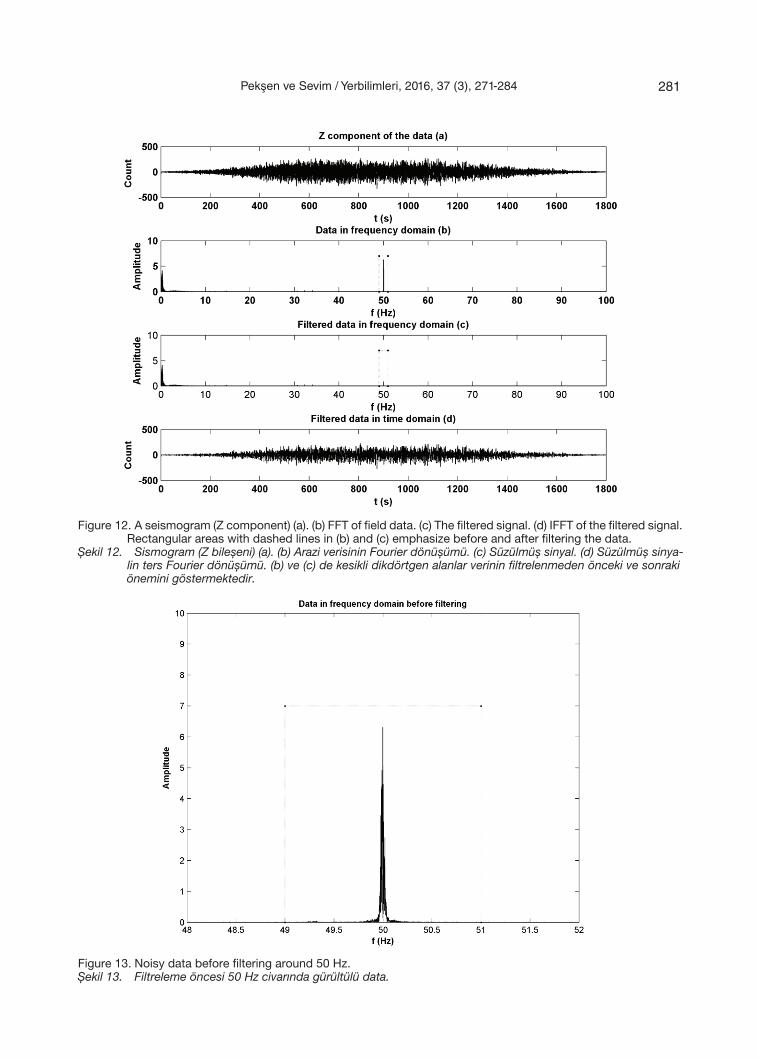
Figure 12. A seismogram (Z component) (a). (b) FFT of field data. (c) The filtered signal. (d) IFFT of the filtered signal. Rectangular areas with dashed lines in (b) and (c) emphasize before and after filtering the data.
Şekil 12. Sismogram (Z bileşeni) (a). (b) Arazi verisinin Fourier dönüşümü. (c) Süzülmüş sinyal. (d) Süzülmüş sinya-lin ters Fourier dönüşümü. (b) ve (c) de kesikli dikdörtgen alanlar verinin filtrelenmeden önceki ve sonraki önemini göstermektedir.
Figure 13. Noisy data before filtering around 50 Hz. Şekil 13. Filtreleme öncesi 50 Hz civarında gürültülü data.
Pekşen ve Sevim / Yerbilimleri, 2016, 37 (3), 271-284 281
hyperbolic secant function has no singularity point within plus and mines infinity, the filter is stable.
The proposed filter has been compared with some common windows used in signal processing. The proposed signal derived a smooth hyperbolic-secant filter compared Bartlett, Parzen, Tukey, and Kaiser windows. The proposed filter gives a better result than Bartlett and Parzen do. However, there have been very small differences observed among the proposed filter Tukey and Kaiser windows. We also compared the band-stop filter with the proposed fil-ter. The result obtained with the proposed filter much better than the result obtained with the band-stop filter. The proposed filter can be used in seismic data set as well. The seismic data set for oil exploration often is contaminated with power-lines.
As a conclusion, the new filter coefficient obtained by using the hyperbolic secant function has suc-cessfully been applied to a synthetic data set. And the filter has also been tested on the field data set as well.
ACKNOWLEDGEMENT
The authors would like to thank Mehmet Küçüktiftik from Erkoç Elektrik Company for providing the in-stantaneous value of power-line frequency variation. The authors also would like to thank to TUBITAK MAM for providing the data set for the study.
REFERENCES
Abromowitz, M., and Stegun, I.A., 1965. Handbook of mathematical functions. Dover Publications Inc..
Başokur, A.T., 1998. Digital filter design using the hyperbolic tangent functions. Journal of the Balkan Geophysical Society, 1, 14-15.
Başokur, A.T., 2007. Spectral Analiz and Sayısal Süz-geçler. JFMO Eğitim Yayınları No:8 (in Tur-kish).
Başokur, A.T., 2011. Designing Frequency Selective Filters Via the Use of Hyperbolic Tangent Functions. Bulletin of Earth Sciences App-lication and Research Centre of Hacettepe University, 1, 69-88.
Bloomfield , P., 2000. Fourier Analysis of Time Series: An Introduction. New York: Wiley-Intersci-ence, p.69.
Bracewell, R., 1965. The Fourier transform and its applications. McGraw_Hill, Inc..
Butler, K.E., and Russell, R.D., 1993. Subtraction of powerline harmonics from geophysical re-cords. Geophysics, 58, 898-903.
Cadzow, J.A., 1973. Discrete-Time systems: An int-roduction with interdisciplinary applications. Prentice—Hall, Inc.
Deshpande, R., Jain, S.B., and Kumar, B., 2008. De-sign of maximally flat linear phase FIR notch filter with controlled null width. Signal Pro-cessing, 88, 2584-2592.
Ertürk, S., 2009. Sayısal işaret işleme, Birsen Yayınevi (in Turkish).
Gradshteyn, I.S., and Ryzhik, I.M., 1994. Table of integrals, series, and products, Academic Press Inc.
Harris, F.J., 1978. On the Use of Windows for Harmo-nic Analysis with the Discrete Fourier Trans-form. Proceedings of the IEEE, 6651-83.
Hattingh, M., 1988. A new data adaptive filtering program to remove noise form geophysical time- or space- series data. Computers & Geosciences, 14, 467-480.
Hayes, M.N., 1999. Digital Signal Processing, Schaum’s Outline Series, McGraw-Hill. p.361.
Haykin, S, 1991. Adaptive filter design, Prentice Hall.
Johensen, H.K., and Sorensen, K., 1979. Fast Hankel transforms. Geophysical Prospecting, 27, 876-901.
Oppenheim, A.V., and R.W. Schafer. 1999. Discrete-Time Signal Processing. Upper Saddle Ri-ver, NJ: Prentice-Hall, 468-471.
Piskorowski, J., 2012. Suppressing harmonic power-line interference using multiple-notch filte-ring methods with improved transient beha-vior. Measurement, 45, 1350-1361.
Piskorowski, J., 2013. Time-efficient removel of po-wer-line noise from EMG signals using IIR notch filters with non-zero initial conditions. Bioceybernetics and Biomedical Enginee-ring, 33, 1771-178.
Stancic, G., and Nikolic, S., 2013. Digital linear pha-se notch filter design based on IIR all-pass filter applications. Digital Signal Processing, 23, 1065-1069.
Pekşen ve Sevim / Yerbilimleri, 2016, 37 (3), 271-284282
APPENDIX
Some Common Windows
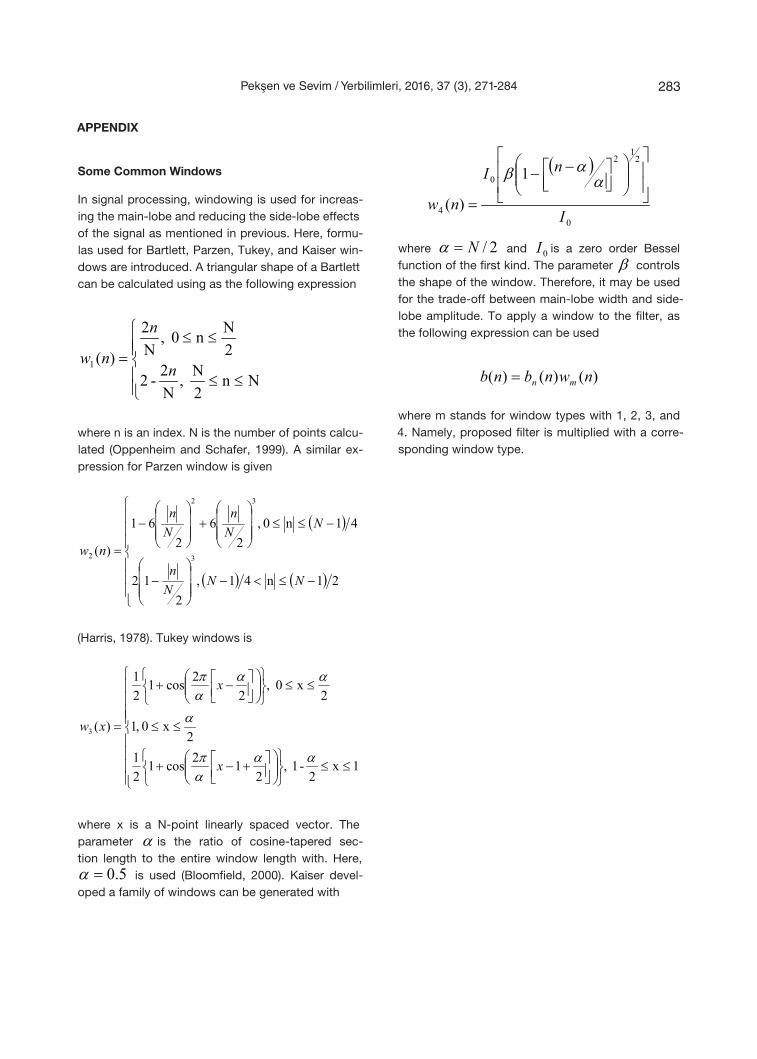
In signal processing, windowing is used for increas-ing the main-lobe and reducing the side-lobe effects of the signal as mentioned in previous. Here, formu-las used for Bartlett, Parzen, Tukey, and Kaiser win-dows are introduced. A triangular shape of a Bartlett can be calculated using as the following expression
≤≤
≤≤=
Nn2N ,
N2-2
2Nn0 ,
N2
)(1 n
n
nw
where n is an index. N is the number of points calcu-lated (Oppenheim and Schafer, 1999). A similar ex-pression for Parzen window is given
( )
( ) ( )
−≤<−
−
−≤≤
+
−
=
21n41 ,2
12
41n0 ,2
62
61
)(3
32
2
NNNn
NNn
Nn
nw
(Harris, 1978). Tukey windows is
≤≤
+−+
≤≤
≤≤
−+
=
1x2
-1 ,2
12cos121
2x0 ,1
2x0 ,
22cos1
21
)(3
αααπ
α
αααπ
x
x
xw
where x is a N-point linearly spaced vector. The parameter α is the ratio of cosine-tapered sec-tion length to the entire window length with. Here,
5.0=α is used (Bloomfield, 2000). Kaiser devel-oped a family of windows can be generated with
( )
0
21
2
0
4
1
)(I
nI
nw
−−
=α
αβ
where 2/N=α and 0I is a zero order Bessel function of the first kind. The parameter β controls the shape of the window. Therefore, it may be used for the trade-off between main-lobe width and side-lobe amplitude. To apply a window to the filter, as the following expression can be used
)()()( nwnbnb mn=
where m stands for window types with 1, 2, 3, and 4. Namely, proposed filter is multiplied with a corre-sponding window type.
Pekşen ve Sevim / Yerbilimleri, 2016, 37 (3), 271-284 283