Embed Size (px)
Citation preview
HIGHWAY R E S E A R C H B O A R D
Bulletin 100
Soit Freezing
RESEARCH
National Academy of Sciences-
National Research
HIGHWAY R E S E A R C H BOARD Officers and Members of the Executive Committee
1955
OFFICERS
G . DONALD KENNEDY, Chairman K . B . WOODS, Vice Chairman
FRED BURGGRAF, Director E L M E R M . WARD, Assistant Director
Executive Committee
C. D. CuRTiss, Commissioner, Bureau of Public Roads
A . E . JOHNSON, Executive Secretary, American Association of State Highway Officials
L O U I S JORDAN, Executive Secretary, Division of Engineering and Industrial Research, National Research Council
R . H . BALDOCK, State Highway Engineer, Oregon State Highway Commission
P Y K E JOHNSON, Consultant, Automotive Safety Foundation
G . DONALD K E N N E D Y , President, Portland Cement Association
O. L . Kipp, Assistant Commissioner and Chief Engineer, Minnesota Department of Highways
BURTON W . MARSH, Director, Safety and Traffic Engineering Department, American Automobile Association
C. H. ScHOLER, Head, Applied Mechanics Department, Kansas State College
R E X M . WHITTON, Chief Engineer, Missouri State Highway Department
K. B . WOODS, Director, Joint Highway Research Project, Purdue University
Editorial Staff
FRED BURGGRAF E L M E R M . WARD W A L T E R J . M I L L E R
2101 Constitution Avenue Washington 25, D . C.
The opinions and conclusions expressed m this publication are those of the authors and not necessarily those of the Highway Resi?aich Boaid.
HIGHWAY R E S E A R C H BOARD
Bulletin 100
Soil Freezing P R E S E N T E D AT T H E
Thirty-Third Annual Meeting January 12-15, 1954
1955 Washington, D. C.
Department of Soils
Frank R. Olmstead, Chairman Chief, Soils Section, Bureau of Public Roads,
U . S. Department of Commerce
COMMITTEE ON FROST HEAVE AND FROST ACTION IN SOIL
George W. McAlpin, J r . , Chairman Director, Bureau of Soil Mechanics,
New York Department of Public Works
Charles W. Allen, Research Engineer, Ohio Department of High\ways
Ear l F. Bennett, c/o Koppers Company, Tar Products Division, Koppers Building, Pittsburgh
C. B. Crawford, Soil Mechanics Section, Division of Building Research, National Research Council, Ottawa, Canada
El l i s Danner, Professor of Highway Engineering, University of I l l inois
L . E. Gregg, Associate Director of Research, Highway Materials Laboratory, Lexington, Kentucky
Frank B. Hennion, Off ice, Chief of Engineers, Department of the Army
D r . Miles S. Kersten, Professor, University of Minnesota
O. L . Lund, Assistant Materials Engineer, Nebraska Department of Roads and I r r iga t ion , Nebraska
A. E. Mattews, Engineer of Soils, Testing & Research Division, Michigan State Highway Department
Lloyd H . Morgan, Supervising Highway Engineer, Washington Department of Highways
Paul Otis, Materials and Research Engineer, New Hampshire Department of Public Works & Highways
Andrew W. Potter, Materials Engineer, South Dakota Highway Commission
James R. Schuyler, Assistant Dis t r ic t Engineer, Soils and Subdramage Section, New Jersey State HighAvay Department
H . R. Smith, Solvay Process Division, Al l ied Chemical and Dye Corporation
J . H. Swanberg, Engineer of Materials and Research, 'Engineering Experiment Building, University of Minnesota
John Walter, Chief Ei^ineer of Construction, Department of Highways, Parliament Buildings, Toronto, Ontario, Canada
K. B . Woods, Director, Jomt Highway Research Project, Purdue University
Contents
FREEZING-AND-THAWING TESTS ON MIXTURES OF SOIL AND CALCIUM CHLORIDE
E . J . Yoder 1 Discussion
Robert E . Pyne 11
FROST DETERMINATION BY ELECTRICAL RESISTANCE
Elmer F. Rowland, Lewis H. Stolzy, and George A. Crabb, Jr. 17
FROST ACTION ON SMALL FOOTINGS W. A. Trow 22
Discussion Hamilton Gray 28 Philip Keene - 33
111
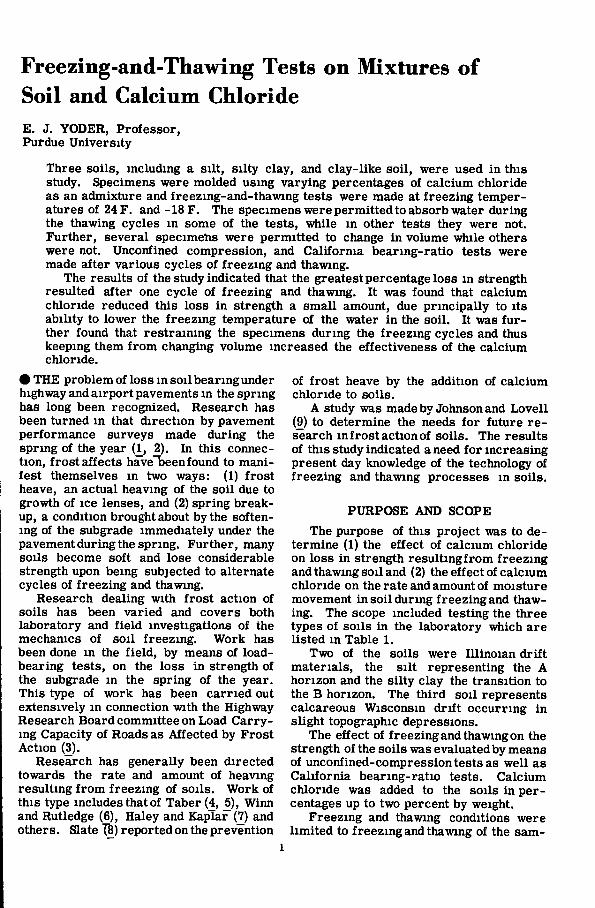
Freezing-and-Thawing Tests on Mixtures of Soil and Calcium Chloride E. J, YODER, Professor, Purdue University
Three soils, including a s i l t , si l ty clay, and clay-like soi l , were used in this study. Specimens were molded using varying percentages of calcium chloride as an admixture and freezing-and-thawing tests were made at freezing temperatures of 24 F. and-18 F. The specimens were permitted to absorb water during the thawing cycles i n some of the tests, while in other tests they were not. Further, several specimens were permitted to change in volume while others were not. Unconfined compression, and California bearing-ratio tests were made after various cycles of freezing and thawing.
The results of the study indicated that the greatest percentage loss in strength resulted after one cycle of freezing and thawing. I t was found that calcium chloride reduced this loss in strength a small amount, due principally to i ts ability to lower the freezing temperature of the water i n the soi l . I t was f u r ther found that restraining the specimens during the freezing cycles and thus keeping them f r o m changing volume increased the effectiveness of the calcium chloride.
• THE problem of loss in soil bearingunder highway and airport pavements in the spring has long been recognized. Research has been turned in that direction by pavement performance surveys made during the spring of the year (1., 2). In this connection, f ros t affects have been found to manifest themselves m two ways: (1) f ros t heave, an actual heaving of the soil due to growth of ice lenses, and (2) spring breakup, a condition brought about by the softening of the subgrade immediately under the pavement during the spring. Further, many soils become soft and lose considerable strength upon being subjected to alternate cycles of freezing and thawing.
Research dealing with f ros t action of soils has been varied and covers both laboratory and f ie ld investigations of the mechanics of soil freezing. Work has been done in the f i e ld , by means of load-bearing tests, on the loss in strength of the subgrade m the spring of the year. This type of work has been carr ied out extensively in connection with the Highway Research Board committee on Load Carrying Capacity of Roads as Affected by Frost Action (3).
Research has generally been directed towards the rate and amount of heaving resulting f r o m freezing of soils. Work of this type includes that of Taber (4, S), Winn and Rutledge (6), Haley and Kaplar (7) and others. Slate ^8) reported on the prevention
of f ro s t heave by the addition of calcium chloride to soils.
A study was made by Johnson and Lovell (9) to determine the needs fo r future r e search in f ros t action of soils. The results of this study indicated a need for increasing present day knowledge of the technology of freezing and thawing processes in soils.
PURPOSE AND SCOPE
The purpose of this project was to determine (1) the effect of calcium chloride on loss in strength resul tmgfrom freezing and thawing soil and (2) the effect of calcium chloride on the rate and amount of moisture movement in soil during freezing and thawing. The scope included testing the three types of soils in the laboratory which are listed in Table 1.
Two of the soils were lUinoian d r i f t materials, the s i l t representing the A horizon and the si l ty clay the transition to the B horizon. The th i rd soil represents calcareous Wisconsin d r i f t occurring in slight topographic depressions.
The effect of freezing and thawing on the strength of the soils was evaluated by means of unconfined-compression tests as well as California bearing-ratio tests. Calcium chloride was added to the soils i n percentages up to two percent by weight.
Freezing and thawing conditions were l imited to freezing and thawing of the sam-

pies f r o m a l l directions. Two freezing temperatures were used: 24 F. and -18 F. In addition, several tests were made on samples kept at room temperature during the cycle in which other specimens were frozen. The variables of moisture and density were introduced by molding specimens under the following conditions: (1) 100 percent maximum Proctor density and 100 percent optimum moisture content; (2) 95 percent maximum Proctor density and 100 percent optimum moisture content; and (3) 100 percent maximum Proctor density and 75 percent optimum moisture content.
T A B L E 1 SOILS T E S T E D
Designation and Derivation
L . L %
P L %
Proctor Weight C pcf.
E Frost Class
Vigo silty clay -niinoian Drift 32 18 114 2 Fs
Brookston Clay -Wisconsin Drift 50 30 105 0 Fa
Vigo Silt -Illinoian Drift 29 25 103.4 F .
In addition, several tests were made in which the samples were not permitted to absorb water during the thawing portion of the cycle and some in which the specimens were completely or part ial ly restrained curing the cycles.
PROCEDURES
Since i t was desirable to determine the rate and amount of moisture movement in soil , as well as the strength characteristics of the mixtures of soi l and calcium chloride, procedures were devised whereby both determinations could be made on one soil specimen.
Molding
The procedures adopted for making the compressive-strength specimens were relatively simple and consisted of compacting the soi l , i n cylinders 2 inches i n diameter by 4)2 inches in height, to a predetermined density and at a known moisture content. This was done by weighing out a known amount of wet soi l , placing the entire amount of soil in the 2-inch-diameter c y l inder, and then compacting i t unt i l i t was exactly 4) 2 inches in height. Figure 1 shows a view of the disassembled cylinder. The 2-by-4^2-inch specimen was used to facil i tate the performance of unconflned
compression tests. The ratio of h / d f o r this size specimen is 2 ) 4 .
After molding, each specimen was encased in a thin rubber membrane, with both ends of the specimen lef t exposed to the air . Duplicate specimens were made, in most cases, and the results averaged to insure consistent results.
The Califorma bearing-ratio specimens were molded at the standard Proctor opt imum moisture content as determined by previous compaction tests. The height, weight, and number of blows of the compaction hammer were adjusted so that the energy imparted to the soil during compaction was approximately equal to that used in the standard Proctor test (12,400 f t . - l b . per cu. f t . ) .
Freezing and Thawing
Two types of freezing-and-thawing tests were made. The f i r s t was one in which the specimens were frozen radially with the reduced temperature applied to a l l faces of the specimen. The specimens were allowed to absorb water f r o m the bottom during the thawing period of the cycle.
Twenty-four hours of reduced temperatures and 24 hours of thawing constituted one cycle of freeze and thaw. After both the freezing and thawing portions of the cycle were completed, the specimens were measured and weighed. Following the completion of the desired number of cycles, the specimens were tested fo r their unconfined compressive strengths and then cut into Ji-inch slices fo r moisture determinations.
The other type of test used was similar to the f i r s t , except that the specimens were completely restrained during the cycles (see Figure 2). Water absorption was again permitted during the freezing portion of the cycle.
In addition to the above tests, several specimens m both groups were tested with no f ree water available for capillary saturation.
To determine the effect of freezing temperatures on strength, tests were made on samples frozen at +24 F . , -18 F . , and on others which were not frozen at a l l , but kept at room temperature during the normal freezing cycle.
The C. B . R. specimens were exposed to weathering cycles much the same as were the unconfined-compression samples.
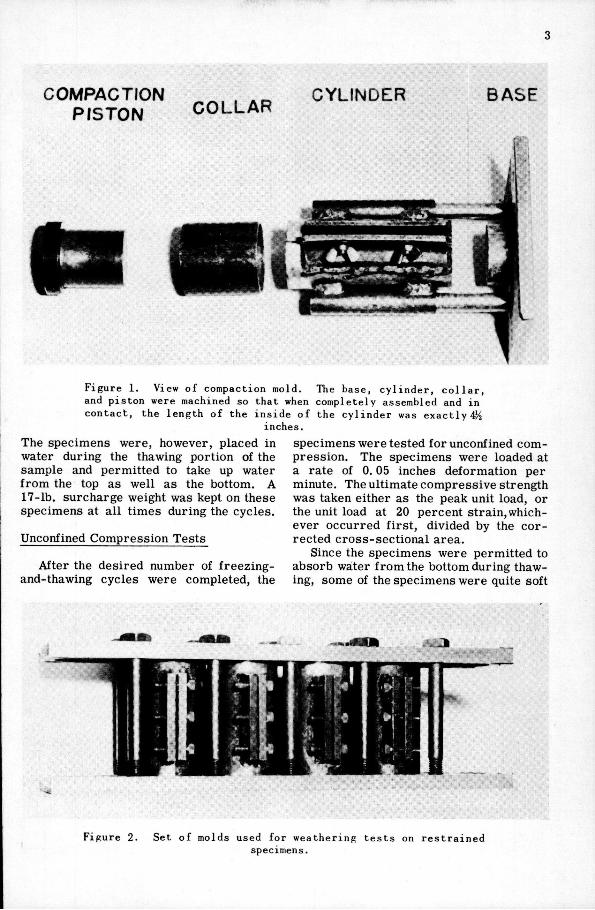
COMPACTION PISTON COLLAR G Y L I N D E R l BASE
Figure 1. View of compaction mold. The base, cyl inder, c o l l a r , and piston were machined so that when completely assembled and in contact, the length of the inside of the cyl inder was exactly 4^
inches. The specimens were, however, placed in water during the thawing portion of the sample and permitted to take up water from the top as well as the bottom. A 17-lb. surcharge weight was kept on these specimens at all times during the cycles.
Unconfined Compression Tests
After the desired number of freezing-and-thawing cycles were completed, the
specimens were tested for unconfined compression. The specimens were loaded at a rate of 0.05 inches deformation per minute. The ultimate compressive strength was taken either as the peak unit load, or the unit load at 20 percent strain, whichever occurred first, divided by the corrected cross-sectional area.
Since the specimens were permitted to absorb water from the bottom during thawing, some of the specimens were quite soft
Figure 2. Set of molds used for weathering tests on res tra ined specimens.
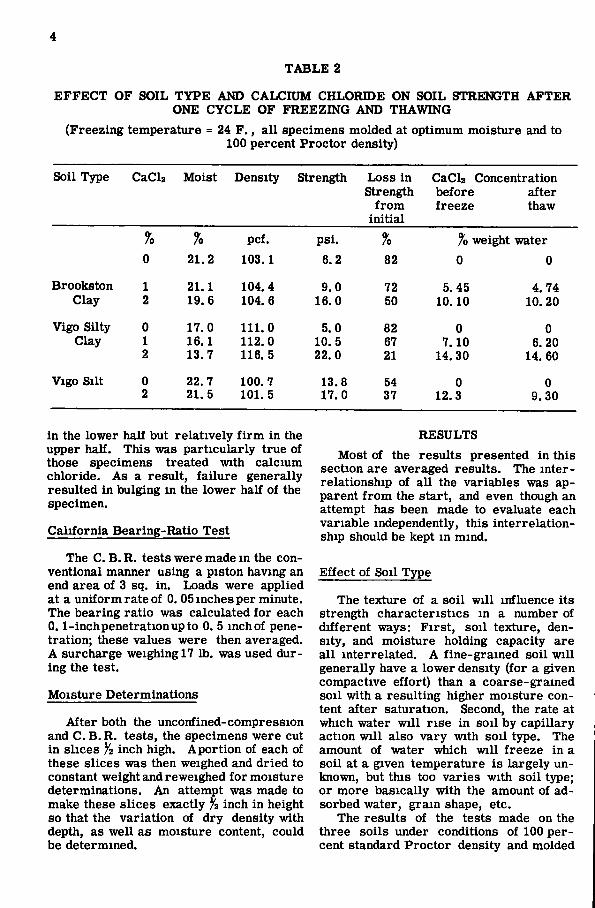
TABLE 2
EFFECT OF SOIL TYPE AND CALCIUM CHLORIDE ON SOIL STRENGTH AFTER ONE CYCLE OF FREEZING AND THAWING
(Freezing temperature 24 F . , a l l specimens molded at optimum moisture and to 100 percent Proctor density)
Soil Type CaClz Moist Density Strength Loss in Strength
f r o m in i t ia l
CaCl2 before freeze
Concentration after thaw
% pcf. psi . % % weight water 0 21.2 103.1 6.2 82 0 0
Brookston 1 21.1 104.4 9.0 72 5.45 4. 74 Clay 2 19.6 104.6 16.0 50 10.10 10. 20
Vigo Silty 0 17.0 111.0 5.0 82 0 0 Clay 1 16.1 112.0 10.5 67 7.10 6. 20
2 13.7 116. 5 22.0 21 14.30 14. 60
Vigo Silt 0 22.7 100.7 13.8 54 0 0 2 21.5 101. 5 17.0 37 12.3 9.30
in the lower half but relatively f i r m in the upper half. This was particularly true of those specimens treated with calcium chloride. As a result, fa i lure generally resulted in bulging in the lower half of the specimen.
California Bearing-Ratio Test
The C. B . R. tests were made in the conventional manner using a piston having an end area of 3 sq. in . Loads were applied at a uniform rate of 0. 05 inches per minute. The bearing ratio was calculated for each 0.1-inchpenetrationupto 0. 5 inch of penetration; these values were A surcharge weighing 17 lb. ing the test.
Moisture Determinations
then averaged, was used dur-
After both the unconfined-compression and C. B. R. tests, the specimens were cut in slices inch high. A portion of each of these slices was then weighed and dried to constant weight and reweighed fo r moisture determinations. An attempt was made to make these slices exactly % inch in height so that the variation of dry density with depth, as wel l as moisture content, could be determined.
RESULTS
Most of the results presented in this section are averaged results. The interrelationship of a l l the variables was apparent f r o m the start, and even though an attempt has been made to evaluate each variable independently, this interrelationship should be kept in mind.
Effect of Soil Type
The texture of a soil w i l l influence its strength characteristics in a number of different ways: F i rs t , soil texture, density, and moisture holding capacity are a l l interrelated. A fine-grained soil w i l l generally have a lower density (for a given compactive effort) than a coarse-grained soil with a resulting higher moisture content after saturation. Second, the rate at which water w i l l r ise in soil by capillary action w i l l also vary with soil type. The amount of water which w i l l freeze in a soil at a given temperature is largely unknown, but this too varies with soil type; or more basically with the amount of adsorbed water, gram shape, etc.
The results of the tests made on the three soils under conditions of 100 percent standard Proctor density and molded
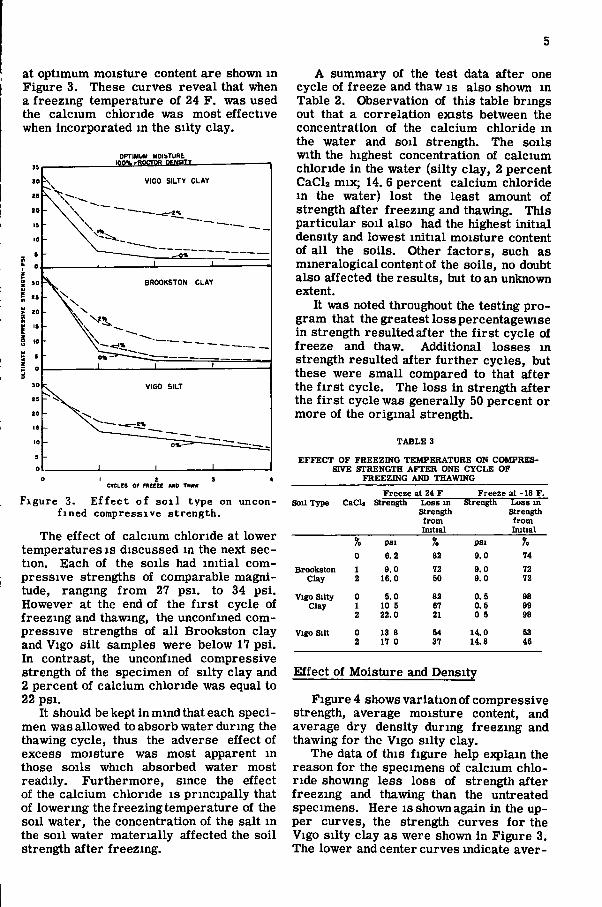
at optimum moisture content are shown in Figure 3. These curves reveal that when a freezing temperature of 24 F. was used the calcium chloride was most effective when incorporated in the sil ty clay.
OPTIMUM MOIbTURt I W H P C T O R BtWSITT
> 20
c 19
1 .ol-
VIGO SILTY CLAY
BROOKSTON CLAY
CYCLES Of n iEEZC M D TM»W
Figure 3. E f f e c t o f s o i l type on unconf i n e d compressive s t reng th .
The effect of calcium chloride at lower temperatures is discussed in the next section. Each of the soils had in i t i a l compressive strengths of comparable magnitude, ranging f r o m 27 psi . to 34 psi. However at the end of the f i r s t cycle of freezing and thawing, the unconfined compressive strengths of a l l Brookston clay and Vigo si l t samples were below 17 psi . In contrast, the unconfined compressive strength of the specimen of sil ty clay and 2 percent of calcium chloride was equal to 22 psi.
I t should be kept in mind that each specimen was allowed to absorb water during the thawing cycle, thus the adverse effect of excess moisture was most apparent m those soils which absorbed water most readily. Furthermore, since the effect of the calcium chloride is principally that of lowering the freezing temperature of the soil water, the concentration of the salt in the soil water materially affected the soil strength after freezing.
A summary of the test data after one cycle of freeze and thaw is also shown in Table 2. Observation of this table brings out that a correlation exists between the concentration of the calcium chloride m the water and soil strength. The soils with the highest concentration of calcium chloride i n the water (silty clay, 2 percent CaClz mix; 14. 6 percent calcium chloride m the water) lost the least amount of strength after freezing and thawing. This particular soil also had the highest in i t ia l density and lowest in i t i a l moisture content of a l l the soils. Other factors, such as mmeralogical content of the soils, no doubt also affected the results, but to an unknown extent.
I t was noted throughout the testing program that the greatest loss percentagewise in strength resulted after the f i r s t cycle of freeze and thaw. Additional losses in strength resulted after further cycles, but these were smal l compared to that after the f i r s t cycle. The loss in strength after the f i r s t cycle was generally 50 percent or more of the original strength.
T A B L E 3
E F F E C T OF F R E E Z I N G T E M P E R A T U R E ON COMPRESSIVE STRENGTH A F T E R ONE C Y C L E OF
F R E E Z I N G AND THAWING
Soil Type CaCli Freeze at 24 F Freeze at -18 F .
Soil Type CaCli Strength Loss in Strength from Initial
Strength Loss in Strength from Imtial
% psi % psi % 0 6.2 82 9.0 74
Brookston 1 9.0 72 9.0 72 Clay 2 16.0 SO 9.0 72
Vigo Silty 0 5.0 82 0.5 98 Clay 1 10 5 67 0.5 99
2 22.0 21 D 5 98
Vigo Silt 0 13 8 54 14.0 S3 2 17 0 37 14.8 46
Effect of Moisture and Density
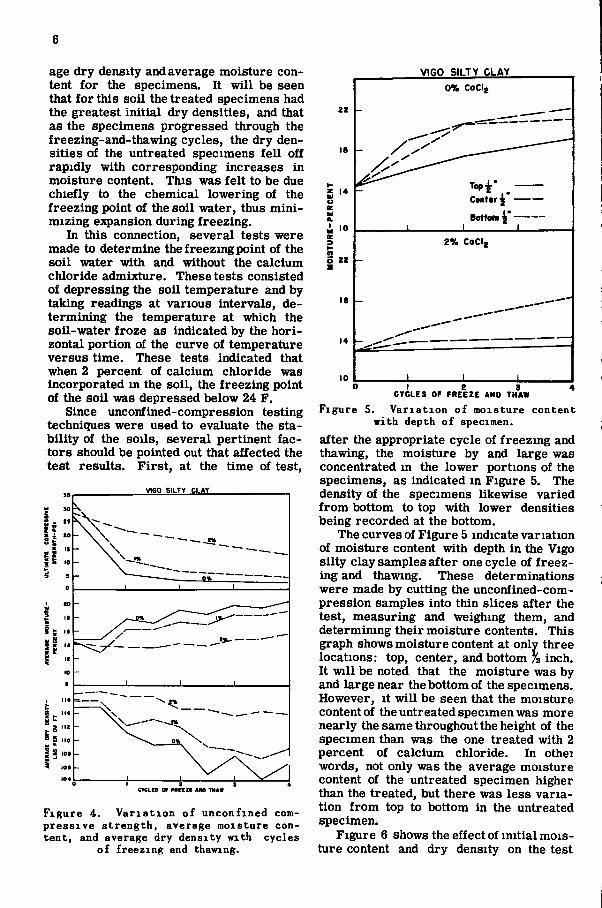
Figure 4 shows variation of compressive strength, average moisture content, and average dry density during freezing and thawing fo r the Vigo si l ty clay.
The data of this f igure help explain the reason fo r the specimens of calcium chloride showing less loss of strength after freezing and thawing than the untreated specimens. Here is shown again in the upper curves, the strength curves fo r the Vigo sil ty clay as were shown in Figure 3, The lower and center curves indicate aver-
6
age dry density and average moisture content fo r the specimens. I t w i l l be seen that fo r this soil the treated specimens had the greatest in i t i a l dry densities, and that as the specimens progressed through the freezing-and-thawing cycles, the dry densities of the untreated specimens f e l l off rapidly with corresponding increases in moisture content. This was fe l t to be due chiefly to the chemical lowering of the freezing point of the soil water, thus m i n i mizing e^qpansion during freezing.
In this connection, several tests were made to determine the freezing point of the soil water with and without the calcium chloride admixture. These tests consisted of depressing the soil temperature and by taking readings at various intervals, determining the temperature at which the soil-water f roze as indicated by the ho r i zontal portion of the curve of temperature versus t ime. These tests indicated that when 2 percent of calcium chloride was incorporated in the soi l , the freezing point of the soil was depressed below 24 F.
Since unconfined-compression testing techniques were used to evaluate the stab i l i t y of the soils, several pertinent factors should be pointed out that affected the test results. F i r s t , at the time of test.
VIGO SILTY CLAY
VIGO SILTY CLAY
C Y C L E S or r m n u a THAW
Figure 4. V a r i a t i o n o f u n c o n f i n e d compres s ive s t r e n g t h , average mois ture cont en t , and average dry densi ty w i t h cycles
o f f r eez ing and thawing.
18 U
0% CoClg
Center 4
2 % CoClg
0 1 2 3 4 CYCLES OF FREEZE ANO THAW
Figure 5. V a r i a t i o n o f mois ture content w i t h depth o f specimen.
after the appropriate cycle of freezing and thawing, the moisture by and large was concentrated in the lower portions of the specimens, as indicated in Figure 5. The density of the specimens likewise varied f r o m bottom to top with lower densities being recorded at the bottom.
The curves of Figure 5 indicate variation of moisture content with depth in the Vigo si l ty clay samples after one cycle of f reezing and thawing. These determinations were made by cutting the unconfined-compression samples into thin slices after the test, measuring and weighing them, and determimng their moisture contents. This graph shows moisture content at only three locations: top, center, and bottom 72 inch. I t w i l l be noted that the moisture was by and large near the bottom of the specimens. However, i t w i l l be seen that the moisture content of the untreated specimen was more nearly the same throughout the height of the specimen than was the one treated with 2 percent of calcium chloride. In othei words, not only was the average moisture content of the untreated specimen higher than the treated, but there was less variation f r o m top to bottom in the untreated specimen.
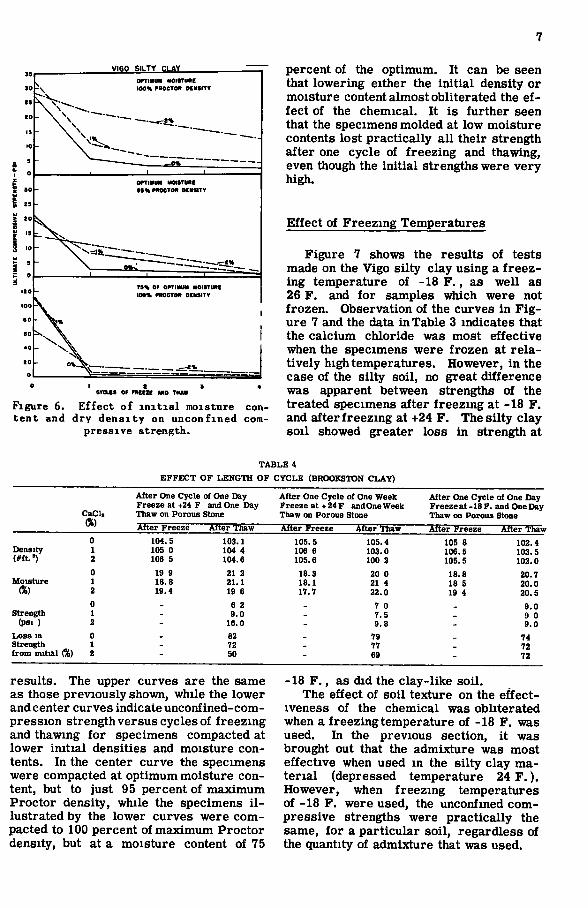
Figure 6 shows the effect of in i t ia l moisture content and dry density on the test
V160 SILTY CLAY
OPTIMUM MOISTURE I 0 0 « raocTOH D E m i T V
OPTIMUM HOISTUIIE M% PiraCTOa O E H I T V
r S % OF OPTIMUM MOISTUPE 1 0 0 % P m C T O P OEIISITT
CTCtXS OF FREEZE M O THAW
Figure 6. t e n t and
E f f e c t o f i n i t i a l moisture con-dry d e n s i t y on u n c o n f i n e d com
pressive s t rength .
percent of the optimum. I t can be seen that lowering either the in i t ia l density or moisture content almost obliterated the effect of the chemical. I t is further seen that the specimens molded at low moisture contents lost practically a l l their strength after one cycle of freezing and thawing, even though the in i t ia l strengths were very high.
Effect of Freezing Temperatures
Figure 7 shows the results of tests made on the Vigo sil ty clay using a f reezing temperature of -18 F . , as well as 26 F. and fo r samples which were not frozen. Observation of the curves in F ig ure 7 and the data in Table 3 indicates that the calcium chloride was most effective when the specimens were frozen at re latively high temperatures. However, i n the case of the sil ty soil , no great difference was apparent between strengths of the treated specimens after freezing at -18 F. and after freezing at +24 F. The si l ty clay soil showed greater loss in strength at
T A B L E 4
E F F E C T O F LENGTH O F C Y C L E (BROOKSTON C L A Y )
CaCli ft)
After One Cycle of One Day Freeze at F and One Day Thaw on Porous Stone
After One Cycle of One Week Freeze at + 24 F andOne Week Thaw on Porous Stone
After One Cycle of One Day Freeze at - I S F . and One Day Thaw on Porous Stone CaCli
ft) After Freeze After Thaw After Freeze After Thaw After Freeze After Thaw
Density (#ft.')
0 1 2
104.5 105 0 106 5
103.1 104 4 104.6
105.5 105.4 106 6 103.0 105.6 100 2
105 8 106.5 105.5
102.4 103.5 102.0
Moisture (%)
0 1 2
19 9 18.8 19.4
21 2 21.1 19 6
18.3 20 0 18.1 21 4 17.7 22.0
18.8 I S 5 19 4
20.7 20.0 20.5
Strength (psi )
0 1 2
~ 6 2 9.0
16.0
7 0 7.5 9.8
-9.0 9 0 9.0
Loss in Strength from initial (%)
0 1 2
-82 72 50
79 77 69 _
74 72 72
results. The upper curves are the same as those previously shown, while the lower and center curves indicate unconfined-compression strength versus cycles of freezing and thawing for specimens compacted at lower in i t ia l densities and moisture contents. In the center curve the specimens were compacted at optimum moisture content, but to just 95 percent of maximum Proctor density, while the specimens i l lustrated by the lower curves were compacted to 100 percent of maximum Proctor density, but at a moisture content of 75
-18 F . , as did the clay-like soi l . The effect of soil texture on the effect
iveness of the chemical was obliterated when a freezing temperature of -18 F. was used. In the previous section, i t was brought out that the admixture was most effective when used m the si l ty clay mater ia l (depressed temperature 24 F . ) . However, when freezing temperatures of -18 F. were used, the unconfined compressive strengths were practically the same, fo r a particular soil , regardless of the quantity of admixture that was used.
T A B L E 5
E F F E C T O F WATER ABSORPTION (BROOKSTON CLAY)
Freezing Temp.
CaCli Initial Strength
Loss m Unconfined Compressive Strength from initial After One Cycle After Four Cycles
Water Absorp. No Water Absorp Diff* Water Absorp. No Water Absorp Dlff »
a ) psi psi. psi. psi. psi psi psi.
+ 24 F . 0 34.0 27.8 13 0 14 8 31 8 17 0 14 8 2 32.0 16 0 2 0 14.0 25 0 2 2 22.8
-18 F . 0 34 0 25.0 IT 0 8 0 31.0 26 2 4 8 2 32.0 23.0 3 0 20.0 28 0 20 0 8.0
• Loss m strength that can be attributed to water absorption
Effect of Length of Freezing Time
Several tests were performed in which the freezing and the thawing phases 'were each increased to one week. The results of these tests are shown in Table 4. The effect of subjecting the soil-calcium chloride mixture to 24 F. for one week was practically the same as freezing i t fo r a shorter period of time at -18 F. The treated specimens lost as much as 10 percent more of their in i t ia l strengths when freezing temperatures of 24 F. were used in the 1-week cycle as compared to the daily cycle.
A portion of this loss must be attributed to the longer period of thaw on the porous stones. At the end of one cycle the treated specimens m the 1-week cycle generally soaked up more water during the thawing cycle, and their densities were correspondingly lower after thawing than those whose cycle was 1-day freeze and 1-day thaw.
Effect of Water Absorption
During the thawing portion of the freeze-aud-thaw cycles, water was permitted to
f low into the majori ty of the specimens by capillary action. Since i t was fe l t that a large portion of the decrease in soil strength was caused by this water absorption, an attempt was made to isolate this variable by sealing several specimens in paraff in, thereby not permitting them to lose or gam any moisture durmg the complete cycle. These specimens were f i r s t encased in thin rubber membranes, and then the ends were sealed with wax. Thus, expansion was permitted, even though no moisture changes took place.
Results of these tests are shown in Table 5. The data clearly i l lustrate that considerable loss in strength can be attributed to water absorption. When 24 F. was used with no water absorption, the compressive strength of the 2 -percent-calcium-chloride specimen was 2.2 psi . less than the in i t i a l . I t is seen also that when frozen at -18 F . these specimens showed appreciable losses m strength out to as far as four cycles. This is in contrast to the test results obtained when water absorption was permitted and by fa r the greatest reduction in strength resulted after the f i r s t cycle.
The data in this table also give a clue to the relative effects of soil freezing and
T A B L E 6
E F F E C T O F RESTRAINT ON COMPRESSIVE STRENGTH (BROOKSTON CLAY)
Freezing Temp
CaCl2 Initial* Strength
Restrained
Initial* Strength No Rest.
Loss in Compressive Strength from Initial After One Cycle After
Rest No Rest. Rest Four Cycles
No Rest
F (%) psi psi. (%) (%) (%) (%)
With Water Absorption During Thawing
+ 24 F 0 33 0 34 0 9 82 30 93 2 27 0 32 0 0 50 0 78
-18 F 0 33 0 34.0 28 74 42 91 2 27 0 32 0 22 72 37 87
With No Water Absorption During Thawing
+ 24 F 0 33 0 34 0 15 38 24 50 2 27 0 32 0 -33* 6 -26** 7
-18 F . 0 33.0 34.0 0 SO 0 77 2 27 0 32 0 -4»* 9 -26** 62
Minus sign indicates increase in strength

9
moisture changes. The losses in strength given in Columns 5 and 8 of Table 5 can be attributed to change in structure and density brought about by freezing, while those in Columns 6 and 9 are due to moisture absorp -tion. I t w i l l be noted that the treated specimens lost l i t t le strength during freezing and thawing when no moisture was permitted to enter the specimen.
VIGO SILTY CLAY
I 0 0 « niOCTOR O C N S I T V
•V OPTIMUM MOISTURE 1 0 0 % PROCTOR OEMSITV M T FROZEN
OPTIMUM MOISTURE 1 0 0 % PROCTm DERSITY FROZER *T — I S "
CYCLES OF FREEZE > R 0 THAW
Figure 7. E f f e c t o f temperature on unconf i n e d compressive s t rength .
Effect of Restraint During Freezing and Thawing
To fur ther isolate the variable of moisture and density on strength, weathering tests were made on samples of the Brooks-ton clay when in a completely confined condition. The specimens were encased in metal cylinders and held f i r m l y by means of bolts. I t was assumed that the plates on either end of the specimens were sufficiently r ig id to make expansion negligible. The specimens were removed f r o m these cy l in ders and tested in unconfined compression at the end of the weathering cycles.
The results of these tests are shown in Table 6. The results were slightly errat ic , inasmuch as the treated specimens (which were in a restrained condition and not permitted to absorb water during the weather
ing cycles) showed increases in strength with cycles of freeze and thaw.
In general, when the specimens were permitted to absorb water they picked up just sufficient water to completely saturate the specimens. None of the specimens lost a great amount of strength during the cycles, the average being about 25 percent of the in i t i a l .
I t w i l l be noted in Table 6 that the effectiveness of the calcium chloride was mater ia l ly increased by restraining the specimens. I t is fe l t , however, that more tests need be made before any definite conclusions can be reached.
Effect of Calcium Chloride and Freezing and Thawing on C. B . R.
Only a l imi ted number of C. B . R. tests were made, the results of which are shown i n Figure 8. These tests were made using standardprocedures ut i l iz ing a 17-lb. surcharge weight. The end point was to determine the effect of par t ia l restraint during freezing and thawing. When the specimens were tested i n a soaked condition, the calcium chloride increased the soil-pene-tration resistance after freezing and thawing, but not to any great extent.
OPTIMUM MOISTURE 1 0 0 * PROCTOR DENSITY
VIGO SILTY CLA^
BR00K5T0N CLAY
CYCLES OF FREEZC A N D T H A W
Figure 8. E f f e c t o f s o i l type on C a l i f orn ia Bearing Rat io.
10
The results indicated that the calcium chloride was effective in decreasing loss m C. B. R. in some cases, but that par t ia l restraint of the surcharge did not have the effect of f u l l restraint.
SUMMARY
The effects of freezing and thawing on soil strength are variable, depending on soil texture, density and changes in density, moisture content and changes in moisture content, duration of freezing, freezing temperature, and degree of confinement. The degree to which calcium chloride affected the strength of the soils differed for a l l of the above-mentioned variables and by restr ic t ing or controlling any one of the variables the effectiveness of the calcium chloride was increased.
The effectiveness of the calcium chloride was found to be principally due to its property of lowering the freezing point of the soil moisture. When the specimens were frozen at very low temperatures the salt was ineffective. Likewise, increasing the freezing time decreased the effectiveness of the calcium chloride.
The results and conclusions of the study are summarized below. They apply only to the conditions of test imposed in this study. The variable of permanence of the chloride, formation of ice lenses, and prevention of f ro s t heaving, were not included in the study.
1. Soil texture influenced the effectiveness of the calcium chloride in preventing loss i n strength after freezing and thawing. Moisture content and density played a very important role in this as did
the actual concentration of the chloride in the soil water. For the three soils tested the calcium chloride was most effective in the s i l ty clay soil .
2. When the specimens were molded at optimum moisture content and 100 percent of Proctor standard density, the calcium chloride reduced the loss m unconfined compressive strength resulting f r o m the weathering cycles. This reduction was as much as 60 percent of the soil 's in i t i a l strength.
3. Calcium chloride was found to be most effective at relatively high freezing temperatures. The principal effect of the chloride was that brought about by lowering the freezing point of the soil water.
When the specimens of soil and calcium chloride were frozen at relatively high temperatures fo r long periods of t ime, the effect was s imilar to that of freezing them at low temperatures f o r a short period of t ime.
5. Water absorption effected the test results appreciably. A larger portion of the reduction in strength of the specimens was attributed to water absorption rather than to the freezing temperature. However, in the case of the raw soil , the actual freezing of the soil had about the same effect as the water absorption.
6. Restraining the soil specimens, and thus preventing expansion, increased the effectiveness of the calcium chloride materially.
7. The calcium chloride was effective in decreasing loss in C. B. R. after freezing and thawing. The effect of par t ia l restraint was not nearly as pronounced as that of total restraint on soil strength.
1. Shelburne, T. E. and Woods, K. B . , "1943 Survey of Secondary Roads (Spring Break-up)", Report to the Advisory Board of the Joint Highway Research Project, Purdue University, A p r i l , 1943 (unpublished).
2. Shelburne, T. E. and Maner, A. W . , "Analysis of Spring Break-up Data in Virg in ia" , Pavement Performance, Bu l l . No. 20, Highway Research Board, 1949.
3. Mot l , C. L . , "Load Carrying Capacity of Roads as Affected by Frost", Highway Research Board, B u l l , , No. 54, 1952.
4. Taber, Stephen, "Frost Heaving", Journal of Geology, Vol. 37, No. 5, 1929.
References 5. Taber, Stephen, "The Mechanics of
Frost Heaving", Journal of Geology, Vol. 38, 1930.
6. Winn, H. F. and Rutledge, P. C. , "Frost Action in Highway Bases and Sub-grades", Research Series No. 73, EES, Purdue University, 1940.
7. Haley, J. F. and Kaplar, C. W. , "Cold Room Studies of Frost Action in Soils", Frost Action in Soils, A symposium, Highway Research Board, Special Report No. 2, 1952.
8. Slate, F. O., "Use of Calcium Chloride in Subgrade Soils fo r Frost Prevention", Proceedings, Highway Research
11
Board, Vol. 22, 1942. 9. Johnson, A. W. and Lovell, C. W.,
"Frost Action Research Needs", Soil Temperature and General Freezing, Highway Research Board, Bull., No. 71, 1953.
10. Yoder, E . J. and Korman, Oktay, "Second Progress Report on Freezing of Soil-Calcium Chloride Mixture", Progress report submitted to Calcium Chloride Institute, January 1953.
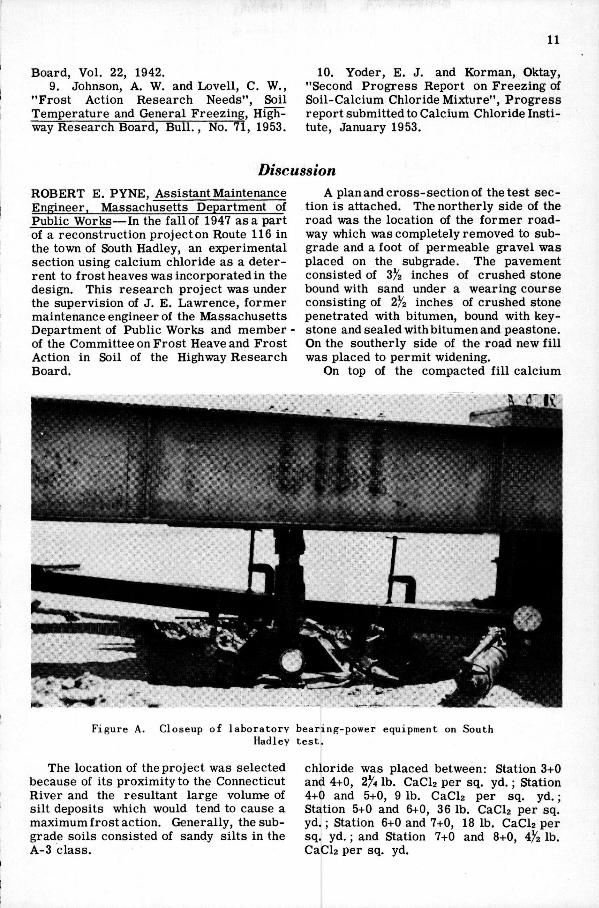
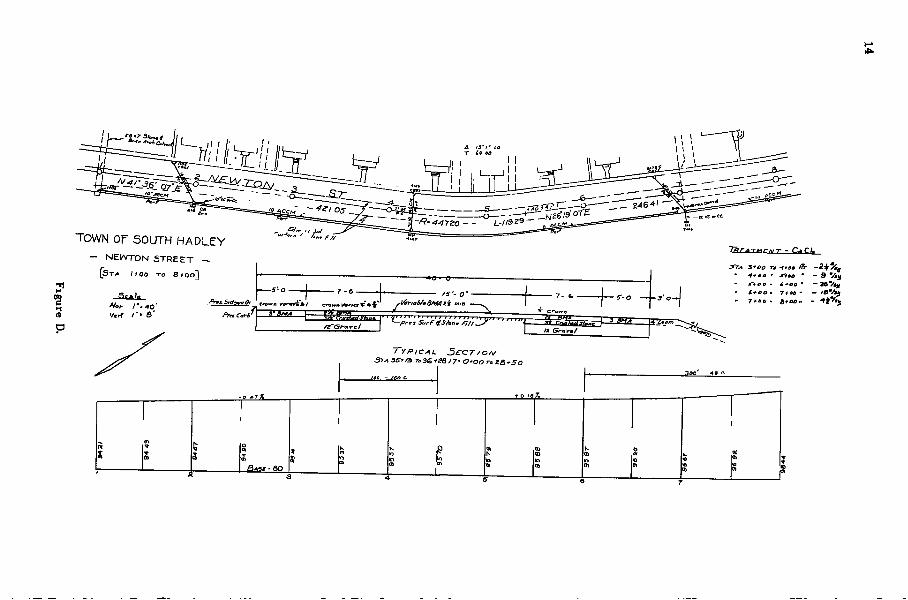
Discussion ROBERT E . PYNE, Assistant Maintenance Engineer, Massachusetts Department of Public Works—In the fall of 1947 as a part of a reconstruction projecton Route 116 in the town of South Hadley, an experimental section using calcium chloride as a deterrent to frost heaves was incorporated in the design. This research project was under the supervision of J . E . Lawrence, former maintenance engineer of the Massachusetts Department of Public Works and member -of the Committee on Frost Heave and Frost Action in Soil of the Highway Research Board.
A plan and cross-section of the test section is attached. The northerly side of the road was the location of the former roadway which was completely removed to sub-grade and a foot of permeable gravel was placed on the subgrade. The pavement consisted of 3/ 2 inches of crushed stone bound with sand under a wearing course consisting of 2/2 inches of crushed stone penetrated with bitumen, bound with keystone and sealed with bitumen and peastone. On the southerly side of the road new fill was placed to permit widening.
On top of the compacted fill calcium
Figure A. Closeup of laboratory bearing-power equipment on South Hadley t e s t .
The location of the project was selected because of its proximity to the Connecticut River and the resultant large volum-e of silt deposits which would tend to cause a maximum frost action. Generally, the sub-grade soils consisted of sandy silts in the A-3 class.
chloride was placed between: Station 3+0 and 4+0, 2^4 lb. CaCU per sq. yd.; Station 4+0 and 5+0, 9 lb. CaCh per sq. yd.; Station 5+0 and 6+0, 36 lb. CaCla per sq. yd.; Station 6+0 and 7+0, 18 lb. CaCh per sq. yd.; and Station 7+0 and 8+0, 4^2 lb. CaCla per sq. yd.
12
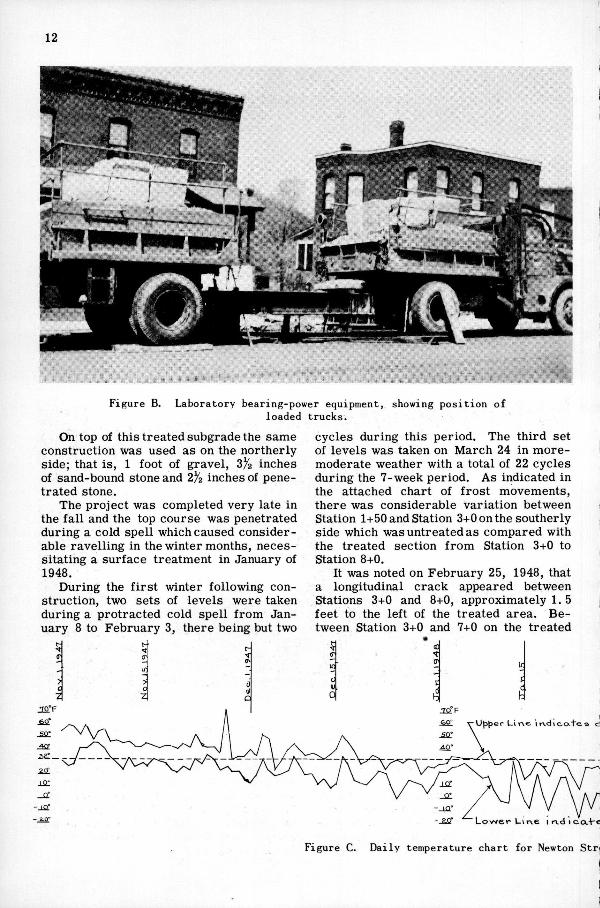
Figure B. Laboratory bearing-power equipment, showing position of loaded trucks.
On top of this treated subgrade the same construction was used as on the northerly side; that is, 1 foot of gravel, 3% inches of sand-bound stone and 1% inches of penetrated stone.
The project was completed very late in the fall and the top course was penetrated during a cold spell which caused considerable ravelling in the winter months, necessitating a surface treatment in January of 1948.
During the first winter following construction, two sets of levels were taken during a protracted cold spell from January 8 to February "i, there being but two
cycles during this period. The third set of levels was taken on March 24 in more-moderate weather with a total of 22 cycles during the 7-week period. As indicated in the attached chart of frost movements, there was considerable variation between Station 1+50 and Station 3+0 on the southerly side which was untreated as compared with the treated section from Station 3+0 to Station 8+0.
It was noted on February 25, 1948, that a longitudinal crack appeared between Stations 3+0 and 8+0, approximately 1. 5 feet to the left of the treated area. Between Station 3+0 and 7+0 on the treated
Lower Uirve i r\ci i c.a.-1-e
Figure C. Daily temperature chart for Newton Stri
13
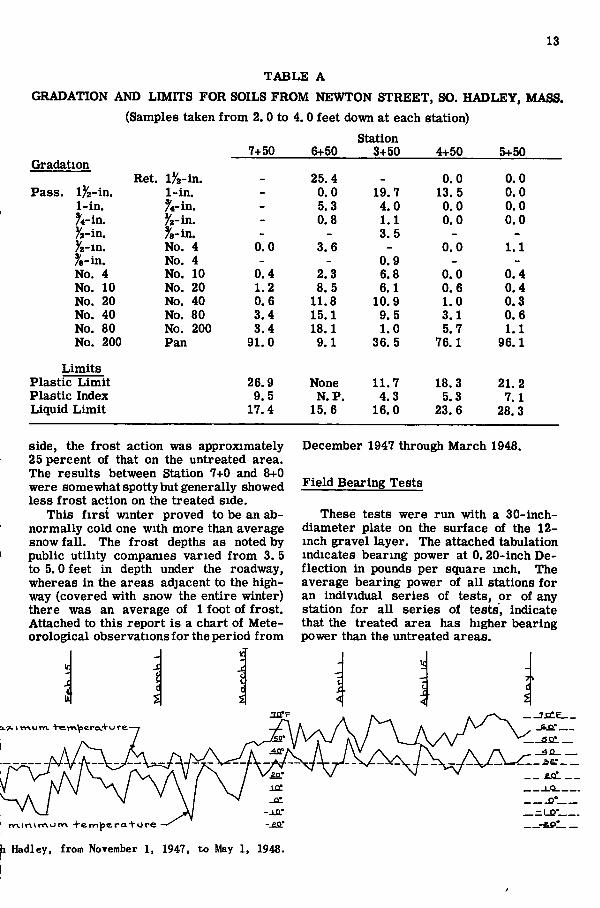
TABLE A GRADATION AND LIMITS FOR SOILS FROM NEWTON STREET, SO. HADLEY, MASS.
(Samples taken from 2. 0 to 4.0 feet down at each station) Station
7+50 6+50 3+50 4+50 5+50 Gradation
Ret. lYi-in. - 25.4 - 0.0 0.0 Pass. 1^2-in. 1-in. - 0.0 19.7 13. 5 0.0
1-in. ^i-in. - 5.3 4.0 0.0 0.0 ?'4-in. ^a-in. - 0.8 1.1 0.0 0.0 Ji-in. %-in. - - 3. 5 - -y^-in. No. 4 0.0 3.6 - 0.0 1.1 %-in. No. 4 - - 0.9 - -No. 4 No. 10 0.4 2.3 6.8 0.0 0.4 No. 10 No. 20 1.2 8.5 6.1 0.6 0.4 No. 20 No. 40 0.6 11.8 10.9 1.0 0.3 No. 40 No. 80 3.4 15.1 9.5 3.1 0.6 No. 80 No. 200 3.4 18.1 1.0 5.7 1.1 No. 200 Pan 91.0 9.1 36. 5 76.1 96.1
Limits Plastic Limit 26.9 None 11.7 18.3 21.2 Plastic Index 9.5 N.P. 4.3 5.3 7.1 Liquid Limit 17.4 15.6 16.0 23.6 28.3
side, the frost action was approximately 25 percent of that on the untreated area. The results between Station 7+0 and 8+0 were somewhat spotty but generally showed less frost action on the treated side.
This first winter proved to be an abnormally cold one with more than average snow fall. The frost depths as noted by public utility compames varied from 3. 5 to 5.0 feet in depth under the roadway, whereas in the areas adjacent to the highway (covered with snow the entire winter) there was an average of 1 foot of frost. Attached to this report is a chart of Meteorological observations for the period from
December 1947 through March 1948.
Field Bearing Tests
These tests were run with a 30-inch-diameter plate on the surface of the 12-inch gravel layer. The attached tabulation indicates bearing power at 0.20-inch Deflection in pounds per square inch. The average bearing power of all stations for an individual series of tests, or of any station for all series of tests, indicate that the treated area has higher bearing power than the untreated areas.
tore
Hadley, from November 1, 1947, to May 1, 1948.
a
a
TOWN or SOUTH HADLEY — N E W T O N S T R E E T —
[ S T A Itoa TO 8+00^
Ho,- /'.AO' V.rT /•• e'
—j-o L r - 6 1 .1 ^t/iriai/eBA^li m.n ^
7 - & — — .
at r,^-'-3-i?FH « Gravef
3 a«,4 1
TyP/CAL 3€CT/CiA/
1 aoo' a -4 '^0 - /go c ^ 1 T
X s tt s
o Ol en
a sc - SO
m at
K fi m a In
cn
Ol in 0)
1 « m (A
01
S O
« Ol 5
y 7
15
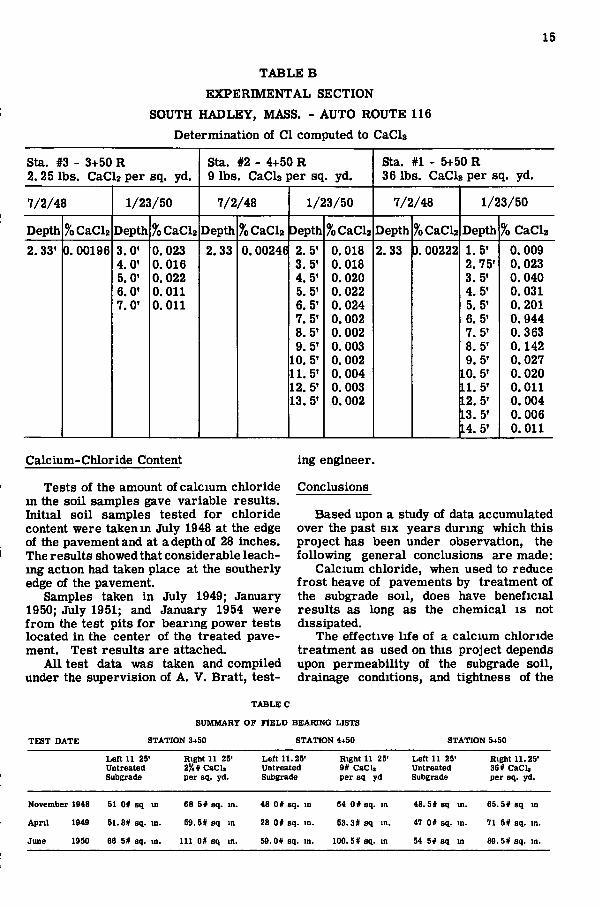
T A B L E B
EXPERIMENTAL SECTION
SOUTH HADLEY, MASS. - AUTO ROUTE 116
Determination of CI computed to CaCU
Sta. #3 - 3+50 R Sta. #2 - 4+50 R Sta. #1 - 5+50 R 2.25 lbs. CaCl2 per sq. yd. 9 lbs. CaClg per sq. yd. 36 lbs. CaClz per sq. yd.
7/2/48 1/23/50 7/2/48 1/23/50 7/2/48 1/23/50
Depth ?oCaCl2 Depth ?oCaClz Depth Depth %Ca.Cl2 Depth ?oCaCl2 Depth % CaCl2 2.33' 0. 00196 3.0' 0.023 2.33 0.00246 2. 5' 0.018 2.33 9. 00222 1.5' 0. 009
4. 0' 0.016 3. 5' 0.018 2.75' 0. 023 5.0' 0. 022 4. 5' 0. 020 3. 5' 0.040 6.0' 0. Oi l 5. 5' 0.022 4. 5' 0.031 7.0' 0. Oil 6. 5' 0.024 5. 5' 0. 201
7. 5' 0.002 6. 5' 0. 944 8.5' 0.002 7. 5' 0.363 9. 5' 0.003 8. 5' 0.142
10. 5' 0.002 9. 5' 0. 027 11.5' 0. 004 10. 5' 0.020 12. 5' 0.003 11. 5' 0. Oi l 13.5' 0.002 12. 5' 0.004
13. 5' 0.006 14. 5' 0. Oi l
Calcium-Chloride Content
Tests of the amount of calcium chloride m the soil samples gave variable results. Initial soil samples tested for chloride content were taken m July 1948 at the edge of the pavement and at a depth of 28 inches. The results showed that considerable leaching action had taken place at the southerly edge of the pavement.
Samples taken in July 1949; January 1950; July 1951; and January 1954 were from the test pits for bearing power tests located in the center of the treated pavement. Test results are attached.
All test data was taken and compiled under the supervision of A. V. Bratt, test
ing engineer.
Conclusions
Based upon a study of data accumulated over the past six years during which this project has been under observation, the following general conclusions are made:
Calcium chloride, when used to reduce frost heave of pavements by treatment of the subgrade soil, does have beneficial results as long as the chemical is not dissipated.
The effective life of a calcium chloride treatment as used on this project depends upon permeability of the subgrade soil, drainage conditions, and tightness of the
TEST DATE
TABLE C
SUMMARY OF HELD BEARING LISTS
STATION 3+50 STATION 4+50 STATION 5+50
Left 11 25< Right 11 25- Left 11.25' Right 11 25' Left 11 25' Right 11.25' Untreated 2Yt* CaCli Untreated 9* CaCU Untreated 36 # CaCU Subgrade per sq. yd. Subgrade per sq yd Subgrade per sq. yd.
November 1948 51 0# sq in 68 S# sq. in. 48 0# sq. m 64 0 # sq. in 48.5#sq in. 65.5# sq in
April 1949 51.8# sq. m. 59.5# sq in 28 0# sq. m. 53. 3 # sq in. 47 0# sq. m. 71 5# sq. in.
June 1950 66 5# sq. in. 111 0# sq in. 59.041 sq. in. 100. 5# sq. in 54 5# sq in 89. 5# sq. in.
16
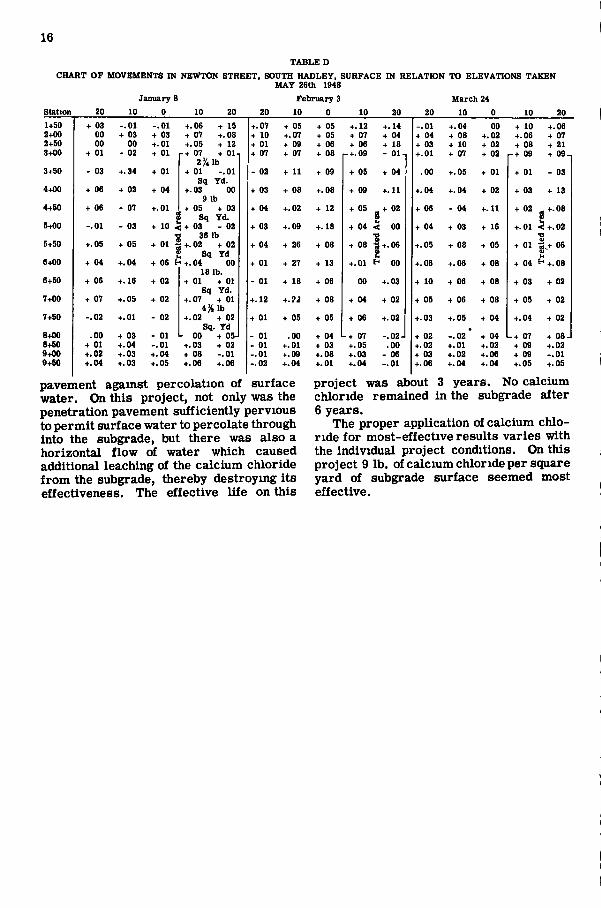
CHART OF MOVEMENTS IN NEWTON STREET, SOUTH HADLEY, SURFACE IN RELATION TO ELEVATIONS TAKEN BiIAY 26th 1948
January 8 February i March 24 Station 20 10 0 10 20 20 10 0 10 20 20 10 0 10 20 1+50 + 03 -.01 -.01 +.06 + IS +.07 + 05 + 05 +.12 +. 14 -. 01 +.04 00 + 10 +.06 2+00 00 + 03 + 03 + 07 +.08 + 10 +.07 + 05 + 07 + 04 + 04 + 08 +.02 + 06 + 07 2+50 00 00 +.01 +.05 + 12 + 01 + 09 + 06 + 06 + 18 + 03 + 10 + 02 + 08 + 21 3+00 + 01 - 02 + 01 |-+ 07 + 01- + 07 + 07 + 08 P+.09 - 01- +.01 + 07 + 02 - + 09 + 09-,
2>ilb 3+50 - 03 +.34 + 01 + 01 -.01 - 02 + 11 + 09 + 05 + 04 .00 +.05 + 01 + 01 - 03
Sq Yd. 4+00 + 06 + 02 + 04 +. 03 00
9 lb + 03 + 08 + 08 + 09 +.11 +.04 +.04 + 02 + 03 + 13
4+50 + 06 - 07 +.01 +05 +03 + 04 +.02 + 12 + 05 - + 02 + 06 - 04 +.11 + 02 - +•08 1 1 Sq Yd. V ft « 5+00 -.01 - 03 + 10 t S + 03 - 02 + 03 +.09 + 18 + 04 < 00 + 04 + 03 + 16 + 01 •<+.02
•g 36 1b •o 5+SO +.05 + 05 + 01 I+.02 +02 + 04 + 26 + 08 + 08 U+.oe +. 05 + 08 + OS + 01 ^+ 06
ft Sq Yd « I. a> h 6+00 + 04 +.04 + 06 <+.04 00 + 01 + 27 + 13 +.01 H 00 +.06 +.06 + 08 + 04 t^+.08
18 1b. 6+50 + 06 +. 16 + 02 + 01 +01 - 01 + 18 + 06 00 +.03 + 10 + 06 + 08 + 03 + 02
Sq Yd. 7+00 + 07 +.05 + 02 +.07 + 01 +. 12 +.?2 + 08 + 04 + 02 + 05 + 06 + 08 + OS + 02
4^ lb 7+50 -.02 +.01 - 02 +.02 + 02 + 01 + 05 + 05 + 06 +.02 +. 03 +.05 + 04 +. 04 + 02
Sq. Yd 8+00 .00 + 03 - 01 L 00 + 05-1 - 01 .00 + 04 -+07 -.02- + 02 -.02 + 04 - + 07 + 08-8+50 + 01 +.04 -.01 +.03 + 02 - 01 +.01 + 03 +.05 .00 +.02 +.01 +.02 + 09 +.02 9+00 +.02 +.03 +.04 + 08 -.01 -.01 +.09 +. 08 +.03 - 06 + 03 +. 02 +.06 + 09 -.01 9+50 +.04 +.03 +.05 +.06 +.06 -.02 +.04 +. 01 +.04 -.01 +.06 +.04 +.04 +.05 +.05
pavement against percolation of surface water. On this project, not only was the penetration pavement si^f iciently pervious to permit surface water to percolate through into the subgrade, but there was also a horizontal flow of water which caused additional leaching of the calcium chloride from the subgrade, thereby destroying its effectiveness. The effective life on this
project was about 3 years. No calcium chloride remained in the subgrade after 6 years.
The proper application of calcium chloride for most-effective results varies with the individual project conditions. On this project 9 lb. of calcium chloride per square yard of subgrade surface seemed most effective.
Frost Determination by Electrical Resistance E L M E R F . ROWLAND, Engineering Aide, LEWIS H. STOLZY, Soil Conservationist, and GEORGE A. CRABB, J r . , Hydraulic Engineer Division of Soils Research, U. S. Department of Agriculture
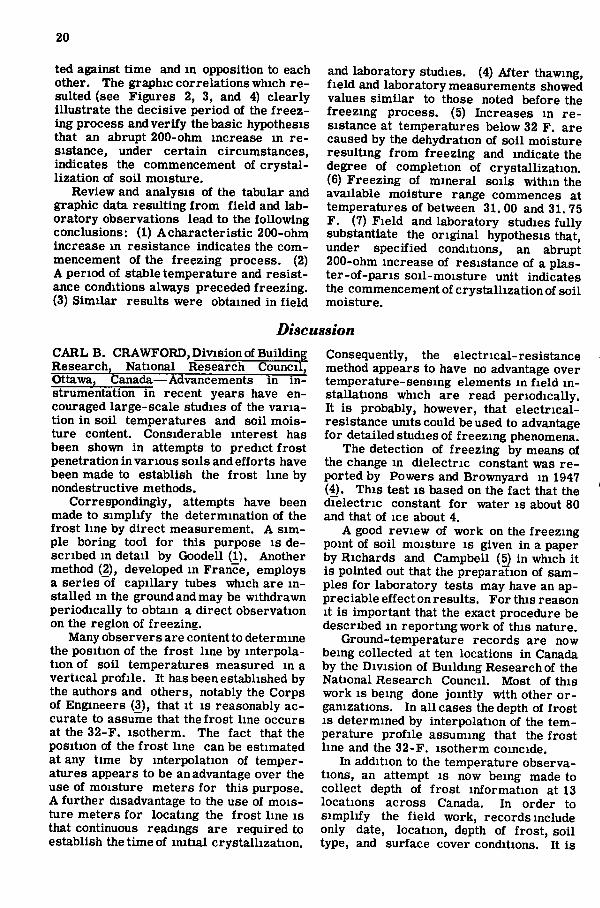
A preliminary report on a new method of determination of frost in the soil profile in situ. The method involves interpretation of electrical resistances obtained with a soil-moisture block and their associated soil temperatures, a method developed at the Michigan Hydrologic Research Station as a result of correlations noted from daily field records of soil moisture and temperatures. A hypothesis relating these phenomena was formulated and was substantiated by field and laboratory studies. Under certain conditions an abrupt 200-ohm increase in the electrical resistance of the plaster-of-paris moisture unit was a satisfactory indicator of the commencement of crystallization of moisture. Test instrumentation and graphic results of the laboratory tests are illustrated.
# T H I S paper presents a simple method for determining the commencement of initial freezing, or water crystallization, of soil moisture in situ. The method was developed at the Michigan Hydrologic Research Station as a result of correlations noted between field observations of frost penetration depths and soil-moisture readings made with moisture blocks. This method of frost determination, which utilizes principles of soil-moisture measurement by variations in the electrical resistance of porous units buried in the profile, is discussed in preliminary form, because of the wide interest evidenced by agronomists and by highway and agricultural engineers.
The electrical-resistance method of determining the moisture content of soil utilizes a porous unit (containing a pair of equidistant electrodes) buried in the soil profile. The moisture content of the unit varies with that of the soil in which it is embedded, and the electrical resistance between the electrodes varies with the moisture. Temperature also affects the resistance of the unit, but this effect may be corrected if the temperature is known. A number of types of such moisture-sensitive units are m use today, primarily differentiated by the type of dielectric used in construction. The most-widely used units utilize plaster-of-paris, nylon, fiberglass, and similar materials as a dielectric. The plaster-of-paris unit developed by Bouyoucos and Mick' I S used at the Michigan Hydrologic Research Station
'Bouyoucos, G. J , and Mick, A. M , an electrical method for the continuous measurement of soil moisture under field conditions Michigan Agricultural Experiment Station Techmcal BuUetinl72, 1940.
for the daily recording of soil moisture at several locations and depths. This method has given indications that it might be used to tell when initial freezing of the soil moisture takes place. Various authors have indicated that frozen soil causes abnormally high resistance, but none of them
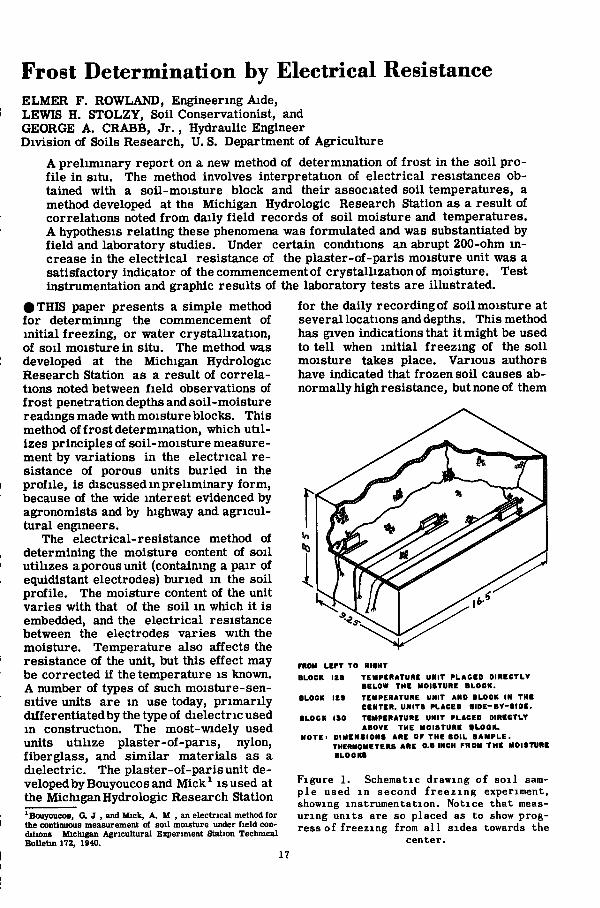
FROM LtrT TO RIOHT BLOCK I 2 S TEMPCRATURC UNIT P L A C K D D I R E C T L Y
BELOW T H E MOISTURE B L O C K . SLOCK lES TEMPERATURE UNIT AND BLOCK I N T H E
C E N T E R . U N I T S PLACED S I D E - B V - S t D E . SLOCK ISO TEMPERATURE UNIT PLACED DIRECTLY
ABOVE T H E MOISTURE B k O C K . N O T E - D I M E N S I O N S ARE OF T H E S O I L S A M P L E .
THERMOMETERS A R E 0.S INCH FROM T H E MOISTURE BLOCKS
Figure 1. Schematic drawing of so i l sample used in second freez ing experiment, showing instrumentation. Notice that measuring units are so placed as to show progress of freezing from a l l sides towards the
center. 17
18
have presented data to pinpoint the commencement of the freezing process.
Comparison of resistance readings from the daily soil moisture studies with manually determined frost-penetration depths in the cultivated watersheds indicated that there was a probable correlation between soil temperatures, moisture-block resistances, andpresenceof frostin the profile. A preliminary field study correlating these factors was carried on during the winter of 1951—52, and showed a high degree of correlation. Data used in this preliminary field study consisted of the daily soil temperature and moisture readings from the hydrologic investigations, supplemented by actual frost-penetration data obtained by probing with a Veihmeyer soil-sampler. Analysis of this data provided the basis for an hypothesis regarding the determination of
was designed to substantiate this hypothesis.
In this study, seven similar samples of soil from the cultivated watersheds were placed m baskets of hardware cloth and frozen in a conventional ice-cream-storage cabinet. The cabinet was thermostatically controlled to maintain a box temperature ranging from 8 to 11 F . Plaster-of-paris moisture units were centrally placed in three of the soil samples, while resistance thermometers were similarly placed in three other samples. A seventh sample was not instrumented, but was utilized for physical determination of frost penetration by probing. The seven samples were installed in the freezer and the coolingpro-cess commenced. Temperatures and resistances of the soil samples, box temperatures, and the probed depth of frost penetration were noted at frequent inter-
66
- 5 4
UJ cc
UJ UJ (£
4 2
30
18
1 \ '°. i \ i i
i \ l ! -
j y i If
i > 1 ^ i
1
I 10 100 1000
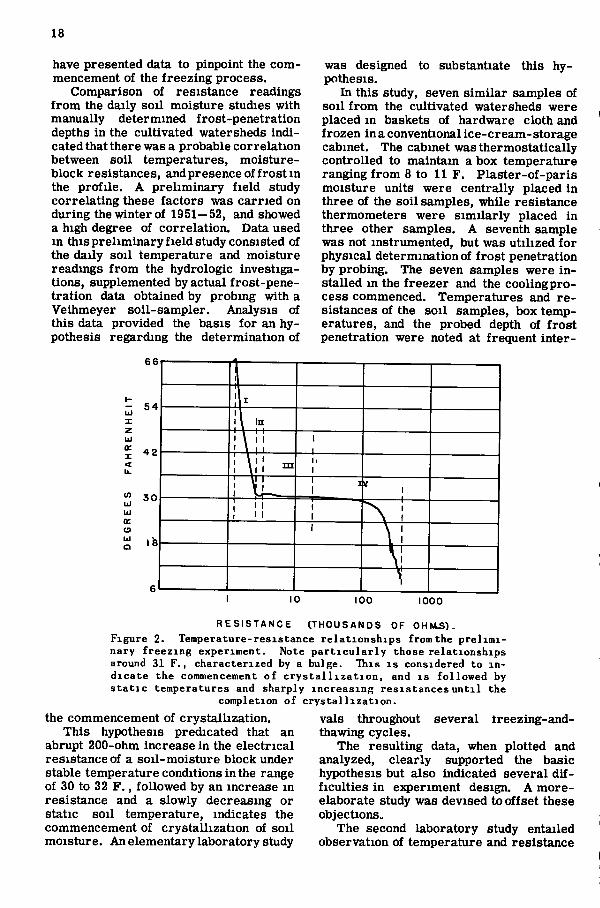
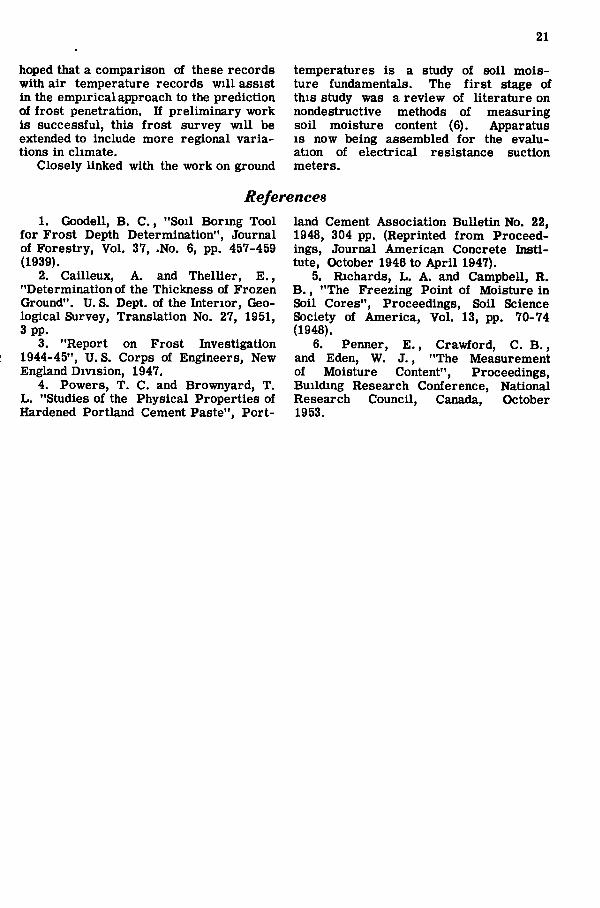
R E S I S T A N C E (THOUSANDS OF 0 H M 3 ) . Figure 2. Temperature-resistance relat ionships from the preliminary freezing experiment. Note p a r t i c u l a r l y those relationships around 31 F. , characterized by a bulge. This i s considered to in dicate the commencement of c r y s t a l l i z a t i o n , and i s followed by s t a t i c temperatures and sharply increasing res istances unt i l the
completion of crys ta l l i za t ion .
the commencement of crystallization. This hypothesis predicated that an
abrupt 200-ohm increase in the electrical resistance of a soil-moisture block under stable temperature conditions in the range of 30 to 32 F . , followed by an increase in resistance and a slowly decreasing or static soil temperature, indicates the commencement of crystallization of soil moisture. An elementary laboratory study
vals throughout several ireezing-and-thawing cycles.
The resulting data, when plotted and analyzed, clearly supported the basic hypothesis but also indicated several difficulties in experiment design. A more-elaborate study was devised to offset these objections.
The second laboratory study entailed observation of temperature and resistance
19
200
CO ISO 2
ISO X o 160 11. d
140 (0
140 o z <t 120 U) o 100 X
80 llJ o z 60 < (/} 40 (/} UJ (£ 20
0
TE MPEI lATU 1
* I t 1 1 !i
1 1 1 i i
•• 1
1 1
" I 1 1 1 1 1 1
1; 1
1 ' •
i i \
RE SIST ANCE :
\ \ . . . i
25
30
35
40
45
50
55
60
65
10 20 30
ELAPSED
40 50 60 70 80
TIME ( H O U R S ' )
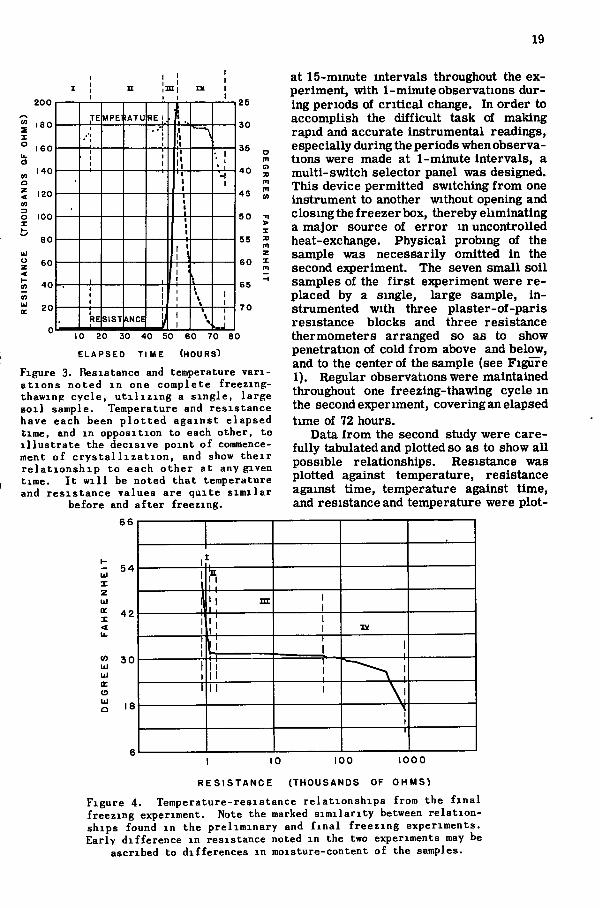
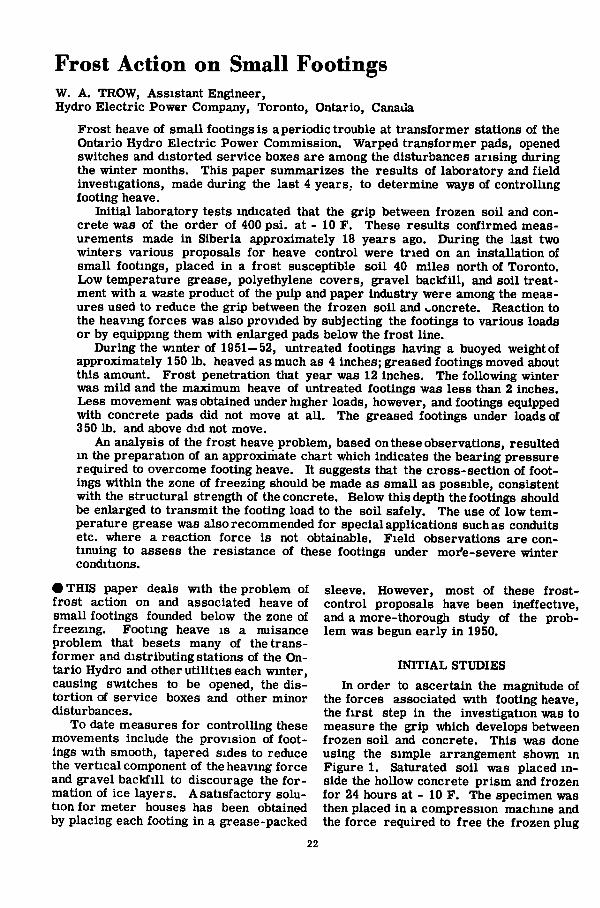
Figure 3. Resistance and temperature v a r i a t i o n s noted in one complete freezing-thawing cycle , u t i l i z i n g a s ingle , large s o i l sample. Temperature and resistance have each been plot ted against elapsed time, and in opposition to each other, to i l l u s t r a t e the decisive point of commencement of c r y s t a l l i z a t i o n , and show the ir r e l a t i o n s h i p to each other at any given time. I t w i l l be noted that temperature and res i s tance values are quite s i m i l a r
before and after freezing.
at 15-minute intervals throughout the experiment, with 1-minute observations during periods of critical change. In order to accomplish the difficult task of making rapid and accurate instrumental readings, especially during the periods when observations were made at 1-minute intervals, a multi-switch selector panel was designed. This device permitted switching from one instrument to another without opening and closing the freezer box, thereby eliminating a major source of error in uncontrolled heat-exchange. Physical probing of the sample was necessarily omitted in the second e^qperiment. The seven small soil samples of the first e^qperiment were replaced by a single, large sample, instrumented with three plaster-of-paris resistance blocks and three resistance thermometers arranged so as to show penetration of cold from above and below, and to the center of the sample (see Figure 1). Regular observations were maintained throughout one freezing-thawing cycle in the second ejcperiment, covering an elapsed time of 72 hours.
Data from the second study were carefully tabulated and plotted so as to show all possible relationships. Resistance was plotted against temperature, resistance against time, temperature against time, and resistance and temperature were plot-
66
- 5 4 UJ I UJ IT X
<
ui UJ IT (9 111 O
4 2
3 0
18
1 t
1 1 h
1 I IK 1 1
!' 1 1
r 1
1 1
1 1
1 1 ! 1 11
1 11 \ \ 1 1 1
I 10 100 1000
R E S I S T A N C E (THOUSANDS OF 0HMS1
Figure 4. Temperature-resistance re la t ionships from the f i n a l freezing experiment. Note the marked s imi lar i ty between relat ionships found in the preliminary and f i n a l freezing experiments. Early difference in resistance noted in the two experiments may be
ascribed to differences m moisture-content of the samples.
20
ted against time and m opposition to each other. The graphic correlations which re sulted (see Figures 2, 3, and 4) clearly illustrate the decisive period of the freezing process and verify the basic hypothesis that an abrupt 200-ohm increase in resistance, under certain circumstances, indicates the commencement of crystallization of soil moisture.
Review and analysis of the tabular and graphic data resulting from field and laboratory observations lead to the following conclusions: (1) A characteristic 200-ohm increase m resistance indicates the commencement of the freezing process. (2) A period of stable temperature and resistance conditions always preceded freezing. (3) Similar results were obtained in field
and laboratory studies. (4) After thawing, field and laboratory measurements showed values similar to those noted before the freezing process. (5) Increases in resistance at temperatures below 32 F . are caused by the dehydration of soil moisture resulting from freezing and indicate the degree of completion of crystallization. (6) Freezing of mineral soils within the available moisture range commences at temperatures of between 31. 00 and 31.75 F . (7) Field and laboratory studies fully substantiate the original hypothesis that, under specified conditions, an abrupt 200-ohm increase of resistance of a plas-ter-of-paris soil-moisture unit indicates the commencement of crystallization of soil moisture.
Discussion C A R L B . CRAWFORD, Division of Building Research, National Research Council, Ottawa, Canada—Advancements in instrumentation in recent years have encouraged large-scale studies of the variation in soil temperatures and soil moisture content. Considerable interest has been shown in attempts to predict frost penetration in various soils and efforts have been made to establish the frost line by nondestructive methods.
Correspondingly, attempts have been made to simplify the determination of the frost line by direct measurement. A simple boring tool for this purpose is described in detail by Gk)odell (1.). Another method (2), developed in France, employs a series of capillary tubes which are installed m the ground and may be withdrawn periodically to obtain a direct observation on the region of freezing.
Many observers are content to determine the position of the frost line by interpolation of soil temperatures measured m a vertical profile. It has been established by the authors and others, notably the Corps of Engineers (3), that it is reasonably accurate to assume that the frost line occurs at the 32-F. isotherm. The fact that the position of the frost line can be estimated at any time by interpolation of temperatures appears to be an advantage over the use of moisture meters for this purpose. A further disadvantage to the use of moisture meters for locating the frost line is that continuous readings are required to establish the time of initial crystallization.
Consequently, the electrical-resistance method appears to have no advantage over temperature-sensing elements in field installations which are read periodically. It is probably, however, that electrical-resistance units could be used to advantage for detailed studies of freezing phenomena.
The detection of freezing by means of the change in dielectric constant was reported by Powers and Brownyard in 1947 (4). This test I S based on the fact that the dielectric constant for water is about 80 and that of ice about 4.
A good review of work on the freezing point of soil moisture is given in a paper by Richards and Campbell (5) in which it is pointed out that the preparation of samples for laboratory tests may have an appreciable effect on results. For this reason it is important that the exact procedure be described in reporting work of this nature.
Ground-temperature records are now being collected at ten locations in Canada by the Division of Building Research of the National Research Council. Most of this work is being done jointly with other organizations. In all cases the depth of frost I S determined by interpolation of the temperature profile assuming that the frost line and the 32-F. isotherm coincide.
In addition to the temperature observations, an attempt is now being made to collect depth of frost information at 13 locations across Canada. In order to simplify the field work, records include only date, location, depth of frost, soil type, and surface cover conditions. It is
21
hoped that a comparison of these records with air temperature records will assist in the empirical approach to the prediction of frost penetration. If preliminary work is successful, this frost survey will be extended to include more regional variations in climate.
Closely linked with the work on ground
temperatures is a study of soil moisture fundamentals. The first stage of this study was a review of literature on nondestructive methods of measuring soil moisture content (6). Apparatus I S now being assembled for the evaluation of electrical resistance suction meters.
References 1. Goodell, B. C . , "Soil Boring Tool
for Frost Depth Determination", Journal of Forestry, Vol. 37, .No. 6, pp. 457-459 (1939).
2. Cailleux, A, and Thellier, E . , "Determination of the Thickness of Frozen Ground". U. S. Dept. of the Interior, Geological Survey, Translation No. 27, 1951, 3 pp.
3. "Report on Frost Investigation 1944-45", U.S. Corps of Engineers, New England Division, 1947.
4. Powers, T. C. and Brownyard, T, L . "Studies of the Physical Properties of Hardened Portland Cement Paste", Port
land Cement Association Bulletin No. 22, 1948, 304 pp. (Reprinted from Proceedings, Journal American Concrete Institute, October 1946 to April 1947).
5. Richards, L . A. and Campbell, R. B . , "The Freezing Point of Moisture in Soil Cores", Proceedings, Soil Science Society of America, Vol. 13, pp. 70-74 (1948).
6. Penner, E . , Crawford, C. B . , and Eden, W. J . , "The Measurement of Moisture Content", Proceedings, Building Research Conference, National Research Council, Canada, October 1953.
Frost Action on Small Footings W. A. TROW, Assistant Engineer, Hydro Electric Power Company, Toronto, Ontario, Canaila
Frost heave of small footings is aperiodic trouble at transformer stations of the Ontario Hydro Electric Power Commission. Warped transformer pads, opened switches and distorted service boxes are among the disturbances arising during the winter months. This paper summarizes the results of laboratory and field investigations, made during the last 4 years,, to determine ways of controlling footing heave.
Initial laboratory tests indicated that the grip between frozen soil and concrete was of the order of 400 psi. at - 10 F . These results confirmed measurements made in Siberia approximately 18 years ago. During the last two winters various proposals for heave control were tried on an installation of small footings, placed in a frost susceptible soil 40 miles north of Toronto. Low temperature grease, polyethylene covers, gravel backfill, and soil treatment with a waste product of the pulp and paper industry were among the measures used to reduce the grip between the frozen soil and ..oncrete. Reaction to the heaving forces was also provided by subjecting the footings to various loads or by equipping them with enlarged pads below the frost line.
During the winter of 1951-52, untreated footings having a buoyed weight of approximately 150 lb. heaved as much as 4 inches; greased footings moved about this amount. Frost penetration that year was 12 inches. The following winter was mild and the maximum heave of untreated footings was less than 2 inches. Less movement Twas obtained under higher loads, however, and footings equipped with concrete pads did not move at all. The greased footings under loads of 350 lb. and above did not move.
An analysis of the frost heave problem, based on these observations, resulted in the preparation of an approximate chart which indicates the bearing pressure required to overcome footing heave. It suggests that the cross-section of footings within the zone of freezing should be made as small as possible, consistent with the structural strength of the concrete. Below this depth the footings should be enlarged to transmit the footing load to the soil safely. The use of low temperature grease was also recommended for special applications such as conduits etc. where a reaction force is not obtainable. Field observations are continuing to assess the resistance of these footings under moi'e-severe winter conditions.
• THIS paper deals with the problem of sleeve. However, most of these frost-frost action on and associated heave of control proposals have been ineffective, small footings founded below the zone of and a more-thorough study of the prob-freezing. Footing heave is a nuisance lem was begun early in 1950. problem that besets many of the transformer and distributing stations of the Ontario Hydro and other utilities each winter, causing switches to be opened, the dis- In order to ascertain the magnitude of tortion of service boxes and other minor the forces associated with footing heave, disturbances. the first step in the investigation was to
To date measures for controlling these measure the grip which develops between movements include the provision of foot- frozen soil and concrete. This was done ings with smooth, tapered sides to reduce using the simple arrangement shown m the vertical component of the heaving force Figure 1. Saturated soil was placed in-and gravel backfill to discourage the for- side the hollow concrete prism and frozen mation of ice layers. A satisfactory solu- for 24 hours at - 10 F . The specimen was tion for meter houses has been obtained then placed in a compression machine and by placing each footing in a grease-packed the force required to free the frozen plug
22
INITIAL STUDIES
23
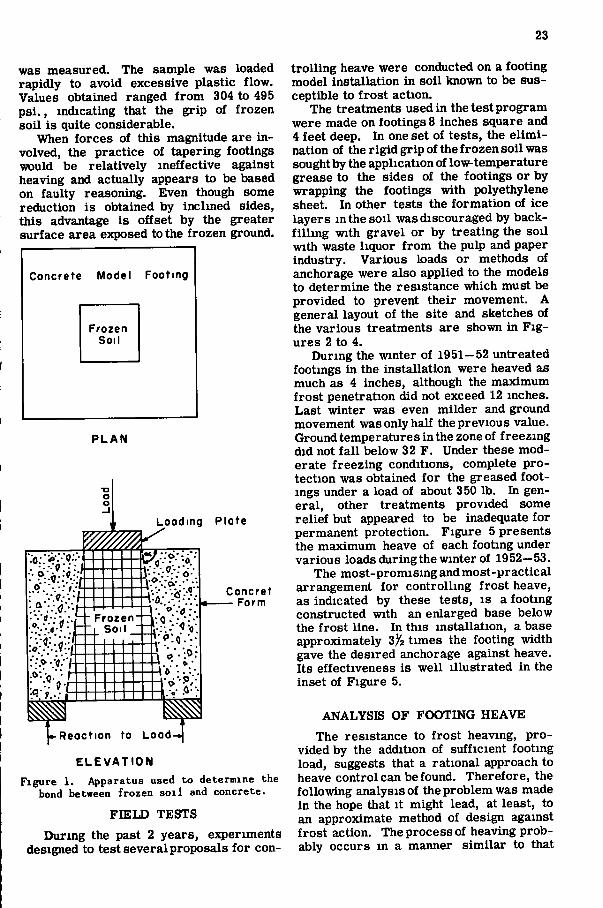
was measured. The sample was loaded rapidly to avoid excessive plastic flow. Values obtained ranged from 304 to 495 psi . , indicating that the grip of frozen soil is quite considerable.
When forces of this magnitude are involved, the practice of tapering footings would be relatively ineffective against heaving and actually appears to be based on faulty reasoning. Even though some reduction is obtained by inclined sides, this advantage is offset by the greater surface area exposed to the frozen ground.
Concrete Model Footing
Frozen Soil
P L A N
Loading Plate
Frozen -M Soil
Concret Form
-Reaction to Load
E L E V A T I O N Figure 1. Apparatus used to determine the
bond between frozen so i l and concrete.
F I E L D TESTS
During the past 2 years, experiments designed to test several proposals for con
trolling heave were conducted on a footing model installation in soil known to be susceptible to frost action.
The treatments used in the test program were made on footings 8 inches square and 4 feet deep. In one set of tests, the elimination of the rigid grip of the frozen soil was sought by the application of low-temperature grease to the sides of the footings or by wrapping the footings with polyethylene sheet. In other tests the formation of ice layers m the soil was discouraged by backfilling with gravel or by treating the soil with waste liquor from the pulp and paper industry. Various loads or methods of anchorage were also applied to the models to determine the resistance which must be provided to prevent their movement. A general layout of the site and sketches of the various treatments are shown in F ig ures 2 to 4.
During the winter of 1951—52 untreated footings in the installation were heaved as much as 4 inches, although the maximum frost penetration did not exceed 12 inches. Last winter was even milder and ground movement was only half the previous value. Ground temperatures in the zone of freezing did not fall below 32 F . Under these moderate freezing conditions, complete protection was obtained for the greased footings under a load of about 350 lb. In general, other treatments provided some relief but appeared to be inadequate for permanent protection. Figure 5 presents the maximum heave of each footing under various loadsduringthe winter of 1952—53.
The most-promising and most-practical arrangement for controlling frost heave, as indicated by these tests, is a footing constructed with an enlarged base below the frost line. In this installation, a base approximately 3^2 times the footing width gave the desired anchorage against heave. Its effectiveness is well illustrated in the inset of Figure 5.
ANALYSIS OF FOOTING HEAVE
The resistance to frost heaving, provided by the addition of sufficient footing load, suggests that a rational approach to heave control can be found. Therefore, the following analysis of the problem was made in the hope that it might lead, at least, to an approximate method of design against frost action. The process of heaving probably occurs in a manner similar to that
24
O
O
o Movst
• 2
• J
• *
a / Q/s O O
• 2/ Q / j a 7
2f O
2« • /2 a
I
^ i
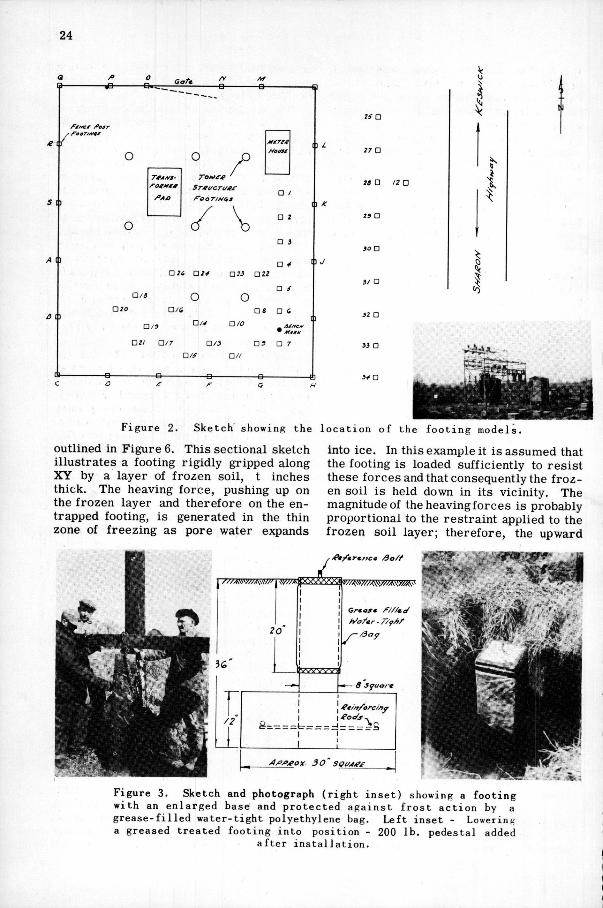
Figure 2. Sketch showing the locat ion of the footing models.
outlined in Figure 6. This sectional sketch illustrates a footing rigidly gripped along X Y by a layer of frozen soil, t inches thick. The heaving force, pushing up on the frozen layer and therefore on the entrapped footing, is generated in the thin zone of freezing as pore water expands
I^VYVY
into ice. In this example it is assumed that the footing is loaded sufficiently to resist these forces and that consequently the frozen soil is held down in its vicinity. The magnitude of the heaving forces is probably proportional to the restraint applied to the frozen soil layer; therefore, the upward
Figure 3. Sketch and photograph (right inset ) showing a footing with an enlarged base and protected against f ros t act ion by a grease-f i l led water-tight polyethylene bag. Left inset - Lowering a greased treated footing into position - 200 lb. pedestal added-
I after insta l lat ion .
25
5/c«*'a
Anchor ^oe/
2 0
1-8
16
1-4
12
10
0 8
0-4
02
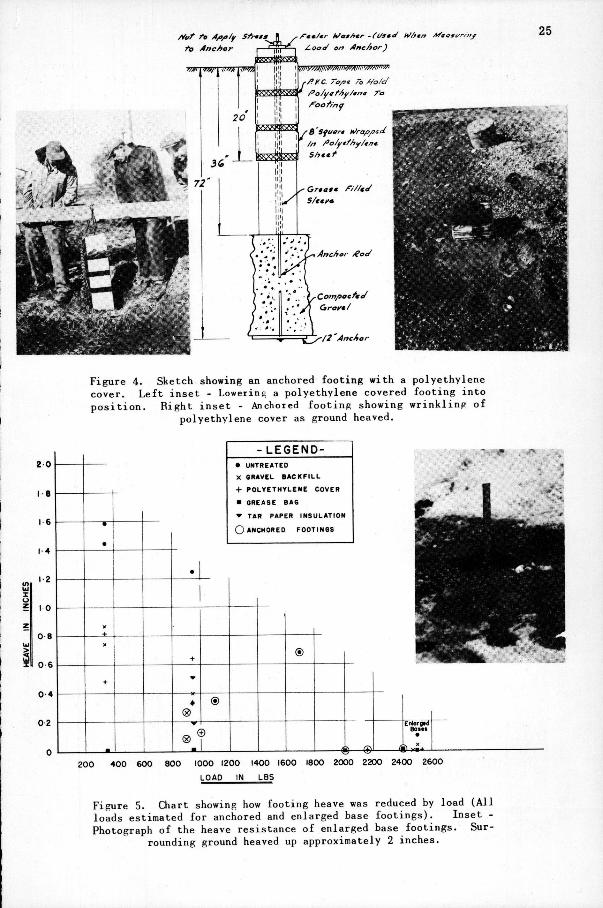
Figure 4. Sketch showing an anchored footing with a polyethylene cover. Lef t inset - Lowering a polyethylene covered footing into posi t ion. Right inset - Anchored footing showing wrinklinp of
polyethylene cover as ground heaved.
L E G E N D -• UNTREATED
X SR«VEL B A C K F I L L
+ P O L Y E T H Y L E N E COVER
• GREASE BAG
^ TAR PAPER INSULATION
O ANCHORED F 0 0 T I N 8 S
®
® ®
®
EnlorgtJ B a m
200 400 600 800 1000 1200 1400 1600 1800 2000 2200 2400 2600 LOAD IN LBS
Figure 5. Chart showing how footing heave was reduced by load (Al l loads estimated for anchored and enlarged base footings). Inset -Photograph of the heave resistance of enlarged base footings. Sur
rounding ground heaved up approximately 2 inches.
26
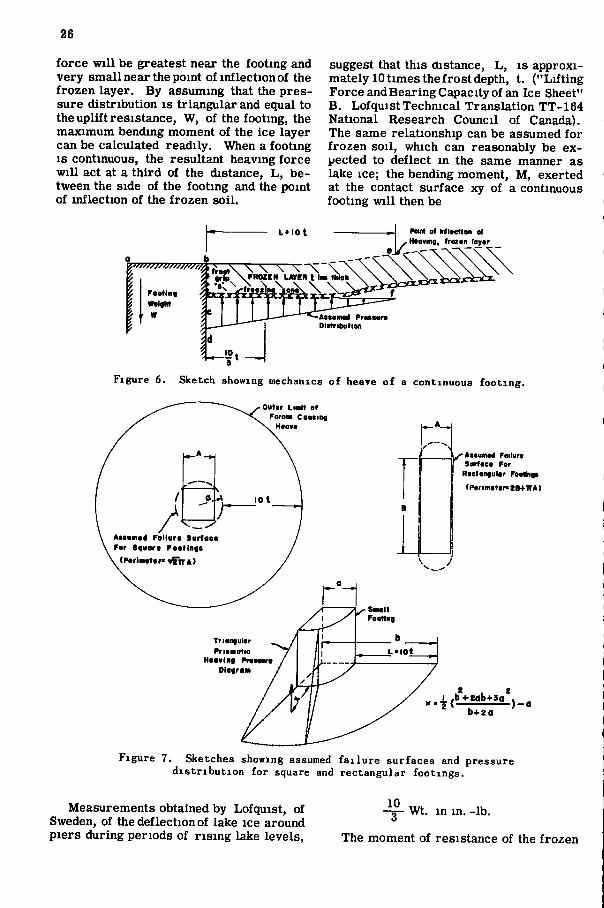
force will be greatest near the footing and very small near the point of inflection of the frozen layer. By assuming that the pressure distribution is triangular and equal to the uplift resistance, W, of the footing, the maximum bending moment of the ice layer can be calculated readily. When a footing I S continuous, the resultant heaving force will act at a third of the distance, L , between the side of the footing and the point of inflection of the frozen soil.
suggest that this distance, L , is approximately 10 times the frost depth, t. ("Lifting Force andBearing Capacity of an Ice Sheet" B. Lofquist Technical Translation TT-164 National Research Council of Canada). The same relationship can be assumed for frozen soil, which can reasonably be expected to deflect in the same manner as lake ice; the bending moment, M, exerted at the contact surface xy of a continuous footing will then be
Pomt of Mltctlon of Hoomng, froion loyor
L * I O t
\ \ \ \ ^ FROZEN LWERt lno
Figure 6. Sketch showing mechanics of heave of a continuous footing.
Outor Limit of Forut Cooling
Hoovo
Aooonod F o l l v r i Sorfaoo For Sgvort Feoflngo
(Porlmtor«if lT*)
^Asiumod Foiluro Sorfoco For
Roetongolor FooDngt
(P«riiiiattrc2B+ir*)
Triongulor Pritmotie
Hoavinf Proowiro Ologroni
S m I I Footliig
L > l 0 t
l^b+Mb+3a b+ea
Figure 7. Sketches showing assumed fa i lure surfaces and pressure distribution for square and rectangular footings.
Measurements obtained by Lofquist, of Sweden, of the deflection of lake ice around piers during periods of rising lake levels,
10 3 Wt. in in. -lb.
The moment of resistance of the frozen
27
soil at this surface is equal to the product of the section modulus of the frozen ground and the frost grip, f, along xy. Using the value f = 400 psi . , the ultimate bending resistance, Mr, along a footing of perimeter P becomes 66.7 Pt^ in.-lb. Hence the load, W, required to prevent heaving of a continuous footing is equal to 20 Pt lb.
Any segment of the heaving-pressure diagram bounding this circle will have the shape of a triangular prism with a center of gravity located at a distance from the circle:
S M A L L F O O T I N G S
7 Frott Dtpth'ZO
20
Dtplh> 10
protlDtplli'S'
nrMtDtpth ' l
P E R I M E T E R A R E A R A T I O IN I N C H E S
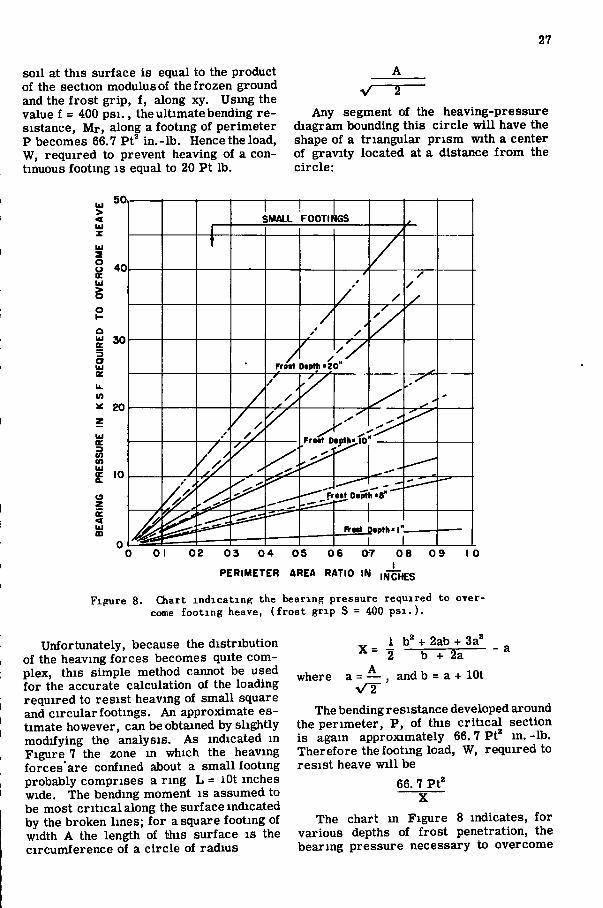
Figure 8. Oiart indicating the bearing pressure required to overcome footing heave, ( frost grip S = 400 p s i . ) .
Unfortunately, because the distribution of the heaving forces becomes quite complex, this simple method cannot be used for the accurate calculation of the loading required to resist heaving of small square and circular footings. An approximate estimate however, can be obtained by slightly modifying the analysis. As indicated m Figure 7 the zone m which the heaving forces'are confined about a small footing probably comprises a ring L = iOt inches wide. The bending moment is assumed to be most critical along the surface indicated by the broken lines; for a square footing of width A the length of this surface is the circumference of a circle of radius
1 b' + 2ab + 3a'' ^ = 2 b + 2a ^
where a = — , and b = a + lOt V T
The bending resistance developed around the perimeter, P, of this critical section is again approximately 66. 7 Pt* in. -lb. Therefore the footing load, W, required to resist heave will be
66. 7 Pt*
The chart m Figure 8 indicates, for various depths of frost penetration, the bearing pressure necessary to overcome
28
footing heave. The size of the footings is expressed by the ratio of their perimeter to area, a quantity which becomes larger as the size of the footings decreases. It is immediately apparent from the chart that the bearing pressure required for small footings is much higher than can be applied safely to most soils. Since it is unlikely that small footings would be designed to withstandsuchhighbearingpressures, they require some special treatment or modification to make them invulnerable to frost action.
PROPOSED FROST-HEAVE CONTROL MEASURES
Although small footings are susceptible to frost heave •when they conform to orthodox design, a simple modification should
provide the necessary resistance. To achieve this resistance the cross-section of the portion of the footing within the zone of frost penetration should be as small as possible; reference to Figure 8 wi l l assist the selection of proper footing size. Below the frost zone the base of the footing can be enlarged to transmit the load safely to the soil.
For such applications as ground-entry point of cables and conduits, where adequate heave resistance cannot be obtained by design or loading, grease-packed sleeves should provide immunity from frost action. Sleeves can also be used to protect the benchmarks and monuments established by surveyors. In many instances these reference points have approximately the same dimensions as the footing models used in the present experiments and therefore are highly vulnerable to frost action.
Discussion HAMILTON CaiAY, Soils Engineer, Maine Highway Department—The subject of Trow's investigation is one which has also interested the writer for a number of years, primarily because it seems to offer a relatively inexpensive way of accumulating fundamental data on frost action for the purpose of obtaining a more-complete understanding of this phenomenon. This is not to imply that the investigation lacks considerable practical value, since although the actual cost of the type of installation studied by Trow is relatively small, the total investment m all similar installations represents a large sum of money. Similarly, when such an installation requires maintenance or some form of rehabilitation as a result of frost action, the cost is not excessively great. However, such maintenance is required on many similar installations. Therefore, in the aggregate, the necessary expenditures total a large sum.
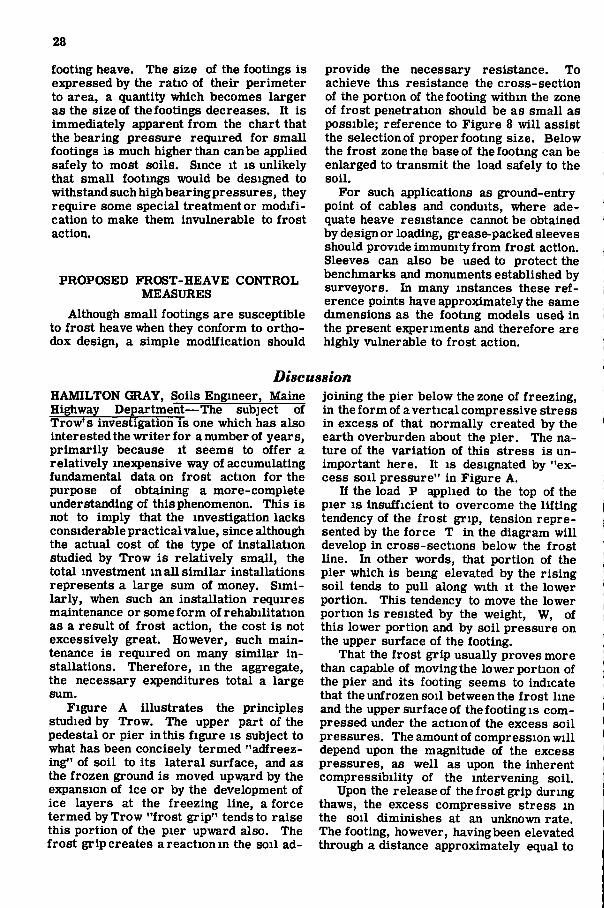
Figure A illustrates the principles studied by Trow. The upper part of the pedestal or pier in this figure is subject to what has been concisely termed "adfreez-ing" of soil to its lateral surface, and as the frozen ground is moved upward by the expansion of ice or by the development of ice layers at the freezing line, a force termed by Trow "frost grip" tends to raise this portion of the pier upward also. The frost grip creates a reaction in the soil ad
joining the pier below the zone of freezing, in the form of a vertical compressive stress in excess of that normally created by the earth overburden about the pier. The nature of the variation of this stress is unimportant here. It is designated by "excess soil pressure" in Figure A.
If the load P applied to the top of the pier is insufficient to overcome the lifting tendency of the frost grip, tension represented by the force T in the diagram will develop in cross-sections below the frost line. In other words, that portion of the pier which is being elevated by the rising soil tends to pull along with i t the lower portion. This tendency to move the lower portion is resisted by the weight, W, of this lower portion and by soil pressure on the upper surface of the footing.
That the frost grip usually proves more than capable of moving the lower portion of the pier and its footing seems to indicate that the unfrozen soil between the frost line and the upper surface of the footing is compressed under the action of the excess soil pressures. The amount of compression will depend upon the magnitude of the excess pressures, as well as upon the inherent compressibility of the intervening soil.
Upon the release of the frost grip during thaws, the excess compressive stress in the soil diminishes at an unknown rate. The footing, however, having been elevated through a distance approximately equal to
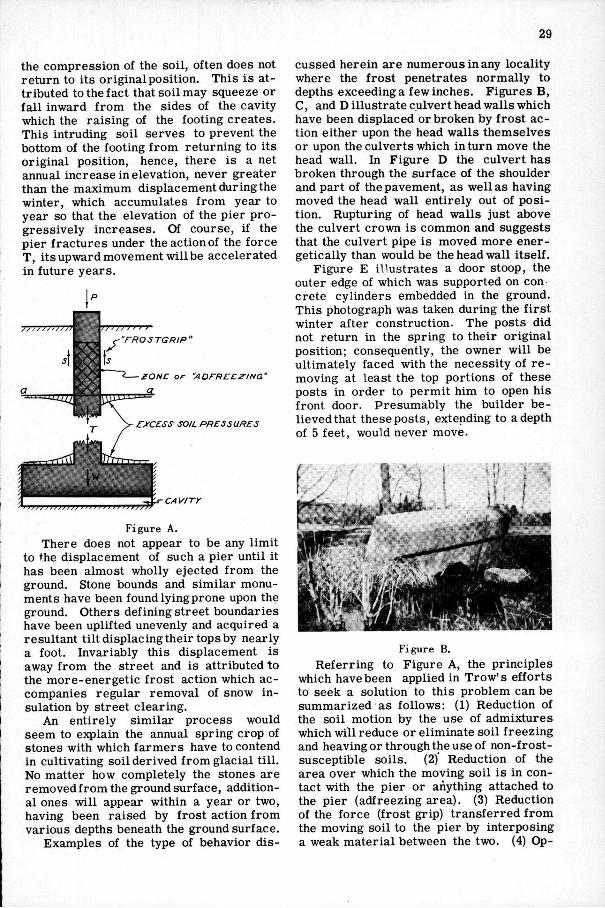
the compression of the soil, often does not return to its original position. This is attributed to the fact that soil may squeeze or fall inward from the sides of the cavity which the raising of the footing creates. This intruding soil serves to prevent the bottom of the footing from returning to its original position, hence, there is a net annual increase in elevation, never greater than the maximum displacement during the winter, which accumulates from year to year so that the elevation of the pier progressively increases. Of course, if the pier fractures under the action of the force T, its upward movement will be accelerated in future years.
/HI >' I >
"rROSTGRIP"
ZONC or "AOrRCC^ING
3.
EXCESS SOIL PRESSURES
Figure A. There does not appear to be any limit
to the displacement of such a pier until it has been almost wholly ejected from the ground. Stone bounds and similar monuments have been found lying prone upon the ground. Others defining street boundaries have been uplifted unevenly and acquired a resultant tilt displacing their tops by nearly a foot. Invariably this displacement is away from the street and is attributed to the more-energetic frost action which accompanies regular removal of snow insulation by street clearing.
An entirely similar process would seem to explain the annual spring crop of stones with which farmers have to contend in cultivating soil derived from glacial till. No matter how completely the stones are removed from the ground surface, additional ones will appear within a year or two, having been raised by frost action from various depths beneath the ground surface.
Examples of the type of behavior dis
cussed herein are numerous in any locality where the frost penetrates normally to depths exceeding a few inches. Figures B, C, and D illustrate culvert head walls which have been displaced or broken by frost action either upon the head walls themselves or upon the culverts which in turn move the head wall. In Figure D the culvert has broken through the surface of the shoulder and part of the pavement, as well as having moved the head wall entirely out of position. Rupturing of head walls just above the culvert crown is common and suggests that the culvert pipe is moved more energetically than would be the head wall itself.
Figure E illustrates a door stoop, the outer edge of which was supported on con Crete cylinders embedded in the ground. This photograph was taken during the first winter after construction. The posts did not return in the spring to their original position; consequently, the owner will be ultimately faced with the necessity of removing at least the top portions of these posts in order to permit him to open his front door. Presumably the builder believed that these posts, extending to a depth of 5 feet, would never move.
Figure B. Referring to Figure A, the principles
which have been applied in Trow's efforts to seek a solution to this problem can be summarized as follows: (1) Reduction of the soil motion by the use of admixtures which will reduce or eliminate soil freezing and heaving or through the use of non-frost-susceptible soils. (2)' Reduction of the area over which the moving soil is in contact with the pier or anything attached to the pier (adfreezing area). (3) Reduction of the force (frost grip) transferred from the moving soil to the pier by interposing a weak material between the two. (4) Op-
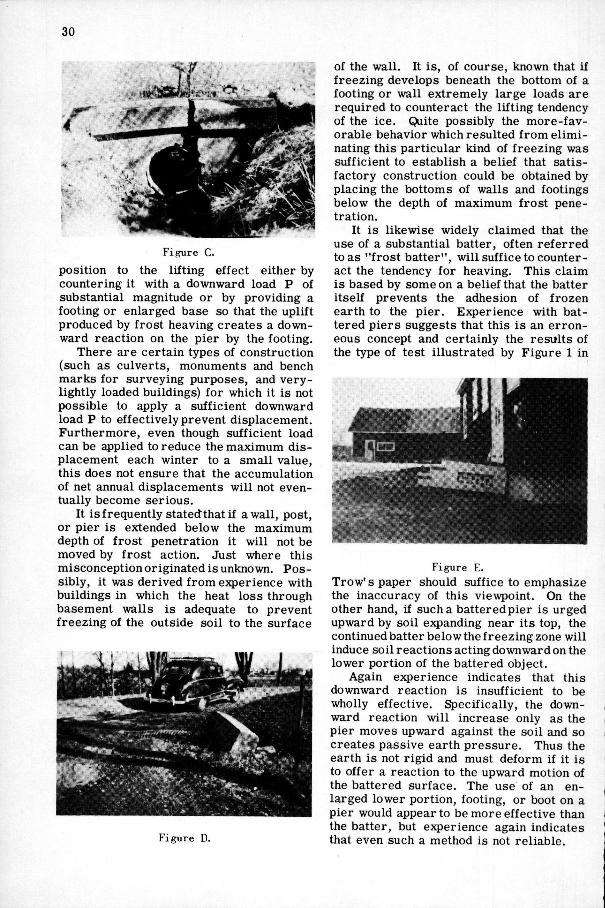
30
Figure C. position to the lifting effect either by countering it with a downward load P of substantial magnitude or by providing a footing or enlarged base so that the uplift produced by frost heaving creates a downward reaction on the pier by the footing.
There are certain types of construction (such as culverts, monuments and bench marks for surveying purposes, and very-lightly loaded buildings) for which it is not possible to apply a sufficient downward load P to effectively prevent displacement. Furthermore, even though sufficient load can be applied to reduce the maximum displacement each winter to a small value, this does not ensure that the accumulation of net annual displacements will not eventually become serious.
It is frequently statedthat if a wall, post, or pier is extended below the maximum depth of frost penetration it will not be moved by frost action. Just where this misconception originated is unknown. Possibly, it was derived from experience with buildings in which the heat loss through basement walls is adequate to prevent freezing of the outside soil to the surface
of the wall. It is, of course, known that if freezing develops beneath the bottom of a footing or wall extremely large loads are required to counteract the lifting tendency of the ice. Quite possibly the more-favorable behavior which resulted from eliminating this particular kind of freezing was sufficient to establish a belief that satisfactory construction could be obtained by placing the bottoms of walls and footings below the depth of maximum frost penetration.
It is likewise widely claimed that the use of a substantial batter, often referred to as "frost batter", will suffice to counteract the tendency for heaving. This claim is based by some on a belief that the batter itself prevents the adhesion of frozen earth to the pier. Experience with battered piers suggests that this is an erroneous concept and certainly the results of the type of test illustrated by Figure 1 in
Figure D.
Figure E. Trow's paper should suffice to emphasize the inaccuracy of this viewpoint. On the other hand, if such a battered pier is urged upward by soil expanding near its top, the continued batter below the freezing zone will induce soil reactions acting downward on the lower portion of the battered object.
Again experience indicates that this downward reaction is insufficient to be wholly effective. Specifically, the downward reaction will increase only as the pier moves upward against the soil and so creates passive earth pressure. Thus the earth is not rigid and must deform if it is to offer a reaction to the upward motion of the battered surface. The use of an enlarged lower portion, footing, or boot on a pier would appear to be more effective than the batter, but experience again indicates that even such a method is not reliable.
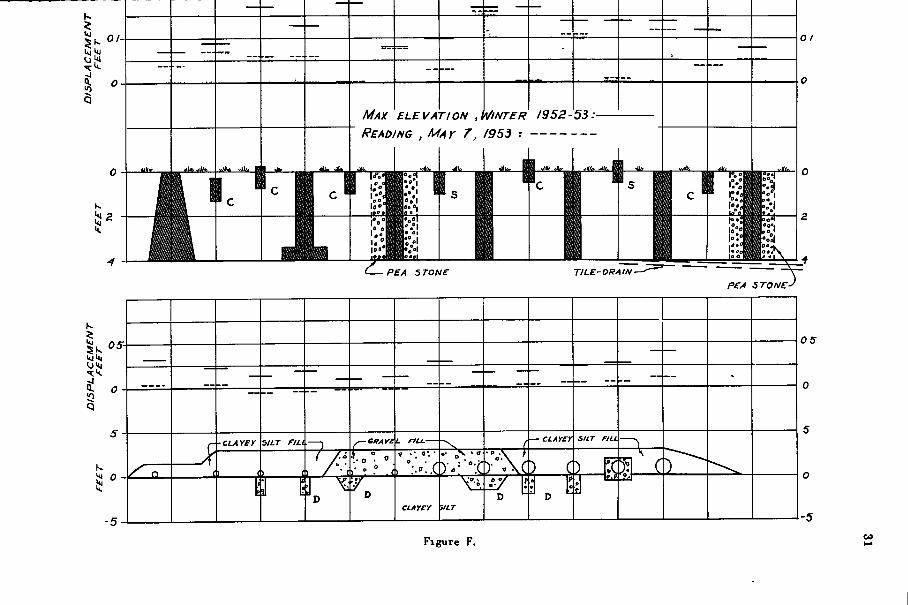
MAX ELEVATION ,MNTER /952-53:-
READING , MAY 7, 1955
PEA STONE TILE-DRAIN
0 I
'-
— — -
/ n k
c
- CLAYEY SILT FILL L riu.— i — CLAYEY SILT FILL
/ n k
c 1 ( ) ( A i » r ° •
V ••. «•. • > ° : - : ( . ) - - \ ° : ( ;
\ f ) : c i \ I ^ 0
CLAYEY tILT
i ^
0 5
-5 Figure F.
32
Observations of the behavior of light buildings without basements which are supported by short timber posts or concrete piers indicates that certain of these posts or piers periodically move to a much greater extent than others, even though the soil conditions appear to be uniform throughout the building area. Many concrete posts or piers with battered sides extending well below the maximum depth of frost penetration have been observed to move progressively until the supported structure is badly distorted.
In one instance a canning factory was supported on cedar posts approximately 20 percent of which moved upward during each winter and remained in an elevated position after each spring thaw. It was then only necessary to saw off afew inches from the top of each such post to relevel the sills and floors of the building. Eventually such posts worked almost entirely out of the ground and had to be replaced. It appears fortunate in this instance that the support was of timber rather than concrete and that the maintenance work could be done when canning activity was nil.
In planning an additional building for this particular site, which was underlain by a glacial t i l l consisting primarily of clay containing many stones, i t was recommended that if posts or pedestals were to be used they be surrounded by granular material which, in turn, should be drained by means of clay tile. Owing to the very heavy floor loads, approximating 600 lb. per sq. f t . , it was found that such a type of construction would be approximately 50 percent more expensive than the utilization of a compacted gravel f i l l upon which a concrete floor slab could be directly laid. The cost of supporting the structure onpiersnot surrounded by drained gravel would have been approximately equal to the cost of a slab placed upon gravel f i l l but would not have offered the certainty of satisfactory performance inherent in the use of gravel f i l l .
Similar observations also indicate that when such structures are supported on posts bearing upon pads which rest on the surface of the ground, less trouble results than when the pads are buried. In the former case, loss of contact between post and pad is unusual, whereas in the latter they soon part company. Hence, although the building may become distorted during heaving weather, the original grades are likely to be regained automatically when
the ground thaws, and there is no net annual increase in elevation. Certainly the annual maintenance of this type of construction is less than where releveling must be accomplished each spring.
One form of protection not mentioned in the paper consists of supporting loads on steel rods or pipes which bear upon a pad or plate located below the frost line. A pipe of larger diameter, used as a loose sleeve extending from above the ground surface to the pad or plate, will move with the heaving ground without transferring any reaction to the smaller rod or pipe. This method is commonly used in northern New England for supporting light loads and is effective until the sleeve has been elevated so that its upper end is in contact with the supported structure. Thereafter the sleeve itself may tend to force the structure upward, although if the buried pad or plate I S securely anchored to the smaller rod this will help to resist upward motion. If wet earth or water collects between rod and sleeve and freezes, the sleeve becomes useless, and in certain soils, the sleeves may corrode fairly rapidly. However, the great majority of such installations appear to function in a thoroughly satisfactory manner.
Figure F illustrates typical installations, some of them rather similar to Trow's piers, which have been observed for the past 2 years. The lower portion of this figure shows experimental culverts under which various types of bedding have been utilized in order to determine the one most effective m reducing frost displacement. Where granular bedding has been used, certain beds (D) have free-draining outlets, while the other beds are simply laid in trenches without outlets.
Culverts which are not deeply buried tend to move upward progressively from winter to winter until they eventually become exposed at the roadway surface. Prior to that time upward displacement of the roadway surface over the culvert necessitates frequent maintenance, and during winter this results in a bump in the pavement surface. The upper portion of the figure illustrates various small piers and cylinders, some placed without any antiheave treatment and others installed in various ways intended to counteract movement by frost. Al l piers extend to a depth of 4 feet below ground surface. The smaller objects are either standard con-
33
Crete cylinders (C) or hollow steel cylinders with capped ends (S) of the same dimensions as the concrete cylinders.
It should be realized that only the accumulated behavior over a period of several years wil l furnish a reasonable indication of the effectiveness of various types of design. The results shown on the figure, which apply to a single year's observations only, indicate the maximum upward displacement occurring some time in the late winter or early spring. The resultant displacement representing the sum of the annual net increases in elevation appears to be more important from the economic standpoint than the maximum displacement attained in any single winter, although in certain types of installations the magnitude of displacement during the winter alone will be sufficient to cause considerable damage.
The immediate conclusion to be drawn from the data shown in Figure F is that while some designs appear more effective than others, none of those adopted have proven wholly effective. Whether in the course of 5 or 10 years there wil l be marked differences in the observed accumulated displacements remains to be seen. Owing to the differences in behavior which are commonly observed within a small area, such as may be covered by a single building, it is probable that behavior of various designs should be placed upon a statistical basis. In other words, the behavior of a substantial number of piers of a given design is likely to be somewhat erratic and the relative frequency of unsatisfactory behavior as compared with similar frequency with respect to a different design would provide a criterion for recommending one in preference to the other. It may prove impracticable to establish a design which is 100 percent effective at all times. This is particularly true in view of possible deficiencies in workmanship.
Consequently, it is the writer's belief that Trow's" work should be encouraged and extended in order that erratic behavior may not play an important part in the conclusions which may be drawn from such investigations.
In addition to the culvert behavior illustrated in Figure F, observations have been made on similar installations under actual roadways. In some cases behavior is contrary to what would logically be expected, and the difficulty has been traced to movement of benchmarks constructed of con
crete in accordance with some of the pier designs also shown m Figure F. We are thoroughly convinced that the only completely trustworthy benchmarks that should be used in making wintertime observations are those which are established on bedrock or upon substantially constructed heated buildings. Any monuments, irrespective of their design, tend to greater or less displacements whenever they are surrounded by freezing soil.
The installations and observations illustrated by Figure F have been made at the University of Maine. They represent part of a project which has been largely financed by a grant from the University's Coe Research Fund. The corrugated metal culvert pipes were generously provided by Bancroft and Martin Rolling Mills of Portland. For an associated similar project, corrugated metal pipe was furnished by the New England Metal Culvert Co. of Boston and concrete pipe by the Hume Pipe Co. of New England.
PHILIP KEENE, Engineer of Soils and Foundations, Connecticut Highway Department—The author is to be commended on presenting an interesting paper containing valuable data on a subject seldom investigated experimentally m the past. It is to be hoped that he will continue to work on this project and that Nature wil l provide him with colder winters than those of recent years so that his remedial devices wil l be severely tested.
The writer was asked to give in this discussion an account of differential frost heaving of a highway pavement that was related to the presence of pipe culverts of various sizes under the pavement. The highway is a part of Route 15 in Hartford, Connecticut, known as the Wilbur Cross Highway, where it crosses a flat swampy area called the South Meadows, located in the southeast corner of the city. The highway IS a four-lane expressway with a 10-foot raised median strip of grass. The section studied is about a mile long. The pavement is on a low fiU 4 to 7 feet high. The pavement is 9 inches of concrete, but not reinforced, laid in 1942. Subbase is 12 inches of bankrun gravel throughout. The embankment is chiefly organic clayey silt taken from the ditch excavations on both sides and from nearby borrow areas. Ground-water table under the pavement is 5 to 6 feet below pavement.
34
The bankrun-gravel subbase is a red gravel of Triassic origin, having approximately the following gradation:
100% passing 5-inch sieve 60% " y* " 20% " No. 40 " 10% " No. 100 " 8% " No. 200 " 2% so-called clay sizes
The portion passing the No. 40 sieve has not sufficient plasticity to permit making a plasticlimit test but that passing the No. 100 sieve was slightly plastic.
The silt is a gray organic clayey silt apparently deposited during past floods of the Connecticut River, Whose normal stream bed is 1/2 mile east of this swamp. The top of swamp is about 3 to 7 feet above normal river level. The clayey silt contains about 15 percent of fine sand 55 percent of the so-called silt sizes (greater than 0.005 mm.), and 30 percent of the clay sizes. Its liquid limit ranges from 37 to 26 and its plastic limit is about 24. Its natural water content varied between 45 percent and 26 percent of dry Weight, but in the embankment its water content is normally about 21 to 32 percent. Standard Proctor density is about 101 pcf. at 22 percent optimum water content.
My attention was first called to cracks in the pavement in October 1944. As the pavement surface at the cracks was flat then, differential frost heavmg due to the so-called chimney action was suspected. Al l cracks are transverse to the parkway. There are 30 cracks, of which'half extend a ful l pavement width (two 12-foot lanes) and half are only half width (one 12-foot lane). Of these, all but three are above or close to cross culverts. There are one ore more cracks in the pavement above or close to each of the four large (36-inch and 48-inch) cross culverts and similar cracks as 15 of the 29 small (12-inch) cross culverts. Thel2-inch culverts extend only under two lanes and the cracks appear only in the lanes under which the culvert is located. The 600 feet of longitudinal culvert caused no cracks.
In January 1945, 100 points were painted on* the centerlme of northbound and southbound lanes. E levations were read on them four times during that winter and the following spring. Most of the points were located at a crack or at transverse joints near the
crack, to furnish a profile of differential heaving extending for 25 to 50 feet on each side of a culvert. These readings verified the belief that excessive differential heaving at the culverts created a condition that resulted in the cracks. Furthermore, the worst differentia^l heaves become obvious to the motorist during the latter half of severe winters.
At this site the three requirements for frost heaves were present: cold temperature, silty or clayey soil, and high water table. The pavement heaved rather uniformly (Yi inch to i j i inches) between culverts, causing only three cracks in the mile of pavement. At the cross culverts , differential heaving (m excess of the uniform heaves) varied from Ys inch or 1 inch of rise in 10 feet to I inch or 1^ inch of rise in 15 feet or 20 feet. At the culverts, cold air inside the pipe apparently created an additional frost zone adjacent to the pipe circumference. The larger-diameter culverts caused more differential heaving and worse cracking of the pavement than the small culverts. The large culverts were less clogged with snow, had a larger zone of frost adjacent to their outef surface, had a larger cross-section areaforcold air per square foot of outer surface, and had a horizontal openmg at each end, whereas the 12- inch culverts connect at one end to two inlets which rise vertically to horizontal gratings at the gutters.
Pavement cracking at the 12-inch culverts was absent when the distance from top of pipe to bottom of subbase was more than about 24 feet. Also, it was absent when top of pipe was more than about 5 feet above ground-water table. Therefore, for conditions like those on this project, a rule might be established for cross culverts that when (I) average distances from top of pipe to top of pavement is less than 4 feet for pipes under 24 inch diameter or less than 5 feet for pipes 24 inches and larger and (2) pipe invert is less than 4 feet above wet ground (or ground-water table, in the case of cuts and shallow f i l l s ) , the pipe shall be surrounded by a 12-inch ring of gravel f i l l . This assumes the f i l l or cut material is a badly frost-heaving soil-silt or clay. If it contains a substantial amount of coarser material, the gravel f i l l can be omitted. The gravel f i l l should not be extended up to the pavement or subbase, as that would result in a depression if the high-•way heaves uniformly.
35
This treatment is not needed for longi- an earth f i l l above, as their roofs are too tudinal culverts, as they apparently have high above the ground-water table and they much weaker chimney action. It Is not are designed to avoid an accumulation of needed for bridges and box culverts having surface infiltration.
Some HRB Publications Relating to Frost
Bibliography 3: FROST ACTION IN SOILS (1948) 57 pp. (mimeo.) $.45. A chronologically arranged, annotated and indexed bibliography, containing important references from the year 1890 to 1948.
Bulletin 40: LOAD CARRYING CAPACITY OF HOADS AS AFFECTED BY FROST ACTION (1951) 38 pp. $. 75.
Contains a committee report involving tests conducted in six states, and the paper "The Effect of Temperature on the Bearing Value of Frozen Soils, " by Miles S. Kersten and Allen E. Cox.
Bulletin 54: LOAD CAPACITY OF ROADS AFFECTED BY FROST (1952) 17 pp. $.30. The fourth committee report of this project with the objective to determine the percentage loss of strength that may occur in highways subjected to freezing and thawing.
Bulletin 71: SOIL TEMPERATURE AND (HIOUND FREEZING (1953) 124 pp. $1.80. Contains the following studies: Cold-Room Studies of Frost Action in Soils, A Progress Report, James F. Haley; Frost Design Criteria for Pavements, Kenneth A. Linell; Soil-Temperature Comparisons Under Varying Covers, George A. Crabb, Jr., and James L. Smith; Calculation of Depth of Freezing and Thawing Under Pavements, Harry Carlson and Miles S. Kersten; Frost Action Research Needs, by A. W. Johnson and C. W. Lovell, Jr.
Bulletin 96: LOAD-CARRYING CAPACITY OF FROST-AFFECTED ROADS (1955) 23 pp. $.45.
Reports of Nebraska, Indiana and Oregon on road strength loss due to freezing and thawing action.
Bulletin 100: SOIL FREEZING (1955) 35 pp. $.60. Special Report 1: FROST ACTION IN ROADS AND AIRFIELDS, A REVIEW OF THE
LITERATURE, 1765-1951 (1952) 288 pp. $3.00. Presents a detailed study and review of important works on the subject. Includes 242 illustrations, a bibliography and a subject index.
Special Report 2: FROST ACTION IN SOILS, A SYMPOSIUM (1952) 385 pp. $3. 75. Because of the wide diversity of subjects in this symposium, the subject matter was divided into seven sub-units. These are: (1) Climate and Distribution of Soil, (two papers); (2) Soil Temperature and Thermal Properties of Soils, (four papers and discussion); (3) Soil Moisture and Moisture Movements, (seven papers); (4) Basic Data Pertaining to Frost Action, (eight papers); (5) Frost Action and Spring Breakup, (seven papers); (6) Remedies and Treatments, (seven papers); (7) Needed Research Pertaining to Frost Action, (two papers).
Research Report 10-D: COMMITTEE REPORT AND MANUAL OF RECOMMENDED TESTING PROCEDURES ON LOAD CARRYING CAPACITY OF ROADS AS AFFECTED BY FROST ACTION (1950) 18 pp. $. 45.
HKB « - 2 « 2
TH E NATIONAL A C A D E M Y OP S C I E N C E S — N A T I O N A L R E S E A R C H COUNC I L is a private, nonprofit organization of scientists, dedicated to the furtherance of science and to its use for the general welfare. The
A C A D E M Y itself was established in 1863 under a congressional charter signed by President Lincoln. Empowered to provide for all activities appropriate to academies of science, it was also required by its charter to act as an adviser to the federal government in scientific matters. This provision accounts for the close ties that have always existed between the A C A D E M Y and the government, although the A C A D E M Y is not a governmental agency.
The NATIONAL R E S E A R C H COUNCIL was established by the A C A D E M Y in 1916, at the request of President Wilson, to enable scientists generally to associate their efforts with those of the limited membership of the A C A D E M Y in service to the nation, to society, and to science at home and abroad. Members of the NATIONAL R E S E A R C H COUNCIL receive their appointments from the president of the ACADEMY, They include representatives nominated by the major scientific and technical societies, representatives of the federal government designated by the President of the United States, and a number of members at large. In addition, several thousand scientists and engineers take part in the activities of the research council through membership on its various boards and committees.
Receiving funds from both public and private sources, by contribution, grant, or contract, the A C A D E M Y and its R E S E A R C H COUNCIL thus work to stimulate research and its applications, to survey the broad possibilities of science, to promote effective utilization of the scientific and technical resources of the country, to serve the government, and to further the general interests of science.
The H I G H W A Y R E S E A R C H BOARD was organized November 11, 1920, as an agency of the Division of Engineering and Industrial Research, one of the eight functional divisions of the NATIONAL R E S E A R C H COUNCIL. The BOARD is a cooperative organization of the highway technologists of America operating under the auspices of the A C A D E M Y - C O U N C I L and with the support of the several highway departments, the Bureau of Public Roads, and many other organizations mterested in the development of highway transportation. The purposes of the BOARD are to encourage research and to provide a national clearinghouse and correlation service for research activities and mformation on highway administration and technologj'.