Embed Size (px)
Citation preview

Interim Report
Q3-16

INTERIM REPORT Q3 2016
HIGHLIGHTS Q3 2016
Operational EBIT of NOK 218 million, the highest in the history of NRS
o Operational EBIT before contracts per kg of NOK 34.15 in Region North
o Operational EBIT before contracts per kg of NOK 21.79 in Region South
o Return on average capital employed for the last four quarters is 50.6 per cent
Stable production costs in Region North and substantially lower
production costs in Region South
Harvested volume increased with 16 per cent and sold volume with 8 per cent compared with the corresponding period last year
Record high result before tax and fair value adjustments of NOK 269 million
Good fish health and sea lice situation for NRS
Strong salmon market driven by good demand and low supply growth
o High salmon price in the quarter
o Expect low long-term global supply growth, which continue to provide good price
expectations
Acquired 50 per cent of Arctic Fish ehf on Iceland
NORWAY ROYAL SALMON - KEY FIGURES Q3 Q3 YTD YTD FY
(NOK '000) 2016 2015 2016 2015 2015
Operating revenues 1 106 855 770 518 3 040 605 2 214 954 3 210 548
Operational EBITDA 233 190 36 328 584 507 149 814 255 591
Operational EBIT 218 112 22 649 539 742 111 045 201 894
Income from associates 15 222 12 482 61 132 10 239 22 754
EBIT 250 659 121 565 533 806 80 543 249 065
EBT 286 244 114 938 677 722 55 689 270 081
EPS (NOK) – before fair value adjustments 4,92 0,68 13,82 1,77 4,99
ROCE 1) 50,6 % 13,2 % 15,4 %
Net cash flow from operating activities 119 077 77 602 585 252 207 431 340 196
Investments in tangible f ixed assets/licences 14 660 28 236 54 216 71 209 212 750
Net interest-bearing debt -13 122 558 576 498 541
Equity ratio 50,0 % 38,3 % 41,3 %
Volume harvested (HOG) 7 537 6 519 22 127 19 652 27 903
Operational EBIT per kg 2) 30,35 9,24 27,11 8,39 9,64
Volume sold - Sales 17 662 16 333 49 097 49 413 69 971
2) Operational EBIT for segments incl margin from sales
1)ROCE: Return on average capital employed based on 4-quarters rolling EBIT
aligned for fair value adjustments / average (NIBD + Equity - Financial assets)

INTERIM REPORT Q3 2016
FINANCIAL PERFORMANCE
(Figures in brackets = 2015, unless otherwise specified)
Revenues and results Norway Royal Salmon posted operating revenues of NOK 1 106.9 million (NOK 770.5 million)
in the third quarter of 2016, an increase of 44 per cent from the corresponding prior-year
period. The Group achieved the highest operational EBIT in the history of NRS of NOK 218.1
million (NOK 22.6 million), an increase of NOK 195.5 million. The increase in revenues and
operational EBIT is due to higher prices and volume. The Group recognised positive fair value
adjustments of NOK 17.3 million (NOK 86.4 million), a decrease of NOK 69.1 million.
The farming business harvested 7 537 tonnes (6 519 tonnes) gutted weight in the quarter,
an increase of 16 per cent from the corresponding quarter last year. Including allocated
margins from sales, Farming achieved an operational EBIT per kg of NOK 30.35 (NOK 9.24).
The increase is due to higher prices. The Sales business sold 17 662 tonnes (16 333 tonnes),
an increase of 8 per cent.
Financial items and share of profit from associates
Result from associates totalled NOK 15.2 million (NOK 12.5 million) in the third quarter. NRS’
share of fair value adjustments of the biomass after tax amounted to NOK 10.4 million (NOK
8.1 million). Associated farming companies harvested 2 354 tonnes, 905 tonnes more than
last year. NRS share of the above figure amounts to 852 tonnes, an increase of 332 tonnes.
A gain of NOK 38.6 million (NOK 0.2 million) on TRS agreements on own shares was posted
in the quarter. Net interest expenses for the period were NOK 2.9 million (NOK 6.1 million),
a decrease of NOK 3.2 million because of lower interest bearing debt in the period.
Balance sheet At the end of the reporting period, total assets amounted to NOK 3 210 million, an increase
of NOK 374 million from the prior quarter end. The change in total assets is attributable to a
number of factors. Fair value adjustments of the biomass increased by NOK 6.9 million, while
inventories and biomass at cost increased by NOK 105.7 million. The net increase in
inventories and biological assets was NOK 112.6 million. Bank deposits increased by NOK
184.8 million as a result of the payment for the acquisition of Arctic Fish of NOK 268.5 million
being placed in a restricted bank account. Financial assets increased with NOK 5.4 million.
The Group’s receivables increased by NOK 71.7 million.
The Group’s net interest-bearing debt decreased by NOK 160.0 million, from NOK 146.9
million at the end of the previous quarter to NOK 13.1 as net bank deposit as of 30 September
2016. The decrease was mainly attributable to an operational EBITDA of NOK 233.2 million,
a realised gain on TRS-agreements of NOK 49.2 million and received dividends from
associated companies of NOK 6.9 million. Increased working capital of NOK 102.1 million and
investments in fixed assets of NOK 14.7 million had the opposite effect on the net interest-
bearing debt. At the end of the quarter, the Group had an unused long-term credit facility of
NOK 350 million and NOK 361 million in unused overdraft. The Group has restricted bank
deposits of NOK 373 million.
As of 30 September, the Group’s equity totalled NOK 1 605 million, an increase of NOK 237
million from the end of the previous quarter. The increase is attributable to a total
comprehensive income of NOK 236.7 million. At the end of the quarter, the equity ratio was
50.0 per cent.

INTERIM REPORT Q3 2016
Statement of cash flow The Group’s operating activities generated a positive cash flow of NOK 119.1 million during
the quarter, which represents an increase of NOK 42.4 million compared with the
corresponding prior-year quarter. The positive cash flow is attributable to an operational
EBITDA of NOK 233.2 million and an increase in accounts payables of NOK 101.0 million. An
increase in inventories at cost of NOK 105.8 million, a reduction in other short-term liabilities
of NOK 26.1 million, an increase in accounts receivables of NOK 48.0 million, an increase in
other receivables of NOK 22.7 million and a negative cash settlement on forward contracts of
NOK 12.5 million had an adverse effect on the cash flow.
Net cash inflows in connection with investing activities in the third quarter amounted to NOK
44.4 million (outflow of NOK 4.5 million), and is related to a gain on the realisation of TRS-
agreements of NOK 49.2 and received dividends from an associated company of NOK 6.9
million. The payments of NOK 14.7 million for investments in fixed assets had a negative
effect on the cash flow.
The net cash inflows from financing activities totalled NOK 21.3 million (outflow of NOK 40.3
million) in the third quarter. Interests paid and instalments amounted to NOK 3.5 million and
NOK 14.4 million respectively. Leasing liabilities rose by NOK 0.5 million and the bank
overdraft facility rose by NOK 38.7 million.
SEGMENT INFORMATION
The Group is organised into two business areas; Farming and Sales. The performance of the
two business areas is monitored with the overall objective of maximising Operational EBIT
per kg and margins.
The Farming business is divided into two geographical segments; Region North and Region
South. Norway Royal Salmon monitors overall value creation from operations based on the
salmon’s source of origin. Consequently, external reporting focuses on measuring the overall
profitability of the harvested volume based on source of origin (Operational EBIT/kg). For this
reason, the contribution from the sales operations is allocated to Region North and Region
South based on the volume harvested in the respective segments.
The Group owns 35 licences for the production of farmed salmon, divided between 29 licences
in Region North, located in Troms and western Finnmark, and 6 licences in Region South,
located in the area around Haugesund.
The business posted sales revenues of NOK 1 104.9 million in the third quarter (NOK 743.9
million), an increase of 49 per cent. The spot price (NASDAQ) for superior quality during the
quarter was NOK 59.52 per kg gutted weight, a reduction of 7 per cent from the second
quarter of 2016 and an increase of 46 per cent compared with the third quarter of 2015. The
sales operations experienced an increase in sales volumes of 8 per cent compared with the
corresponding prior-year period. 17 662 tonnes (16 333 tonnes) were sold in the third
quarter. The Sales business achieved an operational EBIT before open fixed-price contracts
of NOK 14.1 million (NOK 1.9 million), which equates to NOK 0.80 (NOK 0.12) per kg sold
volume in the period. The loss on open fixed-price contracts was NOK 23.1 million (NOK 0.0)
in the quarter.
The Farming operations harvested 7 537 tonnes (6 519 tonnes) gutted weight in the third
quarter, an increase of 16 per cent from the corresponding period last year. The estimated
harvest volume for 2016 is 26 700 tonnes gutted weight and 34 000 tonnes gutted weight for
2017. 10.1 million smolts were released in 2016.

INTERIM REPORT Q3 2016
REGION NORTH
Operational EBIT came in at NOK 220.3 million (NOK 60.2 million), an increase of NOK 160.1
million compared with the same quarter last year. Operational EBIT (ex. contracts) per kg
amounted to NOK 34.15 (NOK 9.69). Loss on fixed-price contracts of NOK 3.06 per kg
contributed to an operational EBIT per kg of NOK 31.09 (NOK 9.69).
7 086 tonnes (6 206 tonnes) were harvested in the region in the third quarter, an increase of
14 per cent. The achieved price for the Farming operations was NOK 21.88 per kg higher than
in the corresponding period last year. The average weight of harvested fish has contributed
positively to the price achievement, while contracts and a significant proportion of volume
being harvested in September, contributed negatively.
Production costs for harvested fish was NOK 0.34 lower than in the second quarter of 2016
and NOK 1.00 lower than in the corresponding period last year. The fish health and sea lice
situation is good in the region.
The estimated harvest volume for 2016 is 21 700 tonnes gutted weight and 27 500 tonnes
for 2017. 8.4 million smolts were released in 2016.
KEY FIGURES Q3 Q3 YTD YTD FY
(NOK '000) 2016 2015 2016 2015 2015
Operating revenues 1 038 773 708 256 2 621 419 1 787 663 2 607 395
Operational EBITDA 232 433 70 920 595 034 175 201 286 009
Operational EBIT 220 321 60 163 559 239 145 162 244 110
Investment in tangible and intangible assets 13 122 20 171 49 962 62 848 113 339
Volume harvested (tonnes) 7 086 6 206 19 055 16 164 22 971
Operational EBIT per kg (ex contracts) 34,15 9,69 31,59 8,98 10,63
Loss on open fixed price contracts -3,06 0,00 -2,24 0,00 0,00
Operational EBIT per kg 31,09 9,69 29,35 8,98 10,63
REGION SOUTH
Operational EBIT came in at NOK 8.5 million (NOK 0.1 million), an increase of NOK 8.4 million.
Operational EBIT (ex. contracts) per kg amounted to NOK 21.79 (NOK 0.24). Loss on fixed-
price contracts of NOK 3.06 per kg contributed to an operational EBIT per kg of NOK 18.73
(NOK 0.24).
451 tonnes (312 tonnes) were harvested in the region in the third quarter, an increase of 45
per cent from the corresponding prior-year period. The Farming operations achieved a price
of NOK 15.57 per kg higher than in the corresponding prior-year period.
The production costs for harvested fish is NOK 13.78 per kg lower than in the second quarter
of 2016 and NOK 4.40 lower than in the corresponding period last year. Improved operations
have resulted in lower production costs in the quarter. Region South achieved higher than
expected growth in the quarter.
Estimated harvest volume for 2016 is 5 000 tonnes gutted weight and 6 500 tonnes for 2017.
1.7 million smolts were released in 2016.

INTERIM REPORT Q3 2016
KEY FIGURES Q3 Q3 YTD YTD FY
(NOK '000) 2016 2015 2016 2015 2015
Operating revenues 66 135 35 650 415 842 394 682 568 585
Operational EBITDA 11 417 2 998 49 597 28 375 36 655
Operational EBIT 8 451 76 40 628 19 691 24 933
Investment in tangible and intangible assets 2 091 6 978 2 390 7 864 7 909
Volume harvested (tonnes) 451 312 3 071 3 488 4 932
Operational EBIT per kg (ex contracts) 21,79 0,24 15,50 5,65 5,05
Loss on open fixed price contracts -3,06 0,00 -2,27 0,00 0,00
Operational EBIT per kg 18,73 0,24 13,23 5,65 5,05
SHARES As of 30 September 2016 Norway Royal Salmon ASA had 43 572 191 shares, allocated among
1 643 shareholders, a reduction of 70 from the end of the previous quarter. At the end of the
quarter, the group had 98 279 treasury shares. The share price increased from NOK 122.50
at the end of June 2016 to NOK 141.00 at the end of September 2016. 6 708 188 shares
were traded during the quarter.
EVENTS IN OR SUBSEQUENT TO THE QUARTER
Contractual rights and TRS agreements for own shares During the third quarter, Norway Royal Salmon has extended TRS (Total Return Swap)
agreements. After this transaction Norway Royal Salmon owns or has a contractual right to
2 452 970 shares, which equates 5.63 per cent of the company’s share capital.
Sickness absence At 2.6 per cent, the Group’s sickness absence rate decreased by 1.3 per cent from the
previous quarter. The long-term absenteeism represents a substantial part of the absence.
Acquisition of 50 per cent of Arctic Fish ehf on Island
On the 23th August 2016, Norway Royal Salmon entered into an agreement to acquire 50 per
cent of Arctic Fish ehf. through a directed private placement in the amount of EUR 29 million.
The transaction will be financed through existing cash and loan facilities. The remaining 50
per cent ownership in Arctic Fish is owned by Bremesco Holding Ltd and Novo ehf, with 47.5
per cent and 2.5 per cent respectively.
Following the transaction, the Board of Arctic Fish will consist of two directors elected by
Norway Royal Salmon ASA and two chosen by Bremesco Holding. In addition, the parties will
together appoint an independent Chair of the Board so that the Board total will consist of five
members. The transaction will not lead to any changes in the management of Arctic Fish.
The investment in Arctic Fish is considered to be an associated company accounted for by the
equity method in Norway Royal Salmon ASA. The transaction was recognised in the accounts
in October 2016, when all the necessary approvals associated with the transaction were met.
Through the transaction, NRS is entering the salmon farming industry on Iceland. NRS
considers Iceland to be an exciting area with great growth potential, and will, through the
transaction, be in a position to take an active role in the development and consolidation of

INTERIM REPORT Q3 2016
the industry. Through the transaction, Arctic Fish will be able to capitalize on NRS’ competence
in salmon farming and sales. The goal is to build the leading fish farming company on Iceland.
Since the establishment of Arctic Fish in 2011, the company has positioned itself as one of
the leading trout- and salmon farming companies on Iceland. Arctic Fish’s operations are
concentrated in the Westfjords, which is a very attractive area for farming, with many similar
characteristics to Finnmark. Arctic Fish currently has licenses for a total allowed annual
production of 9 000 tonnes fish. Arctic Fish is currently building its own hatchery for smolt.
Following completion, the hatchery will have an annual capacity of around 7 million smolt.
The hatchery is strategically located in near proximity to the farm sites of Arctic Fish.
MARKET CONDITIONS
The total value of salmon exported from Norway in the third quarter was NOK 15.6 billion.
This is the highest export value in a quarter ever and an increase of 3.9 billion from the third
quarter of 2015. This represents an increase of 33 per cent. Exported volumes from Norway
was at the same level as last year, which means the increase in value was due to significantly
higher prices. Spot price (NASDAQ) in the third quarter of 2016 was NOK 59.52 per kg
superior quality salmon (delivered Oslo). This is the second highest spot price recorded in a
quarter in the past 20 years, only the second quarter of 2016 have had higher prices. In the
same period last year, the spot price NOK 40.71. The strong price growth is largely driven by
higher prices in local currency. In EUR, the prices of Norwegian salmon increased by 43 per
cent from EUR 4.47 per kg last year to EUR 6.40 per kg this year. Stable volume combined
with good underlying market development for Norwegian salmon in most markets has
contributed greatly to the high prices of salmon in the third quarter.
Although import of Norwegian salmon decreased by 0.6 per cent in the quarter, the demand
from EU has been good. The reduction is in line with the general decline in volume. As the
prices are clearly higher than last year, this indicates a good underlying demand. Although
the availability of volume decreased slightly and prices increased significantly, several
markets excel. Poland had the most positive development with a growth of 11 per cent, but
also the markets in UK, Germany and Belgium increased compared with last year. The
markets in Spain, Sweden and Italy fell somewhat as a result of the high price level. Poland
is the biggest market for Norwegian salmon with a market share of 15 per cent, followed by
France with 11 per cent.
Eastern Europe has had a clear decline in imports of Norwegian salmon in the recent quarters
and compared to last year the volumes fell by 32 per cent in the third quarter. The main
reason for the in volume reduction is lower exports to Belarus, Turkey, Ukraine and
Kazakhstan. Eastern Europe had a market share of Norwegian salmon at 2 per cent in the
third quarter.
Demand for Norwegian Salmon in Asia has had a good development for a long time, and the
import in Asia increased by 8 per cent in the third quarter. The Middle East, South-East Asia
and Japan increased their imports despite the high price increase in local currency. Countries
that developed favourably were Thailand, Singapore, Vietnam and Israel. Even with the
existing trade issues with China, we believe the underlying demand for salmon in the region
is good. Asia has a market share of Norwegian salmon at 15 per cent.

INTERIM REPORT Q3 2016
Demand for salmon in North America continue the positive trend from last year and earlier
this year. Imports of Norwegian salmon increased by 5 per cent compared to the same period
last year, driven by strong demand in for Norwegian salmon in the US. Weaker NOK against
USD and trade barriers in Russia and China provides opportunities for Norwegian salmon in
this region. North America represents 5 per cent of Norwegian salmon exports.
The NRS’ Sales operations had good profitability in the quarter and significantly better than
the third quarter last year. A good price achievement, better margins and higher volumes
have contributed positively to the profitability of the sales operations. 75 per cent of the
harvested fish were sold in the spot market in the third quarter, while 25 per cent was sold
at fixed prices. The fixed price contracts resulted in a loss of NOK 23.1 million compared to
the level of spot prices. Total sales volumes were better than expected in the third quarter,
and was 8 per cent higher than in the same quarter last year. With a substantially higher sold
volume, NRS experiences growth in most markets. The markets in Asia/USA had an increase
of 20 per cent in the third quarter. Higher average weight on the sold fish than earlier this
year has contributed to a shift of volume to Asia/USA. NRS had a growth of 2 per cent in the
second quarter in Western Europe. The export to Eastern Europe from NRS continues to fall
and fell by 2 per cent in the third quarter compared with the same period last year. The
volumes to Norway increased significantly because there was a higher level of fish of lower
quality. In the third quarter, Western Europe accounted for 72 per cent of the export volumes,
Asia accounted for 19 per cent, Eastern Europe accounted for 9 per cent, while the USA
accounted for 1 per cent. Domestic volume amounts to 14 per cent of the total sold volume.

INTERIM REPORT Q3 2016
OUTLOOK
Harvested volume for the quarter was 7 537 tonnes, 500 tonnes more than estimated at the
end of the last quarter. As a result of lower growth in Region North in the quarter, the
estimated volume for 2016 is reduced with 300 tonnes to 26 700 tonnes. The estimated
volume for 2017 is 34 000 tonnes, an increase of 27 per cent from 2016. The farming
operations has hedged prices for 1 804 tonnes for the fourth quarter of 2016 and 2 988 tonnes
for 2017.
In the third quarter, the supply of salmon to the global market was 8 per cent lower than the
year before. Export volumes from Norway were on the same level as last year, which means
the reduction globally is mainly due to significantly lower volumes from Chile. Lower volumes
and increased underlying demand contributed to a significant price increase for salmon in the
third quarter compared with the corresponding period last year. We expect that the global
decline in volume to continue through the first quarter of 2017, after that some growth is
expected. For 2016, a decrease in volume between 3 and 5 per cent from Norway and between
6 and 8 per cent globally is expected. The expected reduction from Chile is around 20 per
cent in 2016. Expectations for 2017 indicate a growth from 2016 between 2 and 5 per cent
driven mainly by growth from Norway and Chile. The supply growth will be lower at the
beginning of 2017 and is expected to be higher in the second half of 2017. A continued low
supply growth and good work in the markets provides the basis for a positive market outlook
for the industry. High price and large currency fluctuations can create uncertainty in the short
term in some markets, although the underlying demand is perceived as good in most markets
we trade.
NRS was awarded 10 licenses in 2014. This gives a possibility for 40 per cent organic growth
and a more sustainable production for NRS. The company has a strong focus on exploiting
the growth potential. NRS has received approval for releasing the planned number of triploid
salmon to the sea. Overall smolt releases for 2016 were 10.1 million smolts. Given the positive
market outlook in the coming years, with low supply growth, NRS expect that the new licenses
will contribute positively to the Group's results. NRS is satisfied that the farming operations
primarily are located in Troms and Finnmark, where there are good conditions for the
production of salmon at low production costs.
Helge Gåsø
Trondheim, 8 November 2016
Kristine Landmark
Marianne E. Johnsen
Chair Vice Chair
Inge Kristoffersen
Lars Måsøval
Trude Olafsen
Charles Høstlund
CEO

INTERIM REPORT Q3 2016
INTERIM REPORT
INCOME STATEMENT
Q3 Q3 YTD YTD FY
(NOK '000) 2016 2015 2016 2015 2015
Operating revenues 1 106 855 770 518 3 040 605 2 214 954 3 210 548
Cost of goods sold 805 295 660 357 2 258 500 1 883 775 2 707 071
Salaries 35 884 27 916 105 915 78 358 113 268
Depreciation 15 078 13 680 44 765 38 769 53 697
Other operating costs 32 486 45 916 91 684 103 008 134 618
Operational EBIT 218 112 22 649 539 742 111 045 201 894
Fair value adjustments 17 325 86 434 -67 068 -40 741 24 416
Income from associates 15 222 12 482 61 132 10 239 22 754
EBIT 250 659 121 565 533 806 80 543 249 065
Gain/loss on f inancial assets 38 586 216 156 580 -5 052 45 200
Other net f inancial items -3 001 -6 844 -12 663 -19 802 -24 184
EBT 286 244 114 938 677 722 55 689 270 081
Tax -58 110 -27 605 -115 015 -13 645 -32 498
Net profit/loss 228 134 87 333 562 707 42 044 237 582
Profit attributable to:
Parent company shareholders 223 364 90 692 549 884 44 827 229 633
Minority interests 4 770 -3 359 12 823 -2 783 7 950
Earnings per share (NOK) 5,14 2,08 12,64 1,03 5,28
Earnings per share - diluted 5,14 2,08 12,64 1,03 5,28
EXTENDED INCOME STATEMENT
Q3 Q3 YTD YTD FY
(NOK '000) 2016 2015 2016 2015 2015
Net profit/loss 228 134 87 333 562 707 42 044 237 582
Items to be reclassif ied to profit or loss:
Cash Flow hedges (net) 8 607 -8 079 48 843 -5 581 -362
Items not to be reclassif ied to profit or loss:
Actuarial gains on defined benefit plans (net) 0 0 0 0 4 749
Total comprehensive income 236 741 79 253 611 550 36 464 241 970
Total comprehensive income attributable to:
Parent company shareholders 231 971 82 612 598 728 39 247 234 020
Minority interests 4 770 -3 359 12 823 -2 783 7 950

INTERIM REPORT Q3 2016
BALANCE SHEET
(NOK '000) 30.09.2016 30.06.2016 31.12.2015 30.09.2015
Intangible assets 648 887 648 887 648 887 648 887
Property, plant and equipment 366 589 367 008 357 948 321 425
Non-current f inancial assets 239 647 234 283 190 385 155 871
Non-current assets 1 255 122 1 250 179 1 197 221 1 126 182
Inventory and biological assets 909 078 796 469 870 559 805 349
Receivables 672 785 601 130 601 126 514 715
Bank deposits, cash 373 419 188 587 201 339 114 804
Current assets 1 955 282 1 586 186 1 673 024 1 434 868
TOTAL ASSETS 3 210 405 2 836 365 2 870 245 2 561 051
Share capital 43 474 43 474 43 502 43 502
Other equity 1 531 949 1 299 836 1 070 287 875 084
Non-controlling interests 29 151 24 381 72 730 61 998
Equity 1 604 574 1 367 691 1 186 519 980 583
Pensions 12 480 12 480 12 480 18 733
Deferred tax 431 387 370 409 303 485 284 286
Provisions 443 867 382 888 315 965 303 019
Long-term interest-bearing debt 277 616 290 038 653 361 625 111
Short-term interest-bearing debt 82 681 45 401 46 519 48 269
Trade payables 570 282 469 223 530 430 461 337
Tax payable 5 764 5 764 3 180 74
Other current liabilities 225 621 275 360 134 271 142 659
Current liabilities 884 348 795 748 714 400 652 338
TOTAL EQUITY AND LIABILITIES 3 210 405 2 836 365 2 870 245 2 561 051

INTERIM REPORT Q3 2016
STATEMENT OF EQUITY
30.09.2016
(NOK '000) Share capital
Treasury
shares
Retained
earnings Total
Equity at 01.01.2016 43 572 -71 1 070 288 1 113 791 72 731 1 186 519
Total comprehensive income 0 0 598 728 598 728 12 823 611 550
Transactions with shareholders
Dividend 0 0 -111 773 -111 773 0 -111 773
Share based payment - 0 -10 892 -10 892 0 -10 892
Purchase/sale of treasury shares 0 -27 -1 540 -1 567 0 -1 567
Purchase minority interest 0 0 -13 598 -13 598 -56 402 -70 000
Other changes 0 0 737 737 0 737
Total transactions with shareholders 0 -27 -137 066 -137 094 -56 402 -193 496
Equity at 30.09.2016 43 572 -98 1 531 950 1 575 426 29 151 1 604 574
30.09.2015
(NOK '000) Share capital
Treasury
shares
Retained
earnings Total
Equity at 01.01.2015 43 572 -34 905 587 949 126 64 781 1 013 907
Comprehensive income 0 0 39 247 39 247 -2 783 36 464
Transactions with shareholders
Dividend 0 0 -65 353 -65 353 0 -65 353
Share based payment 0 0 -1 679 -1 679 0 -1 679
Purchase/sale of treasury shares 0 -37 -2 552 -2 589 0 -2 589
Other changes 0 0 -165 -165 0 -165
Total transactions with shareholders 0 -37 -69 749 -69 786 0 -69 786
Equity at 30.09.2015 43 572 -71 875 084 918 587 61 997 980 583
31.12.2015
(NOK '000) Share capital
Treasury
shares
Retained
earnings Total
Equity at 01.01.2015 43 572 -34 905 587 949 126 64 781 1 013 907
Total comprehensive income 0 0 234 020 234 020 7 950 241 970
Transactions with shareholders
Dividend 0 0 -65 353 -65 353 0 -65 353
Share based payment 0 0 -1 249 -1 249 0 -1 249
Purchase/sale of treasury shares 0 -37 -2 552 -2 589 0 -2 589
Other changes associated companies 0 0 -165 -165 0 -165
Total transactions with shareholders 0 -37 -69 319 -69 356 0 -69 356
Equity at 31.12.2015 43 572 -71 1 070 288 1 113 791 72 731 1 186 519
Equity allocated to parent company shareholders
Non-controlling
interestsTotal equity
Equity allocated to parent company shareholders
Non-controlling
interestsTotal equity
Equity allocated to parent company shareholders
Non-controlling
interests Total equity

INTERIM REPORT Q3 2016
STATEMENT OF CASH FLOW
Q3 Q3 YTD YTD FY
(NOK '000) 2016 2015 2016 2015 2015
Operational EBIT 218 112 22 649 539 742 111 045 201 894
Adjusted for:
Tax paid 0 0 0 -2 031 -2 031
Depreciation 15 078 13 680 44 765 38 769 53 697
Gains (-)/ losses (+) on disposal of non-current assets 0 0 10 1 -1
Share based payment 189 429 -10 892 -1 679 -1 249
Pension costs w ith no cash effect 0 0 0 0 78
Change in inventory / biomass -105 749 -45 460 -31 157 -11 946 -24 423
Change in debtors and creditors 53 010 21 284 21 502 49 383 25 101
Change in other current assets and other liabilities -61 563 65 021 21 282 23 889 87 130
Net cash flow from operating activities 119 077 77 602 585 252 207 431 340 196
Cash flow from investing activities
Proceeds from sale of property, plant and equipment 0 0 800 67 157
Payments for purchase of PPE and licenses -14 660 -28 236 -54 216 -161 209 -212 750
Proceeds from investments in non-current f inancial assets 56 091 23 695 173 787 122 444 127 999
Payments for investments in non-current f inancial assets 0 0 0 -2 641 -4 641
Payments for acquisition of minority interest in subsidiary 0 0 -70 000 0 0
Change in loans to associates and others 3 000 0 3 000 1 800 -18 200
Net cash flow from investing activities 44 432 -4 541 53 371 -39 539 -107 435
Cash flow from financing activities
Receipts from new long-term debt 527 19 343 10 308 142 152 185 259
Long-term debt repayments -14 388 -11 172 -388 610 -30 873 -43 681
Net change in overdraft 38 720 -42 041 38 720 -138 777 -142 576
Sale and purchase of treasury shares -48 0 -1 567 -2 589 -2 589
Interest paid -3 488 -6 392 -13 621 -19 142 -23 976
Dividend payment 0 0 -111 773 -65 353 -65 353
Net cash flow from financing activities 21 323 -40 262 -466 543 -114 582 -92 916
Net increase (+)/ decrease (-) in cash & cash equivalents 184 832 32 799 172 080 53 310 139 845
Cash and cash equivalents - opening balance 188 587 82 005 201 339 61 494 61 494
Cash and cash equivalents - closing balance 373 419 114 804 373 419 114 804 201 339
NOTES TO THE FINANCIAL STATEMENTS
NOTE 1: Accounting principles
The Group's accounting principles in this interim report are the same as described in the annual f inancial report for 2015.
These condensed, consolidated interim financial statements have been draw n up in accordance w ith International Financial
Reporting Standards (IFRSs) and such interpretations as are determined by the EU and published by the International Accounting
Standards Board, including the interim reporting standard (IAS 34). The interim financial statements do not include all the
information required of an annual f inancial report and must therefore be read in conjunction w ith the consolidated f inancial
statements for the 2015 financial year.
The condensed consolidated interim financial statements have not been audited. As a result of rounding differences, numbers or
percentages may not add up to the total.
The consolidated f inancial statements for the Group for the year 2015 are available upon request from the company's head off ice
at Ferjemannsveien 10, Trondheim or at w w w .norw ayroyalsalmon.com.
INTERIM REPORT Q3 2016
NOTES TO THE FINANCIAL STATEMENTS
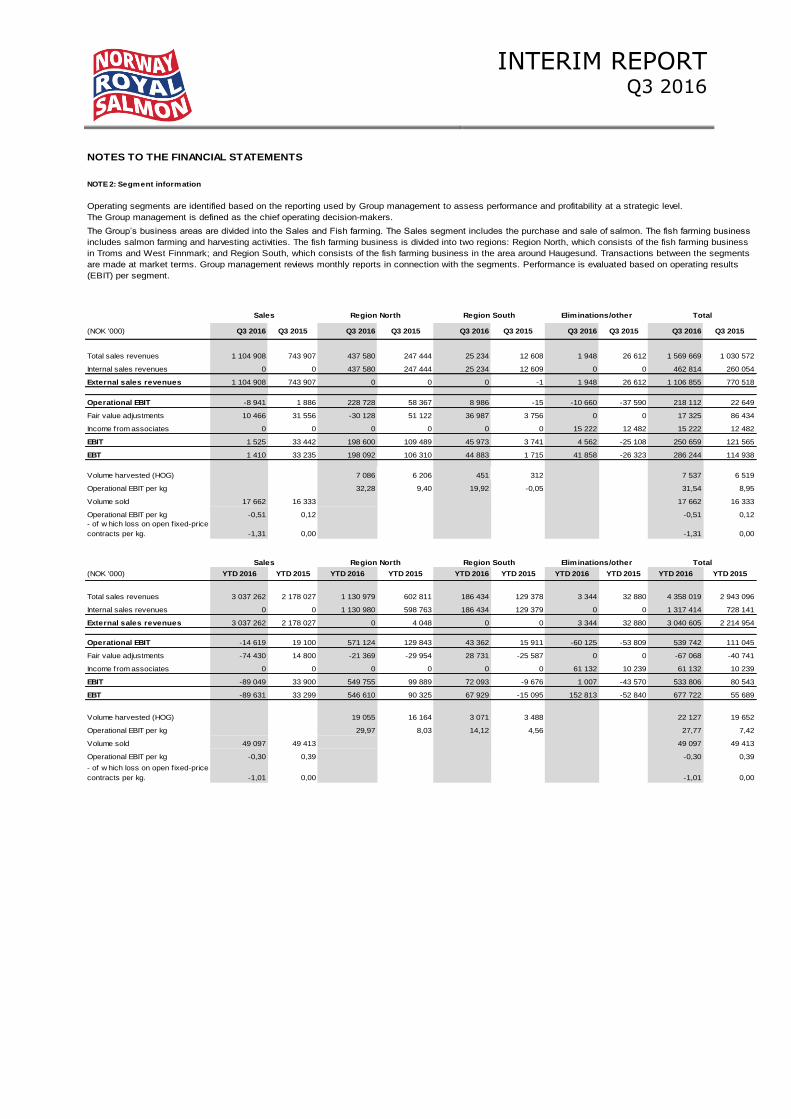
NOTE 2: Segment information
Operating segments are identified based on the reporting used by Group management to assess performance and profitability at a strategic level.
The Group management is defined as the chief operating decision-makers.
(NOK '000) Q3 2016 Q3 2015 Q3 2016 Q3 2015 Q3 2016 Q3 2015 Q3 2016 Q3 2015 Q3 2016 Q3 2015
Total sales revenues 1 104 908 743 907 437 580 247 444 25 234 12 608 1 948 26 612 1 569 669 1 030 572
Internal sales revenues 0 0 437 580 247 444 25 234 12 609 0 0 462 814 260 054
External sales revenues 1 104 908 743 907 0 0 0 -1 1 948 26 612 1 106 855 770 518
Operational EBIT -8 941 1 886 228 728 58 367 8 986 -15 -10 660 -37 590 218 112 22 649
Fair value adjustments 10 466 31 556 -30 128 51 122 36 987 3 756 0 0 17 325 86 434
Income from associates 0 0 0 0 0 0 15 222 12 482 15 222 12 482
EBIT 1 525 33 442 198 600 109 489 45 973 3 741 4 562 -25 108 250 659 121 565
EBT 1 410 33 235 198 092 106 310 44 883 1 715 41 858 -26 323 286 244 114 938
Volume harvested (HOG) 7 086 6 206 451 312 7 537 6 519
Operational EBIT per kg 32,28 9,40 19,92 -0,05 31,54 8,95
Volume sold 17 662 16 333 17 662 16 333
Operational EBIT per kg -0,51 0,12 -0,51 0,12
- of w hich loss on open fixed-price
contracts per kg. -1,31 0,00 -1,31 0,00
(NOK '000) YTD 2016 YTD 2015 YTD 2016 YTD 2015 YTD 2016 YTD 2015 YTD 2016 YTD 2015 YTD 2016 YTD 2015
Total sales revenues 3 037 262 2 178 027 1 130 979 602 811 186 434 129 378 3 344 32 880 4 358 019 2 943 096
Internal sales revenues 0 0 1 130 980 598 763 186 434 129 379 0 0 1 317 414 728 141
External sales revenues 3 037 262 2 178 027 0 4 048 0 0 3 344 32 880 3 040 605 2 214 954
Operational EBIT -14 619 19 100 571 124 129 843 43 362 15 911 -60 125 -53 809 539 742 111 045
Fair value adjustments -74 430 14 800 -21 369 -29 954 28 731 -25 587 0 0 -67 068 -40 741
Income from associates 0 0 0 0 0 0 61 132 10 239 61 132 10 239
EBIT -89 049 33 900 549 755 99 889 72 093 -9 676 1 007 -43 570 533 806 80 543
EBT -89 631 33 299 546 610 90 325 67 929 -15 095 152 813 -52 840 677 722 55 689
Volume harvested (HOG) 19 055 16 164 3 071 3 488 22 127 19 652
Operational EBIT per kg 29,97 8,03 14,12 4,56 27,77 7,42
Volume sold 49 097 49 413 49 097 49 413
Operational EBIT per kg -0,30 0,39 -0,30 0,39
- of w hich loss on open fixed-price
contracts per kg. -1,01 0,00 -1,01 0,00
Total
Eliminations/otherSales Total
The Group’s business areas are divided into the Sales and Fish farming. The Sales segment includes the purchase and sale of salmon. The fish farming business
includes salmon farming and harvesting activities. The fish farming business is divided into two regions: Region North, which consists of the fish farming business
in Troms and West Finnmark; and Region South, which consists of the fish farming business in the area around Haugesund. Transactions between the segments
are made at market terms. Group management reviews monthly reports in connection with the segments. Performance is evaluated based on operating results
(EBIT) per segment.
Region North
Sales Region North Eliminations/otherRegion South
Region South

INTERIM REPORT Q3 2016
NOTES TO THE FINANCIAL STATEMENTS
NOTE 3: Biomass
Book value of inventory:
(NOK '000) 30.09.2016 30.06.2016 30.09.2016 31.12.2015
Raw materials 33 859 29 306 26 584 27 034
Biological assets (biomass) 861 935 743 821 757 215 829 928
Finished goods 13 285 23 342 21 550 13 596
Total inventory 909 078 796 469 805 349 870 559
Specification of the biomass:
(NOK '000) 30.09.2016 30.06.2016 30.09.2016 31.12.2015
Biomass at cost 657 179 545 924 612 554 632 534
Fair value adjustments of the biomass 204 756 197 897 144 661 197 394
Book value of the biomass 861 935 743 821 757 215 829 928
Specification of biological assets - tonnes Q3 2016 Q2 2016 Q3 2015 FY 2015
Opening balance biological assets 15 025 18 585 19 285 23 537
Increase due f ish put in the sea 478 572 156 865
Increase due to production in the period 11 669 5 408 11 695 33 614
Reduction due to mortality in the period -615 -686 -336 -1 637
Reduction due to harvesting in the period -8 973 -8 811 -7 768 -33 258
Non-recurring items and sold biomass 0 -42 -714 -714
Closing balance biological assets 17 584 15 025 22 318 22 407
Specification of changes in book value of biological assets:
(NOK ’000) Q3 2016 Q2 2016 Q3 2015 FY 2015
Biological assets as of 1 January 743 821 791 315 671 307 808 674
Increase due to production in the period 300 325 215 881 263 764 853 256
Extraordinary event at cost 0 -8 000 -25 000 -25 000
Reduction due to harvesting in the period -189 070 -230 807 -207 736 -804 194
Fair value adjustments of the biological assets 6 859 -24 568 54 880 -2 808
Fair value adj. of the biological assets due to extraordinary event 0 0 0 0
Biological assets as of 31 December 861 935 743 821 757 215 829 928
In accordance w ith IAS 41, the biomass is recognised at fair value. Adjustments to the fair value of the biomass are presented on a separate line in the
income statement. When estimating the biomass at fair value the best estimate of fair value for f ish less than 1 kg is assumed to be accumulated cost,
w hile for f ish betw een 1 and 4 kg a proportionate share of full value is recognised. Harvestable f ish (above 4 kg) is valued at full value. An expected
fair value below the expected cost w ould imply a negative value adjustment of biological assets w ith the entire estimated loss. Market prices based on
externally quoted forw ard prices from Fish Pool (see table below ), for the period w hen the f ish are expected to be harvested are used w hen
calculating the fair value. Sales prices are adjusted for sales costs and harvesting costs and costs of transportation to Oslo. The estimated quality
distribution of the f ish is also taken into account w hen estimating the value. Price is set per site and w eighted in relation to the expected harvesting
period of the f ish.

INTERIM REPORT Q3 2016
NOTES TO THE FINANCIAL STATEMENTS
NOTE 3: Biomass cont.
Groups of biological assets, status pr 30.09.2016
Number of
fish (1000)
Biomass
(tonnes)
Acquisition
costs
Fair value
adjustments
Accounted
value
Smaller than 1 kg 7 029 3 532 212 687 0 212 687
1-4 kg 5 418 12 731 409 837 183 705 593 542
Larger than 4 kg 228 1 317 34 656 21 051 55 706
Biological assets 12 675 17 580 657 179 204 756 861 935
Groups of biological assets, status pr 30.06.2016
Number of
fish (1000)
Biomass
(tonnes)
Acquisition
costs
Fair value
adjustments
Accounted
value
Smaller than 1 kg 5 804 2 740 207 977 0 207 977
1-4 kg 3 077 5 730 193 675 59 095 252 770
Larger than 4 kg 1 176 6 555 144 272 138 802 283 074
Biological assets 10 058 15 025 545 924 197 897 743 821
Groups of biological assets, status pr 30.09.2015
Number of
fish (1000)
Biomass
(tonnes)
Acquisition
costs
Fair value
adjustments
Accounted
value
Smaller than 1 kg 3 328 1 202 77 228 0 77 228
1-4 kg 6 464 17 841 449 651 125 912 575 563
Larger than 4 kg 791 3 276 85 674 18 750 104 424
Biological assets 10 583 22 318 612 553 144 662 757 215
Groups of biological assets, status pr 31.12.2015
Number of
fish (1000)
Biomass
(tonnes)
Acquisition
costs
Fair value
adjustments
Accounted
value
Smaller than 1 kg 5 172 2 376 143 001 0 143 001
1-4 kg 4 259 12 561 325 229 94 543 419 772
Larger than 4 kg 1 628 7 470 164 304 102 851 267 155
Biological assets 11 059 22 407 632 534 197 394 829 928
30.09.2016 NOK/kg 30.06.2016 NOK/kg 30.09.2015 NOK/kg 31.12.2015 NOK/kg
Q4 16 63,75 Q3 16 59,00 Q4 15 43,67 Q1 16 51,80
Q1 17 63,40 Q4 16 61,00 Q1 16 45,00 Q2 16 47,50
Q2 17 63,58 Q1 17 60,40 Q2 16 44,60 Q3 16 44,10
Q3 17 55,32 Q2 17 59,78 Q3 16 40,72 Q4 16 44,60
Q4 17 56,68 Q3+Q4 17 60,00 Q4 16 41,44 Q1 + Q2 17 49,65
Fish Pool forward prices used in the calculation of the fair falue of the biomass

INTERIM REPORT Q3 2016
NOTES TO THE FINANCIAL STATEMENTS
NOTE 4: Extraordinary events
Extraordinary events Cost
Fair value
adjustments Fair value Cost
Fair value
adjustments Fair value
0 0 0 25 000 0 25 000
Biological assets 0 0 0 25 000 0 25 000
Extraordinary events Cost
Fair value
adjustments Fair value Cost
Fair value
adjustments Fair value
0 0 0 25 000 0 25 000
11 186 0 11 186 0 0 0
8 000 0 8 000 0 0 0
Biological assets 19 186 0 19 186 0 0 0
Extraordinary events Cost
Fair value
adjustments Fair value
25 000 0 25 000
Biological assets 25 000 0 25 000
1) Fish less than 1 kg. The best estimate of fair value is cost.
In addition, a f ine of MNOK 6,3 to Nord Senja Laks w as recognised as a extraordinary event in the Q3 2015. This do not affect biological assets.
NOTE 5: Fair value adjustments
(NOK '000) Q3 2016 Q3 2015 YTD 2016 YTD 2015 FY 2015
Change in fair value adjustments of the biomass 6 859 54 878 7 362 -55 541 -2 808
Change in provision for onerous sales contracts 22 990 -2 350 -96 363 3 176 -22 241
Change in unrealised gains/losses on f inancial f ish pool contracts -12 524 33 907 21 933 11 624 49 465
Total fair value adjustments 17 325 86 434 -67 068 -40 741 24 416
The fair value adjustments has the following effect in the balance sheet:
(NOK '000) 30.09.2016 30.06.2016 31.12.2015 30.06.2015
Fair value adjustments biomass (inventory and biological assets) 204 756 197 897 197 394 144 661
Provision for onerous sales contracts (other current liabilities) -124 130 -147 120 -27 767 -2 350
Fair value of f inancial f ish pool contracts (other receivables/other current liabilities) 84 219 96 742 62 286 24 445
Net fair value adjustments in the balance sheet 164 845 147 519 231 913 166 756
NOTE 6: Transactions with related parties
For further details of transactions w ith related parties, please see the description in the annual report.
Fish disease ISA, destruction required by the authorities 1)
Destruction of f ish w ith w inter w ounds Nor Seafood AS 1
Destruction of desmoltif ied f ish NRS Finnmark AS 1
FY 2015
Fish disease ISA, destruction required by the authorities 1)
Q3 2016 Q3 2015
Fish disease ISA, destruction required by the authorities 1)
YTD 2016 YTD 2015
Fair value adjustments w hich are a part of the Group’s EBIT, is presented on a separate line in order to give a better understanding of the Group’s operating profit from goods
sold. The item consists of:
The Norw ay Royal Salmon Group undertakes transactions under ordinary terms and conditions w ith associates and f ish farmers w ho are also NRS shareholders. This applies to the
purchase of f ish from fish-farming companies, as w ell as the purchase of harvesting services from tw o of the Group’s associates. Smolts are also purchased from associated companies.
Share-based incentive schemes
Wellboat services w ith a total value of KNOK 8 658 w ere purchased from enterprises controlled by the company’s Chair Helge Gåsø in 2016. Services for TNOK 3 405 w ere purchased in Q3
2016. These services w ere priced at the market rate. I addition, has smolts from Nordland Akva AS, w hich is controlled by one of the largest shareholders of NRS, Egil Kristoffersen og
Sønner AS, been purchased for KNOK 16 018 in 2016. Smolts for TNOK 10 285 w ere purchased in Q3 2016.
A new bonus programme based on synthetic options w as introduced for the Group's management in 2014. The bonus programme gives entitlement to a cash bonus based on the NRS
average share price over a period prior to respectively 29 March 2014 and 24 June 2014. Bonuses are calculated 12, 24 and 36 months after these dates, and the bonus programme includes
an obligation to invest the net bonus after tax in Norw ay Royal Salmon ASA (NRS) shares at the market price on the relevant date. Shares purchased in accordance w ith the bonus
programme w ill be subject to a 12-month lock-up period. All bonus payments are conditional on full-time employment in the company. The bonus is calculated based on the increase in value of
the share in NRS from 29 March 2014 and 24 June 2014, and in relation to price increases during the period on the number of shares covered by the programme. After the execution of 150
000 options in Q3 2016, the scheme covers 370 000 shares allocated to the Group’s management at the end of the year. In the third quarter of 2016 costs relating to the option scheme w as
recognised in the income statement in the amount of KNOK 5 266.

INTERIM REPORT Q3 2016
NOTES TO THE FINANCIAL STATEMENTS
NOTE 7: Investments in associates
(NOK '000) Shareholding
Book value
01.01.2016
Share of
profit/loss in the
period after tax Other changes
Book value
30.09.2016
Share of volume
harvested -
tonnes HOG
30.09.2016*
Wilsgård Fiskeoppdrett AS 37,50 % 64 733 42 460 0 107 193 1 182
Måsøval Fishfarm AS 36,10 % 16 731 720 -6 859 10 593 431
Hellesund Fiskeoppdrett AS 33,50 % 51 995 15 729 -2 012 65 712 459
Hardanger Fiskeforedling AS 31,10 % 8 542 880 0 9 422
Espevær Laks AS 33,33 % 2 222 442 0 2 664
Ranfjord Fiskeprodukter AS 37,75 % 20 689 902 0 21 591
Skardalen Settefisk AS 30,00 % 5 032 0 0 5 032
Other 48 0 0 48
Total associates 30.09.2016 169 993 61 133 -8 871 222 253 2 072
Total associates 30.09.2015 150 155 10 239 -4 918 155 476 1 911
* The harvested volume comprises NRS’s share of the harvested volume of associates
The Group’s associates ow n a combined total of ten licences.
Associates that own shares in NRS as of 30 September 2016:
Shareholding
Number of
shares Cost Fair value
Fair value
adjustment
NRS' share of fair
value
adjustment
Måsøval Fishfarm AS 36,10 % 252 520 783 35 605 34 823 12 571
Hellesund Fiskeoppdrett AS 33,50 % 1 620 380 13 190 228 474 215 283 72 120
Total 1 872 900 13 973 264 079 250 106 84 691
Note 8 Interest rate swap
(NOK '000)
Currency Amount NRS pays NRS receives Maturity
Market value
30.06.2016
Market value
30.09.2016
Change in
market value Q3
2016
NOK 100 000 Fixed 3,37% 3 M NIBOR 07.09.2016 -602 0 602
Note 9 Treasury shares and TRS agreements
(NOK '000) No. of shares
Exercise
Price Maturity
Market value
30.06.2016
Market value
30.09.2016
Change in
market value Q3
2016
TRS 1 2 354 691 106,8371 15.09.2016 39 022 0 -39 022
TRS 2 2 354 691 129,6229 15.03.2017 0 28 372 28 372
Sum 39 022 28 372 -10 650
NOTE 10: Loans to credit institutions
The interest rate sw ap is not recognized as hedge accounting under IFRS. Subsequent the fair value changes on the agreement w ill be charged to the income
statement as a part of other net f inancial items.
The Group's main borrow ing covenants is one requiring an equity ratio of at least 30 per cent and another requiring that the short-term credit facility shall not
exceed 75 per cent of the carrying value of inventory and accounts receivables. At the end of the third quarter 2016 the Group is in compliance w ith the terms
of its loan agreements.
As at 30 September the company holds 98 279 treasury shares, corresponding to 0.23 % of the share capital of the company. Norw ay Royal Salmon ASA's
total underlying exposures through TRS agreements is at 30 September 2 354 691 shares, representing 5.40 % of the share capital of the company. TRS
agreements are recorded at fair value and changes in fair value are recognized as f inancial items in the income statement. The company realised previously
entered TRS agreements in the period. Gain on realisation amounted to KNOK 49 232 and is posted as a f inancial item (gain on f inancial assets) in the income
statement.
Some associates ow n shares in Norw ay Royal Salmon ASA. These are recognised at cost in the accounts of the companies. The fair value of the shares that
the associated companies ow n is not included in the Group accounts.

INTERIM REPORT Q3 2016
NOTES TO THE FINANCIAL STATEMENTS
NOTE 11: Shareholders
Ownership structure – the 20 largest shareholders as at 30.09.2016:
Shareholder No. of shares Shareholding
GÅSØ NÆRINGSUTVIKLING AS 6 632 835 15,22 %
GLASTAD INVEST AS 5 768 862 13,24 %
MÅSØVAL EIENDOM AS 5 111 933 11,73 %
EGIL KRISTOFFERSEN OG SØNNER AS 4 679 382 10,74 %
HAVBRUKSINVEST AS 3 706 873 8,51 %
DNB NOR MARKETS, AKSJEHAND/ANALYSE 2 365 730 5,43 %
SPAREBANK 1 MARKETS AS 1 698 009 3,90 %
HELLESUND FISKEOPPDRETT A/S 1 620 380 3,72 %
LOVUNDLAKS AS 1 051 205 2,41 %
NYHAMN AS 1 022 457 2,35 %
STATE STREET BANK AND TRUST CO. 738 112 1,69 %
JP MORGAN BANK LUXEMBOURG S.A 425 176 0,98 %
HOLTA INVEST AS 344 368 0,79 %
MSIP EQUITY 287 010 0,66 %
HENDEN FISKEINDUSTRI AS 283 808 0,65 %
MP PENSJON PK 263 265 0,60 %
MÅSØVAL FISHFARM AS 252 520 0,58 %
JPMORGAN CLEARING CORP. 218 000 0,50 %
THE BANK OF NEW YORK MELLON SA/NV 214 607 0,49 %
JPMORGAN CHASE BANK, N.A., LONDON 208 986 0,48 %
Total 20 largest shareholders 36 893 518 84,67 %
Total other shareholders 6 678 673 15,33 %
Total no. of shares 43 572 191 100,00 %