Embed Size (px)
Citation preview
Ways & Means 741
High-resolution icosahedral reconstruction: fulfilling the promiseof cryo-electron microscopyErika J Mancini, Felix de Haas and Stephen D Fuller*
Address: The Structural Biology Programme, European MolecularBiology Laboratory, Meyerhofstrabe 1, Postfach 10.2209, 69117Heidelberg, Federal Republic of Germany.
*Corresponding author.E-mail: [email protected]
Structure 15 June 1997, 5:741–750http://biomednet.com/elecref/0969212600500741
© Current Biology Ltd ISSN 0969-2126
SummaryTwo recent papers have defined the secondary structureof the hepatitis B virus capsid using a combination of cryo-electron microscopy and icosahedral image reconstruction.These two papers do more than reveal a new fold for avirus protein; they herald a new era in which image recon-struction of single particles will provide reliable high-reso-lution structural information. In revealing the promise ofthese techniques to the structural biology community,their two papers should play a seminal role for single parti-cle work, similar to that of the work of Unwin and Hen-derson [1] on bacteriorhodopsin in revealing the potentialof electron microscopy of membrane protein crystals.Indeed, the success of these single particle methods owesmuch to the development of high-resolution techniquesfor two-dimensional crystals. This review will summarizesome of the history of icosahedral reconstruction fromcryo-electron micrographs, compare the two differentapproaches used to obtain the recent results and outlinesome of the challenges and promises for the future.
IntroductionIcosahedral reconstruction is a type of single particleimage reconstruction in which the process of combiningimages of individual particles in random orientations toyield a structure is aided by the icosahedral symmetry ofthe particle. In this way, the progress made in icosahedralreconstruction provides a glimpse of the future of othersingle particle methods which do not rely upon the sym-metry of the structure and have recently achieved break-throughs of their own [2,3]. In all cases, the quality of thefinal structure is determined by the precision and accuracyof the alignment of the individual views, rather than bythe presence of order in the arrangement of individual par-ticles. The two papers which breached the 10Å barrier forthe resolution of such a reconstruction both used the samewell-defined N-terminal fragment (residues 1–149) of thehepatitis B capsid (HBc) in their studies. This fragment ofthe HBc assembles upon expression in Escherichia coli toyield T=4 (360 Å diameter) and T=3 (320Å diameter)capsids. The structure of this capsid had been determined
initially by Crowther et al. [4] to 30 Å and has been shownto be conserved in different constructs of varying length,including those corresponding to hepdnaviruses of otherspecies [5,6]. This set the stage for the higher resolutionwork [7,8] described below. A third paper reports a 9 Åmap of a larger particle, the 600 Å diameter bovine papillo-mavirus [9], using an overall strategy similar to that ofConway et al. [8].
Overview of the methodThe use of icosahedral reconstruction in combination withcryo-electron microscopy is the marriage of two comple-mentary developments [10,11]. Crowther introduced theuse of common lines as a method for determining the ori-entation (Euler angles θ,φ,ω) and phase origin (x,y) of anicosahedral particle [12,13]. Once their orientations areestablished, the images of separate particles in differentorientations are combined by considering them as separateviews of the same structure. This is done using the projec-tion theorem for Fourier transforms and the 60-fold (532)symmetry of the structure. Each individual particle trans-form is placed into the three-dimensional transform in its60 equivalent positions. The assembled data from all par-ticles is then used to calculate the coefficients of a seriesof expansion functions with 52 symmetry by linear leastsquares. This series is subsequently inverted to producethe density sampled in Cartesian coordinates. The eigen-values for the linear least squares determination of thecoefficients of the expansion functions reveal how wellthese coefficients, and hence the final map, are deter-mined. Eigenvalues of 1 indicate that the ensemble ofparticle data has determined the reconstruction whilelarger values indicate that it is overdetermined so that thecoefficients are determined by averaging. This entire pro-cedure rests on the twin assumptions of icosahedral sym-metry in the particle and the constancy of the structurefrom particle to particle. These are very dubious assump-tions when data from negatively stained samples are usedas virions are often distorted by the staining process. Cryo-electron microscopy makes these assumptions more reli-able by eliminating the stain [10] and preserving theparticle in water [14]. Typically, a drop of virus suspensionis placed on a microscope grid which is covered by a holeycarbon film. The grid is blotted to produce a very thin(~1000Å) layer of the sample across the holes of thecarbon film. This thin layer is rapidly cooled by plunginginto a bath of ethane slush held in a container of liquidnitrogen [10,14]. The very rapid cooling causes the forma-tion of a vitrified sample which provides an aqueous envi-ronment to preserve the sample. Indeed, a number ofdynamic particles, including microtubules [15–17] and

membrane viruses [18,19], can be visualized in an intactform only by cryo-electron microscopy.
This preservation, however, comes with a cost; cryo-elec-tron micrographs have substantially lower contrast thannegatively stained ones and are substantially morecomplex because the entire particle, including its interiorstructures, is seen in projection. The contrast in the imagecomes primarily from defocus phase contrast, whichaccentuates certain resolution ranges in the image andsuppresses others. This effect must be corrected (videinfra) in the final structure. In the first work with nega-tively stained material [13,20], the orientation of the indi-vidual particles was determined by eye and then theseorientations refined using their common lines phase resid-uals. Identification of the view by eye is possible for rela-tively few orientations of an unstained virus particle invitrified water. A modification of the original common
lines residual which is appropriately weighted for thedegeneracy of the lines near symmetry axes allows the ori-entation to be determined computationally [18]. Thedetermination of orientation as the one with the lowestweighted common lines residual is the approach used atthe beginning of the solution of a new structure [11]. Itsadvantage is that the only assumption made concerningthe particle is that it is icosahedrally symmetric. Unfortu-nately, the reliability of this approach is compromised bythe low signal-to-noise ratio in the images and the possi-bility of variation within the population of particles [11].Consequently, as soon as an initial reconstruction has beencalculated and seen to be reliable by comparing recon-structions derived from independent sets of particles,model-based methods are used to refine the orientations[4,21]. The implementation of model-based methods con-verted icosahedral reconstruction from an intricate puzzleto be solved by intuition and perseverance to a reliablemethod for structure determination. These methods alsomake it practical to screen, and hence include, largernumbers of particles into a reconstruction and conse-quently to increase the signal-to-noise ratio and resolutionof the final map.
The history of the field can be summarized in a revealingchart (Fig. 1) of the increase in resolution of representa-tive, published structures over time. The chart shows agradual increase in resolution from worse than 30Å toaround 20Å as the advent of model-based orientationmethods allowed inclusion of increased numbers of parti-cles. The second marked increase in resolution, which cul-minated in the two HBc structures, has a second cause: theuse of data from field emission gun (FEG) equippedmicroscopes. The higher coherence of these sources pro-duces an image with more contrast at high resolution [22].The effect is synergistic for icosahedral reconstructionbecause the effectiveness of averaging, and hence thequality of the map which is used for further alignment, isdependent upon the precision of alignment. More strengthin the higher resolution data of an image allows more accu-rate alignment and hence allows the averaging of higherresolution data. Reconstructions performed with such highquality data (indicated by in Fig. 1) result in a higherresolution for the same number of images. Indeed, one canextrapolate from the least squares fit to the progress ofreconstructions which relied upon conventional illumina-tion (Fig. 1) that without the use of FEG microscopederived data the 10Å barrier would have been crossed inthe next millennium and require many more images.
Just combine lots of images and you see helicesA crystallographer colleague summed up a widespreadimpression of the recent advances in resolution in a strik-ing way. His comment was that he hoped that the twopapers would inspire electron microscopists to be morebold in interpreting their data and in using larger and larger
742 Structure 1997, Vol 5 No 6
Figure 1
Improving resolution of reconstructions. The improvement in theresolution of published icosahedral reconstructions from cryo-electronmicrographs. (a) The reported resolution as a function of the date ofpublication. (b) The number of particles included in the reconstructionsshown in (a). The least squares fitted line indicates the improvingresolution of reconstructions from cryo-electron micrograph data takenusing conventional illumination (). Reconstructions from datacollected with field emission gun (FEG) illumination () yield higherresolution for the same number of particles. The reconstructionsshown [4,6–9,18,19,26,32–34,55–80] were chosen to berepresentative rather than exhaustive. Some reconstructions combineimages of the same particles at different defocuses to produce thefinal structure but all are displayed as the number of particles.
5
10
15
20
25
30
35
40
45
1986 1987 1988 1990 1991 1992 1993 1994 1995 1996 1997
1986 1987 1988 1990 1991 1992 1993 1994 1995 1996 199710
100
1000
10000
(a)
(b)
Res
olut
ion
(Å)
Num
ber o
f par
ticle
s
data sets. It was a satisfying feeling to realize that our fieldhad become so respectable that the X-ray crystallographersnow thought that we were afflicted with caution. However,the comment misses two important features of reconstruc-tion from cryo-electron micrographs. It is not only thenumber of particles used in the reconstruction but theimproved ability to orient them accurately with high preci-sion that has led to the increase in resolution. Hence, themethod of orientation is critical. Particles must also beselected carefully. Most biological specimens show hetero-geneity. A major advantage of electron microscopy is thatone can consider each particle separately and so excludethose which should not contribute to the average. TheHBc case is an extreme one as the preparation containsboth T=3 and T=4 particles which must be treated sepa-rately [4–6]. In a sense the quality of the reconstruction isoften a function of the fraction of particles excluded as wellas the number of particles included in the final map.
An essential distinction between single particle methodsand crystallographic ones is that there is no truly objectivemeasure of the quality of the data, such as the strength of areflection, except for the quality of the final structure. Onecan measure the optical quality of an image objectively byexamining its optical or computed transform, but this isonly a limit on the quality of the data contained within it.Images which pass this criterion must then be examinedby eye to exclude particles which fail the ‘o’ test (i.e.resemble any letter of the alphabet but o) and which showcrisp features. This initial screening produces the data set(e.g. in the two recent papers 6650 particles from 34 micro-graphs [7] or 2040 from two micrographs of the same field[8] imaged at two different defocuses) for which orienta-tions must be determined.
The two groups used different model-based methods fordetermining the orientations of the particles in their dataset, on the basis of the previously determined low-resolu-tion structures of the assembled HBc protein expressed inE. coli [4,6]: Böttcher et al. [7] used refinement of the crosscommon lines (ccl) residual while Conway et al. [8] usedthe polar Fourier transform (pft) method [21] (Fig. 2).
The 532 symmetry of the particle gives rise to two types ofcommon lines in the Fourier transform of the image: thosewithin a single image transform and those between imagetransforms. The transform of a single image contains 37pairs of common lines. The positions of these lines dependupon the orientation of the view relative to the icosahedralsymmetry axes. The calculation of the weighted phaseresidual between these pairs is the basis of the orientationmethod for individual images described above [11,20,23].The transforms of any pair of differently oriented particlesshare 60 pairs of ccl which each must have identical valuesand whose position in each can be calculated from therelative orientation of the particles. The ccl residual
method calculates the positions of the ccl between thetransforms of the image and those of a set of projections ofthe current best map. The power of the method over theuse of individual image transforms arises from the largenumber and even distribution of the ccl as well as from theuse of an averaged model structure. The authors mini-mized this ccl phase residual by varying the orientationsand phase origins of the individual particle transforms rela-tive to six transforms of the best current map. The refine-ment of orientations was carried out to increasingresolution as Fourier shell correlation [24] demonstratedthe improved quality of the map. Particles from eachmicrograph were refined separately and used to generatereconstructions which were contrast transfer function(CTF) weighted and summed (vide infra) to produce aCTF corrected, average reconstruction at each stage of therefinement (Fig. 2a).
Conway et al. [8] utilized the pft method (Fig. 2b) forrefinement [21]. This widely used method proceeds inseveral stages to convert the five-dimensional (θ,φ,ω,x,y)search to a two-dimensional (θ,φ) one. Firstly, an averagedprojection of the current best map is used to find the bestcenter for each image by cross correlation. Then projec-tions of the map for different values of θ and φ are interpo-lated onto polar coordinates (r,α) and Fourier transformedalong the angular (α) axis. One-dimensional cross correla-tion along this axis with pft’s of the image are used to findmodel projection which most closely matches the image.The cross-correlation value reveals the quality of thematch while the position of the cross-correlation peakyields the value of Ω. One great advantage of this methodis that it permits easy selection of the radial ranges in realand reciprocal space, which are the most sensitive and reli-able for orientation. This allows the use of a relatively poormodel for the initial stages of refinement. Indeed, radiallycropped maps of viruses with antibodies bound have beenused to orient the uncomplexed virion [25–28], and thecapsid of the neutral pH form of an enveloped virus hasbeen used to orient the entire enveloped low pH form[19]. The use of the pft method for refinement at higherresolution requires the generation of closely spaced projec-tions, 0.3° in the HBc work [8]. Once again the power ofthe method for orientation comes from the use of an aver-aged map of higher signal-to-noise ratio for comparison.
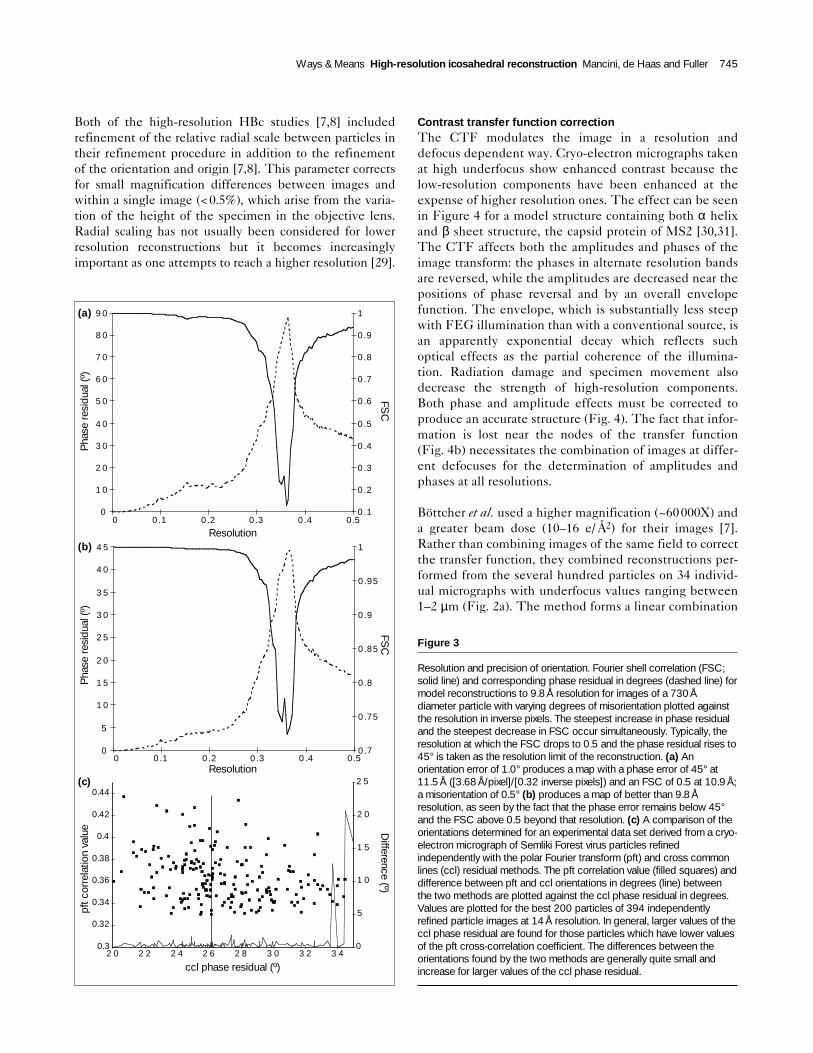
There is a great deal of discussion over the relative meritsof these two methods [9]. Comparison of the two methodsfor the refinement of images of the Semliki Forest virus to14 Å resolution (Fig. 3; Fuller and Mancini, unpublishedresults) shows that they give nearly equivalent results.The pft method seems better at identifying distorted par-ticles for exclusion, while the ccl method appears toimpose a hand on the reconstruction more consistently.The ccl method is also more efficient at higher resolution.The calculation of the ccl residual between the transforms
Ways & Means High-resolution icosahedral reconstruction Mancini, de Haas and Fuller 743
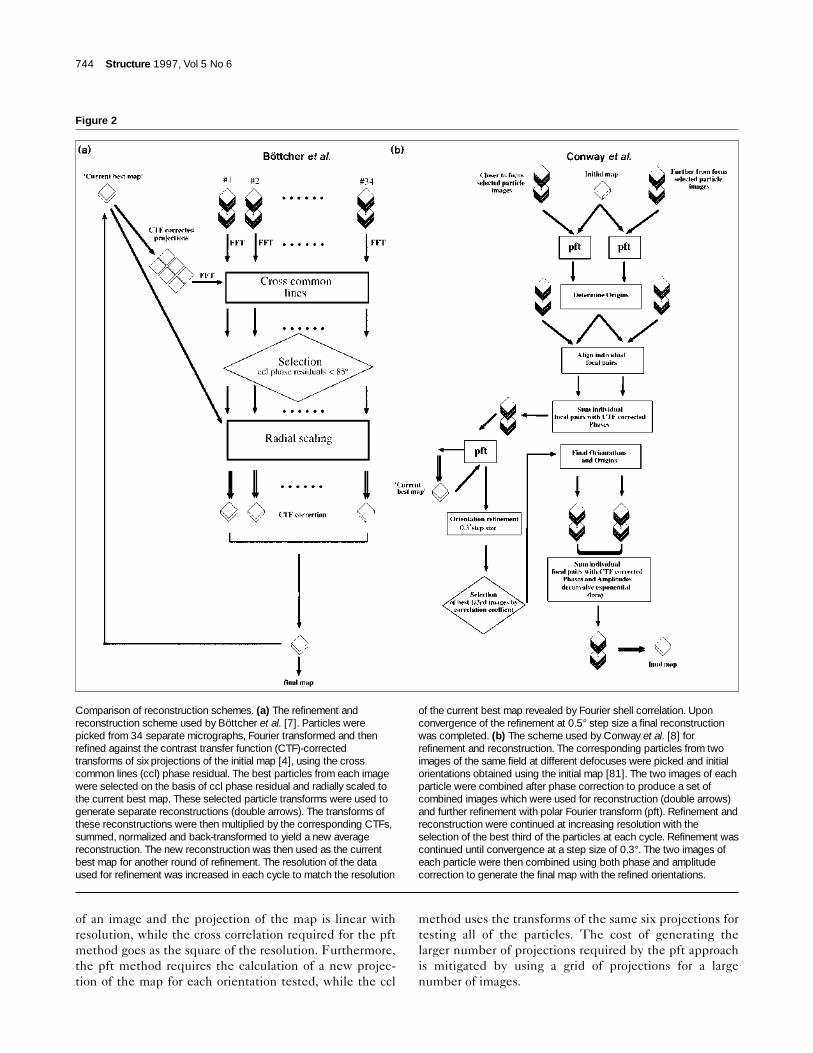
of an image and the projection of the map is linear withresolution, while the cross correlation required for the pftmethod goes as the square of the resolution. Furthermore,the pft method requires the calculation of a new projec-tion of the map for each orientation tested, while the ccl
method uses the transforms of the same six projections fortesting all of the particles. The cost of generating thelarger number of projections required by the pft approachis mitigated by using a grid of projections for a largenumber of images.
744 Structure 1997, Vol 5 No 6
Figure 2
Comparison of reconstruction schemes. (a) The refinement andreconstruction scheme used by Böttcher et al. [7]. Particles werepicked from 34 separate micrographs, Fourier transformed and thenrefined against the contrast transfer function (CTF)-correctedtransforms of six projections of the initial map [4], using the crosscommon lines (ccl) phase residual. The best particles from each imagewere selected on the basis of ccl phase residual and radially scaled tothe current best map. These selected particle transforms were used togenerate separate reconstructions (double arrows). The transforms ofthese reconstructions were then multiplied by the corresponding CTFs,summed, normalized and back-transformed to yield a new averagereconstruction. The new reconstruction was then used as the currentbest map for another round of refinement. The resolution of the dataused for refinement was increased in each cycle to match the resolution
of the current best map revealed by Fourier shell correlation. Uponconvergence of the refinement at 0.5° step size a final reconstructionwas completed. (b) The scheme used by Conway et al. [8] forrefinement and reconstruction. The corresponding particles from twoimages of the same field at different defocuses were picked and initialorientations obtained using the initial map [81]. The two images of eachparticle were combined after phase correction to produce a set ofcombined images which were used for reconstruction (double arrows)and further refinement with polar Fourier transform (pft). Refinement andreconstruction were continued at increasing resolution with theselection of the best third of the particles at each cycle. Refinement wascontinued until convergence at a step size of 0.3°. The two images ofeach particle were then combined using both phase and amplitudecorrection to generate the final map with the refined orientations.
Both of the high-resolution HBc studies [7,8] includedrefinement of the relative radial scale between particles intheir refinement procedure in addition to the refinementof the orientation and origin [7,8]. This parameter correctsfor small magnification differences between images andwithin a single image (<0.5%), which arise from the varia-tion of the height of the specimen in the objective lens.Radial scaling has not usually been considered for lowerresolution reconstructions but it becomes increasinglyimportant as one attempts to reach a higher resolution [29].
Contrast transfer function correction The CTF modulates the image in a resolution anddefocus dependent way. Cryo-electron micrographs takenat high underfocus show enhanced contrast because thelow-resolution components have been enhanced at theexpense of higher resolution ones. The effect can be seenin Figure 4 for a model structure containing both α helixand β sheet structure, the capsid protein of MS2 [30,31].The CTF affects both the amplitudes and phases of theimage transform: the phases in alternate resolution bandsare reversed, while the amplitudes are decreased near thepositions of phase reversal and by an overall envelopefunction. The envelope, which is substantially less steepwith FEG illumination than with a conventional source, isan apparently exponential decay which reflects suchoptical effects as the partial coherence of the illumina-tion. Radiation damage and specimen movement alsodecrease the strength of high-resolution components.Both phase and amplitude effects must be corrected toproduce an accurate structure (Fig. 4). The fact that infor-mation is lost near the nodes of the transfer function(Fig. 4b) necessitates the combination of images at differ-ent defocuses for the determination of amplitudes andphases at all resolutions.
Böttcher et al. used a higher magnification (~60 000X) anda greater beam dose (10–16 e/ Å2) for their images [7].Rather than combining images of the same field to correctthe transfer function, they combined reconstructions per-formed from the several hundred particles on 34 individ-ual micrographs with underfocus values ranging between1–2 µm (Fig. 2a). The method forms a linear combination
Ways & Means High-resolution icosahedral reconstruction Mancini, de Haas and Fuller 745
0.3
0.32
0.34
0.36
0.38
0.4
0.42
0.44
02 0 2 2 2 4 2 6 2 8 3 0 3 2 3 4
5
1 0
1 5
2 0
2 5
0
5
1 0
1 5
2 0
2 5
3 0
3 5
4 0
4 5
0 0.1 0.2 0.3 0.4 0.50.7
0.75
0.8
0.85
0.9
0.95
1
0
1 0
2 0
3 0
4 0
5 0
6 0
7 0
8 0
9 0
0 0.1 0.2 0.3 0.4 0.50.1
0.2
0.3
0.4
0.5
0.6
0.7
0.8
0.9
1(a)
Pha
se re
sidu
al (º
)
FSC
Resolution(b)
Pha
se re
sidu
al (º
)
FSC
Resolution(c)
pft c
orre
latio
n va
lue D
ifference (º)
ccl phase residual (º)
Figure 3
Resolution and precision of orientation. Fourier shell correlation (FSC;solid line) and corresponding phase residual in degrees (dashed line) formodel reconstructions to 9.8Å resolution for images of a 730Ådiameter particle with varying degrees of misorientation plotted againstthe resolution in inverse pixels. The steepest increase in phase residualand the steepest decrease in FSC occur simultaneously. Typically, theresolution at which the FSC drops to 0.5 and the phase residual rises to45° is taken as the resolution limit of the reconstruction. (a) Anorientation error of 1.0° produces a map with a phase error of 45° at11.5Å ([3.68Å/pixel]/[0.32 inverse pixels]) and an FSC of 0.5 at 10.9Å;a misorientation of 0.5° (b) produces a map of better than 9.8Åresolution, as seen by the fact that the phase error remains below 45°and the FSC above 0.5 beyond that resolution. (c) A comparison of theorientations determined for an experimental data set derived from a cryo-electron micrograph of Semliki Forest virus particles refinedindependently with the polar Fourier transform (pft) and cross commonlines (ccl) residual methods. The pft correlation value (filled squares) anddifference between pft and ccl orientations in degrees (line) betweenthe two methods are plotted against the ccl phase residual in degrees.Values are plotted for the best 200 particles of 394 independentlyrefined particle images at 14Å resolution. In general, larger values of theccl phase residual are found for those particles which have lower valuesof the pft cross-correlation coefficient. The differences between theorientations found by the two methods are generally quite small andincrease for larger values of the ccl phase residual.

of the transforms of the individual reconstructions [32]each of which is multiplied by its own CTF and normal-ized with the sum of the squares of all of the CTF’s. Thecorrected average reconstruction is convolved with theCTF corresponding to the individual micrograph [32]before the generation of the transformed projections usedfor ccl refinement. The comparison of the reconstructionand the individual image transforms was used at eachstage of the refinement to improve the accuracy of theCTF determination. The final map was sharpened bycorrecting the exponential fall off with an inverse temper-ature factor of 500 Å2.
Conway et al. used a single focal pair of images containingover 2000 particles taken at 38000X at ~6e/Å2 [8]. Theimages were taken at complementary defocus values; thefirst zero was at 1/17Å in the first exposure and at 1/27Å inthe second exposure. The rotation and translation betweenthe two fields could be determined precisely from the posi-tions of particles at the corners of the micrographs, and theorientation parameters of the individual particles weredetermined with pft (Fig. 2b). The two images for eachparticle were then combined by reversing the phases inbands to yield a hybrid image with the correct phaseswhich could be used for the refinement of orientationsusing pft (Fig. 2b). The final reconstruction was producedfrom a second set of combined images in which the expo-nential decay was corrected so that the high-resolution datareceived appropriate weight in the structure.
Both approaches are substantial improvements over themore common use of a Weiner filter, which is essentiallythe division of a single image transform by the transferfunction (Fig. 4). The correction and refinement of theCTF using the reconstruction [32,33] has the advantagethat the averaged structure is used so that the correction isperformed on the highest signal-to-noise representation ofthe data. The combination of images to correct the transferfunction prior to reconstruction [6,8] may be more gener-ally useful as it may be difficult to obtain enough good par-ticles on a single high-magnification field to complete areconstruction for larger structures and less well behavedspecimens than HBc.
How good is it?As mentioned previously, the quality of the data for asingle particle reconstruction becomes clear only in retro-spect, in evaluating the quality of the final reconstruction.Both groups continually monitored the progress of theirreconstruction in two ways. The values optimized by therefinement method for individual images (phase residual
746 Structure 1997, Vol 5 No 6
Figure 4
Contrast transfer function (CTF) correction. The effect of CTF correctionon the structure of the MS2 virus capsid protein [30,31]. (a) A ribbondiagram of the MS2 capsid protein quasi-equivalent trimer. Note theposition of the peripheral α helix and the central platforms of β sheet.(b) The CTFs for a CM200FEG (Cs=2mm) operating at 200kV for1.0 µm and 1.5 µm underfocus. The negative of the transfer function isplotted against the abscissa in inverse nm. The high coherence of thesource is indicated by the fact that the transfer function extends to 5 Å.(c–h) A simulation of the effect of the CTF. The atomic positions of theprotein were sampled on a 1 Å grid and low pass filtered to 5 Åresolution before application of the transfer functions. The projections ofthe three-dimensional density convolved with the transfer function for1 µm and 1.5 µm are shown in (c) and (d), respectively. The combinedprojections of the structure with only the phases corrected are shown in(e); the projection with both phases and amplitudes corrected areshown in (f). The surface views of (g) and (h) show that completecorrection makes the presence and size of the α-helical features moreapparent while the β-sheet features are not resolved in either map.

for ccl refinement or phase only cross-correlation coeffi-cient for pft refinement) were used to select the bestparticles at each stage of refinement. The data was alsodivided in half to compute separate maps for the calcula-tion of the Fourier shell correlation [24] or the correspond-ing phase residual as a measure of the progress of therefinement towards defining an average structure. Simulta-neous monitoring of the two measures of resolution deter-mined the course of the refinement. The ccl refinement[7] utilized only particles which displayed a ccl phaseresidual of less than 85o to 1/22Å (90° would be random[11,20,34]) and data between the 1/30 Å and the resolutionat which the current average map showed a phase residualof 45°. The final map was generated from 6384 imagesrefined to a precision of 0.5° and showed a 42° phase resid-ual with a cross-correlation value of 0.5 at 7.4 Å. The pftcross-correlation value [8] was used to rank the particles inthe data set at each stage and eventually to exclude morethan 1000 of the original 1618 T =4 particles selected; thefinal reconstruction contained 600 particles. The resolutionof the final reconstructions was also determined by Fouriershell correlation (FSC) [24] and phase residuals of recon-structions generated from half data sets, and extendedbeyond the resolution of the portion of the data used forrefinement. Conway et al. used data to 14Å to refine to a0.3° precision but demonstrated that their map was reliableto 9.1Å, by FSC, and to similar resolutions by Fourier ringcorrelation (8.4Å) and reliability index (9.0 Å) [8].
The precision of refinement is critical to the finalresolution. The 0.5° and 0.3° step sizes used correspond toa phase error due to misalignment of 38° (= [0.5°/2]/360° × [π×360 Å] [360°/7.4Å]) [7] and 16° (= [0.3°/2]/360°× [π×310Å] [360°/9.1Å]) [8] respectively, at the reso-lutions reported for the reconstructions. The relationshipbetween the different measures of quality can be seen inFigure 3 for different degrees of misorientation. Both theFSC and phase residual values show a sharp change indi-cating the loss of reliability at the same resolution and,hence, are effectively equivalent measures for wellbehaved data sets [24]. The cross-correlation values frompft and the ccl phase residual are shown for the same dataand indicate that loss of precision in alignment rapidlydegrades the resolution of the final result.
An intriguing question is whether the difference in resolu-tion between the two maps (9.1Å versus 7.4Å) is relatedto the number of particles used (600 focus pairs versus6384 images of individual particles). The question isimportant for the generality of the methods for othersystems. A naive geometric calculation shows that a 7.4Åmap requires only 1.86 times more data than a 9.1Å map,but this neglects the fact that the signal-to-noise is lowerat the higher resolution. One possibility is that selection ofthe best third of the particles [8] resulted in a better mapfor the same number of particles than one incorporating
essentially all the particles [7] in a field. The CTF correc-tion method used by Böttcher et al. [7] demands that areconstruction be completed from each of the 34 micro-graphs (i.e. from ~200 particles) and, hence, essentially allof the particles must be kept to define the reconstructionto 7.4 Å. The difference in efficiency may be more appar-ent than real, as can be seen from Figure 2 of Böttcher etal. [7]. The 1000 particle reconstruction of Böttcher et al.[7] yielded an FSC near 0.5 at 9Å, similar to the FSC forthe reconstruction from 600 pairs of particle images ofConway et al. [8]. As the two reconstructions used very dif-ferent imaging conditions and different ways of combiningdata, a definitive answer to this question will only befound by a detailed comparison of the results by the twogroups and the experience of other groups in pursuinghigher resolution.
Trus et al. [9] combined 209 image triplets to produce their9Å map of bovine papillomavirus. They employed a dif-ferent criterion for resolution: the spectral signal-to-noiseratio (SSNR) [35]. SSNR uses the comparison between themap projections and the original images to determine theresolution of the map. One advantage of this approach isthat one can avoid making two independent reconstruc-tions with subsets of the data to determine the resolution.
The limitsThe experience and results of electron crystallography[36,37] and of ordered helical structures [38,39] challengesingle particle work to reach the same resolutions. Theplausibility of reaching higher resolution is demonstratedin an elegant argument presented by Henderson [40] inwhich the limits are defined on the basis of experiencewith two-dimensional crystals. Larger particles are moretractable objects than smaller ones for single particle workbecause of the greater sensitivity of the cross-correlationvalues to orientation. Icosahedral viruses have the advan-tage of size, which allows alignment, and of high symme-try, which increases the averaging in the final structure.For example, the 600 particle T=4 reconstruction is anaverage of 36000 asymmetric units, more than the numberfound in a 2µm square crystal of bacteriorhodopsin. Inaddition, both groups took advantage of the quasi-equiva-lence of the two independent dimers in the asymmetricunit to confirm their interpretations of the secondary struc-ture. Nevertheless, there are both practical and physicalproblems which become more severe as the size of the par-ticle increases. A practical limit is the inconvenience ofdealing with the large data sets required which increasewith the cube of the resolution and the particle size, that is(diameter [Å]× resolution [Å–1])3. A 600 particle recon-struction of a 700Å diameter virus would require27GBytes to store the icosahedrally sampled Fourier trans-forms used in the solution of the linear equations. Theprecision of the alignment must also be increased withincreasing particle size to achieve the same resolution; a
Ways & Means High-resolution icosahedral reconstruction Mancini, de Haas and Fuller 747

0.3° precision for the 310Å HBc is equivalent to a 0.09°precision for the 1100Å adenovirus. A physical limit is thecurvature of the Ewald sphere (i.e. the fact that the topand bottom of a large structure are not in the same focus;Fig. 5) would limit the resolution of a reconstruction of the1100Å adenovirus to 7.5Å with a 200kV microscope. Athigher resolution, other factors, such as the effect of beamtilt, which are routinely corrected in high-resolution elec-tron crystallography must also be corrected [41].
The HBc system is a very intelligent choice for demonstrat-ing the possibility of high-resolution reconstruction. Theparticle is less than 400Å in diameter and can be produced
in highly homogeneous form by bacterial expression [6].Furthermore, the deletion of the C terminus from the con-struct produces a particle without RNA so that essentiallyall of the density of the particle is icosahedral [4,5]. It is avery important structure, not only because of the medicalimportance of hepatitis itself, but also because it can serveas a polyvalent carrier of defined epitopes for immunization[42,43]. Nevertheless, a skeptic could question its general-ity. Most viruses are larger and contain a non-icosahedralgenome which could interfere with alignment. The appear-ance of the 9Å structure of the 600Å bovine papillo-mavirus, however, [9] should ease those misgivings.
One cause for optimism is that the present successes havebeen achieved without invoking all of the high end tech-nology developed for high resolution electron crystallogra-phy. Higher voltage can overcome the curvature of theEwald sphere (Fig. 5) or may be addressed by computa-tional methods such as COMET [44]. Spot scanning[41,45–50] and liquid helium temperature stages [51] mayyield further increases in the signal-to-noise of the individ-ual images, which could prompt another leap in resolutionsimilar to that given by the more coherent FEG illumina-tion. Energy filtering for cryo-electron microscopy of singleparticles [52] holds great promise. Similarly, a number ofgroups have made strides in enhancing the speed of therefinement process by implementing both the pft and cclrefinement methods on parallel computing architectures.Much of this work has been driven by a collegial sharing ofsoftware between the groups working in the field, so thatone groups advance is rapidly utilized by others. Thebreaking of the 10Å barrier has raised expectations andstandards in the field and will motivate further progress.
The future is indeed very bright for cryo-electronmicroscopy of single particles. The range of specimens ismuch broader than for electron crystallography and ismade broader still by the possibility of studying dynamicchanges [19,53] and heterogeneous populations. Thestudy of particles with lower symmetry [53,54] and withoutsymmetry [2,3] is already well underway. As structuralbiology reaches for a deeper understanding of the biologi-cal processes mediated by large complexes, it has becomeclear that the solution of a portion of a structure by crystal-lographic or spectroscopic methods is only the first step.One must turn to microscopy to find the context in whichthe structure functions. In a number of cases, microscopyhas shown dramatic conformational changes between thestructure of the isolated protein in the crystal and in thefunctional complex. Higher resolution is critical to a defin-ition of these changes; cryo-electron microscopy’s matura-tion opens this possibility.
AcknowledgementsThe authors are indebted to James Conway and Alasdair Steven (NIAMSD,NIH Bethesda) and RA Crowther (MRC LMB, Cambridge) for extensive andpatient discussions concerning their work and for their comments on the
748 Structure 1997, Vol 5 No 6
Figure 5
Effect of particle diameter on defocus phase error. (a) The maximaldefocus phase error, due to thickness, for a 400 Å diameter particleshown in degrees for different voltages. The maximal phase error isderived from the difference in the transfer function between the topand bottom of the particle. The average phase error from this causewill be one half of the plotted value. (b) The resolution for which thisdefocus phase error will be equal to 45° for particles of differentdiameters at several voltages. The water layer of a specimen used forcryo-electron microscopy is typically ~1000 Å thick so the height ofthe specimen within the layer may also vary and lead to a defocusphase error.
0
45
90
2345678910
Pha
se e
rror
Resolution (Å)
100kV200kV 400kV
1000kV
0
2
4
6
8
10
50 200 350 500 650 800 950 1100
Res
olut
ion
(Å)
Thickness (Å)
100 kV
400 kV
200 kV
1000 kV
(a)
(b)

manuscript before its submission. We also thank TS Baker (Purdue), RHCheng (Stockholm), Ulf Skoglund (Stockholm), Michael Radermacher (MPI,Frankfurt), Benes Trus (NIAMSD,NIH) and Da Nang Wang (New York) fordiscussions of their work prior to its publication.
References1. Unwin, P.N.T. & Henderson, R. (1975). Molecular structure
determination by electron microscopy of unstained crystallinespecimens. J. Mol. Biol. 94, 425–440.
2. Frank, J., et al., & Agrawal, R. (1995). A model of protein synthesisbased on cryo-electron microscopy of the Escherichia coli ribosome.Nature 376, 441–444.
3. Stark, H., et al., & van Heel, M. (1995). The 70S Escherichia coliribosome at 23 Å resolution: fitting the ribosomal RNA. Structure 3,815–821.
4. Crowther, R., et al., & Pumpens, P. (1994). Three-dimensionalstructure of hepatitis B virus core particles determined by electroncryo-microscopy. Cell 77, 943–950.
5. Kenney, J., von Bonsdorf, C.-H., Nassel, M. & Fuller, S.D. (1995).Evolutionary conservation in the hepatitis B core structure:comparison of human and duck cores. Structure 3, 1009–1019.
6. Zlotnick, A. (1996). Dimorphism of hepatis B capsids is stronglyinfluenced by the C terminus of the capsid protein. Biochemistry 35,7412–7421.
7. Böttcher, B., Wynne, S.A. & Crowther, R.A. (1997). Determination ofthe fold of the core protein of hepatitis B virus by electroncryomicroscopy. Nature 386, 88–91.
8. Conway, J.F., Cheng, N., Zlotnick, A., Wingfield, P.T., Stahl, S.J. andSteven, A.C. (1997). Visualization of the 4-helix bundle in thehepatitis B virus capsid by cryo-electron microscopy. Nature 386,91–94.
9. Trus, B.L., Roden, R.B.S., Greenstone, H.L., Vrhel, M., Schiller, J.T. &Booy, F.P. (1997). Novel structural features of bovine papillomaviruscapsid revealed by three-dimensional reconstruction to 9 Å resolution.Nat. Struct. Biol. 4, 413–420.
10. Dubochet, J., et al., & Schultz, P. (1988). Cryo-electron microscopy ofvitrified specimens. Q. Rev. Biophys. 21, 129–228.
11. Fuller, S.D., Butcher, S.J., Cheng, R.H. & Baker, T.S. (1996). Three-dimensional reconstruction of icosahedral particles: the uncommonline. J. Struct. Biol. 116, 48–55.
12. Crowther, R.A., DeRosier, D.J. & Klug, A. (1970). The reconstructionof a three-dimensional structure from projections and its application toelectron microscopy. Proc. R. Soc. Lond. Ser. A 317, 319–340.
13. Crowther, R.A. (1971). Procedures for three-dimensionalreconstruction of spherical viruses by Fourier synthesis fromelectron micrographs. Philos. Trans. R. Soc. Lond. Biol. 261,221–230.
14. Adrian, M., Dubochet, J., Lepault, J. & McDowall, A.W. (1984). Cryo-electron microscopy of viruses. Nature 308, 32–36.
15. Wade, R.H. & Chrétien, D. (1993). Cryo-electron microscopy ofmicrotubules. J. Struct. Biol. 110, 1–27.
16. Chrétien, D., Fuller, S.D. & Karsenti, E. (1995). Structure of growingmicrotubule ends: two-dimensional sheets close into tubes at variablerates. Cell Biol. 129, 1311–1328.
17. Chrétien, D., Kenney, J.M., Fuller, S.D. & Wade, R.H. (1996).Determination of microtubule polarity by cryo-electron microscopy.Structure 4, 1031–1040.
18. Fuller, S.D. (1987). The T = 4 envelope of sindbis virus is organized bycomplementary interactions with a T = 3 icosahedral capsid. Cell 48,923–934.
19. Fuller, S.D., Berriman, J.A., Butcher, S.J. & Gowen, B.E. (1995). LowpH induces the swivelling of the glycoprotein heterodimers in theSemliki Forest virus spike complex. Cell 81, 715–725.
20. Crowther, R.A., Amos, L.A., Finch, J.T., De Rosier, D.J. & Klug, A.(1970). Three-dimensional reconstructions of spherical viruses byFourier synthesis from electron micrographs. Nature 226,421–423.
21. Baker, T.S. & Cheng, R.H. (1996). A model-based method fordetermining orientations of biological molecules by cryo-electronmicroscopy. J. Struct. Biol. 116, 120–130.
22. Zemlin, F. (1994). Expected contribution of the field-emission gun tohigh resolution transmission electron microscopy. Micron 25, 223–226.
23. Crowther, R.A. & Amos, L.A. (1972). Three-dimensional imagereconstruction of some small spherical viruses. Cold Spring Harb.Symp. Quant. Biol. 36, 489–494.
24. van Heel, M. (1987). Similarity measures between images.Ultramicroscopy 21, 95–100.
25. Cheng, H., Olson, N.H., Baker, T.S., Kuhn, R.J. & Smith, T.J. (1995).Cryo-electron microscopy, antibody labelling and image analysisreveals macromolecular interactions in enveloped alphavirus. Zool.Stud. Suppl. 34, 130–131.
26. Hewat, E.A. & Blaas, D. (1996). Structure of a neutralizing antibodybound bivalently to human rhinovirus 2. EMBO J. 15, 1515–1523.
27. Liu, H., et al., & Baker, T.S. (1994). Structure determination of an Fabfragment that neutralizes human rhinovirus 14 and analysis of theFab–virus complex. J. Mol. Biol. 240, 127–137.
28. Rossmann, M.G., et al., & Baker, T.S. (1994). Crystallographic and cryoEM analysis of virion-receptor interactions. Arch. Virol. Suppl. 9, 531–41.
29. Aldroubi, A., Trus, B., Unser, M., Booy, F.P. & Steven, A.C. (1992).Magnification mismatches between micrographs: corrective proceduresand implications for structural analysis. Ultramicroscopy 46, 175–188.
30. Valegård, K., Murray, J.B., Stockley, P.G., Stonehouse, N.J. & Liljas, L.(1994). Crystal structure of an RNA bacteriophage coatprotein–operator complex. Nature 371, 623–626.
31. Valegård, K., Liljas, L., Fridborg, K. & Unge, T. (1990). The three-dimensional structure of the bacterial virus MS2. Nature 345, 36–41.
32. Böttcher, B. & Crowther, R.A. (1996). Difference imaging reveals orderedregions of RNA in turnip yellow mosaic virus. Structure 4, 387–394.
33. Böttcher, B., Kiselev, N.A., Stel’mashchuk, V.Y., Perevozchikova, N.A.,Borisov, A.V. & Crowther, R.A. (1997). Three-dimensional structure ofthe infectious bursal disease virus determined by electroncryomicroscopy. J. Virol. 71, 325–330.
34. Stewart, P., Burnet, R., Cyrklaff, M. & Fuller, S.D. (1991). Imagereconstruction reveals the complex molecular organization ofadenovirus. Cell 67, 145–154.
35. Unser, M. Resolution assessment of 3D reconstruction by spectralsignal-to-noise ratio.11th EUREM 1996, Dublin, Ireland.
36. Kühlbrandt, W., Wang, D.N. & Fugiyoshi, Y. (1994). Atomic model ofplant light-harvesting complex by electron crystallography. Nature 367,614–621.
37. Henderson, R., Baldwin, J.M., Agard, D.M. & Leifer, D. (1983). High-resolution structural analysis of purple membrane. Elec. Microsc. Soc.Amer. Proc. 41, 418–421.
38. Morgan, D.G., Owen, C., Melanson, L.A. & DeRosier, D.J. (1995).Structure of bacterial flagellar filaments at 11 Å resolution: packing ofthe α-helices. J. Mol. Biol. 249, 88–110.
39. Jeng, T.-W., Crowther, R.A., Stubbs, G. & Chiu, W. (1989).Visualization of α-helices in tobacco mosaic virus by cryo-electronmicroscopy. J. Mol. Biol. 205, 251–257.
40. Henderson, R. (1995). The potential and limitations of neutrons,electrons and X-rays for atomic resolution microscopy of unstainedbiological molecules. Q. Rev. Biophys. 28, 171–193.
41. Henderson, R., Baldwin, J.M., Ceska, T.A., Zemlin, F., Beckmann, E. &Downing, K.H. (1990). Model for the structure of bacteriorhodopsinbased on high-resolution electron cryomicroscopy. J. Mol. Biol. 213,899–929.
42. Schödel, F., Neckermann, G., Peterson, D., Fuchs, K., Fuller, S.D.,Will, H. & Roggendorf, M. (1993). Immunization with recombinantwoodchuck hepatitis virus nucleocapsid antigen or hepatitis B virusnucleocapsid antigen protects woodchucks from woodchuck hepatitisvirus infection. Vaccine 11, 624–628.
43. Pumpens, P., Borisova, G.P., Crowther, R.A. & Grens, E. (1995).Hepatitis B virus core particles as epitope carriers. Intervirology 38,63–74.
44. Skoglund, U., Öfverstedt, L.-G., Burnett, R. & Bricogne, G. (1995).Maximum-entropy three-dimensional reconstruction with deconvolutionof the contrast transfer function: a test application with adenovirus. J.Struct. Biol. 117, 173–188.
45. Downing, K.H. & Glaeser, R. (1986). Improvement in high resolutionimage quality of radiation-sensitive specimens achieved with reducedspot size of the electron beam. Ultramicroscopy 20, 269–278.
46. Downing, K.H. (1988). Observations of restricted beam-inducedspecimen motion with small-spot illumination. Ultramicroscopy 24,387–398.
47. Downing, K.H. (1991). Spot-scan imaging in transmission electronmicroscopy. Science 251, 53–59.
48. Jap, B.K., Downing, K.H. & Wailian, P. (1990). Structure of PhoE inprojection at 3.5 Å resolution. J. Struct. Biol. 103, 57–63.
49. Kühlbrandt, W. & Downing, K.H. (1989). Two-dimensional structure ofplant light-harvesting complex at 3.7 Å resolution by electroncrystallography. J. Mol. Biol. 207, 823–828.
50. Zhou, Z.H. & Chiu, W. (1993). Prospects for using an IVEM with aFEG for imaging macromolecules towards atomic resolution.Ultramicroscopy 49, 407–416.
Ways & Means High-resolution icosahedral reconstruction Mancini, de Haas and Fuller 749

51. Zemlin, F. (1992). Desired features of cryo-electron microscope forthe electron crystallography of biological material. Ultramicroscopy 46,25–32.
52. Langmore, J.P. & Smith, M.F. (1992). Quantitative energy-filteredelectron microscopy of biological molecules in ice. Ultramicroscopy46, 349–373.
53. Roseman, A.M., Chen, S., White, H., Braig, K. & Saibil, H.R. (1996).The chaperonin ATPase cycle: mechanism of allosteric switching andmovements of substrate binding domains in GroEL. Cell 87, 241–251.
54. Radermacher, M. & Wagenknecht, T. (1994). Cryo-electronmicroscopy and three-dimensional image reconstruction of thecalcium release channel/ryanodine receptor from skeletal muscle. J.Cell Biol. 127, 411–423.
55. Vogel, R.H., Provencher, S.W., Bonsdorff, C.-H., Adrian, M. &Dubochet, J. (1986). Envelope structure of Semliki Forest virusreconstructed from cryo-electron micrographs. Nature 320, 533–535.
56. Baker, T.S., Drak, J. & Bina, M. (1988). Reconstruction of the three-dimensional structure of simian virus 40 and visualization of thechromatin core. Proc. Natl. Acad. Sci. USA 85, 422–426.
57. Baker, T.S., Newcomb, W.W., Booy, F.P., Brown, J.C. & Steven, A.C.(1990). Three-dimensional structures of maturable and abortivecapsids of equine herpesvirus 1 from cryo-electron microscopy.J. Virol. 64, 563–573.
58. Baker, T.S., Newcomb, W.W., Olson, N.H., Cowsert, L.M., Olson, C. &Brown, J.C. (1991). Structures of bovine and human papillomaviruses: analysis by cryo-electron microscopy and three-dimensionalimage reconstruction. Biophys. J. 60, 1445–1456.
59. Butcher, S.J., Bamford, D.H. & Fuller, S.D. (1995). DNA packagingorders the membrane of bacteriophage PRD1. EMBO J. 14,6078–6086.
60. Cheng, R.H., Olson, N.H. & Baker, T.S. (1992). Cauliflower mosaicvirus: a 420 subunit (T = 7), multi-layer structure. Virology 186,655–668.
61. Cheng, R.H., Reddy, V.S., Olson, N.H., Fisher, A.J., Baker, T.S. &Johnson, J.E. (1994). Functional implications of quasi-equivalence in aT = 3 icosahedral animal virus established by cryo-electron microscopyand X-ray crystallography. Structure 2, 271–282.
62. Cheng, R.H., et al., & Baker, T.S. (1995). Nucleocapsid andglycoprotein organization in an enveloped virus. Cell 80, 621–630.
63. Conway, J.F., Duda, R.L., Cheng, N., Hendrix, R.W. & Steven, A.C.(1995). Proteolytic and conformational control of virus capsidmaturation: the bacteriophage HK97 system. J. Mol. Biol. 253,86–99.
64. Dokland, T. & Murialdo, H. (1993). Structural transitions duringmaturation of bacteriophage lambda capsids. J. Mol. Biol. 233,682–694.
65. Dokland, T., Lindqvist, B.H. & Fuller, S.D. (1992). Imagereconstruction from cryo-electron micrographs reveals themorphopoietic mechanism in the P2-P4 bacteriophage system. Eur.Mol. Biol. Org. J. 11, 839–846.
66. Dryden, K.A., et al., & Baker, T.S. (1993). Early steps in reovirusinfection are associated with dramatic changes in supramolecularstructure and protein conformation: analysis of virions and subviralparticles by cryo-electron microscopy and image reconstruction.J. Cell Biol. 122, 1023–1041.
67. Hagensee, M.E., Olson, N.H., Baker, T.S. & Galloway, D.A. (1994).Three-dimensional structure of vaccinia virus-produced humanpapillomavirus type 1 capsids. J. Virol. 68, 4503–4505.
68. Ilag, L.L., et al, & Incardona, N.L. (1995). DNA packagingintermediates of bacteriophage φX174. Structure 3, 353–363.
69. Kenney, J.M., Sjöberg, M., Garoff, H. & Fuller, S.D. (1994). Fusionactivation of the Semliki Forest virus spike complex. Structure 2,823–832.
70. Olson, N.H., Baker, T.S., Johnson, J.E. & Hendry, D.A. (1990). Thethree-dimensional structure of frozen-hydrated Nudaurelia capensis βvirus, a T = 4 insect virus. J. Struct. Biol. 105, 111–122.
71. Porta, C., Wang, G., Cheng, H., Chen, Z., Baker, T.S. & Johnson, J.E.(1994). Direct imaging of interactions between an icosahedral virusand conjugate F(ab) fragments by cryo-electron microscopy and X-raycrystallography. Virology 204, 777–788.
72. Wikoff, W.R., et al., & Rossmann, M.G. (1994). The structure of aneutralized virus: canine parvovirus complexed with neutralizingantibody fragment. Structure 2, 595–607.
73. Trus, B.L., et al., & Steven, A.C. (1995). Herpes simplex virus capsidsassembled in insect cells infected with recombinant baculoviruses:structural authenticity and localization of VP26. J. Virol. 69,7362–7366.
74. Speir, J., Munshi, S., Wang, G., Baker, T.S. & Johnson, J.E. (1995).Structures of the native and swollen forms of cowpea chlorotic mottlevirus determined by X-ray crystallography and cryo-electronmicroscopy. Structure 3, 63–78.
75. Smith, T.J., et al., & Baker, T.S. (1995). Putative receptor binding siteson alphaviruses as visualized by cryo-electron microscopy. Proc. Natl.Acad. Sci. USA 92, 10648–10652.
76. Marvik, O.J., Dokland, T.E., Nøkling, R.H., Jacobsen, E., Larsen, T. &Lindqvist, B.H. (1995). The capsid size-determining protein Sid formsan external scaffold on phage P4 procapsids. J. Mol. Biol. 251,59–75.
77. Zhou, Z.H., Prasad, B.V., Jakana, J., Rixon, F.J. & Chiu, W. (1994).Protein subunit structures in the herpes simplex virus A-capsiddetermined from 400 kV spot-scan electron cryomicroscopy. J. Mol.Biol. 242, 456–69.
78. Singh, S., Rothnagel, R., Prasad, B. & Buckley, B. (1995). Expressionof tobacco ringspot virus capsid protein and satellite RNA in insectcells and three-dimensional structure of tobacco ringspot virus-likeparticles. Virology 213, 472–81.
79. Hewat, E.A., Booth, T.F. & Roy, P. (1992). Structure of bluetonguevirus particles by cryo-electron microscopy. J. Struct. Biol. 109,61–69.
80. Thuman-Commicke, P., et al., & Chiu, W. (1996). Three-dimensionalStructure of scaffolding-containing phage P22 procapsids by electoncryo-microscopy. J. Mol. Biol. 260, 85–98.
81. Wingfield, P.T., Stahl, S.J., Williams, R.W. & Steven, A.C. (1995).Hepatitis core antigen produced in Escherichia coli: subunitcomposition, conformational analysis and in vitro capsid assembly.Biochemistry 34, 4919–4932.
750 Structure 1997, Vol 5 No 6