Embed Size (px)
Citation preview

HIGH-RESOLUTION HOLOCENE ALLUVIAL CHRONOSTRATIGRAPHY AT
ARCHAEOLOGICAL SITES IN EASTERN GRAND CANYON, ARIZONA
by
Erin Margaret Tainer
A thesis submitted in partial fulfillment of the requirements for the degree
of
MASTER OF SCIENCE
in
Geology
Approved: ________________________ ________________________ Joel L. Pederson Tammy M. Rittenour Major Professor Committee Member ________________________ ________________________ John C. Schmidt Byron R. Burnham Committee Member Dean of Graduate Studies
UTAH STATE UNIVERSITY Logan, Utah
2010

ii
Copyright © Erin M. Tainer 2010
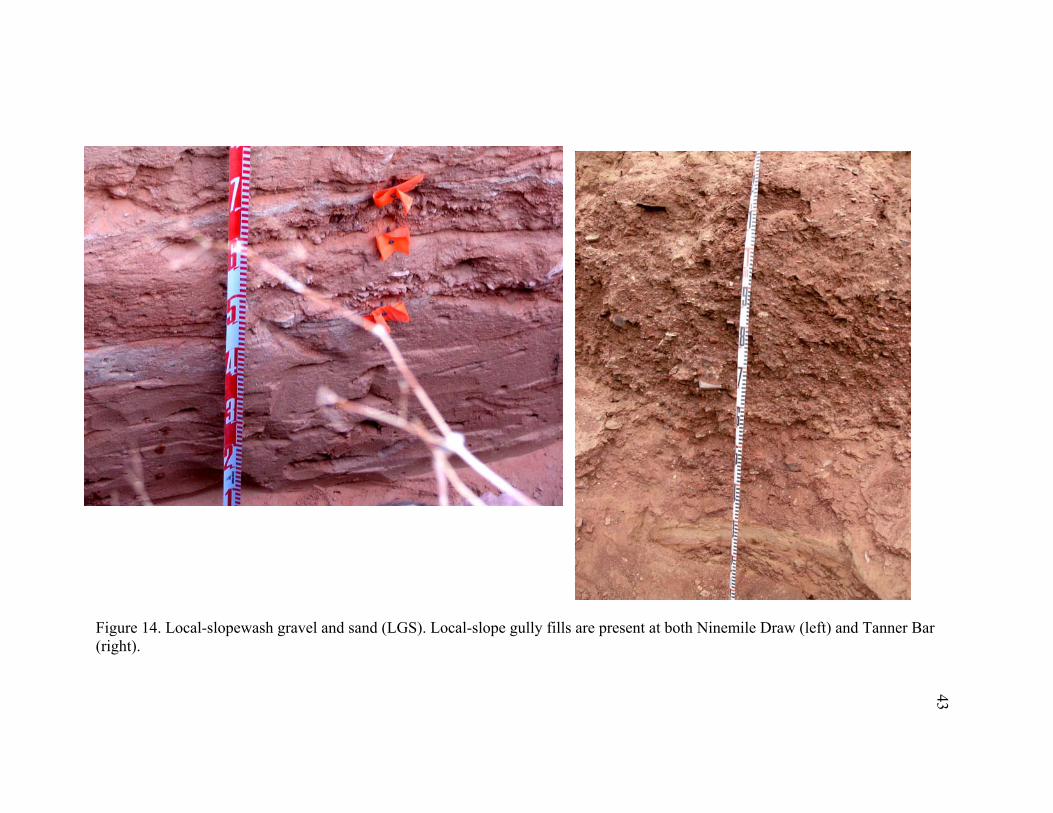
All Rights Reserved
iiiABSTRACT
High-resolution Holocene Alluvial Chronostratigraphy at Archaeological Sites in
Eastern Grand Canyon, Arizona
by
Erin M. Tainer, Master of Science
Utah State University, 2009
Major Professor: Dr. Joel L. Pederson Department: Geology
Understanding the nature of Colorado River deposits in Grand Canyon helps
reveal how the river responds to changes in its Colorado Plateau tributaries and Rocky
Mountain headwaters. This study focused on Holocene alluvial deposits associated with
archaeological sites excavated near Ninemile Draw in Glen Canyon and at Tanner Bar in
eastern Grand Canyon. Two previously-developed conceptual models of deposition were
tested based on previous work. Previous researchers have suggested that Holocene
alluvial deposits in Grand Canyon are a series of inset aggradational packages that
correlate to valley fills and arroyo-cutting cycles in Colorado Plateau tributaries and are
laterally consistent throughout the river corridor. An alternate hypothesis is that alluvial
packages record paleoflood sequences along the Colorado River with no Holocene
change in river grade. In this model, deposits are preserved more variably as a function
of local hydrologic geometry, and they should be less correlatable.

ivDetailed stratigraphic columns of terrace deposits and several stratigraphic
panels of archaeological trenches, combined with facies interpretations, were used to
reconstruct a high-resolution alluvial history at two locations. Optically stimulated
luminescence (OSL) and radiocarbon dating methods were used at both locations with
consistent results. At both sites, the sediment includes multiple depositional facies of
mainstem and local-source material, and it consists of stratal packages bound by
unconformities.
These stratigraphic relations, combined with geochronology, lead to the
interpretation that the alluvium is composed of six correlatable alluvial packages at
overlapping heights above river level throughout the canyon. The four older packages
include facies that imply aggradation throughout the river corridor, suggesting
oscillations in river grade. The youngest two packages consist only of mainstem flood
deposits. These packages suggest that preservation of deposits over the past ~1 ky has
not been driven by aggradation, although incision since ~1 ky is possible. Comparison of
the interpreted chronostratigraphy to climate records suggests that this large river’s grade
has not responded visibly to smaller century to millennial-scale climate oscillations.
This work is the first to document that the alluvial record in Grand Canyon spans the
entire Holocene, and conclusions support to both previous conceptual models of
deposition.
(177 pages)
vACKNOWLEDGMENTS
I will be forever grateful to Joel Pederson for giving me the opportunity to work
on this project and for his endless edits. Joel has a contagious passion for geology that I
will carry with me into my future career. Also, thanks to my committee members,
Tammy Rittenour and Jack Schmidt, for their support and encouragement throughout this
project.
Field work would not have been possible without a few key individuals. I am
grateful for Gary O’Brien’s help with field work and trip logistics. Also, thanks to
Natali Zollinger for accompanying me to Tanner Bar, and helping with facies analyses. I
am grateful to Jon Harvey for help with field work and immense moral support. Thanks
to the archaeologists and support crew- Jonathan Damp, Jennifer Dierker, Kenny
Bowekaty, Fernando Peywa, Jeff Waseta, and Eugene Bowekaty, Nicholas Damp, and
Brian Dierker. Thanks to Tammy Rittenour and Melissa Jackson for their help in the
OSL lab. Lastly, thanks to all of the USU geomorphology students for their support.
Funding for this project came from multiple sources. One source of funding was
a contract from the U.S. Department of the Interior Bureau of Reclamation awarded to
Utah State University to conduct geoarchaeological investigations at a series of cultural
sites along the Colorado River corridor in Grand Canyon National Park. Additional
funding came from the Four Corners Geological Society and the Salt Lake Association of
Women Geoscientists. Thanks to the National Park Service for issuing permits that made
the field work for this project possible.
Erin M. Tainer

viCONTENTS
Page
ABSTRACT....................................................................................................................... iii ACKNOWLEDGMENTS .................................................................................................. v CONTENTS....................................................................................................................... vi LIST OF TABLES........................................................................................................... viii LIST OF FIGURES ............................................................................................................ x INTRODUCTION .............................................................................................................. 1 BACKGROUND ................................................................................................................ 3
Holocene Alluvium in the Colorado Plateau ................................................................... 3 Holocene Paleoclimate in the Colorado Plateau.............................................................. 4 Holocene Paleoclimate in the Rocky Mountains ............................................................. 7 Previous Geomorphic Research in Grand Canyon .......................................................... 8 Previous Work on Holocene Alluvial Terraces in Grand Canyon................................. 10
STUDY LOCATIONS...................................................................................................... 17 Ninemile Draw Geomorphic Setting ............................................................................. 22 Previous Work at Ninemile Draw...................................................................................22 Tanner Bar Geomorphic Setting .................................................................................... 23 Previous Work at Tanner Bar ........................................................................................ 24
METHODS ........................................................................................................................27
Sedimentology Methods ................................................................................................ 27 Surveying ....................................................................................................................... 33 Geochronology............................................................................................................... 33 AMS Radiocarbon ......................................................................................................... 33 Optically Stimulated Luminescence (OSL) ................................................................... 34
RESULTS AND INTERPRETATIONS .......................................................................... 37
Facies ............................................................................................................................. 37 Ninemile Draw............................................................................................................... 46

vii Stratigraphy.............................................................................................................. 46
Archaeological Study Unit Stratigraphy and Interpretations................................... 51 Geochronology......................................................................................................... 55 Tanner Bar- C:13:323 .................................................................................................... 57 Stratigraphy.............................................................................................................. 57 Archaeological Study Unit Stratigraphy and Interpretations................................... 59 Geochronology......................................................................................................... 61 Tanner Bar Geomorphoic Study Gully .......................................................................... 64 Stratigraphy.............................................................................................................. 64 Geochronology......................................................................................................... 67 Tanner Bar- C:13:323 .................................................................................................... 67 Stratigraphy.............................................................................................................. 67 Archaeological Study Unit Stratigraphy and Interpretations................................... 71
Geochronology .........................................................................................................72 Summary of Tanner Bar Stratigraphy............................................................................ 73
DISCUSSION................................................................................................................... 75
Revised Eastern Grand Canyon Holocene Stratigraphy ................................................ 75 Correlations to Previous Work and Paleoclimate .......................................................... 82
CONCLUSIONS............................................................................................................... 89 REFERENCES ................................................................................................................. 91 APPENDICES .................................................................................................................. 98
Appendix A: TANNER BAR TEXTURE AND COMPOSITION RESULTS............. 99 Appendix B: STRATIGRAPHIC COLUMNS AND DESCRIPTIONS..................... 101 Appendix C: ARCHAEOLOGICAL STUDY UNIT STRATIGRAPHIC PANELS
AND DESCRIPTIONS....................................................................................... 118 Appendix D: PALEOCURRENT DATA .................................................................... 141 Appendix E: OPTICALLY STIMULATED LUMINESCENCE RESULTS ............. 145 Appendix F: AMS RADIOCARBON RESULTS ....................................................... 162
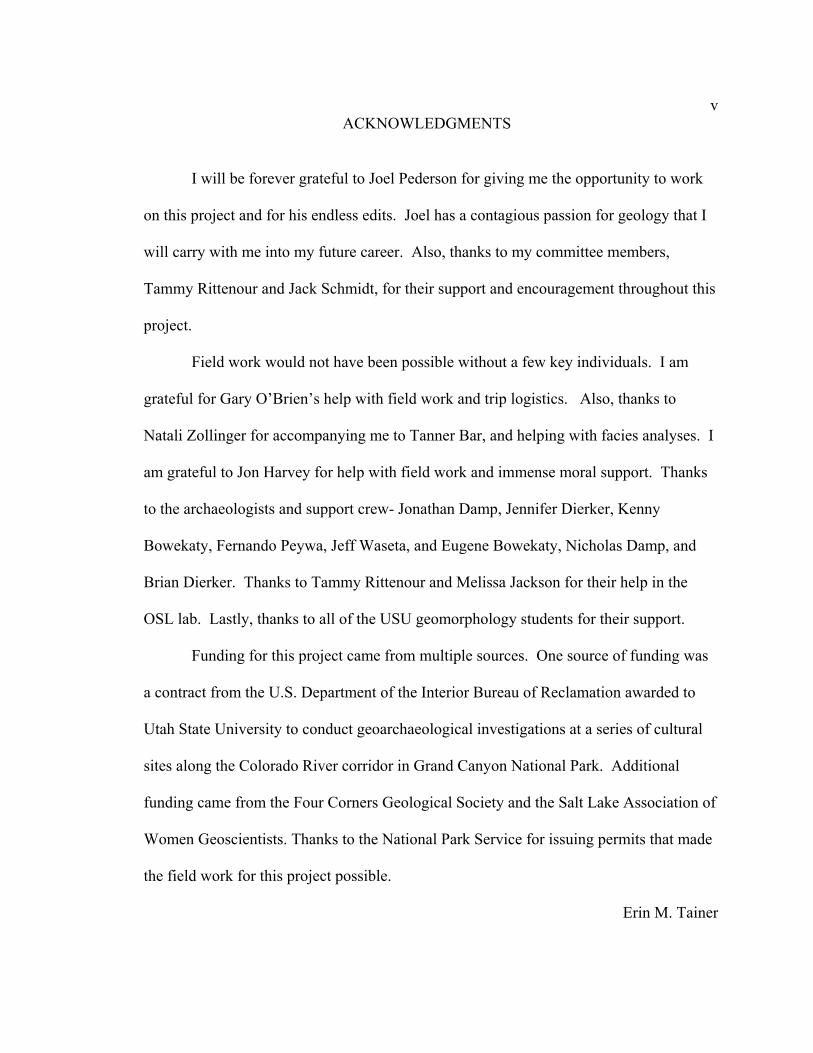
viiiLIST OF TABLES
Table Page 1 FACIES DESIGNATIONS AND DESCRIPTIONS ............................................. 37 2 RESULTS OF DETAILED SEDIMENTARY ANALYSIS AT TANNER BAR..46 3 NINEMILE DRAW LUMINESCENCE PRELIMINARY AGES AND
RADIOCARBON RESULTS ...............................................................................54 4 TANNER BAR LUMINESCENCE PRELIMINARY AGES AND
RADIOCARBON RESULTS ...............................................................................63 A.1 TANNER BAR TEXTURE AND COMPOSITION RESULTS .........................100 B.1 NINEMILE DRAW PACKAGE A UNIT DESCRIPTIONS ..............................103 B.2 NINEMILE DRAW PACKAGE B UNIT DESCRIPTIONS .......................104-106 B.3 NINEMILE DRAW PACKAGE C UNIT DESCRIPTIONS………...….....…...108 B.4 NINEMILE DRAW PACKAGE D UNIT DESCRIPTIONS ………….......…...110 B.5 TANNER BAR GEOMORPHIC STUDY GULLY UNIT DESCRIPTIONS .....112 B.6 TANNER BAR C:13:327 UNIT DESCRIPTIONS ......................................114-117 C.1 DETAILED C:13:323 SU 16 UNIT DESCRIPTIONS .......................................130 C.2 DETAILED C:13:327 SU 3 UNIT DESCRIPTIONS .........................................133 C.3 DETAILED C:13:327 SU 5 UNIT DESCRIPTIONS .........................................136 C.4 DETAILED C:13:327 SU 6 UNIT DESCRIPTIONS .........................................138 D.1 NINEMILE DRAW PALEOCURRENT DATA .................................................142 D.2 TANNER BAR C:13:323 PALEOCURRENT DATA ........................................143 D.3 TANNER BAR GEOMORPHIC STUDY GULLY PALEOCURRENT DATA ..................................................................................................................143 D.4 TANNER BAR C:13:327 PALEOCURRENT DATA ........................................144

ix E.1 OVERVIEW OF PRELIMINARY OSL AGES FROM NINEMILE DRAW ....145 E.2 OVERVIEW OF PRELIMINARY OSL AGES FROM TANNER BAR ...........147 F.1 OVERVIEW OF RADIOCRABON AGES FROM NINEMILE DRAW ...........163 F.2 OVERVIEW OF RADIOCARBON AGES FROM TANNER BAR ..................164
xLIST OF FIGURES
Figure Page
1 Previous chronology of Holocene terraces in Grand Canyon……………………..12 2 Conceptual model of inset packages of Holocene alluvium................................... 13 3 Conceptual model of stacked and inset flood deposits. .......................................... 16 4 Location map of eastern Grand Canyon sites. ........................................................ 18 5 Detailed location map of Ninemile Draw study site............................................... 19 6 Detailed location map of Tanner Bar study site...................................................... 20 7 Topographic map of Ninemile Draw study site (C:02:032) with
archaeological study units labeled. ....................................................................... 28 8 Topographic map of Tanner Bar study locations with archaeological and
geomorphic study units labeled ............................................................................ 29 9 Facies MSlr and MSSlr with plane-bed laminations and thin ripple
cross-bedding ....................................................................................................... .38 10 Massive mainstem sand, facies MSm. .................................................................... 39 11 Mainstem channel gravel facies, MCG................................................................... 40 12 Mainstem-reworked sand with laminations, MRSlr. .............................................. 41 13 Local mud lens facies, LM...................................................................................... 41 14 Local-slopewash gravel and sand (LGS) ................................................................ 43 15 Eolian sand, facies ES............................................................................................. 44 16 Anthropogenic unit, facies A .................................................................................. 45 17 Ninemile Draw stratigraphic panel location and enlargement with
unconformity-bound stratal packages A-D........................................................... 48 18 Ninemile Draw generalized stratigraphic column with geochronology
sample locations.................................................................................................... 49

xi19 Stratigraphic panel of C:2:032 SU 1. ...................................................................... 52 20 Initial geochronology results from the Ninemile Draw stratigraphic panel
outcrop. ................................................................................................................. 56 21 A) Stratigraphy and initial OSL sample results from the Tanner Bar
C:13:323 archaeological site. B) Stratigraphy and initial OSL results from the Tanner Bar geomorphic study gully....................................................... 58
22 Stratigraphic column of C:13:323 SU 7.................................................................. 60 23 Stratigraphic column of C:13:323 SU 5.................................................................. 62 24 Generalized stratigraphic column of Tanner Bar geomorphic study gully
with OSL sample locations ................................................................................... 66 25 Stratigraphic column of sediment exposed by the gully cutting through the
C:13:327 archaeological site................................................................................. 69 26 Stratigraphic panel of C:13:327 SU 6..................................................................... 70 27 Upstream-to-downstream transect schematic of Tanner Bar Holocene
alluvium along the ~400 m-long the terrace riser.. ............................................... 74 28 Graph of preliminary geochronology results from Ninemile Draw
combined with results from Tanner Bar ............................................................... 76 29 Compiled schematic of Holocene Grand Canyon alluvium at both study
locations ................................................................................................................ 77 30 Graph comparing depositional packages to early Holocene paleoclimate
proxy curves, including global and regional proxies ............................................ 84 31 Graph of early Holocene paleoclimate proxy curves ..............................................86 32 Graph comparing depositional packages to Grand Canyon paleoclimate
proxies from the Grand Canyon region for the past 1.2 ka................................... 88 B.1 Stratigraphic column of Ninemile Draw Packages A and B with units and
geochronology sample locations labeled .............................................................102 B.2 Stratigraphic column of Ninemile Draw Package C with units and
geochronology sample locations labeled .............................................................107

xiiB.3 Stratigraphic column of Ninemile Draw Package D with units and
geochronology sample locations labeled .............................................................109 B.4 Tanner Bar geomorphic study gully stratigraphic column with OSL sample
locations labeled ..................................................................................................111 B.5 Tanner Bar C:13:327 stratigraphic column with OSL sample locations labeled .................................................................................................................113 C.1 Photo and stratigraphic panel of C:02:032 SU 1 .................................................. 119 C.2 Photo and stratigraphic panel of C:02:032 SU 2 .................................................. 120 C.3 Photo and stratigraphic panel of C:02:032 SU 3 .................................................. 121 C.4 Photo and stratigraphic panel of C:02:032 SU 4 Profile A .................................. 122 C.5 Photo and stratigraphic panel of C:02:032 SU 4, Profile B .................................. 123 C.6 Photo and stratigraphic panel of C:02:032 SU 4, below the hearth ..................... 124 C.7 Photo and stratigraphic panel of C:13:323 SU 3 1 x 1 ......................................... 125 C.8 Photo and stratigraphic panel of C13:323 SU 4 1x1 ............................................ 126 C.9 Photo and stratigraphic panel of C13:323 SU 5 1x1 ..............................................127 C.10 Photo and stratigraphic panel of C13:323 SU 7 1x1 ............................................ 128 C.11 Photo and stratigraphic panel of C13:323 SU 16 ................................................. 129 C.12 Photo and stratigraphic panel of C13:327 SU 2 . .................................................. 131 C.13 Photo and stratigraphic panel of C:13:327 SU 3 .................................................. 132 C.14 Photo and stratigraphic panel of C13:327 SU 4 . .................................................. 134 C.15 Photo and stratigraphic panel of C13:327 SU 5 ................................................... 135 C.16 Photo and stratigraphic panel of C13:327 SU 6 ................................................... 137 C.17 Photo and stratigraphic panel of C13:327 SU 7 ................................................... 139 C.18 Photo and stratigraphic panel of C13:327 SU 8 ................................................... 140

INTRODUCTION
The Colorado River is well-known for the spectacular erosion it has driven along
its length, especially in Grand Canyon. The river receives most of its water from the
Rocky Mountains but most of its sediment from the Colorado Plateau (Andrews, 1991),
and it has integrated conditions in both regions into a complex alluvial history. This
history has undoubtedly been influenced by changes in runoff and sediment yield, some
of which have been recorded in alluvium along the Colorado River corridor in Grand
Canyon. Human habitation of the area was also influenced by changes in river behavior
(Fairley, 2003), and the alluvial record preserves important information about
archaeology along the river corridor.
The overall objective of this research was to gain a better understanding of the
Holocene alluvial history of Grand Canyon by combining detailed stratigraphic data and
interpretations with geochronology. The study areas include Ninemile Draw, in Glen
Canyon, and Tanner Bar, in eastern Grand Canyon. These two locations host some of the
best preserved and exposed Holocene deposits in the eastern Grand Canyon region.
Excellent stratigraphic exposure was available because this research was done in
conjunction with archaeological excavations in 2008.
A better understanding of Holocene stratigraphy in Grand Canyon has both
practical and theoretical applications. First, results have importance for the ongoing
archaeology studies of the river corridor in Grand Canyon. The stratigraphy at
archaeological sites provides the record of paleoenvironment during early human
occupation and abandonment of these locations. By determining the river’s behavior

2throughout the late Holocene in the context of archaeological sites, a clearer picture of
how humans were living along the river corridor can be revealed.
Second, a refined record of Holocene stratigraphy in Grand Canyon can help us
understand the fluvial geomorphic processes that created the preserved stratigraphy. Two
end-member models of Holocene deposition in Grand Canyon have been proposed by
previous workers. One model is that these Holocene alluvial deposits are a series of inset
aggradational packages that correlate to the valley-fill and arroyo cycles identified in
Colorado Plateau tributaries (Hereford et al., 1996). This hypothesis implies that deposits
should correlate throughout the canyon, and that river grade has changed over the
Holocene with a link to changing climate and sediment supply.
An alternate model, following work on the same deposits by O’Connor et al.
(1994) and Ely (1992), is that the Holocene alluvium primarily represents a record of
flood frequency and magnitude along the mainstem of the Colorado River. In contrast to
Hereford’s model, this conceptual model implies that river grade has not changed over
the Holocene and that deposition responds only to hydrology and not tributary sediment
supply. The nature of these models and differences between them is further explored in
the Background section. With optically stimulated luminescence (OSL) dating to
supplement radiocarbon ages, much more detailed age control is available in this study
and these models of deposition are tested.

3BACKGROUND
Holocene Alluvium in the Colorado Plateau
Past research on Holocene alluvium in the Colorado Plateau has revealed alluvial
packages related to cycles of erosion and deposition. Hack (1942) distinguished three
units of alluvial fill in northern Arizona valleys. He termed the depositional packages the
Jeddito, Tsegi, and Naha, and he provided age control based on artifacts found within
each unit. Abundant subsequent research on these deposits and other Holocene alluvium
in the Southwest has varied in terms of approach and interpretation.
Historically, there has been no clear consensus on the degree to which cut-and-fill
cycles in the Southwest are synchronous across the region or whether climate is the main
driver of these cycles. Hack (1942) noted a correlation between his depositional units
and periods of wet climate, and this general link between climate and deposition has been
supported by subsequent research (e.g. Cooke and Reeves, 1976; Hereford et al., 1996;
Hereford, 2002). Likewise, several studies have supported the idea that aggradation and
incision in the Southwest correlate regionally (e.g. Waters and Haynes, 2001; Hereford,
2002; Mann and Meltzer, 2007). In contrast, multiple studies support the idea that
alluvial packages do not correlate between locations and are not driven by climate (e.g.
Boison and Patton, 1985; Waters, 1985; Patton and Boison, 1986). Some studies also
suggest that correlating depositional packages across a region may be difficult because of
internal geomorphic variables that can cause cycles independent of external forcing
mechanisms (e.g. Schumm and Hadley, 1957; Graf, 1987). Graf suggested that there
may be lag time in a large river’s response to climate change as compared to the response

4time of smaller streams. Specifically, drainages with areas greater than 10,000 km2
have discontinuous sediment transport and storage because of their integrated response to
both mountain-headwater hydrology and lower-plateau sediment supply (Graf, 1987).
Holocene Paleoclimate in the Colorado Plateau
To evaluate linkages between paleoclimate and the Grand Canyon alluvial record,
it is necessary to compare the results of this study with records of Holocene climate in the
Colorado Plateau and surrounding areas. Most paleoclimate studies of this region do not
span the entire Holocene, but in combination they provide a broad understanding of
Holocene climate in the Grand Canyon region.
Anderson et al. (2000) synthesized paleoclimate data in the southern Colorado
Plateau, including pollen, packrat middens, and stratigraphic deposits such as lake
sediments. The synthesis focuses on the middle to late-Wisconsin or Marine Oxygen
Isotope Stages (MIS) 2 and 3, but includes some information from MIS 1, the Holocene.
The data suggest that the mean annual temperature during the last glacial maximum (MIS
2) was ~5°C cooler than today. In eastern Grand Canyon, paleobotanic records suggest
that vegetation shifted in elevation and from glacial to modern assemblages with an
overall warming of temperature between ~13 and ~9.5 ka, which spans the Younger
Dryas oscillation (Anderson at al., 2000). Also, based on the expanse of ponderosa pine
across the southern Colorado Plateau during the beginning of the Holocene, a maximum
in summer precipitation is inferred at ~9 ka (Anderson et al., 2000).
Early Holocene climate of the region is also revealed through studies of packrat
middens and bat guano in Grand Canyon. Data of δ13C values from packrat middens

5reveal that temperatures cooled ~4° C during the Younger Dryas, between 11.8 and 11.5
ka (Cole and Arundel, 2005). Additional studies using paleobotanic data from packrat
middens indicate that immediately after the Younger Dryas, conditions were ~1° C
warmer and there was more effective moisture than today (Cole, 1990). Wurster et al.
(2008) used δ13C and hydrogen isotopes from bat guano in the Grand Canyon as a climate
proxy and showed that early Holocene climate gradually became warmer with increased
summer precipitation until ~9 ka, which coincides with a summer solar insolation
maximum. Results confirm cooler and drier conditions during the Younger Dryas than
present and an abrupt temporary decrease in δ13C values at ~8.2 ka, suggesting cooler
conditions with less summer precipitation at that time (Wurster et al., 2008). Overall,
paleoclimate studies of the early Holocene reveal a cold Younger Dryas followed by
warming and an episode of increased monsoonal precipitation at ~9 ka.
Climate proxies bridging records between the early and mid-Holocene include
lake sediment cores and speleothems. These studies indicate a period of warmer, drier
climate in the mid-Holocene, known as the Altithermal. Weng and Jackson (1999) used
data from pollen on the Kaibab Plateau to show that from ~11 to 8 ka climate was cooler
and wetter than today with a stronger summer monsoon. Their data indicate that the
middle Holocene Altithermal was dry and warm, and that the late Holocene was wetter
and cooler with increasing effective moisture due to changes in summer insolation (Weng
and Jackson, 1999). Asmerom et al. (2007) present a high-resolution Holocene climate
record from speleothems in southeastern New Mexico. Using δ18O values, variations in
annual band thickness, growth-no growth records, mineralogy changes, and uranium-
series dating for age control, their study shows millennial and centennial-scale climate

6variation. They similarly conclude that after the Younger Dryas, the early Holocene
was characterized by warming with a wet period lasting until 10 ka, followed by a dry
period until 7 ka, and then a return to a wetter climate (Asmerom et al., 2007).
In terms of late Holocene climate, Polyak and Asmerom (2001) present an
additional mid and late Holocene paleoclimate record from speleothems from the same
cave as the 2007 study. These results show that climate was similar to today from 4 ka to
3 ka, immediately following the Altithermal (Polyak and Asmerom, 2001). From 3 to 0.8
ka, wetter and cooler conditions were present, followed by conditions similar to today
except for a wetter interval from 0.44 to 0.29 ka, which corresponds to the Little Ice Age
(Polyak and Asmerom, 2001).
Late-Holocene paleoclimate records for the Colorado Plateau also include
paleoflood studies and tree ring records. Ely (1992) established a composite chronology
of flood deposits on rivers in Arizona and southern Utah. This was created by correlating
flood deposits between sites dating deposits using radiocarbon and cesium-137 dating
(Ely, 1992). In the paleoflood studies, flood events were compared to an El Niño-
Southern Oscillation (ENSO) index, concluding that there is a correlation between large
floods and episodes of more frequent El Niño conditions over the past millennium (Ely,
1992). Overall, the paleoflood results imply that large floods over the last 5 ka occurred
specifically from 3.8 to 2.2 ka, 1.1 to 0.9 ka, and after 0.5 ka until present (Ely, 1997).
Also relating to flood hydrology, Cook et al. (2004), Woodhouse et al. (2006),
and Meko et al. (2007) used tree ring data for drought analyses and to extend the record
of annual Colorado River stream flows at Lees Ferry as far back as 1.2 ka. These records
7provide evidence for a dry period, corresponding to the Medieval Climate Anomaly
from 1 to 0.7 ka (Cook et al., 2004).
A theme in the extensive climate research from this region is that the Holocene
epoch in the Colorado Plateau contained three broad climate episodes. The early
Holocene is generally characterized as a period of warming that was more monsoon-
dominated than today, the middle Holocene was warmer and drier than today, and the
past 4 ka have been similar to today with century-scale climate shifts associated with the
Medieval Warm Period and the Little Ice Age.
Holocene Paleoclimate in the Rocky Mountains
Because the Colorado River integrates sediment signals from the Colorado
Plateau with a hydrology dictated by Rocky Mountain headwaters, the geomorphic
response to climate is likely driven by changes in both regions. A synthesis of studies
using these proxies in portions of the Rocky Mountains in Colorado, Utah, and New
Mexico is presented by Refsnider and Brugger (2007). These researchers used lichen
diameters on rock glaciers in central Colorado to determine that there were periods of
glacial activity, indicating cooler conditions, at ~1.15 ka, ~2.07 ka, and ~3.08 ka. These
periods correlate to other proxies of Rocky Mountain climate including glacial records,
pollen assemblages, packrat middens, lake sediment cores, beetle assemblages, and tree
ring data (Refsnider and Brugger, 2007).
A study of sediment in the Henry’s Fork, ID drainage shows a similar pattern of
climate change in the Rocky Mountains (Munroe, 2003). Using a study of vegetation
changes coupled with changes in mode of deposition (fluvial, lacustrine, or wetland), the
8study concludes that the mean annual temperature of this region at ~9.5 ka was ~1°C
greater than today. They also conclude that the area’s maximum temperature was
between 6.5 and 5.4 cal yr BP, with near-modern climate present from 5.4 to 3.8 ka.
An additional study of Rocky Mountain Holocene climate is a synthesis by Fall
(1997). Her study used timberlines as a paleoclimate proxy in eight sedimentary basins
in southern Colorado. Pollen and plant macrofossil data show that before 11 ka, the
climate in the southern Rocky Mountains was 2-5 °C cooler than today with 7-16 cm
greater precipitation. From 9 to 4 ka, the temperature was 1-2°C warmer than today with
an intensification of the monsoon and increased solar insolation between 9-6 ka that
raised the mean annual precipitation (Fall, 1997). Conditions from 6-4 ka were drier than
present, followed by a cooling to 1° C warmer than today and finally modern climate at 2
ka (Fall, 1997).
Proxies for Rocky Mountain paleoclimate indicate the same broad climatic
episodes that have been found in proxies of Colorado Plateau Holocene climate. First,
they indicate that conditions changed at ~11 ka. They reveal warmer, wetter conditions
between 9 and 6 ka, which corresponds to the warming and increase in monsoonal
precipitation indentified in Colorado Plateau climate proxies. In addition, Rocky
Mountain climate proxies reveal a dry period in the mid-Holocene, which corresponds to
the Altithermal. For the past 4 ka, the climate has been at near-modern conditions with
episodes of slight cooling as indicated by proxies for glacial extent.
Previous Geomorphic Research in Grand Canyon

9 Previous Grand Canyon researchers have produced a wealth of literature on
geomorphic topics such as debris fans, sediment supply and limitation related to human
management of the river, fill terraces and their relations to climate, and the Holocene
alluvial stratigraphy. Leopold (1969) first identified that the channel geometry and
longitudinal profile of the Colorado River is controlled by the rapid-and-pool sequences
found in the canyon. An early study on the geomorphology of the Colorado River by
Howard and Dolan (1981) described the geomorphic settings and features along the river
and analyzed its sediment supply. These researchers state that both rock type and
tributary debris fan control local channel geometry. Subsequent geomorphic research in
Grand Canyon has focused on these debris fans and debris flow frequency, including
their control on the longitudinal profile of the Colorado River (i.e. Webb et al., 1989;
Melis, 1997; Griffiths et al., 2004; Hanks and Webb, 2006). The effect of debris fans on
the local geomorphology of these study locations is discussed below.
Draut and Rubin (2007, 2008) also studied Holocene sedimentation in Grand
Canyon, with a focus on eolian transport along the river corridor. A detailed grain size
analysis showed that grain size differences can be used, along with sedimentary
structures, to distinguish deposits from fluvial deposits in Grand Canyon (Draut and
Rubin, 2007). These techniques were applied to three archaeological areas in the canyon,
with the general conclusion that most of the archaeological sites in Grand Canyon are set
in fluvial deposits (Draut and Rubin, 2008). Nevertheless, eolian processes are important
for preservation of archaeological sites along the canyon corridor (Draut and Rubin 2007,
2008).

10Fluvial systems respond to changes in hydrology and sediment supply in
complicated ways. For example, drastic fluvial response to changes in hydrology and
sediment supply at short time scales in Grand Canyon can be observed through studies of
the effects of the closure Glen Canyon Dam in 1963. Grams et al. (2007) detail the
transformation of the Colorado River corridor in Glen Canyon due to reduction in
magnitude and duration of floods and sediment delivery. Changes at Ninemile Draw
include river bed lowering of < 2.5 m, an increase in bed grain size from 0.25 mm to 25
mm, and erosion of a large portion of the pre-dam alluvium (Grams et al., 2007). Their
study is useful in revealing how decreased sediment supply and stream power affect
channel morphology and erosion, although whether changes due to the dam are on the
same scale as Holocene climate change is unknown.
Large fluvial systems like the Colorado River may take time to adjust completely
to changes in climate because they are incorporating signals from multiple tributaries and
a large and varied drainage area (Blum, 2008). Research on fill terraces in the eastern
Grand Canyon region generally supports this idea, finding that the Colorado River
responds strongly to orbital-scale climate changes and is less sensitive to Holocene-scale
fluctuations (Anders et al., 2005). In these studies, optically stimulated luminescence,
uranium series, and 10Be cosmogenic nuclide dating were used to provide age control for
middle to late Quaternary fill terraces, and results show a temporal link between
Colorado River fill terraces and glaciations in Rocky Mountain headwaters (Anders et al.,
2005; Pederson et al., 2006; Cragun, 2007). Holocene alluvium was generalized as a
single unit (“M1”) that was interpreted to overlie an older gravel fill mostly below
modern river grade (Anders et al., 2005; Pederson et al., 2006). Thus, it was interpreted

11that all smaller-scale Holocene changes are superimposed on a trend of post-glacial
aggradation (Pederson et al., 2006). Nevertheless, the possibility remains that small,
temporary, subtle changes in river grade have occurred over the Holocene.
Previous Work on Holocene Alluvial Terraces in Grand Canyon
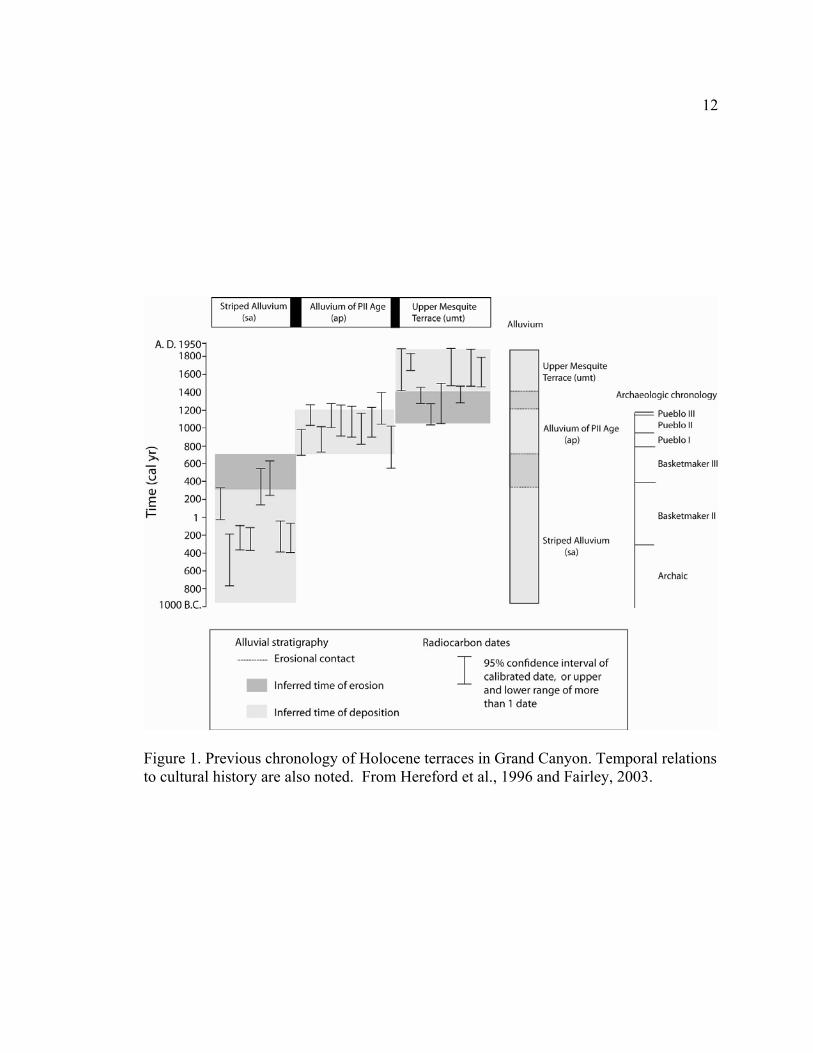
Hereford and others (1996) define three prehistoric late Holocene fill terraces of
the Colorado River in Grand Canyon, with constraints from 27 radiocarbon ages (Figure
1). The oldest of these units is the striped alluvium, or sa, deposited from before 770
B.C. to A.D. 300 (Hereford et al., 1996). The sa is named for the interbeds of reddish
tributary-derived material and mainstem sand common in this unit (Hereford et al., 1996).
The alluvium of Pueblo II age, ap, is inset into the sa and dates from A.D. 700 to 1200
(Hereford et al., 1996). This package is generally characterized by mainstem flood sands
and little local-slope material. The third prehistoric fill terrace defined by Hereford is the
upper mesquite terrace, umt, which was deposited from A.D. 1400 to 1880 (Hereford et
al., 1996). The umt is also a distinct package of mainstem flood deposits and is inset into
the sa and ap. Hereford et al. (1996) state that early and middle Holocene deposits had
not yet been recognized because they were evidently not preserved adjacent to the river
or were buried by younger deposits.
Hereford’s conceptual model of alluviation was developed based on these three
prehistoric Holocene terraces and additional historic deposits (Figure 2). By using the
same unit names along the entire Colorado River, Hereford’s model clearly implies that
the same depositional packages are found throughout the canyon, and he uses the same
unit names along the entire Colorado River corridor. Hereford relates the inset terraces
12
Figure 1. Previous chronology of Holocene terraces in Grand Canyon. Temporal relations to cultural history are also noted. From Hereford et al., 1996 and Fairley, 2003.

13
bedrock
‘83
PII structure
saumt
ap
lmt pda
e
1 Figure 2. Conceptual model of inset packages of Holocene alluvium. sa= striped alluvium, ap= alluvium of Pueblo II age, umt= upper mesquite terrace, lmt= lower mesquite terrace pda= pre-dam alluvium, ‘83= 1983 flood deposits, e= eolian sand deposits. Arrows indicate erosion or deposition associated with changing river grade. Modified from Hereford et al., 1996 and Fairley, 2003.
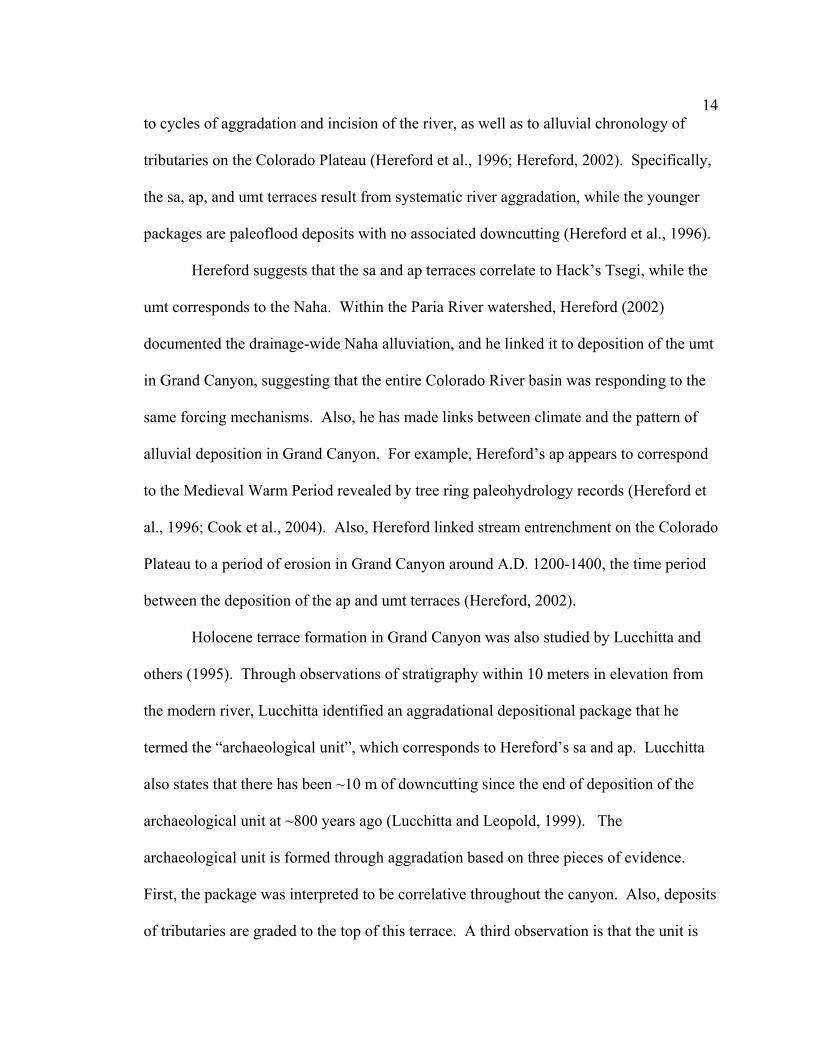
14to cycles of aggradation and incision of the river, as well as to alluvial chronology of
tributaries on the Colorado Plateau (Hereford et al., 1996; Hereford, 2002). Specifically,
the sa, ap, and umt terraces result from systematic river aggradation, while the younger
packages are paleoflood deposits with no associated downcutting (Hereford et al., 1996).
Hereford suggests that the sa and ap terraces correlate to Hack’s Tsegi, while the
umt corresponds to the Naha. Within the Paria River watershed, Hereford (2002)
documented the drainage-wide Naha alluviation, and he linked it to deposition of the umt
in Grand Canyon, suggesting that the entire Colorado River basin was responding to the
same forcing mechanisms. Also, he has made links between climate and the pattern of
alluvial deposition in Grand Canyon. For example, Hereford’s ap appears to correspond
to the Medieval Warm Period revealed by tree ring paleohydrology records (Hereford et
al., 1996; Cook et al., 2004). Also, Hereford linked stream entrenchment on the Colorado
Plateau to a period of erosion in Grand Canyon around A.D. 1200-1400, the time period
between the deposition of the ap and umt terraces (Hereford, 2002).
Holocene terrace formation in Grand Canyon was also studied by Lucchitta and
others (1995). Through observations of stratigraphy within 10 meters in elevation from
the modern river, Lucchitta identified an aggradational depositional package that he
termed the “archaeological unit”, which corresponds to Hereford’s sa and ap. Lucchitta
also states that there has been ~10 m of downcutting since the end of deposition of the
archaeological unit at ~800 years ago (Lucchitta and Leopold, 1999). The
archaeological unit is formed through aggradation based on three pieces of evidence.
First, the package was interpreted to be correlative throughout the canyon. Also, deposits
of tributaries are graded to the top of this terrace. A third observation is that the unit is
15present in reaches of different morphology and not just in back-water eddy areas,
implying system-wide aggradation. In addition to identifying the archaeological unit,
Lucchitta observed two younger, non-aggradational deposits, the Green Arrowweed and
Silver Arrowweed terraces (Lucchitta et al., 1995). These terraces are both within
historic flood stages, similarly to Hereford’s lmt, pda, and younger deposits.
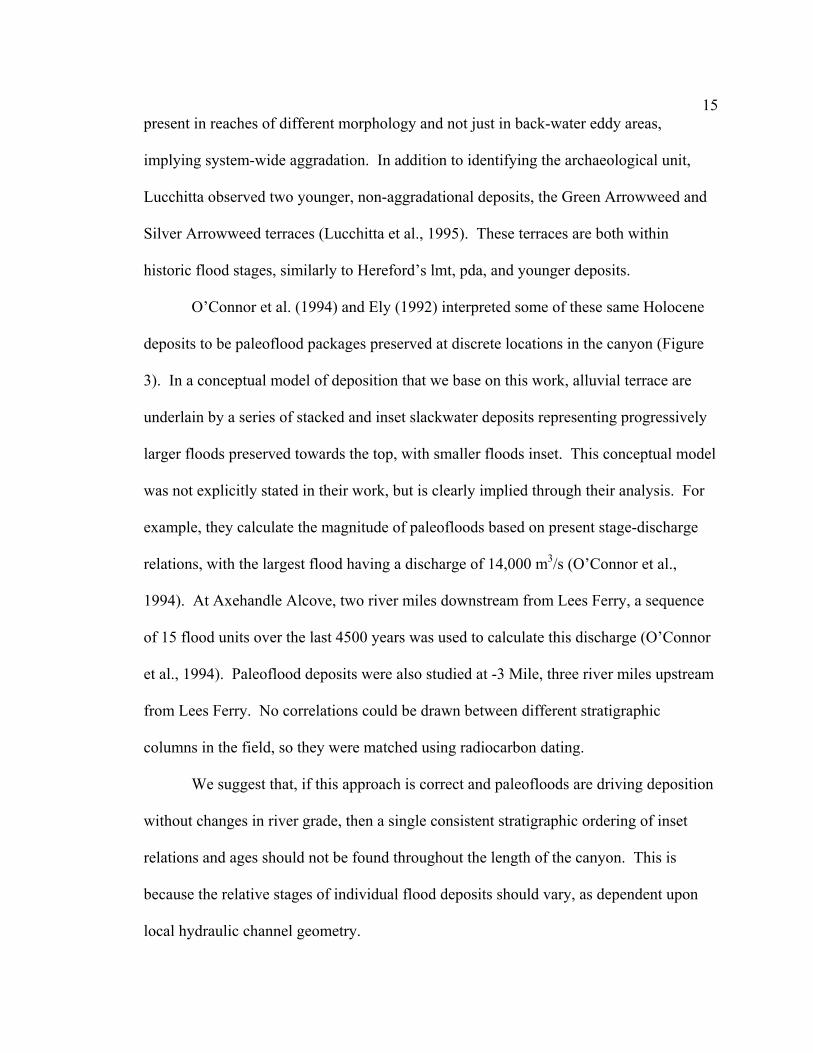
O’Connor et al. (1994) and Ely (1992) interpreted some of these same Holocene
deposits to be paleoflood packages preserved at discrete locations in the canyon (Figure
3). In a conceptual model of deposition that we base on this work, alluvial terrace are
underlain by a series of stacked and inset slackwater deposits representing progressively
larger floods preserved towards the top, with smaller floods inset. This conceptual model
was not explicitly stated in their work, but is clearly implied through their analysis. For
example, they calculate the magnitude of paleofloods based on present stage-discharge
relations, with the largest flood having a discharge of 14,000 m3/s (O’Connor et al.,
1994). At Axehandle Alcove, two river miles downstream from Lees Ferry, a sequence
of 15 flood units over the last 4500 years was used to calculate this discharge (O’Connor
et al., 1994). Paleoflood deposits were also studied at -3 Mile, three river miles upstream
from Lees Ferry. No correlations could be drawn between different stratigraphic
columns in the field, so they were matched using radiocarbon dating.
We suggest that, if this approach is correct and paleofloods are driving deposition
without changes in river grade, then a single consistent stratigraphic ordering of inset
relations and ages should not be found throughout the length of the canyon. This is
because the relative stages of individual flood deposits should vary, as dependent upon
local hydraulic channel geometry.
16
no change inriver grade
PII structure
bedrock
Figure3. Conceptual model of stacked and inset flood deposits, based on the approach of O’Connor et al., 1994 and Ely, 1992.
17STUDY LOCATIONS
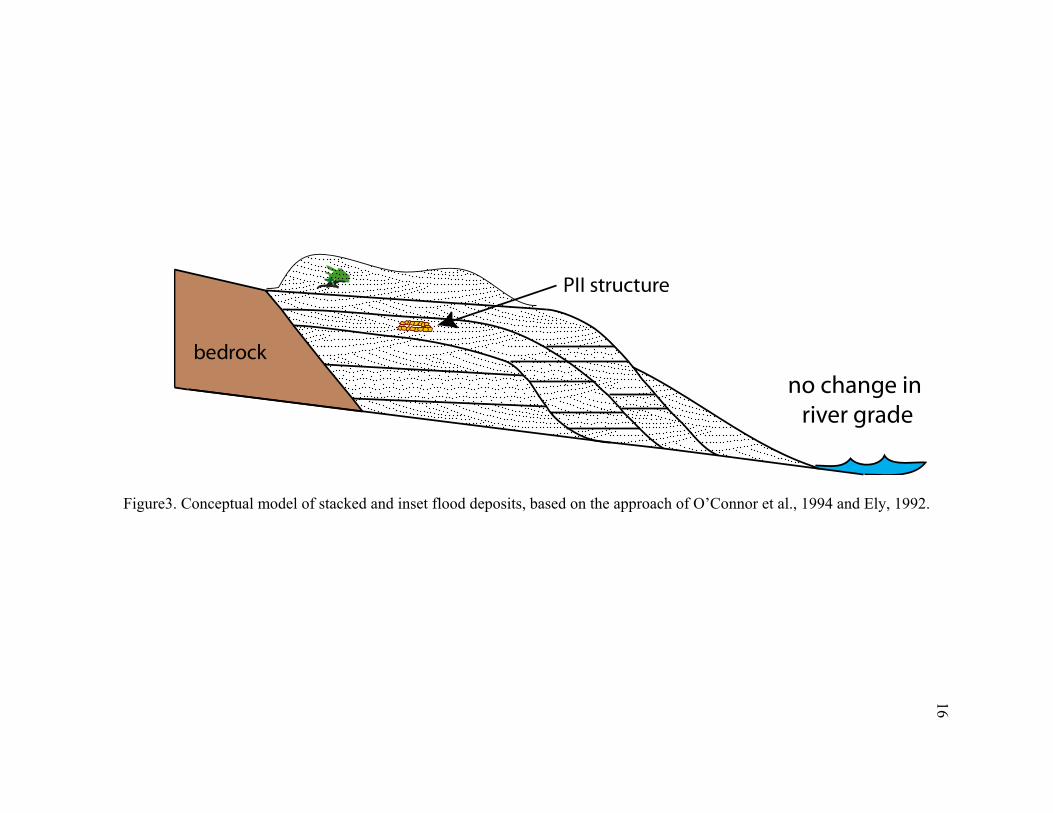
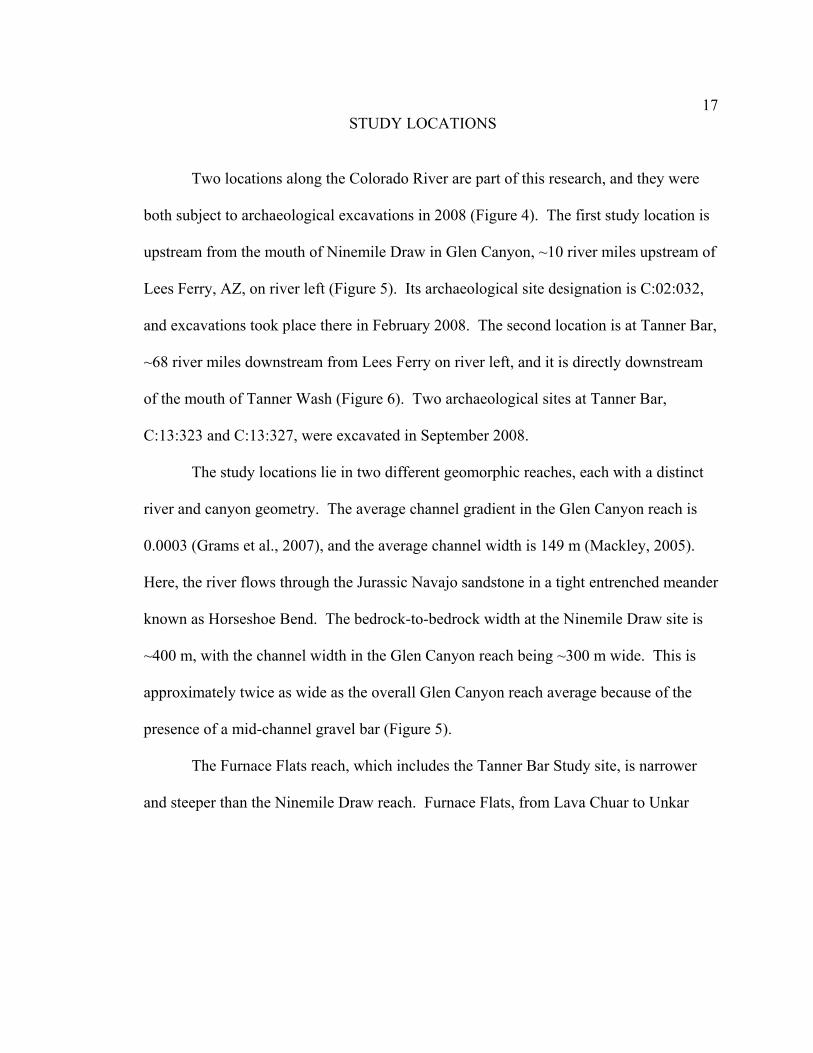
Two locations along the Colorado River are part of this research, and they were
both subject to archaeological excavations in 2008 (Figure 4). The first study location is
upstream from the mouth of Ninemile Draw in Glen Canyon, ~10 river miles upstream of
Lees Ferry, AZ, on river left (Figure 5). Its archaeological site designation is C:02:032,
and excavations took place there in February 2008. The second location is at Tanner Bar,
~68 river miles downstream from Lees Ferry on river left, and it is directly downstream
of the mouth of Tanner Wash (Figure 6). Two archaeological sites at Tanner Bar,
C:13:323 and C:13:327, were excavated in September 2008.
The study locations lie in two different geomorphic reaches, each with a distinct
river and canyon geometry. The average channel gradient in the Glen Canyon reach is
0.0003 (Grams et al., 2007), and the average channel width is 149 m (Mackley, 2005).
Here, the river flows through the Jurassic Navajo sandstone in a tight entrenched meander
known as Horseshoe Bend. The bedrock-to-bedrock width at the Ninemile Draw site is
~400 m, with the channel width in the Glen Canyon reach being ~300 m wide. This is
approximately twice as wide as the overall Glen Canyon reach average because of the
presence of a mid-channel gravel bar (Figure 5).
The Furnace Flats reach, which includes the Tanner Bar Study site, is narrower
and steeper than the Ninemile Draw reach. Furnace Flats, from Lava Chuar to Unkar

18
Figure 4. Location map of eastern Grand Canyon sites. Modified from Pederson et al., 2003.

19
Figure 5. Detailed location map of Ninemile Draw study site.

20
Figure 6. Detailed location map of Tanner Bar study site.
21(river mile 61.6 to 77.4), has a channel gradient of 0.0021, seven times steeper than at
Ninemile Draw (Schmidt and Graf, 1990). Also, the average channel width in the
Furnace Flats reach is 98 m, ~50 m less than the width in the Ninemile Draw reach
(Mackley, 2005). At Tanner Bar, the Colorado River is in a reach underlain by
Precambrian Dox sandstone, which accommodates a relatively broad canyon floor. The
average width to depth ratio in this reach is 26.6 and the average channel width is 390 ft
(Schmidt and Graf, 1990).
Along with differences in canyon geometry and bedrock type, the sites also differ
in terms of smaller-scale geomorphic features along the channel. Pleistocene gravelly
alluvial terraces are absent at Ninemile Draw, whereas large Pleistocene gravel deposits
are prominent in the Furnace Flats reach. Also, there is no debris fan at Ninemile Draw,
whereas Tanner Bar has a prominent debris fan that has led to the formation of Tanner
Rapids. In addition, sediment supply is different at both sites. The Paria and Little
Colorado rivers are major tributaries to the Colorado River downstream of Ninemile
Draw and upstream of Tanner Bar, and they supply fine-grained sediment to the Colorado
River. The average pre-dam suspended sediment concentration at Lees Ferry was 6.0 x
1010 kg/yr (Andrews, 1991). Because of the closing of Glen Canyon Dam, the Ninemile
Draw study area currently receives no fine-grained sediment. In contrast, the Tanner Bar
study area receives an average of 1.8 x 10¹⁰ kg/yr of suspended sediment entering
downstream of Lees Ferry, and ~70% of that sediment comes from the Paria and Little
Colorado rivers (Andrews, 1991).

22Ninemile Draw Geomorphic Setting
Ninemile Draw is a tributary to the Colorado River and is located near the
downstream end of a long cutbank at this location (Figure 5). The cutbank extends for
~900 m along the inside of the meander bend. Although there is coarse tributary material
at the mouth of Ninemile Draw, there is no discernible debris fan landform. Multiple
gullies have cut through the terrace tread and exposed stratigraphy, but the best exposure
is along the cutbank face parallel to the river. The sediment in the cutbank includes
mainstem sand, local tributary and slopewash material, and eolian sand. The
archaeological and geomorphic research at site C:02:032 took place in the upstream
portion of the cutbank (Figure 5).
Previous Work at Ninemile Draw
Archaeological studies began at Ninemile Draw when charcoal and ash stains
within the top meter of stratigraphy were tested for cultural content (Leap and Neal,
1992). Radiocarbon age results were 1715 ± 55 years BP and 3150 ± 55 years BP, both
uncalibrated (Leap and Neal, 1992). During a 2005 site reassessment by the Navajo
Nation Archaeology Department (NNAD), charcoal was obtained from a hearth in the
cutbank and dated with a calibrated radiocarbon result of 2780-2400 years BP (Anderson,
2006). This date is significant because it is from the Archaic period and is older than
most of the established cultural history of Grand Canyon (Anderson, 2006).
During stratigraphic analysis by Anderson, terraces were named based on their
local depositional chronology, with T1 being the youngest and T6 being the oldest
(Anderson, 2006). Anderson produced a stratigraphic column of the upper ~3 m of the

23oldest depositional sequence, which he called the “T6”. Anderson’s report does not
include individual unit descriptions, but his interpretation of this depositional package
was that it contains interfingered mainstem fluvial and local alluvial fan deposits, which
are characteristic of Hereford’s striped alluvium (Anderson, 2006).
The deposits at Ninemile Draw were studied by Burke and Hereford (1998), who
created a map of the surficial geology of the location. Historic units, including the lower
mesquite terrace (lmt) and postdam alluvium (pda) were mapped along with the
prehistoric striped alluvium (sa), alluvium of Pueblo II age (ap), and upper mesquite
terrace (umt) (Burke and Hereford, 1998). Eolian, colluvial, and alluvial-fan deposits
were also mapped. The importance of this mapping effort is that Burke and Hereford
identified depositional packages based using their framework of terraces elsewhere along
the river corridor, suggesting that the terraces are correlatable across the canyon. The
map has not yet been published, so it is not included as a figure, but select features of this
previous mapping is compared to results of this study below.
Tanner Bar Geomorphic Setting
The second study location is Tanner Bar, which encompasses two archaeological
sites on river left (Figure 6). The broader geomorphic setting is important when
considering this site. As mentioned above, the Furnace Flats reach is distinct because of
its broad canyon geometry influenced by Tapeats Sandstone and Unkar Group bedrock
(Schmidt and Graf, 1990). Channel-margin deposits are common in this reach (Schmidt
and Graf, 1990).

24The presence of the debris fan formed at the mouth of Tanner Creek controls
the local geomorphology at the Tanner Bar study site. The reach from river mile 38 to 77,
has an average of 2.6 debris fans per river mile (Hanks and Webb, 2006). A few of these
debris fans, not including the Tanner Creek fan, have been dated using dissolution pitting.
Results suggest that they have experienced active deposition multiple times over the past
~4 ka (Hereford et al., 1996). Thus, there may be some degree of local geomorphic
control on river grade since ~4 ka. Because Tanner Wash supplies coarse tributary
material to the area, a tributary debris fan has developed at the confluence of Tanner
Wash and the Colorado River. Downstream of the tributary debris fan at Tanner Wash
lies a large gravel bar between the river and the Holocene terrace scarp. The
archaeological sites are located at or near the surface of these Holocene deposits. In
addition, stratigraphic exposures are observed in several gullies that cut across the terrace
tread. One of these gullies, located between the two archaeological sites, was the site of
significant work in this study (Figure 6).
Previous Work at Tanner Bar
Research specifically at Tanner Bar includes stratigraphic studies of Holocene
alluvium, surficial mapping, and soil studies. The Tanner Wash debris fan was studied
by Melis et al. (1994). This debris fan has been active as recently as 1993, when a debris
flow aggraded the fan and constricted the river by ~30 m (Melis et al., 1994). Repeat
photography also suggests that the 1993 debris flow was the first fan activity since at
least 1890. Boulders from Tanner Canyon are present on river right, opposite the debris
25fan, indicating that the fan was significantly larger in the recent geological past (Melis
et al., 1994).
A detailed soil survey from Palisades to Unkar was completed by Davis et al.
(1995). Results from this soil survey, including buried surfaces with corn pollen and
other vegetation, were interpreted as evidence for aggradation of the “archaeological
unit” in their research (Davis et al., 2000).
The Tanner Bar terrace stratigraphy has been studied by Hereford et al. (1996)
and USU geomorphologists (Damp et al., 2007). This location is especially important
because it is the informal type section for Hereford’s striped alluvium (sa). Hereford’s
studies included the production of topographic maps made from ground surveys and low-
altitude aerial photography, a map of surficial geology, and descriptions of two
stratigraphic sections. The stratigraphic columns and the surficial geology map produced
by Hereford have not published (Hereford, 2008).
Hereford’s research at Tanner Bar included radiocarbon ages for the striped
alluvium, which range from ~2300-1600 years BP, with sample locations ranging from
near-surface to the exposure base (Hereford et al., 1996). Hereford also dated charcoal
related to cultural features in the alluvium of Pueblo II age (ap) at this location, with
results ranging from ~1200-900 years BP (Hereford et al., 1996). No inset terraces have
been documented at this location, with the ap resting on top of the sa at this site.
Previous age control at the C:13:323 site consists of a single radiocarbon age from
a hearth, at 2170 ± 70 years BP, consistent stratigraphically and chronologically with the
top of Hereford’s sa (Damp et al., 2007). More detailed study of part of the Holocene
alluvium at the C:13:327 site was conducted during reconnaissance for the archaeological

26excavations (Damp et al., 2007). The stratigraphy in the top 3.5 m of alluvium in the
gully at the mouth of Tanner Canyon was described, and samples were collected for OSL
and radiocarbon dating (Damp et al., 2007).

27METHODS
Sedimentology Methods
Sedimentology methods were conducted on both naturally-exposed Holocene
stratigraphy and archaeological study trenches. The study units were typically 1 m x 1 m
or 1 m x 2 m pits dug to expose cultural material or expose stratigraphy. Four study units
were dug to expose stratigraphy along the terrace front at Ninemile Draw (Figure 7),
eight study units exposed stratigraphy at Tanner Bar C:13:323 (Figure 8), and eight study
units exposed stratigraphy at Tanner Bar C:13:327 (Figure 8). These study units only
exposed stratigraphy adjacent to archaeological features.
Before observations were made, the best-exposed stratigraphy at each site was
cleared using shovels, trowels, and brushes. At Ninemile Draw, this stratigraphy
included a ~20 m long and ~10 m high section of the cutbank underlying the C:02:032
archaeological site (Figures 5 and 7). At Tanner Bar, the stratigraphic procedure was
applied at three primary exposures (Figures 6 and 8). The first exposure was on the
north-facing wall of a gully adjacent to the downstream Tanner Bar archaeological site,
C:13:327. The second was the south-facing stratigraphy in the geomorphic study gully
~300 m north of the downstream site. The third stratigraphic exposure was underneath
the upstream Tanner Bar archaeological site, C:13:323.
Data collection at each exposure began with general descriptions that included
exposure type, dimensions, location, and general geomorphic setting. Then individual
depositional units were discerned based on features such as texture, color, sedimentary

28
0 20 meters
955
955
955960SU 1 SU 2
SU 3
SU 4
measured/described stratigraphic section
Contour Interval = 1 m
<
<
<
<
<
<
<
< <
<
<
<
< <
<
<
<
<
<
<
<
<
<
<
<
<
<
<
<
<
<
< <
< <
<
METERS
96085
96
0
985
965
96485
96285
960
960
95985
985
980
975
980
965
955
965965
970
975
980
96385
96485
96585
96685
95985
955
960
95285
952
95285
960.5
960 985965
960
960955
959.5
985980
975970
965
955965965
970
975
980
963.5
964.5
965.5
966.5
962.5
959.5
955960
952
952.5
952
952.5
0 100
Ü
Ninemile Draw<
Figure 7. Topographic map of Ninemile Draw study site (C:02:032) with archaeological study units labeled. Location of the detailed stratigraphic panel is indicated in orange. Topographic lines are from Burke and Hereford, 1998. Contour interval is 1 m, with lighter grey lines indicating 0.5 m contour interval. Geomorphic features of Ninemile Draw are shown in Figure 5.

29
Figure 8. Topographic map of Tanner Bar study locations with archaeological and geomorphic study units labeled. Topographic lines were obtained as shapefiles from the Grand Canyon Monitoring and Research Center (GCMRC). Locations of detailed stratigraphic sections are indicated in orange. Geomorphic features of Tanner Bar are shown in Figure 6.
30structures, and bed geometry. Unit descriptions were recorded, and they included the
following characteristics: unit thickness, bed geometry, contacts with adjacent units,
sedimentary structures and grading, grain size, texture and composition, sorting,
bioturbation, effervescence, cultural material if applicable, and color. Depositional
hiatuses and possible unconformities were also identified. In addition to detailed
descriptions, field interpretations of each unit were recorded.
After the stratigraphy was described, each exposure was photographed and
sketched. Also, paleocurrent directions were measured if ripples were present and well-
preserved. The last step of the field procedure was to collect samples for AMS
radiocarbon and OSL dating, as described in subsequent sections.
In addition to descriptions of naturally-exposed stratigraphy, the stratigraphy of
archaeological study units was described using the procedure outlined above. In each
study unit, dimensions and locations were recorded along with the aspect of the face with
the best-exposed stratigraphy. At Ninemile Draw, C:02:032, four archaeological study
units were described. At the upstream Tanner Bar site, C:13:323, the archaeological
excavation included five described study units. At the downstream Tanner Bar site,
C:13:327, seven study units were described. All of the study units were at the top of the
landforms and included only the upper ~1-2 m of Holocene stratigraphy. Some study
units were not used to analyze the overall stratigraphy because they were repetitive or did
not provide important data. Others provided important information about
paleoenvironment during human occupation and helped with overall stratigraphic
analysis.

31 A classification system was developed to categorize depositional facies at both
sites and aid in the interpretation of recurring depositional processes and environments.
Facies were named based on source, texture, composition, and sedimentary structures.
This facies classification system was applied to all of the depositional units described in
this study.
Depositional units were first interpreted based on source, with mainstem river,
local tributaries or hillslopes, and eolian sources each having a modifier. They were
subdivided based on grain size and then sedimentary structures such as ripple cross-
stratification or imbrication. The facies names were used to reconstruct a sequence of
depositional events and an interpretation of changes in river behavior and depositional
environment.
To distinguish local tributary or slopewash deposits from mainstem or eolian,
three characteristics were used. First, the texture of the deposit, especially grain size, was
an important indicator of source. Locally-sourced material has grain sizes ranging from
silt to gravel and is often poorly sorted, whereas mainstem and eolian deposits consist of
clay to coarse sand and are better sorted. Secondly, rounding is an indicator of source.
Some lithic granules or coarse sand-sized grains may be angular, indicating a local
provenance despite grain size similar to mainstem river-sourced material. Alternatively,
eolian sediment and mainstem river sediment are well-rounded. The last characteristic
used to help determine source was color. Locally-sourced sediment tends to have a
redder color value than mainstem sand, generally a Munsell color of 7.5 YR to 2.5 YR
instead of 10 YR.

32Distinguishing between eolian and mainstem river deposits is more difficult,
especially because eolian deposits are often just reworked mainstem river sand. Grain
size, grading, and other sedimentary structures are used for this task. Fluvial structures
include ripples that are usually asymmetric because most flow is unidirectional. Eolian
ripples form at lower climb angles than fluvial ripples and contain very thin strata (Draut
and Rubin, 2008). The strata also are inversely-graded due to sorting by wind, resulting
in a pinstriped pattern (Hunter, 1977). An additional indicator of eolian processes used is
relict rainsplash crust appearing as stacked, thin wavy lamination, indicating continuing
deposition during subaerial exposure.
In addition to interpretations based on field descriptions, a more detailed chemical
analysis was performed on sediment from Tanner Bar. On the north-facing portion of the
gully adjacent to the C:13:327 archaeological site, units were divided into facies based on
composition, texture, color, and bed geometry. Approximately 200 g of sediment from
the uppermost unit of each facies was collected for detailed chemical and grain size
analyses. The representative facies samples were divided and part was sent to Chemtech-
Ford Laboratories in Murray, UT, for measurement of the total iron content using an
Inductively-Coupled Plasma Spectrophotometer. The remaining portion was sent to Utah
State University Analytical Laboratories, where three properties were analyzed. Calcium
carbonate content was measured using a pressure transducer, grain size was measured
using a hydrometer, and organic matter was measured by the loss-on-ignition method.
These properties were analyzed for representative differences between mainstem and
local facies.

33Surveying
Survey methods were used to determine terrace heights, study unit locations, and
geochronology sample locations. Terrace heights and OSL sample locations were
documented using measuring tapes along with hand levels and eye heights. Heights
above the modern river were measured using these methods at Ninemile Draw because of
the deposit’s close proximity to the river. Using ArcMap, stratigraphic heights at Tanner
Bar were estimated from a 1-m LIDAR digital elevation model obtained from the Grand
Canyon Monitoring and Research Center (GCMRC). Also, placement of study units was
precisely surveyed using a Topcon RTK-GPS.
Geochronology
Dating methods include both radiocarbon and OSL dating. Radiocarbon methods
were appropriate for units with preserved charcoal from cultural hearths or non-cultural
units with preserved charcoal. OSL methods were used for units of mainstem sand with
little to no bioturbation.
AMS Radiocarbon
Radiocarbon dating was used to date a basal unit of the gully stratigraphy near the
Tanner Bar C:13:327 archaeological site. Detrital charcoal deposited by mainstem fluvial
processes, as indicated by low angle cross lamination, was removed from the unit and
placed in aluminum foil. It was then transported back to the laboratory, where ~50 mg of
the best-preserved charcoal was separated from the rest of the sample. This portion was
sent to Beta Analytic, Inc. for Accelerated Mass Spectrometer (AMS) radiocarbon dating.
In addition to this radiocarbon result, several radiocarbon ages from near-surface cultural

34features at the excavation sites have been obtained by archaeologists. This allows for
comparison of radiocarbon and OSL methods and the production of a more complete
record chronostratigraphic record.
Optically Stimulated Luminescence (OSL)
This dating method provides an estimate of when sediment was last exposed to
light, thereby dating sediment deposition or burial. OSL dating can provide good age
control for fluvial sediments (Wallinga, 2002), and it has high enough resolution to be
applicable to Holocene sedimentation, which are two reasons why it was chosen for this
study.
After sediment is buried, its luminescence signal grows as radiation emitted from
decay of nearby radioactive isotopes of potassium, thorium, rubidium, and uranium along
with incoming cosmic radiation energizes and ejects electrons from their energy bands,
and some of these electrons are then trapped in quartz crystal lattice defects. When the
quartz receives energy in the form of heat or light, the electrons can gain enough energy
to be released from these traps, causing luminescence (Aitken, 1998).
The time since burial can be determined by first measuring the luminescence
signal as related to a known amount of radiation, the equivalent dose (De). The
equivalent dose is divided by radioactivity of the surrounding sediment and cosmic input,
known as the dose rate, to determine the sample age.
)(
)()(
yrGyRateDose
GyDoseEquivalentyrAge =

35 Samples were collected from near the base of each stratigraphic package, from
near the top of each deposit, and often from one or more units in the middle of the
stratigraphy. A total of fourteen samples were removed from the exposures in opaque
metal tubes, following standard procedures of the USU Luminescence Laboratory.
Representative sediment was removed from within 30 cm of the OSL sample location for
dose rate calculations. The dose rate samples were sent to Chemex Laboratories for
analyses of elements including potassium, rubidium, thorium, and uranium in the
sediment.
The samples were all processed at the Utah State University Luminescence
Laboratory. First, each was wet sieved to remove the appropriate grain size fraction of
63 to 150 µm or 75 to 150 µm. Carbonates and organics were removed with
hydrochloric acid and bleach baths, and then heavy minerals were removed through
density separation using 2.72 g/cm3 sodium polytungstate. Hydrofluoric acid was used to
remove feldspars and etch the quartz. The quartz in each sample was then dry sieved to
remove the fraction less than 63 or 75 μm in diameter, depending on the grain size
removed by wet sieving.
Aliquots of the remaining quartz were mounted on 2 mm stainless steel disks and
placed in a Riso TL/OSL-DA-20 reader with blue-green light stimulation (470 nm). To
determine the equivalent dose, the procedure used was the single-aliquot regenerative-
dose (SAR) protocol of Murray and Wintle (2000). Regenerative doses of 100, 200, and
300 seconds were used. To find the equivalent dose, the natural luminescence signal was
interpolated onto a saturating exponential curve fit to the regenerative doses, and a line of
best fit was interpolated from the luminescence signals of all of the regenerative doses.

36This partial bleaching process is taken into account by discarding the aliquots
with greater than 2σ standard deviation. Aliquots were discarded if they had a greater
than 10% recycling ratio, indicating the presence of feldspars. They were also discarded
if they had high recuperation values, indicating that some energy was transferred as heat
and not light. No natural signal or a poor fit to the regenerative curve were additional
reasons some aliquots were discarded.
The luminescence signal measured in the laboratory is a function of burial time
and surrounding radiation. It is also affected by water content, and cosmic radiation,
which varies by sample depth, elevation, latitude, and longitude (Prescott and Hutton,
1994). Therefore, each environmental dose rate was corrected for these factors in order
to increase accuracy. The new OSL ages reported here are preliminary because they have
less than 20 aliquots, the number needed for a statistically significant age.
37RESULTS AND INTERPRETATIONS
Facies
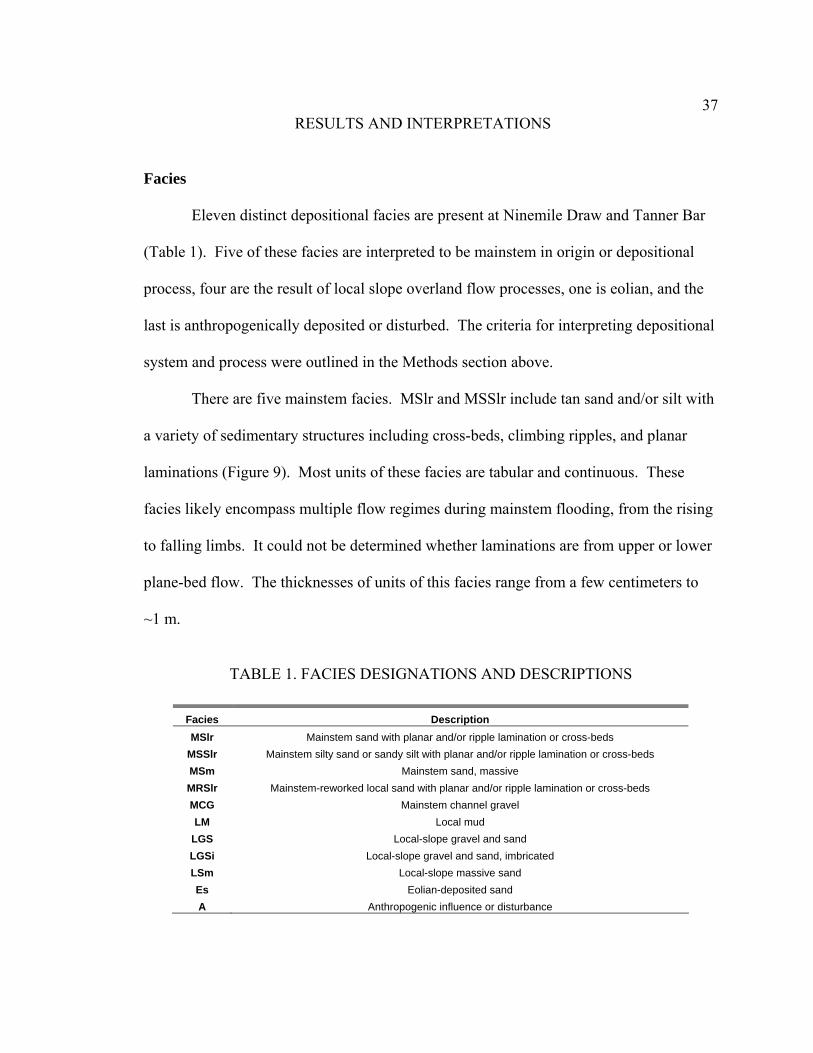
Eleven distinct depositional facies are present at Ninemile Draw and Tanner Bar
(Table 1). Five of these facies are interpreted to be mainstem in origin or depositional
process, four are the result of local slope overland flow processes, one is eolian, and the
last is anthropogenically deposited or disturbed. The criteria for interpreting depositional
system and process were outlined in the Methods section above.
There are five mainstem facies. MSlr and MSSlr include tan sand and/or silt with
a variety of sedimentary structures including cross-beds, climbing ripples, and planar
laminations (Figure 9). Most units of these facies are tabular and continuous. These
facies likely encompass multiple flow regimes during mainstem flooding, from the rising
to falling limbs. It could not be determined whether laminations are from upper or lower
plane-bed flow. The thicknesses of units of this facies range from a few centimeters to
~1 m.
TABLE 1. FACIES DESIGNATIONS AND DESCRIPTIONS
Facies Description MSlr Mainstem sand with planar and/or ripple lamination or cross-beds
MSSlr Mainstem silty sand or sandy silt with planar and/or ripple lamination or cross-beds MSm Mainstem sand, massive MRSlr Mainstem-reworked local sand with planar and/or ripple lamination or cross-beds MCG Mainstem channel gravel LM Local mud
LGS Local-slope gravel and sand LGSi Local-slope gravel and sand, imbricated LSm Local-slope massive sand Es Eolian-deposited sand A Anthropogenic influence or disturbance

38
Figure 9. Facies MSlr and MSSlr with plane-bed laminations (left) and thin ripple cross-bedding (right).
Massive mainstem sand, MSm (Figure 10), is also characterized by its tan color
and good sorting, but it lacks sedimentary structures. This could be the result of either
very rapid deposition or bioturbation after deposition. In the field, traces of burrows,
roots, or rhizoliths provided indicators of bioturbation. The only mainstem facies coarser
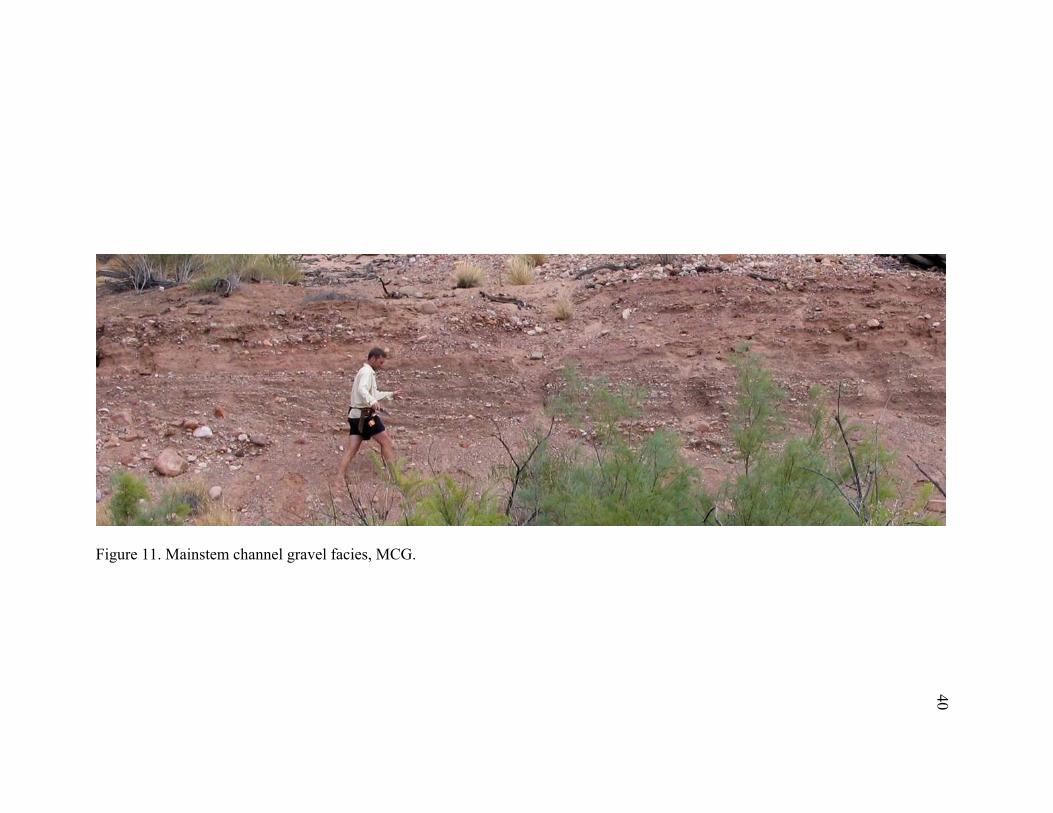
than sand is the mainstem channel gravel facies, MCG, which was only found at Tanner
Bar (Figure 11). This facies includes well-rounded cobbles and pebbles. The imbrication
of these clasts indicates that they were deposited by mainstem river processes.
Mainstem-reworked laminated or rippled sand, MRSlr , has the reddish Munsell hue of
2.5 YR to 7.5 YR of local-slope sediment (Figure 12). Despite this, its depositional
environment is interpreted to be mainstem because of its good sorting and fluvial
sedimentary structures. The thickness of beds of these facies range from a few to 50 cm,
and most of these beds are tabular and continuous.

39
Figure 10. Massive mainstem sand, facies MSm. Rhizoliths are present, indicating bioturbation.
Local mud (LM) occurs most often in lenses (Figure 13) and was seen primarily
in the study trenches at Ninemile Draw, specifically in the upper ~1 m of the stratigraphy.
These are interpreted as local depressions on the surface where water collected and
evaporated, leaving behind silt and carbonate cement. They are all discontinuous, with
lateral extents of less than one meter and a maximum thickness of 0.1 m. This facies was
found only in the top 1 m of stratigraphy at Ninemile Draw.
Local massive sand (LSm) ranges in Munsell hue from 2.5 to 7.5 YR and it
appears less well-sorted than the MSm facies, indicating that it is the result of local-slope
overland flow or wash processes. It is primarily composed of sand but includes angular
or subangular coarse sand to granule-sized grains. This facies is massive as a result of
40
Figure 11. Mainstem channel gravel facies, MCG.

41
Figure 12. Mainstem-reworked sand with laminations, MRSlr.
Figure 13. Local mud lens facies, LM.
42bioturbation or rapid deposition, so no sedimentary structures are preserved. LSm is
present at all sites, but it is a distinguishing feature at Ninemile Draw because it exists in
discontinuous, broad, lens-shaped units in most of the cutbank.
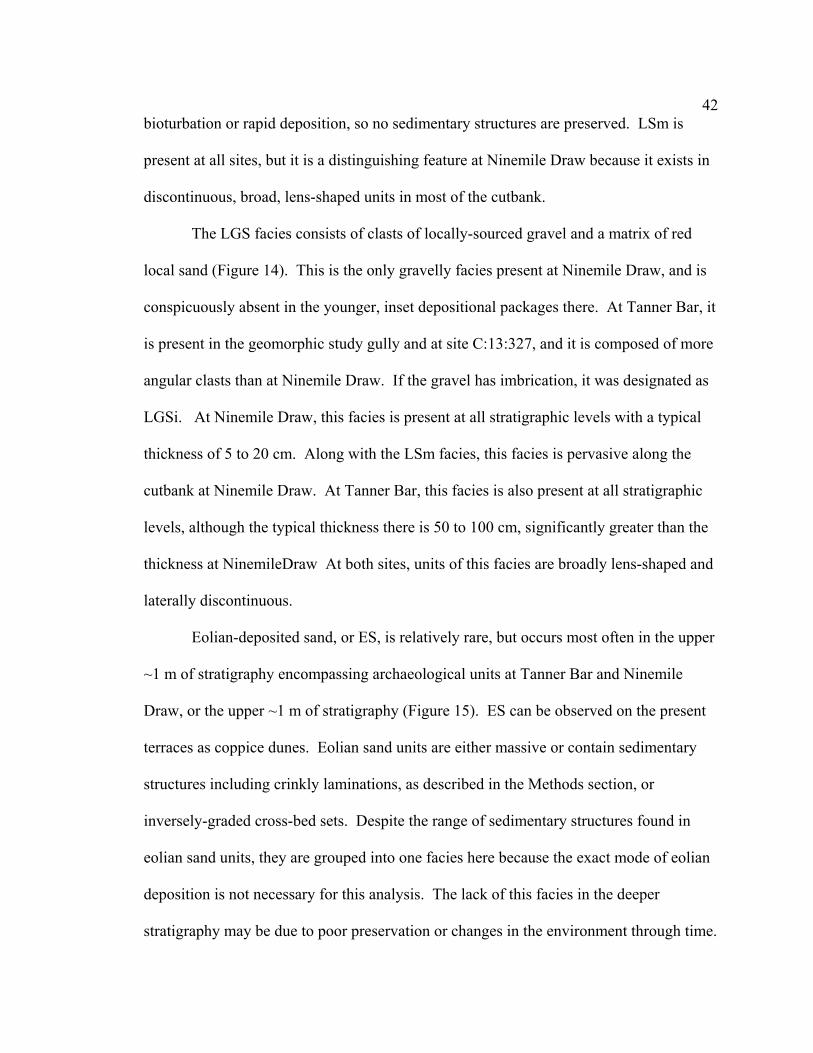
The LGS facies consists of clasts of locally-sourced gravel and a matrix of red
local sand (Figure 14). This is the only gravelly facies present at Ninemile Draw, and is
conspicuously absent in the younger, inset depositional packages there. At Tanner Bar, it
is present in the geomorphic study gully and at site C:13:327, and it is composed of more
angular clasts than at Ninemile Draw. If the gravel has imbrication, it was designated as
LGSi. At Ninemile Draw, this facies is present at all stratigraphic levels with a typical
thickness of 5 to 20 cm. Along with the LSm facies, this facies is pervasive along the
cutbank at Ninemile Draw. At Tanner Bar, this facies is also present at all stratigraphic
levels, although the typical thickness there is 50 to 100 cm, significantly greater than the
thickness at NinemileDraw At both sites, units of this facies are broadly lens-shaped and
laterally discontinuous.
Eolian-deposited sand, or ES, is relatively rare, but occurs most often in the upper
~1 m of stratigraphy encompassing archaeological units at Tanner Bar and Ninemile
Draw, or the upper ~1 m of stratigraphy (Figure 15). ES can be observed on the present
terraces as coppice dunes. Eolian sand units are either massive or contain sedimentary
structures including crinkly laminations, as described in the Methods section, or
inversely-graded cross-bed sets. Despite the range of sedimentary structures found in
eolian sand units, they are grouped into one facies here because the exact mode of eolian
deposition is not necessary for this analysis. The lack of this facies in the deeper
stratigraphy may be due to poor preservation or changes in the environment through time.
43
Figure 14. Local-slopewash gravel and sand (LGS). Local-slope gully fills are present at both Ninemile Draw (left) and Tanner Bar (right).

44
Figure 15. Eolian sand, facies ES. Cross-bed foresets in top portion of the picture are inversely graded. Lower half of unit includes “crinkly” laminations representing rainsplash-crust and eolian sand.
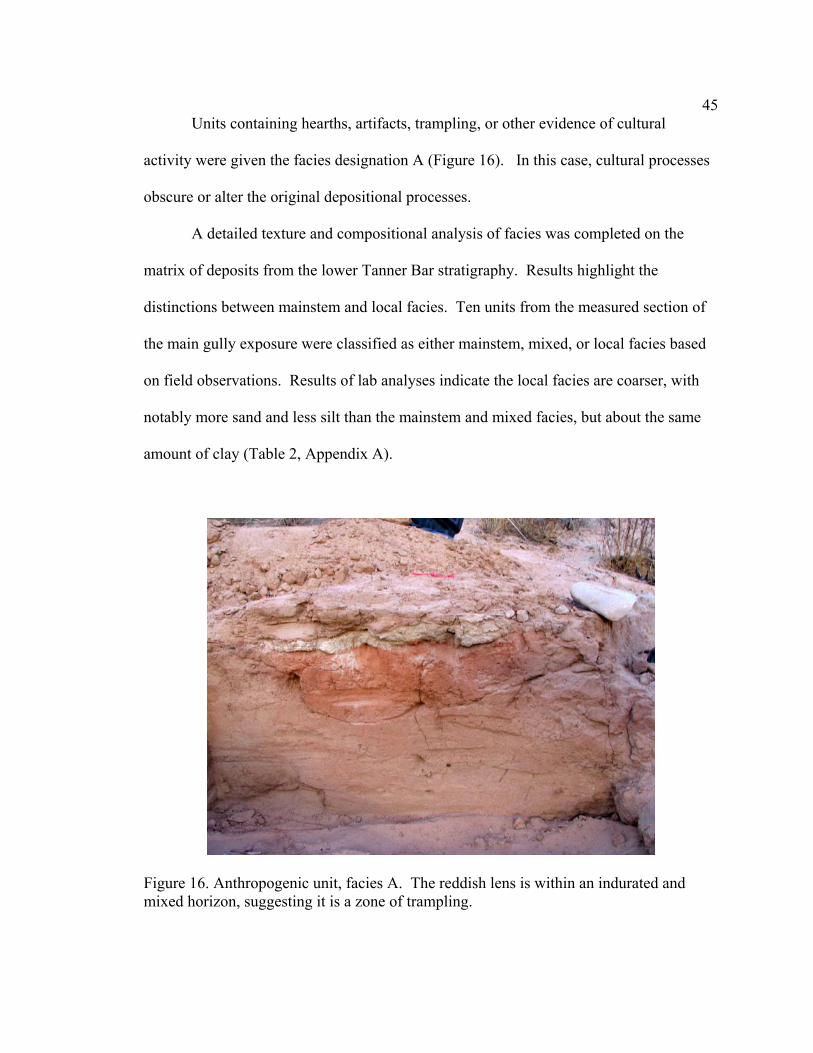
45Units containing hearths, artifacts, trampling, or other evidence of cultural
activity were given the facies designation A (Figure 16). In this case, cultural processes
obscure or alter the original depositional processes.
A detailed texture and compositional analysis of facies was completed on the
matrix of deposits from the lower Tanner Bar stratigraphy. Results highlight the
distinctions between mainstem and local facies. Ten units from the measured section of
the main gully exposure were classified as either mainstem, mixed, or local facies based
on field observations. Results of lab analyses indicate the local facies are coarser, with
notably more sand and less silt than the mainstem and mixed facies, but about the same
amount of clay (Table 2, Appendix A).
Figure 16. Anthropogenic unit, facies A. The reddish lens is within an indurated and mixed horizon, suggesting it is a zone of trampling.

46Local facies have less calcium carbonate and somewhat higher iron content
than mainstem facies and the mixed facies had slightly more iron than the mainstem
facies (Table 2). The local bedrock is composed of sandstone and siltstone with little
calcium carbonate, whereas elsewhere on the Colorado Plateau the river flows through
limestone. The high iron content in local bedrock is evident in its reddish iron oxide
hues.
More precise grain-size and grading measurements would be necessary to
determine if the patterns of inverse grading of modern flood deposits in Grand Canyon
(Rubin et al., 1998) are present in pre-dam strata. Such results could help better
understand pre-dam sediment supply.
Ninemile Draw
Stratigraphy
Stratigraphic results from Ninemile Draw are presented in a primary stratigraphic
panel and four archaeological study units. A total of 53 units were described in the
stratigraphy of the terrace front at Ninemile Draw, where four main stratigraphic
TABLE 2. RESULTS OF DETAILED SEDIMENTARY ANALYSIS AT TANNER
BAR*.
Sand Silt Clay CaCO3 Iron Source -------------------%---------------------- % mg/kg
Mainstem 48.6 40.6 10.3 6.7 7720 Mixed 59.0 31.3 9.5 6.1 9900 Local 81 9 10 3.1 11600
* See Appendix A for detailed results.
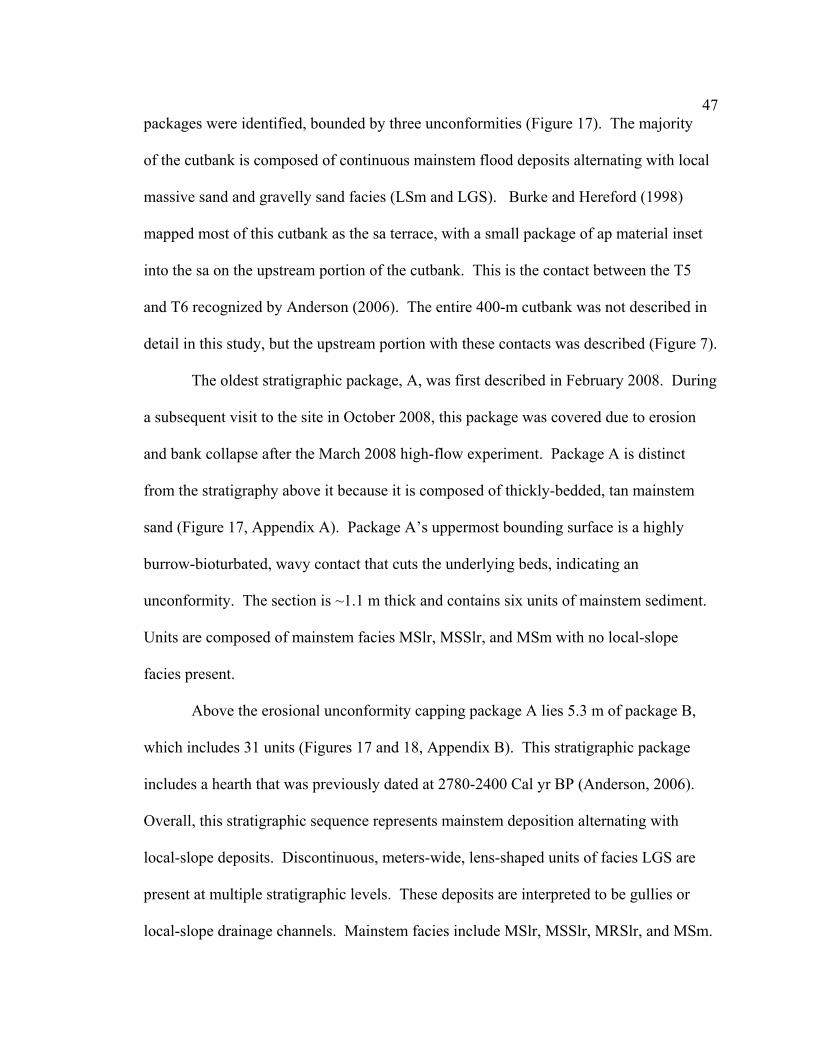
47packages were identified, bounded by three unconformities (Figure 17). The majority
of the cutbank is composed of continuous mainstem flood deposits alternating with local
massive sand and gravelly sand facies (LSm and LGS). Burke and Hereford (1998)
mapped most of this cutbank as the sa terrace, with a small package of ap material inset
into the sa on the upstream portion of the cutbank. This is the contact between the T5
and T6 recognized by Anderson (2006). The entire 400-m cutbank was not described in
detail in this study, but the upstream portion with these contacts was described (Figure 7).
The oldest stratigraphic package, A, was first described in February 2008. During
a subsequent visit to the site in October 2008, this package was covered due to erosion
and bank collapse after the March 2008 high-flow experiment. Package A is distinct
from the stratigraphy above it because it is composed of thickly-bedded, tan mainstem
sand (Figure 17, Appendix A). Package A’s uppermost bounding surface is a highly
burrow-bioturbated, wavy contact that cuts the underlying beds, indicating an
unconformity. The section is ~1.1 m thick and contains six units of mainstem sediment.
Units are composed of mainstem facies MSlr, MSSlr, and MSm with no local-slope
facies present.
Above the erosional unconformity capping package A lies 5.3 m of package B,
which includes 31 units (Figures 17 and 18, Appendix B). This stratigraphic package
includes a hearth that was previously dated at 2780-2400 Cal yr BP (Anderson, 2006).
Overall, this stratigraphic sequence represents mainstem deposition alternating with
local-slope deposits. Discontinuous, meters-wide, lens-shaped units of facies LGS are
present at multiple stratigraphic levels. These deposits are interpreted to be gullies or
local-slope drainage channels. Mainstem facies include MSlr, MSSlr, MRSlr, and MSm.
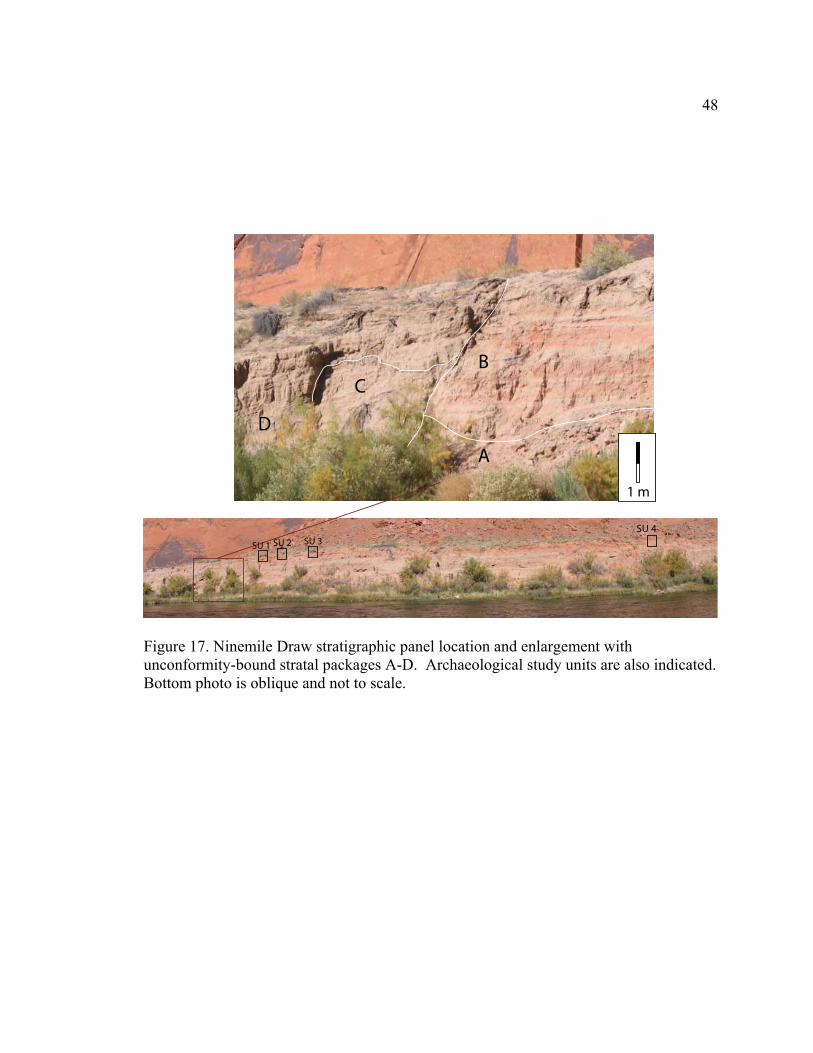
48
1 m
D
C
SU 1 SU 3SU 2SU 4
A
B
Figure 17. Ninemile Draw stratigraphic panel location and enlargement with unconformity-bound stratal packages A-D. Archaeological study units are also indicated. Bottom photo is oblique and not to scale.
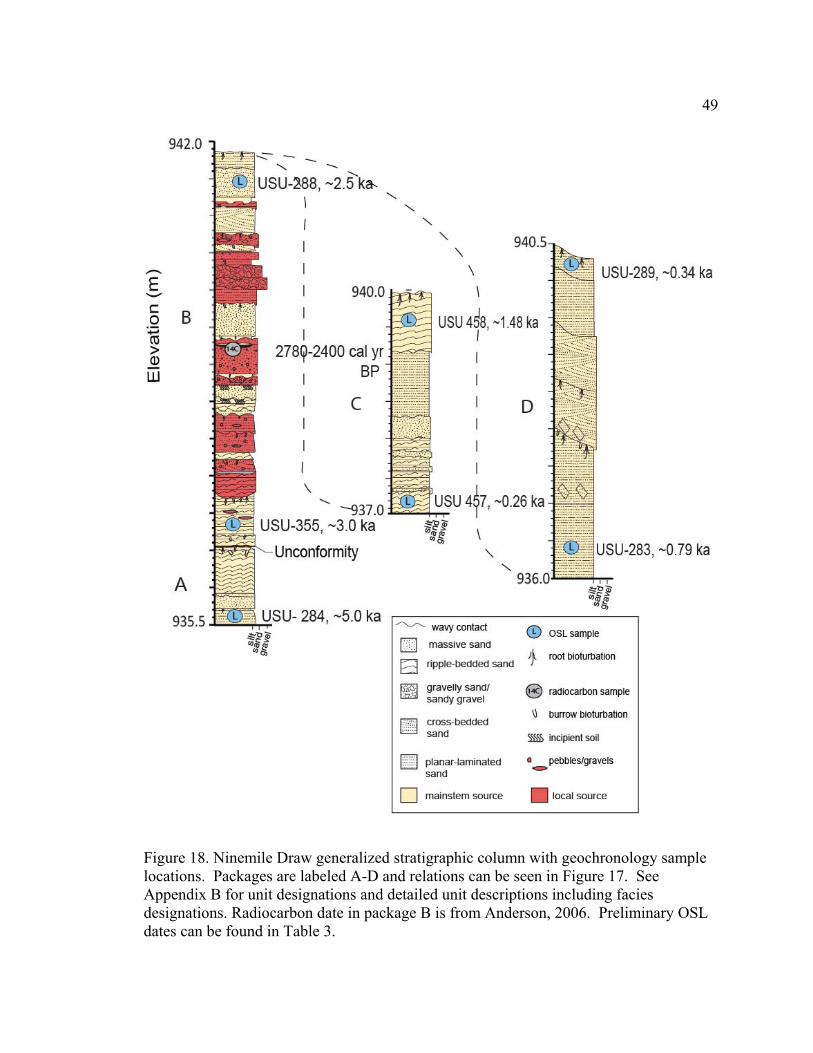
49
Figure 18. Ninemile Draw generalized stratigraphic column with geochronology sample locations. Packages are labeled A-D and relations can be seen in Figure 17. See Appendix B for unit designations and detailed unit descriptions including facies designations. Radiocarbon date in package B is from Anderson, 2006. Preliminary OSL dates can be found in Table 3.

50Mainstem deposits in this section are commonly inversely-graded from silt at
the bottom to sand at the top, suggesting that the rising limb of paleofloods is preserved.
Paleocurrent indications of climbing ripples are bimodal, with approximate directions
being south and southeast, or downstream (Appendix D).
Two inset depositional packages were identified (Figures 17 and 18, and
Appendix B). Package C was not discernible during the original archaeological field
excursion, but after the March 2008 high -flow experiment, erosion of the cut bank
uncovered lateral unit truncations, indicating a distinct package. This 3.0 m thick
depositional package contains sedimentary structures including plane-bed laminations,
climbing ripples, and massive sand. Five couplets of facies MSSlr and MSm with
varying thicknesses were identified, and they all coarsen up. Although there is a slight
incorporation of local sediment as indicated by sand with a hue of 7.5 YR, the units are
all well-sorted mainstem facies. Paleocurrent indicators in this package are all
downstream (Appendix D).
One explanation for the alternating couplets of facies MSSlr and MSm in this
package is that they represent fluvial deposition followed by eolian reworking, as
identified by Draut and Rubin (2008). The couplets they identified are flood deposits
alternating with distinctively eolian or massive units. Alternatively, each couplet could
represent one flood with two pulses of sediment, corresponding to limbs of the flood, one
silty sand and one primarily sand. The flood deposits in this package alternate with
massive, slightly redder units that may be eolian, but the massive structure may be due to
bioturbation.

51 Package D (Figures 17 and 18, Appendix B) is the youngest and is inset into
the first three packages. Package D consists of at least six mainstem beds with no local
sediment. Units are notably thicker than units in the other packages, up to ~1 m, with six
units of MSSlr or MSm, all 10 YR 6/3 in color. Sedimentary structures include cross-
beds, ripples, and wavy laminations with no obvious pattern. The ripples are interpreted
as fluvial because of their form, thickness, and lack of reverse grading. The bottom two
units contain slumped portions of sediment along the buttress contact that are interpreted
as toppled portions of the paleocutbank. The other observed paleocurrent indicators were
highly variable and suggest that these units were deposited in an eddy.
Archaeological Study Unit Stratigraphy and Interpretations In addition to the primary stratigraphic section along the cutbank at the Ninemile
Draw study site, four smaller archaeological study units were described (Figure 7). Here,
I focus on SU 1 (Figure 19) because it ties directly to the top of package B at the primary
study outcrop. More detailed stratigraphic panels were produced for each study unit
(Appendix C), and radiocarbon ages from potential cultural features were obtained by
archaeologists.
Study Unit (SU) 1 was located on the western end of the site, closest to the
primary stratigraphic section described above (Figure 7). The depositional units consist
of entirely local facies and are interpreted to have been deposited by both local slopewash
and eolian processes, including eolian sand (ES), local massive sand (LSm), and local
gravelly sand (LGS). Four discontinuous carbonate lenses of mud and silt (facies LM)
are also present, indicating at least four depositional hiatuses. No cultural material was
52
5 123
4
6
7
5
1b
3b 4b
massive sand
pebbly/gravelly sand root cast
1
2
3
4
6
5
1b
3b
4b1 m
local mud lens
North
7
Figure 19. Stratigraphic panel of C:2:032 SU 1. Top photo is oblique view of study trench. Numbers indicate units (see Appendix C). Charcoal lens with 2340-2120 cal yr BP age is from floor of this study unit, directly beneath unit 1.

53found in this unit, but a radiocarbon age obtained by archaeologists from a charcoal
lens ~ 2 m below the top of this study unit is 2340-2120 cal yr BP (Table 3, Appendices
E and F).
SU 2, east of SU 1 (see Figure 7 for location), has a burn unit at the base that is
pervasive across the site but may not be cultural (Damp et al., 2009). This corresponds to
the lens dated in SU 1. The trench exposed units of ES, LSm and lenses of LGS, similar
to SU 1. The stratigraphy revealed by SU 3, east of SU 1 and SU 2, also consists of
alternating MSm and LGS. A discontinuous ash stain ~1 m deep is present, capped by
charcoal and ash, and was found to be 3210 to 2940 cal yr BP (Table 3). This ash feature
is ~1 m higher than the feature in SU 1 but ~900 cal yr BP older, which is inconsistent
but may be the result of local cut-and-fill processes on the terrace tread (Damp et al.,
2009).
SU 4, ~80 m downstream from SU 3, exposed a hearth feature at the base of SU
4. This hearth is underlain by an indurated tan sand unit, which is underlain by a 3 cm-
thick ash lens. Artifacts found in or around SU 4 include sherds, groundstone fragments,
and other lithic scatter, indicating a Pueblo II age, which is younger than the other study
units (Damp et al., 2009). Sedimentary facies include LSm and ES with numerous
indurated anthropogenic horizons, suggesting multiple times of use. In summary, these
archaeological study units reveal exposures of the stratigraphy in the upper ~1 to 2 m of
the alluvium at this location. SU 1 and SU 2 exposed the upper 1-2 m of package B. SU
3 and SU 4 exposed alluvium that is slightly younger and older than package B,
suggesting a complicated sequence of erosion of deposition along the terrace tread.
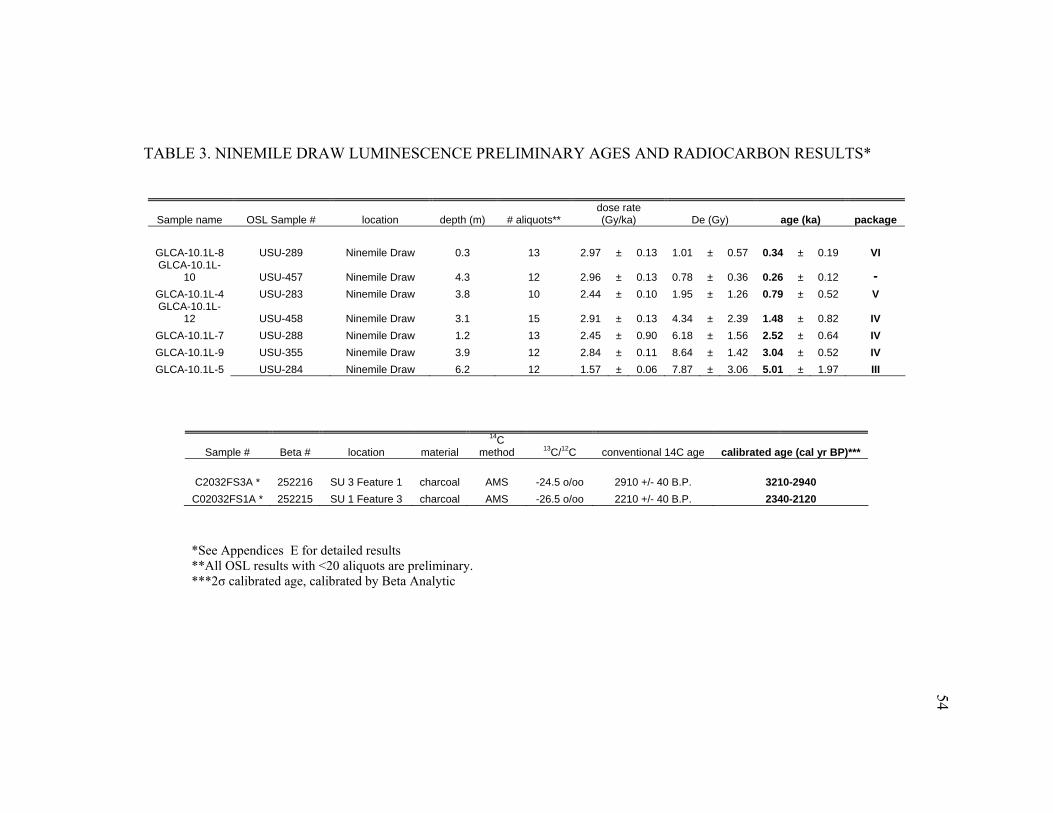
54
TABLE 3. NINEMILE DRAW LUMINESCENCE PRELIMINARY AGES AND RADIOCARBON RESULTS*
Sample name OSL Sample # location depth (m) # aliquots** dose rate (Gy/ka) De (Gy) age (ka) package
GLCA-10.1L-8 USU-289 Ninemile Draw 0.3 13 2.97 ± 0.13 1.01 ± 0.57 0.34 ± 0.19 VI GLCA-10.1L-
10 USU-457 Ninemile Draw 4.3 12 2.96 ± 0.13 0.78 ± 0.36 0.26 ± 0.12 - GLCA-10.1L-4 USU-283 Ninemile Draw 3.8 10 2.44 ± 0.10 1.95 ± 1.26 0.79 ± 0.52 V GLCA-10.1L-
12 USU-458 Ninemile Draw 3.1 15 2.91 ± 0.13 4.34 ± 2.39 1.48 ± 0.82 IV GLCA-10.1L-7 USU-288 Ninemile Draw 1.2 13 2.45 ± 0.90 6.18 ± 1.56 2.52 ± 0.64 IV GLCA-10.1L-9 USU-355 Ninemile Draw 3.9 12 2.84 ± 0.11 8.64 ± 1.42 3.04 ± 0.52 IV GLCA-10.1L-5 USU-284 Ninemile Draw 6.2 12 1.57 ± 0.06 7.87 ± 3.06 5.01 ± 1.97 III
Sample # Beta # location material 14C
method 13C/12C conventional 14C age calibrated age (cal yr BP)***
C2032FS3A * 252216 SU 3 Feature 1 charcoal AMS -24.5 o/oo 2910 +/- 40 B.P. 3210-2940 C02032FS1A * 252215 SU 1 Feature 3 charcoal AMS -26.5 o/oo 2210 +/- 40 B.P. 2340-2120
*See Appendices E for detailed results **All OSL results with <20 aliquots are preliminary. ***2σ calibrated age, calibrated by Beta Analytic
55Sedimentary units in all of these study units consist of poorly-sorted local slopewash or
gully facies alternating with massive sand. No distinct mainstem flood structures were
visible in the study units, suggesting that they are the result of local depositional
processes instead of mainstem overbank floods. In addition, eolian reworking may have
occurred during hiatuses in deposition, but the sand units are massive, possibly because
of bioturbation, so they were indeterminate. Based on the anthropogenic facies observed
in the study trenches, occupation occurred at multiple times as the landform was slowly
aggrading due to local hillslope and tributary wash processes.
Geochronology
Seven OSL samples from Ninemile Draw were processed and initial results are
presented in Table 3. These results are preliminary, so that the ages will become refined
as analyses are complete. Nevertheless, these results constrain the timing of the
stratigraphic packages above and support the observed unconformities (Figures 18 and
20). The base of package A is ~5.0 ka. Overlying this package, the base of package B is
~3.0 ka, which suggests the presence of an erosional unconformity spanning up to ~2 ky.
An initial OSL age from 5.0 m above the base of package B is ~2.5 ka. Within error,
these package B OSL ages are stratigraphically consistent with the radiocarbon age of
2780 to 2400 cal yr BP previously obtained from the hearth between them (Anderson,
2006), as well as the radiocarbon age in the upper package from SU 3 (2340 to 2120 cal
yr BP).
Two initial OSL ages from package C confirm that it is younger than A and B, as
observed in the field, but the ages are stratigraphically reversed (Figure 18, Table 3).

56
10 m
USU-289: ~0.34 ka
USU-283: ~0.79 kaUSU-284: 5.0 ka
2780-2400 Cal yr BP14C
L
L
L
L
L
L
1 m
USU-288: ~2.5 ka
14C
C02032FS1A:2340 to 2120 Cal yr BP
L
USU-457: ~0.26 ka
USU-458: ~1.5 ka
USU-355: ~3.0 ka
SU 1 to east
DC
Figure 20. Initial geochronology results from the Ninemile Draw stratigraphic panel outcrop. Lower radiocarbon age is from Anderson (2006) and upper age is from Damp et al. (2009).
A
57Sample USU-457 was collected from 4.3 m below the present day terrace tread and its
preliminary age is ~0.3 ka. Sample USU-458 was collected from 1.2 m above USU-457,
but its age is ~1.5 ka. This younger age stratigraphically below an older age may be due
to bioturbation of the lower units or because an upper portion of the stratigraphy slumped
or slid from its original stratigraphic location. The upper age does fit within the rest of
the chronostratigraphy, and so the lower age is assumed to be erroneous.
Preliminary results from the youngest stratigraphic package, D, include a basal
OSL age of ~0.8 ka and an upper OSL age of ~0.3 ka (Table 3, Figures 18 and 20).
These ages are consistent with this package being stratigraphically higher than the other
three packages and inset into them. Deposition within package D spans at least a few
hundred years and is composed of only six flood packages, yet no abrupt unconformities
are visible.
Tanner Bar- C:13:323 Stratigraphy
In the ~6.5 m of stratigraphy exposed underlying the upstream archaeological site
at Tanner Bar, mainstem channel gravels (facies MCG) are interbedded with mainstem
sand (Figure 21). The paleocurrent directions indicated by imbricated gravels and
dipping gravel foresets in the lowest strata underneath the archaeological site focus about
180°, or downstream (Appendix C). This sequence is interpreted as a prograding lateral-
channel gravel bar because it includes mainstem channel gravels in dipping foresets. The
top of this gravelly sequence is ~10 m above the modern river shoreline. The channel
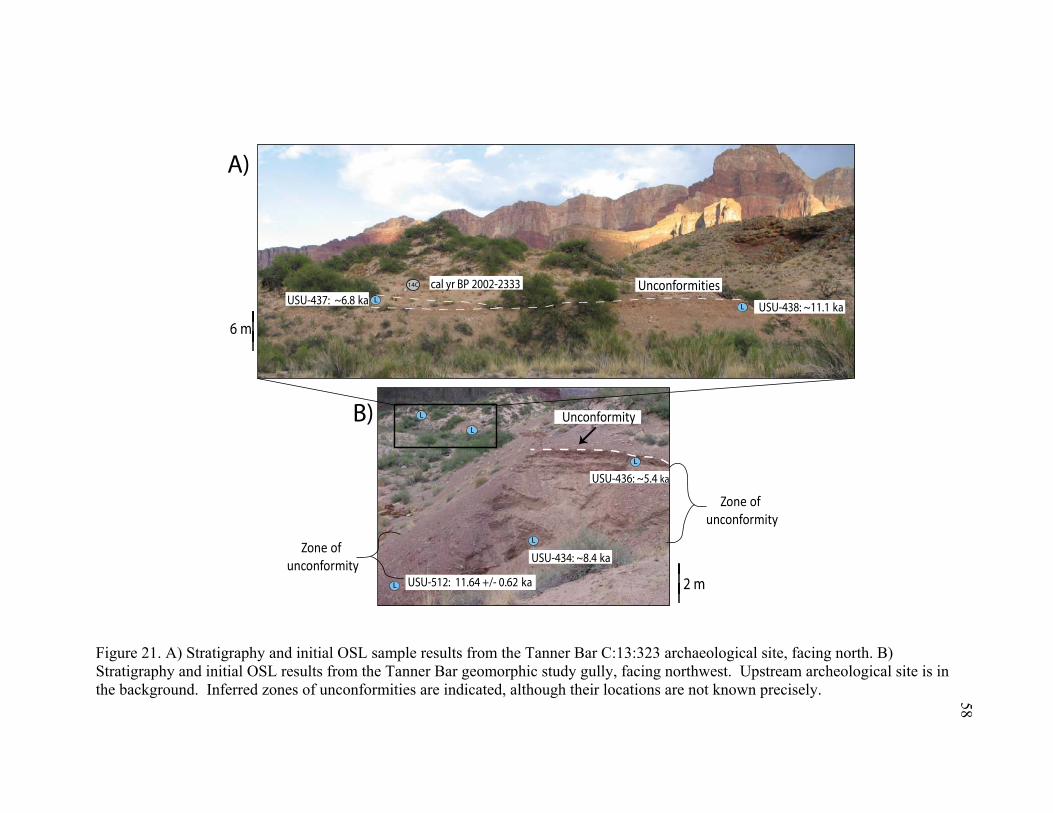
58
Figure 21. A) Stratigraphy and initial OSL sample results from the Tanner Bar C:13:323 archaeological site, facing north. B) Stratigraphy and initial OSL results from the Tanner Bar geomorphic study gully, facing northwest. Upstream archeological site is in the background. Inferred zones of unconformities are indicated, although their locations are not known precisely.
LL
USU-434: ~8.4 ka
USU-436: ~5.4 ka
2 m
L
L
L
USU-438: ~11.1 kaL
L
USU-437: ~6.8 kacal yr BP 2002-2333
USU-512: 11.64 +/- 0.62 kaL
14C
Unconformity
6 m
Unconformities
Zone ofunconformity
Zone ofunconformity
A)
B)

59gravels at Tanner Bar are interpreted to be sourced from the mainstem and not local
tributaries because they are strongly imbricated downstream in dipping foresets and they
are composed of rounded cobbles and gravels of rock types besides what is present in the
Tanner Creek tributary.
Above these basal mainstem channel deposits, units of finer-grained mainstem
sand are interbedded with eolian sand, which both encompass the archaeological features.
These interfingering units have a cumulative thickness of up to 2 m. Eolian-
reworkedsand currently caps the stratigraphy. No detailed overall stratigraphic panel was
measured at this upstream site, but archaeological study units associated with the
uppermost stratigraphy were.
Archaeological Study Unit Stratigraphy and Interpretations
Stratigraphy was described and stratigraphic columns were produced at five study
units at the archaeological site (see Figure 8 for study unit locations). Here I focus on SU
5 and SU 7 because they were dug in different stratigraphic locations and constrain the
stratigraphy around the main archaeological features at this site (see Appendix C for
detailed stratigraphic panels of additional study units).
SU 7 is stratigraphically the lowest archaeological study unit. At the base of SU 7
is sandy gravel, facies LGS, that is at the very top of a channel gravel sequence
underlying the archaeological site (Figure 22). Facies MSlr, mainstem laminated sand,
tops the gravel sequence. Directly above the mainstem sand is a ~0.5 m thick unit of
crinkly-laminated sand, which is interpreted to be eolian-reworked fluvial sand (facies

60
0
0.5
2
3
meters
4
USU‐437, ~ 6.8 ka L
2
3
4
1
L
covered
1
Lripple‐laminated silty sand
clast‐supported gravel
OSL sample
rhizoliths
massive sand
12
USU‐437, ~ 6.8 ka
Figure 22. Stratigraphic column of C:13:323 SU 7 with preliminary OSL age of 6.8 ka (Table 4). See Appendix C for detailed facies designations and unit descriptions.
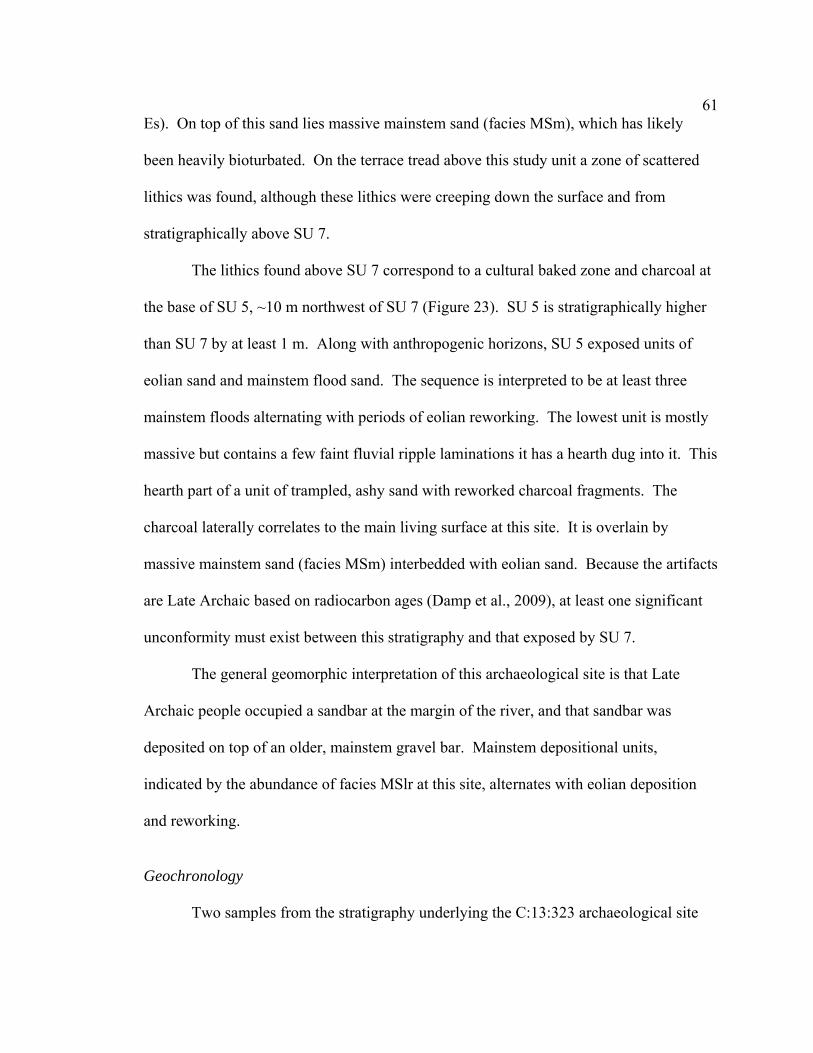
61Es). On top of this sand lies massive mainstem sand (facies MSm), which has likely
been heavily bioturbated. On the terrace tread above this study unit a zone of scattered
lithics was found, although these lithics were creeping down the surface and from
stratigraphically above SU 7.
The lithics found above SU 7 correspond to a cultural baked zone and charcoal at
the base of SU 5, ~10 m northwest of SU 7 (Figure 23). SU 5 is stratigraphically higher
than SU 7 by at least 1 m. Along with anthropogenic horizons, SU 5 exposed units of
eolian sand and mainstem flood sand. The sequence is interpreted to be at least three
mainstem floods alternating with periods of eolian reworking. The lowest unit is mostly
massive but contains a few faint fluvial ripple laminations it has a hearth dug into it. This
hearth part of a unit of trampled, ashy sand with reworked charcoal fragments. The
charcoal laterally correlates to the main living surface at this site. It is overlain by
massive mainstem sand (facies MSm) interbedded with eolian sand. Because the artifacts
are Late Archaic based on radiocarbon ages (Damp et al., 2009), at least one significant
unconformity must exist between this stratigraphy and that exposed by SU 7.
The general geomorphic interpretation of this archaeological site is that Late
Archaic people occupied a sandbar at the margin of the river, and that sandbar was
deposited on top of an older, mainstem gravel bar. Mainstem depositional units,
indicated by the abundance of facies MSlr at this site, alternates with eolian deposition
and reworking.
Geochronology
Two samples from the stratigraphy underlying the C:13:323 archaeological site

62
6 5
4
3
2
65
3
2
ripple‐laminated sandrhizoliths
massive sand
0
0.5
meters
1
cultural charcoal and ashy sand
12
3
4
5
charcoal fragments
14C
14C radiocarbon sample
2310-2040 cal yr BP
14C
4
56
Figure 23. Stratigraphic column of C:13:323 SU 5 with radiocarbon age of 2310-2040 cal yr BP (Table 4). See Appendix C for detailed facies designations and unit descriptions.

63TABLE 4. TANNER BAR LUMINESCENCE PRELIMINARY AGES AND RADIOCARBON RESULTS*
OSL Sample # location depth (m) # aliquots**
dose rate (Gy/ka) De (Gy) age (ka) package
USU-440 C:13:327 SU 8 0.2 6 1.80 ± 0.08 - ± - modern ± - -
USU-439 C:13:327 SU 4 0.6 14 1.82 ± 0.08 1.94 ± 0.62 1.06 ± ±
0.34 V
USU-142* C:13:327 gully 3.6 20 2.65 ± 0.12 3.93 ± 1.21 1.48 ± ±
0.13 IV
USU-141* C:13:327 gully 4.6 20 3.01 ± 0.13 4.63 ± 1.19 1.50 ± ±
0.11 IV
USU-140* C:13:327 gully 5.4 20 2.72 ± 0.12 4.64 ± 1.21 1.71 ± ±
0.13 IV
USU-370 C:13:327 gully 5.3 12 4.5 ± 0.20 7.17 ± 2.63 1.60 ± ±
0.59 IV
USU-436 Geomorphic study gully 0.6 16 3.12 ± 0.14 16.93 ± 2.12 5.42 ± ±
0.73 III
USU-437 C13:323 SU 7 0.6 16 2.34 ± 0.10 15.96 ± 2.54 6.82 ± ±
1.14 III
USU-434 Geomorphic study gully 3.1 13 2.75 ± 0.12 23.13 ± 4.73 8.40 ± ± 1.7 II
USU-438 C13:323 basal stratigraphy,
top of gravel sequence 1.6 13 2.16 ± 0.09 24.00 ± 4.50 11.10 ± ±
2.15 I
USU-512* Geomorphic study gully 4.5 24 2.83 ± 0.13 33.04 ± 4.38 11.64 ± ±
0.62 I
Sample # Beta # location material 14C method 13C/12C conventional
14C age age (cal yr BP)*** C13323FS28A * 252217 C:13:323 SU 5 Feature 2 charcoal AMS -25.4 o/oo 2130 +/- 40 B.P 2310-2040 C13323FS43A* 252218 C:13:323 SU 10 Feature 4 charcoal AMS -25.1 o/oo 2160 +/- 40 B.P 2300-2240, 2170-2000
Beta-232598 232598 C:13:327 SU 1 Feature 3 charcoal AMS -22.9 o/oo 1200 +/- 60 B.P. 1520-1330 Beta-252219 252219 C:13:327 SU 6 Feature 9 charcoal AMS -24.4 o/oo 1520 +/- 40 B.P. 1280-970 C13327FS1 250688 C13:327 gully charcoal AMS -25.4 o/oo 2920 +/- 40 B.P. 3210-2950
*See Appendices E and F for detailed results. **All OSL results with <20 aliquots are preliminary. *** 2σ calibrated age, calibrated by Beta Analytic. ****Previously designated as UNL-1390, processed at the University of Nebraska-Lincoln Luminescence
Laboratory.

64were dated with OSL (Figure 21). A thin mainstem sand unit within the gravel bar
topsets has a preliminary age of ~11.1 ka (Table 4). This unit is ~1.5 m below
archaeological Feature 1. A mainstem sand unit overlying these gravels in SU 7 has a
preliminary OSL age of ~6.8 ka. This unit is only 10 cm above the gravel sequence,
indicating the presence of an unconformity. The 2310-2040 cal yr BP age from SU 5
(Table 4, Appendices E and F), suggests an additional unconformity between SU 5 and
SU 7.
Overall, this site includes early Holocene mainstem channel deposits, mid-
Holocene mainstem flood sands, and ~ 2 ka Late Archaic archaeological features
encompassed by eolian and mainstem fluvial sand deposits. The three depositional
packages are separated by erosional unconformities.
Tanner Bar Geomorphic Study Gully
Stratigraphy
The Tanner Bar geomorphic study gully is located 150 m south of the C:13:323
archaeological site (Figures 6 and 8). The gully crosses the terrace perpendicular to the
terrace riser ~30 m long, although only the stratigraphy exposed closest to the terrace
riser is well-exposed. The south-facing wall of this gully was originally covered with
modern slope detritus, four exposures were hand-dug to better reveal the stratigraphy
(Figure 21B). A distinct top edge of the terrace tread at this location is ~11.5 m above
the modern river shoreline perpendicular to the channel across the bar, and the measured
stratigraphy is ~8.0 meters thick. Five depositional zones were described, although they
are strongly lenticular and interfinger, so none were laterally continuous for more than a
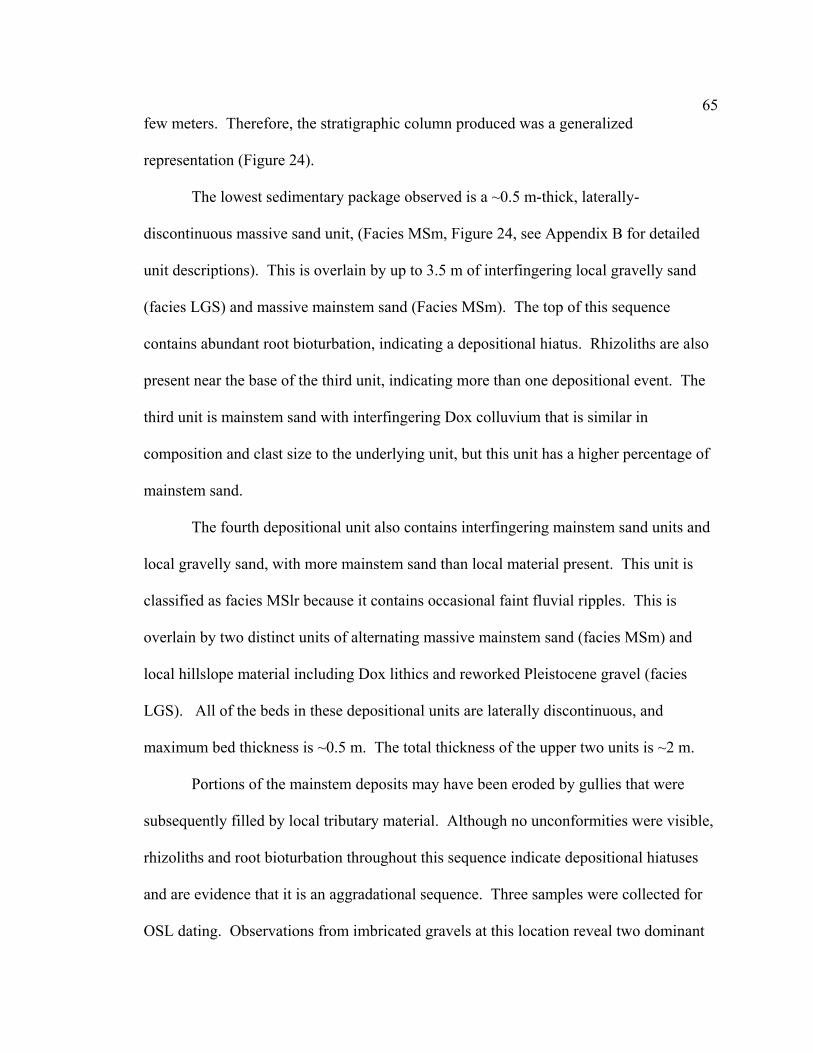
65few meters. Therefore, the stratigraphic column produced was a generalized
representation (Figure 24).
The lowest sedimentary package observed is a ~0.5 m-thick, laterally-
discontinuous massive sand unit, (Facies MSm, Figure 24, see Appendix B for detailed
unit descriptions). This is overlain by up to 3.5 m of interfingering local gravelly sand
(facies LGS) and massive mainstem sand (Facies MSm). The top of this sequence
contains abundant root bioturbation, indicating a depositional hiatus. Rhizoliths are also
present near the base of the third unit, indicating more than one depositional event. The
third unit is mainstem sand with interfingering Dox colluvium that is similar in
composition and clast size to the underlying unit, but this unit has a higher percentage of
mainstem sand.
The fourth depositional unit also contains interfingering mainstem sand units and
local gravelly sand, with more mainstem sand than local material present. This unit is
classified as facies MSlr because it contains occasional faint fluvial ripples. This is
overlain by two distinct units of alternating massive mainstem sand (facies MSm) and
local hillslope material including Dox lithics and reworked Pleistocene gravel (facies
LGS). All of the beds in these depositional units are laterally discontinuous, and
maximum bed thickness is ~0.5 m. The total thickness of the upper two units is ~2 m.
Portions of the mainstem deposits may have been eroded by gullies that were
subsequently filled by local tributary material. Although no unconformities were visible,
rhizoliths and root bioturbation throughout this sequence indicate depositional hiatuses
and are evidence that it is an aggradational sequence. Three samples were collected for
OSL dating. Observations from imbricated gravels at this location reveal two dominant

66
Figure 24. Generalized stratigraphic column of Tanner Bar geomorphic study gully with OSL sample locations. See Appendix B for detailed unit descriptions and Appendix D for paleocurrent data.

67paleocurrent directions (Appendix D). The average paleocurrent measured at the
bottom of the gully is west, or towards the river. The paleocurrent direction from seven
imbricated gravels sequences in the middle of the exposure is east, away from the river
(Figure 24). The top ~2 m of stratigraphy also displays a paleocurrent direction of west,
towards the river. Because these directions were measured on units of the local-slope
gravelly sand facies, they have preserved the direction of gully material movement and
reworking, not mainstem processes.
Geochronology
Three initial OSL results from the geomorphic study gully span ~6 ky (Table 4,
Figure 24). The sand unit at the base of this measured stratigraphy has an OSL age of
11.64 ± 0.62 ka, a sand unit from the middle of the section is ~8.4 ka, and a sample from
unit 5, ~0.6 m below the present terrace tread, is ~5.4 ka. These results indicate that at
least two erosional unconformities are present, but field observations failed to find
evidence for their precise locations. Alternatively, this sequence could represent
incremental deposition of local-slope material interfingering with occasional mainstem
overbank floods. No true buried soils were observed, though gully and mainstem erosion
at the onset of each depositional event may have removed any such markers.
Tanner Bar C:13:327 Stratigraphy
The C:13:327 archaeological site lies ~100 m downstream from the geomorphic
study gully and is set where a gully cuts through the terrace (Figures 6 and 8). Here, ~8
m of stratigraphy was measured and described as exposed by the main gully. In addition,

68the upper stratigraphy was observed in archaeological study unit exposures adjacent to
the gully and along the terrace riser south of the gully. The top tread of the terrace is
~11.5 m above the modern river shoreline, as measured perpendicular to flow. This is
approximately the same height above the river as the terrace tread at the other two Tanner
sites. There are at least two meters of additional basal stratigraphy that was not exposed.
No cross-cutting unconformities were visible in the main body of stratigraphy during
field observations.
The stratigraphy includes alternating mainstem and local deposits (Figure 25).
The thickest three units are all facies LGS with angular, imbricated Dox cobbles and
pebbles. Other facies include mainstem-deposited MSlr, MSSlr, MSm, and MSlr and
local-slope sands of LSm. No eolian units were observed in the stratigraphy exposed
along the gully, but they were observed in the archaeological study units of the upper
stratigraphy. Over 40 paleocurrent directions were measured in the stratigraphy exposed
by the gully from sedimentary structures including climbing ripples, cross-bedding, and
imbrication (Figure 25, Appendix D). Mainstem fluvial sand units exposed by the gully
in the upper ~3 m of stratigraphy have paleocurrent directions that vary from north to
west, or approximately upstream to towards the river and gravel bar, suggesting
deposition in an eddy. Additional mainstem fluvial sand units in the ~3 m below that
have paleocurrent directions of west to south, which is additional evidence for variable
flow direction and the presence of an eddy. Imbricated gravels are generally oriented
west to north, or towards the river and slightly upstream.

69
L
slab-lined hearth
820.0
L
11
Elev
atio
n (m
)
USU‐370, ~1.6 kaL
14C
LUSU‐140, 1.71 ± .13 ka
USU‐141, 1.50 ± .11 ka
L
L USU‐142, 1.48 ± .13 ka
14C 3210‐2950 cal yr BP
14C
1520‐1330 cal yr BP
1280‐970 cal yr BP
USU‐439, ~1.1 ka
silt
sand
grav
el
813.0
820.0
822.0
n = 5resultant = 294°
N
S
n = 11resultant = 305
N
S
n = 9resultant = 236
N
S
n = 14resultant = 287
N
S
OSL sample
root bioturbation
radiocarbon sample
burrow bioturbation
incipient soil
pebbles/gravels
Lwavy contact
massive sand
planar-laminatedsand
ripple-bedded sand
gravelly sand/sandy gravel
cross-beddedsand
14C
mainstem source local source
Figure 25. Stratigraphic column of sediment exposed by the gully cutting through the C:13:327 archaeological site. OSL and radiocarbon sample locations are indicated. See Appendix B for facies designations and detailed unit descriptions and Appendix D for detailed paleocurrent data.
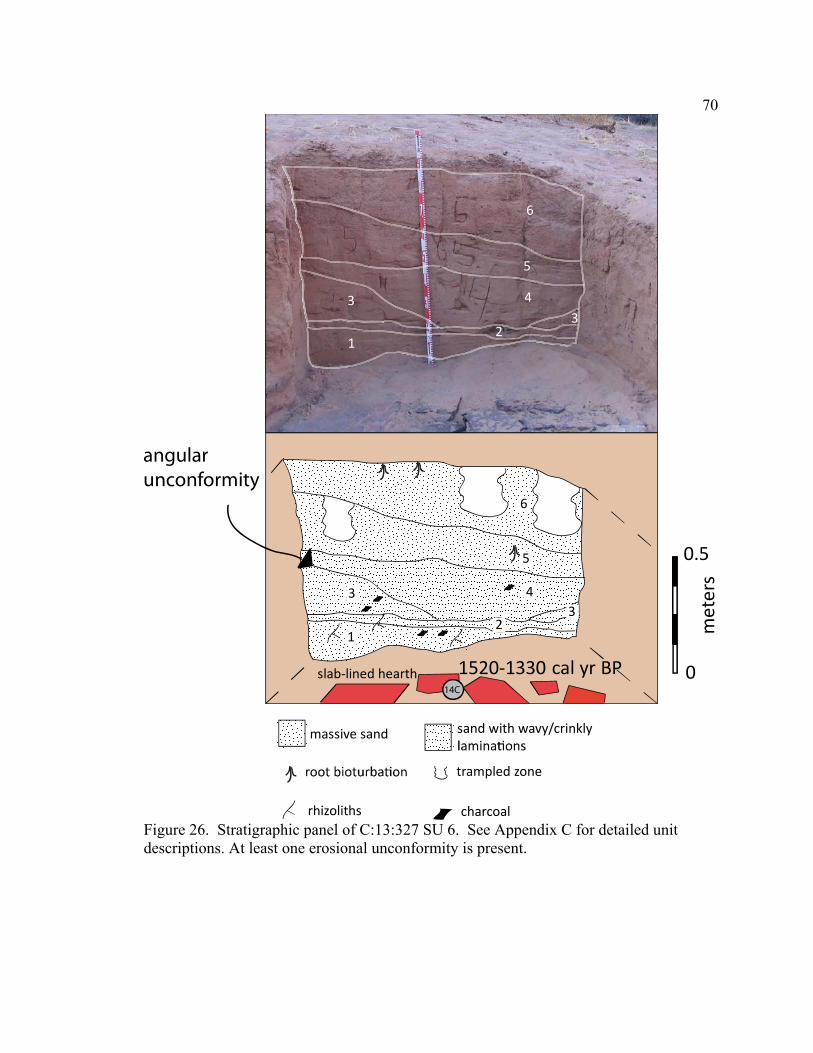
70
12
0.5
meters
massive sand
0
rhizoliths
6
5
4
1
3
2
6
5
33
3
charcoal
4
1
33
5
6
sand with wavy/crinkly
trampled zone
slab‐lined hearth
2
angularunconformity
14C
1520‐1330 cal yr BP
Figure 26. Stratigraphic panel of C:13:327 SU 6. See Appendix C for detailed unit descriptions. At least one erosional unconformity is present.
71Archaeological Study Unit Stratigraphy and Interpretations
In addition to the stratigraphic section along the gully, six archaeological study
units and two geomorphic study units were excavated and described in the upper strata at
C:13:327 (Appendix C, Figure 26). Here, I focus on SU 6, SU 4, and SU 7 to provide a
complete picture of the stratigraphy here. The stratigraphically lowest of these,
SU 6, was a ~ 2 m deep exposure set near the top of the main gully stratigraphy (Figure
25). It exposed a slab-lined hearth that was one of the main features of this site, and a
radiocarbon age indicates that it was used 1280-970 cal yr BP (Table 4). This cultural
feature was first overtopped by a mainstem flood (unit 1) and charcoal from the slab-
lined hearth is reworked into this sand. At least four additional mainstem flood events
are interpreted in the overlying strata, depositing units 2 through 5 (Figure 25). These are
either ripple-laminated or massive, likely because of human trampling. At least one
erosional unconformity exists along the top of unit 3.
Approximately 2 m higher and 20 m northeast of SU 6 (Figure 8; Appendix C,
Figure C.14), SU 4 contained only one unit that was not obscured by bioturbation. This
unit is ~0.5 m thick and is composed of facies MSlr with large fluvial cross beds. An
OSL sample from this fluvial sand has an initial age of ~1.1 ka (Table 4).
Two geomorphic study units were dug into near-surface eolian coppice dunes to
expose the highest stratigraphy at this site. One of archaeological study units, SU 8, t the
eastern edge of the C:13:327 archaeological site (Figure 8), exposed two distinct units of
eolian sand capped by a single mainstem flood unit (Appendix C, Figure C.18). An OSL

72sample from 0.2 m below the surface in this study unit has an average of less than zero
equivalent dose.
Regarding the archaeological context, the oldest archaeological features were
found within the top ~1 m meter of the stratigraphy exposed by the gully at this site,
which is in the top ~3 m of overall stratigraphy. Mainstem floods younger than ~1 ka
overtopped the terrace here after Puebloan occupation. Eolian facies indicate that wind-
driven deposition has alternated with fluvial deposition, and there is no evidence of eolian
deposition in strata underneath archaeological features.
Geochronology
Six depositional units at this site were dated with OSL and one with radiocarbon
dating to constrain the stratigraphy, and there are radiocarbon ages from two
archaeological features (Table 4). The radiocarbon date from the bottom of the
stratigraphy excavated along the terrace front is 3210-2950 cal yr BP, which is
stratigraphically consistent with four younger OSL ages of 1.71 ka to ~1.5 ka, all in
stratigraphic order within error. These results also agree with the 1520 to 1330 and 1280
to 970 cal yr BP radiocarbon ages from hearths within the stratigraphy (Table 4). The
~1-1.5 ka age difference between the lowest OSL age and the radiocarbon date suggests a
depositional hiatus or slight erosional unconformity between ~7 and ~8 m depth (Figure
25). Still, all of the deposits dated at this location are ~3 ka or younger, with at least 8 m
of deposition in less than 1.5 ka. This indicates more rapid deposition preserved at this
location than in the stratigraphy observed at the geomorphic study gully.

73The OSL sample from a fluvial cross-bedded sand unit in SU 4 has a
preliminary age of ~1.1 ka, and this unit is ~2 m above the 1520 to 1330 and 1280 to 970
cal yr BP radiocarbon ages from SU 6, based on RTK-GPS survey results. The
stratigraphically highest sample from this location, collected from SU 8, has OSL results
that indicate the deposit is too young for OSL dating or has been bioturbated and
contaminated with modern, bleached sand. Modern roots were seen in the depositional
unit that this sample was collected from, and the sample location was only 0.2 m below
the modern surface, so both a modern age and bioturbation have likely affected this
sample.
Summary of Tanner Bar Stratigraphy
Although the three study sites at Tanner Bar contain distinct stratigraphy and
ages, they can be compared to create a better understanding of the overall processes at
this location (Figure 27). A few patterns emerge from this schematic. First, every
location includes at least two unconformities. Second, the stratigraphy of the geomorphic
study gully and the C:13:327 site contain thick Dox colluvial wedges, but these are not
present at C:13:323. Third, stratigraphy of different ages is present at the same elevation
in this location. The oldest ages are at the C:13:323 archaeological site and the
geomorphic study gully, while the lowest sampled stratigraphy at the C:13:327 site is ~8
ka younger than at the other sites. The stratigraphy at this location is progressively
younger and inset in the downstream direction.

74
2310-2040 cal yr BP
3210-2950 cal yr BP
L818.0L
L
14C
SU 7
USU-438: ~11.1 ka
elev
atio
n (m
)
812.0
III820.0
L
USU-434: ~8.4 ka
e
I
II
820.0
816.0
810.0
L USU-436: ~5.4 kaIII 818.0
812.0
822.0L
C
1520-1330 cal yr BPC
L
V
IV
SU 4, USU-439, ~1.1 ka
USU-370: ~1.6 ka
e
USU-512: 11.64 +/- 0.62 ka
ee
USU-437: ~6.8 ka
SU 5
Site C:13:323 geomorphic study gully
upstream (N)
downstream (S)
Site C:13:327
IV
I
Figure 27. Upstream-to-downstream transect schematic of Tanner Bar Holocene alluvium along the ~400 m-long along the terrace riser. Site C:13:323 schematic is wider because a greater lateral extent of stratigraphy was exposed there than at the other two sites. Absolute elevations are based on Topcon RTK surveyed elevations and are likely to have an uncertainty of ~0.5 m. Roman numerals indicate interpreted depositional packages addressed in the Discussions section of the text.

75
DISCUSSION
Revised Eastern Grand Canyon Holocene Stratigraphy
Ninemile Draw and Tanner Bar terraces have distinct preserved chronostratigraphies, but
together they help refine the record of Holocene stratigraphy in Grand Canyon. A plot of
geochronology results (Figure 28) helps better analyze trends. The first apparent trend in the
geochronology results is that more age control exists from the late Holocene than the middle and
early Holocene. This is likely because of the concentration of radiocarbon ages from late
Holocene archaeological features and because later Holocene deposits are better-preserved.
The plot of geochronology results also elucidates a pattern of six possible discrete
depositional packages separated by erosional episodes ranging from ~1-2 ky-long in the early
Holocene to ~0.1-0.2 ky-long in the late Holocene (Figure 28). The breaks in deposition
between the youngest four packages are consistent with stratigraphic relations observed in the
field. The oldest four packages consist of interbedded local slopewash and gully deposits and
mainstem flood deposits. They include tributary material up to 10 m above the modern channel.
They also include rhizoliths and root bioturbation throughout, suggesting incremental
aggradation (Lucchitta and Leopold, 1999). The youngest two packages consist of solely
mainstem sandy and silty flood deposits with no discernible depositional hiatuses.
The early Holocene deposits, designated packages I and II, include both MCG and MSm
facies up to 9 m above the present river at Tanner Bar (Figure 29). These packages
unconformably underlie younger sediments at the upstream cultural site and the geomorphic
study gully between the two Tanner cultural sites. Because of the distinct MCG facies,
downstream-oriented gravel foresets, and generally downstream paleocurrent

76
Age
(ka)
1
10
depositional episode
erosional episodesample error
Earliest Holocene alluivum~12-11 ka
Early Holocene alluvium~ 8 ka
Middle Holocene alluvium~7-4 ka
Late Holocene alluvium~3-1.5 ka
Puebloan flood deposits.~1.5-1 ka
Protohistoric flood deposits~0.8-0.3 ka
I
II
III
IV
V
VI
radiocarbon ageOSL ageTanner Bar age
Ninemile Draw age
0.3
Figure 28. Graph of preliminary geochronology results from Ninemile Draw (in blue) combined with results from Tanner Bar (in red). Error bars are only shown for radiocarbon samples and OSL samples with >20 aliquots (Tables 3 and 4). Preliminary ages are shown without error bars. Disproportionate representation of younger deposits and ages is due to preservation and sampling bias.
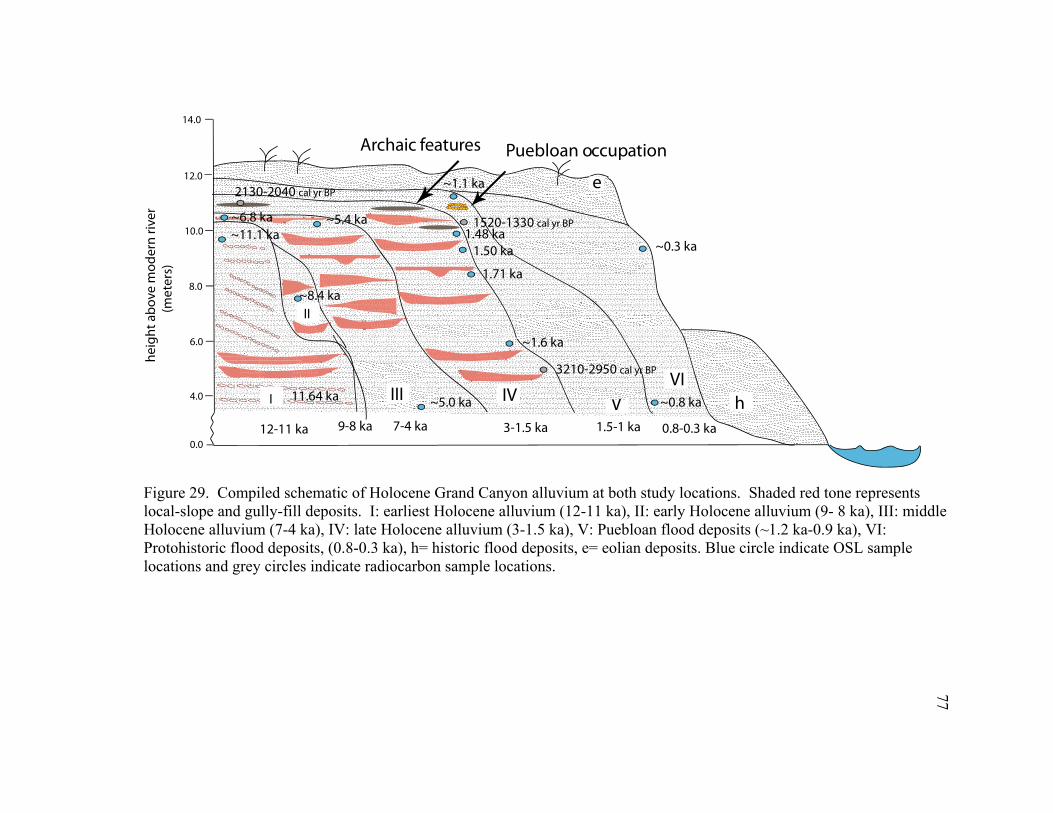
77
heig
ht a
bove
mod
ern
river
(met
ers)
0.0
12.0 e
II
IV V
Puebloan occupationArchaic features
h4.0
6.0
8.0
10.0
14.0
I IIIVI
~11.1 ka
11.64 ka
12-11 ka 7-4 ka9-8 ka 3-1.5 ka 1.5-1 ka 0.8-0.3 ka
~6.8 ka
~8.4 ka
~5.0 ka
~5.4 ka
~1.1 ka
~0.3 ka
~0.8 ka
1.48 ka1.50 ka
1.71 ka
~1.6 ka
1520-1330 cal yr BP
2130-2040 cal yr BP
3210-2950 cal yr BP
Figure 29. Compiled schematic of Holocene Grand Canyon alluvium at both study locations. Shaded red tone represents local-slope and gully-fill deposits. I: earliest Holocene alluvium (12-11 ka), II: early Holocene alluvium (9- 8 ka), III: middle Holocene alluvium (7-4 ka), IV: late Holocene alluvium (3-1.5 ka), V: Puebloan flood deposits (~1.2 ka-0.9 ka), VI: Protohistoric flood deposits, (0.8-0.3 ka), h= historic flood deposits, e= eolian deposits. Blue circle indicate OSL sample locations and grey circles indicate radiocarbon sample locations.

78
directions, this depositional package is interpreted to represent a higher river grade at
~11 ka than present.
The early Holocene deposits, designated packages I and II, include both MCG and
MSm facies up to 9 m above the present river at Tanner Bar. These packages
unconformably underlie younger sediments at the upstream cultural site and the
geomorphic study gully between the two Tanner cultural sites. Because of the distinct
MCG facies, downstream-oriented gravel foresets, and generally downstream
paleocurrents directions, this depositional package is interpreted to represent a higher
river grade at ~11 ka than present.
The overlying stratigraphy (package II, ~8-9 ka) is present at the Tanner Bar
geomorphic study gully, where interfingering mainstem and local slopewash facies sit
unconformably on top of package I. The unconformities are inferred here based on the
OSL ages, but because there are no buried soils or distinct erosional contacts, the exact
locations are not known.
Unconformably overlying package II at the geomorphic study gully exposure is
an additional mid-Holocene package of interfingering mainstem and tributary slopewash
material (package III, ~5.5-3.5 ka). The morphology of this package is distinct from the
underlying units here because the local gravelly slopewash beds are thinner, indicating
either more frequent mainstem floods, reduced preservation of local material, or reduced
local sediment yield. This inferred package is also present as a <0.5 m thick mainstem
flood sequence directly overlying package I at the downstream Tanner Bar site. In
addition, the deepest stratigraphic deposits observed at Ninemile Draw represent package
III with an initial OSL age of ~5 ka. At Ninemile Draw the deposit does not include
79
interfingering mainstem and local deposition and is only ~3-4 m above the modern
river. Although only 1 m of the package is exposed and an unconformity separates it
from above strata, it was most likely thicker before erosion.
Late Holocene package IV (~3.5-1.5 ka) is well-preserved at both Tanner Bar and
Ninemile Draw. It is constrained by more age control than previous packages because it
hosts Late Archaic cultural features were found. At Ninemile Draw, this package
unconformably overlies package III as indicated by both geochronology results and a
visible unconformity. In addition, the stratigraphy consists of alternating mainstem flood
deposits and coarser, redder tributary and local slopewash deposits in gully-fill
sequences, whereas package III is composed solely of mainstem sand, but may be due to
lack of preservation of package III. Package IV also displays this characteristic striped
morphology at Tanner Bar C:13:327, where it includes units of facies LGS up to 1 m
thick. Packages II and III also display a striped morphology, but their local facies (LGS)
exist in thicker units and are composed of sandy gravel, instead of the gravelly sand
frequent in package IV.
Although the basic interpretation of package IV is that is represents alternating
mainstem and local deposition, multiple hypotheses may explain this alternating,
incremental sedimentation. First, increased local sediment yield may be caused by
increased local runoff, perhaps in the form of strong summer monsoons. Also, lack of
vegetation due to drought may have increased local sediment yield from slopes. A third
possibility is decreased mainstem flood discharges due to changes in headwater
hydrology, leading to more incremental aggradation of thin deposits and lack of removal
of local sediment by the mainstem river.

80
Inset into the late Holocene alluvium at Ninemile Draw is a package of
mainstem sand and silt deposited during Puebloan occupation, package V (~1.5-1 ka).
The ~1.5 ka age at Ninemile Draw is preliminary, and subsequent age control may reveal
that it is either younger or partially bleached. The depositional package at Ninemile
Draw consists of couplets of well-sorted tan and redder sand, although both are
mainstem-deposited. The slightly redder sand indicates pulses of more locally-sourced
sediment and helps distinguish this package from the overlying package. Whereas
package V is inset into package IV at Ninemile Draw, at Tanner Bar it sits
unconformably atop package IV. There, a mainstem fluvial package overlies package IV
and indicates that large floods overtopped the terrace, approximately 13 m above the
modern river level. The OSL age may in fact be younger than the initial age of ~1.1 ka
from Tanner Bar C:13:327 SU 4 because this package also buries Pueblo II artifacts. The
location of this package at greater than 10 m above the modern river level may be
significant and is discussed below.
A mainstem flood package at Ninemile Draw represents the youngest deposits
(package VI, ~0.8-0.3 ka). Because these deposits are inset into the Puebloan flood
deposits, they are interpreted as a distinct depositional episode. No deposits of this age
were identified at Tanner Bar, where the youngest-dated and highest flood deposits have
a modern OSL age. This package VI, the Protohistoric flood deposits, consists of thick
mainstem flood packages ranging from ~0.8 to ~0.3 ka. At both locations sand in this
package is purely tan mainstem sand, unlike the couplets of tan and redder sand in
package VI.

81
Based on the observed stratigraphic relations, morphology, and chronology
described above, a refined model of the Grand Canyon Holocene alluvial chronology was
produced (Figure 29). This conceptual model shows the deposition of four aggradational
alluvial packages, I-IV, and oscillating grade. Packages V and VI consist of mainstem
flood deposits and are not necessarily associated with changes in river grade, although
there may have been downcutting since the deposition of package V. Therefore, using
these deposits to reconstruct paleofloods is a valid practice, whereas reconstructing
paleoflood discharges from units in the other depositional packages should be approached
with caution unless the river channel geometry at the time of deposition is known.
At Tanner Bar, Package V is present near the top of the terrace, as indicated by
the preliminary OSL age of ~1.1 ka from C:13:327. This sample, USU-439, was taken
from less than 1 m below the terrace top in SU 4, or 12 m above river level at ~700 m3/s.
In order to determine a very rough estimate of the flood magnitude, I developed a stage-
discharge relation based on the stages of floods of historic discharges using virtual
flowlines from 1-dimensional modeling by Magirl et al. (2008). Based on modern
hydraulic geometry, the rating curve suggests that a discharge of ~1,800,000 ft3/s, or
~51,000 is necessary to deposit a flood at the elevation of the OSL sample USU-439.
Enzel et al. (1993) evaluated gage records and paleoflood studies from throughout
the Colorado River Basin to determine an upper bound of flood magnitude, which is
~480,000 to 501,000 ft3/s, or 13,600 to 14,200 m3/s. They suggest it is unlikely that a
flood has occurred in prehistoric time exceeding this upper bound. If their analysis is
correct, then my estimate of the hypothetical flood required to deposits the upper
sediment at the Tanner Bar C:13:327 site, based on the lower stage calculations of Magirl
82
et al., is over three times larger than possible in this system. This deviation is evidence
for channel incision, at least locally, since Puebloan time.
Correlations to Previous Work and Paleoclimate The preferred but tentative interpretation of these results is of six depositional
episodes, alternating with five possible erosional episodes. Broadly, this timing of
deposition and incision can be compared to other records from the Colorado River and
greater Colorado Plateau. Portions of this record correspond to Hack’s Colorado Plateau
alluvial record. The oldest of Hack’s depositions, the Jeddito Formation, is older than 6
ka, and there are deposits of this age in Grand Canyon (Hack, 1942). The Tsegi was
deposited between ~5 ka and ~0.8 ka (Hack, 1942), a time span that encompasses both
packages III and IV. The period of incision following the Tsegi could be the same as the
erosional period between the package IV and package V, although poorly constrained
because of limitations in geochronology methods. Hack’s Naha formation, deposited
since 0.7 ka, correlates to the Protohistoric flood deposits observed at Ninemile Draw.
The youngest three packages suggested by this study correlate to the depositional
packages originally identified by Hereford et al. (1996). The previously identified sa
terrace is equivalent to package IV, or late Holocene alluvium (Figure 29). This is the
last aggradational package preserved and is present both at Ninemile Draw and Tanner
Bar, although the ages differ slightly between locations. The strata preserved at Tanner
Bar are ~ 0.5 ka younger than Ninemile Draw, most likely due to preservation.
Considering the resolution of OSL geochronology, package V correlates to Hereford’s ap
terrace and package VI correlates to the umt terrace. The ages of these packages are

83
better-constrained with radiocarbon dating from other archaeological sites, but because
archaeological features may be placed after sedimentary deposition, they often only
provide minimum ages. Both geochronology and stratigraphic relations support this
correlation, and this study complements Hereford’s by establishing the beginning of
deposition of the sa at ~3 ka, an age that was previously poorly-constrained. Three
packages older than Hereford’s terraces are inferred from this study, so these results build
on his record by extending it to the early Holocene.
Comparing these results to Ely’s (1997) cumulative paleoflood record of the
Southwest, including data from eastern Grand Canyon, shows no correlation in the mid-
Holocene and a weak correlation in the late Holocene (Figure 30). Her results show a
cluster of floods from 5-3.6 ka (Ely, 1997), a time with little deposition in Grand Canyon,
according to this study. Ely’s study also suggests fewer floods from 3.6 to 2.2 ka, which
partially overlaps with the deposition of package IV. Reduced paleoflood events from
~1.8 and ~1.6 ka correlate with our results, while numerous floods at ~1 ka coincide with
the end of the deposition of package V.
The latest paleoflood pattern was a drop in flood frequency from 0.8 to 0.6 ka
followed by an increase in deposition from ~0.6 ka to present (Ely, 1997), which coincide
with deposition of package VI and Hereford’s umt. Thus, the age of package IV
deposition does not correlate well with frequent paleofloods, whereas the deposition of
packages V and VI does. This is significant because these two packages are composed
solely of mainstem flood deposits, suggesting that there may be preferential preservation
of the largest and most recent floods.

84
Age
(ka)
2.6
2.2
1.8
1.4
1.2
1.6
2.4
2.8
1.0
0.8
0.6
0.4
0.2
Hereford et al, 1996 This studyEly, 1997
2.0
IV
V
VI
sa
ap
umt
6.0
5.0
4.6
4.2
3.8
3.6
4.0
4.8
5.2
3.4
3.2
3.0
4.4
5.45.6
5.8
III
no d
ata
frequent paleofloods
frequent paleofloods
frequent paleofloods
Climate
LIA
MWP
Figure 30. Graph of middle-late Holocene depositional episodes (grey boxes) in Grand Canyon compared with those reported in previous studies from this region. LIA= Little Ice Age, MWP= Medieval Warm Period

85
These results can also be correlated to the most pertinent local and regional
climate proxies (Figure 31). First, results are compared to the Greenland Ice Sheet
Project δ18O values, which are a proxy for Northern Hemisphere air temperature (Stuiver
et al., 2005). Higher δ18O values indicate warmer temperatures, and this record shows
low δ18O values at ~12 ka, which is evidence for a cold Younger Dryas event followed by
temperatures increasing to near-modern levels. The early Holocene Grand Canyon
depositional package (I) may correlation to changes in climate at the end of the Younger
Dryas.
Early Holocene climate proxies within Grand Canyon come from packrat middens
and bat guano. A curve of δ13C values was developed based on Grand Canyon packrat
midden data (Cole and Arundel, 2005, Figure 31). Deposition of package I coincides
with a general increase in δ13C from packrat middens, which indicates higher
temperatures and summer-dominated precipitation and corresponds to a change in
vegetation (Wurster et al., 2008). The δ13C and δD values in a bat guano cores also show
a correlation to these results. Higher δD values indicate increased precipitation and
temperature. Both proxies indicate a climatic shift around ~11.5 ka at the end of the
Younger Dryas and during the deposition of package I. Both bat guano curves indicate
an abrupt cooling and decreased precipitation at 8.2 ka, an event that is interpreted to be a
change in atmospheric circulation, possibly a period of maximum insolation and strong
summer monsoons (Wurster et al., 2008). This event corresponds to the end of deposition
of package II, although the exact relation between this event and earlier deposition is
unclear.

86
year (ka)14 12 10 8
a) Greenland Ice Sheet Project
b) Packrat midden δ13CGrand Canyon
d) Bat guano δ13CGrand Canyon
c) Bat guano δDGrand Canyon
-18
-26-26
-22
-27
-26
-25
-24
δ13C
(%VP
DB)
δ13C
(%VP
DB)
δ18O
(%VP
DB)
-20
-24 -140
-180
-160
δD (%
VSM
OW
)
- 40
- 34
- 38
- 36
I II III
Younger Dryas
6
vege
tatio
n sh
ift
max
imum
mon
soon
al p
pt
Figure 31. Graph of early Holocene paleoclimate proxy curves, including global and regional proxies. A: δ18O values, modified from Stuiver et al., 1995. B: Packrat midden δ13C values (modified from Cole and Arundel, 2005). C: Bat guano δD values (modified from Wurster et al., 2008). D: Bat guano δD values (modified from Wurster at al., 2008). Shaded grey bars correspond to inferred Grand Canyon depositional packages I, II, and III. Vegetation shift and maximum monsoonal precipitation time frames are suggested by Wurster et al., 2008.
87
In the mid-Holocene, the Alithermal was a climatic episode warmer and drier
than present, as observed in data from microfossils from lake sediment cores and δ18O
values from stalagmites (Weng and Jackson, 1999; Asmerom et al., 2007). This warm,
dry episode seems to correspond to the deposition of package III (~7-4 ka) in the middle
Holocene. This package consists of both terrace-top mainstem flood deposition and local
slope facies, suggesting incremental aggradation on the Colorado River while drought
was occurring elsewhere in the Colorado Plateau. Incremental aggradation may be due to
low to moderate flood discharges during drought. After the Altithermal, an additional
aggradational episode is preserved as the deposition of package IV, which does not
correlate to any large climate anomaly, although Ely (1997) suggests that it is a period of
stronger ENSO activity.
These depositional packages can also be compared to late Holocene climate
proxies in Grand Canyon. Tree rings records, was used to reconstruct both drought in the
Upper Colorado River Basin and flow at Lees Ferry (Cook et al., 2004; Meko et al.,
2007; Figure 32). The Medieval Warm Period and the Little Ice Age are both
discernible from these curves, and there is no apparent correspondence between
depositional packages and either climatic episode. Both overlap episodes of erosion and
deposition. If the final results from the preliminary ~0.8 ka age (USU-283, Ninemile
Draw) indicate that it is younger, then package VI will correspond better to the Little Ice
Age and Hereford’s umt terrace.
In addition, no pattern immediately emerges when comparing these packages to
recent paleoflood packages identified in the Southwest (Figure 32). Paleoflood frequency

88
wetterdrier
% d
roug
ht a
rea
40
VI: ProtohistoricFloods
V: PuebloanFloods
60
20
1.2 1 0.8 0.6 0.4 0.2 0
0# of
pal
eoflo
ods
flow
(% o
f mea
n)
Little Ice Age
100
85
115
Medieval WarmPeriod
15
30
years (ka)
Figure 32. Graph of Grand Canyon paleoclimate proxies from the Grand Canyon region for the past 1.2 ka. Top curve is modified from tree ring studies (Cook et al. 2007), and is a plot of % drought area over time. Middle curve is a 25-yr running average % of 1906-2000 mean flow (Meko et al., 2007). Bottom curve is total paleoflood counts modified from Ely et al., 1993, with floods grouped into 0.2 ka intervals. Medieval Warm Period and Little Ice Age time constraints are local values from Cook et al. (2007).

89
increased towards the later part of the past 1.2 ka (Ely, 1997), but there was no fluvial
depositional package younger than ~0.3 ka identified in this study. These results are
weighted towards the present because of increased preservation, but the paleoflood study
indicates a period of increased deposition between the age constraints on packages V and
VI and after package VI. If the final OSL age on the oldest portion of package VI is
younger than the initial age of ~0.8 ka, it will correspond to increased paleoflood
deposition.
Overall, Holocene paleoclimate records do not necessarily correspond to the
Holocene alluvial record in Grand Canyon. Such correlations will likely become clearer
with more continued work. One possible explanation for the lack of correlation is that
the resolution of these geochronology results is too poor to properly constrain to flood
packages on timescales as short as climate variability. An alternative explanation is that
the Colorado River has such a large drainage area and integrates climate signals from
numerous locations throughout the Colorado Plateau, it is likely that it does not respond
to small oscillations in climate like the Little Ice Age and the Medieval Warm Period as a
smaller tributary drainage would, as documented on the Colorado Plateau.
90
CONCLUSIONS
1) Eleven distinct sedimentary facies at Ninemile Draw and Tanner Bar can be used
to help determine the depositional environment of preserved terrace sediment, including
those surrounding archaeological sites. Most facies are preserved at both study sites.
Five facies are interpreted as mainstem river deposits and are evidence for Colorado
River flood events. Four facies are interpreted as local-slope deposits along the channel
margin. One facies is interpreted to be influenced by anthropogenic activity. Where
mainstem or local deposits dominate, it may indicate relatively active sedimentation or
preferred preservation of that system. One facies is interpreted as eolian deposit and is
only common in late Holocene strata.
2) This study has produced a refined understanding of the Holocene
chronostratigraphy in Grand Canyon. Stratigraphic observations at Ninemile Draw and
Tanner Bar indicate Holocene alluvium includes sediment older than previously known,
as old as 12 ka. Observed and implied unconformities in the stratigraphy suggest these
may encompass six distinct packages, all at overlapping elevations or stages. These
packages are potentially correlatable between reaches along the corridor, but neither of
the two study sites includes all six.
3) Sedimentary patterns and trends within the stratigraphic packages provide
circumstantial evidence for changing river grade over the Holocene. For example, facies
reflecting local-slope depositional systems at both low and high landscape positions
suggest episodic floodplain accretion and true aggradation, not just paleoflooding. Also,
~11 ka mainstem channel gravels at 8 m above the present-day shoreline indicate higher
91
local grade in the early Holocene at Tanner Bar. The suggestions of changing grade
are limited to the first four inferred depositional packages. The younger two flood
packages, V and VI, have solely mainstem sandy and silty facies of flood deposits, and
they may reflect a static river grade over the past ~1 ky.
4) In terms of correlations to previous work, the younger mainstem flood packages
do not correlate well with the overall Colorado Plateau late Holocene paleoflood record
of Ely (1992; Ely et al., 1993). Nevertheless, packages V and VI correspond to
paleoflood episodes identified specifically in Grand Canyon (Ely, 1992; O’Connor et al.,
1994), as well as to Hereford’s previously identified ap and umt terraces.
5) There is a loose correlation between the inferred older depositional packages, I
and III and early to mid-Holocene climate. It appears that deposition may coincide with
drier episodes, including the post-Younger Dryas and the Altithermal. The younger
inferred alluvial packages do not correlate well with late Holocene climate. For example,
deposition occurred during both the Medieval Warm Period and the Little Ice Age.
6) These initial results from two sites lend some support to both models of
deposition and terrace formation and disprove neither. Inset deposits dominate much of
the Holocene record, with evidence for an aggrading river on millennial timescales at
least twice. This supports Hereford’s model of inset terrace deposits and changing river
grade. On the other hand, purely mainstem paleoflood deposits dominate the past ~1 ky
of the record. This suggests that caution should be taken before using present-day stage-
discharge relations to determine paleoflood magnitude before ~1 ky, because channel
geometry and grade have likely varied over Holocene timescales.
92
REFERENCES
Aitken, M.J., 1998, An introduction to optical dating: Oxford, Oxford University Press. Anders, M.D., Pederson, J.L., Rittenour, T.M., Sharp, W.D., Gosse, J.C., Karlstrom,
K.E., Crossey, L.C., Finkel, R.C., Goble, R.J., Stockli, L., and Yang, G., 2005, Pleistocene geomorphology and geochronology of eastern Grand Canyon: Linkages of landscape components during climate changes: Quaternary Science Reviews, v. 24, p. 2428-2448.
Anderson, K.C., 2006, Geoarchaeological investigations of 53 sites between Glen
Canyon Dam and Paria Riffle: Navajo Nation Archaeology Department Report No. 05-229. Ms. on file, United States Bureau of Reclamation, Upper Colorado Region, Salt Lake City, Utah.
Anderson, R.S., Betancourt, J.L. Mead, J.I., Hevly, R.H., and Adam, D.P., 2000, Middle-
and late-Wisconsin paleobotanic and paleoclimatic records from the southern Colorado Plateau, USA: Paleogeography, Palaeoclimatology, Palaeoecology, v. 115, p. 31-57.
Andrews, E.D., 1991, Sediment transport in the Colorado River Basin, in G.R. Marzolk,
ed., Colorado River ecology and dam management: Proceedings of a symposium: Santa Fe, New Mexico National Academy Press, Washington, D.C., p. 54-75.
Asmerom, Y.A., Polyak, V., Burns, S., and Rassmussen, J., 2007, Solar forcing of
Holocene climate: New insights from a speleothem record, southwestern United States: Geology, v. 35, no. 1, p. 1-4.
Boison, P.J., and Patton, P.C., 1985, Sediment storage and terrace formation in Coyote
Gulch basin, south-central Utah: Geology, v. 13, no. 1, p. 31-34. Blum, M.D., 2008, Large river systems and climate change, in Gupta, A., ed., Large
rivers: Geomorphology and management: New York, John Wiley and Sons, p. 627-659.
Burke, K.L., and Hereford, R., 1998, Map showing surficial geology and geomorphology
of the Ninemile Draw area, Glen Canyon, Arizona. Open-file Report, U.S. Geological Survey, Washington D.C. 98-xxx.
Cole, K.L., 1990, Reconstruction of past desert vegetation along the Colorado River
using packrat middens: Palaeogeography, Palaeoclimatology, and Palaeoecology, v. 76, p. 349-366.

93
Cole, K.L., and Arundel, S.T., 2005, Carbon isotopes from fossil packrat pellets and elevational movements of Utah agave plants reveal the Younger Dryas cold period in the Grand Canyon, AZ: Geology, v. 33, p. 713-716.
Cooke, R.U., and Reeves, R.W., 1976, Arroyos and environmental change: Oxford,
Clarendon Press, 213 p. Cook, E.R., Woodhouse, C.A., Eakin, C.M., Meko, D.M., and Stahle, D.W., 2004, Long-
term aridity changes in the western United States: Science v. 306, p. 1015-1018. Cragun, W.S., 2007, Quaternary evolution of the Colorado River at Lees Ferry, Arizona
[MS thesis]: Logan, Utah State University, 192 p. Damp, J., Pederson, J.L, and O’Brien, G.R., 2007, Geoarchaeology investigations and an
archaeological treatment plan for 151 sites in the Grand Canyon, AZ: United States Bureau of Reclamation Report, 501 p.
Damp, J., Pederson, J.L., and O’Brien, G.R., 2009, Geoarchaeological investigations in
Grand Canyon, 2008: Annual Report to the United States Bureau of Reclamation, 236 p.
Davis, S.W., Davis, M.E., Lucchitta, I., Caffee, M., and Finkel, R, 1995, Soil survey of
the Palisades-Unkar area, eastern Grand Canyon, Arizona. Final report submitted to the Glen Canyon Environmental Studies Program. Flagstaff: U.S. Bureau of Reclamation, 39 p.
Davis, S.W., Davis, M.E., Lucchitta, I., Finkel, R., and Caffee, M., 2000, Early
agriculture in the eastern Grand Canyon of Arizona, USA: Geoarchaeology, v. 15, no. 8, p. 783-798.
Draut, A.E., and Rubin, D.M., 2007, Measurements of wind, aeolian sand transport, and
precipitation in the Colorado River corridor, Grand Canyon, Arizona: Final report on research activities, 2003-2006: United States Geological Survey Open-File Report 2007-1001.
Draut, A.E., and Rubin, D.M., 2008, The role of eolian sediment in the preservation of
archaeologic sites along the Colorado River corridor in Grand Canyon National Park, Arizona: United States Geological Survey Professional Paper 1756.
Ely, L.L., 1992, Large floods in the southwestern United States in relation to late-
Holocene climatic variations [PhD dissertation]: Tucson, University of Arizona, 326 p.
Ely, L.L., 1997, Response of extreme floods in the southwestern United States to climatic
variations in the late Holocene: Geomorphology, v. 19, nos. 3-4, p. 175-201.

94
Ely, L.L., Enzel, Y., Baker, V.R., and Cayan, D.R., 1993, A 5000-year record of extreme floods and climate change in the southwestern United States: Science, v. 15, no. 5132, p. 410-412.
Enzel, Y., Ely, L.L., House, K.P., and Baker, V.R., 1993, Paleoflood evidence for a
natural upper bound to flood magnitudes in the Colorado River Basin: Water Resources Research, v. 29, no. 7, p. 2287-2297.
Fairley, H.C., 2003, Changing river: Time, culture, and the transformation of landscape
in the Grand Canyon. A regional research design for the study of cultural resources along the Colorado River in lower Glen Canyon and Grand Canyon National Park, Arizona: Statistical Research Inc., Technical Series 79. Tucson, Arizona. 180 p.
Fall, P.L., 1997, Timberline fluctuations and late Quaternary paleoclimates in the
Southern Rocky Mountains, CO: Geological Society of America Bulletin, v. 109, p. 1306-1320.
Graf, W.L., 1987, Late Holocene sediment storage in canyons of the Colorado Plateau:
GSA Bulletin, v. 99, p. 261-271. Grams, P.E., Schmidt, J.C., and Topping., D.J., 2007, The rate and pattern of bed incision
and bank adjustment on the Colorado River in Glen Canyon downstream from Glen Canyon Dam, 1956-2000: GSA Bulletin, v. 119, nos. 5-6, p. 556-575.
Griffiths, P.G., Webb, R.H., and Melis, T.S., 2004, Frequency and initiation of debris
flows in Grand Canyon, Arizona: Journal of Geophysical Research, v. 109, doi: 10.1029/2003JF000077.
Hack, J.T., 1942, Erosion and sedimentation in the Jeddito Valley and other valleys of the
western Navajo Country: Papers of the Peabody Museum of American Archaeology and Ethnology, v. 35, p. 45-69.
Hanks, T.C., and Webb, R.H., 2006, Effects of tributary debris on the longitudinal profile
of the Colorado River in Grand Canyon: Journal of Geophysical Research, v. 111, doi: 10.1029/2004JF000257.
Hereford, R., 2002, Valley-fill alluviation during the Little Ice Age (ca. A.D. 1400-1880),
Paria River basin and southern Colorado Plateau, United States: GSA Bulletin, v. 114, no. 12, p. 1550-1563.
Hereford, R., 11 February 2008, “Tanner Canyon Area.” Email to J. Pederson.

95
Hereford, R., Thompson, K.S., Burke, K.J., and Fairley, H.C., 1996, Tributary debris fans and the late Holocene alluvial chronology of the Colorado River, eastern Grand Canyon, Arizona: GSA Bulletin, v. 108, no. 1, p. 3-19.
Howard, A., and Dolan, R., 1981, Geomorphology of the Colorado River in the Grand
Canyon: Journal of Geology, v. 89, p. 259-298. Hunter, R.E., 1977, Basic types of stratification in small eolian dunes: Sedimentology, v.
24, p. 361-287. Leap, L.M., and Neal, L.A., 1992, Testing and charcoal sampling at C:2:32, river mile -
9.8 LB and C:2:100, river mile -0.4 LB Glen Canyon National Recreation Area. Ms. On file, Glen Canyon National Recreation Area, Resource Management Division, Page, Arizona.
Leopold, L.B., 1969, The rapids and pools- Grand Canyon: United States Geological
Survey Professional Paper 31, pt. 2, p. 335-354. Lucchitta, I., Dehler, C.M., Davis, M.E., Davis, S.W., and Turrin, B., 1995, Quaternary
geologic map of the Palisades Creek-Comanche Area, eastern Grand Canyon, Arizona, Open File Report 95-832. Flagstaff, AZ: US Geological Survey, Western Regional Office. 39 p.
Lucchitta, I., and Leopold, L.B., 1999, Floods and sandbars in the Grand Canyon: GSA
Today, v. 9, p. 1-7. Mackley, R.D., 2005, Relating the bedrock strength to hydraulic driving forces along the
large-scale profile of the Colorado River in Glen and Grand Canyons [MS thesis]: Logan, Utah State University, 173 p.
Magirl, C.S., Breedlove, M.J., Webb, R.H., and Griffiths, P.G., 2008, Modeling water-
surface elevations and virtual shorelines from the Colorado River in Grand Canyon, Arizona. United States Geological Survey Scientific Investigation Report 2008-5075. 32 p.
Mann, D.H., and Metzler, D.J., 2007, Millennial-scale dynamics of valley fills over the
past 12,000 14C yr in northeastern New Mexico, USA: GSA Bulletin v. 119, nos. 11-12, 1433-1448.
Meko, D., Woodhouse, C.A., Baisan, C.A., Knight, T., Lukas, J.J., Hughes, M.K., and
Salzer, M.W., 2007, Medieval drought in the upper Colorado River Basin: Geophysical Research Letters, v. 34. 5 p.

96
Melis, T.S., 1997, Geomorphology of debris flows and alluvial fans in Grand Canyon National Park and their influence on the Colorado River below Glen Canyon dam, Arizona, [PhD dissertation] Tucson, University of Arizona.
Melis, T.S., Webb, R.H., Griffiths, P.G, and Wise, T.J., 1994, Magnitude and frequency
data for historic debris flows in Grand Canyon National Park and vicinity, Arizona: United States Geological Survey Water Resources Investigations Report, 9404214, 285 p.
Munroe, J.S., 2003, Holocene timberline and palaeoclimate of the northern Uinta
Mountains, northeastern Utah, USA: The Holocene, v. 13, no. 2, p. 175-185. Murray, A.S. and Wintle, A.G., 2000, Luminescence dating of quartz using an improved
single-aliquot regenerative-dose protocol: Radiation Measurements, v. 32, p. 57-73.
O’Connor, J.E., Ely, L.L., Wohl, E.E., Stevens, L.E., Melis, T.S., Kale, V.S., and Baker,
V.R., 1994, A 4500‐year long record of large floods on the Colorado River in the Grand Canyon, Arizona: Journal of Geology, v. 102, p. 1–9.
Patton, P.C., and Boison, P.J., 1986, Processes and rates of formation of Holocene
alluvial terraces in Harris Wash, Escalante River basin, south-central Utah: GSA Bulletin, v. 97, no. 3, p. 369-378.
Pederson, J.L., Anders, M.D., Rittenour, T.M., Sharp, W.D., Gosse, J.C., and Karlstrom,
K.E., 2006, Using fill terraces to understand incision rates and evolution of the Colorado River in eastern Grand Canyon, Arizona: Journal of Geophysical Research (Earth Surface), v. 111, doi:10.10/2004JP000201.
Pederson, J.L., Schmidt, J.C., and Anders, M.D., 2003, Pleistocene and Holocene
geomorphology of Marble and Grand canyons, canyon cutting to adaptive management: Field trip guidebooks for the XVIth INQUA Congress, Easterbrook, D.J., ed., Boulder, Geological Society of America, p. 407-438.
Polyak, V.J., and Asmerom, Y., 2001, Late Holocene climate and cultural changes in the southwestern United States: Science, v. 294, p. 148-150.
Prescott, J.R., and Hutton, J.T., 1994, Cosmic ray contributions to dose rates for luminescence and ESR dating: large depths and long-term time variations: Radiation Measurements, v. 23, p. 497-500.
Refsnider, K.A., and Brugger, K.A., 2007, Rock glaciers in central Colorado, U.S.A., as indicators of Holocene climate change: Arctic, Antarctic, and Alpine Research, v. 39, no. 1, p. 127-136.
97
Rubin, D.M., Nelson, J.M., and Topping, D.J., 1998, Relation of inversely-graded deposits to suspended sediment grain-size evolution during the 1996 flood experiment in Grand Canyon: Geology, v. 26, p. 99-102.
Schmidt, J.C., and Graf, J.B., 1990, Aggradation and degradation of alluvial sand deposits, 1965 to 1986, Colorado River, Grand Canyon National Park, Arizona: Washington, D.C., U.S Geological Survey, Professional Paper, no. 1493.
Schumm, S.A., and Hadley, R.F., 1957, Arroyos and the semiarid cycle of erosion [Wyoming and New Mexico]: American Journal of Science, v. 255, no. 3, p. 161-174.
Stuiver, M., Grootes, P.M., and Braziunas, T.F., 1995, The GISP2 18O climate record of the past 16,500 years and the role of the sun, oceans, and volcanoes: Quaternary Research, v. 44, p. 341-354.
Wallinga, J., 2002, Optically stimulated luminescence dating of fluvial deposits: A review: Boreas, v. 31, p. 303-322.
Waters, M.R., 1985, Late Quaternary alluvial stratigraphy of Whitewater Draw, Arizona;
implications for regional correlation of fluvial deposits in the American Southwest, Geology, v. 13, no. 10, p. 705-708.
Waters, M.R., and Haynes, C.V., 2001, Late Quaternary arroyo formation and climate
change in the American Southwest: Geology, v. 29, no. 5, p. 399-402. Webb, R.H., Pringle, P.T., and Rink, G.R., 1989, Debris flows from tributaries of the
Colorado River, Grand Canyon National Park, Arizona: United States Geological Survey Professional Paper, v. 1492, 39.
Weng, W., and Jackson S.T., 1999, Late Glacial and Holocene vegetation history and
paleoclimate of the Kaibab Plateau, Arizona: Palaeogeography, Paleoclimatology, Paelaeoecology, v. 153, p. 179-201.
Woodhouse, C.A., Gray, S.T., and Meko, D.M., 2006, Updated streamflow
reconstructions for the Upper Colorado River Basin: Water Resources Research, v. 42.
Wurster, C.M., Patterson, W.P., McFarlane, D.A., Wassenaar, L.I., Hobson, K.A.,
Atfield, N.B., and Bird, M.I., 2008, Stable carbon and hydrogen isotopes from bat guano in the Grand Canyon, USA, reveal Younger Dryas and 8.2 ka events: Geology, v. 36, no. 9, p. 683-686.

98
APPENDICES

99
Appendix A: TANNER BAR TEXTURE AND COMPOSITION RESULTS

100
TABLE A.1. TANNER BAR TEXTURE AND COMPOSITION RESULTS*
USU ID** CaCO3 Sand Silt Clay Texture Organic Matter*** Iron**** Interpreted Source% % mg/kg
4384 6.8 66 23 11 sandy loam NA 5150 mainstem4385 6.2 75 14 11 sandy loam NA 11300 mixed4386 6.8 41 48 11 loam 0.8 8240 organic/mainstem4387 6.5 41 49 10 loam NA 7980 mixed4388 6.8 33 52 15 silty loam NA 10300 mainstem4389 6.8 34 55 11 silty loam NA 8110 mainstem4390 6.2 69 25 5 sandy loam NA 6800 mainstem4391 6.2 58 32 9 sandy loam NA 9220 mixed4392 3.1 81 9 10 loamy sand NA 11600 local4393 5.6 62 30 8 sandy loam NA 9399 mixed
average 6.1 56 33.7 10 8810standard deviation 1.13 17.51 16.44 2.56 1991
-------------------%----------------------
*All samples from Tanner Bar C:13:327 stratigraphy. Location is UTM 12 N, 220594 E 565500 N. **Processed by the Utah State University Analytical Laboratory. ***Only measured in sample containing visible organic content. **** Processed by Chemtech-Ford Laboratories, Murray, UT.

101
Appendix B: STRATIGRAPHIC COLUMNS AND DESCRIPTIONS

102
Figure B.1. Stratigraphic column of Ninemile Draw Packages A and B with units and geochronology sample locations labeled. See Tables B1 and B2 for detailed unit descriptions

103
TABLE B.1. NINEMILE DRAW PACKAGE A UNIT DESCRIPTIONS
Unit Thickness
(m) Unit Description Facies Geochronology
sample Preliminary age
(ka) Paleocurrent (°)
6 0.06 Carbonate silt, 6-10 cm, planar unit with horizontal basal contact, bed thins slightly downriver, massive, no grading, mottled appearance, minor root bioturbation, 10 YR 6/6 MSm - - -
5 0.6
Silty sand, 60 cm, basal contact rises downriver, climbing ripples throughout, rare carbonate laminae near bottom, grain size is vfl, minor root and burrow bioturbation, effervesces at bottom, 7.5 YR 6/4 MSSlr - - -
4 0.05 Sand, 2-10 cm, basal contact is irregular, no grading, grain size is vfl-fl, subrounded, burrow bioturbation, effervesces, 7.5 YR 6/4 MSlr - - -
3 0.15 Sand, 15 cm, thickens downstream, upper contact gets higher away from river, a few thin laminae, no grading, grain size is fl-fu sand, rounded, no visible bioturbation, 7.5 YR 6/4 MSlr - - -
2 0.03 Sandy silt, 3 cm, massive, no grading, grain size is silt to vfl sand, matrix is carbonate, root bioturbation, effervesces, 10 YR 6/6 Msm - - -
1 0.2
Sand, 17-20 cm, bottom contact was not visible, 1-4 mm thick laminations, normally graded, rounded, grain size is fu-fl at bottom, vfl-fl at top, no visible bioturbation, no effervescence, sand completely unconsolidated, 7.5 YR 6/4 MSlr USU-284; OSL 5.0 ± 1.97 -
total thick-
ness (m) 6.34
*See Appendix E for OSL results. ** See Appendix D for paleocurrent data.

104
TABLE B.2. NINEMILE DRAW PACKAGE B UNIT DESCRIPTIONS
Unit Thickness
(m) Unit Description Facies Geochronology
sample* Preliminary age
(ka) Paleo-
current (°)**
15 0.08
Silt, 8 cm, wavy basal contact and irregular upper contact, thickness does not vary, very thin sand bed 2 mm up unit, planar laminations and few faint climbing ripples, no grading, major root bioturbation especially at upper contact, effervesces, 10 YR 6/3 MSSlr - - -
13/14 0.25
Sand with pebbly sand lenses, 25 cm, wavy basal contact, pebbly sand lenses have red sand and pebbles clasts 1-5 cm in mean diameter, a few faint laminae and thin beds of alternating red and tan sand, normal grading, grain size at bottom is fl to ml sand, vfl to ml at top, 70% red sand at bottom, decreases to 30% towards top of unit, minor root and burrow bioturbation, slight effervescence, 2.5 YR 6/6- 5 YR 6/6 MRSlr - - -
11/12 0.27
Sand with pebbly sand lenses, 27 cm, red sand with laminae of tan sand, rare floating red sandstone pebbles, plane bed laminations and some gentle ripples, fines upward, grain size is fl to ml sand at bottom and vfl-fl sand at top, minor burrow bioturbation, 5 YR 5/6 at bottom grades to 7.5 YR 6/6 at top MRSlr - - 120, 260
10 0.1
Sand capped by silt, 10 cm, basal contact is slightly wavy, discontinuous cross bedding, subcritical and critical climbing ripples, normally graded, grain size is vfl sand to silt at the base, strong effervescence, burrowing at top and bottom contacts, sand is 10 yr 6/3, silt cap at top is 10 YR 8/2 MSSlr - - -
9b 0.18
Sand, 18 cm, sharp upper contact, rare local pebbles, 1-2 cm thick very low angle, thin cross beds, normal grading, ms at bottom and fl sand at top, bioturbated by burrows, 5 YR 6/6 MRSlr - - -
9a 0.23
Sand, 23 cm, erosional scoped basal contact with 20 cm of relief, interbedded silt laminae, capped by 3 m broad evaporative mud pan, local pebbles, planar laminations and low-angle ripples throughout, normally graded, grain size is mL-cL sand at bottom and fU-mL sand at top, burrows at bottom contact, minor root bioturbation, silt is 5YR 7/2, sand is 5 YR 6/6 MRSlr - - -
8 0.55
Alternating silt and sand, 55 cm, alternating laminae of tan silt and sand, thin beds, basal contact is wavy, sand has climbing ripples and plane bed laminae, isolated lenses of red tributary sand are present, no grading, subrounded, grain size is vfu-vfl, grain size in lenses of sand is fu-vfl, root and burrow bioturbation throughout, rhizoliths, silt is 7.5 YR 6/2, lenses of sand are 5 YR 6/4 MSSlr - - 110, 230
7 0.15
Sand, 15 cm, basal contact is planar to slightly wavy and very bioturbated, climbing ripples and cross bedding that are less distinct towards top, no grading, grain size is vfl-vfu, rounded, slight bioturbation, rhizoliths, 7.5 YR 7/2 MSlr USU-355; OSL 3.0 ± 0.52 -
thick-
ness (m) 1.81 *See Appendix E for OSL results. ** See Appendix D for paleocurrent data.

105
TABLE B.2. NINEMILE DRAW PACKAGE B UNIT DESCRIPTIONS (CONTINUED)
Unit Thickness
(m) Unit Description Facies Geochronology
sample* Preliminary age
(ka) Paleo-
current (°)**
25c 0.18
Sand, 20 cm, wavy basal contact, some laminations, no grading, grain size is fl to fu sand, small pieces of organic matter throughout, no effervescence, minor burrow bioturbation, 2.5 YR 6/6 MRSlr - - -
24 0.44 Sandy silt, 44 cm, massive, no grading, grain size is silt to vfu sand, root and burrow bioturbation, no effervescence, 10 YR 6/3 MSm - - -
23 0.06 Carbonate silt, 6 cm, maximum thickness of 10 cm, wavy and indistinct basal contact, no structures, no grading, major root and burrow bioturbation, rhizoliths effervesces, 10 YR 7/2 LMl - -
22 0.08
Pebbly sand, 8 cm, wavy basal contact, sandstone pebbles at throughout unit, no structures, no grading, grain size of sand is fl to mu and pebbles are 1 to 5 cm in mean diameter, lots of root bioturbation on top, rare charcoal fragments, 2.5 YR 6/6 LGS - - -
21 0.07 Silt, 1-7 cm, laterally discontinuous, irregular basal contact, no structures, no grading, root bioturbation, effervesces, 10 YR 7/2 LMl - - -
20 0.39
Sand, 38-42 cm, capped by lens of burned organic matter, thin charcoal bed and burn horizon, 70% sand and 30% pebbles, pebbles throughout concentrated between 6 and 12 cm and 5 cm at top, no visible structures, no grading, grain size of sand is fl to mu, sand is 2.5 YR 6/6 LGS 14C*
2700-2300 cal yr BP -
19 0.02 Silt, 1-2 cm, irregular and indistinct basal contact, discontinuous, contains some red sand, no structures, no grading, major burrow bioturbation at top, effervesces, 10 YR 6/6 LMl - - -
18 0.05
Sand with occasional pebbles, 4-7 cm, base has ripples and thin beds but local colluvium influence is dominant, no grading, grain size is vfu to mu, mean diameter of pebbles ranges from 0.5 to 2 cm and are subrounded red sandstone, major burrow bioturbation, some small flecks of organic material, round seeds, no effervescence, 2.5 YR 6/6 LGS - - -
17 0.15 Silty sand, 14 cm, planar bed but basal contact is slightly wavy, no grading, burrow bioturbation throughout, effervesces, rhizoliths, 10 YR 6/3 MSSlr - - -
16 0.16
Sand, 15-17 cm, irregular basal contact, planar laminations and thin ripple cross-stratification and climbing ripples, inversely graded, grain size is fl to ml sand at bottom, upper 4 cm is pulse of fine to medium sand, insect burrow bioturbation at contacts, rhizoliths 2.5 YR 6/6 MRSlr - - 230
thick- ness (m) 1.44
*See Appendix E for OSL results. ** See Appendix D for paleocurrent data.
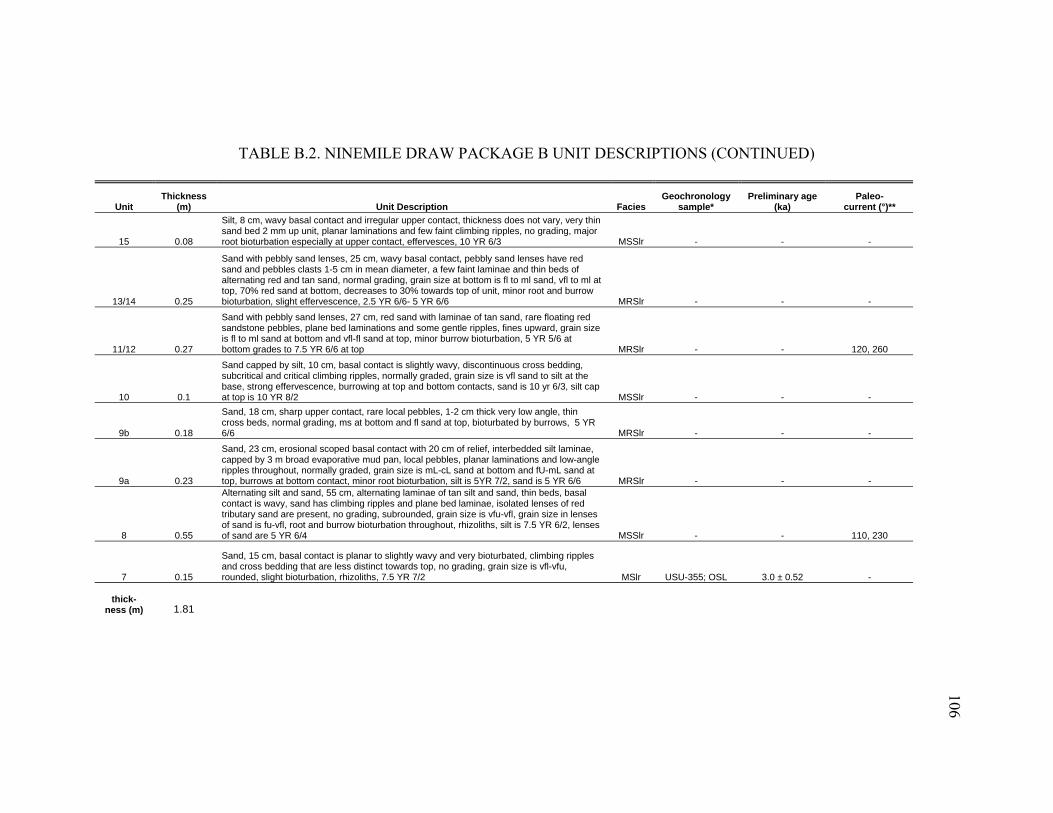
106
TABLE B.2. NINEMILE DRAW PACKAGE B UNIT DESCRIPTIONS (CONTINUED)
Unit Thickness
(m) Unit Description Facies Geochronology
sample* Preliminary age
(ka) Paleo-
current (°)**
15 0.08
Silt, 8 cm, wavy basal contact and irregular upper contact, thickness does not vary, very thin sand bed 2 mm up unit, planar laminations and few faint climbing ripples, no grading, major root bioturbation especially at upper contact, effervesces, 10 YR 6/3 MSSlr - - -
13/14 0.25
Sand with pebbly sand lenses, 25 cm, wavy basal contact, pebbly sand lenses have red sand and pebbles clasts 1-5 cm in mean diameter, a few faint laminae and thin beds of alternating red and tan sand, normal grading, grain size at bottom is fl to ml sand, vfl to ml at top, 70% red sand at bottom, decreases to 30% towards top of unit, minor root and burrow bioturbation, slight effervescence, 2.5 YR 6/6- 5 YR 6/6 MRSlr - - -
11/12 0.27
Sand with pebbly sand lenses, 27 cm, red sand with laminae of tan sand, rare floating red sandstone pebbles, plane bed laminations and some gentle ripples, fines upward, grain size is fl to ml sand at bottom and vfl-fl sand at top, minor burrow bioturbation, 5 YR 5/6 at bottom grades to 7.5 YR 6/6 at top MRSlr - - 120, 260
10 0.1
Sand capped by silt, 10 cm, basal contact is slightly wavy, discontinuous cross bedding, subcritical and critical climbing ripples, normally graded, grain size is vfl sand to silt at the base, strong effervescence, burrowing at top and bottom contacts, sand is 10 yr 6/3, silt cap at top is 10 YR 8/2 MSSlr - - -
9b 0.18
Sand, 18 cm, sharp upper contact, rare local pebbles, 1-2 cm thick very low angle, thin cross beds, normal grading, ms at bottom and fl sand at top, bioturbated by burrows, 5 YR 6/6 MRSlr - - -
9a 0.23
Sand, 23 cm, erosional scoped basal contact with 20 cm of relief, interbedded silt laminae, capped by 3 m broad evaporative mud pan, local pebbles, planar laminations and low-angle ripples throughout, normally graded, grain size is mL-cL sand at bottom and fU-mL sand at top, burrows at bottom contact, minor root bioturbation, silt is 5YR 7/2, sand is 5 YR 6/6 MRSlr - - -
8 0.55
Alternating silt and sand, 55 cm, alternating laminae of tan silt and sand, thin beds, basal contact is wavy, sand has climbing ripples and plane bed laminae, isolated lenses of red tributary sand are present, no grading, subrounded, grain size is vfu-vfl, grain size in lenses of sand is fu-vfl, root and burrow bioturbation throughout, rhizoliths, silt is 7.5 YR 6/2, lenses of sand are 5 YR 6/4 MSSlr - - 110, 230
7 0.15
Sand, 15 cm, basal contact is planar to slightly wavy and very bioturbated, climbing ripples and cross bedding that are less distinct towards top, no grading, grain size is vfl-vfu, rounded, slight bioturbation, rhizoliths, 7.5 YR 7/2 MSlr USU-355; OSL 3.0 ± 0.52 -
thick-
ness (m) 1.81
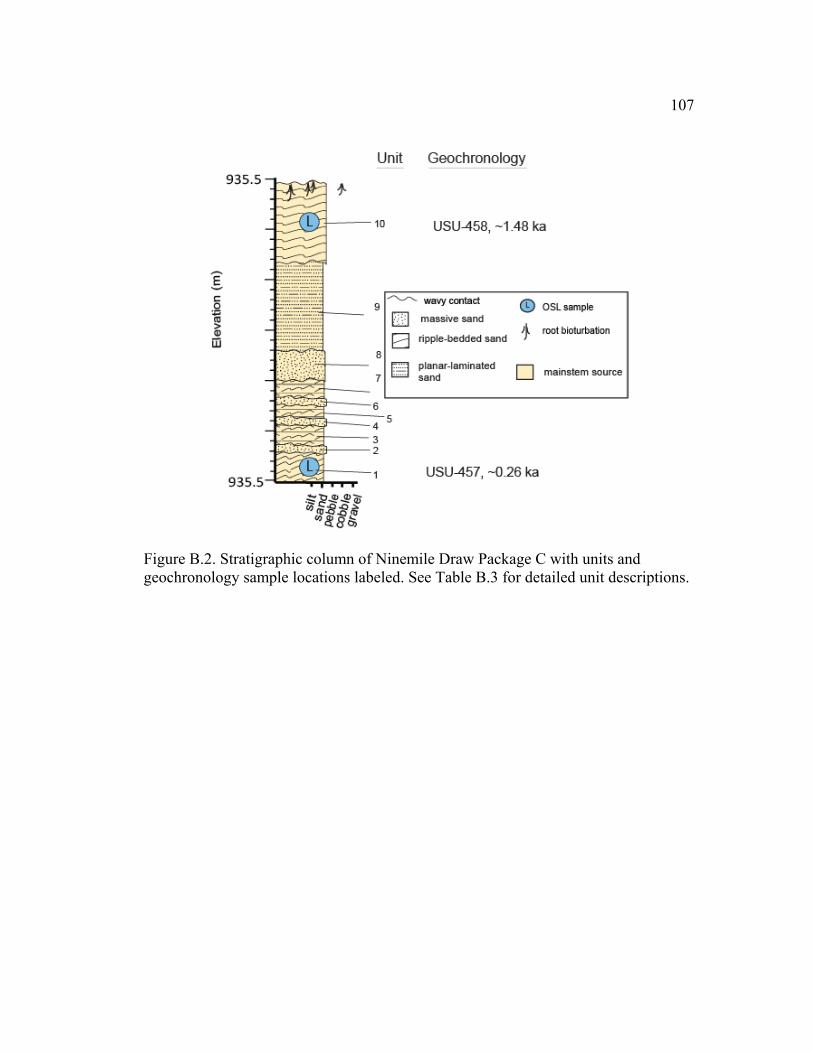
107
Figure B.2. Stratigraphic column of Ninemile Draw Package C with units and geochronology sample locations labeled. See Table B.3 for detailed unit descriptions.

108
TABLE B.3. NINEMILE DRAW PACKAGE C UNIT DESCRIPTIONS
Unit Thickness
(m) Unit Description Facies Geochronology
sample* Preliminary age
(ka) Paleo-
current (°)**
10 0.8
Sand, up to 80 cm, erosional upper contact and erosional contact with buttress unconformity, thin crossbeds and ripples climbing upstream, lots of rooting bioturbation, 10 YR 6/3 MSlr USU-458; OSL 1.48 ± 0.82 250
9 0.9
Silty sand, 90 cm, start of this unit blankets unlevel surface, deposited on slope to bedding is slope-parallel, laminated and thinly interbedded, silt to vfs thinly interbedded with vfs, 10 YR 6/3 MSSlr - - -
8 0.28 Sand, 28 cm, massive, bioturbated at top, 7.5 YR 5/4 ES - - -
7 0.17 Silty sand, 17 cm, 10 YR 6/3 MSSlr - - -
6 0.05 Sand, 5 cm, massive, grain size is vfs to fs, burrow and root bioturbation, 7.5 YR 5/4 MSm - - -
5 0.16 Silty sand, 16 cm, 10 YR 6/3 MSSlr - - -
4 0.06 Sand, 6 cm, grain size is vfs to fs, very bioturbated, 7.5 YR 5/4 MSm - - -
3 0.25 Silty sand, 25 cm, wavy but sharp basal contact, planar laminations and ripples, 10 YR 6/3 MSSlr - - -
2 0.04 Sand, 4 cm, massive, grain size is vf-f, extremely bioturbated, 7.5 YR 5/4 MSm - - -
1 0.28 Silty sand, 28 cm, ripples up to 7 cm tall oriented upstream, 10 YR 6/3 MSSlr USU-457; OSL 0.26 ± 0.12 -
total thickness 2.99
*See Appendix E for OSL results. ** See Appendix D for paleocurrent data.
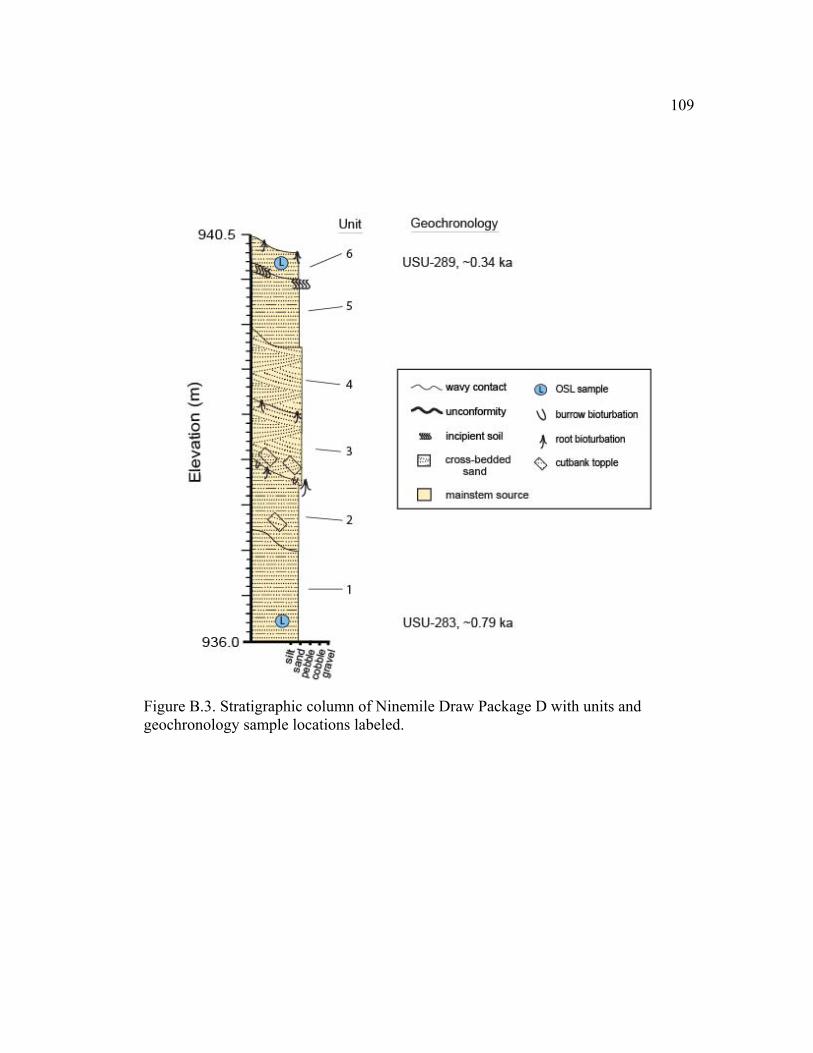
109
Figure B.3. Stratigraphic column of Ninemile Draw Package D with units and geochronology sample locations labeled.

110
TABLE B.4. NINEMILE DRAW PACKAGE D UNIT DESCRIPTIONS
Unit Thickness
(m) Unit Description Facies Geochronology
sample* Preliminary age
(ka) Paleo-
current (°)**
10 0.8
Sand, up to 80 cm, erosional upper contact and erosional contact with buttress unconformity, thin crossbeds and ripples climbing upstream, lots of rooting bioturbation, 10 YR 6/3 MSlr USU-458; OSL 1.48 ± 0.82 250
9 0.9
Silty sand, 90 cm, start of this unit blankets unlevel surface, deposited on slope to bedding is slope-parallel, laminated and thinly interbedded, silt to vfs thinly interbedded with vfs, 10 YR 6/3 MSSlr - - -
8 0.28 Sand, 28 cm, massive, bioturbated at top, 7.5 YR 5/4 ES - - -
7 0.17 Silty sand, 17 cm, 10 YR 6/3 MSSlr - - -
6 0.05 Sand, 5 cm, massive, grain size is vfs to fs, burrow and root bioturbation, 7.5 YR 5/4 MSm - - -
5 0.16 Silty sand, 16 cm, 10 YR 6/3 MSSlr - - -
4 0.06 Sand, 6 cm, grain size is vfs to fs, very bioturbated, 7.5 YR 5/4 MSm - - -
3 0.25 Silty sand, 25 cm, wavy but sharp basal contact, planar laminations and ripples, 10 YR 6/3 MSSlr - - -
2 0.04 Sand, 4 cm, massive, grain size is vf-f, extremely bioturbated, 7.5 YR 5/4 MSm - - -
1 0.28 Silty sand, 28 cm, ripples up to 7 cm tall oriented upstream, 10 YR 6/3 MSSlr USU-457; OSL 0.26 ± 0.12 - total
thickness (m) 2.99
*See Appendix E for OSL results. ** See Appendix D for paleocurrent data.

111
Figure B.4. Tanner Bar geomorphic study gully stratigraphic column with OSL sample locations labeled. See Table B.5 for detailed unit descriptions and Appendix D for paleocurrent data.

112
TABLE B.5. TANNER BAR GEOMORPHIC STUDY GULLY UNIT DESCRIPTIONS
Unit Thickness
(m) Unit description Facies Geochronology
sample* Preliminary age
(ka)
6 1 Stripes at the top of exposure are approximately 1 meter thick interfingering hillslope and mainstem material, percentage of mainstem increases into the gully, lots of rodent holes in these beds
LGS and MSm USU-436 5.42 ± 0.73ka
5 variable Alternating mainstem and Dox/Pleistocene hillslope material, overlaps in stratigraphic level with Unit 3
LGS and MSm
4 0.45
Sand, differs from unit 2 because it is more red, approximate thickness is 45 cm, a few faint mud drapes and ripples, some strings of Dox granules, composition of sand is fine to medium, some rhizoliths, slightly effervescent, 7.5 yr 6/4 MSlr
3 variable
Mainstem sand with interfingering Dox colluvium, unit dips toward gully, some small strings of Dox granules are present, sand is subrounded, fine to medium, some carbonate development, root bioturbation, slight effervescence, 7.5 YR 5/4
LGS and MSm USU-434 8.40 ± 1.7 ka
2 1.2 m
minimum
Dox lithic unit, 1.2 m minimum thickness, angular to subrounded clasts, clasts range in size from 0.5 cm intermediate diameter to cobble-sized, matrix ranges in size from fine sand to Dox granules, poorly-sorted, clasts-supported, 2-4% of clasts are Pleistocene gravels, root bioturbation, white carbonate development on some clasts LGS
1 ? Massive mainstem sand MSm USU-512 11.64 ± 0.62 ka
*See Appendix E for OSL results.
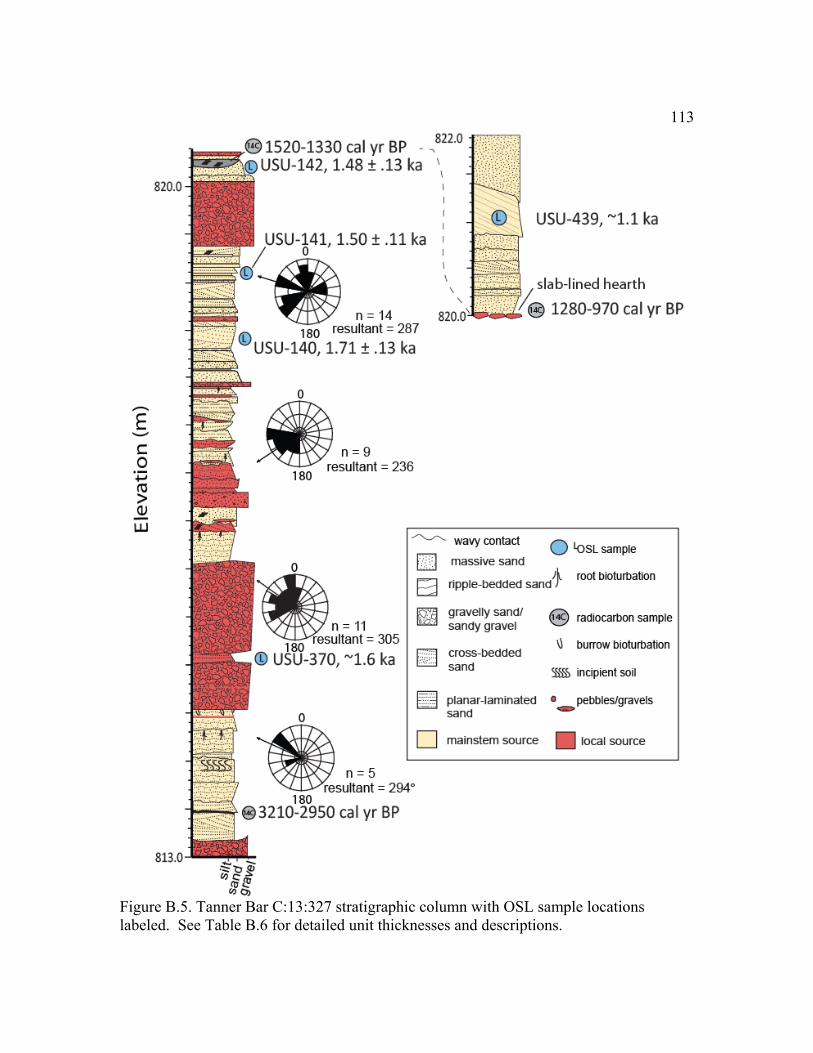
113
Figure B.5. Tanner Bar C:13:327 stratigraphic column with OSL sample locations labeled. See Table B.6 for detailed unit thicknesses and descriptions.
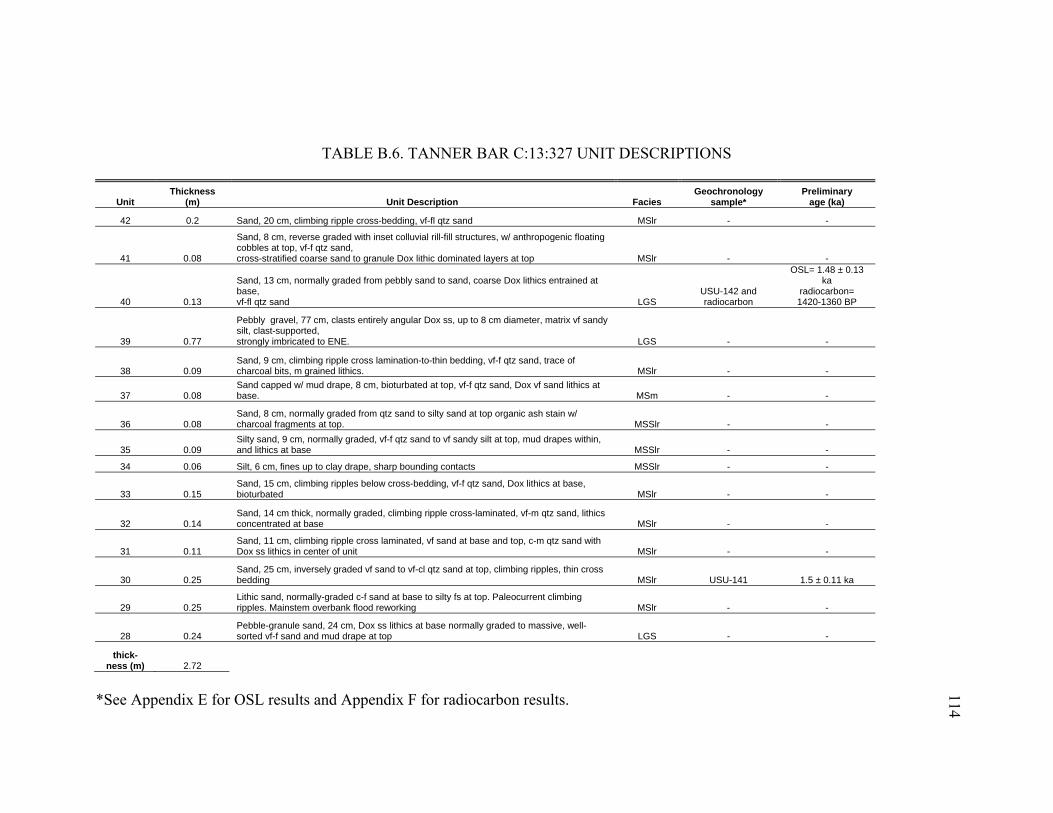
114
TABLE B.6. TANNER BAR C:13:327 UNIT DESCRIPTIONS
Unit Thickness
(m) Unit Description Facies Geochronology
sample* Preliminary
age (ka)
42 0.2 Sand, 20 cm, climbing ripple cross-bedding, vf-fl qtz sand MSlr - -
41 0.08
Sand, 8 cm, reverse graded with inset colluvial rill-fill structures, w/ anthropogenic floating cobbles at top, vf-f qtz sand, cross-stratified coarse sand to granule Dox lithic dominated layers at top MSlr - -
40 0.13
Sand, 13 cm, normally graded from pebbly sand to sand, coarse Dox lithics entrained at base, vf-fl qtz sand LGS
USU-142 and radiocarbon
OSL= 1.48 ± 0.13 ka
radiocarbon= 1420-1360 BP
39 0.77
Pebbly gravel, 77 cm, clasts entirely angular Dox ss, up to 8 cm diameter, matrix vf sandy silt, clast-supported, strongly imbricated to ENE. LGS - -
38 0.09 Sand, 9 cm, climbing ripple cross lamination-to-thin bedding, vf-f qtz sand, trace of charcoal bits, m grained lithics. MSlr - -
37 0.08 Sand capped w/ mud drape, 8 cm, bioturbated at top, vf-f qtz sand, Dox vf sand lithics at base. MSm - -
36 0.08 Sand, 8 cm, normally graded from qtz sand to silty sand at top organic ash stain w/ charcoal fragments at top. MSSlr - -
35 0.09 Silty sand, 9 cm, normally graded, vf-f qtz sand to vf sandy silt at top, mud drapes within, and lithics at base MSSlr - -
34 0.06 Silt, 6 cm, fines up to clay drape, sharp bounding contacts MSSlr - -
33 0.15 Sand, 15 cm, climbing ripples below cross-bedding, vf-f qtz sand, Dox lithics at base, bioturbated MSlr - -
32 0.14 Sand, 14 cm thick, normally graded, climbing ripple cross-laminated, vf-m qtz sand, lithics concentrated at base MSlr - -
31 0.11 Sand, 11 cm, climbing ripple cross laminated, vf sand at base and top, c-m qtz sand with Dox ss lithics in center of unit MSlr - -
30 0.25 Sand, 25 cm, inversely graded vf sand to vf-cl qtz sand at top, climbing ripples, thin cross bedding MSlr USU-141 1.5 ± 0.11 ka
29 0.25 Lithic sand, normally-graded c-f sand at base to silty fs at top. Paleocurrent climbing ripples. Mainstem overbank flood reworking MSlr - -
28 0.24 Pebble-granule sand, 24 cm, Dox ss lithics at base normally graded to massive, well-sorted vf-f sand and mud drape at top LGS - -
thick- ness (m) 2.72
*See Appendix E for OSL results and Appendix F for radiocarbon results.
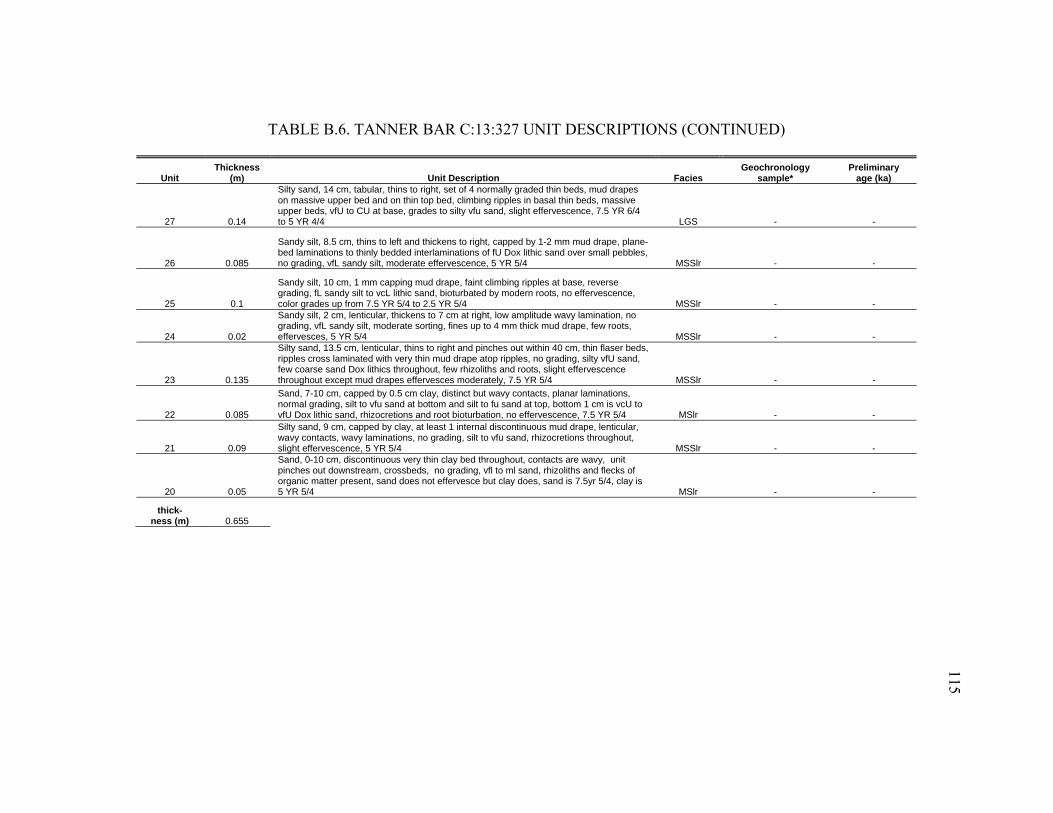
115
TABLE B.6. TANNER BAR C:13:327 UNIT DESCRIPTIONS (CONTINUED)
Unit Thickness
(m) Unit Description Facies Geochronology
sample* Preliminary
age (ka)
27 0.14
Silty sand, 14 cm, tabular, thins to right, set of 4 normally graded thin beds, mud drapes on massive upper bed and on thin top bed, climbing ripples in basal thin beds, massive upper beds, vfU to CU at base, grades to silty vfu sand, slight effervescence, 7.5 YR 6/4 to 5 YR 4/4 LGS - -
26 0.085
Sandy silt, 8.5 cm, thins to left and thickens to right, capped by 1-2 mm mud drape, plane-bed laminations to thinly bedded interlaminations of fU Dox lithic sand over small pebbles, no grading, vfL sandy silt, moderate effervescence, 5 YR 5/4 MSSlr - -
25 0.1
Sandy silt, 10 cm, 1 mm capping mud drape, faint climbing ripples at base, reverse grading, fL sandy silt to vcL lithic sand, bioturbated by modern roots, no effervescence, color grades up from 7.5 YR 5/4 to 2.5 YR 5/4 MSSlr - -
24 0.02
Sandy silt, 2 cm, lenticular, thickens to 7 cm at right, low amplitude wavy lamination, no grading, vfL sandy silt, moderate sorting, fines up to 4 mm thick mud drape, few roots, effervesces, 5 YR 5/4 MSSlr - -
23 0.135
Silty sand, 13.5 cm, lenticular, thins to right and pinches out within 40 cm, thin flaser beds, ripples cross laminated with very thin mud drape atop ripples, no grading, silty vfU sand, few coarse sand Dox lithics throughout, few rhizoliths and roots, slight effervescence throughout except mud drapes effervesces moderately, 7.5 YR 5/4 MSSlr - -
22 0.085
Sand, 7-10 cm, capped by 0.5 cm clay, distinct but wavy contacts, planar laminations, normal grading, silt to vfu sand at bottom and silt to fu sand at top, bottom 1 cm is vcU to vfU Dox lithic sand, rhizocretions and root bioturbation, no effervescence, 7.5 YR 5/4 MSlr - -
21 0.09
Silty sand, 9 cm, capped by clay, at least 1 internal discontinuous mud drape, lenticular, wavy contacts, wavy laminations, no grading, silt to vfu sand, rhizocretions throughout, slight effervescence, 5 YR 5/4 MSSlr - -
20 0.05
Sand, 0-10 cm, discontinuous very thin clay bed throughout, contacts are wavy, unit pinches out downstream, crossbeds, no grading, vfl to ml sand, rhizoliths and flecks of organic matter present, sand does not effervesce but clay does, sand is 7.5yr 5/4, clay is 5 YR 5/4 MSlr - -
thick- ness (m) 0.655
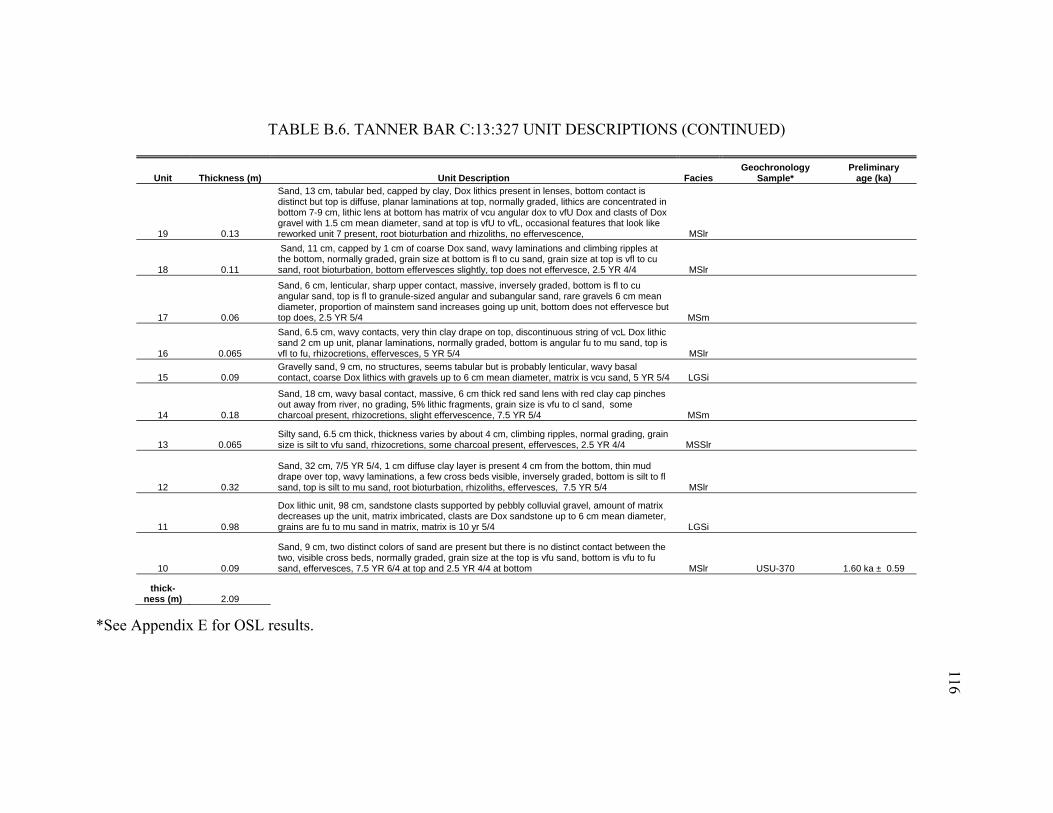
116
TABLE B.6. TANNER BAR C:13:327 UNIT DESCRIPTIONS (CONTINUED)
Unit Thickness (m) Unit Description Facies Geochronology
Sample* Preliminary
age (ka)
19 0.13
Sand, 13 cm, tabular bed, capped by clay, Dox lithics present in lenses, bottom contact is distinct but top is diffuse, planar laminations at top, normally graded, lithics are concentrated in bottom 7-9 cm, lithic lens at bottom has matrix of vcu angular dox to vfU Dox and clasts of Dox gravel with 1.5 cm mean diameter, sand at top is vfU to vfL, occasional features that look like reworked unit 7 present, root bioturbation and rhizoliths, no effervescence, MSlr
18 0.11
Sand, 11 cm, capped by 1 cm of coarse Dox sand, wavy laminations and climbing ripples at the bottom, normally graded, grain size at bottom is fl to cu sand, grain size at top is vfl to cu sand, root bioturbation, bottom effervesces slightly, top does not effervesce, 2.5 YR 4/4 MSlr
17 0.06
Sand, 6 cm, lenticular, sharp upper contact, massive, inversely graded, bottom is fl to cu angular sand, top is fl to granule-sized angular and subangular sand, rare gravels 6 cm mean diameter, proportion of mainstem sand increases going up unit, bottom does not effervesce but top does, 2.5 YR 5/4 MSm
16 0.065
Sand, 6.5 cm, wavy contacts, very thin clay drape on top, discontinuous string of vcL Dox lithic sand 2 cm up unit, planar laminations, normally graded, bottom is angular fu to mu sand, top is vfl to fu, rhizocretions, effervesces, 5 YR 5/4 MSlr
15 0.09 Gravelly sand, 9 cm, no structures, seems tabular but is probably lenticular, wavy basal contact, coarse Dox lithics with gravels up to 6 cm mean diameter, matrix is vcu sand, 5 YR 5/4 LGSi
14 0.18
Sand, 18 cm, wavy basal contact, massive, 6 cm thick red sand lens with red clay cap pinches out away from river, no grading, 5% lithic fragments, grain size is vfu to cl sand, some charcoal present, rhizocretions, slight effervescence, 7.5 YR 5/4 MSm
13 0.065 Silty sand, 6.5 cm thick, thickness varies by about 4 cm, climbing ripples, normal grading, grain size is silt to vfu sand, rhizocretions, some charcoal present, effervesces, 2.5 YR 4/4 MSSlr
12 0.32
Sand, 32 cm, 7/5 YR 5/4, 1 cm diffuse clay layer is present 4 cm from the bottom, thin mud drape over top, wavy laminations, a few cross beds visible, inversely graded, bottom is silt to fl sand, top is silt to mu sand, root bioturbation, rhizoliths, effervesces, 7.5 YR 5/4 MSlr
11 0.98
Dox lithic unit, 98 cm, sandstone clasts supported by pebbly colluvial gravel, amount of matrix decreases up the unit, matrix imbricated, clasts are Dox sandstone up to 6 cm mean diameter, grains are fu to mu sand in matrix, matrix is 10 yr 5/4 LGSi
10 0.09
Sand, 9 cm, two distinct colors of sand are present but there is no distinct contact between the two, visible cross beds, normally graded, grain size at the top is vfu sand, bottom is vfu to fu sand, effervesces, 7.5 YR 6/4 at top and 2.5 YR 4/4 at bottom MSlr USU-370 1.60 ka ± 0.59
thick- ness (m) 2.09
*See Appendix E for OSL results.
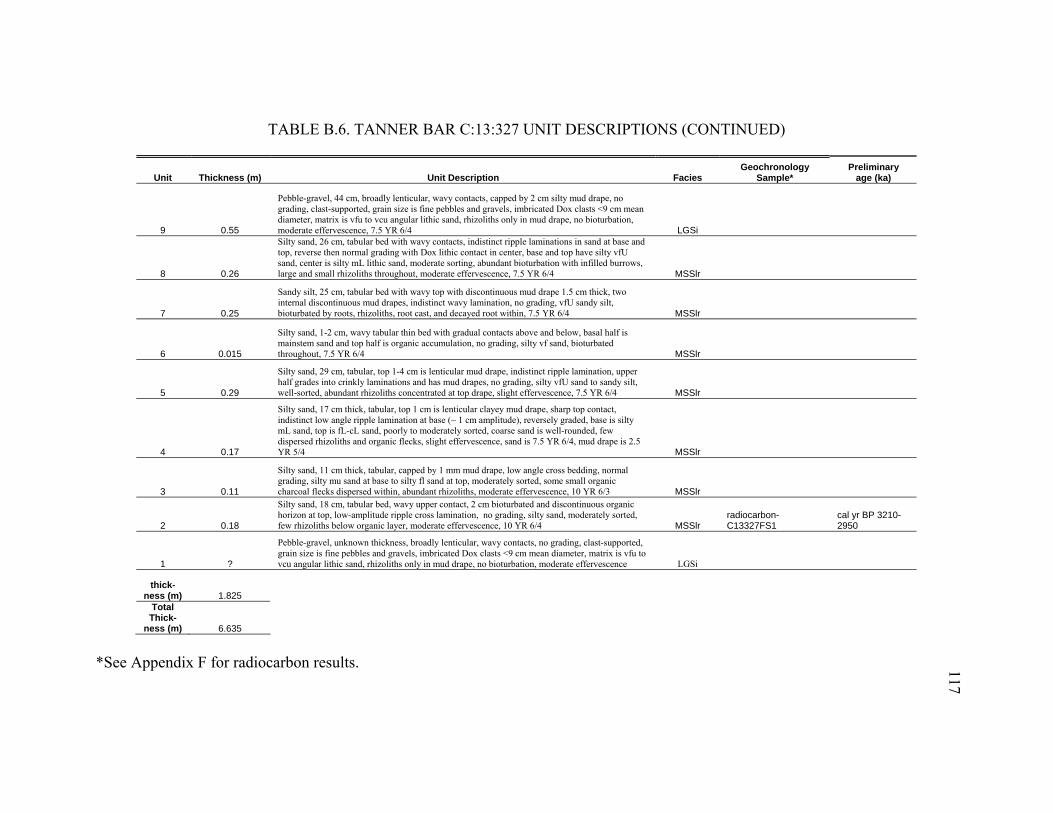
117
TABLE B.6. TANNER BAR C:13:327 UNIT DESCRIPTIONS (CONTINUED)
Unit Thickness (m) Unit Description Facies Geochronology
Sample* Preliminary
age (ka)
9 0.55
Pebble-gravel, 44 cm, broadly lenticular, wavy contacts, capped by 2 cm silty mud drape, no grading, clast-supported, grain size is fine pebbles and gravels, imbricated Dox clasts <9 cm mean diameter, matrix is vfu to vcu angular lithic sand, rhizoliths only in mud drape, no bioturbation, moderate effervescence, 7.5 YR 6/4 LGSi
8 0.26
Silty sand, 26 cm, tabular bed with wavy contacts, indistinct ripple laminations in sand at base and top, reverse then normal grading with Dox lithic contact in center, base and top have silty vfU sand, center is silty mL lithic sand, moderate sorting, abundant bioturbation with infilled burrows, large and small rhizoliths throughout, moderate effervescence, 7.5 YR 6/4 MSSlr
7 0.25
Sandy silt, 25 cm, tabular bed with wavy top with discontinuous mud drape 1.5 cm thick, two internal discontinuous mud drapes, indistinct wavy lamination, no grading, vfU sandy silt, bioturbated by roots, rhizoliths, root cast, and decayed root within, 7.5 YR 6/4 MSSlr
6 0.015
Silty sand, 1-2 cm, wavy tabular thin bed with gradual contacts above and below, basal half is mainstem sand and top half is organic accumulation, no grading, silty vf sand, bioturbated throughout, 7.5 YR 6/4 MSSlr
5 0.29
Silty sand, 29 cm, tabular, top 1-4 cm is lenticular mud drape, indistinct ripple lamination, upper half grades into crinkly laminations and has mud drapes, no grading, silty vfU sand to sandy silt, well-sorted, abundant rhizoliths concentrated at top drape, slight effervescence, 7.5 YR 6/4 MSSlr
4 0.17
Silty sand, 17 cm thick, tabular, top 1 cm is lenticular clayey mud drape, sharp top contact, indistinct low angle ripple lamination at base (~ 1 cm amplitude), reversely graded, base is silty mL sand, top is fL-cL sand, poorly to moderately sorted, coarse sand is well-rounded, few dispersed rhizoliths and organic flecks, slight effervescence, sand is 7.5 YR 6/4, mud drape is 2.5 YR 5/4 MSSlr
3 0.11
Silty sand, 11 cm thick, tabular, capped by 1 mm mud drape, low angle cross bedding, normal grading, silty mu sand at base to silty fl sand at top, moderately sorted, some small organic charcoal flecks dispersed within, abundant rhizoliths, moderate effervescence, 10 YR 6/3 MSSlr
2 0.18
Silty sand, 18 cm, tabular bed, wavy upper contact, 2 cm bioturbated and discontinuous organic horizon at top, low-amplitude ripple cross lamination, no grading, silty sand, moderately sorted, few rhizoliths below organic layer, moderate effervescence, 10 YR 6/4 MSSlr
radiocarbon- C13327FS1
cal yr BP 3210-2950
1 ?
Pebble-gravel, unknown thickness, broadly lenticular, wavy contacts, no grading, clast-supported, grain size is fine pebbles and gravels, imbricated Dox clasts <9 cm mean diameter, matrix is vfu to vcu angular lithic sand, rhizoliths only in mud drape, no bioturbation, moderate effervescence LGSi
thick- ness (m) 1.825
Total Thick-
ness (m) 6.635 *See Appendix F for radiocarbon results.

118
Appendix C: ARCHAEOLOGICAL STUDY UNIT STRATIGRAPHIC PANELS AND
DESCRIPTIONS
Site C:02:032 (Ninemile) archaeological study units, p. 119-124 Site C:13:323 (Tanner Bar) archaeological study units p. 125-130 Site C:13:327 (Tanner Bar) archaeological study units, p. 131-140

119
5 1234
67
5
1b
3b 4b
massive sand (LSm)
pebbly/gravelly sand (LGS) root cast
1
2
3
4
6
5
1b
3b
4b1 m
calcareous mud (LMl)
trench
1 m
north
7
root bioturbationN
terrace front14C 2340‐2120 cal yr BP
7) Sand, 24 cm, massive, fl to fu sand,5 YR 5/6, LSm
6) Pebbly sand, 9-23 cm, sandstonepebbles in lenses atbase, 1-2 cm organic horizon capsunit, fl-fu sand at bottom to vfu-fl sand at top, 5 YR 6/6, LGS
5) Pebbly sand, 6-20 cm, inverselygraded from vfl to fu sand atbottom and fl to ml sand at top, 5%sandstone pebble clasts, 5 YR 6/6,LGS
4) Pebbly sand, 15-40 cm, massive,normally graded with matrix ofmu sand at bottom and fl to mu sand attop, 5 YR 6/6, LGS -Capped by unit 4b, discontinuouscarbonate silty clay, LMl
3) Pebbly sand, 0-16 cm, sandstonepebbles, matrix is silty vfto mu sand, 5 YR 6/6, LGS-Capped by unit 3b, discontinuouscarbonate silt, 7.5 YR 7/4, LMl
2) Pebbly sand, 10-45 cm, massive,pebbly sandstone gravels lessthan 2 cm, matrix is silty vf-ml sand, 5YR 6/6, LGS
Figure C.1. Photo and stratigraphic panel of C:02:032 SU 1. Top photo is oblique view of trench and not to scale. Facies are indicated in bold.

120
6
5
3
24
1m
step
step
1
2
steps
Terrace front
Panel location
1 m
Trench
massive sand
pebbly/gravelly sand
clay
colluvium
cobble
root bioturbation
depoistional hiatus
burn horizon
3
45
6
N
6) Sand with lenses of pebbly sand, 35 cmthick, massive, 3 subunits based on grada-tional contacts:6a: Sand with rare pebbles, 5 cm, vfu-vfl sandinversely graded to fl-ml sand, LGS6b: Pebbly sand, 10 cm, fl-ml sand, sandstonepebbles up to 5 cm, 5 YR 5/6. LGS6c: Sand, 9-20 cm, vfu-ml sand, 7.5 yr 5/4,LSm
5) Clayey sand, 2-8 cm, silt-fl sand, root andburrow bioturbation,7.5 YR 6/4, LSm-Unit contains centimeter-scale discontinuousclay bodies, 10 YR 6/3, LMl
4) Sand with a lens of pebbly sand, 30-35 cmthick, massive, vfu-ml sand inversely graded tovfu-mu sand at top, rare sandstone pebbles,contains a 5-17 cm lens of 30% sandstonepebbles 0.5-5 cmheavy root and burrowbioturbation, 5 YR 6/6, LGS
3) Silty sand, 5-11 cm, grades up from clay to flsand, burrows, rizocretions, sand is 5 YR 5/4,clay is 10 YR 7/3, LSm
2) Sand, 15 cm minimum, vfl to fu sand withrare ashy fragments, rarepebbles, burrows and roots truncated againstthis unit, 5 YR 5/6, LSm
1) Massive ashy sand, 0-7 cm, burn unitpervasive across east end, A
Figure C.2. Photo and stratigraphic panel of C:02:032 SU 2. Photo is oblique view of trench and not to scale. Facies are indicated in bold.

121
1 m
massive sand
pebbly/gravellysand
ashy sand
charcoal lens
radiocarbon sample
root bioturbation
root cast
12
43
6
7
3
5
4
2
1
4
2
N
5
34
6
7
14C
14C
14C
step
terrace front 1 m
trench
N
3120‐2940 cal yr BP
7) Sand, 24 cm, no distinct contact with eolian sand ontop, vfl-ml sand, 7.5 yr 5/4, LSm
6) Pebbly sand, approximately 10-30 cm vfu-ml,matrix-supported with subrounded sandstone pebbles, 2.5YR 5/6, LGS
5) Sand, 10-20 cm with lens of 10YR 6/3 silty claylaminae with rhizocretions , contains a root cast with darkorganic material and ashy sand, bottom of unit containsashy sand grading up into red sand, 5YR 5/6, LSm
4) Sand, interfingered with clast-supported colluvium ofunit 2, vfl-ml, 5 YR 5/6, LGS
3) Clast-supported gravel with sand matrix, interfingerssand of unit 3, sandstone pebbles/cobbles with matrix ofred sand, 5 YR 5/6, LGS
2) Ashy sand, discontinuous ash stain that is vfl to mlsand, radiocarbon sample from this unit, 7.5 yr 3/3,capped by lense of charcoal and ash 10-20 cm and 10YR3/2, A
1) Sand, 37 cm, rvery slight effervescence, 5 YR 5/6,LSm
Figure C.3. Photo and stratigraphic panel of C:02:032 SU 3. Photo is oblique view of trench and not to scale. Facies are indicated in bold.

122
1
543
2
67
1
543
2
67
1
5
4
3
2
6
7
1 m
7) Sand, 7 cm, tabular bedding, contains organiclitter and few very thin clay laminae, vfu-mu sand,rare sandstone pebbles, 2.5YR 5/6, MSSlr
6) Sand, 16 cm, massive, rare pebbles, vfu-mlsand, root bioturbation, 7.5YR 5/6, MRSm
5) Sand, 10 cm thick, irregular bedding,contains organic litter and very thin claylaminae, vfu-mu sand, rare sandstonepebbles, 2.5 YR 5/6, MSSlr
sand
pebbly/gravelly sand
clay/silty clay
4) Sand, 5.5 cm, massive, rare pebbles,vfu-ml sand, root bioturbation, 7.5YR 5/6, MRSm
3) Pebbly sand, 13 cm, sandstone pebble clastsup to 3 cm concentrated at base, normally graded, grades laterally to very coarse gravelly lenses,vfl-mu sand, root bioturbation, 5YR 5/6, LGS
2) Sand, 6.5 cm, laterally discontinuous,planar bedding, vfl-fu at bottom coarsens tovfl-mu at top, rootlet bioturbation, 7.5YR 5/4MSSlr
1) Sand, 32 cm, massive, vfu-ml sand, rarepebbles up to 2 cm, charcoal fragments,rhizocretions and root bioturbation 5YR 5/6, A
root bioturbation
disturbed sediment
charcoal fragments
Planform View of Study Unit 4
Profile A Profile B
FloorHearth
OSL: GLCA‐SU4‐3
Ash Stain
Terrace Front
N
1 meter
Figure C.4. Photo and stratigraphic panel of C:02:032 SU 4 Profile A looking north. Facies are indicated in bold.

123
11b
34
5
6
789
2
9) Sand, 22 cm, massive, 7.5 YR 5/4, MSm
8) Sand with silty clay laminations, 11 cm,5 YR 5/6, MRSm
7) Sand, 4 cm, massive, 7.5 YR 5/4, MSm
6) Sand, 26 cm, massive, 7.5 YR 5/4, MSm
5) Sand with silty clay laminations, 13 cm,5YR 5/6, MSSlr
disturbed sediment
sand
pebbly/gravelly sand
ash stain
clay/ silty clay
4) Sand, 9 cm, capped by mud drape, channel-shaped and lined with mud drapes, 5YR 5/6
3) Sand capped by mud drape, 22 cmmassive, 5 YR 5/6, MSSlr
2) Pebbly sand, 14 cm massive,5 YR 5/6, LGS
1) Pebbly sand, 11 cm sandstone pebbles andgravel at base, 5 YR 5/6, LGS-Capped by unit 1b, ash-stained lens withcharcoal fragments 2-5 mm, 5YR 3/1, A
1 m
1
2
3
4
5
6
8
9
1b
Planform View of Study Unit 4
Profile A Profile B
FloorHearth
OSL: GLCA‐SU4‐3
Ash Stain
Terrace Front
N
7
1 meter
Figure C.5. Photo and stratigraphic panel of C:02:032 SU 4, Profile B, facing north. Facies are indicated in bold.
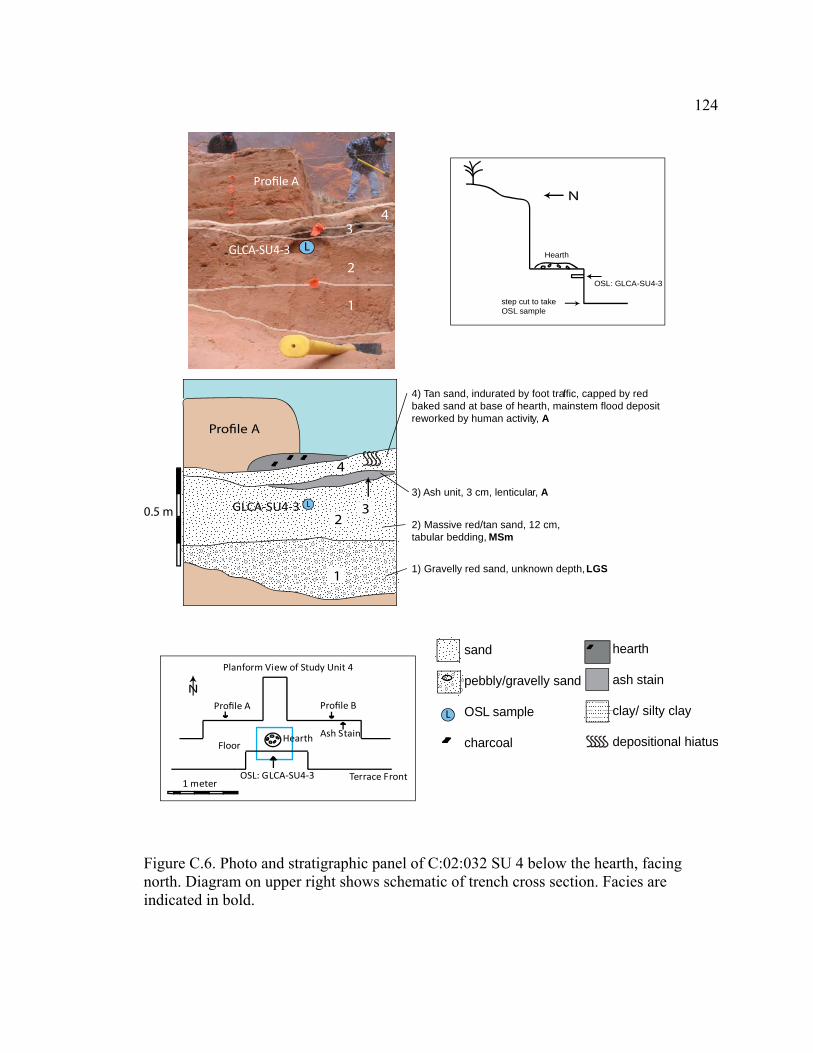
124
3) Ash unit, 3 cm, lenticular, A
1) Gravelly red sand, unknown depth,LGS
2) Massive red/tan sand, 12 cm,tabular bedding, MSm
4) Tan sand, indurated by foot traffic, capped by redbaked sand at base of hearth, mainstem flood depositreworked by human activity, A
GLCA‐SU4‐3
Profile A
1
4
30.5 m
sand
pebbly/gravelly sand
OSL sample
charcoal
hearth
ash stain
clay/ silty clay
depositional hiatus
2L
Planform View of Study Unit 4
Profile A Profile B
FloorHearth
OSL: GLCA‐SU4‐3
Ash Stain
Terrace Front
N
OSL: GLCA-SU4-3
Hearth
step cut to takeOSL sample
N
L
GLCA‐SU4‐3
1
2
34
L
Profile A
1 meter
Figure C.6. Photo and stratigraphic panel of C:02:032 SU 4 below the hearth, facing north. Diagram on upper right shows schematic of trench cross section. Facies are indicated in bold.

125
massive sand
0
0.52
1
3
2
1
3
sand with large cross beds
crinkly-laminated sand
1) Fine sand, 0-17 cm, crinkly-laminated laminationsdipping 31 to 345° imitating dip of bed, 10 YR 6/4
Interpretation: Eolian dune, ES
2) Fine sand, 50-70 cm, planar-tabular cross bedding,wavy and coarsening-up avalanche forests, dipping 30°to 80°, 10 YR 6/4
Interpretation: Eolian dune, ES
3) Sand, 10-20 cm, upper 1 cm is slope-parallel laminated,
10 YR 6/4
Interpretation: Deeply bioturbated top of unit 2,ES
met
ers
N 2 meters
SU3
Feature 1
SU4SU7
SU5
terrace front
mesquite trees & eolian dunes
Figure C.7. Photo and stratigraphic panel of C:13:323 SU 3 1 x 1 meter pit, facing 100°. Facies are indicated in bold.

126
0
0.52
1
2
1
sand with crinkly laminations
met
ers
rhizoliths
root bioturbation
N 2 meters
SU3
Feature 1
SU4SU7
SU5
terrace front
mesquite trees & eolian dunes
2) Sand, 15-20 cm, crinkly laminations dipping 15° NWthroughout and 22 W in top 2 cm, 10YR 6/4Interp: Recent eolian-rainsplash slope sediment orientedalong modern coppice dune sid, ES
1) Silty very fine sand, 35-40 cm, crinkly laminations,variable dip but 6° N in places, many rhizoliths gradingto many roots at top, 10 YR 6/4-Buried, vegetated dune face with eolian ripples, ES
Figure C.8. Photo and stratigraphic panel of C13:323 SU 4 1x1 meter pit, facing 90°. Facies are indicated in bold.
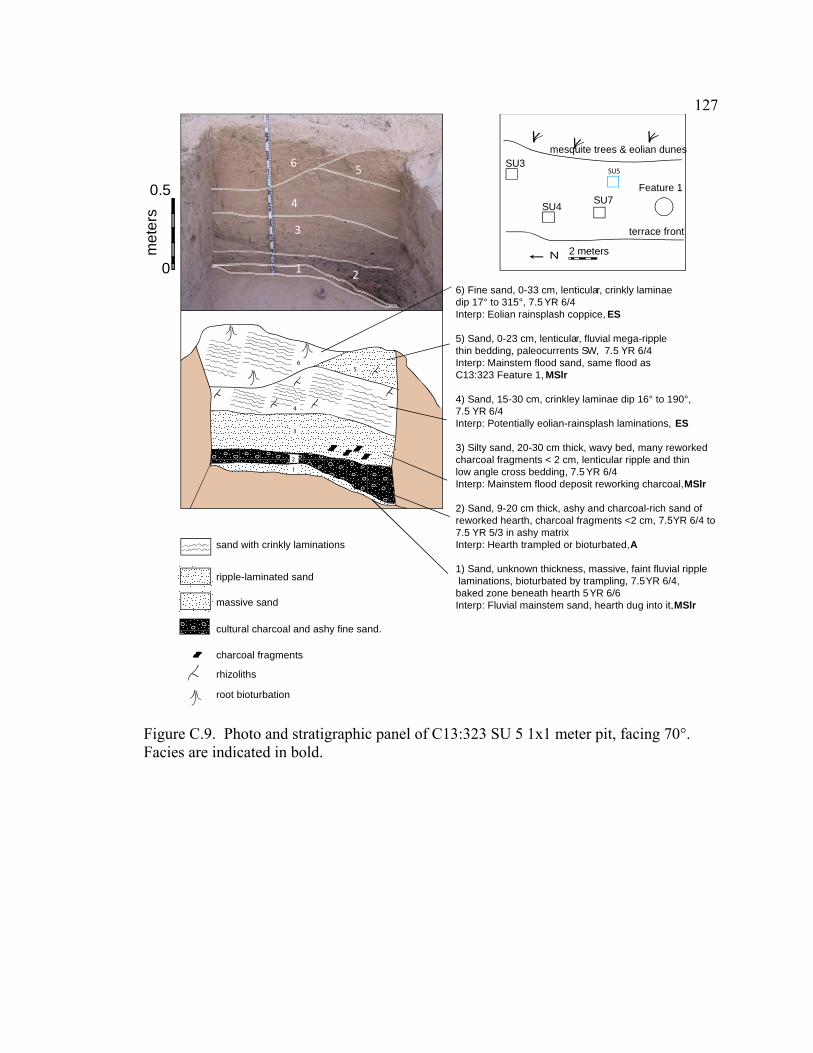
127
6 5
4
3
2
65
3
2
sand with crinkly laminations
ripple-laminated sand
rhizoliths
root bioturbation
massive sand
0
0.5
met
ers
6) Fine sand, 0-33 cm, lenticular, crinkly laminaedip 17° to 315°, 7.5 YR 6/4Interp: Eolian rainsplash coppice, ES
5) Sand, 0-23 cm, lenticular, fluvial mega-ripplethin bedding, paleocurrents SW, 7.5 YR 6/4Interp: Mainstem flood sand, same flood asC13:323 Feature 1, MSlr
4) Sand, 15-30 cm, crinkley laminae dip 16° to 190°,7.5 YR 6/4Interp: Potentially eolian-rainsplash laminations, ES
3) Silty sand, 20-30 cm thick, wavy bed, many reworkedcharcoal fragments < 2 cm, lenticular ripple and thinlow angle cross bedding, 7.5 YR 6/4Interp: Mainstem flood deposit reworking charcoal,MSlr
2) Sand, 9-20 cm thick, ashy and charcoal-rich sand ofreworked hearth, charcoal fragments <2 cm, 7.5YR 6/4 to7.5 YR 5/3 in ashy matrixInterp: Hearth trampled or bioturbated,A
1) Sand, unknown thickness, massive, faint fluvial ripple laminations, bioturbated by trampling, 7.5YR 6/4,baked zone beneath hearth 5YR 6/6Interp: Fluvial mainstem sand, hearth dug into it,MSlr
1
cultural charcoal and ashy fine sand.
1
2
3
4
5
charcoal fragments
N 2 meters
SU3
Feature 1
SU4 SU7
SU5
terrace front
mesquite trees & eolian dunes
Figure C.9. Photo and stratigraphic panel of C13:323 SU 5 1x1 meter pit, facing 70°. Facies are indicated in bold.
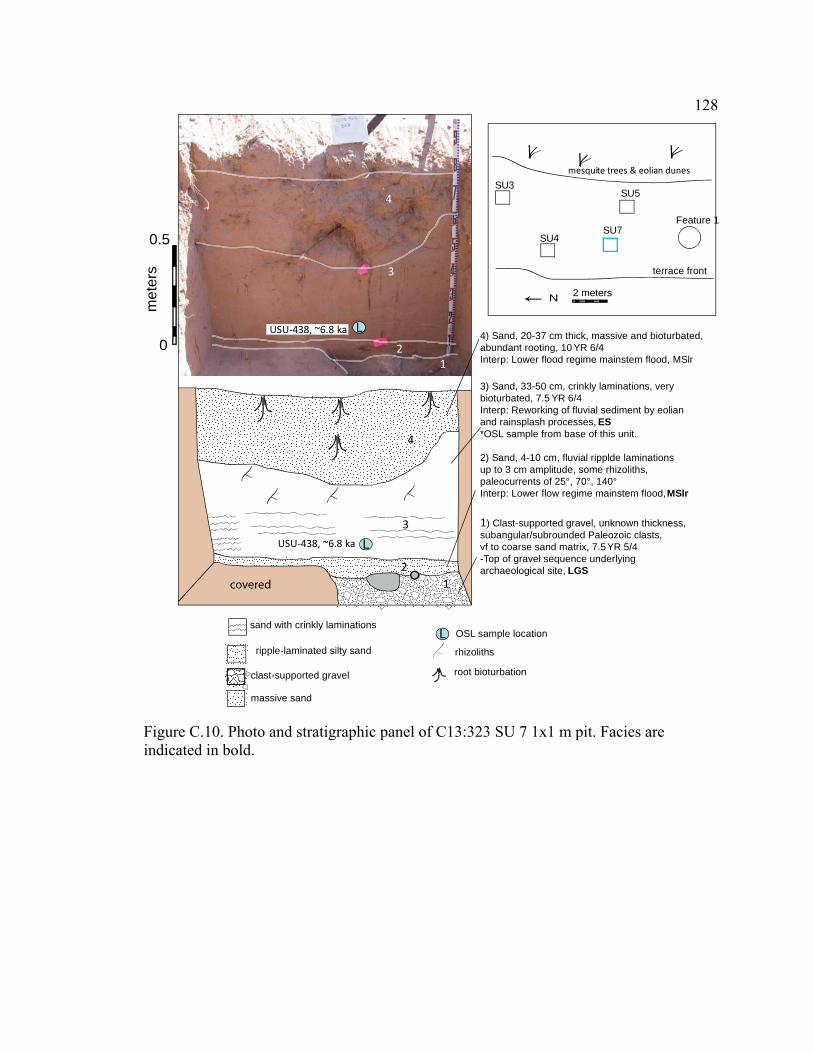
128
0
0.5
2
3
met
ers
4
L
2
3
4
1
sand with crinkly laminations
USU‐438, ~6.8 ka L
covered
1
Lripple-laminated silty sand
clast-supported gravel
OSL sample location
rhizoliths
root bioturbation
massive sand
4) Sand, 20-37 cm thick, massive and bioturbated,abundant rooting, 10 YR 6/4Interp: Lower flood regime mainstem flood, MSlr
3) Sand, 33-50 cm, crinkly laminations, verybioturbated, 7.5 YR 6/4Interp: Reworking of fluvial sediment by eolianand rainsplash processes, ES*OSL sample from base of this unit.
2) Sand, 4-10 cm, fluvial ripplde laminationsup to 3 cm amplitude, some rhizoliths,paleocurrents of 25°, 70°, 140°Interp: Lower flow regime mainstem flood,MSlr
1) Clast-supported gravel, unknown thickness,subangular/subrounded Paleozoic clasts,vf to coarse sand matrix, 7.5YR 5/4-Top of gravel sequence underlyingarchaeological site, LGS
N 2 meters
SU3
Feature 1
SU4SU7
SU5
terrace front
mesquite trees & eolian dunes
USU‐438, ~6.8 ka
Figure C.10. Photo and stratigraphic panel of C13:323 SU 7 1x1 m pit. Facies are indicated in bold.

129
sand with crinkly laminations
ripple-laminated sand
rhizoliths
root bioturbation
massive sand
0
0.5
met
ers
5) Sand, 0-20 cm, wavy laminations, inversely graded,10 YR 6/4Interp: Possibly eolian, has fluvial cross bedding laterally, MSlr
4) Sand, 13-15 cm, 12 ° dip, 1 mm mud cap, ripplelaminae, 150° paleocurrents, trace of charcoal, 10YR 6/4Interp: Mainstem flood event with root bioturbation,MSlr
3) Sand, 20-22 cm, 1 mm mud cap, ripple lamination at base,low angle trough cross bedding to left, trace of charcoal,10 YR 6/4Interp: Mainstem flood deposit with same 12° dip as unit 2,possible transported clasts downslope from hearth,MSlr
2) Sand, 19-24 cm, massive, charcoal, ash and stonescatter at top, 10 YR 6/4Interp: Top contact is living surface, potentially trampled.Charcoal is edge of lens of ash pit that coincides withupslope edge of hearth. Living surface is parallel tobedding, strikes 70° and dips 9° S. A
1) Sand, 0-15 cm, crinkley laminae, vfl-ml sand, 7.5YR 6/4Interp: Mainstem overbank flood deposit,MSlr
charcoal fragments
1
2
3
4
5
1
2
3
4
5
3
4
5
N 2 meters
SU3
Feature 1
SU4SU7
SU5
terrace front
mesquite trees & eolian dunes
SU16
Figure C.11. Photo and stratigraphic panel of C13:323 SU 16 1x1 m pit, facing 70°. Facies are indicated in bold.
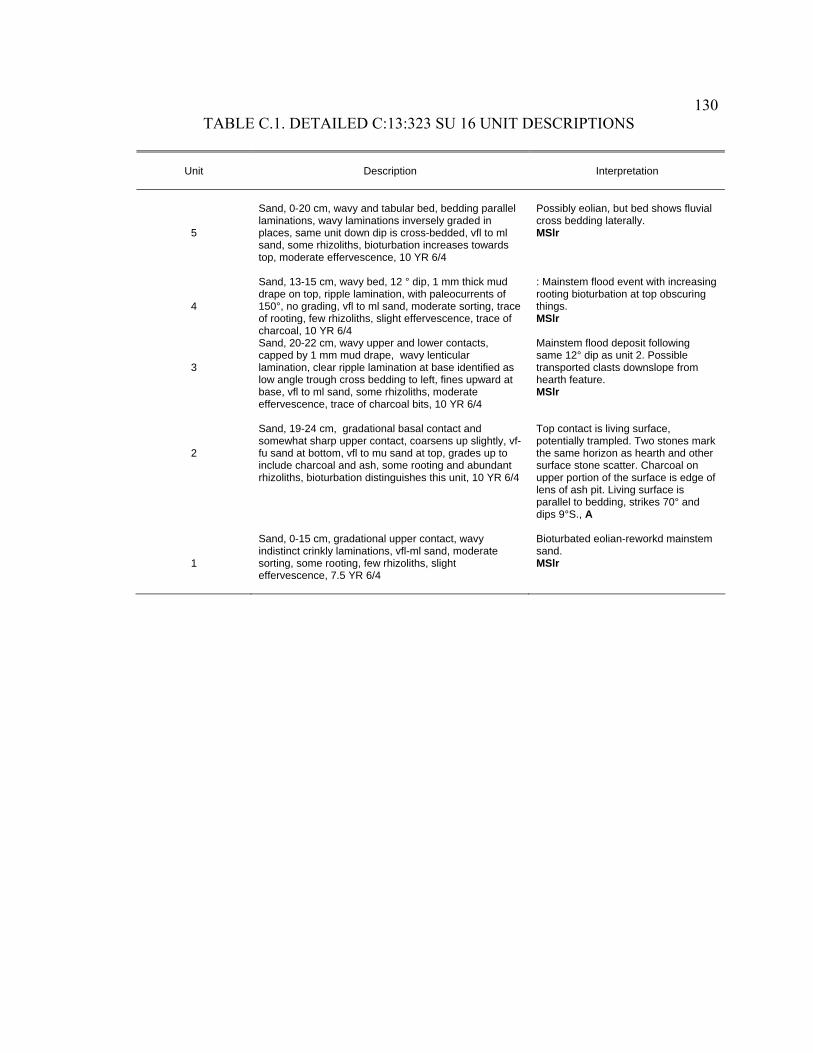
130TABLE C.1. DETAILED C:13:323 SU 16 UNIT DESCRIPTIONS
Unit
Description
Interpretation
5
Sand, 0-20 cm, wavy and tabular bed, bedding parallel laminations, wavy laminations inversely graded in places, same unit down dip is cross-bedded, vfl to ml sand, some rhizoliths, bioturbation increases towards top, moderate effervescence, 10 YR 6/4
Possibly eolian, but bed shows fluvial cross bedding laterally. MSlr
4
Sand, 13-15 cm, wavy bed, 12 ° dip, 1 mm thick mud drape on top, ripple lamination, with paleocurrents of 150°, no grading, vfl to ml sand, moderate sorting, trace of rooting, few rhizoliths, slight effervescence, trace of charcoal, 10 YR 6/4
: Mainstem flood event with increasing rooting bioturbation at top obscuring things. MSlr
3
Sand, 20-22 cm, wavy upper and lower contacts, capped by 1 mm mud drape, wavy lenticular lamination, clear ripple lamination at base identified as low angle trough cross bedding to left, fines upward at base, vfl to ml sand, some rhizoliths, moderate effervescence, trace of charcoal bits, 10 YR 6/4
Mainstem flood deposit following same 12° dip as unit 2. Possible transported clasts downslope from hearth feature. MSlr
2
Sand, 19-24 cm, gradational basal contact and somewhat sharp upper contact, coarsens up slightly, vf-fu sand at bottom, vfl to mu sand at top, grades up to include charcoal and ash, some rooting and abundant rhizoliths, bioturbation distinguishes this unit, 10 YR 6/4
Top contact is living surface, potentially trampled. Two stones mark the same horizon as hearth and other surface stone scatter. Charcoal on upper portion of the surface is edge of lens of ash pit. Living surface is parallel to bedding, strikes 70° and dips 9°S., A
1
Sand, 0-15 cm, gradational upper contact, wavy indistinct crinkly laminations, vfl-ml sand, moderate sorting, some rooting, few rhizoliths, slight effervescence, 7.5 YR 6/4
Bioturbated eolian-reworkd mainstem sand. MSlr
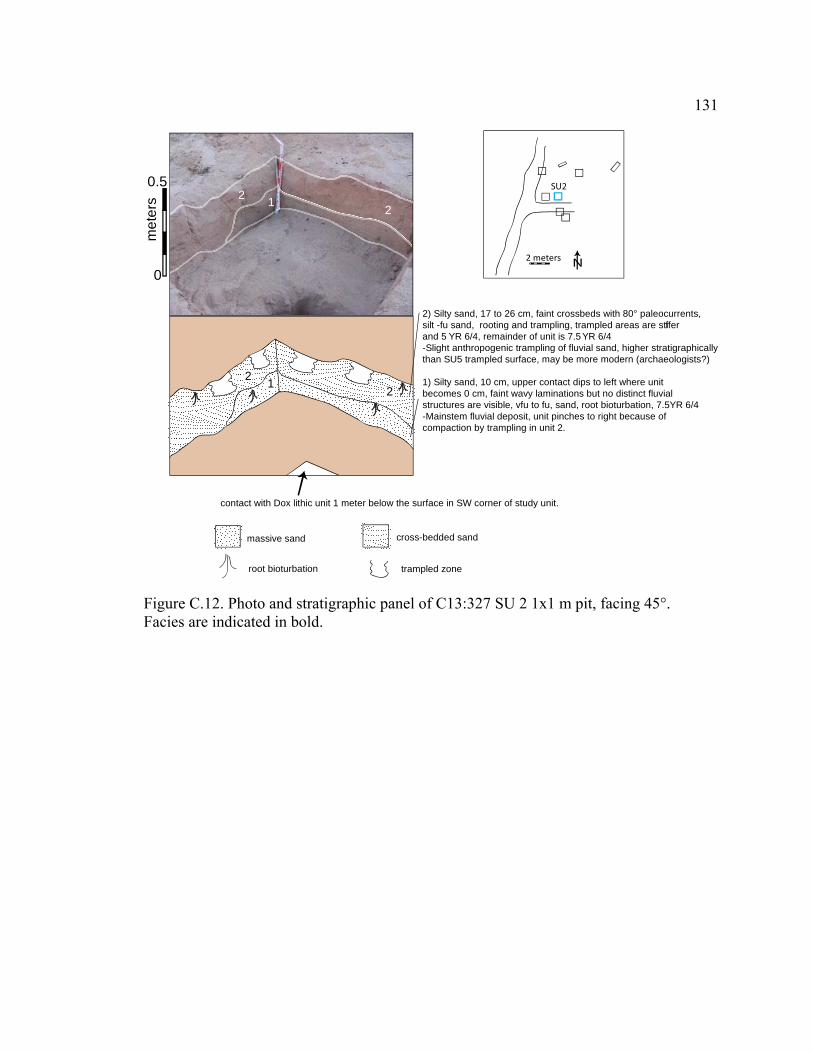
131
0.5
met
ers 1
22
massive sand
trampled zone
SU2
N2 meters
2) Silty sand, 17 to 26 cm, faint crossbeds with 80° paleocurrents,silt -fu sand, rooting and trampling, trampled areas are stifferand 5 YR 6/4, remainder of unit is 7.5 YR 6/4-Slight anthropogenic trampling of fluvial sand, higher stratigraphicallythan SU5 trampled surface, may be more modern (archaeologists?)
1) Silty sand, 10 cm, upper contact dips to left where unitbecomes 0 cm, faint wavy laminations but no distinct fluvialstructures are visible, vfu to fu, sand, root bioturbation, 7.5YR 6/4-Mainstem fluvial deposit, unit pinches to right because ofcompaction by trampling in unit 2.
0
12
2
root bioturbation
contact with Dox lithic unit 1 meter below the surface in SW corner of study unit.
21
cross-bedded sand
Figure C.12. Photo and stratigraphic panel of C13:327 SU 2 1x1 m pit, facing 45°. Facies are indicated in bold.

132
0
0.5m
eter
s
1
2
3
4
2
5
6
1
2
4
5
6
ripple‐laminated sand
rhizoliths
massive sand
charcoal fragments
bone
1
2
3
2
4
5
6
trampled zone
depositional hiatus
6) Silty sand, 5-11 cm, massive, some charcoal and bone ,stiff, 7.5 YR 6/4Interp: Charcoal and bone reworked from unit 4 hearth.Trampling may be historic. A
5) Sand, 0-7 cm, two thin beds of sand with Dox mudat base reversely graded to sand, wavy laminations,faint fluvial ripples, 7.5 YR 6/4Interp: Onlapping mainstem flood backwater deposit,MSlr
4) Silty sand, 17-21 cm, firm zone with peds developed,traces of charcoal, 2 cm ash lens overlying unit, 5YR 6/4Interp: Base is sloping occupation surface with oxidizedzone beneath hearth, compacted by trampling,A
3) Sand, 0-9 cm, basal ripple bedding, coarsens up toinclude Dox lithics, ash stain in lower right 2 cm, 7.5YR 6/4Interp: Indeterminant local versus mainstem wash eventat base, possible eolian-rainsplash laminations near top,MSlr
2) Sand, 8-11 cm, stiff and massive, faint laminae, fewcharcoal bits, string of local Dox lithics, 7.5YR 6/4Interp: Indeterminant fluvial versus eolian with localDox, occupation level same as SU1, LGS or MSm
1) Dox lithic sand, 3-10 cm, massive, 5YR 5/4Interp: Dox lithic sand atop Dox gravel marker bed,LGS
SU3
N2 meters
Figure C.13. Photo and stratigraphic panel of C13:327 SU 3 1x1 meter pit, facing north. Facies are indicated in bold.

133TABLE C.2. DETAILED C:13:327 SU 3 UNIT DESCRIPTIONS
Unit
Description
Interpretation
6
Sand, 5-11 cm, distinct gradual/wavy basal contact, massive/bioturbated to left but on right wall is fluvial/ripple cross-lamination, silty vfu-fl sand, some charcoal detritus and bone entrained within, stiffens to left implying trampling, moderate effervescence, 7.5 YR 6/4
Sand, 5-11 cm, distinct gradual/wavy basal contact, massive/bioturbated to left but on right wall is fluvial/ripple cross-lamination, silty vfu-fl sand, some charcoal detritus and bone entrained within, stiffens to left implying trampling, moderate effervescence, 7.5 YR 6/4
5
Sand, 0-7 cm, wedge/lenticular, sharp contact, two thin beds of sand each with Dox mud at base slightly reversely graded to sand, wavy/lenticular lamination, faint fluvial ripples, fl-cu sand, moderately to poorly sorted with Dox lithics, no rhizoliths, trace rooting, slight effervescence, 7.5 YR 6/4
Onlapping mainstem flood backwater with maybe changing currents to give basal mud to thin sand beds.
4
Sand, 17-21 cm, wavy tabular zone striking due N and dipping 15° W, upper parts of units 2 and 3 that have been bioturbated by trampling, faint original sed structures at base, firm/indurated zone with columnar jointing/peds developed, with color zones following ped columns, vfu to fl silty sand, traces of charcoal, no rhizoliths, few roots, 5.4 YR 6/4 to 5 YR 6/4
Anthropogenic unit following sloping occupation surface, compacted by trampling to right, oxidized zone within unit is less than 15 cm of baked zone beneath hearth feature. Overlying this and coincident with top is 2 cm ash lens.
3
Sand, 0-9 cm, wedge-shaped, upper and lower distinct wavy contacts, basal ripple thin bedding, structures in upper portion are indistinct, normal grading, vfu-vcl sand at base with Dox lithics to vfu to coarse at top, ash stain in lower right 2 cm, no rooting or rhizoliths, slight effervescence, 7.5 YR 6/4
Indeterminate local versus mainstem wash event at base, possible eolian-rainsplash laminations near top.
2
Sand, 8-11 cm, wavy indistinct top contact rises to right, mottled basal contact, stiff and massive, faint lamination, no grading, fl to cl sand, few charcoal bits throughout, no rooting or rhizoliths, likely trampled, moderate effervescence, 7.5 YR 6/4
Indeterminate fluvial versus eolian with local Dox stringer, buried occupation level same as SU1?
1
Sand, 3-10 cm, wavy and gradational mottled upper contact, lower contact not visible, massive, vf-ml sand, ungraded, some rhizoliths, bioturbated, possibly trampled, moderate effervescence, 5 YR 5/4
Dox lithic sand atop thick Dox gravel marker bed.

134
NL
2
1L
Figure C.14. Photo and stratigraphic panel of C13:327 SU 4 1x1 meter pit, facing 85°. Facies are indicated in bold.

135
0.5
met
ers
12
massive sandSU5
N2 meters
0
root bioturbation
5
4
3
2
1
1step
floor
5) Sand, 20 cm, mottled trampling and slope-parallel materialat upper contact, cross beds with paleocurrents of 70° and 140°,vfl-fl silty sand with rare coarse Dox lithics and organics,root ball bioturbation, 7.5 YR 6/4Interp: Fluvial mainstem deposit with some modern trampling on topMSlr
4) Sand, 0 cm-31 cm, massive, silty vfl-cl Dox lithic sand, organicflecks, rooting, bioturbation dominated by root cast, 7.5YR 5/4Interp: Zone of massive bioturbation,MSm
3) Sand, 20-22 cm, cross beds with paleocurrents of 100°, thinbeds of Dox lithics and charcoal, fl-mu sand, frequent rooting andrhizoliths, few charcoal fragments, 7.5YR 5/4Interp: Fluvial mainstem deposition and reworking of charcoal/lithicswith moderate bioturbation, MSlr
2) Sand, 27 cm, cross beds with paleocurrents of 280° andcrinkly laminations, silty vfu- fu sand coarsening up to silty vfu-musand, rhizoliths, rooting and organic flecks, 7.5YR 5/4Interp: Fluvial deposit with coarse fragments from bioturbation ofunit 3. May be >1 flood event, MSlr
1) Sand, 9 cm, crinkly and indistinct wavy laminations, vfu-fu siltysand, rooting and rhizoliths, 5 YR 5/4Interp: Mainstem flood or reworked mainstem sand,MSlr
rhizoliths
2
3
4
5
charcoal
root cast
cross-bedded sand
Figure C.15. Photo and stratigraphic panel of C13:327 SU 5 1x1 meter pit, facing 10°. Facies are indicated in bold.

136TABLE C.3. DETAILED C:13:327 SU 5 UNIT DESCRIPTIONS
Unit
Description
Interpretation
5
Sand, 20 cm, tabular with gradual and slightly wavy upper and lower contact, lower contact is defined by extent of root ball bioturbation and upper contact by mottled trampling and slope-parallel material, cross beds visible with paleocurrents of 70° and 140°, no grading, grain size is vfl to fl silty sand with rare coarse fragments of Dox lithics and organics, slightly effervescent at bottom and not effervescent at top, 7.5 YR 6/4
Fluvial mainstem deposit with some modern trampling on the top. Facies MSlr
4
Sand, 0 cm on left to 31 cm on right, very wavy and indistinct upper and lower contacts, root ball portion is present on right, massive, no grading, silty vfl to cl sand, coarse sand is Dox lithics, poor sorting, rooting, organic fragments present, bioturbation is dominated by root ball, slight effervescence, 7.5 YR 5/4
Zone of massive bioturbation by plant that formed huge root ball. Facies MSm
3
Sand, 20-22 cm, wavy and gradational top and bottom contacts, tabular but top contact dips right, cross beds with paleocurrents of 100°, thin beds of Dox lithics and charcoal, no grading, fl to mu sand, lithic strings are fl to cu sand, poor sorting, frequent rooting and rhizoliths, few charcoal fragments, no effervescence, 7.5 YR 5/4
Fluvial mainstem deposition and reworking of charcoal/lithics with moderate bioturbation. Facies MSlr
2
Sand, 27 cm thick, pinches to right, top contact is wavy and gradational but marked by zone of Dox lithic granules, cross beds and crinkly laminations visible, coarsens up from vfu to fu silty sand at bottom to vfu to mu silty sand at top, frequent rhizoliths, rooting and organic flecks, a few concentrated areas of red sand may be bioturbated mud drapes, slight effervescence, 7.5 YR 5/4
Fluvial deposit with some coarse fragments from bioturbation of unit 3. May represent be more than one flood. Paleocurrents of cross beds are 280°. Facies MSlr
1
Sand, 9 cm, wavy contact at top and gradual contact, bottom of unit is not visible, tabular, color grades from red at bottom to tan at top, crinkly, indistinct wavy laminations, no grading, vfu to fu silty sand, well-sorted, rooting and rhizoliths abundant, slight effervescence, 5 YR 5/4
Bioturbated red sand does not coincide with top of Dox marker. More mainstem flood or reworked sand. Facies MSlr

137
12
0.5
met
ers
massive sand
SU6
N2 meters
0
root bioturbation
rhizoliths
6
5
4
1
3
2
6
5
33
3
charcoal
4
1
33
5
6
6) Sand, 10-30 cm, massive, discontinuous muddrapes, portions of stiff red sand, silty vfu-granule sand, root bioturbation, 7.5YR 6/4Interp: Eolian-reworked surface of mainstem and localmaterial bioturbated by trampling,ESm
5) Sand, 12-18 cm, massive with strings of Dox,slope-parallel contacts, portions of stiff red sand,vfu-cl silty sand coarsens up to vfu- vcl silty sand,rooting and trampling, 7.5YR 6/4Interp: Trampled anthropogenic surface,A
4) Sand, 6-21 cm, thin mud drapes, cross bedsand ripples, charcoal flecks and Dox lithics, silty vfu-mu sand, burrows, 10 YR 6/4Interp: Mainstem flood with tributary influence/redistribution of lithics, MSlr
3) Sand, 2-21 cm, thin mud drape cap, Dox lithicstrings, crinkly laminations, silty vfu-fl sand,charcoal fragments, some rhizoliths, 10YR 6/4Interp: Bioturbated and possibly trampled floodpackages reworking charcoal, A
2) Sand, 2-4 cm, thin mud drape cap, wavy/crinklylaminations, strings of Dox lithics, silty vfu-cu sand,small pebbles and charcoal, rhizoliths, 7.5YR 5/4Interp: Charcoal surface on top of prior livingsurface reworked by flood,A
1) Sand, 2 cm, slab-lined hearth floor, thin mudcap, massive/few wavy laminations, silt-vfusand coarsens up to silt-fu sand, rhizoliths/burrows, stiff portions with charcoal, 7.5 YR 6/4Interp: Flood sand overtopping living surfacefollowed by some trampling,A
sand with wavy/crinklylaminations
trampled zone
slab-lined hearth
2
Figure C.16. Photo and stratigraphic panel of C13:327 SU 6 1x1 meter pit, facing 10°. Facies are indicated in bold. See Table C.3 for detailed unit descriptions.

138TABLE C.4. DETAILED C:13:327 SU 6 UNIT DESCRIPTIONS
Unit
Description
Interpretation
6
Sand, 10-30 cm, wavy bed, roughly slope-parallel basal contact is wavy and sharp with a mud drape, top contact is sharp with eolian-reworked surface material, massive, some internal discontinuous mud drapes, poorly sorted, more lithics than unit 5, middle of this unit is stiff with strong structure, no grading, up to 10% coarse sand to granule-sized lithics, grains size is vfu to granule silty sand, root bioturbation, moderately effervescent, no grading, 7.5 YR 6/4
Bioturbated by trampling, mixture of mainstem and local material, anthropogenic surface before eolian reworking, ES
5
Sand, 12-18 cm, string of Dox, bottom and top contacts are wavy and defined by mud drapes, almost slope-parallel contacts, no visible structures besides concentrations of Dox, portions of stiff red sand, inversely graded from vfu to cl silty sand at bottom to vfu to vcl silty sand at top, higher concentrations of Dox at top than bottom, poorly sorted, root and trampling bioturbation, no visible rhizoliths, all moderately effervescent, 7.5 YR 6/4, Dox lithics are slightly imbricated in places but vary in direction
Interp: Trampling is evident by red, stiff, effervescent areas of sand with strong structure, A
4 Sand, 6-21 cm, pinches to right, overall slop-parallel, both contacts defined by thin mud drapes, cross beds at base, wavy ripples at top and middle, poor sorting, charcoal flecks and Dox lithic granules are present throughout, grain size is vfu to mu silty sand, no grading, some strings of Dox, few rhizoliths, burrow bioturbation, slightly effervescent, 10 YR 6/4
Mainstem flood with slight tributary influence or redistribution of lithics, slight bioturbation but no anthropogenic influence unless unit 5 is trampled portion of this unit, MSlr
3
Sand, 2-21 cm, top contact is very wavy but sharp and defined by mud drape, bottom contact is wavy and more diffuse but can also be defined by mud drape in placed, unit pinches to right/toward river, strings of Dox are present on right like in unit 2, crinkly laminations are present along with a few discontinuous internal mud drapes, grains size is vfu- fl silty sand with no grading and a few charcoal fragments, some rhizoliths, moderate effervescence, same unit to left has stiff, trampled-looking portions on it, 10 YR 6/4
Bioturbated and possibly trampled flood packages reworking charcoal, MSlr/ A
2
Sand, 2-4 cm, wavy bed with charcoal, top and bottom contacts defined by thin mud drapes and are wavy, crinkly laminations and strings of coarse Dox lithics, are present, poorly sorted, no grading, grain size is vfu to cu silty sand, small pebbles (1 cm intermediate diameter) also present, string of Dox concentrated to right (toward river), some rhizoliths and carbonate development, moderately effervescent, 7.5 YR 5/4
Charcoal surface on top of prior living surface, charcoal was reworked by flood, A
1
Sand, 2 cm, floor is slab-lined heart, unit’s top contact is very thin mud drape (slope-parallel)- distinct/sharp but wavy contact, structures are crinkly laminations, otherwise massive, inverse grading, possible because of bioturbation, grain size at bottom is silt to vfu sand, top is silt to fu sand with rare coarse sand Dox lithics, rhizolith and burrow bioturbation, slight effervescence, some areas are stiffer with slightly more effervescence and charcoal, 7.5 YR 6/4
Flood sand overtopping living surface followed by trampling, MSlr/A
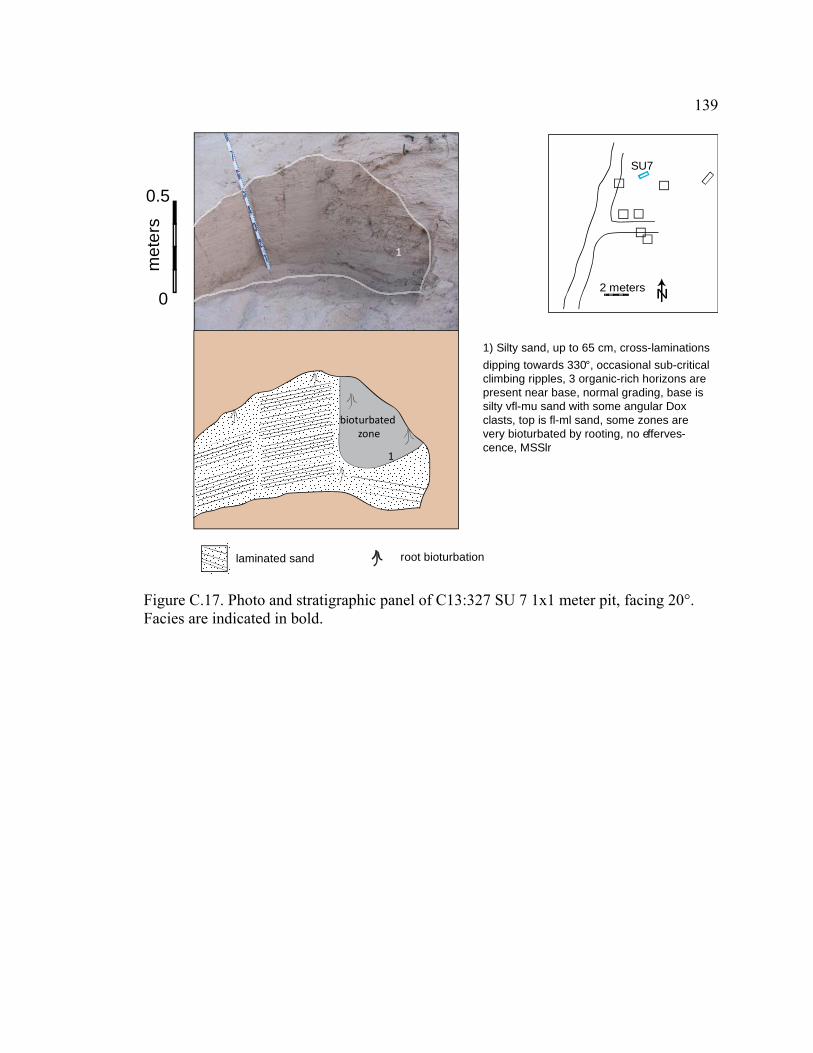
139
0.5
met
ers
laminated sand
SU7
N2 meters0
root bioturbation
1
1
bioturbatedzone
1) Silty sand, up to 65 cm, cross-laminationsdipping towards 330°, occasional sub-criticalclimbing ripples, 3 organic-rich horizons arepresent near base, normal grading, base issilty vfl-mu sand with some angular Doxclasts, top is fl-ml sand, some zones arevery bioturbated by rooting, no efferves-cence, MSSlr
Figure C.17. Photo and stratigraphic panel of C13:327 SU 7 1x1 meter pit, facing 20°. Facies are indicated in bold.

140
0.5
met
ers
massive sandSU8
N2 meters
0
root bioturbation
laminated sand
2
1
3
1
3
L
L
3) Sand, 22 cm, planar laminations at base with ripples migrating to NEabove, vfu to ml sand, faint rodent burrows near base, bioturbated near topby roots, no effervescence.Interp: Mainstem flood deposit, MSlr
2) Silty sand, 50 cm, organic-rich lenses are present in top half of unit, nograding, laminations at bottom dipping to 320°, otherwise massive vfl to mlsand, contains ~3% vcu Dox lithic clasts, very slight effervescence.Interp: Eolian deposit., MSlr
1) Silty sand, 18 cm, faint cross-bedding, laminations dipping to the NE(~45°), no grading, vfl-mu sand, very bioturbated, some modern roots, noeffervescence.Interp: Eolian deposit, Es
2
L OSL sample location
1
USU-440, ?
USU-440, ?
ripple-laminated sand
Figure C.18. Photo and stratigraphic panel of C13:327 SU 8 1x1 meter pit, facing 160°. Facies are indicated in bold.

141
Appendix D: PALEOCURRENT DATA
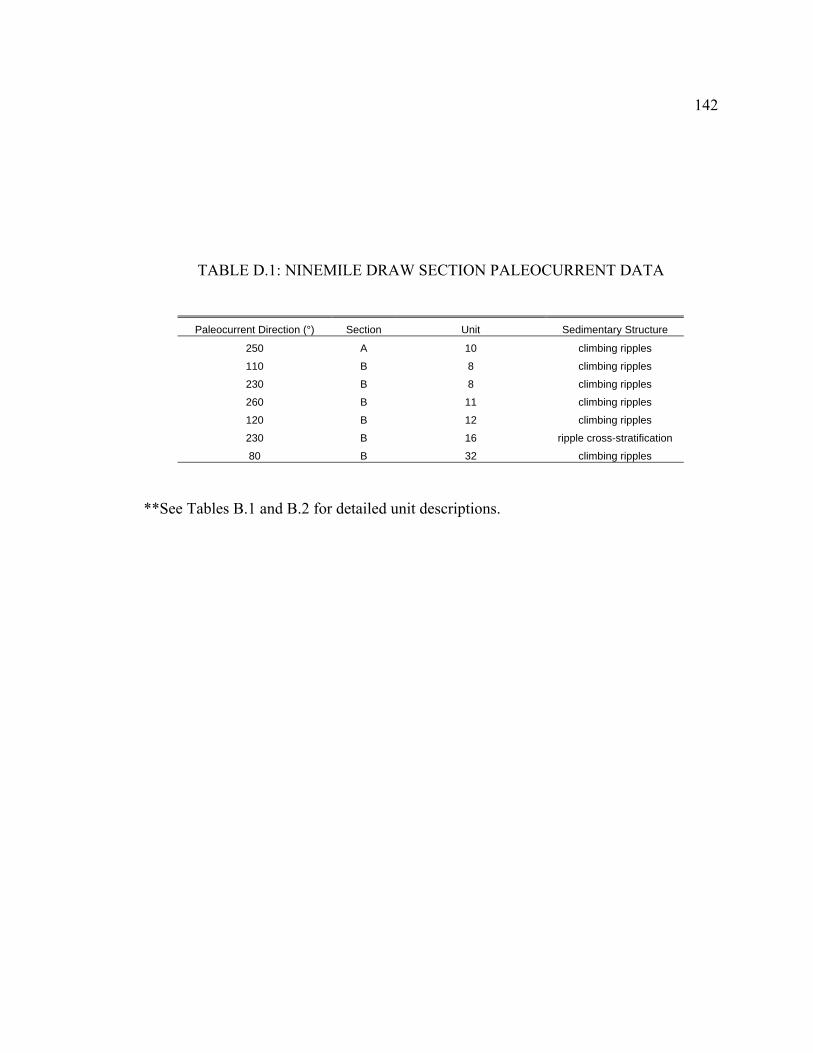
142
TABLE D.1: NINEMILE DRAW SECTION PALEOCURRENT DATA
Paleocurrent Direction (°) Section Unit Sedimentary Structure
250 A 10 climbing ripples
110 B 8 climbing ripples
230 B 8 climbing ripples
260 B 11 climbing ripples
120 B 12 climbing ripples
230 B 16 ripple cross-stratification
80 B 32 climbing ripples
**See Tables B.1 and B.2 for detailed unit descriptions.

143
TABLE D.2: TANNER BAR GEOMORPHIC STUDY PALEOCURRENT DATA
Paleocurrent Direction (°) Sedimentary Structure
175 imbricated channel gravels 185 imbricated channel gravels 205 imbricated channel gravels 130 boulders in foresets 180 imbricated channel gravels 195 imbricated channel gravels 160 imbricated channel gravels 185 imbricated channel gravels
TABLE D.3: TANNER BAR GEOMORPHIC STUDY PALEOCURRENT DATA
Paleocurrent Direction (°) Unit* Sedimentary Structure
290 1 Imbricated Dox lithics 280 2 Imbricated Dox lithics 90 2 Imbricated Dox lithics 90 2 Imbricated Dox lithics 40 2 Imbricated Dox lithics 90 2 Imbricated Dox lithics 70 3 Imbricated Dox lithics 20 5 Imbricated Dox lithics 60 5 Imbricated Dox lithics
100 5 Imbricated Dox lithics 300 6 Imbricated Dox lithics 340 6 Imbricated Dox lithics 300 6 Imbricated Dox lithics 310 6 Imbricated Dox lithics 290 6 Imbricated Dox lithics 260 6 Imbricated Dox lithics
*See Table B.5 for detailed unit descriptions.

144TABLE D.4: TANNER BAR C:13:327 PALEOCURRENT DATA
Paleocurrent Direction Unit*, ** Structure
300 4 climbing ripples, subcritical 310 3 climbing ripples, subcritical 300 3 climbing ripples, subcritical 310 5 climbing ripples, subcritical 250 5 climbing ripples, subcritical 260 12 small cross-beds 240 14 subcritical to supercritical ripples cross bedding 240 18 subcritical climbing ripples 270 20 subcritical climbing ripples 220 20 trough crossbedding 225 23 subcritical climbing ripples 260 23 subcritical climbing ripples 190 24 ripples 215 24 ripples 290 25 imbrication of small Dox lithics 240 25 imbrication of small Dox lithics 235 27 supercritical ripples
0 upper 2.5 m trough crossbedding 350 upper 2.5 m trough crossbedding 280 upper 2.5 m ripples to low angle cross beds 230 upper 2.5 m supercritically climbing ripples 70 upper 2.5 m supercritically climbing ripples
225 upper 2.5 m ripples 250 upper 2.5 m cross beds 240 upper 2.5 m trough crossbedding 95 upper 2.5 m supercritically climbing ripples
320 upper 2.5 m supercritically climbing ripples 290 upper 2.5 m supercritically climbing ripples 350 upper 2.5 m trough crossbedding 280 upper 2.5 m supercritically climbing ripples 280 9 imbrication 320 9 imbrication 250 11 imbrication 350 11 imbrication 360 14 Dox lens within unit 270 15 imbrication 240 15 imbrication 290 upper 2.5 m imbrication 350 upper 2.5 m imbrication 350 upper 2.5 m imbrication 300 upper 2.5 m imbrication
*See Table B.6 for detailed unit descriptions. **Locations of paleocurrent indicator measurements were accidentally omitted in upper ~2.5 m of stratigraphy.

145
Appendix E. OPTICALLY STIMULATED LUMINESCENCE RESULTS

TABLE E.1. OVERVIEW OF PRELIMINARY OSL AGES FROM NINEMILE DRAW
Sample name OSL Sample # location depth (m) # aliquots* dose rate (Gy/ka) De (Gy) age (ka) package
GLCA-10.1L-8 USU-289 Ninemile Draw 0.3 13 2.97 ± 0.13 1.01 ± 0.57 0.34 ± 0.19 VI GLCA-10.1L-
10 USU-457 Ninemile Draw 4.3 12 2.96 ± 0.13 0.78 ± 0.36 0.26 ± 0.12 - GLCA-10.1L-4 USU-283 Ninemile Draw 3.8 10 2.44 ± 0.10 1.95 ± 1.26 0.79 ± 0.52 V GLCA-10.1L-
12 USU-458 Ninemile Draw 3.1 15 2.91 ± 0.13 4.34 ± 2.39 1.48 ± 0.82 IV GLCA-10.1L-7 USU-288 Ninemile Draw 1.2 13 2.45 ± 0.90 6.18 ± 1.56 2.52 ± 0.64 IV GLCA-10.1L-9 USU-355 Ninemile Draw 3.9 12 2.84 ± 0.11 8.64 ± 1.42 3.04 ± 0.52 IV GLCA-10.1L-5 USU-284 Ninemile Draw 6.2 12 1.57 ± 0.06 7.87 ± 3.06 5.01 ± 1.97 III
* Results from samples with <20 aliquots are preliminary.
146

TABLE E.2. OVERVIEW OF PRELIMINARY OSL AGES FROM TANNER BAR
Sample Name OSL Sample
# location depth (m) # aliquots**
dose rate (Gy/ka) De (Gy) age (ka) package
GCGAP-C13327-4 USU-440 C:13:327 SU 8 0.2 6 1.80 ± 0.08 - ± - modern ± - -
GCGAP-C13327-3 USU-439 C:13:327 SU 4 0.6 14 1.82 ± 0.08 1.94 ± 0.62 1.06 ± ±
0.34 V
GCtreat-67L-11 USU-142* C:13:327 gully 3.6 20 2.65 ± 0.12 3.93 ± 1.21 1.48 ± ±
0.13 IV
GCtreat-67L-10 USU-141* C:13:327 gully 4.6 20 3.01 ± 0.13 4.63 ± 1.19 1.50 ± ±
0.11 IV
GCtreat-67L-9 USU-140* C:13:327 gully 5.4 20 2.72 ± 0.12 4.64 ± 1.21 1.71 ± ±
0.13 IV
GC-TB-1 USU-370 C:13:327 gully 5.3 12 4.5 ± 0.20 7.17 ± 2.63 1.60 ± ±
0.59 IV
GC-TB-4 USU-436 Geomorphic study gully 0.6 16 3.12 ± 0.14 16.93 ± 2.12 5.42 ± ±
0.73 III
GCGAP-C13327-1 USU-437 C13:323 SU 7 0.6 16 2.34 ± 0.10 15.96 ± 2.54 6.82 ± ±
1.14 III GC-TB-2 USU-434 Geomorphic study gully 3.1 13 2.75 ± 0.12 23.13 ± 4.73 8.40 ± ± 1.7 II
GCGAP-C13327-2 USU-438 C13:323 basal stratigraphy,
top of gravel sequence 1.6 13 2.16 ± 0.09 24.00 ± 4.50 11.10 ± ±
2.15 I
Gctreat-2 USU-512* Geomorphic study gully 4.5 24 2.83 ± 0.13 33.04 ± 4.38 11.64 ± ±
0.62 I *From previous work by Pederson and Rittenour, published in Damp et al., 2007. Ages are final but detailed results are not reported here. ** Results from samples with <20 aliquots are preliminary.
147

148
GCLA-10.L-4 Ninemile Draw Package D De (Gy) Error Age (ka) ±USU-283 0.26 1.07 0.10 0.07
De (Gy) ± Age (ka) ± 0.80 2.78 0.32 0.21wt Mean = 1.95 1.26 0.8 0.5 0.94 2.21 0.38 0.25
1.64 6.76 0.67 0.431.78 2.39 0.72 0.47
Median = 1.81 0.7 0.5 1.84 2.64 0.75 0.49Min = 0.26 0.1 0.1 1.92 2.93 0.78 0.51Max = 4.31 1.8 1.1 2.23 1.06 0.91 0.59
3.78 1.97 1.54 1.00S.D. = 1.26 used here 4.31 8.59 1.76 1.14Standard error = 0.40
Random Errors= 64.81 %Systematic Error= 4.70 %Total Error= 64.98 %
Bin Width = 0 Gyn = 10 Disks
+/-dose rate= 2.45 0.12 Gy/kaU = 0.80 0.1 ppmTh = 7.50 0.7 ppmK2O = 2.04 0.05 wt. %Rb2O= 43.7 1.7 ppmH2O= 3.5 3.5 wt. %
Cosmic= 0.14 Gy/kadepth = 3.7 mlatitude= 36 degrees (north positive)longitude= -111 degrees (east positive)elevation= 0.94 km asl
Sample descript: Unit 1 in Ninemile Draw Package D, laminated silty sand
UTM 12, 248262E, 652870 N
Histogram
0
1
2
3
4
0.0
0.5
1.0
1.5
2.0
2.5
3.0
3.5
4.0
4.5
10.0
De (Gy)
Freq
uenc
y
Cumulative Probability Curve
0.0
1.0
2.0
3.0
4.0
5.0
6.0
-5 0 5 10De (Gy)
Pro
babi
lity
sum
Sum of W td De's
Average W td De's
De's and errors
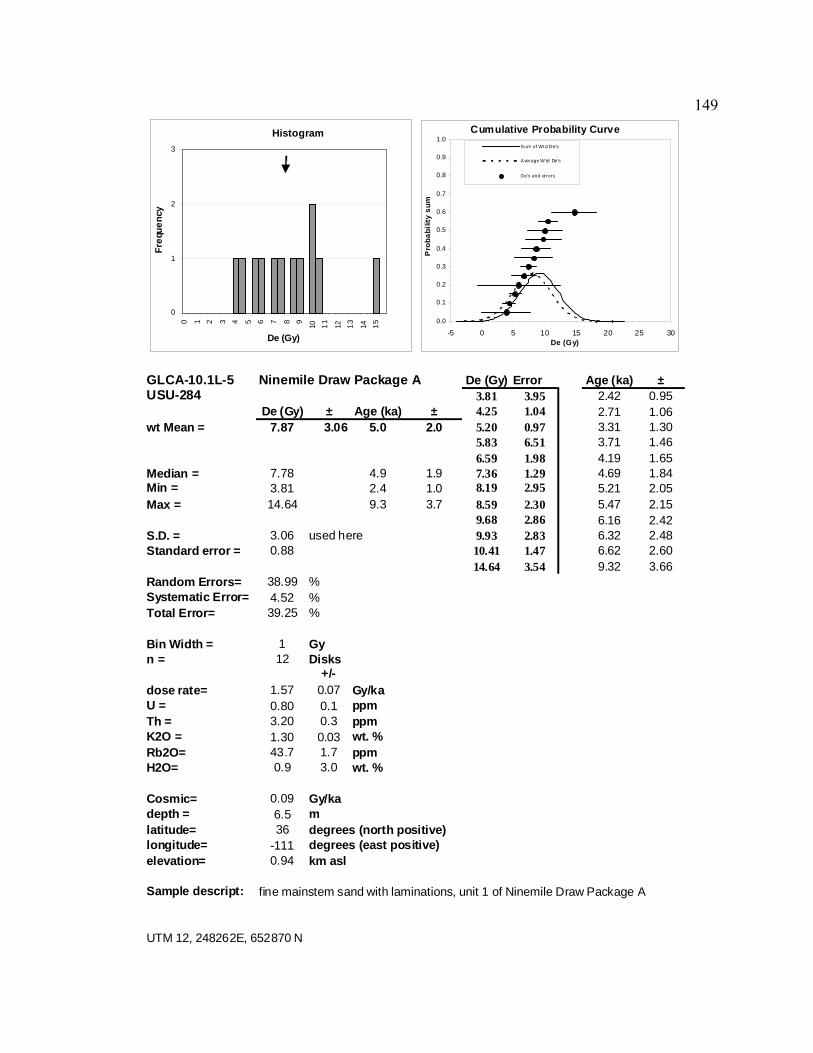
149
GLCA-10.1L-5 Ninemile Draw Package A De (Gy) Error Age (ka) ±USU-284 3.81 3.95 2.42 0.95
De (Gy) ± Age (ka) ± 4.25 1.04 2.71 1.06wt Mean = 7.87 3.06 5.0 2.0 5.20 0.97 3.31 1.30
5.83 6.51 3.71 1.466.59 1.98 4.19 1.65
Median = 7.78 4.9 1.9 7.36 1.29 4.69 1.84Min = 3.81 2.4 1.0 8.19 2.95 5.21 2.05Max = 14.64 9.3 3.7 8.59 2.30 5.47 2.15
9.68 2.86 6.16 2.42S.D. = 3.06 used here 9.93 2.83 6.32 2.48Standard error = 0.88 10.41 1.47 6.62 2.60
14.64 3.54 9.32 3.66Random Errors= 38.99 %Systematic Error= 4.52 %Total Error= 39.25 %
Bin Width = 1 Gyn = 12 Disks
+/-dose rate= 1.57 0.07 Gy/kaU = 0.80 0.1 ppmTh = 3.20 0.3 ppmK2O = 1.30 0.03 wt. %Rb2O= 43.7 1.7 ppmH2O= 0.9 3.0 wt. %
Cosmic= 0.09 Gy/kadepth = 6.5 mlatitude= 36 degrees (north positive)longitude= -111 degrees (east positive)elevation= 0.94 km asl
Sample descript: fine mainstem sand with laminations, unit 1 of Ninemile Draw Package A
UTM 12, 248262E, 652870 N
Histogram
0
1
2
3
0 1 2 3 4 5 6 7 8 9 10 11 12 13 14 15
De (Gy)
Freq
uenc
y
Cumulative Probability Curve
0.0
0.1
0.2
0.3
0.4
0.5
0.6
0.7
0.8
0.9
1.0
-5 0 5 10 15 20 25 30De (Gy)
Pro
babi
lity
sum
Sum of Wtd De's
Average W td De's
De's and errors
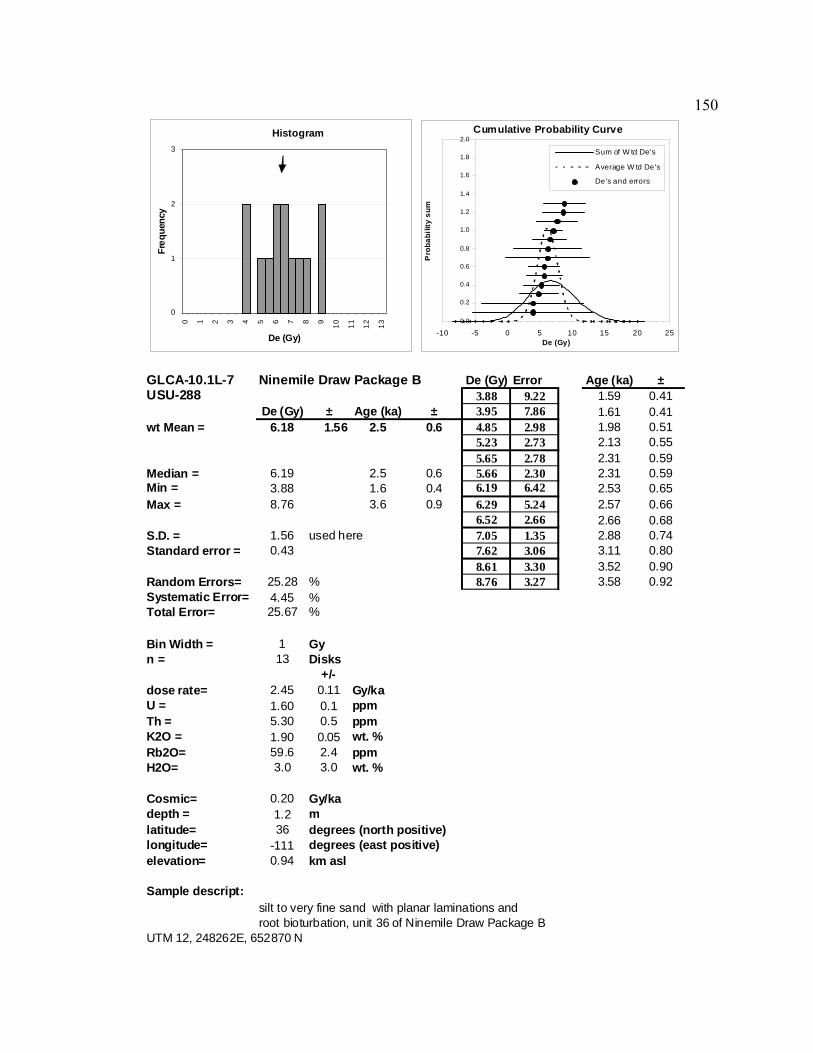
150
GLCA-10.1L-7 Ninemile Draw Package B De (Gy) Error Age (ka) ±USU-288 3.88 9.22 1.59 0.41
De (Gy) ± Age (ka) ± 3.95 7.86 1.61 0.41wt Mean = 6.18 1.56 2.5 0.6 4.85 2.98 1.98 0.51
5.23 2.73 2.13 0.555.65 2.78 2.31 0.59
Median = 6.19 2.5 0.6 5.66 2.30 2.31 0.59Min = 3.88 1.6 0.4 6.19 6.42 2.53 0.65Max = 8.76 3.6 0.9 6.29 5.24 2.57 0.66
6.52 2.66 2.66 0.68S.D. = 1.56 used here 7.05 1.35 2.88 0.74Standard error = 0.43 7.62 3.06 3.11 0.80
8.61 3.30 3.52 0.90Random Errors= 25.28 % 8.76 3.27 3.58 0.92Systematic Error= 4.45 %Total Error= 25.67 %
Bin Width = 1 Gyn = 13 Disks
+/-dose rate= 2.45 0.11 Gy/kaU = 1.60 0.1 ppmTh = 5.30 0.5 ppmK2O = 1.90 0.05 wt. %Rb2O= 59.6 2.4 ppmH2O= 3.0 3.0 wt. %
Cosmic= 0.20 Gy/kadepth = 1.2 mlatitude= 36 degrees (north positive)longitude= -111 degrees (east positive)elevation= 0.94 km asl
Sample descript:
UTM 12, 248262E, 652870 N
silt to very fine sand with planar laminations and root bioturbation, unit 36 of Ninemile Draw Package B
Histogram
0
1
2
3
0 1 2 3 4 5 6 7 8 9 10 11 12 13
De (Gy)
Freq
uenc
y
Cumulative Probability Curve
0.0
0.2
0.4
0.6
0.8
1.0
1.2
1.4
1.6
1.8
2.0
-10 -5 0 5 10 15 20 25De (Gy)
Pro
babi
lity
sum
Sum of W td De's
Average W td De's
De's and errors

151
GLCA-10.1L-8 Ninemile Draw Package D De (Gy) Error Age (ka) ±USU-289 0.46 3.76 0.16 0.09
De (Gy) ± Age (ka) ± 0.49 3.28 0.17 0.09wt Mean = 1.01 0.57 0.3 0.2 0.56 2.25 0.19 0.11
0.61 5.26 0.20 0.12Peak fit = 0.63 3.59 0.21 0.12Median = 0.85 0.3 0.2 0.85 2.02 0.29 0.16Min = 0.46 0.2 0.1 0.85 7.49 0.29 0.16Max = 2.24 0.8 0.4 0.94 2.11 0.31 0.18
0.95 3.12 0.32 0.18S.D. = 0.57 used here 0.98 2.65 0.33 0.19Standard error = 0.16 1.59 4.00 0.54 0.31
1.99 5.42 0.67 0.38Random Errors= 56.81 % 2.24 1.24 0.75 0.43Systematic Error= 4.41 %Total Error= 56.99 %
Bin Width = 0 Gyn = 13 Disks
+/-dose rate= 2.97 0.13 Gy/kaU = 2.30 0.2 ppmTh = 7.60 0.7 ppmK2O = 2.11 0.05 wt. %Rb2O= 69.9 2.8 ppmH2O= 3.0 3.0 wt. %
Cosmic= 0.24 Gy/kadepth = 0.3 mlatitude= 36 degrees (north positive)longitude= -111 degrees (east positive)elevation= 0.94 km asl
Sample descript: silty sand with planar laminations in unit 6 of Ninemile Draw package D
UTM 12, 248262E, 652870 N
Histogram
0
1
2
3
4
5
6
0.0
0.5
1.0
1.5
2.0
2.5
3.0
3.5
4.0
De (Gy)
Freq
uenc
y
Cumulative Probability Curve
0.0
2.0
4.0
6.0
8.0
10.0
12.0
-2 0 2 4 6 8 10De (Gy)
Pro
babi
lity
sum
Sum of Wtd De's
Average Wtd De's
De's and errors

152
GLCA-10.1L-9 Ninemile Draw Package B De (Gy) Error Age (ka) ±USU-355 6.62 2.29 2.33 0.40
De (Gy) ± Age (ka) ± 6.87 4.59 2.42 0.42wt Mean = 8.64 1.42 3.0 0.5 6.97 2.72 2.45 0.42
7.66 1.51 2.70 0.47Peak fit = 7.90 1.31 2.78 0.48Median = 8.46 3.0 0.5 7.90 1.31 2.78 0.48Min = 6.62 2.3 0.4 8.46 1.84 2.98 0.51Max = 11.21 3.9 0.7 8.46 1.84 2.98 0.51
8.48 0.76 2.99 0.52S.D. = 1.42 used here 8.76 0.68 3.08 0.53Standard error = 0.39 9.39 4.54 3.31 0.57
9.61 1.17 3.38 0.58Random Errors= 16.66 % 10.12 0.60 3.56 0.61Systematic Error= 4.45 % 10.20 2.16 3.59 0.62Total Error= 17.25 % 11.21 2.45 3.94 0.68
Bin Width = 1 Gyn = 13 Disks
+/-dose rate= 2.84 0.13 Gy/kaU = 2.30 0.2 ppmTh = 7.90 0.7 ppmK2O = 2.05 0.05 wt. %Rb2O= 78.6 3.1 ppmH2O= 3.0 3.0 wt. %
Cosmic= 0.13 Gy/kadepth = 3.9 mlatitude= 36 degrees (north positive)longitude= -111 degrees (east positive)elevation= 0.94 km asl
Sample descript:
UTM 12, 248262E, 652870 N
Bottom of Ninemile Draw package B, in very fine mainstem sandwith climbing ripples and cross-beds
Histogram
0
1
2
3
4
6 7 8 9 10 11 12
De (Gy)
Freq
uenc
y
Cumulative Probability Curve
0.0
2.0
4.0
6.0
8.0
10.0
12.0
14.0
0 5 10 15 20De (Gy)
Pro
babi
lity
sum
Sum of Wtd De's
Average Wtd De's
De's and errors
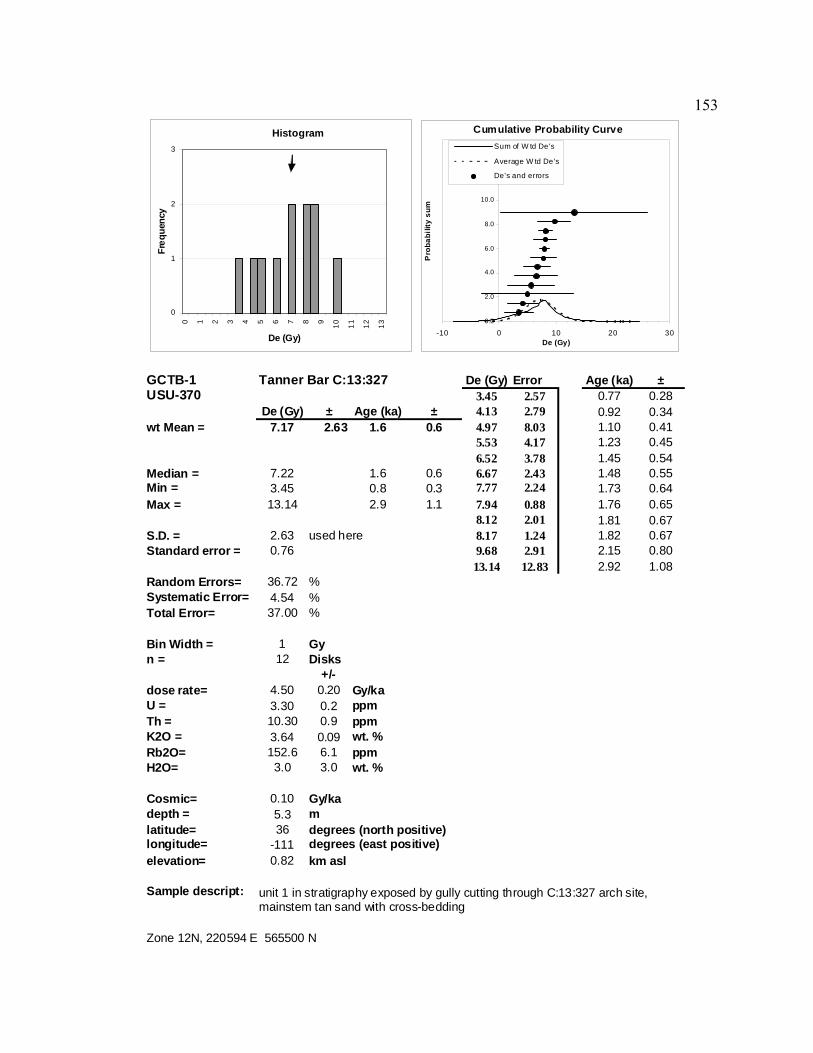
153
GCTB-1 Tanner Bar C:13:327 De (Gy) Error Age (ka) ±USU-370 3.45 2.57 0.77 0.28
De (Gy) ± Age (ka) ± 4.13 2.79 0.92 0.34wt Mean = 7.17 2.63 1.6 0.6 4.97 8.03 1.10 0.41
5.53 4.17 1.23 0.456.52 3.78 1.45 0.54
Median = 7.22 1.6 0.6 6.67 2.43 1.48 0.55Min = 3.45 0.8 0.3 7.77 2.24 1.73 0.64Max = 13.14 2.9 1.1 7.94 0.88 1.76 0.65
8.12 2.01 1.81 0.67S.D. = 2.63 used here 8.17 1.24 1.82 0.67Standard error = 0.76 9.68 2.91 2.15 0.80
13.14 12.83 2.92 1.08Random Errors= 36.72 %Systematic Error= 4.54 %Total Error= 37.00 %
Bin Width = 1 Gyn = 12 Disks
+/-dose rate= 4.50 0.20 Gy/kaU = 3.30 0.2 ppmTh = 10.30 0.9 ppmK2O = 3.64 0.09 wt. %Rb2O= 152.6 6.1 ppmH2O= 3.0 3.0 wt. %
Cosmic= 0.10 Gy/kadepth = 5.3 mlatitude= 36 degrees (north positive)longitude= -111 degrees (east positive)elevation= 0.82 km asl
Sample descript:
Zone 12N, 220594 E 565500 N
unit 1 in stratigraphy exposed by gully cutting through C:13:327 arch site, mainstem tan sand with cross-bedding
Histogram
0
1
2
3
0 1 2 3 4 5 6 7 8 9 10 11 12 13
De (Gy)
Freq
uenc
y
Cumulative Probability Curve
0.0
2.0
4.0
6.0
8.0
10.0
12.0
14.0
-10 0 10 20 30De (Gy)
Pro
babi
lity
sum
Sum of W td De's
Average W td De's
De's and errors
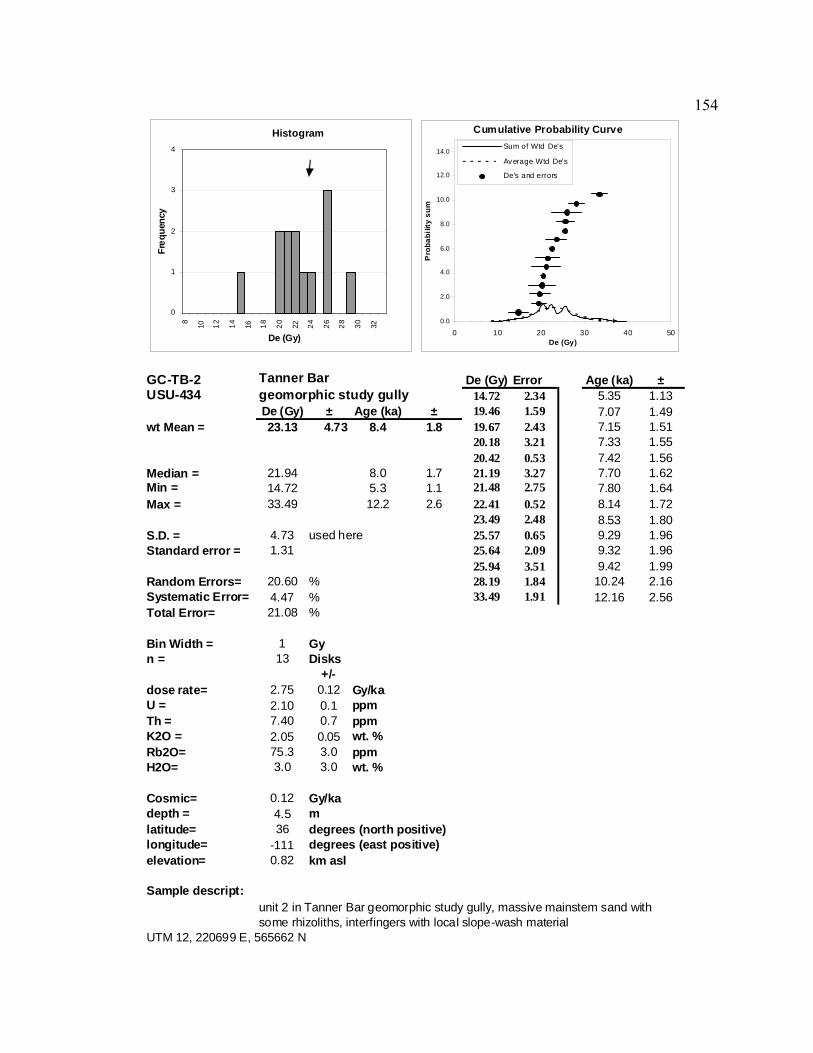
154
GC-TB-2 De (Gy) Error Age (ka) ±USU-434 14.72 2.34 5.35 1.13
De (Gy) ± Age (ka) ± 19.46 1.59 7.07 1.49wt Mean = 23.13 4.73 8.4 1.8 19.67 2.43 7.15 1.51
20.18 3.21 7.33 1.5520.42 0.53 7.42 1.56
Median = 21.94 8.0 1.7 21.19 3.27 7.70 1.62Min = 14.72 5.3 1.1 21.48 2.75 7.80 1.64Max = 33.49 12.2 2.6 22.41 0.52 8.14 1.72
23.49 2.48 8.53 1.80S.D. = 4.73 used here 25.57 0.65 9.29 1.96Standard error = 1.31 25.64 2.09 9.32 1.96
25.94 3.51 9.42 1.99Random Errors= 20.60 % 28.19 1.84 10.24 2.16Systematic Error= 4.47 % 33.49 1.91 12.16 2.56Total Error= 21.08 %
Bin Width = 1 Gyn = 13 Disks
+/-dose rate= 2.75 0.12 Gy/kaU = 2.10 0.1 ppmTh = 7.40 0.7 ppmK2O = 2.05 0.05 wt. %Rb2O= 75.3 3.0 ppmH2O= 3.0 3.0 wt. %
Cosmic= 0.12 Gy/kadepth = 4.5 mlatitude= 36 degrees (north positive)longitude= -111 degrees (east positive)elevation= 0.82 km asl
Sample descript:
UTM 12, 220699 E, 565662 N
Tanner Bar geomorphic study gully
unit 2 in Tanner Bar geomorphic study gully, massive mainstem sand with some rhizoliths, interfingers with local slope-wash material
Histogram
0
1
2
3
4
8 10 12 14 16 18 20 22 24 26 28 30 32
De (Gy)
Freq
uenc
y
Cumulative Probability Curve
0.0
2.0
4.0
6.0
8.0
10.0
12.0
14.0
0 10 20 30 40 50De (Gy)
Pro
babi
lity
sum
Sum of Wtd De's
Average Wtd De's
De's and errors
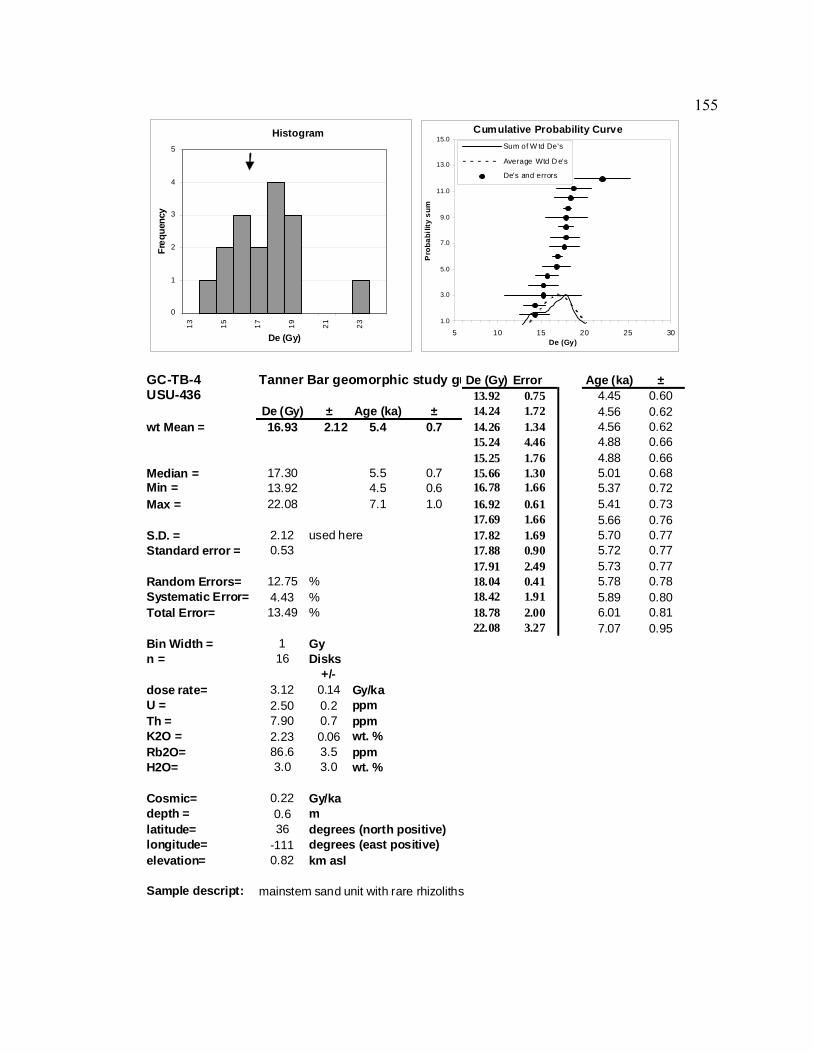
155
GC-TB-4 Tanner Bar geomorphic study guDe (Gy) Error Age (ka) ±USU-436 13.92 0.75 4.45 0.60
De (Gy) ± Age (ka) ± 14.24 1.72 4.56 0.62wt Mean = 16.93 2.12 5.4 0.7 14.26 1.34 4.56 0.62
15.24 4.46 4.88 0.6615.25 1.76 4.88 0.66
Median = 17.30 5.5 0.7 15.66 1.30 5.01 0.68Min = 13.92 4.5 0.6 16.78 1.66 5.37 0.72Max = 22.08 7.1 1.0 16.92 0.61 5.41 0.73
17.69 1.66 5.66 0.76S.D. = 2.12 used here 17.82 1.69 5.70 0.77Standard error = 0.53 17.88 0.90 5.72 0.77
17.91 2.49 5.73 0.77Random Errors= 12.75 % 18.04 0.41 5.78 0.78Systematic Error= 4.43 % 18.42 1.91 5.89 0.80Total Error= 13.49 % 18.78 2.00 6.01 0.81
22.08 3.27 7.07 0.95Bin Width = 1 Gyn = 16 Disks
+/-dose rate= 3.12 0.14 Gy/kaU = 2.50 0.2 ppmTh = 7.90 0.7 ppmK2O = 2.23 0.06 wt. %Rb2O= 86.6 3.5 ppmH2O= 3.0 3.0 wt. %
Cosmic= 0.22 Gy/kadepth = 0.6 mlatitude= 36 degrees (north positive)longitude= -111 degrees (east positive)elevation= 0.82 km asl
Sample descript: mainstem sand unit with rare rhizoliths
Histogram
0
1
2
3
4
5
13 15 17 19 21 23
De (Gy)
Freq
uenc
y
Cumulative Probability Curve
1.0
3.0
5.0
7.0
9.0
11.0
13.0
15.0
5 10 15 20 25 30De (Gy)
Pro
babi
lity
sum
Sum of W td De's
Average Wtd D e's
De's and errors

156
GCGAP-C13323-1 Tanner Bar C:13:323, SU 4 De (Gy) Error Age (ka) ±USU-437 11.91 2.04 5.09 0.85
De (Gy) ± Age (ka) ± 13.01 2.67 5.56 0.93wt Mean = 15.96 2.54 6.8 1.1 13.05 2.29 5.58 0.93
13.79 1.09 5.90 0.9814.18 1.76 6.06 1.01
Median = 15.67 6.7 1.1 15.01 1.61 6.42 1.07Min = 11.91 5.1 0.9 15.27 1.23 6.53 1.09Max = 20.68 8.8 1.5 15.46 2.15 6.61 1.10
15.88 2.98 6.79 1.13S.D. = 2.54 used here 16.53 3.44 7.07 1.18Standard error = 0.64 16.70 0.60 7.14 1.19
17.27 2.67 7.38 1.23Random Errors= 16.10 % 17.31 3.72 7.40 1.24Systematic Error= 4.44 % 19.41 1.41 8.30 1.39Total Error= 16.70 % 19.89 1.94 8.50 1.42
20.68 2.62 8.84 1.48Bin Width = 1 Gyn = 16 Disks
+/-dose rate= 2.34 0.10 Gy/kaU = 1.50 0.1 ppmTh = 4.80 0.4 ppmK2O = 1.81 0.05 wt. %Rb2O= 64.2 2.6 ppmH2O= 3.0 3.0 wt. %
Cosmic= 0.22 Gy/kadepth = 0.6 mlatitude= 36 degrees (north positive)longitude= -111 degrees (east positive)elevation= 0.82 km asl
Sample descript: unit 2 of C:13:323 SU 7, mainstem sand with crinkly laminations
UTM 12, 220721 E,565809 N
Histogram
0
1
2
3
4
5
0 2 4 6 8 10 12 14 16 18 20 22 24 26 28 30
De (Gy)
Freq
uenc
y
Cumulative Probability Curve
0.0
2.0
4.0
6.0
8.0
10.0
12.0
14.0
16.0
0 5 10 15 20 25 30De (Gy)
Pro
babi
lity
sum
Sum of W td De's
Average Wtd D e's
De's and errors

157
GCGAP-C13323-2 C:13:323 underneath arch site De (Gy) Error Age (ka) ±USU-438 15.41 2.36 7.12 1.38
De (Gy) ± Age (ka) ± 20.22 0.51 9.35 1.82wt Mean = 24.00 4.50 11.1 2.2 21.10 1.59 9.76 1.89
21.26 4.48 9.83 1.9121.77 1.27 10.07 1.95
Median = 23.42 10.8 2.1 22.44 1.40 10.38 2.01Min = 15.41 7.1 1.4 23.42 3.01 10.83 2.10Max = 31.97 14.8 2.9 24.59 0.77 11.37 2.21
25.05 1.74 11.58 2.25S.D. = 4.50 used here 25.75 1.91 11.91 2.31Standard error = 1.25 28.43 1.38 13.15 2.55
30.61 0.83 14.16 2.75Random Errors= 18.89 % 31.97 5.27 14.79 2.87Systematic Error= 4.44 %Total Error= 19.41 %
Bin Width = 1 Gyn = 13 Disks
+/-dose rate= 2.16 0.09 Gy/kaU = 1.50 0.1 ppmTh = 4.60 0.4 ppmK2O = 1.65 0.04 wt. %Rb2O= 65.1 2.6 ppmH2O= 3.0 3.0 wt. %
Cosmic= 0.18 Gy/kadepth = 1.6 mlatitude= 36 degrees (north positive)longitude= -111 degrees (east positive)elevation= 0.82 km asl
Sample descript: mainstem sand interbedded with imbricated channel gravels
UTM 12, 220724 E, 565724 N
Histogram
0
1
2
3
4
10 12 14 16 18 20 22 24 26 28 30 32
De (Gy)
Freq
uenc
y
Cumulative Probability Curve
0.0
0.2
0.4
0.6
0.8
1.0
1.2
1.4
1.6
1.8
2.0
10 15 20 25 30 35 40De (Gy)
Pro
babi
lity
sum
Sum of W td De's
Average W td De's
De's and errors
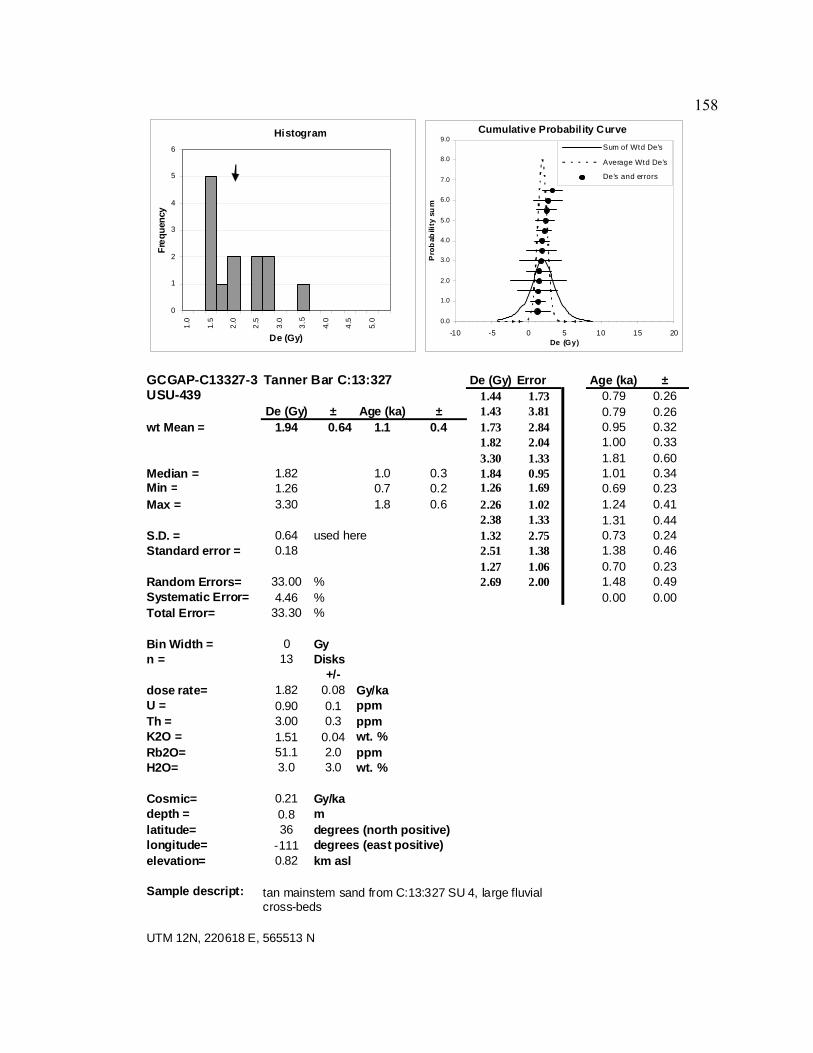
158
GCGAP-C13327-3 Tanner Bar C:13:327 De (Gy) Error Age (ka) ±USU-439 1.44 1.73 0.79 0.26
De (Gy) ± Age (ka) ± 1.43 3.81 0.79 0.26wt Mean = 1.94 0.64 1.1 0.4 1.73 2.84 0.95 0.32
1.82 2.04 1.00 0.333.30 1.33 1.81 0.60
Median = 1.82 1.0 0.3 1.84 0.95 1.01 0.34Min = 1.26 0.7 0.2 1.26 1.69 0.69 0.23Max = 3.30 1.8 0.6 2.26 1.02 1.24 0.41
2.38 1.33 1.31 0.44S.D. = 0.64 used here 1.32 2.75 0.73 0.24Standard error = 0.18 2.51 1.38 1.38 0.46
1.27 1.06 0.70 0.23Random Errors= 33.00 % 2.69 2.00 1.48 0.49Systematic Error= 4.46 % 0.00 0.00Total Error= 33.30 %
Bin Width = 0 Gyn = 13 Disks
+/-dose rate= 1.82 0.08 Gy/kaU = 0.90 0.1 ppmTh = 3.00 0.3 ppmK2O = 1.51 0.04 wt. %Rb2O= 51.1 2.0 ppmH2O= 3.0 3.0 wt. %
Cosmic= 0.21 Gy/kadepth = 0.8 mlatitude= 36 degrees (north positive)longitude= -111 degrees (east positive)elevation= 0.82 km asl
Sample descript:
UTM 12N, 220618 E, 565513 N
tan mainstem sand from C:13:327 SU 4, large fluvial cross-beds
Histogram
0
1
2
3
4
5
6
1.0
1.5
2.0
2.5
3.0
3.5
4.0
4.5
5.0
De (Gy)
Freq
uenc
y
Cumulative Probability Curve
0.0
1.0
2.0
3.0
4.0
5.0
6.0
7.0
8.0
9.0
-10 -5 0 5 10 15 20De (Gy)
Pro
bab
ility
su
m
Sum of Wtd De's
Average Wtd De's
De's and errors
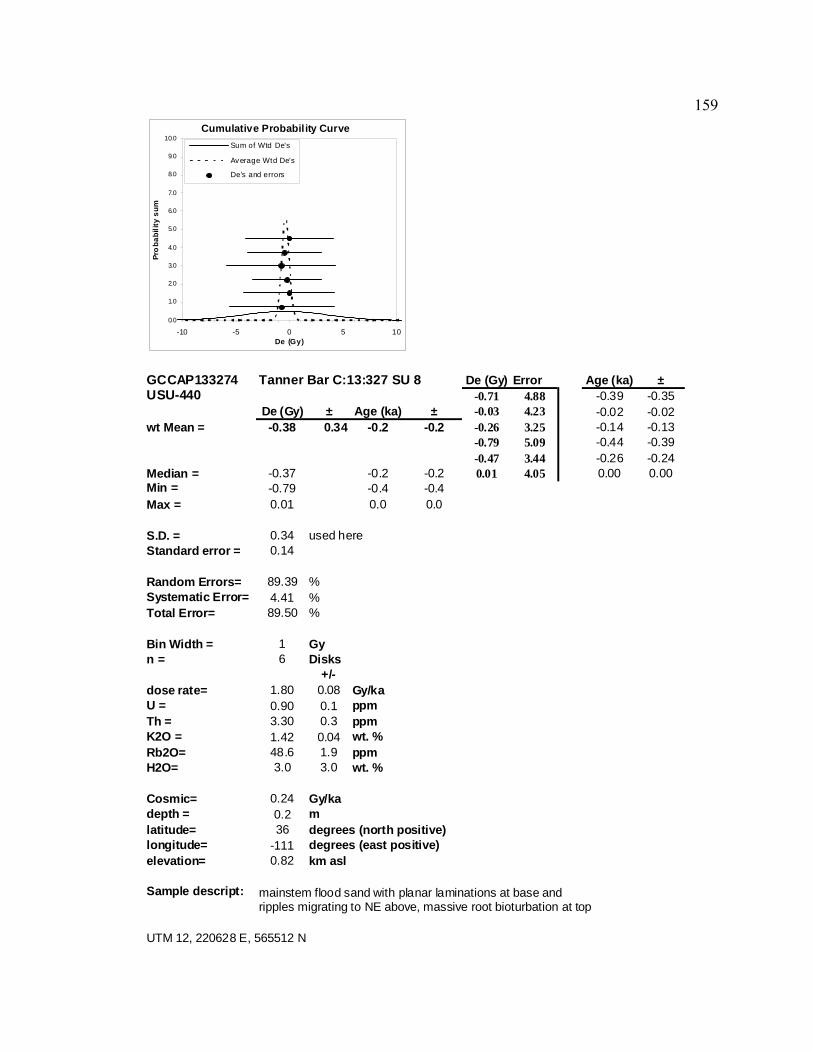
159
GCCAP133274 Tanner Bar C:13:327 SU 8 De (Gy) Error Age (ka) ±USU-440 -0.71 4.88 -0.39 -0.35
De (Gy) ± Age (ka) ± -0.03 4.23 -0.02 -0.02wt Mean = -0.38 0.34 -0.2 -0.2 -0.26 3.25 -0.14 -0.13
-0.79 5.09 -0.44 -0.39-0.47 3.44 -0.26 -0.24
Median = -0.37 -0.2 -0.2 0.01 4.05 0.00 0.00Min = -0.79 -0.4 -0.4Max = 0.01 0.0 0.0
S.D. = 0.34 used hereStandard error = 0.14
Random Errors= 89.39 %Systematic Error= 4.41 %Total Error= 89.50 %
Bin Width = 1 Gyn = 6 Disks
+/-dose rate= 1.80 0.08 Gy/kaU = 0.90 0.1 ppmTh = 3.30 0.3 ppmK2O = 1.42 0.04 wt. %Rb2O= 48.6 1.9 ppmH2O= 3.0 3.0 wt. %
Cosmic= 0.24 Gy/kadepth = 0.2 mlatitude= 36 degrees (north positive)longitude= -111 degrees (east positive)elevation= 0.82 km asl
Sample descript:
UTM 12, 220628 E, 565512 N
mainstem flood sand with planar laminations at base and ripples migrating to NE above, massive root bioturbation at top
Cumulative Probability Curve
0.0
1.0
2.0
3.0
4.0
5.0
6.0
7.0
8.0
9.0
10.0
-10 -5 0 5 10De (Gy)
Pro
babi
lity
sum
Sum of Wtd De's
Average Wtd De's
De's and errors

160
GLCA-10.1L-10 Package C, Ninemile Draw De (Gy) Error Age (ka) ±USU-457 0.12 4.57 0.04 0.02
De (Gy) ± Age (ka) ± 0.46 4.27 0.16 0.07wt Mean = 0.78 0.36 0.3 0.1 0.53 2.10 0.18 0.08
0.57 4.05 0.19 0.090.70 2.15 0.24 0.11
Median = 0.72 0.2 0.1 0.70 1.91 0.24 0.11Min = 0.12 0.0 0.0 0.73 2.75 0.25 0.12Max = 1.39 0.5 0.2 0.75 5.64 0.25 0.12
0.96 1.85 0.33 0.15S.D. = 0.36 used here 1.16 5.59 0.39 0.18Standard error = 0.11 1.28 0.54 0.43 0.20
1.39 2.31 0.47 0.22Random Errors= 46.75 %Systematic Error= 4.46 %Total Error= 46.96 %
Bin Width = 0 Gyn = 12 Disks
+/-dose rate= 2.96 0.13 Gy/kaU = 2.50 0.2 ppmTh = 8.30 0.7 ppmK2O = 2.10 0.05 wt. %Rb2O= 79.7 3.2 ppmH2O= 3.0 3.0 wt. %
Cosmic= 0.12 Gy/kadepth = 4.3 mlatitude= 36 degrees (north positive)longitude= -111 degrees (east positive)elevation= 0.94 km asl
Sample descript:
UTM 12, 248262E, 652870 N
unit 1 of package VI, mainstem silty sand with ripples
Histogram
0
1
2
3
4
5
0.0
0.4
0.8
1.2
1.6
2.0
De (Gy)
Freq
uenc
y
Cumulative Probability Curve
0.0
2.0
4.0
6.0
8.0
10.0
12.0
14.0
-5 0 5 10De (Gy)
Pro
babi
lity
sum
Sum of W td De's
Average W td De's
D e's and errors

161
GLCA-10.1L-12 Package C, Ninemile Draw De (Gy) Error Age (ka) ±USU-458 1.63 2.62 0.56 0.31
De (Gy) ± Age (ka) ± 1.95 3.49 0.67 0.37wt Mean = 4.34 2.39 1.5 0.8 1.98 3.69 0.68 0.37
2.40 2.32 0.82 0.452.62 1.45 0.90 0.49
Median = 3.74 1.3 0.7 2.90 1.45 0.99 0.55Min = 1.63 0.6 0.3 3.74 0.33 1.28 0.71Max = 9.67 3.3 1.8 3.74 1.94 1.28 0.71
3.97 1.40 1.36 0.75S.D. = 2.39 used here 4.82 3.36 1.65 0.91Standard error = 0.62 5.06 2.71 1.73 0.96
5.51 4.80 1.88 1.04Random Errors= 55.05 % 7.06 0.83 2.42 1.33Systematic Error= 4.45 % 8.01 4.98 2.74 1.51Total Error= 55.23 % 9.67 2.89 3.31 1.83
Bin Width = 1 Gyn = 15 Disks
+/-dose rate= 2.92 0.13 Gy/kaU = 2.40 0.2 ppmTh = 7.90 0.7 ppmK2O = 2.08 0.05 wt. %Rb2O= 79.2 3.2 ppmH2O= 3.0 3.0 wt. %
Cosmic= 0.15 Gy/kadepth = 3.1 mlatitude= 36 degrees (north positive)longitude= -111 degrees (east positive)elevation= 0.94 km asl
Sample descript: unit 10 of package C, mainstem sand with thin cross beds and climbing ripples
UTM 12, 248262E, 652870 N
Histogram
0
1
2
3
4
0 1 2 3 4 5 6 7 8 9 10
De (Gy)
Freq
uenc
y
Cumulative Probability Curve
0.0
2.0
4.0
6.0
8.0
10.0
12.0
14.0
-5 0 5 10 15 20De (Gy)
Pro
babi
lity
sum
Sum of W td De's
Average W td De's
D e's and errors

162
Appendix F. AMS RADIOCARBON RESULTS

163
TABLE F.1. DETAILED NINEMILE DRAW RADIOCARBON RESULTS
Sample #
Beta #
Location
Material
14C method
13C/12C
conventional 14C age
age (cal yr BP)**
C13323FS28A * 252217 C:13:323 SU 5 Feature 2 charcoal AMS -25.4 o/oo 2130 +/- 40 B.P 2310-2040
C13323FS43A* 252218 C:13:323 SU 10 Feature 4 charcoal AMS -25.1 o/oo 2160 +/- 40 B.P 2300-2240, 2170-2000 Beta-232598 232598 C:13:327 SU 1 Feature 3 charcoal AMS -22.9 o/oo 1200 +/- 60 B.P. 1520-1330 Beta-252219 252219 C:13:327 SU 6 Feature 9 charcoal AMS -24.4 o/oo 1520 +/- 40 B.P. 1280-970 C13327FS1 250688 C13:327 gully charcoal AMS -25.4 o/oo 2920 +/- 40 B.P. 3210-2950
*See Damp et al., 2007 for detailed AMS radiocarbon results. Raw data are not included here. **Calibrated by Beta Analytic.

164
TABLE F.2. DETAILED TANNER BAR RADIOCARBON RESULTS
Sample #
Beta #
Location
Material
14C method
13C/12C
conventional 14C age
age (cal yr BP)***
C13323FS28A * 252217 C:13:323 SU 5 Feature 2 charcoal AMS -25.4 o/oo 2130 +/- 40 B.P 2310-2040 C13323FS43A* 252218 C:13:323 SU 10 Feature 4 charcoal AMS -25.1 o/oo 2160 +/- 40 B.P 2300-2240, 2170-2000
Beta-232598 232598 C:13:327 SU 1 Feature 3 charcoal AMS -22.9 o/oo 1200 +/- 60 B.P. 1520-1330 Beta-252219 252219 C:13:327 SU 6 Feature 9 charcoal AMS -24.4 o/oo 1520 +/- 40 B.P. 1280-970 C13327FS1 250688 C13:327 gully charcoal AMS -25.4 o/oo 2920 +/- 40 B.P. 3210-2950
*See Damp et al., 2007 for detailed AMS radiocarbon results. Raw data are not included here. **Calibrated by Beta Analytic.

165