Embed Size (px)
Citation preview
High Capacity Single Table Performance Design Using
Partitioning in Oracle or PostgreSQL
by Travis Parker and Paul Ritchey
ARL-CR-0689 March 2012
Prepared by ICF International
9300 Lee Highway, Fairfax, VA 22031-1207 USA
Under Contract W911QX-07-F-0023
COR: U.S. Army Research Laboratory
RDRL-CI Linda Duchow
2800 Powder Mill Road Adelphi, MD 20783-1197
Approved for public release; distribution unlimited.
NOTICES
Disclaimers The findings in this report are not to be construed as an official Department of the Army position unless so designated by other authorized documents. Citation of manufacturer’s or trade names does not constitute an official endorsement or approval of the use thereof. Destroy this report when it is no longer needed. Do not return it to the originator.
Army Research Laboratory Aberdeen Proving Ground, MD 21005
ARL-CR-0689 March 2012
High Capacity Single Table Performance Design Using Partitioning in Oracle or PostgreSQL
Travis Parker and Paul Ritchey
Computational and Information Sciences Directorate, ARL
Prepared by ICF International
9300 Lee Highway, Fairfax, VA 22031-1207 USA
Under Contract W911QX-07-F-0023
COR: U.S. Army Research Laboratory
RDRL-CI Linda Duchow
2800 Powder Mill Road Adelphi, MD 20783-1197
Approved for public release; distribution unlimited.
ii
REPORT DOCUMENTATION PAGE Form Approved OMB No. 0704-0188
Public reporting burden for this collection of information is estimated to average 1 hour per response, including the time for reviewing instructions, searching existing data sources, gathering and maintaining the data needed, and completing and reviewing the collection information. Send comments regarding this burden estimate or any other aspect of this collection of information, including suggestions for reducing the burden, to Department of Defense, Washington Headquarters Services, Directorate for Information Operations and Reports (0704-0188), 1215 Jefferson Davis Highway, Suite 1204, Arlington, VA 22202-4302. Respondents should be aware that notwithstanding any other provision of law, no person shall be subject to any penalty for failing to comply with a collection of information if it does not display a currently valid OMB control number. PLEASE DO NOT RETURN YOUR FORM TO THE ABOVE ADDRESS.
1. REPORT DATE (DD-MM-YYYY)
March 2012 2. REPORT TYPE
Final 3. DATES COVERED (From - To)
January to October 2011 4. TITLE AND SUBTITLE
High Capacity Single Table Performance Design Using Partitioning in Oracle or PostgreSQL
5a. CONTRACT NUMBER
W911QX-07-F-0023 5b. GRANT NUMBER
5c. PROGRAM ELEMENT NUMBER
6. AUTHOR(S)
Travis Parker and Paul Ritchey 5d. PROJECT NUMBER
5e. TASK NUMBER
5f. WORK UNIT NUMBER
7. PERFORMING ORGANIZATION NAME(S) AND ADDRESS(ES)
ICF International 9300 Lee Highway Fairfax, VA 22031-1207 USA
8. PERFORMING ORGANIZATION REPORT NUMBER
9. SPONSORING/MONITORING AGENCY NAME(S) AND ADDRESS(ES)
U.S. Army Research Laboratory ATTN: RDRL-CIN-D Aberdeen Proving Ground, MD 21005
10. SPONSOR/MONITOR'S ACRONYM(S)
11. SPONSOR/MONITOR'S REPORT NUMBER(S)
ARL-CR-0689
12. DISTRIBUTION/AVAILABILITY STATEMENT
Approved for public release; distribution unlimited.
13. SUPPLEMENTARY NOTES
14. ABSTRACT
This report describes the design rationale and resulting performance seen in a single server (non-clustered) database with an extremely large table containing in excess of 11 billion records. The original research and testing had been performed on a much smaller scale into the tens of millions of records around fall 2001, with an expectation that it would be near to the projected maximum number of records. In summer 2003, after those initial results were used to design a table still in use in production today, a similar table with a much larger data set was needed and the basic research was applied again to the new table. Initially, it was expected the number of records would peak close to half a billion; however, due to continuous and unexpected growth, the table now contains more than 11 billion records and is expected to grow more as the storage capacity is increased on the database server.
15. SUBJECT TERMS
Oracle, postgres, performance, partitioning
16. SECURITY CLASSIFICATION OF: 17. LIMITATION
OF ABSTRACT
UU
18. NUMBER OF
PAGES
22
19a. NAME OF RESPONSIBLE PERSON
Travis Parker a. REPORT
Unclassified b. ABSTRACT
Unclassified c. THIS PAGE
Unclassified 19b. TELEPHONE NUMBER (Include area code)
(410) 278-0900 Standard Form 298 (Rev. 8/98)
Prescribed by ANSI Std. Z39.18
iii
Contents
List of Figures iv
List of Tables iv
1. Introduction 1
1.1 Oracle Overview..............................................................................................................1
1.2 Oracle Database Data Storage .........................................................................................2
1.3 Oracle Tables and Partitioning ........................................................................................2
1.4 Oracle Indexing ...............................................................................................................3
1.5 Oracle Production Implementation .................................................................................5
2. PostgreSQL 7
2.1 PostgreSQL Database Data Storage ................................................................................7
2.2 PostgreSQL Table Partitioning .......................................................................................9
3. Performance Comparisons 10
4. Additional Key Performance Indicators (KPIs) 13
5. Conclusion 14
List of Symbols, Abbreviations, and Acronyms 15
Distribution List 16
iv
List of Figures
Figure 1. Oracle storage mechanism. ..............................................................................................2
Figure 2. Oracle table partitioning. .................................................................................................3
Figure 3. Oracle locally partitioned index. .....................................................................................5
Figure 4. PostgreSQL storage mechanism. .....................................................................................8
Figure 5. PostgreSQL storage mechanism—tablespaces. ...............................................................9
Figure 6. PostgreSQL table partitioning. ......................................................................................10
Figure 7. Time to seek and return one record. ..............................................................................13
List of Tables
Table 1. Performance testing results. ............................................................................................11
Table 2. Totals records available during performance testing. .....................................................11
Table 3. PostgreSQL scalability performance (non-cached). .......................................................12
Table 4. Additional issues that should be evaluated when comparing Oracle and PostgreSQL. .............................................................................................................................14
1
1. Introduction
The Computer and Information Sciences Directorate provides network defense efforts to the U.S. Army Research Laboratory (ARL). These efforts require the ability to index and search a very large number of network traffic records and associated findings. A high-capacity, high-performance database is well suited to this task.
The table partitioning and indexing concepts described in this report were originally a result of needing near instantaneous responses as possible from the database. In order to meet that requirement, we started exploring the additional features and capabilities provided by Oracle to determine what would provide the performance we needed with the number of records we expected to keep in the table. After successfully applying our research to production for several years, we began evaluating the possibility of changing our preferred database software, Oracle, in order to reduce yearly operating costs. After selecting PostgreSQL as the likely replacement, testing needed to be performed to ensure it would meet our performance requirements.
Historically, PostgreSQL had a reputation of having sluggish1 performance as compared to other databases, but had seen improvements2 over the years3. Other benchmarks testing performance on multiple cores4 showed PostgreSQL scaling better on more cores than MySQL. Before migrating a critical part of our database architecture over to PostgreSQL, we had to first apply the design and concepts developed while using Oracle as best we could with PostgreSQL in order to obtain the best performance possible and then test it using queries similar to those users would be executing to see if we could obtain the performance level we needed to meet.
This report provides details on our original implementation using Oracle, and then how those concepts and experiences were applied to PostgreSQL, wrapping up with the performance results we were able to obtain.
1.1 Oracle Overview
The commercially available Oracle Database is known for its reliability and scalability. Several features that can enhance the scalability and performance for large tables are carefully leveraging the partitioning and tablespace features in conjunction with bitmap indexes. The combination of these features, when implemented with careful consideration of the primary queries that will be
1PostgreSQL Publishes First Real Benchmark. http://it.toolbox.com/blogs/database-soup/postgresql-publishes-first-real-
benchmark-17470 (November 2011). 2Open Source PostgreSQL Trails Oracle in Benchmark, But Not By Much.
http://www.informationweek.com/news/201001901?subSection=Open+Source (November 2011). 3MySQL vs PostgreSQL Benchmarks. http://www.randombugs.com/linux/mysql-postgresql-benchmarks.html (November
2011).. 4Database Test 8-way Opteron. http://tweakers.net/reviews/674/6/database-test-8-way-opteron-scaling-behaviour-from-4-to-
8-sockets.html (November 2011).
2
executed, allow one to attain acceptable response times from the database. As an example of the performance that can be obtained, in our Oracle production environment, executing a query that returns 1,556 rows from a table containing over 11 billion records takes approximately 11 s from disk and approximately 4 s if the data is cached in memory. The basic research that went into the design of our tables and indexing was originally performed using Oracle 8i. The production implementation has remained unchanged from Oracle versions 8i through 10g.
1.2 Oracle Database Data Storage
To understand the implementation details used in our Oracle production environment, a basic understanding of how data are stored and organized in an Oracle database is needed as well as an explanation of the terminology that is used.
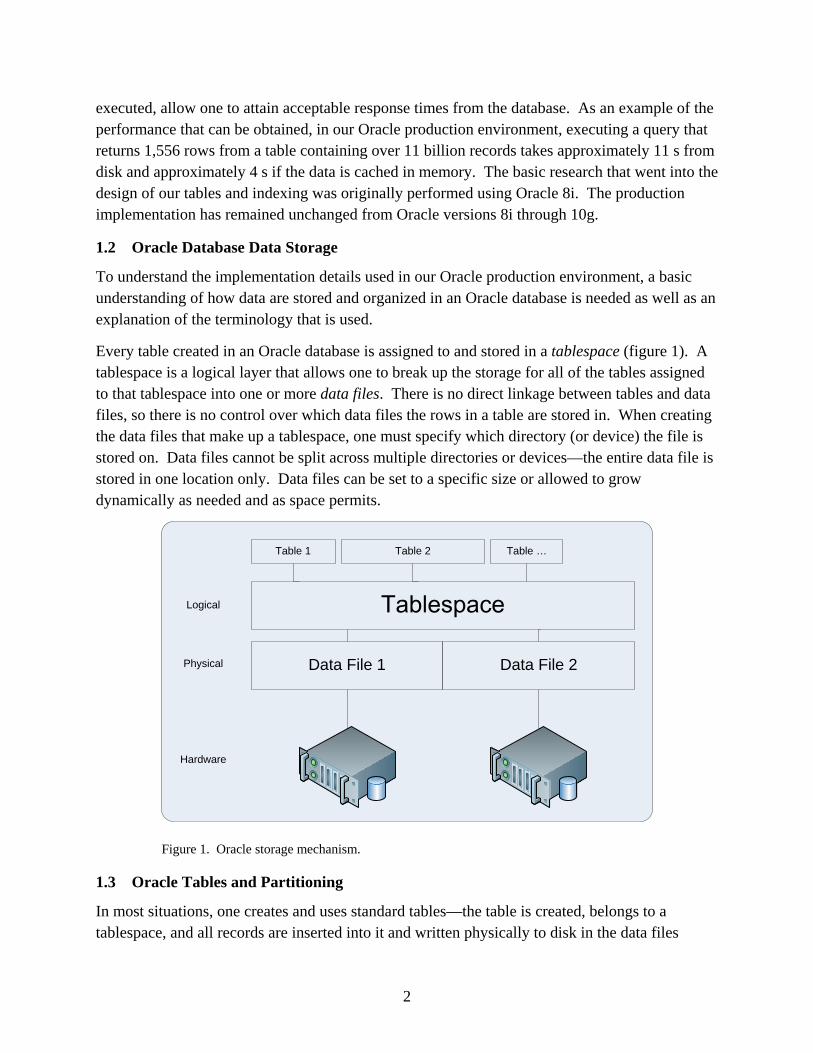
Every table created in an Oracle database is assigned to and stored in a tablespace (figure 1). A tablespace is a logical layer that allows one to break up the storage for all of the tables assigned to that tablespace into one or more data files. There is no direct linkage between tables and data files, so there is no control over which data files the rows in a table are stored in. When creating the data files that make up a tablespace, one must specify which directory (or device) the file is stored on. Data files cannot be split across multiple directories or devices—the entire data file is stored in one location only. Data files can be set to a specific size or allowed to grow dynamically as needed and as space permits.
Logical
Table 1 Table 2 Table …
Data File 1 Data File 2
Hardware
Physical
Figure 1. Oracle storage mechanism.
1.3 Oracle Tables and Partitioning
In most situations, one creates and uses standard tables—the table is created, belongs to a tablespace, and all records are inserted into it and written physically to disk in the data files
3
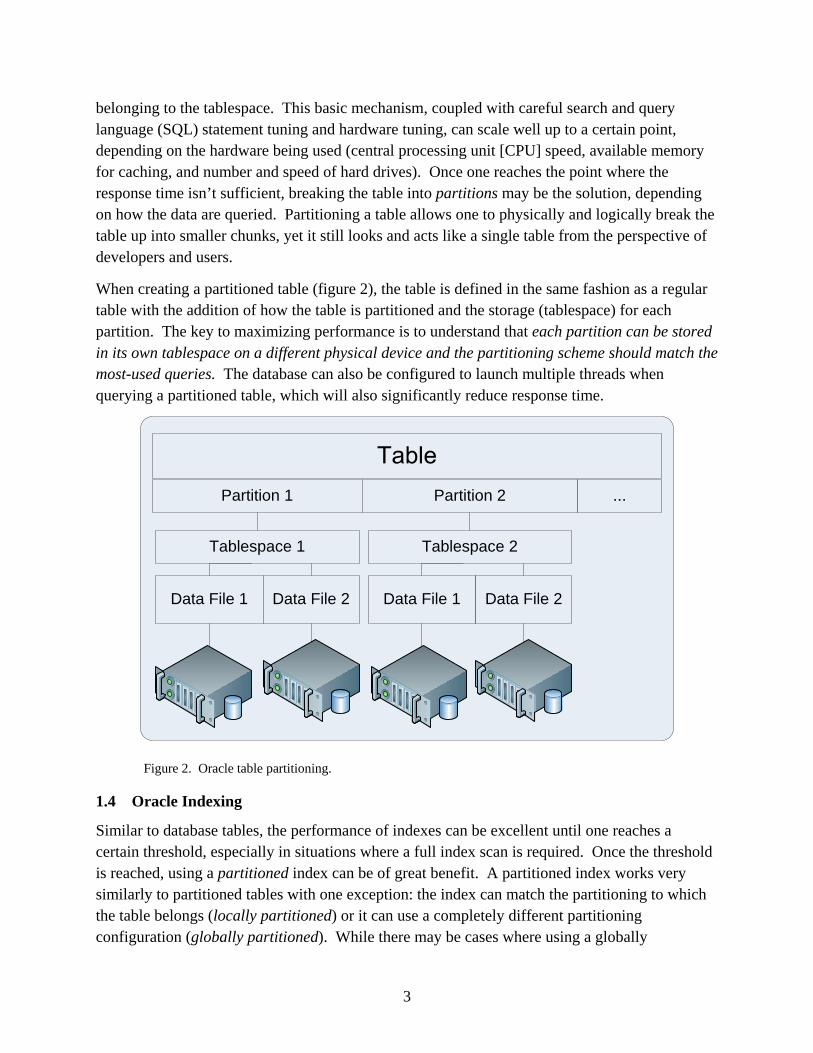
belonging to the tablespace. This basic mechanism, coupled with careful search and query language (SQL) statement tuning and hardware tuning, can scale well up to a certain point, depending on the hardware being used (central processing unit [CPU] speed, available memory for caching, and number and speed of hard drives). Once one reaches the point where the response time isn’t sufficient, breaking the table into partitions may be the solution, depending on how the data are queried. Partitioning a table allows one to physically and logically break the table up into smaller chunks, yet it still looks and acts like a single table from the perspective of developers and users.
When creating a partitioned table (figure 2), the table is defined in the same fashion as a regular table with the addition of how the table is partitioned and the storage (tablespace) for each partition. The key to maximizing performance is to understand that each partition can be stored in its own tablespace on a different physical device and the partitioning scheme should match the most-used queries. The database can also be configured to launch multiple threads when querying a partitioned table, which will also significantly reduce response time.
Tablespace 1
Data File 1 Data File 2
Tablespace 2
Data File 1 Data File 2
Partition 1 Partition 2 ...
Figure 2. Oracle table partitioning.
1.4 Oracle Indexing
Similar to database tables, the performance of indexes can be excellent until one reaches a certain threshold, especially in situations where a full index scan is required. Once the threshold is reached, using a partitioned index can be of great benefit. A partitioned index works very similarly to partitioned tables with one exception: the index can match the partitioning to which the table belongs (locally partitioned) or it can use a completely different partitioning configuration (globally partitioned). While there may be cases where using a globally
4
partitioned index may be beneficial, our usage has been limited solely to locally partitioned indexes because they are maintained automatically, which is critical for the volume and volatility of data being stored. When using globally indexed partitions, care needs to be taken to avoid a few specific SQL commands that will cause a partition(s) in the index to be marked invalid, thereby requiring the index to be rebuilt and potentially causing significant application performance issues while it’s not available for use.
When a partitioned index is used, multiple threads can be used to read and process the partitions thereby reducing response time significantly. In addition, Oracle’s optimizer will automatically skip processing partitions in the index that will not contain results based on the partitioning scheme used and the query. For example, if the index is partitioned based on the month and the query is only interested in records where the month is December, the optimizer will automatically ignore the partitions for the months January through November. By eliminating entire partitions in this manner the optimizer can significantly reduce the amount of physical disk input/output (I/O) that must be performed.
Note: If performance using partitioned indexes isn’t as expected, one should analyze the execution plan using the EXPLAIN PLAN command to sanity check the execution plan. Although Oracle’s optimizer is excellent, sometimes it may not choose to use a partitioned index. In this situation, providing a hint embedded in the SQL query command pointed the optimizer in the correct direction and the partitioned index was incorporated, significantly decreasing response time.
Figure 3 shows an Oracle locally partitioned index.

5
Figure 3. Oracle locally partitioned index.
By default when a new index is created in Oracle without specifying the type of index, it will be a b-tree index. Oracle’s implementation of the b-tree index is a workhorse and will provide sufficient performance most of the time. In our particular instance, we wanted to see if an alternative index type would improve performance. The bitmap index looked like it may work; however, at the time (version 8i), the documentation specified that it should be used on columns “with low cardinality of values.” Our usage greatly stretched the idea of “low cardinality” but it worked and improved performance in our particular case. Since that point in time Oracle has eliminated the “low cardinality” recommendation.
1.5 Oracle Production Implementation
This section details the implementation of the previously described features Oracle provides as used for our large (in excess of 11 billion records) table. The discussion also includes a general description of the hardware, which although it has been migrated to newer hardware once, the basic configuration was unchanged.
The original hardware implementation used a Sun Microsystems Sun Fire 6800 server with a dual-pathed external storage array that was split into two separate partitions. By using two partitions, we were able to maximize our use of the two pathways to the storage array, manually load balancing Oracle’s I/O across them. Tests were performed using additional partitions but no performance improvements were found due to being limited by two pathways.
6
Optimum performance of the storage array was attained by carefully planning the table partitioning/indexing and manually distributing the tablespace data files across the partitions. Generally speaking, the data files for a partition in an index were not placed on the same partition where the table partitions data file was placed. This eliminated disk contention between reading the index partition and retrieving the actual records from the table. Disk I/O was monitored on a regular basis and occasional (manual) adjustments were necessary to redistribute the data files to maintain an even distribution of I/O across the partitions.
The original hardware was replaced several years later with an SGI server using a dual-pathed, fiber-based external SGI TP9700 storage array, which was split into two separate partitions. By this point in time Oracle 10g was available and the Automatic Storage Management (ASM) feature was used on raw partitions (no operating system [OS] file system). By using raw partitions, the overhead added by using an OS file system is eliminated and any contention between the OS performing data caching and Oracle’s caching/buffering was eliminated. ASM provides automated I/O load balancing between available storage points (disk partitions) and, when additional storage points are added, it will automatically redistribute the tablespace data files across all of the storage points while the database is live. This has eliminated the manual process of distributing the data files and monitoring disk I/O for the purpose of keeping I/O balanced across available partitions.
The data stored in the largest table was bulk loaded by date each day, which equated to loading roughly 60 million records a day. In most situations, the user will execute a query across all available dates (limited to six months due to storage capacity), searching for a particular piece of information, though occasionally the user will have a specific date range in mind. For those reasons, the table was partitioned by date, which helps aid performance in several ways. When the data have aged and need to be removed, the partition of interest is simply truncated, which happens almost instantaneously with no impact on production performance. Users can greatly benefit from this partitioning scheme if they specify a subset of the dates stored in the table. When a date range is specified, a potentially large number of table and index partitions will be automatically ignored by the optimizer, greatly speeding the returned matches because of the reduced amount of data that needs to be processed during the search.
Many of the indexes used on the table are “locally partitioned” (they inherit the partitioning by date from the table) and use bitmaps instead of b-trees. The bitmap indexes are also the most beneficial type of index, since the search criteria specified usually specify exact values. If exact values aren’t specified (i.e., “>=”, “<=”, etc.), full index scans may be necessary, which can degrade search performance just like a full table scan due to the sheer size of the table and the number of records the query may return.
7
2. PostgreSQL
PostgreSQL was selected years ago as a potential replacement for Oracle. Although an open source database, many of the underpinnings that are unique to the commercially available Oracle database that allow it to scale appear to be in their infancy in PostgreSQL. For example, both support the logical tablespace method for assigning the physical storage location for a table, although Oracle has taken it a step farther by allowing the administrator to assign multiple separate files (data files) to a single tablespace and place those files across more than one storage point to distribute I/O. PostgreSQL also supports table partitioning in a manner similar to Oracle’s; however, the implementation is not quite as robust as Oracle’s but it is effective enough to allow PostgreSQL to scale much larger than one would expect. For our testing and eventual production implementation, we were able to apply the structure and lessons learned while working with Oracle to PostgreSQL and achieve results successful enough to allow us migrate our large tables to it.
2.1 PostgreSQL Database Data Storage
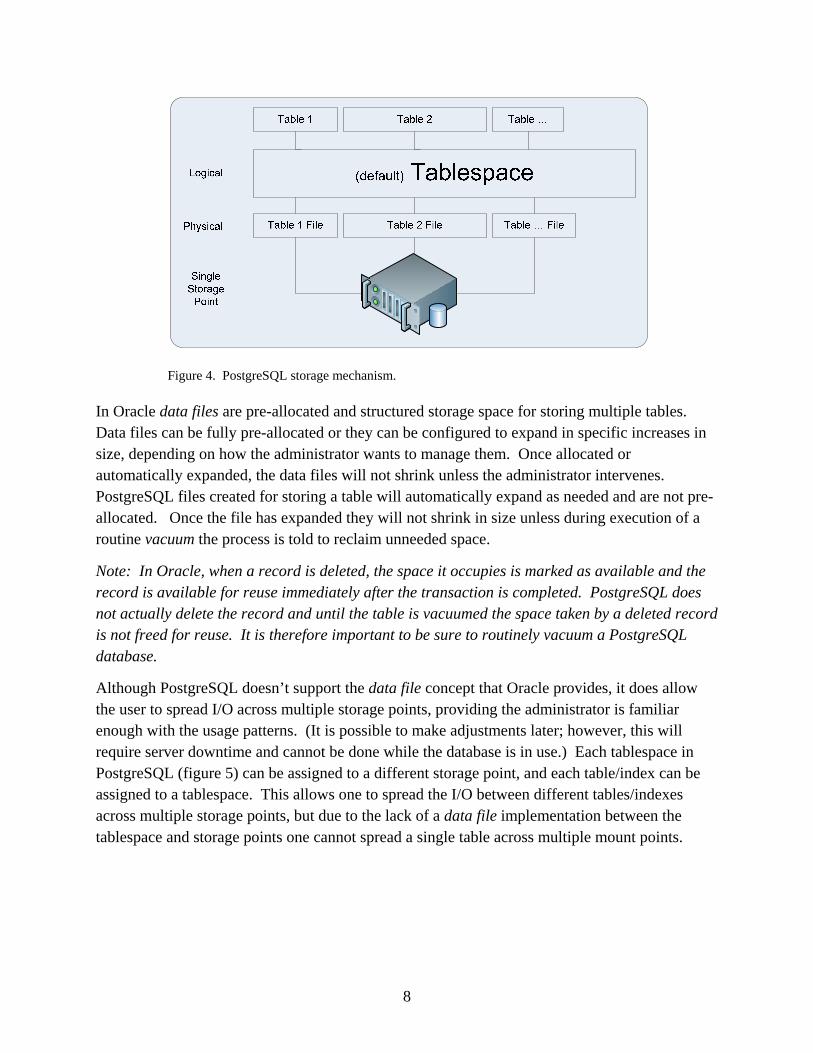
PostgreSQL’s storage mechanism is very simple: Each table created corresponds to one file on disk, typically located in the same directory on an OS provided filesystem (such as ext3) (figure 4). This layout limits one to using a single storage point unless one takes advantage of PostgreSQL’s tablespace mechanism, which is discussed in section 2.2. The other item of importance is that PostgreSQL does not have the concept of data files, allowing one to split the storage for a particular tablespace across multiple storage points. This implementation thereby prohibits one from indirectly and automatically allowing the storage and I/O for a table to spread across multiple storage points for better performance—a table is stored in one file in one location (even if the table eventually grows beyond a specified threshold to require additional files, they will reside right next to the original file).
8
Figure 4. PostgreSQL storage mechanism.
In Oracle data files are pre-allocated and structured storage space for storing multiple tables. Data files can be fully pre-allocated or they can be configured to expand in specific increases in size, depending on how the administrator wants to manage them. Once allocated or automatically expanded, the data files will not shrink unless the administrator intervenes. PostgreSQL files created for storing a table will automatically expand as needed and are not pre-allocated. Once the file has expanded they will not shrink in size unless during execution of a routine vacuum the process is told to reclaim unneeded space.
Note: In Oracle, when a record is deleted, the space it occupies is marked as available and the record is available for reuse immediately after the transaction is completed. PostgreSQL does not actually delete the record and until the table is vacuumed the space taken by a deleted record is not freed for reuse. It is therefore important to be sure to routinely vacuum a PostgreSQL database.
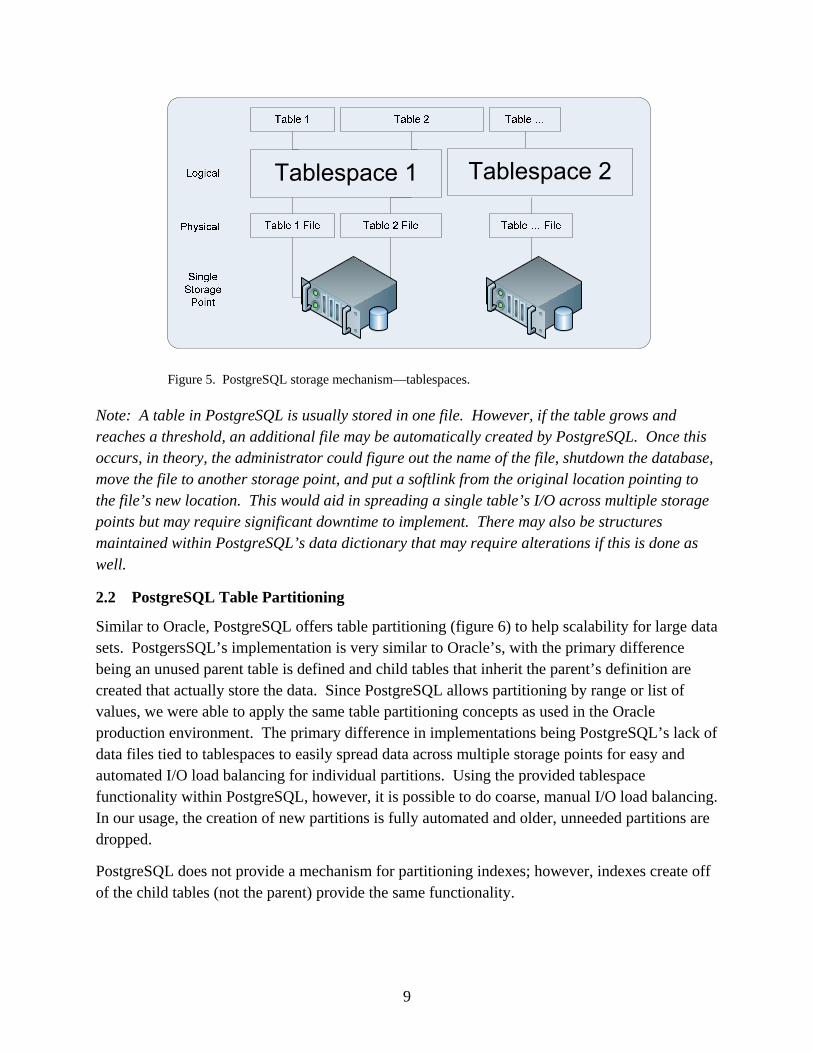
Although PostgreSQL doesn’t support the data file concept that Oracle provides, it does allow the user to spread I/O across multiple storage points, providing the administrator is familiar enough with the usage patterns. (It is possible to make adjustments later; however, this will require server downtime and cannot be done while the database is in use.) Each tablespace in PostgreSQL (figure 5) can be assigned to a different storage point, and each table/index can be assigned to a tablespace. This allows one to spread the I/O between different tables/indexes across multiple storage points, but due to the lack of a data file implementation between the tablespace and storage points one cannot spread a single table across multiple mount points.
9
Figure 5. PostgreSQL storage mechanism—tablespaces.
Note: A table in PostgreSQL is usually stored in one file. However, if the table grows and reaches a threshold, an additional file may be automatically created by PostgreSQL. Once this occurs, in theory, the administrator could figure out the name of the file, shutdown the database, move the file to another storage point, and put a softlink from the original location pointing to the file’s new location. This would aid in spreading a single table’s I/O across multiple storage points but may require significant downtime to implement. There may also be structures maintained within PostgreSQL’s data dictionary that may require alterations if this is done as well.
2.2 PostgreSQL Table Partitioning
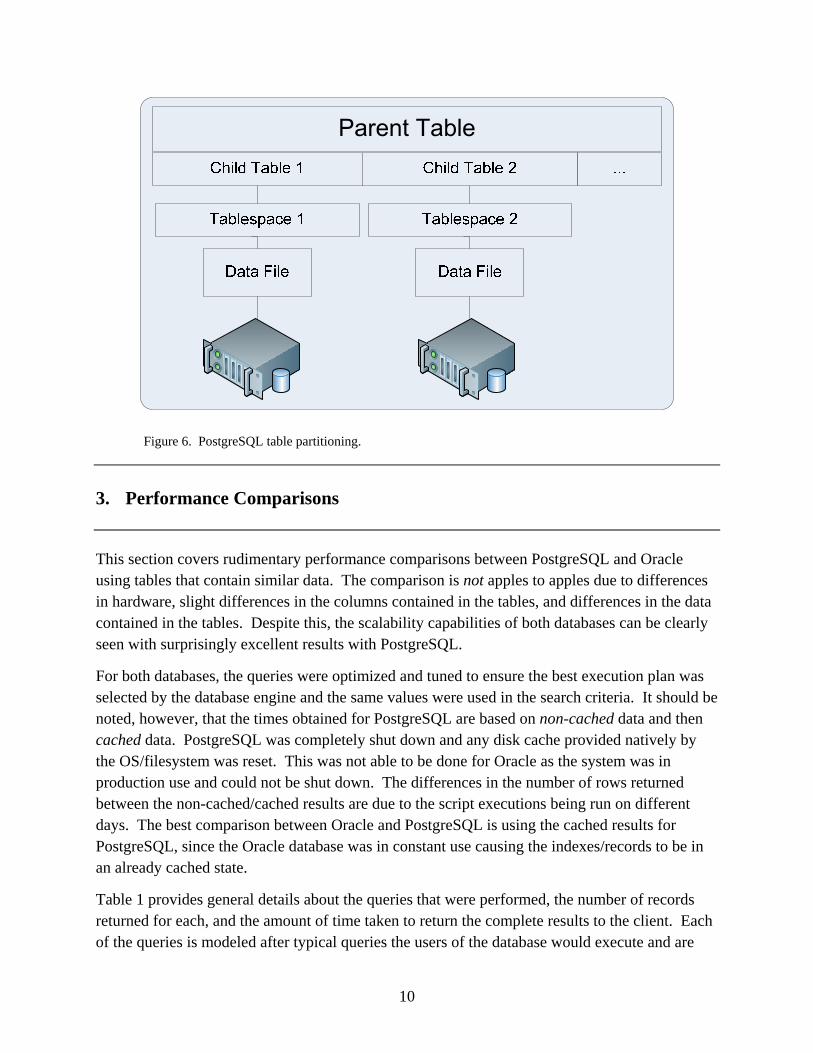
Similar to Oracle, PostgreSQL offers table partitioning (figure 6) to help scalability for large data sets. PostgersSQL’s implementation is very similar to Oracle’s, with the primary difference being an unused parent table is defined and child tables that inherit the parent’s definition are created that actually store the data. Since PostgreSQL allows partitioning by range or list of values, we were able to apply the same table partitioning concepts as used in the Oracle production environment. The primary difference in implementations being PostgreSQL’s lack of data files tied to tablespaces to easily spread data across multiple storage points for easy and automated I/O load balancing for individual partitions. Using the provided tablespace functionality within PostgreSQL, however, it is possible to do coarse, manual I/O load balancing. In our usage, the creation of new partitions is fully automated and older, unneeded partitions are dropped.
PostgreSQL does not provide a mechanism for partitioning indexes; however, indexes create off of the child tables (not the parent) provide the same functionality.
10
Figure 6. PostgreSQL table partitioning.
3. Performance Comparisons
This section covers rudimentary performance comparisons between PostgreSQL and Oracle using tables that contain similar data. The comparison is not apples to apples due to differences in hardware, slight differences in the columns contained in the tables, and differences in the data contained in the tables. Despite this, the scalability capabilities of both databases can be clearly seen with surprisingly excellent results with PostgreSQL.
For both databases, the queries were optimized and tuned to ensure the best execution plan was selected by the database engine and the same values were used in the search criteria. It should be noted, however, that the times obtained for PostgreSQL are based on non-cached data and then cached data. PostgreSQL was completely shut down and any disk cache provided natively by the OS/filesystem was reset. This was not able to be done for Oracle as the system was in production use and could not be shut down. The differences in the number of rows returned between the non-cached/cached results are due to the script executions being run on different days. The best comparison between Oracle and PostgreSQL is using the cached results for PostgreSQL, since the Oracle database was in constant use causing the indexes/records to be in an already cached state.
Table 1 provides general details about the queries that were performed, the number of records returned for each, and the amount of time taken to return the complete results to the client. Each of the queries is modeled after typical queries the users of the database would execute and are
11
specific to our data and environment. The total number of records contained in the table being queried is shown in table 2 since the queries were executed on different database servers with different data at different times.
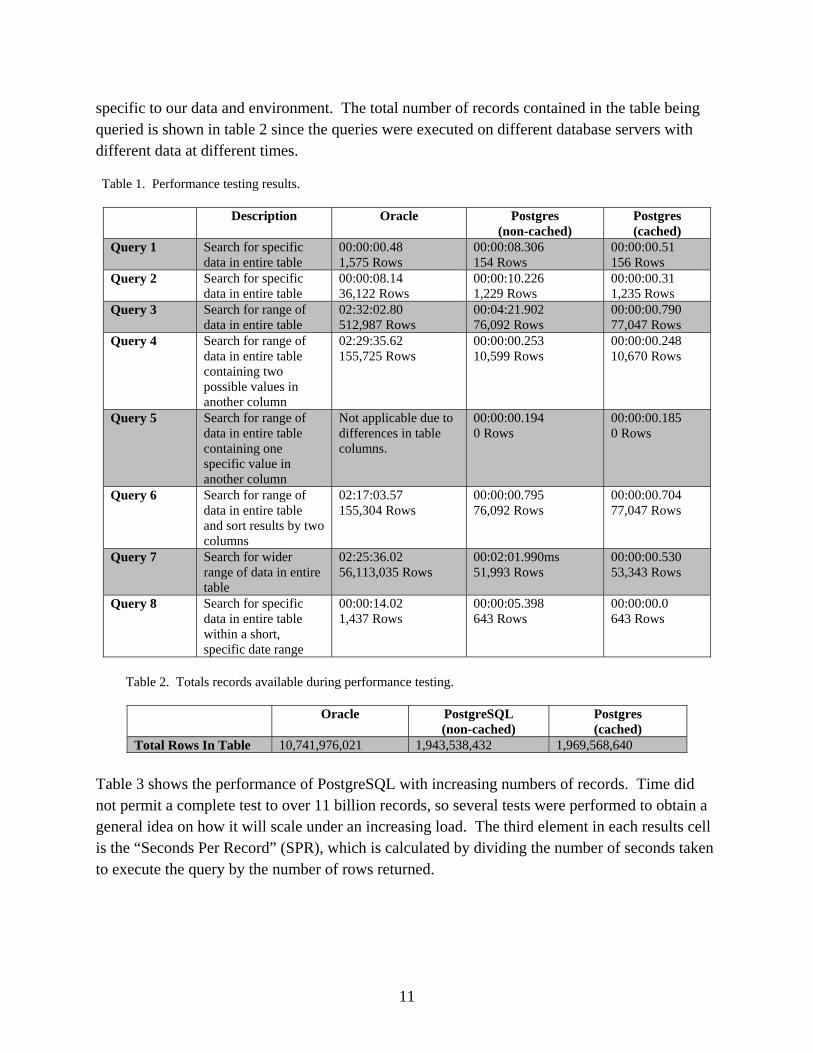
Table 1. Performance testing results.
Description Oracle Postgres (non-cached)
Postgres (cached)
Query 1 Search for specific data in entire table
00:00:00.48 1,575 Rows
00:00:08.306 154 Rows
00:00:00.51 156 Rows
Query 2 Search for specific data in entire table
00:00:08.14 36,122 Rows
00:00:10.226 1,229 Rows
00:00:00.31 1,235 Rows
Query 3 Search for range of data in entire table
02:32:02.80 512,987 Rows
00:04:21.902 76,092 Rows
00:00:00.790 77,047 Rows
Query 4 Search for range of data in entire table containing two possible values in another column
02:29:35.62 155,725 Rows
00:00:00.253 10,599 Rows
00:00:00.248 10,670 Rows
Query 5 Search for range of data in entire table containing one specific value in another column
Not applicable due to differences in table columns.
00:00:00.194 0 Rows
00:00:00.185 0 Rows
Query 6 Search for range of data in entire table and sort results by two columns
02:17:03.57 155,304 Rows
00:00:00.795 76,092 Rows
00:00:00.704 77,047 Rows
Query 7 Search for wider range of data in entire table
02:25:36.02 56,113,035 Rows
00:02:01.990ms 51,993 Rows
00:00:00.530 53,343 Rows
Query 8 Search for specific data in entire table within a short, specific date range
00:00:14.02 1,437 Rows
00:00:05.398 643 Rows
00:00:00.0 643 Rows
Table 2. Totals records available during performance testing.
Oracle PostgreSQL (non-cached)
Postgres (cached)
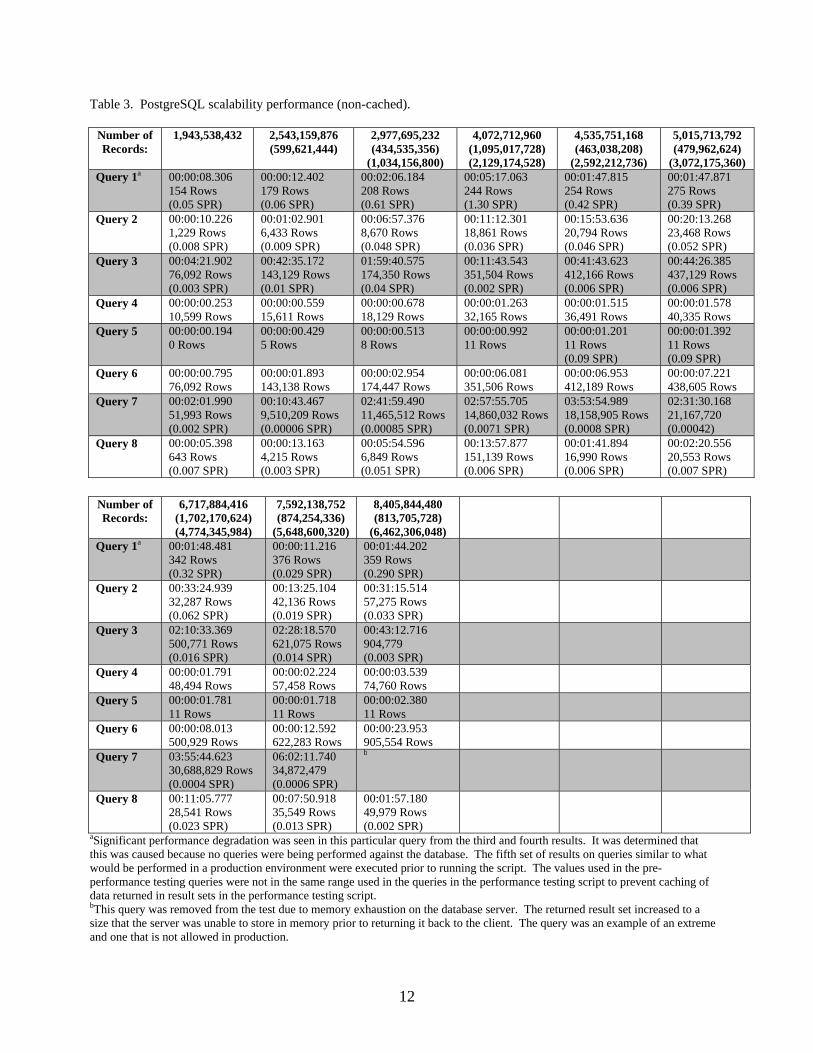
Total Rows In Table 10,741,976,021 1,943,538,432 1,969,568,640 Table 3 shows the performance of PostgreSQL with increasing numbers of records. Time did not permit a complete test to over 11 billion records, so several tests were performed to obtain a general idea on how it will scale under an increasing load. The third element in each results cell is the “Seconds Per Record” (SPR), which is calculated by dividing the number of seconds taken to execute the query by the number of rows returned.
12
Table 3. PostgreSQL scalability performance (non-cached).
Number of Records:
1,943,538,432 2,543,159,876 (599,621,444)
2,977,695,232 (434,535,356)
(1,034,156,800)
4,072,712,960 (1,095,017,728) (2,129,174,528)
4,535,751,168 (463,038,208)
(2,592,212,736)
5,015,713,792 (479,962,624)
(3,072,175,360) Query 1a 00:00:08.306
154 Rows (0.05 SPR)
00:00:12.402 179 Rows (0.06 SPR)
00:02:06.184 208 Rows (0.61 SPR)
00:05:17.063 244 Rows (1.30 SPR)
00:01:47.815 254 Rows (0.42 SPR)
00:01:47.871 275 Rows (0.39 SPR)
Query 2 00:00:10.226 1,229 Rows (0.008 SPR)
00:01:02.901 6,433 Rows (0.009 SPR)
00:06:57.376 8,670 Rows (0.048 SPR)
00:11:12.301 18,861 Rows (0.036 SPR)
00:15:53.636 20,794 Rows (0.046 SPR)
00:20:13.268 23,468 Rows (0.052 SPR)
Query 3 00:04:21.902 76,092 Rows (0.003 SPR)
00:42:35.172 143,129 Rows (0.01 SPR)
01:59:40.575 174,350 Rows (0.04 SPR)
00:11:43.543 351,504 Rows (0.002 SPR)
00:41:43.623 412,166 Rows (0.006 SPR)
00:44:26.385 437,129 Rows (0.006 SPR)
Query 4 00:00:00.253 10,599 Rows
00:00:00.559 15,611 Rows
00:00:00.678 18,129 Rows
00:00:01.263 32,165 Rows
00:00:01.515 36,491 Rows
00:00:01.578 40,335 Rows
Query 5 00:00:00.194 0 Rows
00:00:00.429 5 Rows
00:00:00.513 8 Rows
00:00:00.992 11 Rows
00:00:01.201 11 Rows (0.09 SPR)
00:00:01.392 11 Rows (0.09 SPR)
Query 6 00:00:00.795 76,092 Rows
00:00:01.893 143,138 Rows
00:00:02.954 174,447 Rows
00:00:06.081 351,506 Rows
00:00:06.953 412,189 Rows
00:00:07.221 438,605 Rows
Query 7 00:02:01.990 51,993 Rows (0.002 SPR)
00:10:43.467 9,510,209 Rows (0.00006 SPR)
02:41:59.490 11,465,512 Rows (0.00085 SPR)
02:57:55.705 14,860,032 Rows (0.0071 SPR)
03:53:54.989 18,158,905 Rows (0.0008 SPR)
02:31:30.168 21,167,720 (0.00042)
Query 8 00:00:05.398 643 Rows (0.007 SPR)
00:00:13.163 4,215 Rows (0.003 SPR)
00:05:54.596 6,849 Rows (0.051 SPR)
00:13:57.877 151,139 Rows (0.006 SPR)
00:01:41.894 16,990 Rows (0.006 SPR)
00:02:20.556 20,553 Rows (0.007 SPR)
Number of Records:
6,717,884,416 (1,702,170,624) (4,774,345,984)
7,592,138,752 (874,254,336)
(5,648,600,320)
8,405,844,480 (813,705,728)
(6,462,306,048)
Query 1a 00:01:48.481 342 Rows (0.32 SPR)
00:00:11.216 376 Rows (0.029 SPR)
00:01:44.202 359 Rows (0.290 SPR)
Query 2 00:33:24.939 32,287 Rows (0.062 SPR)
00:13:25.104 42,136 Rows (0.019 SPR)
00:31:15.514 57,275 Rows (0.033 SPR)
Query 3 02:10:33.369 500,771 Rows (0.016 SPR)
02:28:18.570 621,075 Rows (0.014 SPR)
00:43:12.716 904,779 (0.003 SPR)
Query 4 00:00:01.791 48,494 Rows
00:00:02.224 57,458 Rows
00:00:03.539 74,760 Rows
Query 5 00:00:01.781 11 Rows
00:00:01.718 11 Rows
00:00:02.380 11 Rows
Query 6 00:00:08.013 500,929 Rows
00:00:12.592 622,283 Rows
00:00:23.953 905,554 Rows
Query 7 03:55:44.623 30,688,829 Rows (0.0004 SPR)
06:02:11.740 34,872,479 (0.0006 SPR)
b
Query 8 00:11:05.777 28,541 Rows (0.023 SPR)
00:07:50.918 35,549 Rows (0.013 SPR)
00:01:57.180 49,979 Rows (0.002 SPR)
aSignificant performance degradation was seen in this particular query from the third and fourth results. It was determined that this was caused because no queries were being performed against the database. The fifth set of results on queries similar to what would be performed in a production environment were executed prior to running the script. The values used in the pre-performance testing queries were not in the same range used in the queries in the performance testing script to prevent caching of data returned in result sets in the performance testing script. bThis query was removed from the test due to memory exhaustion on the database server. The returned result set increased to a size that the server was unable to store in memory prior to returning it back to the client. The query was an example of an extreme and one that is not allowed in production.
13
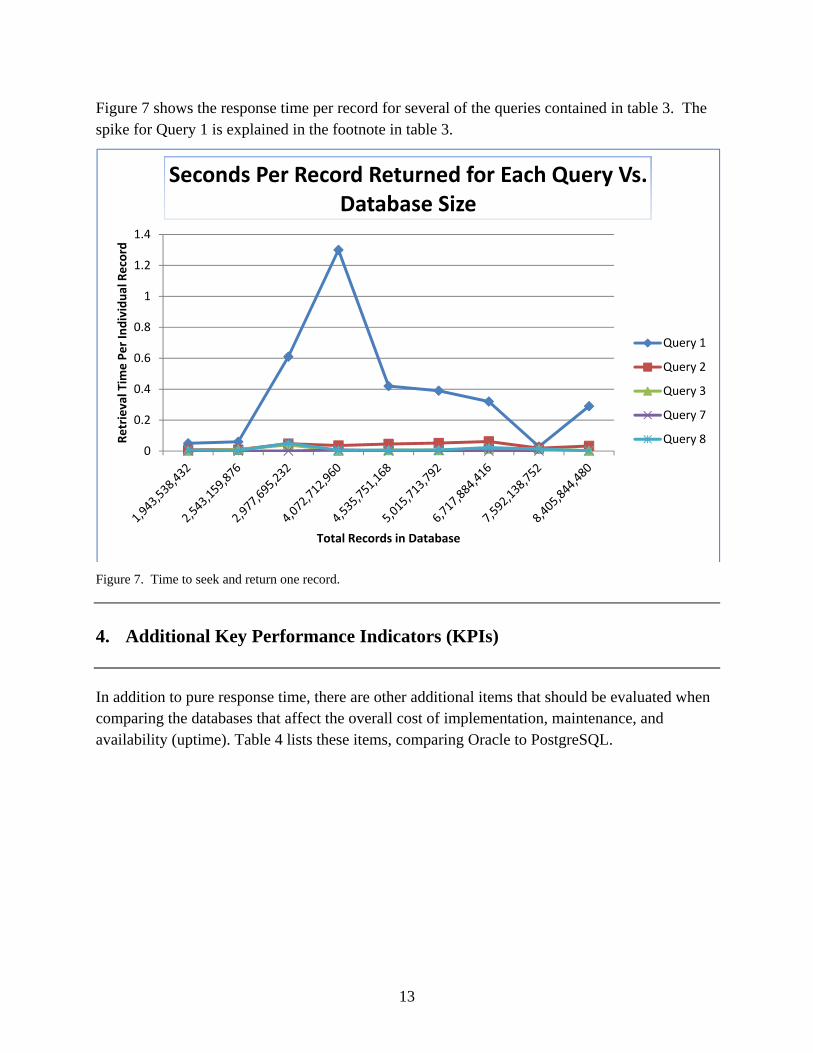
Figure 7 shows the response time per record for several of the queries contained in table 3. The spike for Query 1 is explained in the footnote in table 3.
Figure 7. Time to seek and return one record.
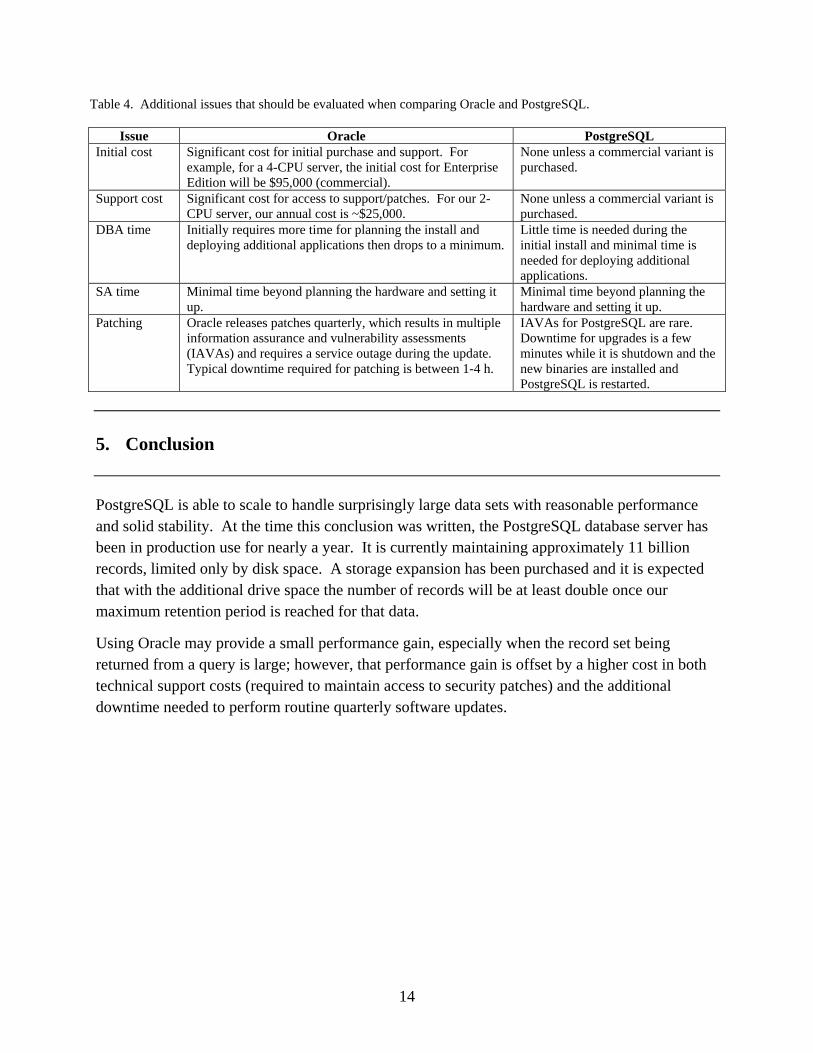
4. Additional Key Performance Indicators (KPIs)
In addition to pure response time, there are other additional items that should be evaluated when comparing the databases that affect the overall cost of implementation, maintenance, and availability (uptime). Table 4 lists these items, comparing Oracle to PostgreSQL.
0
0.2
0.4
0.6
0.8
1
1.2
1.4
Retrieval Tim
e Per Individual Record
Total Records in Database
Seconds Per Record Returned for Each Query Vs. Database Size
Query 1
Query 2
Query 3
Query 7
Query 8
14
Table 4. Additional issues that should be evaluated when comparing Oracle and PostgreSQL.
Issue Oracle PostgreSQL Initial cost Significant cost for initial purchase and support. For
example, for a 4-CPU server, the initial cost for Enterprise Edition will be $95,000 (commercial).
None unless a commercial variant is purchased.
Support cost Significant cost for access to support/patches. For our 2-CPU server, our annual cost is ~$25,000.
None unless a commercial variant is purchased.
DBA time Initially requires more time for planning the install and deploying additional applications then drops to a minimum.
Little time is needed during the initial install and minimal time is needed for deploying additional applications.
SA time Minimal time beyond planning the hardware and setting it up.
Minimal time beyond planning the hardware and setting it up.
Patching Oracle releases patches quarterly, which results in multiple information assurance and vulnerability assessments (IAVAs) and requires a service outage during the update. Typical downtime required for patching is between 1-4 h.
IAVAs for PostgreSQL are rare. Downtime for upgrades is a few minutes while it is shutdown and the new binaries are installed and PostgreSQL is restarted.
5. Conclusion
PostgreSQL is able to scale to handle surprisingly large data sets with reasonable performance and solid stability. At the time this conclusion was written, the PostgreSQL database server has been in production use for nearly a year. It is currently maintaining approximately 11 billion records, limited only by disk space. A storage expansion has been purchased and it is expected that with the additional drive space the number of records will be at least double once our maximum retention period is reached for that data.
Using Oracle may provide a small performance gain, especially when the record set being returned from a query is large; however, that performance gain is offset by a higher cost in both technical support costs (required to maintain access to security patches) and the additional downtime needed to perform routine quarterly software updates.
15
List of Symbols, Abbreviations, and Acronyms
ARL U.S. Army Research Laboratory
ASM Automatic Storage Management
CPU central processing unit
I/O input/output
KPIs key performance indicators
OS operating system
SPR Seconds Per Record
SQL search and query language
16
NO. OF COPIES ORGANIZATION ADMNSTR DEFNS TECHL INFO CTR ATTN DTIC OCP 8725 JOHN J KINGMAN RD STE 0944 FT BELVOIR VA 22060-6218 US ARMY RSRCH LAB ATTN RDRL CIN D T PARKER BLDG 310E RM C53 ABERDEEN PROVING GROUND MD 21005 US ARMY RSRCH LAB ATTN RDRL CIN S P RITCHEY BLDG 310E RM C72 ABERDEEN PROVING GROUND MD 21005 US ARMY RSRCH LAB ATTN IMNE ALC HRR MAIL & RECORDS MGMT ATTN RDRL CIO LL TECHL LIB ATTN RDRL CIO LT TECHL PUB ADELPHI MD 20783-1197