Embed Size (px)
Citation preview

PHYSICAL REVIEW C 91, 024602 (2015)
High-accuracy determination of the 238U/ 235U fission cross section ratio up to ≈ 1 GeVat n_TOF at CERN
C. Paradela,1,2 M. Calviani,3 D. Tarrıo,1,4 E. Leal-Cidoncha,1 L. S. Leong,5,6 L. Tassan-Got,5 C. Le Naour,5 I. Duran,1
N. Colonna,7,* L. Audouin,5 M. Mastromarco,7 S. Lo Meo,8 A. Ventura,9 G. Aerts,10 S. Altstadt,11 H. Alvarez,1
F. Alvarez-Velarde,12 S. Andriamonje,10 J. Andrzejewski,13 G. Badurek,14 M. Barbagallo,7 P. Baumann,15 V. Becares,12
F. Becvar,16 F. Belloni,2 B. Berthier,5 E. Berthoumieux,10 J. Billowes,17 V. Boccone,3 D. Bosnar,18 M. Brugger,3 F. Calvino,19
D. Cano-Ott,12 R. Capote,20 C. Carrapico,21 P. Cennini,3 F. Cerutti,3 E. Chiaveri,3 M. Chin,3 G. Cortes,22
M. A. Cortes-Giraldo,23 L. Cosentino,24 A. Couture,25 J. Cox,25 S. David,5 M. Diakaki,26 I. Dillmann,27 C. Domingo-Pardo,28
R. Dressler,29 W. Dridi,10 C. Eleftheriadis,30 M. Embid-Segura,12 L. Ferrant,5 A. Ferrari,3 P. Finocchiaro,24 K. Fraval,10
K. Fujii,31 W. Furman,32 S. Ganesan,33 A. R. Garcıa,12 G. Giubrone,28 M. B. Gomez-Hornillos,22 I. F. Goncalves,21
E. Gonzalez-Romero,12 A. Goverdovski,34 F. Gramegna,35 E. Griesmayer,36 C. Guerrero,3 F. Gunsing,10 P. Gurusamy,33
R. Haight,37 M. Heil,27 S. Heinitz,29 M. Igashira,38 S. Isaev,5 D. G. Jenkins,39 E. Jericha,36 Y. Kadi,3 F. Kappeler,40
D. Karadimos,41 D. Karamanis,41 M. Kerveno,15 V. Ketlerov,34 N. Kivel,29 M. Kokkoris,26 V. Konovalov,34 M. Krticka,16
J. Kroll,16 C. Lampoudis,30 C. Langer,11 C. Lederer,11 H. Leeb,14 R. Losito,3 M. Lozano,23 A. Manousos,30 J. Marganiec,13
T. Martınez,12 S. Marrone,7 C. Massimi,42 P. Mastinu,35 E. Mendoza,12 A. Mengoni,8 P. M. Milazzo,31 F. Mingrone,42
M. Mirea,43 W. Mondelaers,2 C. Moreau,31 M. Mosconi,27 A. Musumarra,44 S. O’Brien,25 J. Pancin,10 N. Patronis,41
A. Pavlik,45 P. Pavlopoulos,3 J. Perkowski,13 L. Perrot,10 M. T. Pigni,14 R. Plag,27 A. Plompen,2 L. Plukis,10 A. Poch,19
C. Pretel,19 J. Praena,23 J. Quesada,23 T. Rauscher,46,47 R. Reifarth,11 A. Riego,22 F. Roman,3 G. Rudolf,15 C. Rubbia,3
P. Rullhusen,2 J. Salgado,21 C. Santos,21 L. Sarchiapone,3 R. Sarmento,21 A. Saxena,33 P. Schillebeeckx,2 S. Schmidt,11
D. Schumann,29 C. Stephan,5 G. Tagliente,7 J. L. Tain,28 L. Tavora,21 R. Terlizzi,7 A. Tsinganis,3 S. Valenta,16 G. Vannini,42
V. Variale,7 P. Vaz,21 R. Versaci,3 M. J. Vermeulen,39 D. Villamarin,12 M. C. Vincente,12 V. Vlachoudis,3 R. Vlastou,26 F. Voss,27
A. Wallner,48 S. Walter,27 T. Ware,17 M. Weigand,11 C. Weiß,3 M. Wiesher,25 K. Wisshak,27 T. Wright,17 and P. Zugec18
(n_TOF Collaboration)1Universidade de Santiago de Compostela, Spain
2European Commission JRC, Institute for Reference Materials and Measurements, Retieseweg 111, B-2440 Geel, Belgium3CERN, Geneva, Switzerland
4Department of Physics and Astronomy, Uppsala University, Sweden5Centre National de la Recherche Scientifique/IN2P3 - IPN, Orsay, France
6Japan Atomic Energy Agency, JAEA, Japan7Istituto Nazionale di Fisica Nucleare, Bari, Italy
8ENEA, Bologna, Italy9Istituto Nazionale di Fisica Nucleare, Bologna, Italy
10CEA/Saclay - IRFU, Gif-sur-Yvette, France11Johann-Wolfgang-Goethe Universitat, Frankfurt, Germany
12Centro de Investigaciones Energeticas Medioambientales y Tecnologicas (CIEMAT), Madrid, Spain13University of Lodz, Lodz, Poland
14Atominstitut der Osterreichischen Universitaten, Technische Universitat Wien, Austria15Centre National de la Recherche Scientifique/IN2P3 - IReS, Strasbourg, France
16Charles University, Prague, Czech Republic17University of Manchester, Oxford Road, Manchester, United Kingdom
18Department of Physics, Faculty of Science, University of Zagreb, Croatia19Universidad Politecnica de Madrid, Spain
20International Atomic Energy Agency (IAEA), Nuclear Data Section, Vienna, Austria21Instituto Superior Tecnico/CTN, Universidade de Lisboa, Portugal
22Universitat Politecnica de Catalunya, Barcelona, Spain23Universidad de Sevilla, Spain
24INFN - Laboratori Nazionali del Sud, Catania, Italy25University of Notre Dame, Notre Dame, Indiana 46556, USA
26National Technical University of Athens (NTUA), Greece27Forschungszentrum Karlsruhe GmbH (FZK), Institut fur Kernphysik, Germany
28Instituto de Fısica Corpuscular, CSIC-Universidad de Valencia, Spain29Paul Scherrer Institut, 5232 Villigen PSI, Switzerland
30Aristotle University of Thessaloniki, Thessaloniki, Greece31Istituto Nazionale di Fisica Nucleare, Trieste, Italy
32Joint Institute for Nuclear Research, Frank Laboratory of Neutron Physics, Dubna, Russia33Bhabha Atomic Research Centre (BARC), Mumbai, India
34Institute of Physics and Power Engineering, Obninsk, Russia
0556-2813/2015/91(2)/024602(11) 024602-1 Published by the American Physical Society
C. PARADELA et al. PHYSICAL REVIEW C 91, 024602 (2015)
35Istituto Nazionale di Fisica Nucleare, Laboratori Nazionali di Legnaro, Italy36Atominstitut, Technische Universitat Wien, Austria
37Los Alamos National Laboratory, Los Alamos, New Mexico 87545, USA38Tokyo Institute of Technology, Tokyo, Japan
39University of York, Heslington, York, United Kingdom40Karlsruhe Institute of Technology (KIT), Institut fur Kernphysik, Karlsruhe, Germany
41University of Ioannina, Greece42Dipartimento di Fisica, Universita di Bologna, and Sezione INFN di Bologna, Italy
43Horia Hulubei National Institute of Physics and Nuclear Engineering - IFIN HH, Bucharest - Magurele, Romania44Dipartimento di Fisica e Astronomia DFA, Universita di Catania and INFN-Laboratori Nazionali del Sud, Catania, Italy
45University of Vienna, Faculty of Physics, Austria46Centre for Astrophysics Research, School of Physics, Astronomy and Mathematics, University of Hertfordshire, Hatfield, United Kingdom
47Department of Physics, University of Basel, Basel, Switzerland48Research School of Physics and Engineering, Australian National University, ACT 0200, Australia
(Received 27 November 2014; published 9 February 2015)
The 238U to 235U fission cross section ratio has been determined at n_TOF up to ≈1 GeV, with two differentdetection systems, in different geometrical configurations. A total of four datasets has been collected andcompared. They are all consistent to each other within the relative systematic uncertainty of 3–4%. The datacollected at n_TOF have been suitably combined to yield a unique fission cross section ratio as a function ofneutron energy. The result confirms current evaluations up to 200 MeV. Good agreement is also observed withtheoretical calculations based on the INCL+ + /Gemini++ combination up to the highest measured energy.The n_TOF results may help solve a long-standing discrepancy between the two most important experimentaldatasets available so far above 20 MeV, while extending the neutron energy range for the first time up to ≈1 GeV.
DOI: 10.1103/PhysRevC.91.024602 PACS number(s): 25.85.Ec, 28.20.−v, 27.90.+b
I. INTRODUCTION
The neutron-induced fission cross section of the two majorisotopes of uranium, 235U and 238U, are of fundamentalimportance in the field of nuclear technology, as well as forother fields of basic and applied nuclear physics. In particular,fission cross section data above a few MeV are important forthe development of new systems for energy production andwaste transmutation, for accelerator and space applications,in neutron flux measurements at high energies, or for therefinement of theoretical models on nuclear fission at highenergy. The 235U(n,f) cross section is a standard at 0.0253 eVand from 0.15 to 200 MeV [1,2], while 238U(n,f) is a standard inthe neutron energy region between 2 and 200 MeV [3]. Whilethe 235U(n,f) cross section is commonly used in a variety offields, for example in neutron flux measurements, from thermalto very high energy, the 238U(n,f) cross section can be moreconveniently used in the presence of a low energy neutronbackground, thanks to its high fission threshold.
Despite its importance, few data have been collected upto now on the 238U(n,f)/ 235U(n,f) cross section ratio above20 MeV. Lisowski et al. [4] measured the ratio at Los AlamosNational Laboratory, from 0.5 to 400 MeV. Current evaluatednuclear data libraries [5] and evaluations of cross section
Published by the American Physical Society under the terms of theCreative Commons Attribution 3.0 License. Further distribution ofthis work must maintain attribution to the author(s) and the publishedarticle’s title, journal citation, and DOI.
standards [1] are mostly based on these results. More recently,Shcherbakov et al. [6] measured the ratio between 1 and200 MeV at the GNEIS facility, Gatchina. Above 50 MeV theseresults are between 5 and 8% lower than those of Lisowskiet al.. On the contrary, results from Nolte et al. [7] seem toconfirm the older measurement, but they are affected by a toolarge systematic uncertainty to draw a final conclusion. New,high-accuracy measurements are therefore required to solvethe long-standing discrepancy, and improve the accuracy incurrent evaluations. An extension of the energy range up tohigher energy would also be desirable, as data above 200 MeVcould prove useful for refining theoretical models, in particularthose used in modern Monte Carlo codes for high-energyneutron transport.
To address the need of new, accurate data for a future crosssection standard, and to extend the current energy limit, aseries of measurements of the 238U(n,f)/ 235U(n,f) cross sectionratio were performed at the n_TOF facility at CERN, from0.5 MeV to 1 GeV, in different experimental campaigns andwith different setups. After a description of the various setupsand analysis procedures in Sec. II, the n_TOF results arepresented and compared with each other in Sec. III. Suitablycombined in a unique dataset, the n_TOF results are thencompared with previous experimental data, with currentevaluations, and with the predictions of a theoretical modelextending up to the highest measured energy. Conclusions arefinally given in Sec. IV.
II. EXPERIMENTAL SETUP
The measurements were performed at the n_TOF facility atCERN [8–11], which is based on the spallation of 20 GeV/c
024602-2
HIGH-ACCURACY DETERMINATION OF THE 238U/ . . . PHYSICAL REVIEW C 91, 024602 (2015)
protons on a Pb target. Data were collected in differentexperimental campaigns and with different experimental se-tups, taking advantage of the very convenient features of theneutron beam, that make this facility particularly suitable formeasurements of neutron-induced fission cross sections [12].In particular, the wide energy distribution of the neutron beam,extending over more than ten orders of magnitude, allows oneto measure the fission cross section up to the GeV region.Furthermore, the long flight path, close to 200 m, ensured agood energy resolution at all energies.
The 238U(n,f)/ 235U(n,f) cross section ratio can be deter-mined from the background-subtracted fission events C(En),as a function of neutron energy, according to the followingexpressions:
σ8(En)
σ5(En)= C8(En)
C5(En)× N5
N8× ε5
ε8× CF. (1)
Here the subscripts 8 and 5 refer to the 238U(n,f) and235U(n,f) reactions, respectively, N is the areal density ofthe samples used in the measurements (in atoms/b), ε isthe detection efficiency for fission events, and CF accountsfor other corrections, in particular for the detection deadtime. It is important to note that the ratio does not dependon either the shape or the absolute value of the neutronflux, since the two samples, having the same diameter, aremeasured simultaneously and in the same experimental setup,i.e., are exposed to the same neutron flux. As a consequence,the final uncertainties in the cross section ratio will mostlybe determined by the uncertainty on the areal density of thetwo samples, and on the ratio of the efficiency and dead-timecorrections.
The data reported here were collected with two detectionsystems: a fission ionization chamber (FIC), in which a singlefission fragment (FF) is detected, and an array of parallel plateavalanche counters (PPACs), in which the two FFs are detectedin coincidence. This last detection system was used in twogeometrical configurations: one with the detectors mountedperpendicularly to the neutron beam direction, and the other(a tilted configuration) with the detectors at an angle of 45◦relative to the neutron beam direction. A brief description ofthe detectors and other experimental details is given below foreach setup, together with the systematic uncertainties affectingthe corresponding results. All data here reported were collectedwith a large-aperture collimator (8 cm diameter). With suchan arrangement, the beam profile is essentially flat over thesurface of the samples, which were �8 cm in diameter. Thisfeature is of great advantage, since it minimizes the effectof possible inhomogeneities of the fissile deposit. Anotherimportant aspect of the n_TOF neutron beam regards theneutron energy resolution in the range reported here. Above afew MeV, this is dominated by the width of the proton beam,of 6 ns (r.m.s.). Considering the long flight path of 185 m, theenergy resolution is better than 1% at 100 MeV, and reachesslightly over 5% at 1 GeV.
A. The FIC chamber
The fast ionization chamber (FIC) used in the measurementis described in detail in Ref. [13]. It is made of a stack of
ionization chambers mounted along the direction of theneutron beam. Each cell consists of a central aluminumelectrode 100 μm thick, plated on both sides with the isotopeto be measured, and two external 15-μm-thick aluminum elec-trodes. Different versions of the FIC were built. One of them,the FIC1, was specifically built for measurements of highlyradioactive samples, and according to CERN regulations hadto comply with the ISO2919 standard, as a “sealed source.”For this reason, the case was made in stainless steel, and thechamber was equipped with thick stainless steel windows. Thesecond version of the ionization chamber, FIC2, was muchlighter and was directly coupled to the vacuum beam pipe, withonly a 125-μm-kapton window at the gas/vacuum interface.For this reason, this second version was less sensitive to theso-called γ -flash, i.e., the prompt signal caused in the detectorby spallation γ rays and relativistic particles. In both FIC1and FIC2 chambers the gap between electrodes was 5 mm. Allchambers were operated with a gas mixture of 90% Ar and10% CF4 at a pressure of 720 mbar. The detector signals wereamplified by a current feedback operational amplifier AD844and digitized with a flash analog-to-digital converter (FADC)with 8-bit resolution and 250 MHz sampling rate. The fasttiming properties of the gas and of the front-end electronicsresulted in a fast signal with a typical rise time of 40 ns and afall time of 120 ns.
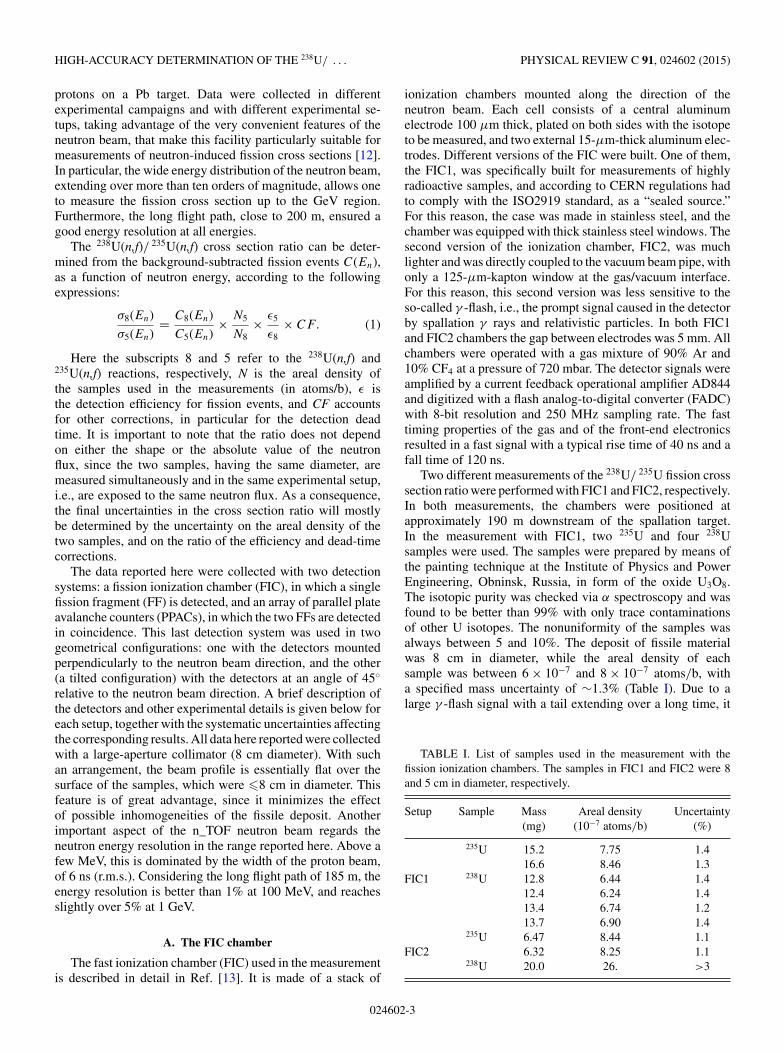
Two different measurements of the 238U/ 235U fission crosssection ratio were performed with FIC1 and FIC2, respectively.In both measurements, the chambers were positioned atapproximately 190 m downstream of the spallation target.In the measurement with FIC1, two 235U and four 238Usamples were used. The samples were prepared by means ofthe painting technique at the Institute of Physics and PowerEngineering, Obninsk, Russia, in form of the oxide U3O8.The isotopic purity was checked via α spectroscopy and wasfound to be better than 99% with only trace contaminationsof other U isotopes. The nonuniformity of the samples wasalways between 5 and 10%. The deposit of fissile materialwas 8 cm in diameter, while the areal density of eachsample was between 6 × 10⁻⁷ and 8 × 10⁻⁷ atoms/b, witha specified mass uncertainty of ∼1.3% (Table I). Due to alarge γ -flash signal with a tail extending over a long time, it
TABLE I. List of samples used in the measurement with thefission ionization chambers. The samples in FIC1 and FIC2 were 8and 5 cm in diameter, respectively.
Setup Sample Mass Areal density Uncertainty(mg) (10−7 atoms/b) (%)
235U 15.2 7.75 1.416.6 8.46 1.3
FIC1 238U 12.8 6.44 1.412.4 6.24 1.413.4 6.74 1.213.7 6.90 1.4
235U 6.47 8.44 1.1FIC2 6.32 8.25 1.1
238U 20.0 26. >3
024602-3
C. PARADELA et al. PHYSICAL REVIEW C 91, 024602 (2015)
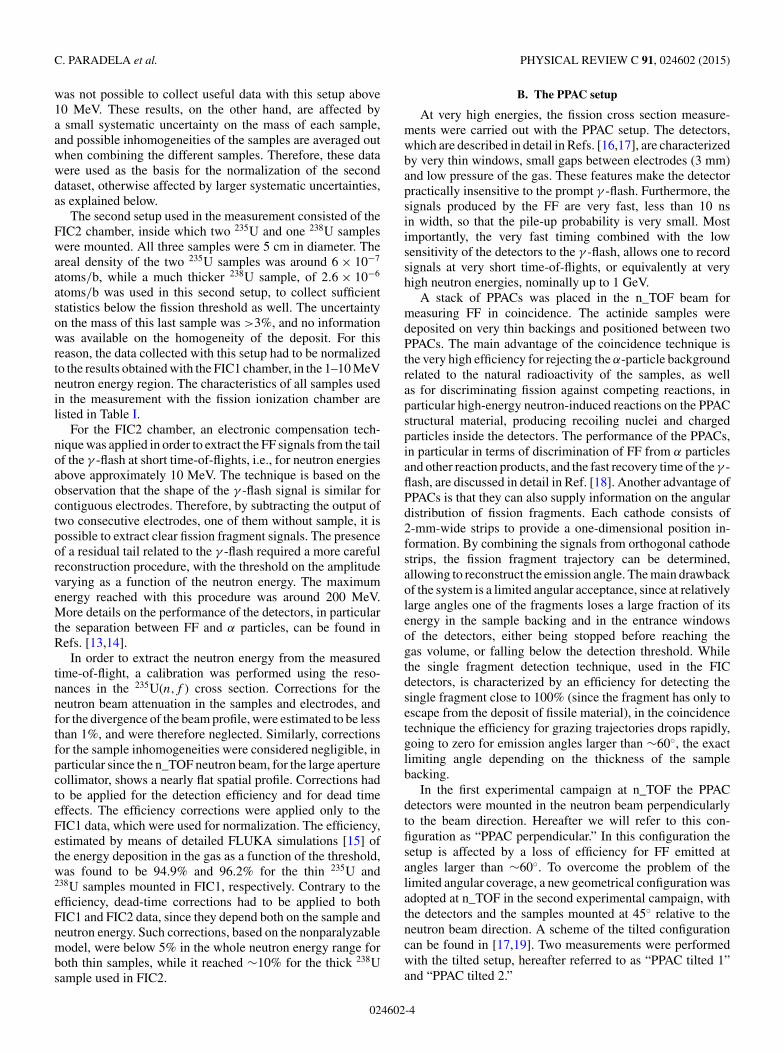
was not possible to collect useful data with this setup above10 MeV. These results, on the other hand, are affected bya small systematic uncertainty on the mass of each sample,and possible inhomogeneities of the samples are averaged outwhen combining the different samples. Therefore, these datawere used as the basis for the normalization of the seconddataset, otherwise affected by larger systematic uncertainties,as explained below.
The second setup used in the measurement consisted of theFIC2 chamber, inside which two 235U and one 238U sampleswere mounted. All three samples were 5 cm in diameter. Theareal density of the two 235U samples was around 6 × 10⁻⁷
atoms/b, while a much thicker 238U sample, of 2.6 × 10⁻⁶
atoms/b was used in this second setup, to collect sufficientstatistics below the fission threshold as well. The uncertaintyon the mass of this last sample was >3%, and no informationwas available on the homogeneity of the deposit. For thisreason, the data collected with this setup had to be normalizedto the results obtained with the FIC1 chamber, in the 1–10 MeVneutron energy region. The characteristics of all samples usedin the measurement with the fission ionization chamber arelisted in Table I.
For the FIC2 chamber, an electronic compensation tech-nique was applied in order to extract the FF signals from the tailof the γ -flash at short time-of-flights, i.e., for neutron energiesabove approximately 10 MeV. The technique is based on theobservation that the shape of the γ -flash signal is similar forcontiguous electrodes. Therefore, by subtracting the output oftwo consecutive electrodes, one of them without sample, it ispossible to extract clear fission fragment signals. The presenceof a residual tail related to the γ -flash required a more carefulreconstruction procedure, with the threshold on the amplitudevarying as a function of the neutron energy. The maximumenergy reached with this procedure was around 200 MeV.More details on the performance of the detectors, in particularthe separation between FF and α particles, can be found inRefs. [13,14].
In order to extract the neutron energy from the measuredtime-of-flight, a calibration was performed using the reso-nances in the 235U(n,f ) cross section. Corrections for theneutron beam attenuation in the samples and electrodes, andfor the divergence of the beam profile, were estimated to be lessthan 1%, and were therefore neglected. Similarly, correctionsfor the sample inhomogeneities were considered negligible, inparticular since the n_TOF neutron beam, for the large aperturecollimator, shows a nearly flat spatial profile. Corrections hadto be applied for the detection efficiency and for dead timeeffects. The efficiency corrections were applied only to theFIC1 data, which were used for normalization. The efficiency,estimated by means of detailed FLUKA simulations [15] ofthe energy deposition in the gas as a function of the threshold,was found to be 94.9% and 96.2% for the thin 235U and238U samples mounted in FIC1, respectively. Contrary to theefficiency, dead-time corrections had to be applied to bothFIC1 and FIC2 data, since they depend both on the sample andneutron energy. Such corrections, based on the nonparalyzablemodel, were below 5% in the whole neutron energy range forboth thin samples, while it reached ∼10% for the thick 238Usample used in FIC2.
B. The PPAC setup
At very high energies, the fission cross section measure-ments were carried out with the PPAC setup. The detectors,which are described in detail in Refs. [16,17], are characterizedby very thin windows, small gaps between electrodes (3 mm)and low pressure of the gas. These features make the detectorpractically insensitive to the prompt γ -flash. Furthermore, thesignals produced by the FF are very fast, less than 10 nsin width, so that the pile-up probability is very small. Mostimportantly, the very fast timing combined with the lowsensitivity of the detectors to the γ -flash, allows one to recordsignals at very short time-of-flights, or equivalently at veryhigh neutron energies, nominally up to 1 GeV.
A stack of PPACs was placed in the n_TOF beam formeasuring FF in coincidence. The actinide samples weredeposited on very thin backings and positioned between twoPPACs. The main advantage of the coincidence technique isthe very high efficiency for rejecting the α-particle backgroundrelated to the natural radioactivity of the samples, as wellas for discriminating fission against competing reactions, inparticular high-energy neutron-induced reactions on the PPACstructural material, producing recoiling nuclei and chargedparticles inside the detectors. The performance of the PPACs,in particular in terms of discrimination of FF from α particlesand other reaction products, and the fast recovery time of the γ -flash, are discussed in detail in Ref. [18]. Another advantage ofPPACs is that they can also supply information on the angulardistribution of fission fragments. Each cathode consists of2-mm-wide strips to provide a one-dimensional position in-formation. By combining the signals from orthogonal cathodestrips, the fission fragment trajectory can be determined,allowing to reconstruct the emission angle. The main drawbackof the system is a limited angular acceptance, since at relativelylarge angles one of the fragments loses a large fraction of itsenergy in the sample backing and in the entrance windowsof the detectors, either being stopped before reaching thegas volume, or falling below the detection threshold. Whilethe single fragment detection technique, used in the FICdetectors, is characterized by an efficiency for detecting thesingle fragment close to 100% (since the fragment has only toescape from the deposit of fissile material), in the coincidencetechnique the efficiency for grazing trajectories drops rapidly,going to zero for emission angles larger than ∼60◦, the exactlimiting angle depending on the thickness of the samplebacking.
In the first experimental campaign at n_TOF the PPACdetectors were mounted in the neutron beam perpendicularlyto the beam direction. Hereafter we will refer to this con-figuration as “PPAC perpendicular.” In this configuration thesetup is affected by a loss of efficiency for FF emitted atangles larger than ∼60◦. To overcome the problem of thelimited angular coverage, a new geometrical configuration wasadopted at n_TOF in the second experimental campaign, withthe detectors and the samples mounted at 45◦ relative to theneutron beam direction. A scheme of the tilted configurationcan be found in [17,19]. Two measurements were performedwith the tilted setup, hereafter referred to as “PPAC tilted 1”and “PPAC tilted 2.”
024602-4

HIGH-ACCURACY DETERMINATION OF THE 238U/ . . . PHYSICAL REVIEW C 91, 024602 (2015)
TABLE II. Characteristics of the samples used with the PPACsetup, both in the perpendicular configuration and in the firstmeasurement with the tilted configuration (“PPAC tilted 1”).
Sample Mass Areal density Uncertainty(mg) (10−7 atoms/b) (%)
235U 13.97 6.98 0.7238U 11.5 5.86 0.7
In all PPAC measurements the samples, prepared at IN2P3-Orsay, were 8 cm in diameter, with the fissile materialelectrodeposited on thin aluminum foils 2.0 and 0.7 μmin thickness in the first two and in the third measurement,respectively. The characteristics of the samples used in thefirst two cases are listed in Table II. The mass of the sampleswas determined by means of α counting. For the 235U sample,the impurities were determined by mass spectrometry, whichprovided the atom ratios of 0.0628(1) and 7.472(15) × 10−3
for the 238U/ 235U and 234U/ 235U, respectively. The latter hasbeen used to extract the total mass of 235U from the measuredα activity. The 238U sample was of very high purity, as itwas produced by magnetic separation from natural uranium.The homogeneity of the deposits was checked by α scan-ning, for the 235U sample, and by Rutherford backscatteringspectroscopy (RBS) for the 235U and 238U samples. RBS alsoprovided the chemical composition of samples and backings.Apart from the contamination of 238U in the 235U sample, takeninto account in the analysis, only trace concentrations of otherisotopes were found in the samples (see Refs. [16,20]). Thesamples of the last measurement (PPAC tilted 2) have not beencharacterized with the necessary accuracy. As a consequence,this last dataset has been normalized to the ENDF/B-VII.1evaluated ratio between 3 and 5 MeV.
In both configurations, a correction had to be appliedfor the loss of efficiency related to the stopping of one ofthe fission fragments in the sample backing. Because of theangular dependence of the efficiency, the fission fragmentangular distribution (FFAD) had to be considered. To thisend, corrections were calculated, by means of Monte Carlosimulations, on the basis of existing experimental results onthe FFAD as a function of the neutron energy, reported inthe EXFOR database for both isotopes [21]. More detailson the procedure can be found in Refs. [16,20]. The FFADis expressed as the sum of even Legendre polynomials interms of the cosine of the emission angle (because of theforward-backward symmetry of the emitted FFs). In this work,polynomials up to second order only were considered, asthere is no reliable information in literature about higherorder coefficients. The energy-dependent coefficients weredetermined from the so-called anisotropy parameter, A(E),defined as the ratio between the emission probability of the FFat 0 and 90◦, W (E,0◦)/W (E,90◦). The angular anisotropy of235U and 238U was obtained by fitting the available literaturedata in the EXFOR database [21] up to ∼20 and 100 MeVneutron energy in the case of 235U and 238U, respectively.Above those energies, the anisotropy was assumed to approachunity asymptotically. The data and the results of the fit areshown in Fig. 1.
FIG. 1. (Color online) Anisotropy in the emission angle of FF inthe neutron-induced fission of 238U (upper panel) and 235U (lowerpanel), as a function of the neutron energy. The curves representthe results of a fit of the various experimental data with Legendrepolynomials.
FIG. 2. (Color online) Efficiency for detecting FFs in coinci-dence with the PPAC setup, in the two geometrical configurations.In the tilted setup, the gain of efficiency at large emission angles iscompensated by a corresponding loss at all other angles.
024602-5

C. PARADELA et al. PHYSICAL REVIEW C 91, 024602 (2015)
FIG. 3. (Color online) Ratio between the efficiencies for detect-ing a fission event from the 235U and 238U samples respectively. Thevarious structures in the efficiency ratio corresponds to the structuresin the angular anisotropy of FF emission in the two reactions.
The detection efficiency of the PPAC setup as a function ofthe FF emission angle is shown in Fig. 2 for the perpendicularand tilted configurations. The figure clearly shows the dif-ference between the two configurations: in the perpendicularcase, the efficiency is flat up to a given angle (around ∼60◦),and drops to zero above this limit. On the contrary, in the tiltedconfiguration all FF emission angles are covered. The gainin efficiency at large angles is obviously compensated by areduction of the efficiency at smaller angles, due to the cut inthe azimuthal angle related to the stopping of the fragmentsin the dead layers (sample backing and PPAC windows). Asexpected, the global efficiency, i.e., the efficiency integratedover the polar angle, is nearly the same in both perpendicularand tilted configuration, but the latter has the advantage of asmaller influence of the angular anisotropy of FF emission.
The analysis of the tilted configuration is described in greatdetail in Refs. [17,22,23]. Several conditions were appliedin order to identify the fission fragments, reconstruct thetrajectory of each fragment, and reject all possible sourcesof background. The efficiency corrections obtained by MonteCarlo simulations [22] were confirmed by means of a methodbased exclusively on experimental data [23]. Contrary to the
TABLE III. Systematic uncertainties (in %) on the data collectedin the four different measurements of the 238U/ 235U fission crosssection ratio. “Others” refers to dead-time corrections. Since thesame samples were used in the second and third measurement, thecorresponding uncertainties on the sample mass are fully correlated.For the last dataset, normalized to ENDF/B-VII.1, the uncertainty inthe mass is replaced by the one in the evaluated cross sections.
Setup Samples Efficiency Others Total
FIC 2 1 3 3.5PPAC perpend. 1.1 3 <1 �3PPAC tilted 1 1.1 2 <1 �3PPAC tilted 2 (∼1) 1 <1 2.5
FIG. 4. (Color online) The 238U/ 235U fission cross section ratiomeasured at n_TOF with the different setups, in the neutron energyrange 500 keV - 20 MeV. The error bars represent only the statisticaluncertainties. For comparison, the ratio calculated on the basis of theevaluated cross sections from ENDF/B-VII.1 is also shown in thefigure (solid line).
perpendicular configuration, a dependence of the efficiencyon the polar angle has to be taken into account, together withother effects related to the viewing angle of the sample by thedetectors.
As shown in Eq. (1), the cross section ratio depends on theratio of the efficiency for detecting a fission event from the235U and the 238U samples respectively. The ratio is shownin Fig. 3, for the two different configurations. In both cases,the correction is of at most 4%. The systematic uncertaintiesaffecting the various PPAC measurements, as well as themeasurement with the FIC, are listed in Table III.
III. RESULTS AND DISCUSSION
Figure 4 shows the results of the different measurements ofthe 238U/ 235U fission cross section ratio, for neutron energiesin the range 500 keV–20 MeV. For comparison, the ratioextracted from the ENDF/B-VII.1 evaluated cross sections is
FIG. 5. (Color online) The 238U/ 235U fission cross section ratiofrom the different n_TOF measurements, in the neutron energy range500 keV–1 GeV.
024602-6
HIGH-ACCURACY DETERMINATION OF THE 238U/ . . . PHYSICAL REVIEW C 91, 024602 (2015)
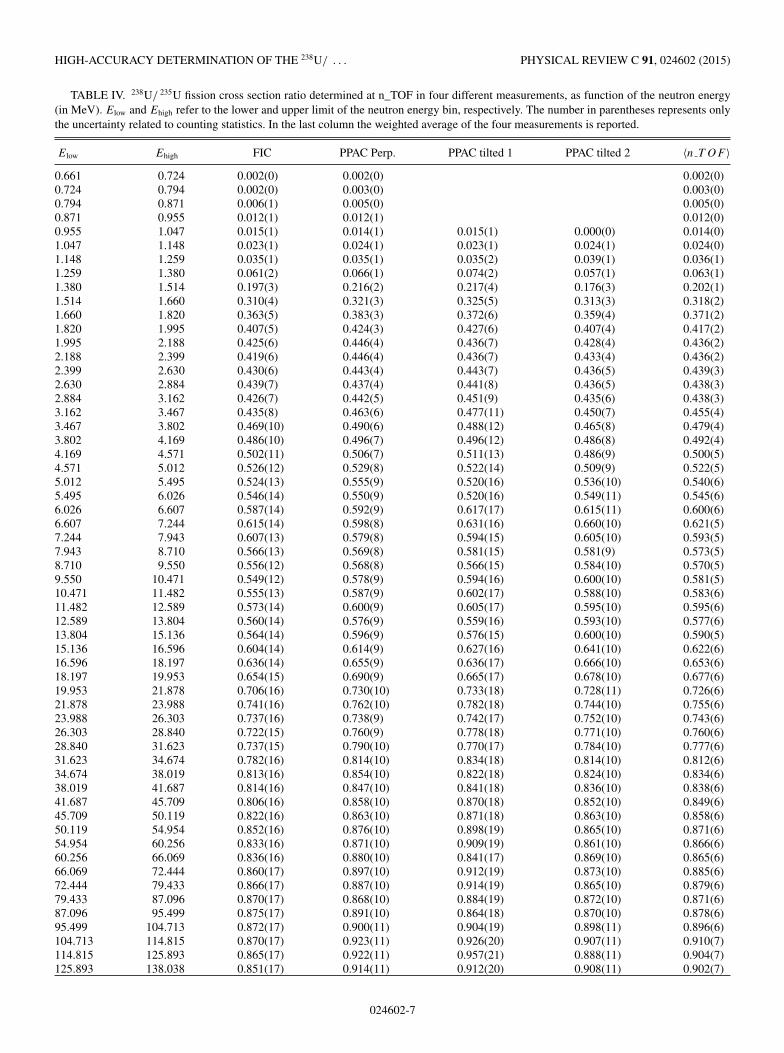
TABLE IV. 238U/ 235U fission cross section ratio determined at n_TOF in four different measurements, as function of the neutron energy(in MeV). Elow and Ehigh refer to the lower and upper limit of the neutron energy bin, respectively. The number in parentheses represents onlythe uncertainty related to counting statistics. In the last column the weighted average of the four measurements is reported.
Elow Ehigh FIC PPAC Perp. PPAC tilted 1 PPAC tilted 2 〈n T OF 〉0.661 0.724 0.002(0) 0.002(0) 0.002(0)0.724 0.794 0.002(0) 0.003(0) 0.003(0)0.794 0.871 0.006(1) 0.005(0) 0.005(0)0.871 0.955 0.012(1) 0.012(1) 0.012(0)0.955 1.047 0.015(1) 0.014(1) 0.015(1) 0.000(0) 0.014(0)1.047 1.148 0.023(1) 0.024(1) 0.023(1) 0.024(1) 0.024(0)1.148 1.259 0.035(1) 0.035(1) 0.035(2) 0.039(1) 0.036(1)1.259 1.380 0.061(2) 0.066(1) 0.074(2) 0.057(1) 0.063(1)1.380 1.514 0.197(3) 0.216(2) 0.217(4) 0.176(3) 0.202(1)1.514 1.660 0.310(4) 0.321(3) 0.325(5) 0.313(3) 0.318(2)1.660 1.820 0.363(5) 0.383(3) 0.372(6) 0.359(4) 0.371(2)1.820 1.995 0.407(5) 0.424(3) 0.427(6) 0.407(4) 0.417(2)1.995 2.188 0.425(6) 0.446(4) 0.436(7) 0.428(4) 0.436(2)2.188 2.399 0.419(6) 0.446(4) 0.436(7) 0.433(4) 0.436(2)2.399 2.630 0.430(6) 0.443(4) 0.443(7) 0.436(5) 0.439(3)2.630 2.884 0.439(7) 0.437(4) 0.441(8) 0.436(5) 0.438(3)2.884 3.162 0.426(7) 0.442(5) 0.451(9) 0.435(6) 0.438(3)3.162 3.467 0.435(8) 0.463(6) 0.477(11) 0.450(7) 0.455(4)3.467 3.802 0.469(10) 0.490(6) 0.488(12) 0.465(8) 0.479(4)3.802 4.169 0.486(10) 0.496(7) 0.496(12) 0.486(8) 0.492(4)4.169 4.571 0.502(11) 0.506(7) 0.511(13) 0.486(9) 0.500(5)4.571 5.012 0.526(12) 0.529(8) 0.522(14) 0.509(9) 0.522(5)5.012 5.495 0.524(13) 0.555(9) 0.520(16) 0.536(10) 0.540(6)5.495 6.026 0.546(14) 0.550(9) 0.520(16) 0.549(11) 0.545(6)6.026 6.607 0.587(14) 0.592(9) 0.617(17) 0.615(11) 0.600(6)6.607 7.244 0.615(14) 0.598(8) 0.631(16) 0.660(10) 0.621(5)7.244 7.943 0.607(13) 0.579(8) 0.594(15) 0.605(10) 0.593(5)7.943 8.710 0.566(13) 0.569(8) 0.581(15) 0.581(9) 0.573(5)8.710 9.550 0.556(12) 0.568(8) 0.566(15) 0.584(10) 0.570(5)9.550 10.471 0.549(12) 0.578(9) 0.594(16) 0.600(10) 0.581(5)10.471 11.482 0.555(13) 0.587(9) 0.602(17) 0.588(10) 0.583(6)11.482 12.589 0.573(14) 0.600(9) 0.605(17) 0.595(10) 0.595(6)12.589 13.804 0.560(14) 0.576(9) 0.559(16) 0.593(10) 0.577(6)13.804 15.136 0.564(14) 0.596(9) 0.576(15) 0.600(10) 0.590(5)15.136 16.596 0.604(14) 0.614(9) 0.627(16) 0.641(10) 0.622(6)16.596 18.197 0.636(14) 0.655(9) 0.636(17) 0.666(10) 0.653(6)18.197 19.953 0.654(15) 0.690(9) 0.665(17) 0.678(10) 0.677(6)19.953 21.878 0.706(16) 0.730(10) 0.733(18) 0.728(11) 0.726(6)21.878 23.988 0.741(16) 0.762(10) 0.782(18) 0.744(10) 0.755(6)23.988 26.303 0.737(16) 0.738(9) 0.742(17) 0.752(10) 0.743(6)26.303 28.840 0.722(15) 0.760(9) 0.778(18) 0.771(10) 0.760(6)28.840 31.623 0.737(15) 0.790(10) 0.770(17) 0.784(10) 0.777(6)31.623 34.674 0.782(16) 0.814(10) 0.834(18) 0.814(10) 0.812(6)34.674 38.019 0.813(16) 0.854(10) 0.822(18) 0.824(10) 0.834(6)38.019 41.687 0.814(16) 0.847(10) 0.841(18) 0.836(10) 0.838(6)41.687 45.709 0.806(16) 0.858(10) 0.870(18) 0.852(10) 0.849(6)45.709 50.119 0.822(16) 0.863(10) 0.871(18) 0.863(10) 0.858(6)50.119 54.954 0.852(16) 0.876(10) 0.898(19) 0.865(10) 0.871(6)54.954 60.256 0.833(16) 0.871(10) 0.909(19) 0.861(10) 0.866(6)60.256 66.069 0.836(16) 0.880(10) 0.841(17) 0.869(10) 0.865(6)66.069 72.444 0.860(17) 0.897(10) 0.912(19) 0.873(10) 0.885(6)72.444 79.433 0.866(17) 0.887(10) 0.914(19) 0.865(10) 0.879(6)79.433 87.096 0.870(17) 0.868(10) 0.884(19) 0.872(10) 0.871(6)87.096 95.499 0.875(17) 0.891(10) 0.864(18) 0.870(10) 0.878(6)95.499 104.713 0.872(17) 0.900(11) 0.904(19) 0.898(11) 0.896(6)104.713 114.815 0.870(17) 0.923(11) 0.926(20) 0.907(11) 0.910(7)114.815 125.893 0.865(17) 0.922(11) 0.957(21) 0.888(11) 0.904(7)125.893 138.038 0.851(17) 0.914(11) 0.912(20) 0.908(11) 0.902(7)
024602-7
C. PARADELA et al. PHYSICAL REVIEW C 91, 024602 (2015)
TABLE IV. (Continued.)
Elow Ehigh FIC PPAC Perp. PPAC tilted 1 PPAC tilted 2 〈n T OF 〉138.038 151.356 0.882(18) 0.911(11) 0.922(21) 0.893(11) 0.902(7)151.356 165.959 0.889(19) 0.903(11) 0.910(21) 0.933(12) 0.913(7)165.959 181.970 0.893(19) 0.921(12) 0.960(22) 0.923(12) 0.922(7)181.970 199.526 0.906(20) 0.903(12) 0.946(22) 0.922(12) 0.915(7)199.526 218.776 0.865(19) 0.927(12) 0.947(23) 0.911(12) 0.914(7)218.776 239.883 0.899(20) 0.924(13) 0.942(23) 0.937(12) 0.928(8)239.883 263.027 0.924(22) 0.927(13) 0.948(23) 0.905(12) 0.920(8)263.027 288.404 0.895(21) 0.934(13) 0.923(24) 0.939(13) 0.930(8)288.403 316.227 0.869(21) 0.951(13) 0.943(24) 0.941(13) 0.934(8)316.228 346.737 0.890(22) 0.954(14) 0.968(25) 0.920(13) 0.933(8)346.736 380.189 0.919(22) 0.942(14) 0.982(26) 0.926(13) 0.936(8)380.190 416.870 0.914(13) 0.951(25) 0.916(13) 0.919(9)416.870 457.089 0.947(14) 0.976(27) 0.933(13) 0.944(9)457.089 501.188 0.938(14) 0.963(26) 0.941(13) 0.943(9)501.188 549.541 0.953(14) 0.990(28) 0.938(13) 0.950(9)549.541 602.560 0.906(14) 0.937(27) 0.932(13) 0.922(9)602.560 660.694 0.942(15) 1.004(29) 0.971(13) 0.962(9)660.694 724.436 0.913(14) 0.984(29) 0.922(13) 0.924(9)724.436 794.328 0.930(15) 1.019(30) 0.941(13) 0.944(9)794.328 870.964 0.932(15) 0.932(15)870.964 954.993 0.914(15) 0.914(15)
indicated by the solid line. We remind that for neutron energiesbelow 20 MeV a wealth of data are available in the literature,with the standard cross sections of both isotopes characterizedby an uncertainty of less than 1%. Therefore the very goodagreement between n_TOF results and the ENDF/B-VII.1evaluations, evident in Fig. 4, provides strong confidence inthe accuracy of the new data, in particular in the systematicuncertainty related to the sample mass and in the efficiencycorrections. Some minor differences can nevertheless benoticed in the figure, in particular around 12 MeV neutronenergy, where the dip corresponding to a valley in the 238U(n,f)cross section is less pronounced in the n_TOF dataset, relativeto ENDF/B-VII.1 evaluation. Another minor difference can beobserved around the 238U fission threshold, slightly above 1MeV. In this region, the n_TOF data are systematically shiftedto higher energies, possibly indicating that the fission thresholdin the evaluation needs to be increased by a small amount.
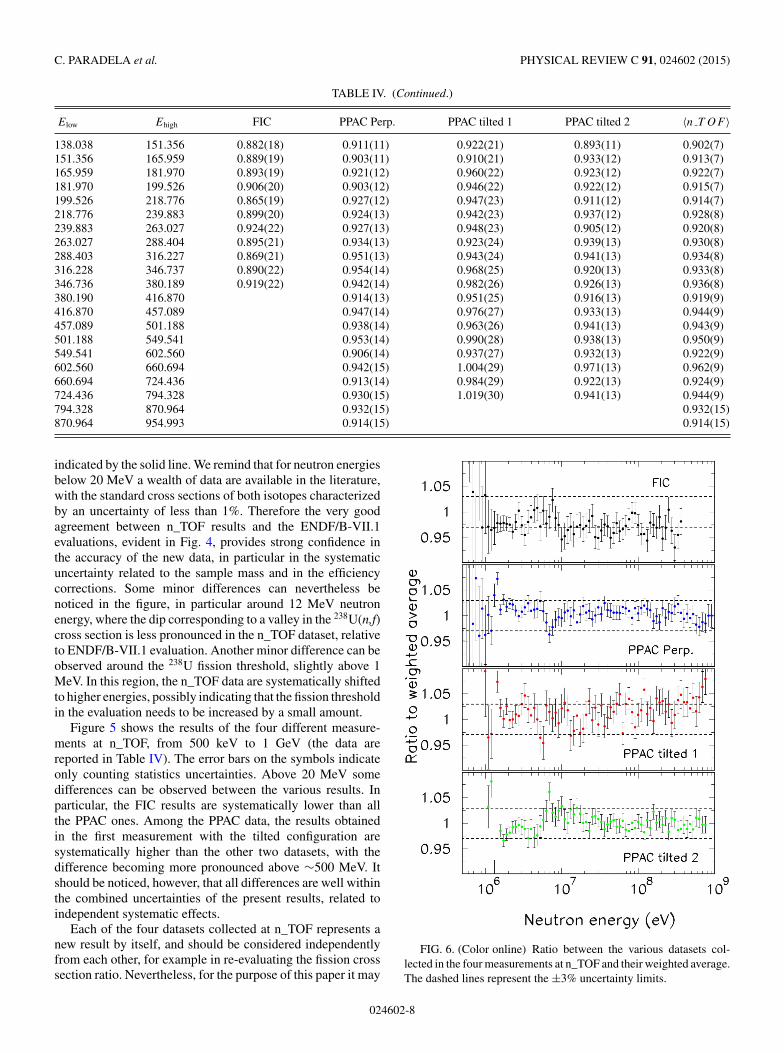
Figure 5 shows the results of the four different measure-ments at n_TOF, from 500 keV to 1 GeV (the data arereported in Table IV). The error bars on the symbols indicateonly counting statistics uncertainties. Above 20 MeV somedifferences can be observed between the various results. Inparticular, the FIC results are systematically lower than allthe PPAC ones. Among the PPAC data, the results obtainedin the first measurement with the tilted configuration aresystematically higher than the other two datasets, with thedifference becoming more pronounced above ∼500 MeV. Itshould be noticed, however, that all differences are well withinthe combined uncertainties of the present results, related toindependent systematic effects.
Each of the four datasets collected at n_TOF represents anew result by itself, and should be considered independentlyfrom each other, for example in re-evaluating the fission crosssection ratio. Nevertheless, for the purpose of this paper it may
FIG. 6. (Color online) Ratio between the various datasets col-lected in the four measurements at n_TOF and their weighted average.The dashed lines represent the ±3% uncertainty limits.
024602-8
HIGH-ACCURACY DETERMINATION OF THE 238U/ . . . PHYSICAL REVIEW C 91, 024602 (2015)
be convenient to combine all four datasets. To this end,a weighted average was performed. Since the uncertaintiesdue to systematic effects are similar in magnitude for thedifferent datasets, only the uncorrelated uncertainties due tocounting statistics were taken into account. The ratio obtainedwith this procedure can be more easily compared with datafrom previous measurements, as well as with evaluationsand theoretical calculations. Moreover, it can be used toanalyze the dispersion of the n_TOF datasets to draw furtherconclusions on their accuracy. This last point is illustratedin Fig. 6, which shows the divergence of the n_TOF resultsfrom their weighted average, as functions of neutron energy.Except for some details, the difference in all cases is withinthe ∼3% systematic uncertainty associated with each dataset.(In the crude approximation adopted here, neglecting possiblecorrelations between some datasets, the systematic uncertaintyon the weighted average is around 1% up to 200 MeV,and between 1 and 2% above this energy.) This observationprovides further strength on the accuracy of the present results.
Comparison with previous results, evaluations,and model predictions
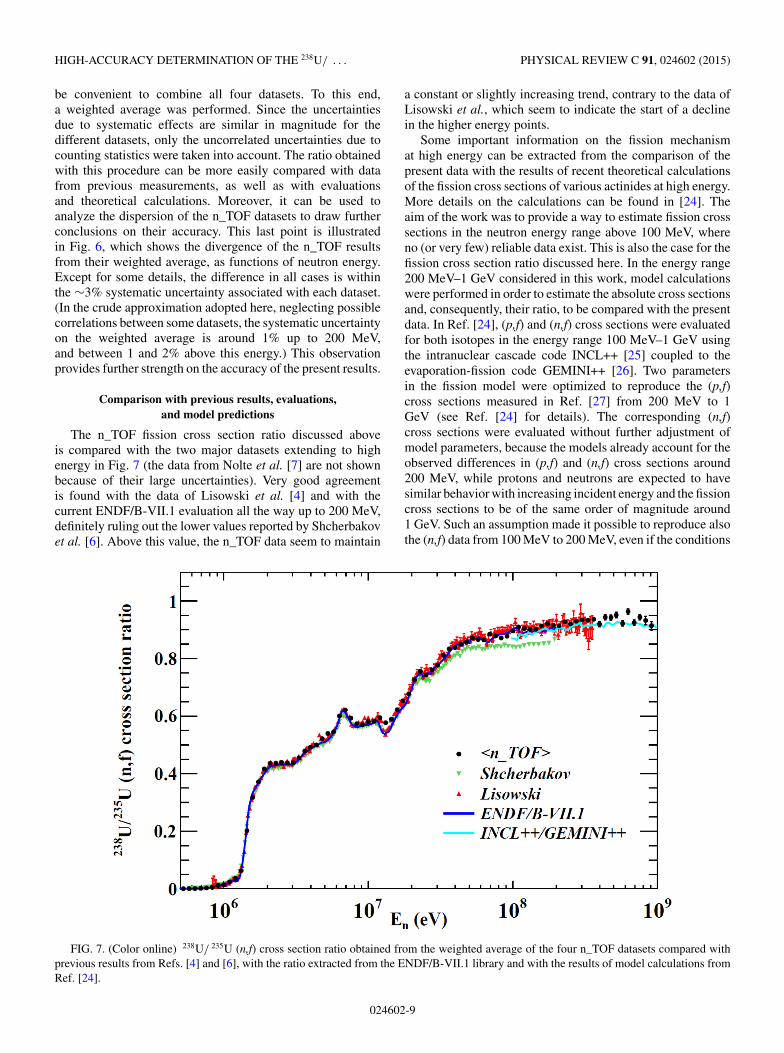
The n_TOF fission cross section ratio discussed aboveis compared with the two major datasets extending to highenergy in Fig. 7 (the data from Nolte et al. [7] are not shownbecause of their large uncertainties). Very good agreementis found with the data of Lisowski et al. [4] and with thecurrent ENDF/B-VII.1 evaluation all the way up to 200 MeV,definitely ruling out the lower values reported by Shcherbakovet al. [6]. Above this value, the n_TOF data seem to maintain
a constant or slightly increasing trend, contrary to the data ofLisowski et al., which seem to indicate the start of a declinein the higher energy points.
Some important information on the fission mechanismat high energy can be extracted from the comparison of thepresent data with the results of recent theoretical calculationsof the fission cross sections of various actinides at high energy.More details on the calculations can be found in [24]. Theaim of the work was to provide a way to estimate fission crosssections in the neutron energy range above 100 MeV, whereno (or very few) reliable data exist. This is also the case for thefission cross section ratio discussed here. In the energy range200 MeV–1 GeV considered in this work, model calculationswere performed in order to estimate the absolute cross sectionsand, consequently, their ratio, to be compared with the presentdata. In Ref. [24], (p,f) and (n,f) cross sections were evaluatedfor both isotopes in the energy range 100 MeV–1 GeV usingthe intranuclear cascade code INCL++ [25] coupled to theevaporation-fission code GEMINI++ [26]. Two parametersin the fission model were optimized to reproduce the (p,f)cross sections measured in Ref. [27] from 200 MeV to 1GeV (see Ref. [24] for details). The corresponding (n,f)cross sections were evaluated without further adjustment ofmodel parameters, because the models already account for theobserved differences in (p,f) and (n,f) cross sections around200 MeV, while protons and neutrons are expected to havesimilar behavior with increasing incident energy and the fissioncross sections to be of the same order of magnitude around1 GeV. Such an assumption made it possible to reproduce alsothe (n,f) data from 100 MeV to 200 MeV, even if the conditions
FIG. 7. (Color online) 238U/ 235U (n,f) cross section ratio obtained from the weighted average of the four n_TOF datasets compared withprevious results from Refs. [4] and [6], with the ratio extracted from the ENDF/B-VII.1 library and with the results of model calculations fromRef. [24].
024602-9

C. PARADELA et al. PHYSICAL REVIEW C 91, 024602 (2015)
FIG. 8. (Color online) Deviation of the average n_TOF238U/ 235U (n,f) cross section ratio from the predictions of the majorevaluated nuclear data libraries and from the INCL++/GEMINI++model calculations. The horizontal lines represent the limit of ±2%deviation.
of validity of the intranuclear cascade model are poorlysatisfied at such relatively low energies. The theoretical crosssections are affected by statistical errors inherent in the MonteCarlo technique, which propagate to their ratios and have to beconsidered in the comparison with the experiment. The resultsof the model calculations, which are show in Fig. 7 by thelight-blue curve, are in good agreement with present data at allenergies. Although some systematic effects in the calculationsmay be at least partially compensated in the cross section ratio,the good agreement indicates that the theoretical treatmentof Lo Meo et al. might be adequate for predicting the fissioncross section of actinides above 100 MeV neutron energy.
More evidences in this respect could come from additionalfission studies at n_TOF up to 1 GeV.
A more quantitative comparison between the 238U/ 235Ufission cross section ratio measured at n_TOF and evaluationsor model calculation is shown in Fig. 8. For completeness, thepresent results are also compared with the libraries JEFF3.2and JENDL-HE-2007 [5]. While the former contains dataonly up to 30 MeV, the latter extends up to 3 GeV, being infact the only library reporting evaluated cross sections above200 MeV. While ENDF/B-VII.1 and the INCL++/GEMINI++predictions agree, within 2%, with the present result, arelatively large difference exists with respect to the JEFF3.2library, in the whole energy region from threshold to 30 MeV. Areasonable agreement is observed relative to JENDL-HE-2007at all energies, although a strange behaviour is observed around∼300 MeV, with the ratio of the evaluated cross sections sud-denly increasing above this energy. A final consideration can bemade regarding the energy region around the fission thresholdof 238U. A difference is observed relative to all major libraries,although not always in the same direction, possibly indicatinga slight under- or overestimate of the threshold energy.
IV. CONCLUSIONS
The 238U/ 235U fission cross section ratio has been mea-sured at n_TOF, for the first time up to 1 GeV, with two differentdetection systems, one of which was used in two differentgeometrical configurations. The results of the measurementsagree with each other within the estimated systematic uncer-tainty of approximately 3%. Furthermore, the results are in allcases in agreement with evaluated cross sections and standardvalues between 0.5 and 20 MeV, thus providing confidencein their accuracy. The results have been combined in orderto obtain a unique dataset for comparison with previousresults and evaluations, up to 200 MeV, and with theoreticalcalculations based on the intranuclear cascade model coupledwith an evaporation-fission code, all the way up to 1 GeV. Theextracted ratio rules out the results of Shcherbakov et al., and isin very good agreement both with ENDF/B-VII.1 evaluation,up to 200 MeV, and with theoretical calculations up to 1 GeV.Some differences are instead observed between present dataand other major libraries. These results could be used toimprove the accuracy of current libraries, and in particularof the standard used in a variety of applications.
ACKNOWLEDGMENTS
The research leading to these results has received fund-ing from the European Atomic Energy Communitys (Eu-ratom) Seventh Framework Program FP7/2007-2011 underthe Project CHANDA (Grant No. 605203).
[1] A. Carlson et al., Nucl. Data Sheets 110, 3215 (2009).[2] https://www-nds.iaea.org/standards/Data/endf-6-format/std-
092_U_235.endf.[3] http://www-nds.iaea.org/standards/Data/endf-6-format/std-
092_U_238.endf .
[4] P. Lisowski, A. Gavron, W. E. Parker, S. J. Balestrini,A. D. Carlson, O. A. Wasson, and N. W. Hill, Proceedingsof the International Conference on Nuclear Data for Scienceand Technology, May 13-17 1991, Julich, Germany (Springer-Verlag, Berlin, Heidelberg, 1992), p. 732 .
024602-10

HIGH-ACCURACY DETERMINATION OF THE 238U/ . . . PHYSICAL REVIEW C 91, 024602 (2015)
[5] https://www-nds.iaea.org/exfor/endf.htm.[6] O. Shcherbakov et al., J. Nucl. Sci. Technol. 39, 230 (2002).[7] R. Nolte, M. S. Allie, F. D. Brooks, A. Buffler, V. Dangendorf,
J. P. Meulders, H. Schuhmacher, F. D. Smit, and M. Weierganz,Nucl. Sci. Eng. 156, 197 (2007).
[8] https://ntof-exp.web.cern.ch/ntof-exp/.[9] U. Abbondanno et al., CERN/INTC-O-011 INTC-2002-037,
CERN-SL-2002-053 ECT (2003).[10] C. Guerrero et al., Eur. Phys. J. A 49, 27 (2013).[11] M. Barbagallo et al., Eur. Phys. J. A 49, 156 (2013).[12] N. Colonna et al., Energy Environ. Sci. 3, 1910 (2010).[13] M. Calviani et al., Nucl. Instrum. Methods Phys. Res., Sect. A
594, 220 (2008).[14] M. Calviani et al., Phys. Rev. C 80, 044604 (2009).[15] T. T. Bohlen, F. Cerutti, M. P. W. Chin, A. Fasso, A. Ferrari, P. G.
Ortega, A. Mairani, P. R. Sala, G. Smirnov, and V. Vlachoudis,Nucl. Data Sheets 120, 211 (2014).
[16] C. Paradela et al., Phys. Rev. C 82, 034601 (2010).[17] D. Tarrıo et al., Nuclear Instrum. Methods Phys. Res., Sect. A
743, 79 (2014).
[18] C. Paradela, I. Duran, D. Tarrıo, L. Audouin, L. Tassan-Got, and C. Stephan, Proceedings of the 2nd Interna-tional Conference on Advancements in Nuclear Instrumen-tation Measurement Methods and their Applications (ANI-MMA), June, 2011, Ghent, Belgium (IEEE, Ghent, 2011),pp. 6–9.
[19] D. Tarrıo et al., Nucl. Data Sheets 119, 35 (2014).[20] D. Tarrıo et al., Phys. Rev. C 83, 044620 (2011).[21] https://www-nds.iaea.org/exfor/exfor.htm.[22] D. Tarrıo, Ph.D. thesis, Universidade de Santiago de
Compostela, Spain, 2012.[23] L. S. Leong and L. Tassan-Got, Ph.D. thesis, University of Paris,
France, 2013.[24] S. Lo Meo, D. Mancusi, C. Massimi, G. Vannini, and A. Ventura,
Nucl. Phys. A 933, 43 (2015).[25] A. Boudard, J. Cugnon, J.-C. David, S. Leray, and D. Mancusi,
Phys. Rev. C 87, 014606 (2013).[26] D. Mancusi, R. J. Charity, and J. Cugnon, Phys. Rev. C 82,
044610 (2010).[27] A. Kotov et al., Phys. Rev. C 74, 034605 (2006).
024602-11