Embed Size (px)
Citation preview
J. Finan. Intermediation 16 (2007) 555–583www.elsevier.com/locate/jfi
Herd behavior in the Japanese loan market:Evidence from bank panel data
Hirofumi Uchida a,∗, Ryuichi Nakagawa b,c
a Faculty of Economics, Wakayama University, 930 Sakaedani, Wakayama 640-8510, Japanb Center on Japanese Economy and Business, Columbia University, 321 Uris Hall, 3022 Broadway,
New York, NY 10027-6902, USAc Faculty of Economics, Kansai University, 3-3-35 Yamate Suita, Osaka 564-8680, Japan
Received 17 March 2006
Available online 8 June 2007
Abstract
This paper investigates whether Japanese banks had been following herd behavior in the domestic loanmarket from 1975 through 2000. Applying the technique developed by Lakonishok, Shleifer, and Vishny[Lakonishok, J., Shleifer, A., Vishny, R.V., 1992. The impact of institutional trading on stock prices, J. Fi-nan. Econ. 32, 23–43] to the data from loans outstanding to different types of borrowers, we obtain evidenceindicative of the existence of herding. City banks in Japan had been following a cyclical pattern of herdingwith one of the peaks around the bubble period in the late 1980s. Adjusting further for herding resultingfrom rational behavior, evidence indicative of the existence of irrational herding was observed only in thebubble period. Our estimate indicates that a total of some 5 trillion yen of loan increase by city banks duringthe period of 1987–1989 can be attributed to irrational herd behavior. The results imply that irrational bankbehavior in the late 1980s might have contributed to the problems Japanese banks had with non-performingloans. We also obtained evidence for herding among regional banks and among geographically proximatebanks.© 2007 Elsevier Inc. All rights reserved.
JEL classification: C12; G14; G23
Keywords: Herd behavior; LSV herding measure; Adjusted LSV herding measure; Banks; Loan market; Japan
* Corresponding author. Fax: 81 73 457 7711.E-mail addresses: [email protected] (H. Uchida), [email protected] (R. Nakagawa).URLs: http://www.eco.wakayama-u.ac.jp/~uchida/ (H. Uchida), http://www2.ipcku.kansai-u.ac.jp/~ryu-naka/
(R. Nakagawa).
1042-9573/$ – see front matter © 2007 Elsevier Inc. All rights reserved.doi:10.1016/j.jfi.2007.03.007

556 H. Uchida, R. Nakagawa / J. Finan. Intermediation 16 (2007) 555–583
1. Introduction
The non-performing loan problem is considered to be one of the biggest causes behind theJapanese banking crisis, which has existed since the early 1990s. It is very important to clarify themechanism behind the accumulation of non-performing loans because the problem has causeda malfunctioning of the Japanese banking sector and deteriorated the credit channel of Japanesemonetary policy.1 Investigation of the mechanism is also important for other economies withbank-oriented financial systems to draw a lesson from the Japanese experience.
Irrational herd behavior by Japanese banks during the bubble period in the late 1980s isoften blamed as one of the factors that brought about the accumulation of non-performing loans.An anecdotal explanation of this phenomenon is that Japanese banks did not exert sufficientmonitoring effort, and uniformly pushed forward irrational lending behavior. The fact that bankloans to the real estate sector rapidly increased during the late 1980s is often considered ascollateral evidence of this irrational herding.2 This hypothesis implies that Japanese banks couldhave practiced better lending behavior, and thus were responsible for the non-performing loanproblem. This behavioral explanation enjoys significant popularity, especially outside academiccircles.
From an empirical point of view, this irrational herding hypothesis has proven to be quite chal-lenging to substantiate, and several interesting questions can be raised in this regard. First of all,we can question the above hypothesis from the viewpoint of the very existence or non-existenceof herding. Indeed herd behavior has been considered as typical behavior of Japanese banks fora long time, for which evidence can easily be obtained, for example, from articles in the NihonKeizai Shinbun (Nikkei), a Japanese newspaper comparable to the Wall Street Journal. A data-base search through the Nikkei Telecom 21 Article Search Service indeed yielded 1437 articlesin Nikkei containing the words “yokonarabi” (herding) and “ginko” (banks) from January 1,1975 through December 31, 2000.3 However, the information in those articles is based more onanecdotal evidence than empirical evidence. More empirical investigation should be conductedabout the existence of herd behavior among Japanese banks.
Second, we can doubt the hypothesis above from the viewpoint of rationality in herding. Asfor real estate lending, for example, Ueda (2000) states that behind the loan influx, Japanesebank managers had expectations that surging land price levels would be sustainable, and thatcollateral for loans would not deteriorate, taking into account the favorable economic conditionsduring the late 1980s. Thus, although banks may have followed herd behavior, the behavior mighthave been based on this expectation, and therefore rational.4 Indeed the expectation turned out
1 See, for example, Hoshi and Kashyap (2001, Chapter 8) and Woo (2003). For other causes of the banking crisis, seeCargill (2000) for example.
2 The fact is confirmed by Hoshi and Kashyap (2001, Chapter 8) and Nakagawa and Uchida (2003), for example.3 We have other incidental evidence of herding in Japanese banks. During the high growth period from the mid 1950s
through the early 1970s, the existence of the “convoy system” was pointed out, in which Japanese banks were claimedto be herding to keep the weakest member alive with the aid of regulation and protection by the Ministry of Finance. SeeHoshi (2002).
4 As a matter of fact, rational herding has been paid much attention in theoretical studies. Herd behavior could ra-tionally result (i) among fund managers with a similar comparative advantage (e.g. Falkenstein, 1996); (ii) when thereare payoff externalities in following the herd (e.g. bank run in Diamond and Dybvig, 1983; liquidity in Devenow andWelch, 1996; and information production in Froot et al., 1992 and Hirshleifer et al., 1994); (iii) from reputation con-cerns (Scharfstein and Stein, 1990); (iv) based on common information; and (v) through inference from behavior of
H. Uchida, R. Nakagawa / J. Finan. Intermediation 16 (2007) 555–583 557
to be wrong. However, this rational herding hypothesis implies that banks were not to blame forthe non-performing loan problem; they were just unfortunate victims of speculation.
Finally, the irrational herding hypothesis put forward above, together with the accompanyingdiscussion, remind us of the importance of intertemporal comparison. The existence of herdinghas long been suspected and, as shown above, anecdotal evidence for its existence can be foundnot only during the bubble period but also during other periods. This may imply that Japanesebanks have long followed irrational herd behavior. If the banks had long been following irrationalherd behavior, it is unlikely that the behavior brought about the non-performing loan problem,which emerged only in the 1990s. However, if the behavior of Japanese banks during the bubbleperiod was abnormal, and irrational herding was observed only during this frantic period in thelate 1980s, it is highly likely that the behavior precipitated the subsequent non-performing loanproblem.
Summarizing the discussion thus far, we should ask three questions so as to investigatewhether the irrational herding hypothesis holds or not: (1) First of all, has herd behavior ex-isted among Japanese banks in the past? (2) If so, were banks rational or not in such behavior?And (3) was the irrationality (or rationality) observed only in the bubble period or was it a char-acteristic of Japanese banks consistently observed for a long time? These important questionsmust be answered based on a formal empirical analysis.
This paper is an attempt to answer the questions raised above. The analysis consists oftwo stages. First, we will determine the existence or non-existence of herd behavior amongJapanese banks. Our methodology is indebted to a study of herd behavior among fund managers.Lakonishok et al. (1992) (henceforth LSV) devised an innovative index to measure the extent towhich fund managers follow herd behavior in investing in equity. The measure, called the LSVmeasure, captures the extent to which fund managers deviate from average investment decisionswhich depend on overall economic conditions to collectively buy or sell specific stocks. Due toits appealing simplicity, the measure gained substantial popularity and was applied to investigateherd behavior in different contexts by numerous studies that followed.5
We apply the measure directly to individual banks’ loans outstanding to different industriesduring the period of 1975 through 2000, for which banks’ balance sheet data are available in theNikkei Needs Company (Bank) Data File. Using the data, we will capture the extent to whichJapanese banks deviate from lending policy based on macroeconomic conditions, and collec-tively increase or decrease loans to specific industries in each year. We calculate the measure fora representative type of commercial banks in Japan: city banks.6
Second, if the existence of herd behavior is confirmed at the first stage, we will further inves-tigate possible rationality in the detected herding. Because the LSV measure quantifies banks’collective deviation from overall trends in increasing or decreasing loans outstanding, the mea-sure does not capture bank behavior that can be rationally explained from a macroeconomic pointof view. However, the collective deviation could yet result from banks’ decisions that are rationalat an individual industry level. For example, expanded or decreased loan demand from an indus-try due to drastic environmental changes, such as a surge in land prices during the bubble period,
other agents (Bikhchandani et al., 1992; Banerjee, 1992). See Bikhchandani et al. (1998), Devenow and Welch (1996),Bikhchandani and Sharma (2001), and Hirshleifer and Teoh (2003) for survey.
5 For example, see Grinblatt et al. (1995), Wermers (1999), and Choe et al. (1999). See Bikhchandani and Sharma(2001) for survey of such studies. More recent studies include Wylie (2005) and Walter and Weber (2006). For the prosand cons of the LSV measure and alternative measures see Section 2.1.
6 For the types of Japanese banks, see Section 2.2.
558 H. Uchida, R. Nakagawa / J. Finan. Intermediation 16 (2007) 555–583
could have made Japanese banks behave collectively so as to lend to the industry. This behaviorwould be rational, but would be captured by the LSV measure as herding. Thus, in order to moreexactly investigate whether the detected herding is rational or not, it is necessary to exclude fromthe LSV measure banks’ rational behavior at an industry level.
To this end, we regress the extent of banks’ collective deviation from average lending de-cisions on proxies for industry-specific factors. By using the resulting residual, we create anadjusted LSV herding measure. This adjusted measure quantifies the extent of herding whichdoes not stem from macroeconomic or industry-specific reasons.7
After deriving the adjusted measure for the entire sample period, we will compare the levelof this adjusted measure in the bubble period to that in other periods, and see whether Japanesebanks followed exceptional behavior only in the bubble period, or whether they had been follow-ing consistent behavior throughout the sample period.
The results from the first stage of the analysis demonstrate the existence of herd behavioramong Japanese banks during the sample period. City banks had followed a cyclical herdingpattern along with business fluctuations in Japan. Interestingly, herding is observed around thesecond oil crisis in the late 1970s, during the bubble period in the late 1980s, and during thestagnation period that followed. These results are consistent with our image of banks as beingfrantic in lending to certain industries.
After disentangling herding caused by industry-specific factors, the results obtained from thesecond stage of the analysis show that most of the herding detected in the first stage disappearsthrough adjustment. However, a large extent of herd behavior is still observed in the bubble periodof the late 1980s. It is therefore highly likely that irrational bank behavior had been exceptionallypresent during the bubble period. Our estimate indicates that a total of some 5 trillion yen ofloan increase by city banks during the period of 1987–1989 can be attributed to irrational herdbehavior.
Since city banks have been playing a major role in the Japanese economy for a long time,the results are worthy of special mention. They imply that we cannot reject the hypothesis thatJapanese banks had been following irrational herd behavior at least during the bubble period.The irrational herding might have contributed to the accumulation of non-performing loans, andwhat Japanese banks got may have been what they deserved.
For comparison purposes, we also apply the measures to regional banks: smaller banks thatoperate regionally on a smaller scale than city banks. For these banks, herding is consistently andsignificantly observed throughout the sample period. Even after adjusting for rational factors,herding among regional banks is still observed. In this sense, regional banks might have beenmore frequently following irrational herd behavior than city banks. This result is consistent withUchida and Tsutsui’s (2005) finding that city banks are more competitive than regional banks inthe Japanese loan market.
Finally we conducted analysis not by bank type but by region. When we focus on banks in thetwo largest urban areas of Japan, statistically significant levels of herding across different types
7 Although it is impossible to empirically specify the exact causes of rational herding, if we detect herding in ourstudy, we can at least exclude reasons (i) through (iii) in footnote 4. First, Japanese banks might have had comparativeadvantage in lending to firms with a specific size or in a specific region, however they were unlikely to have an advantagein lending to a specific industry. As our dataset contains each bank’s loans outstanding only at the industry level, wecan exclude explanation (i). Second, at an industry level, one bank’s lending is not likely to have positive externality toother banks’ lending, which excludes explanation (ii). Finally, we cannot infer bank managers’ ability based upon theirperformance in lending to a particular industry. This allows us to eliminate explanation (iii).
H. Uchida, R. Nakagawa / J. Finan. Intermediation 16 (2007) 555–583 559
of banks are observed in both areas in the late 1980s. This implies that irrational herd behaviorin the bubble period might have been followed among geographically proximate banks as well.However, the magnitude of herding is smaller than that by bank type, implying that it is typerather than geographical proximity that matters more when banks herd.
Few studies have empirically investigated herd behavior among banks, although there havebeen several theoretical studies.8 Jain and Gupta (1987) examined causality in loans outstandingaggregated by bank type to find herding among groups of banks in the US. Based upon Jain andGupta (1987), Nakagawa and Uchida (2003) detect the causality relationship in loans outstandingby different types of banks in Japan. However, these studies investigate the relationship betweenloans of different groups of banks. The LSV measure in this paper is calculated using the dataof individual banks’ loans outstanding, so that our results contain more specific information. Byway of using the well-known LSV measure, we present the first evidence of herd behavior amongbanks at an individual bank level.
Our finding of a cyclical herding pattern (before adjustment) is closely related to a stylized factcalled procyclicality in bank lending behavior. As introduced in Berger and Udell (2004), lendingoften increases significantly during business cycle expansions and then falls considerably duringsubsequent downturns. The cyclical herding behavior found in the present paper is perfectly inline with this fact and could be considered as a manifestation of lending procyclicality.9
Finally, the present paper contains some econometric contributions to the existing studiessince the introduction of the LSV measure. We construct a formal procedure to test the statisticalsignificance of the LSV measure. In the literature, some studies pay little attention to statisticaltesting. Other studies use the ordinary t-test, but the test could bring about some bias which makesthe LSV measure less significantly different from zero and is not reliable in small-sample analy-sis. The present paper formally investigates the testing procedure and proposes a Chi-squaredtest for the LSV measure which is applicable to small-sample analysis.
The subsequent section of this paper explains the first stage of our analysis. After introducingthe methodology and data, we report the results. Our Chi-squared test is also introduced in thissection. In Section 3, we extend the second stage of our analysis. After the explanation of themethodology, we present the results. Regional banks’ herd behavior and herd behavior by regionare then investigated in Section 4. The final section concludes the paper with some suggestionsfor future study.
2. Analysis by LSV herding measure
2.1. Methodology
We detect herd behavior among Japanese banks using the LSV herding measure created byLakonishok et al. (1992). Suppose that in each year indexed by t , banks have loans outstandingto industries j . For notational simplicity, we denote by i the index of each industry-year which
8 Theoretical studies include Rajan (1994), Acharya (2001), Acharya and Yorulmazer (2005, 2006, 2007), and Ogura(2006).
9 The focus of Berger and Udell (2004) is on a different explanation of procyclicality, called the institutional memoryhypothesis. They provide empirical evidence suggesting that this hypothesis can explain the lending procyclicality. How-ever, they mention that herding theory is one of several plausible and concomitant explanations for procyclicality (Bergerand Udell, 2004, p. 493). As for procyclicality in bank lending, see also Rajan (1994), Acharya and Yorulmazer (2005),Pennacchi (2005), and Jiménez and Saurina (2006) as well.

560 H. Uchida, R. Nakagawa / J. Finan. Intermediation 16 (2007) 555–583
is defined by a combination of one t and one j . The LSV herding measure is defined as follows.
(1)LSV i ≡ |Pi − Pt | − E|Pi − Pt |.Pi is the proportion of banks that actually increased their loans outstanding in industry-year i (ofindustry j in year t ). Pi is derived as
Pi ≡ Xi/Ni,
where Ni and Xi are the numbers of banks that were active in the industry-year i, and thatincreased loans outstanding in the industry-year i, respectively.
Pt is the expected proportion of banks that increased their loans outstanding in year t , whichis calculated as a mean of all the observed Pis in the year. This can be considered as an indicatorof the banks’ overall lending policy that reflects macroeconomic factors. If every bank inde-pendently increases (or decreases) its loans outstanding in industry-year i with probability Pt
(or 1 − Pt ), which is based rationally on macroeconomic factors, the observed value of Pi be-comes close to Pt and the first term will become zero. If, on the other hand, banks collectivelyincrease or decrease loans in an industry-year, the observed value of Pi departs from Pt . The firstterm of Eq. (1) thus quantifies the extent to which banks’ lending policies in an industry-year i
deviate from the overall lending policy in the year t .The overall lending policy Pt thus represents the null hypothesis of no herding. Non-
independent corrective increase and decrease amount to a larger value of the first absolute valueand the measure itself. It is this sense of herd behavior that the LSV measure tries to capture. Aswe are interested in the change in banks’ lending behavior over the sample period, we obtain ineach year a sample mean of the LSV measure among all industries and analyze the time seriesof the mean.
Note that even if the null hypothesis holds and there exists no herding, the expected value ofthe first absolute term of LSV i is positive. The last term E|Pi − Pt | of Eq. (1) is subtracted so asto normalize the measure and make its mean zero under the null hypothesis of no herding.
The LSV measure is the most frequently-used measure to quantify herd behavior among eq-uity investors. The measure is “a standard in the literature” (Wylie, 2005) and is applied innumerous studies.10 Several alternative measures have been proposed. However, they are lessuseful and/or not appropriate to capture herd behavior among banks.11
This is not to say that the LSV measure is free from drawbacks. Bikhchandani and Sharma(2001) point out that the measure (1) only uses the number of investors that sold or purchaseda particular stock, (2) cannot identify intertemporal trading patterns, and (3) may not be a good
10 See references in footnote 5.11 First, a portfolio-change measure in Wermers (1995) focuses on collective movements in portfolio weights of stockinvestors (Bikhchandani and Sharma, 2001). However, the measure is complicated to calculate and, to the best of theauthors’ knowledge, has never actually been used in other studies. Second, Lakonishok et al. (1992) and Wermers (1999)use the D ratio and the N ratio, and Grinblatt et al. (1995) use the momentum trading measures. They are, however,measures of feedback trading or momentum investing, and do not necessarily represent herding. Third, different measuresin Christie and Huang (1995), Hwang and Salmon (2004), and Nofsinger and Sias (1999) use stock return information.However they are impossible to use in the banking context where no comparable return data is available (Bikhchandaniand Sharma, 2001). Fourth, herding among investment analysts is more directly tested by analyzing data of individualanalysts’ decisions (see Bikhchandani and Sharma, 2001; Hirshleifer and Teoh, 2003). However, such detailed data isnot available in the banking context. Finally, instead of devising a measure of herd behavior, Kodres and Pritsker (1996)investigate correlations among changes in positions of futures market participants using daily trading data. Although themethodology is interesting, it does not hold sufficient explanatory power for our small-sample data set of Japanese banks.
H. Uchida, R. Nakagawa / J. Finan. Intermediation 16 (2007) 555–583 561
measure unless the time interval and the choice of investment category over which the measure isaveraged are appropriately chosen. In later sections, we will try to alleviate drawback (1) by inter-preting the results with the addition of quantitative information as well. Since we will use annualdata and focus on particular types of banks, the present study suffers less from drawbacks (2)and (3).
Wylie (2005) points out additional caveats: The accuracy of the LSV measure rests on twoimplicit conditions: (i) no short-selling constraints and (ii) no conditional propensity to buydepending on investors’ initial holding in the stock and liquidity needs. Unless both of theseconditions are satisfied, there is a bias in the measure. In the banking context, however, it shouldbe reasonable to presume that these conditions are satisfied. On balance, it is appropriate to usethe LSV measure in this study.
2.2. Data
The primary data to be used in this paper are loans outstanding to different types of industries,which are available from the Nikkei NEEDS Company (Bank) Data File. Loans to the followingeleven industries by individual banks are available: (1) Manufacturing, (2) Agriculture, Forestand Fisheries, (3) Mining, (4) Construction, (5) Wholesale and Retail Trade, (6) Finance andInsurance, (7) Real Estate, (8) Transport and Communication, (9) Electricity, Gas, Heat supplyand Water, (10) Services, and (11) Individuals and others.12
The data set includes two types of commercial banks in Japan. City banks have a main branchoffice in a big city and operate nationwide as well as multinationally. They are the biggest banksin Japan and mainly deal with bigger businesses. Their lines of operation include not only com-mercial banking but also some investment and international banking. In contrast, regional bankshave their main branch in a smaller city and operate mainly inside the prefectures in which theyare located. They are small- or medium-sized banks and are closely connected to local businessesand governments.13
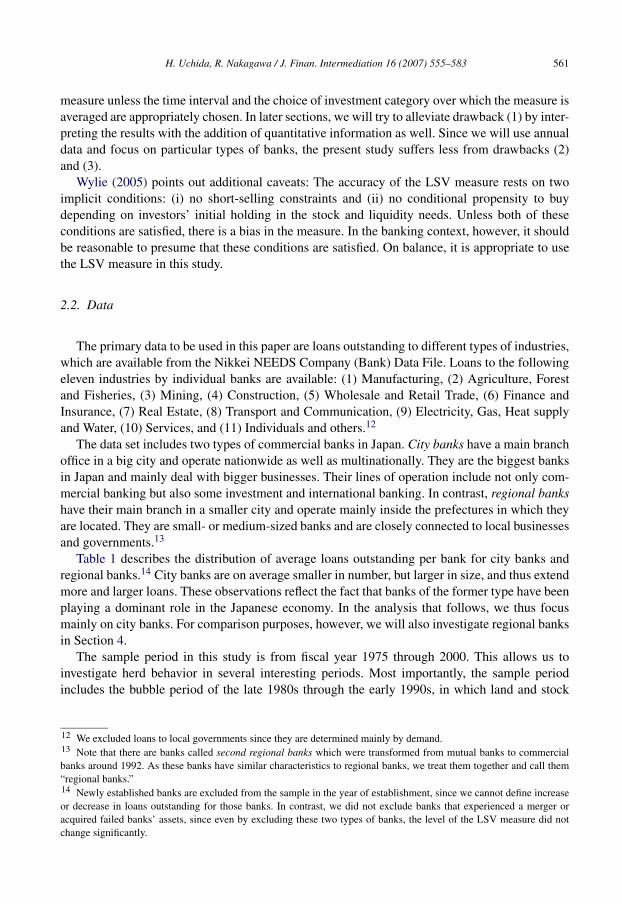
Table 1 describes the distribution of average loans outstanding per bank for city banks andregional banks.14 City banks are on average smaller in number, but larger in size, and thus extendmore and larger loans. These observations reflect the fact that banks of the former type have beenplaying a dominant role in the Japanese economy. In the analysis that follows, we thus focusmainly on city banks. For comparison purposes, however, we will also investigate regional banksin Section 4.
The sample period in this study is from fiscal year 1975 through 2000. This allows us toinvestigate herd behavior in several interesting periods. Most importantly, the sample periodincludes the bubble period of the late 1980s through the early 1990s, in which land and stock
12 We excluded loans to local governments since they are determined mainly by demand.13 Note that there are banks called second regional banks which were transformed from mutual banks to commercialbanks around 1992. As these banks have similar characteristics to regional banks, we treat them together and call them“regional banks.”14 Newly established banks are excluded from the sample in the year of establishment, since we cannot define increaseor decrease in loans outstanding for those banks. In contrast, we did not exclude banks that experienced a merger oracquired failed banks’ assets, since even by excluding these two types of banks, the level of the LSV measure did notchange significantly.
562 H. Uchida, R. Nakagawa / J. Finan. Intermediation 16 (2007) 555–583
Table 1Descriptive statistics
Year City banks Regional banks
# ofbanks
Average loansoutstandingper bank(million yen)
% ofincrease
# ofbanks
Average loansoutstandingper bank(million yen)
% ofincrease
1975 13 3,783,817 N/A 131 299,648 N/A1976 13 4,154,987 8.9 131 337,551 11.21977 13 4,510,592 7.9 131 374,147 9.81978 13 4,888,615 7.7 131 418,799 10.71979 13 5,215,223 6.3 131 455,844 8.11980 13 5,591,411 6.7 131 492,567 7.51981 13 6,127,892 8.8 131 544,733 9.61982 13 6,710,032 8.7 131 595,297 8.51983 13 7,390,521 9.2 131 646,877 8.01984 13 8,246,396 10.4 131 706,061 8.41985 13 9,076,686 9.1 131 734,584 3.91986 13 10,051,630 9.7 131 775,112 5.21987 13 11,024,705 8.8 131 842,798 8.01988 13 11,926,564 7.6 131 927,932 9.21989 13 13,121,687 9.1 131 1,044,786 11.21990 12 17,823,409 26.4 131 1,257,844 16.91991 11 19,992,428 10.8 131 1,316,307 4.41992 11 20,443,008 2.2 130 1,367,000 3.71993 11 20,306,336 −0.7 129 1,397,630 2.21994 11 19,966,124 −1.7 129 1,424,676 1.91995 11 19,823,569 −0.7 129 1,462,625 2.61996 10 21,607,731 8.3 128 1,476,369 0.91997 9 23,185,396 6.8 126 1,505,497 1.91998 9 23,453,673 1.1 124 1,536,494 2.01999 8 23,439,792 −0.1 122 1,503,922 −2.22000 8 23,240,364 −0.9 117 1,534,155 2.0
Source: The Nikkei NEEDS Company (Bank) Data File.
prices were inflated. As Table 1 demonstrates, outstanding loans had been consistently increasinguntil this period, but suddenly stopped expanding afterward.15
Because of the long sample period, the results for the bubble period can be compared withthose for other interesting periods. First, the second oil crisis in the late 1970s is included inthe sample. Herd behavior might have been followed around this panic year. Second, the sampleincludes the period of financial liberalization in the 1980s. In this period, Japanese banks hadlost their traditional borrowers, who were freed from regulation and obtained other financingsources. As Hoshi and Kashyap (2000) and Nakagawa and Uchida (2003) show, banks had toexpand loans to borrowers with whom they had less information accumulated. Third, the periodafter the bubble collapse is included in the sample. Herding among Japanese banks in this panicperiod might be as plausible as that among fund managers in the period of the international
15 Note that although a considerable increase may be naturally observed in this period, a surge in loans outstanding infiscal year 1990 seems unexpected. It is highly probable that this surge was caused by a change in the accounting standardin fiscal year 1990, in which banks began to include overdrafts in loans outstanding by industry in their annual financialstatement.
H. Uchida, R. Nakagawa / J. Finan. Intermediation 16 (2007) 555–583 563
currency crisis.16 Finally, the sample period contains the stagnation period in the 1990s whenthe Japanese economy had been struggling to escape from its weak economic condition. Banksuniformly decreased loans in this period. We will interpret the results of our study based on thishistorical background of interest.
2.3. Results
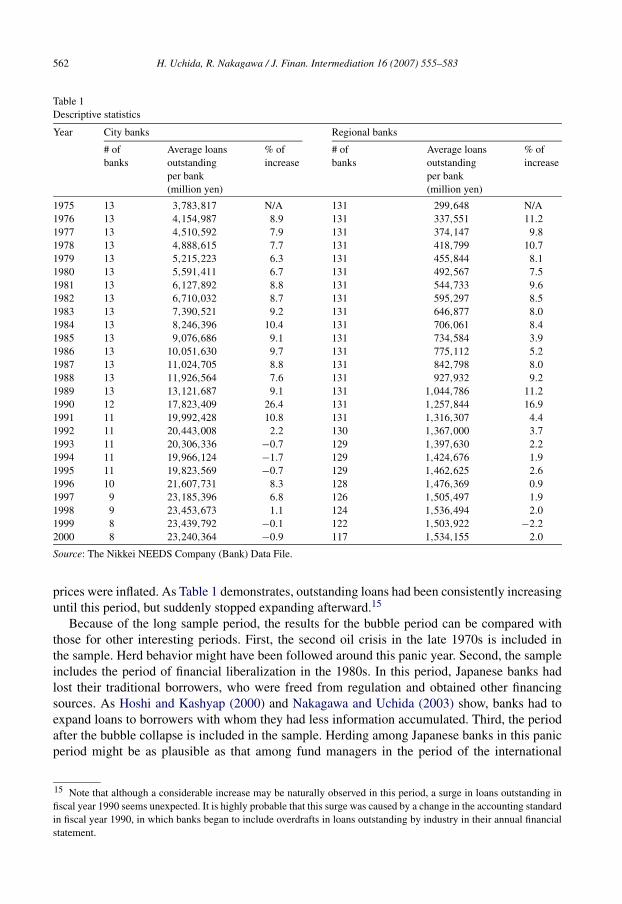
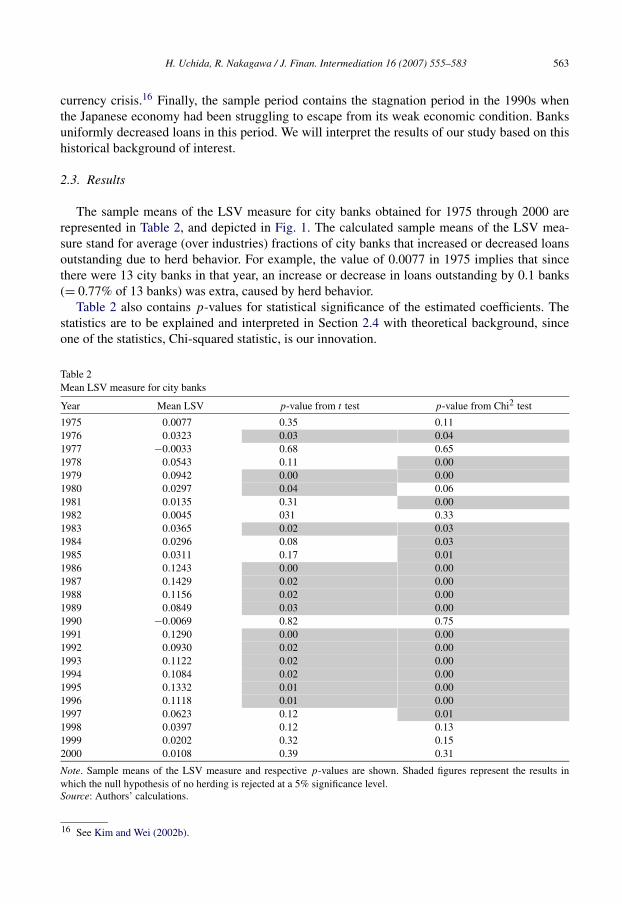
The sample means of the LSV measure for city banks obtained for 1975 through 2000 arerepresented in Table 2, and depicted in Fig. 1. The calculated sample means of the LSV mea-sure stand for average (over industries) fractions of city banks that increased or decreased loansoutstanding due to herd behavior. For example, the value of 0.0077 in 1975 implies that sincethere were 13 city banks in that year, an increase or decrease in loans outstanding by 0.1 banks(= 0.77% of 13 banks) was extra, caused by herd behavior.
Table 2 also contains p-values for statistical significance of the estimated coefficients. Thestatistics are to be explained and interpreted in Section 2.4 with theoretical background, sinceone of the statistics, Chi-squared statistic, is our innovation.
Table 2Mean LSV measure for city banks
Year Mean LSV p-value from t test p-value from Chi2 test
1975 0.0077 0.35 0.111976 0.0323 0.03 0.041977 −0.0033 0.68 0.651978 0.0543 0.11 0.001979 0.0942 0.00 0.001980 0.0297 0.04 0.061981 0.0135 0.31 0.001982 0.0045 031 0.331983 0.0365 0.02 0.031984 0.0296 0.08 0.031985 0.0311 0.17 0.011986 0.1243 0.00 0.001987 0.1429 0.02 0.001988 0.1156 0.02 0.001989 0.0849 0.03 0.001990 −0.0069 0.82 0.751991 0.1290 0.00 0.001992 0.0930 0.02 0.001993 0.1122 0.02 0.001994 0.1084 0.02 0.001995 0.1332 0.01 0.001996 0.1118 0.01 0.001997 0.0623 0.12 0.011998 0.0397 0.12 0.131999 0.0202 0.32 0.152000 0.0108 0.39 0.31
Note. Sample means of the LSV measure and respective p-values are shown. Shaded figures represent the results inwhich the null hypothesis of no herding is rejected at a 5% significance level.Source: Authors’ calculations.
16 See Kim and Wei (2002b).
564 H. Uchida, R. Nakagawa / J. Finan. Intermediation 16 (2007) 555–583
Sour
ce:A
utho
rs’
calc
ulat
ions
Fig.
1.M
ean
LSV
mea
sure
for
city
bank
s.
H. Uchida, R. Nakagawa / J. Finan. Intermediation 16 (2007) 555–583 565
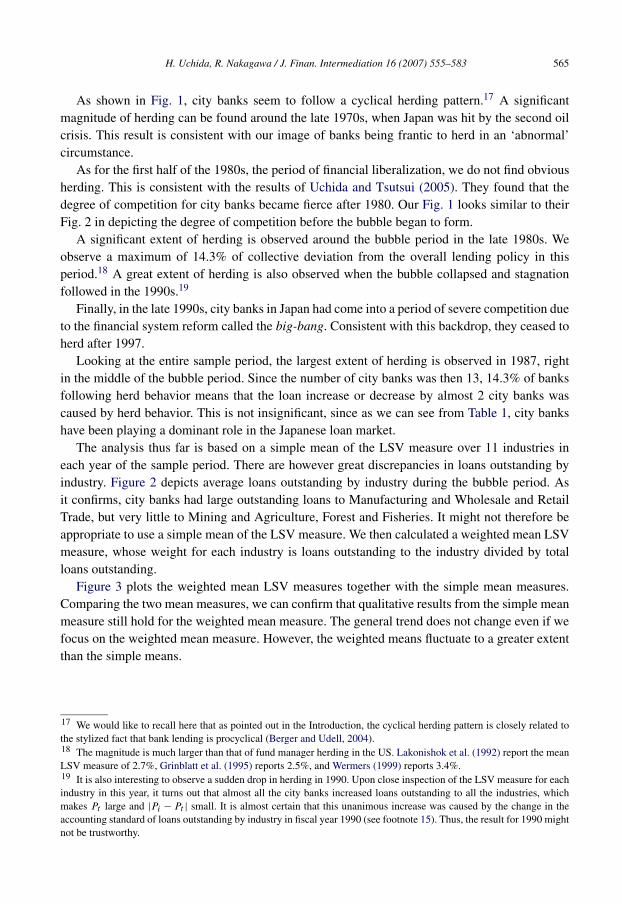
As shown in Fig. 1, city banks seem to follow a cyclical herding pattern.17 A significantmagnitude of herding can be found around the late 1970s, when Japan was hit by the second oilcrisis. This result is consistent with our image of banks being frantic to herd in an ‘abnormal’circumstance.
As for the first half of the 1980s, the period of financial liberalization, we do not find obviousherding. This is consistent with the results of Uchida and Tsutsui (2005). They found that thedegree of competition for city banks became fierce after 1980. Our Fig. 1 looks similar to theirFig. 2 in depicting the degree of competition before the bubble began to form.
A significant extent of herding is observed around the bubble period in the late 1980s. Weobserve a maximum of 14.3% of collective deviation from the overall lending policy in thisperiod.18 A great extent of herding is also observed when the bubble collapsed and stagnationfollowed in the 1990s.19
Finally, in the late 1990s, city banks in Japan had come into a period of severe competition dueto the financial system reform called the big-bang. Consistent with this backdrop, they ceased toherd after 1997.
Looking at the entire sample period, the largest extent of herding is observed in 1987, rightin the middle of the bubble period. Since the number of city banks was then 13, 14.3% of banksfollowing herd behavior means that the loan increase or decrease by almost 2 city banks wascaused by herd behavior. This is not insignificant, since as we can see from Table 1, city bankshave been playing a dominant role in the Japanese loan market.
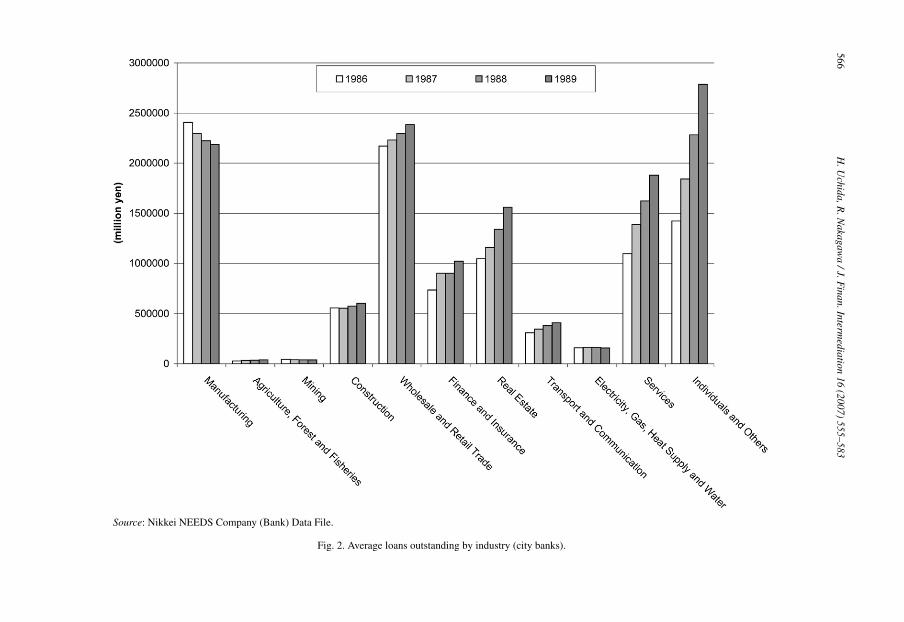
The analysis thus far is based on a simple mean of the LSV measure over 11 industries ineach year of the sample period. There are however great discrepancies in loans outstanding byindustry. Figure 2 depicts average loans outstanding by industry during the bubble period. Asit confirms, city banks had large outstanding loans to Manufacturing and Wholesale and RetailTrade, but very little to Mining and Agriculture, Forest and Fisheries. It might not therefore beappropriate to use a simple mean of the LSV measure. We then calculated a weighted mean LSVmeasure, whose weight for each industry is loans outstanding to the industry divided by totalloans outstanding.
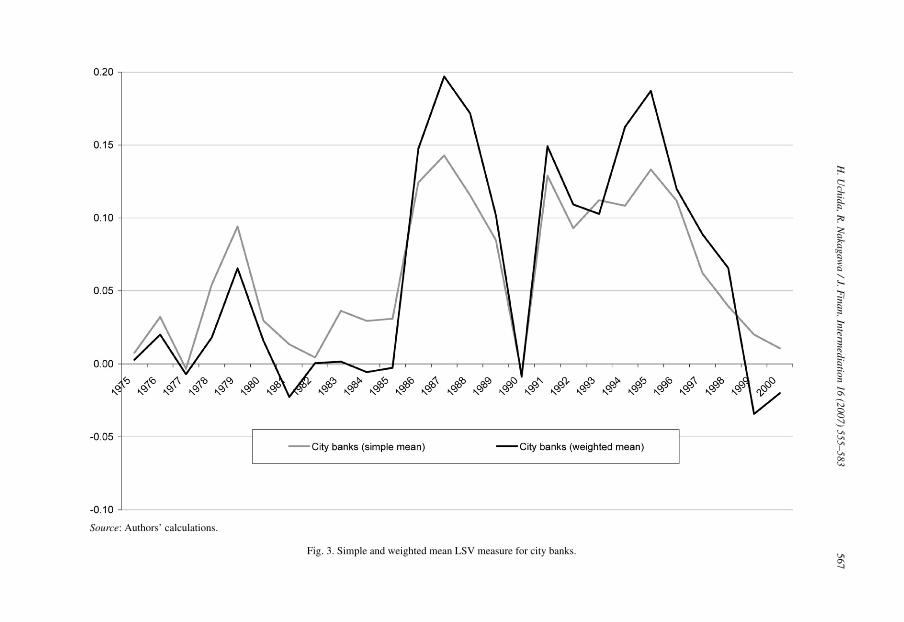
Figure 3 plots the weighted mean LSV measures together with the simple mean measures.Comparing the two mean measures, we can confirm that qualitative results from the simple meanmeasure still hold for the weighted mean measure. The general trend does not change even if wefocus on the weighted mean measure. However, the weighted means fluctuate to a greater extentthan the simple means.
17 We would like to recall here that as pointed out in the Introduction, the cyclical herding pattern is closely related tothe stylized fact that bank lending is procyclical (Berger and Udell, 2004).18 The magnitude is much larger than that of fund manager herding in the US. Lakonishok et al. (1992) report the meanLSV measure of 2.7%, Grinblatt et al. (1995) reports 2.5%, and Wermers (1999) reports 3.4%.19 It is also interesting to observe a sudden drop in herding in 1990. Upon close inspection of the LSV measure for eachindustry in this year, it turns out that almost all the city banks increased loans outstanding to all the industries, whichmakes Pt large and |Pi − Pt | small. It is almost certain that this unanimous increase was caused by the change in theaccounting standard of loans outstanding by industry in fiscal year 1990 (see footnote 15). Thus, the result for 1990 mightnot be trustworthy.
566H
.Uchida,R
.Nakagaw
a/J.F
inan.Intermediation
16(2007)
555–583
Source: Nikkei NEEDS Company (Bank) Data File.
Fig. 2. Average loans outstanding by industry (city banks).
H.U
chida,R.N
akagawa
/J.Finan.Interm
ediation16
(2007)555–583
567
.
Source: Authors’ calculations.
Fig. 3. Simple and weighted mean LSV measure for city banks
568 H. Uchida, R. Nakagawa / J. Finan. Intermediation 16 (2007) 555–583
2.4. Statistical testing of LSV measure
2.4.1. Conventional test and distribution of LSV measureIn this subsection, we focus on the statistical significance of herd behavior detected by the
LSV measure. We propose a Chi-squared test which is suitable for small-sample analysis. Insome of the literature, careful treatment of statistical testing has not been of concern. The focushas only been on the economic significance or the magnitude of the measure.20
In other studies which do mention the statistical significance of the measure, the standardt -test has been conventionally applied. Lakonishok et al. (1992), Kim and Wei (2002a, 2002b),Borensztein and Gelos (2000), and Choe et al. (1999) present the standard errors and even t -values of sample means of the measure. Based on these values, they determine the statisticalsignificance of the measure and thus the existence of herd behavior.21
It is highly probable, however, that the conventional test has a considerable small-sample biasin the present paper. We can confirm this simply by investigating the probability distribution ofthe LSV measure. Suppose that there is no herding for an industry-year i. Then, Pi follows abinomial distribution with mean Pt and variance Pt (1 − Pt )/Ni . If Ni , the number of banks, issufficiently large, we can approximate this binomial distribution to the normal distribution withthe same mean and variance, which is conventionally allowed if NiPt > 5 and Ni(1 − Pt ) > 5.22
This approximation implies that the first term of the LSV measure, |Pi − Pt |, follows a half-normal distribution, and thus the distribution of the measure (1) has a longer tail to the right.Therefore, if we test a sample mean of the LSV measure using the conventional test based onnormal distribution, the test results might be biased toward accepting the null hypothesis of noherding when we have a small sample. That is, only when there is a large number of industry-years, the sample mean approximately follows a normal distribution and the conventional test isreliable.
As far as the existing studies on fund managers are concerned, this condition seems to besatisfied, since they include a large number of samples. As for a sample like ours that has a smallnumber of industry-years, however, testing results obtained from the conventional test are notreliable. In the following section, therefore, we devise a test procedure that does not suffer fromsmall-sample bias, which could enhance the test’s reliability over the conventional test.
2.4.2. Chi-squared test for LSV measureNow define a statistic Zi as
Zi ≡ Pi − Pt√Pt (1 − Pt)/Ni
.
From Eq. (1), this equals (the non-absolute value of) the first term of the LSV measure whichis normalized for its variance to take the value of 1 under the null hypothesis of no herding.From the discussion above, we know that the approximation of Zi ∼ N(0,1) is allowed when
20 No explicit comments are made about the statistical significance of the measure in Grinblatt et al. (1995) or Gelosand Wei (2002).21 Another interesting attempt is Wermers (1999). He depicts in his Fig. 1 an actual distribution of the LSV measureand compares it with a simulated one obtained from a sufficiently large number of samples under the null hypothesis ofno herding. Wermers (1999) notes the difference in shape between these two distributions and concludes in favor of theexistence of herding. Borensztein and Gelos (2000) also take the same approach. Although this is indeed an interestingapproach, it depends upon visual perception and is not an objective test.22 See Rice (1995, p. 172).
H. Uchida, R. Nakagawa / J. Finan. Intermediation 16 (2007) 555–583 569
NiPt > 5 and Ni(1 − Pt ) > 5. This leads to the result that
Z2i ∼ χ(1).
This is the statistic we propose in order to test the significance of the herding detected by the LSVmeasure. When we test the statistical significance of herding for a group of industry-years Φ (ora sample mean of the LSV measure over Φ), we can use the relationship that
Z2Φ ≡
∑
i∈Φ
Z2i ∼ χ(I),
where I is the number of samples (industry-years) included in Φ . Note that as absolute valuesand squared values correspond to each other, we have a close correspondence between Z2
i andthe LSV measure, and between Z2
Φ and a sample mean of the LSV measure.It should be stressed here that in order to derive the probability distribution of the Chi-squared
statistic Z2i (or the sum Z2
Φ ), we do not rely on the normal approximation of a sample mean of theLSV measure, which is only justified with a large number of industry-years (i.e. large I ). Evenif we are interested in herding among a small number of I , as long as the normal approximationof a binomial distribution of Pi is allowed, the Chi-squared test based on the Z2
i statistic wouldbe more reliable than the conventional t -test. The use of the Chi-squared test together with thet -test would improve the reliability of the test to detect herding.
2.4.3. Statistical significance of the resultsThe results with the Chi-squared and the t -tests are presented in Table 2. For both tests, the
results of the statistical significance represented by the p-values parallel the results representedin Fig. 1. A cyclical herding pattern for city banks is supported from a statistical point of view aswell. We can therefore confirm the conclusion in Section 2.3 from a statistical point of view.
Note that the two tests reveal some differences. p-values from the t -test are larger in generalthan those from the Chi-squared test. The conventional test has a bias toward accepting the nullhypothesis of no herding. As was expected above, this implies that the Chi-squared test couldavoid the small-sample bias of the t -test.23
We can thus conclude that the conventional t -test is unreliable for small-sample analysis, andthat the Chi-squared test could make an improvement over the conventional one. Although theconventional testing is indeed easy and convenient, and appeals to our intuition, it may demon-strate a loss of test efficiency and may bias the results for small samples.
3. Rationality in herding
3.1. Methodology
3.1.1. Rationality in LSV herding measureHaving detected the existence of herd behavior, we are now interested in investigating in
further detail its rationality. As explained in Section 2.1 the LSV measure quantifies the extentto which banks’ behavior to lend to each industry collectively deviates from the overall trend inincreasing or decreasing loans outstanding. Since Pt is subtracted from Pi , the measure does notinclude banks’ rational decisions based on overall macroeconomic conditions.
23 In Section 3.2, we will confirm this point in more detail.
570 H. Uchida, R. Nakagawa / J. Finan. Intermediation 16 (2007) 555–583
However, as mentioned in the Introduction, this does not necessarily imply that banks areirrational when the LSV measure indicates the existence of herding. Rational banks make lendingdecisions not only based on overall macroeconomic conditions but also on conditions specific toindividual industries. Although Pt is subtracted from Pi in the measure, the measure could stillreflect an increase or decrease in loans outstanding that is based on industry-specific rationalfactors. For example, if there are growing industries and declining industries, most banks wouldcollectively increase loans to the former and decrease loans to the latter. The increase or decreaseshould reflect increased or decreased loan demand as well, which also has nothing to do withbanks’ irrational behavior. In order to more closely investigate the rationality of the detectedherding, it would be better to adjust for the deviation from the overall lending policy that isbased on industry-specific rational reasons.
3.1.2. Adjusted LSV herding measureIn order to eliminate industry-specific reasons for herding, we estimate the following equation
by the ordinary least squares (OLS):
(2)Pi − Pt = a + bXi + εi,
where Xi is a vector of industry-specific control variables.24 εi represents the after adjustmentdeviation from the overall lending policy that cannot be explained by industry-specific factors.In other words, εi captures the portion of herding which cannot be explained by rational factors.We can therefore quantify the extent of herding after adjustment by the following measure:
LSVAi ≡ |εi | − E|εi |.
We call this the adjusted LSV herding measure.25 Averaging this adjusted measure in each year,we can grasp the extent of herding that cannot be explained by industry-specific factors.
The statistical significance of this measure can be tested in a manner similar to that of LSV i .Define a statistic Wi as follows:
Wi ≡ εi√Pt (1 − Pt )/Ni
.
As Wi asymptotically follows the standard normal distribution under the null hypothesis of noherding, we obtain the following relationship:
W 2Φ ≡
∑
i∈Φ
W 2i ∼ χ2(I − K),
where Φ is the relevant group of samples (industry-years), I is the number of samples includedin Φ , and K is the number of parameters of the regression (2).
The basic idea behind this adjusted measure is to disentangle loan increase or decrease stem-ming from industry-specific rational factors, Xi . This is essentially the same as what Hirshleiferand Teoh (2003) wrote as “to include proxies for possible variables that may jointly affect thebehavior of different individuals” (p. 49), in order to rule out clustering from herding.
24 Estimation results without a constant term produced similar results.25 Note that E|εi | is equivalent to E|Pi − Pt |, the second term of the original measure (1). This is because, under thenull hypothesis of no herding, Pi −aXi follows a binomial distribution with mean Pt as does Pi in the original measure.
H. Uchida, R. Nakagawa / J. Finan. Intermediation 16 (2007) 555–583 571
The adjusted LSV measure is original in that it attempts to control for rational herding. Thismethodology has some contribution to further study since it is very difficult to empirically spe-cify causes of herding.26 Although there have been some studies that attempted to (implicitlyor explicitly) investigate causes of herding, they suffer from drawbacks.27 Some studies on mo-mentum strategy go even further by investigating the LSV measures for “past winners” and “pastlosers” (e.g. Grinblatt et al., 1995), but we are not sure whether momentum strategy is rationalor not. Also, momentum strategy is implausible in the banking context.
One might think of checking rationality using variables representing ex post profitability ofloans to each industry, as studies such as Kim and Wei (2002a, 2002b) do, rather than runningthe regression on variables representing ex ante profitability. We did not pursue this possibilitybecause, if we are to judge bank rationality based on ex post profitability, Japanese banks wouldno doubt behave irrationally because of the miserable performance of loans after the bubbleperiod. Detailed data on loan performance by industry are not available as well.
3.1.3. Control variablesWe use the following three industry-specific variables to further control for rationality. Al-
though there is always an omitted variable problem (Hirshleifer and Teoh, 2003, p. 49), to retaina sufficient degree of freedom, it would be reasonable to use the variables that are plausible andavailable.28
First, we adopt a variable representing the relative magnitude of economic activity of theeleven industries in the Japanese economy. We use the real GDP growth by industry for theten industries other than ‘Individuals and others,’ and the growth rate of real final consumptionexpenditure of households for ‘Individuals and others.’ These variables are to control for therelative profitability of each industry. The data are available from the Annual Report on NationalAccounts.29
Second, land prices are used as a control variable. In Japan, land is highly valued as collateral.In the bubble period, it is often claimed that increased collateral values due to surging landprices contributed to the influx of loan funds into the real estate industry, for example. Thus,we took the index of urban land price as an explanatory variable, which is available from theJapan Real Estate Institute. We used the index only for four industries that are highly likely tobe affected by the change in land prices: Construction, Finance, Real Estate, and Individuals andothers. Specifically, we constructed a variable which is a product of the rate of increase in theprice index and a dummy variable that takes the value of 1 for the four industries and 0 for theothers.30
26 Due to this difficulty, Graham (1999) distinguishes empirical herding from several types of theoretically-explainedherding.27 See the “second” and “third” analyses in footnote 11.28 Note that in each year, we have only 11 samples corresponding to 11 industries.29 We also considered the use of stock price indices by industry, which is available from the Tokyo Stock Exchange, butbecause of the mismatch of industry classification and the limited availability of data (only after 1983), we decided notto use them.30 One might think of introducing the amount of non-performing loans in the 1990s as a control variable. It is howeverhighly probable that the impact of the non-performing loan problem in the 1990s was uniform among loans to all theindustries and is thus reflected in Pt . In fact, it turns out (in Fig. 4) that most of the herding for city banks in the 1990s waseliminated by the three control variables introduced here. We therefore concluded that the variables we had used weresufficient and there was no need to incorporate a variable representing non-performing loans. Note that Pt should reflectnot only non-performing loans but also any other macroeconomic factors that evenly affect loans to all the industries.
572 H. Uchida, R. Nakagawa / J. Finan. Intermediation 16 (2007) 555–583
Finally, we take into account the idiosyncratic impact of financial liberalization in the 1980sas an institutional factor in herding. The difference in the availability of alternative sources offunds across industries brought about by the liberalization could be proxied by the rate of in-crease in corporate bonds outstanding by industry. However, as the rate is available only fortotal bonds outstanding and not for those by industry, we constructed a variable which, for Man-ufacturing and Wholesale, equals the rate of increase in total bonds outstanding, and is zerofor the others.31 Total corporate bonds outstanding are the sum of outstanding corporate bonds,asset-backed bonds, and convertible bonds. These statistics are available from the Financial andEconomic Statistics Monthly issued by the Bank of Japan.
All three control variables are utilized in the relevant years. We also tried the same variableswith a one-year lag. However, they had considerably weaker explanatory power.
3.2. Results
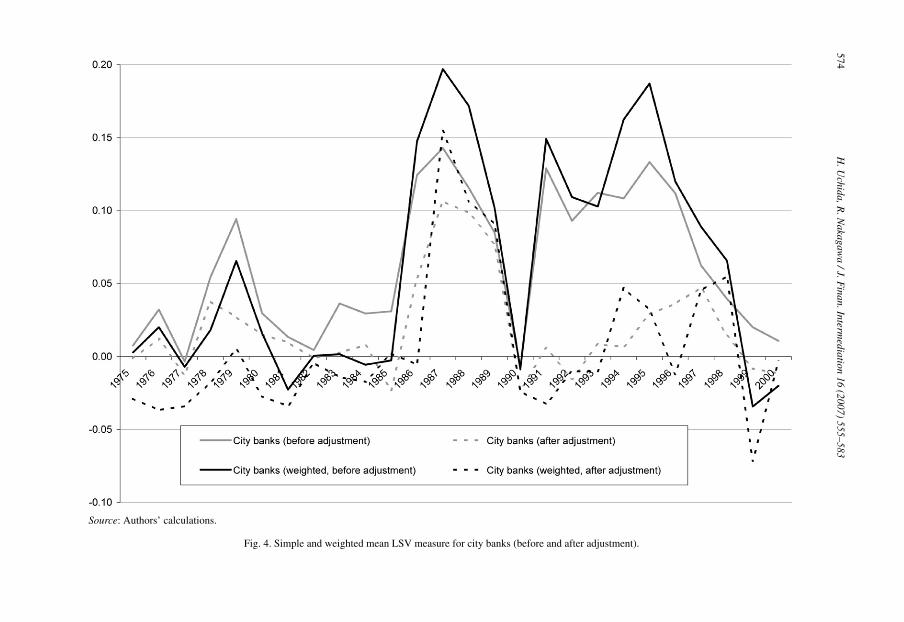
The sample means of herding measures adjusted for rational factors are presented in Table 3.Figure 4 depicts the adjusted measures together with the unadjusted measures. The differencebetween the solid and the dotted lines represents the portion of herding which was adjusted byindustry-specific rational factors.
Most of the herd behavior by city banks can be explained on rational grounds. As for herdingin the late 1970s and the early 1990s, Fig. 4 shows us that purely rational herding was dominant,although the Chi-squared test results tell us that the herding was still statistically significant. Wecan therefore conclude from an economic point of view that city banks’ herding was rational inmost of the sample period.32
The interesting exception to rational herding is the late 1980s, however, which is exactly theperiod when the asset price bubble was formed. Even after adjusting for rational factors, we stillobserve a large extent of herding in Fig. 4. The adjusted LSV measure is statistically significantfor three years: 1987, 1988, and 1989.
Figure 4 also plots the weighted mean LSV measures before and after adjustment. Comparingthe two mean measures (both before and after adjustment), we can confirm that qualitative resultsremain the same between the simple and the weighted mean measures. Quantitatively, as was thecase for the unadjusted measure, the weighted means fluctuate to a greater extent than the simplemeans. However, observation of the rise of the adjusted measure only during the bubble period isstill confirmed. Therefore, we may be able to conclude that the late 1980s seems to be the periodwhen irrational herding of city banks is most distinctly observed.
Finally, it is worth noting the difference in the two testing results. The conventional t -testproduces larger p-values than the Chi-squared test does. This result is more apparent than thatobserved in Table 2. We could therefore confirm the earlier claim that the Chi-squared test re-duces the small-sample bias of the conventional test.
31 As Nakagawa and Uchida (2003) demonstrate, loan shares to these two industries, which had been banks’ maincustomers (traditional industries) decreased drastically after financial liberalization. It is therefore highly probable thatfirms in these two industries benefited from financial liberalization and gained independence from banks.32 The drop in the adjusted measure in 1990 is observed again, and the reason would be the same as that for theunadjusted measure. See footnote 19.
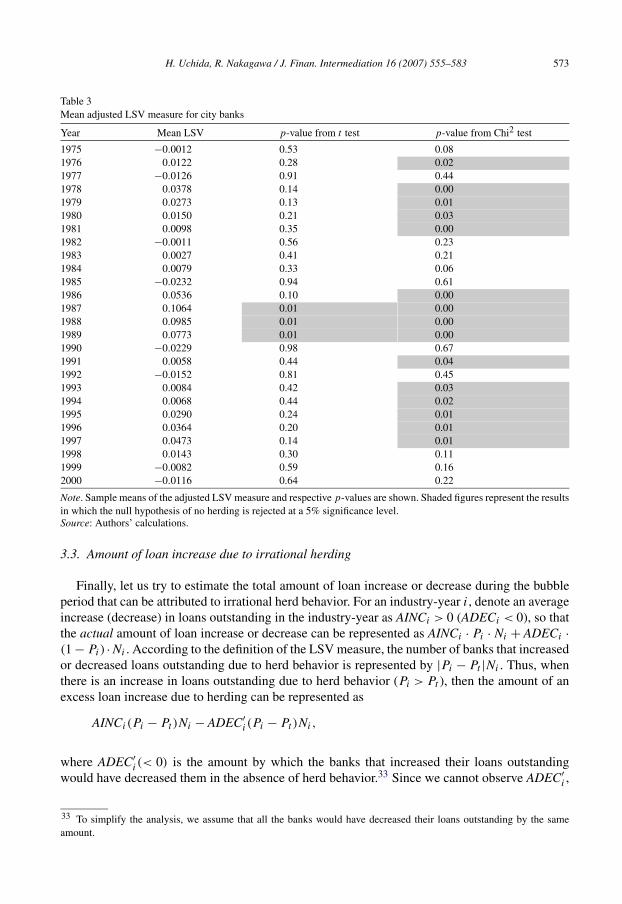
H. Uchida, R. Nakagawa / J. Finan. Intermediation 16 (2007) 555–583 573
Table 3Mean adjusted LSV measure for city banks
Year Mean LSV p-value from t test p-value from Chi2 test
1975 −0.0012 0.53 0.081976 0.0122 0.28 0.021977 −0.0126 0.91 0.441978 0.0378 0.14 0.001979 0.0273 0.13 0.011980 0.0150 0.21 0.031981 0.0098 0.35 0.001982 −0.0011 0.56 0.231983 0.0027 0.41 0.211984 0.0079 0.33 0.061985 −0.0232 0.94 0.611986 0.0536 0.10 0.001987 0.1064 0.01 0.001988 0.0985 0.01 0.001989 0.0773 0.01 0.001990 −0.0229 0.98 0.671991 0.0058 0.44 0.041992 −0.0152 0.81 0.451993 0.0084 0.42 0.031994 0.0068 0.44 0.021995 0.0290 0.24 0.011996 0.0364 0.20 0.011997 0.0473 0.14 0.011998 0.0143 0.30 0.111999 −0.0082 0.59 0.162000 −0.0116 0.64 0.22
Note. Sample means of the adjusted LSV measure and respective p-values are shown. Shaded figures represent the resultsin which the null hypothesis of no herding is rejected at a 5% significance level.Source: Authors’ calculations.
3.3. Amount of loan increase due to irrational herding
Finally, let us try to estimate the total amount of loan increase or decrease during the bubbleperiod that can be attributed to irrational herd behavior. For an industry-year i, denote an averageincrease (decrease) in loans outstanding in the industry-year as AINCi > 0 (ADECi < 0), so thatthe actual amount of loan increase or decrease can be represented as AINCi · Pi · Ni + ADECi ·(1 − Pi) ·Ni . According to the definition of the LSV measure, the number of banks that increasedor decreased loans outstanding due to herd behavior is represented by |Pi − Pt |Ni . Thus, whenthere is an increase in loans outstanding due to herd behavior (Pi > Pt ), then the amount of anexcess loan increase due to herding can be represented as
AINCi (Pi − Pt)Ni − ADEC′i (Pi − Pt)Ni,
where ADEC′i (< 0) is the amount by which the banks that increased their loans outstanding
would have decreased them in the absence of herd behavior.33 Since we cannot observe ADEC′i ,
33 To simplify the analysis, we assume that all the banks would have decreased their loans outstanding by the sameamount.
574H
.Uchida,R
.Nakagaw
a/J.F
inan.Intermediation
16(2007)
555–583
fter adjustment).
Source: Authors’ calculations.
Fig. 4. Simple and weighted mean LSV measure for city banks (before and a
H. Uchida, R. Nakagawa / J. Finan. Intermediation 16 (2007) 555–583 575
as an approximation we assume that ADEC′i = ADECi , i.e. those banks that have increased their
loans outstanding due to herding would have decreased them by the amount of an actual aver-age decrease in the industry-year.34 The total amount of loan increase or decrease due to herdbehavior in a specific year is the sum of the estimates over the industry-years that belong to therelevant year.
For the three years 1987–1989 when the adjusted LSV measure is statistically significant, theestimates of the total amount of loan increase due to herd behavior are 2.07, 1.78, and 1.47 tril-lion yen, respectively. In sum, around 5 trillion yen of increase in total loans outstanding bycity banks during the bubble period might have been attributed to irrational herd behavior. Thisamount is non-negligible in terms of its economic significance. For reference, the amount of non-performing loans of city banks as of the end of March 1998 was 12.9 trillion yen.35 Althoughwe cannot directly link these numbers under a causality relationship, irrational bank behavior inthe late 1980s might have contributed to the accumulation of non-performing loans. If banks hadpracticed rational lending behavior based more on available information, they might have beenable to avoid accumulation of some portion of non-performing loans.
4. Herding among regional banks and herding by region
4.1. Herding among regional banks
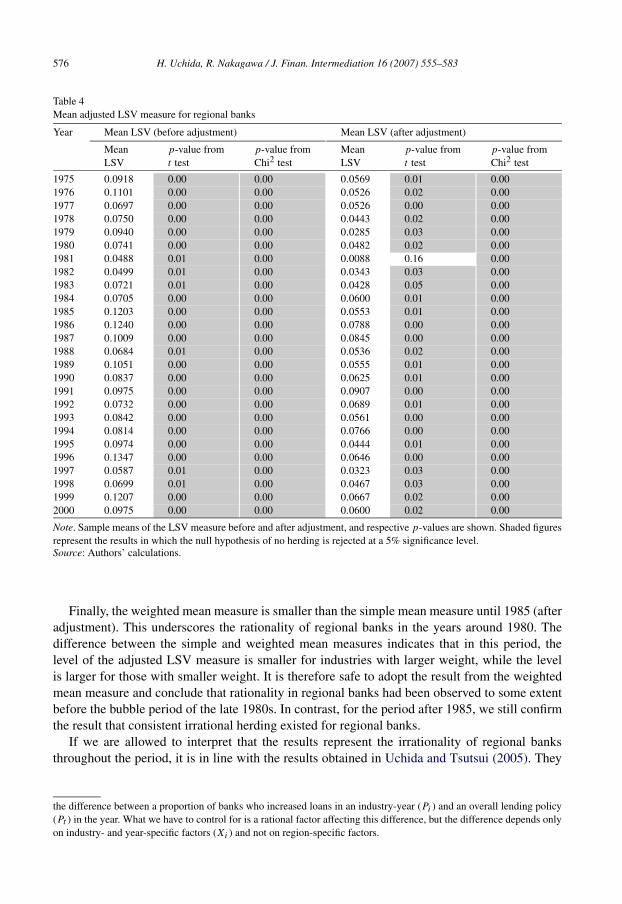
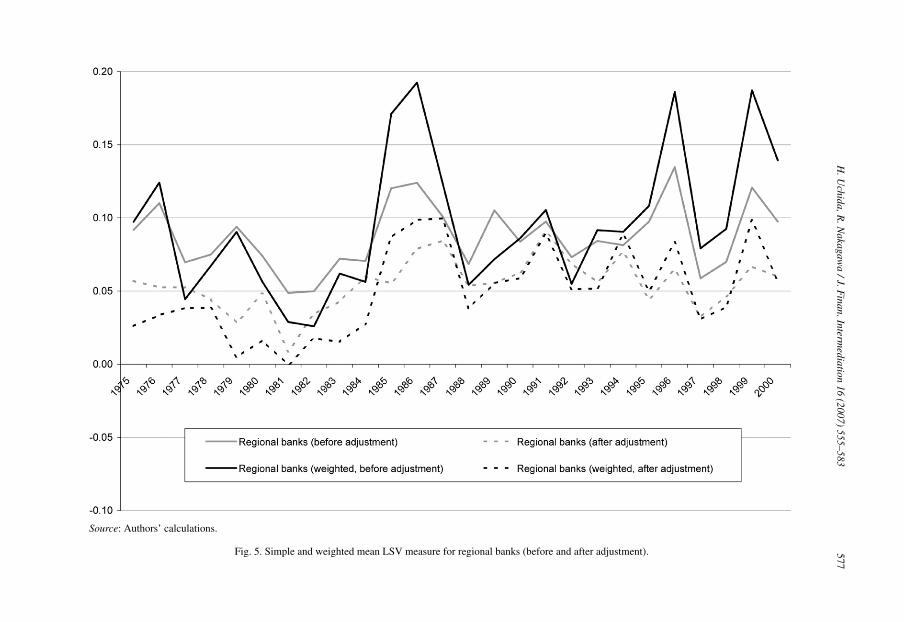
In this section, we apply the LSV measure to regional banks and compare the results withthose for city banks. The simple and weighted mean LSV measures obtained for regional banks(before and after adjustment) are presented in Table 4 and Fig. 5.
For regional banks, the results from a simple mean LSV measure (the gray solid line in Fig. 5)demonstrate the existence of consistent herding. We observe about 10% of collective deviationfrom the overall lending policy in each year. Consistent herding is also significant from a statisti-cal point of view (Table 4). We can reject the null hypothesis of no herding for the entire sampleperiod.
In contrast to the results for city banks, herd behavior is still consistently observed for regionalbanks even after the adjustment (the gray dotted line in Fig. 5).36 We can see that with someexceptions around 1980, only a small proportion of herding was due to rational factors. Still,a large magnitude of adjusted herding manifests itself consistently. The p-values from the Chi-squared test (Table 4) reveal that they are significant not only economically but also statistically.We could therefore conclude that it is highly probable that regional banks had been consistentlyfollowing irrational herd behavior. This makes a good contrast with the results for city banks,which represent irrationality mainly in the late 1980s.37
34 As for the industry-year in which banks excessively decreased their loans outstanding (i.e. Pi < Pt ), we follow thesame procedure but assume that AINC′
i= AINCi .
35 This amount is the sum of loans to borrowers in legal bankruptcy, past due loans in arrears by 6 months or more,loans in arrears by 3 to 6 months, and restructured loans. See “The Current Status of Risk Management Loans held byDeposit-Taking Financial Institutions in Japan,” a press release by the Financial Services Agency, the Government ofJapan, July 1998 (available at http://www.fsa.go.jp/p_fsa/news/newse/news-e-717.html).36 As a control variable representing land price for regional banks, the index of land price for the region outside the sixlargest urban areas is used.37 One might infer that the reason a great extent of herding is consistently observed for regional banks even after theadjustment is not because they are irrational but because they are making lending decisions based on regional economicconditions. However, this type of herding is not likely to be captured in the LSV measure. The LSV measure captures
576 H. Uchida, R. Nakagawa / J. Finan. Intermediation 16 (2007) 555–583
Table 4Mean adjusted LSV measure for regional banks
Year Mean LSV (before adjustment) Mean LSV (after adjustment)
MeanLSV
p-value fromt test
p-value fromChi2 test
MeanLSV
p-value fromt test
p-value fromChi2 test
1975 0.0918 0.00 0.00 0.0569 0.01 0.001976 0.1101 0.00 0.00 0.0526 0.02 0.001977 0.0697 0.00 0.00 0.0526 0.00 0.001978 0.0750 0.00 0.00 0.0443 0.02 0.001979 0.0940 0.00 0.00 0.0285 0.03 0.001980 0.0741 0.00 0.00 0.0482 0.02 0.001981 0.0488 0.01 0.00 0.0088 0.16 0.001982 0.0499 0.01 0.00 0.0343 0.03 0.001983 0.0721 0.01 0.00 0.0428 0.05 0.001984 0.0705 0.00 0.00 0.0600 0.01 0.001985 0.1203 0.00 0.00 0.0553 0.01 0.001986 0.1240 0.00 0.00 0.0788 0.00 0.001987 0.1009 0.00 0.00 0.0845 0.00 0.001988 0.0684 0.01 0.00 0.0536 0.02 0.001989 0.1051 0.00 0.00 0.0555 0.01 0.001990 0.0837 0.00 0.00 0.0625 0.01 0.001991 0.0975 0.00 0.00 0.0907 0.00 0.001992 0.0732 0.00 0.00 0.0689 0.01 0.001993 0.0842 0.00 0.00 0.0561 0.00 0.001994 0.0814 0.00 0.00 0.0766 0.00 0.001995 0.0974 0.00 0.00 0.0444 0.01 0.001996 0.1347 0.00 0.00 0.0646 0.00 0.001997 0.0587 0.01 0.00 0.0323 0.03 0.001998 0.0699 0.01 0.00 0.0467 0.03 0.001999 0.1207 0.00 0.00 0.0667 0.02 0.002000 0.0975 0.00 0.00 0.0600 0.02 0.00
Note. Sample means of the LSV measure before and after adjustment, and respective p-values are shown. Shaded figuresrepresent the results in which the null hypothesis of no herding is rejected at a 5% significance level.Source: Authors’ calculations.
Finally, the weighted mean measure is smaller than the simple mean measure until 1985 (afteradjustment). This underscores the rationality of regional banks in the years around 1980. Thedifference between the simple and weighted mean measures indicates that in this period, thelevel of the adjusted LSV measure is smaller for industries with larger weight, while the levelis larger for those with smaller weight. It is therefore safe to adopt the result from the weightedmean measure and conclude that rationality in regional banks had been observed to some extentbefore the bubble period of the late 1980s. In contrast, for the period after 1985, we still confirmthe result that consistent irrational herding existed for regional banks.
If we are allowed to interpret that the results represent the irrationality of regional banksthroughout the period, it is in line with the results obtained in Uchida and Tsutsui (2005). They
the difference between a proportion of banks who increased loans in an industry-year (Pi ) and an overall lending policy(Pt ) in the year. What we have to control for is a rational factor affecting this difference, but the difference depends onlyon industry- and year-specific factors (Xi ) and not on region-specific factors.
H.U
chida,R.N
akagawa
/J.Finan.Interm
ediation16
(2007)555–583
577
after adjustment).
Source: Authors’ calculations.
Fig. 5. Simple and weighted mean LSV measure for regional banks (before and
578 H. Uchida, R. Nakagawa / J. Finan. Intermediation 16 (2007) 555–583
report that regional banks were consistently under less stringent competitive pressure than citybanks throughout the period. They might thus have been able to afford to herd.38
4.2. Regional herding
Thus far, we have treated banks of the same type in a uniform manner, irrespective of theirlocation in relation to each other. An implicit assumption behind this approach is that banks of thesame type herd. However, it may also be plausible to suppose that banks herd with nearby banks,irrespective of their type. For example, a regional bank in Hokkaido prefecture (the north endof Japan) is not likely to herd (at least directly) with one in Okinawa prefecture (the south end),more than 2000 kilometers away. Rather, the bank is more likely to herd with a city bank whichoperates in Hokkaido. Thus, if we confine sample banks based on their geographical location,we may find a greater degree of herding.
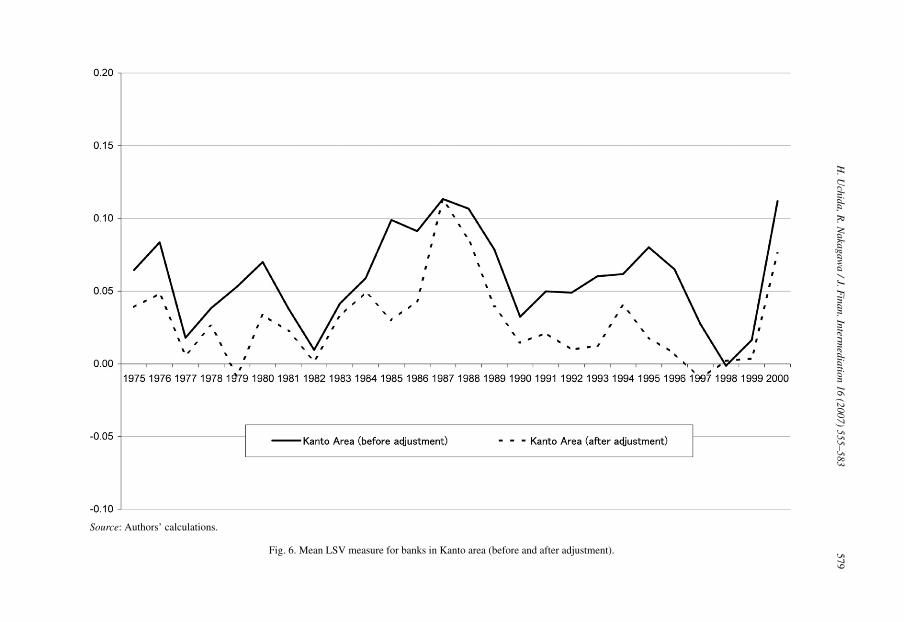
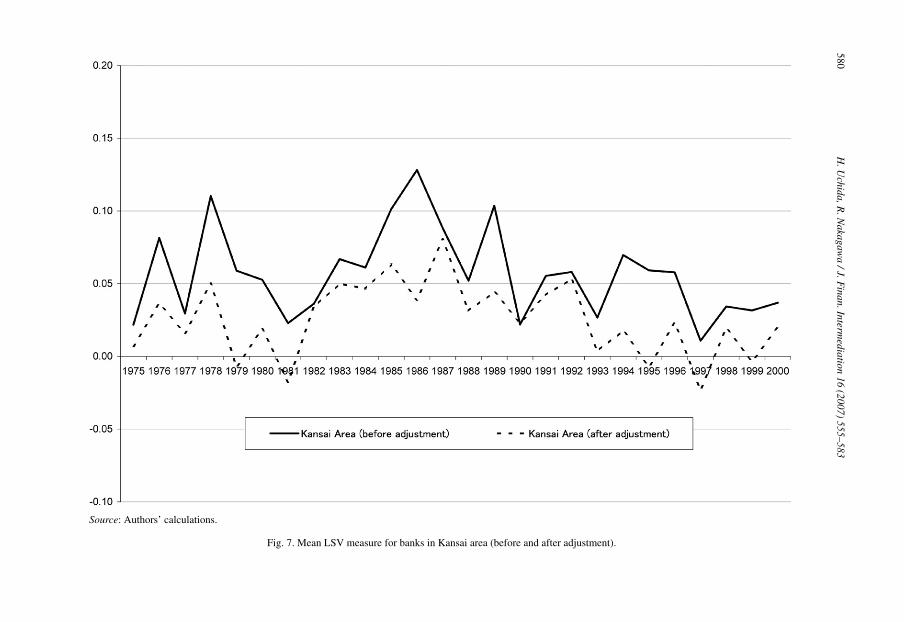
Thus we now focus on two major urban areas in Japan and investigate herding in the two areaswithout separating sample banks by their type.39 The first area is the Kanto area, which consistsof Tokyo, Kanagawa, Saitama, Chiba, Ibaragi, Tochigi, and Gunma prefectures. This area is theeconomic center of Japan. The other area is the Kansai area, consisting of Osaka, Hyogo, Kyoto,Nara, Shiga, and Wakayama prefectures. This area constitutes the second largest focal point ofthe economy of Japan.40 We constructed two separate samples consisting of banks whose mainoffice is located in each of the two areas outlined above, irrespective of whether the bank is a citybank or a regional bank.
The mean LSV measures before and after adjustment for the two areas are represented inFigs. 6 and 7. We can see moderate levels of herding. That is, although the line depicting thetransition is almost exactly in between that of city banks and regional banks, the magnitude ofthe measures is slightly smaller. The Chi-squared test (not reported) reveals that after adjustment,significant levels of herding are observed almost exclusively during the 1983–1989 period.
These results, together with those in the previous sections, imply that a larger extent of herd-ing is observed by type of bank rather than by region. That is, banks tend to herd more withthose of the same type than with those of geographical proximity. If the herding is caused bybanks’ inference from behavior of other banks, this finding implies that banks are more likely toinfer among the same type of bank than to infer among geographically proximate banks (acrossdifferent types).41 This finding is also consistent with the hypothesis that the banking market inJapan is segmented by type.42
38 A less stringent competitive environment for regional banks might have been due to regional segmentation of theirmarkets. One might then speculate that banks as regional monopolists would not follow herd behavior at all, whichcontradicts the evidence obtained in this paper. However, Kano and Tsutsui (2003) demonstrate that markets for regionalbanks were not segmented by prefecture, although they were not perfectly competitive. Together with the results ofUchida and Tsutsui (2005), this implies that regional banks in Japan were under competition even if it was not verysevere. The result of consistent herding is thus not contradictory.39 The analysis in this subsection is based on a suggestion by an anonymous referee, for which we are grateful.40 We chose a division not by prefecture but by area greater than prefecture so as to retain a sufficient number of samples,and because prefectures seem to be small geographically to focus on as markets in which banks herd.41 See footnote 4.42 Although the hypothesis has not directly been tested, there is some evidence that supports it. Uchida and Tsutsui(2005) demonstrate that the degree of competition of city banks is different from that of regional banks, which implies amarket segmentation between city banks and regional banks. Also, Kano and Tsutsui (2003) demonstrate that the banking
H.U
chida,R.N
akagawa
/J.Finan.Interm
ediation16
(2007)555–583
579
ustment).
Source: Authors’ calculations.
Fig. 6. Mean LSV measure for banks in Kanto area (before and after adj
580H
.Uchida,R
.Nakagaw
a/J.F
inan.Intermediation
16(2007)
555–583
djustment).
Source: Authors’ calculations.
Fig. 7. Mean LSV measure for banks in Kansai area (before and after a
H. Uchida, R. Nakagawa / J. Finan. Intermediation 16 (2007) 555–583 581
5. Conclusion
For the purpose of investigating herd behavior among Japanese banks, we calculated the herd-ing measure invented by Lakonishok et al. (1992). The results obtained in this paper give usinformation to answer the question raised in the Introduction. First of all, city banks had followeda cyclical pattern of herding. After adjusting for rational factors that are contained in the originalmeasure, it turned out that herd behavior by city banks was mainly due to rational factors. How-ever, results indicative of irrational herding in the late 1980s were still obtained. Our estimateindicates that a total of some 5 trillion yen of loan increase by city banks during the 1987–1989period can be attributed to irrational herd behavior. These results imply that irrational herd be-havior by city banks during the bubble period might have contributed to the non-performingloan problem in the 1990s. This made a good contrast with the results for regional banks, whichdemonstrated evidence consistent with the existence of irrational herd behavior from the mid-1980s. Finally, we found that herd behavior is likely to be followed among the same types ofbanks rather than across different types, and moderately followed among geographically proxi-mate banks.
There is an interesting issue that remains unchallenged in this paper. Although we were ableto present empirical evidence to answer the three questions raised in the Introduction, investi-gation of the effect of irrational herding that we found is still insufficient. Further investigationis anticipated about whether and how irrational behavior has contributed to the accumulation ofnon-performing loans.
The financial system in Japan has long been bank-oriented, and banks have been playinga major role in the economy. The existence of herding among Japanese banks shown in thispaper is thus as important as that among fund managers in the US, whose financial system ismarket-oriented. Taking account of the serious banking crisis in Japan in the 1990s, investigationof herd behavior should be an important research topic in other economies. The present paperdemonstrates the possibility of applying the method of analysis for herd behavior among fundmanagers to that among banks. In order to obtain some lesson from the Japanese banking crisis,it would be interesting to apply the same analysis to other bank-oriented economies.
Acknowledgments
Comments by two anonymous referees, Ernst-Ludwig von Thadden (the editor), YoshiroTsutsui, Takuya Noguchi, Peng Xu, Russ Wermers, and Matt Pritsker are gratefully acknowl-edged. An earlier version of this paper has been presented at the 2004 Far Eastern Meeting(Seoul) and Australasian Meeting (Melbourne) of the Econometric Society, the 2004 meeting ofthe Japanese Economic Association, the Monetary Economics Workshop, the Financial SystemWorkshop, and a seminar at Kansai University. The first author thanks the Grant-in-Aid for Sci-entific Research (C) (No. 15530214) of the Ministry of Education, Science, Sports and Culture,and Wakayama University Research Fund, and the second author thanks the Financial SystemWorkshop for financial support. Most of this study was conducted during the first author’s termat the Kelley School of Business, Indiana University, as a visiting scholar. He would like to thankhis host, Greg Udell, and the faculty members of the Finance Department, for their hospitalityand intellectual interaction.
market for regional banks is not strictly segmented by prefecture, whereas that for Shinkin banks (smaller cooperativebanks) is segmented by prefecture, which implies a market segmentation between regional banks and Shinkin banks.
582 H. Uchida, R. Nakagawa / J. Finan. Intermediation 16 (2007) 555–583
References
Acharya, V.V., 2001. A theory of systemic risk and design of prudential bank regulation. Unpublished manuscript. Avail-able at SSRN: http://ssrn.com/abstract=236401.
Acharya, V.V., Yorulmazer, T., 2005. Limited liability and bank herding. Unpublished manuscript. Available at SSRN:http://ssrn.com/abstract=442860.
Acharya, V.V., Yorulmazer, T., 2006. Cash-in-the-market pricing and optimal resolution of bank failures. Rev. Finan.Stud., in press.
Acharya, V.V., Yorulmazer, T., 2007. Too many to fail—An analysis of time-inconsistency in bank closure policies.J. Finan. Intermediation 16, 1–31.
Banerjee, A., 1992. A simple model of herd behavior. Quart. J. Econ. 107, 797–817.Berger, A.N., Udell, G.F., 2004. The institutional memory hypothesis and the procyclicality of bank lending behavior.
J. Finan. Intermediation 13, 458–495.Bikhchandani, S., Sharma, S., 2001. Herd behavior in financial markets. IMF Staff Pap. 47, 279–310.Bikhchandani, S., Hirshleifer, D., Welch, I., 1992. A theory of fads, fashion, custom, and cultural change as informational
cascades. J. Polit. Economy 100, 992–1026.Bikhchandani, S., Hirshleifer, D., Welch, I., 1998. Learning from the behavior of others: Conformity, fads, and informa-
tional cascades. J. Econ. Perspect. 12, 151–170.Borensztein, E.R., Gelos, R.G., 2000. A panic-prone pack? The behavior of emerging market mutual funds. Working
paper WP/00/198. IMF.Cargill, T.F., 2000. What caused Japan’s banking crisis? Chapter 2. In: Hoshi, T., Patrick, H. (Eds.), Crisis and Change
in the Japanese Financial System. Kluwer Academic.Christie, W.G., Huang, R.D., 1995. Following the pied piper: Do individual returns herd around the market? Finan.
Analysts J. 51, 31–37.Choe, H., Kho, B.C., Stulz, R.M., 1999. Do foreign investors destabilize stock markets? The Korean experience in 1997.
J. Finan. Econ. 54, 227–264.Devenow, A., Welch, I., 1996. Rational herding in financial economics. Europ. Econ. Rev. 40, 603–615.Diamond, D.W., Dybvig, P., 1983. Bank runs, deposit insurance, and liquidity. J. Polit. Economy 91, 401–419.Falkenstein, E.G., 1996. Preferences for stock characteristics as revealed by mutual fund portfolio holdings. J. Finance 51,
111–135.Froot, K., Scharfstein, D.S., Stein, J.C., 1992. Herd on the street: Informational inefficiencies in a market with short-term
speculation. J. Finance 47, 1461–1484.Gelos, R.G., Wei, S.J., 2002. Transparency and international investor behavior. Working paper 9260. NBER.Graham, J.R., 1999. Herding among investment newsletters: Theory and evidence. J. Finance 54, 237–268.Grinblatt, M., Titman, S., Wermers, R., 1995. Momentum investment strategies, portfolio performance, and herding:
A study of mutual fund behavior. Amer. Econ. Rev. 85, 1088–1105.Hirshleifer, D., Teoh, S.H., 2003. Herd behavior and cascading in capital markets: A review and synthesis. Europ. Finan.
Manage. 9, 25–66.Hirshleifer, D., Subrahmanyam, A., Titman, S., 1994. Security analysis and trading patterns when some investors receive
information before others. J. Finance 46, 1665–1698.Hoshi, T., 2002. The convoy system for insolvent banks: How it originally worked and why it failed in the 1990s. Japan
World Economy 14, 155–180.Hoshi, T., Kashyap, A., 2000. The Japanese banking crisis: Where did it come from and how will it end? Bernanke, B.S.,
Rotemberg, J. (Eds.), NBER Macroeconomic Annual 1999. MIT Press, pp. 129–201.Hoshi, T., Kashyap, A., 2001. Corporate Financing and Governance in Japan. MIT Press.Hwang, S., Salmon, M., 2004. Market stress and herding. J. Empirical Finance 11, 585–616.Jain, A.K., Gupta, S., 1987. Some evidence on ‘herding’ behavior of U.S. banks. J. Money, Credit, Banking 19, 78–89.Jiménez, G., Saurina, J., 2006. Credit cycles, credit risk, and prudential regulation. Int. J. Central Banking 5.Kano, M., Tsutsui, Y., 2003. Geographical segmentation in Japanese bank loan markets. Reg. Sci. Urban Econ. 33,
157–174.Kim, W., Wei, S.J., 2002a. Offshore investment funds: Monsters in emerging market? J. Devel. Econ. 68, 205–224.Kim, W., Wei, S.J., 2002b. Foreign portfolio investors before and during a crisis. J. Int. Econ. 56, 77–96.Kodres, L.E., Pritsker, M., 1996. Directionally similar position taking and herding by large futures market participants.
In: Risk Measurement and Systemic Risk. Board of Governors of the Federal Reserve System, Washington.Lakonishok, J., Shleifer, A., Vishny, R.V., 1992. The impact of institutional trading on stock prices. J. Finan. Econ. 32,
23–43.
H. Uchida, R. Nakagawa / J. Finan. Intermediation 16 (2007) 555–583 583
Nakagawa, R., Uchida, H., 2003. Herd behavior in the Japanese loan market: Evidence from semi-macro data. Workingpaper No. 03-02. Wakayama University.
Nofsinger, J.R., Sias, R.W., 1999. Herding and feedback trading by institutional and individual investors. J. Finance 54,2263–2295.
Ogura, Y., 2006. Learning from a rival bank and lending boom. J. Finan. Intermediation 15, 535–555.Pennacchi, G.G., 2005. Risk-based capital standards, deposit insurance, and procyclicality. J. Finan. Intermediation 14,
432–465.Rajan, R.G., 1994. Why credit policies fluctuate: A theory and some evidence. Quart. J. Econ. 109, 399–442.Rice, J.A., 1995. Mathematical Statistics and Data Analysis: Second Edition. Duxbury Press, CA.Scharfstein, D.S., Stein, J.C., 1990. Herd behavior and investment. Amer. Econ. Rev. 80, 465–479.Uchida, H., Tsutsui, Y., 2005. Has competition in the Japanese banking sector improved? J. Banking Finance 29, 419–
439.Ueda, K., 2000. Causes of Japan’s banking problems in the 1990s. Chapter 3 in: Hoshi, T., Patrick, H. (Eds.), Crisis and
Change in the Japanese Financial System. Kluwer Academic.Walter, A., Weber, F.M., 2006. Herding in the German mutual fund industry. Europ. Finan. Manage. 12, 375–406.Wermers, R., 1995. Herding, trade reversals, and cascading by institutional investors. Unpublished manuscript. Robert
H. Smith School of Business, University of Maryland at College Park, College Park, MD.Wermers, R., 1999. Mutual Fund Herding and the Impact on Stock Prices. J. Finance 54, 581–622.Woo, D., 2003. In search of “capital crunch”: Supply factors behind the credit slowdown in Japan. J. Money, Credit,
Banking 35, 1019–1038.Wylie, S., 2005. Fund manager herding: A test of the accuracy of empirical results using UK data. J. Bus. 78, 381–403.