Embed Size (px)
Citation preview
Introduction
Hepatobiliary imaging by computed tomography(CT) has advanced impressively since the intro-duction of multidetector CT (MDCT) scanners inthe late 1990s. Over the last few years, the numberof detector rows has increased progressively fromfour, to eight, to 16, and then up to 64. Two impor-tant advantages of MDCT are the routine use ofthinner, submillimeter sections, which yield higherspatial resolution, along the Z-axis and decrease ingantry rotation time, which result in a significant-ly reduced scan time. Sixteen-, 32- and 64-slicescanners allow the acquisition of data sets withnearly isotropic voxels for multiplanar imaging(e.g., coronal and sagittal plane), which has similarspatial resolution compared with axial planes.These off-axis reformations are particularly help-ful for evaluating the hepatic vascular anatomy, thebiliary system, and the segmental distribution ofhepatic lesions. Since thin-section collimation alsoreduces partial volume averaging, sensitivity andspecificity for detecting and characterizing in-creases, especially for small focal hepatic lesions,whether benign or malignant. Furthermore, evalu-ation of the biliary tract improves, not only at thelevel of the porta hepatis and extrahepatic bileducts, but all the way to the hepatic periphery.
Shorter scan durations make it possible to in-clude the entire upper abdomen during a single,comfortable breath hold. This reduces motionartefacts, especially in critically ill patients.Anoth-er advantage of reduced scan duration is moreprecise timing of different hepatic enhancementphases following bolus administration of iodinat-ed contrast material, thus improving depiction anddifferentiation of focal hepatic lesions.
The main indication for MDCT examination ofthe liver is the detection and characterization ofhepatic lesions. The crucial part of a diagnosticwork-up of focal hepatic lesions is the differentia-
tion between benign and malignant disease. Char-acterization of small incidental lesions still re-mains a challenging task for hepatic MDCT be-cause of an overall lack of features. Schwartz et al.[1] has shown, however, that approximately 80% ofsmall hepatic lesions (smaller than 1 cm) in pa-tients with cancer diagnosed on MDCT are benign.
Urgent indications for MDCT scan of the liverinclude blunt and penetrating trauma, abscesses,and postoperative complications (e.g., bleeding, in-fection). Moreover, multiphasic MDCT plays animportant role for pre- and postoperative evalua-tion of liver resection and transplant patients.MDCT is also highly useful for diagnosing hepaticparenchymal abnormalities (e.g., fatty infiltration,cirrhosis, iron deposition) and in some cases canprovide quantitative information.
The gold standard for imaging the biliary treeis still endoscopic retrograde cholangiopancre-atography (ERCP) even though this procedure isinvasive, expensive, and physician intensive. In thelast several years, magnetic resonance cholan-giopancreatography (MRCP) has gained wide ac-ceptance for noninvasive biliary imaging. In somepractices and many academic centers, MRCP evenfunctions as the first-choice technique for biliarytract imaging. Although spatial resolution ofMDCT is superior to that of MRCP, MDCT, eitherwith or without a cholangiographic agent, servesonly as an alternative clinical tool for noninvasiveevaluation of the biliary system.
In this chapter, we discuss technical principlesand improvements of hepatobiliary MDCT. In ad-dition, the principles of contrast media applicationand different phases of liver enhancement, includ-ing the typical enhancement pattern of various liv-er lesions, are reviewed.
II.2Hepatobiliary Imaging by MultidetectorComputed Tomography (MDCT)
Sebastian T. Schindera and Rendon C. Nelson
50 MDCT: A Practical Approach
Parameters and Technical Principlesof Hepatobiliary MDCT
After introduction of the first 4-row MDCT scan-ner in 1998, the radiological community quicklyaccepted the new technology. With the develop-ment of 16-, 32-, and 64-slice scanners, data acqui-sition time has been further reduced. Coupling ofwide collimation with large beam pitches andfaster gantry rotation times has allowed for rou-tine use of submillimeter collimation to acquiredata sets with isotropic voxels. Rapid technologicaldevelopment, though, has increased the complexi-ty of imaging options and scanning parameters.Radiologists using MDCT for hepatobiliary imag-ing should understand the imaging parametersand technical principles needed to acquire imageswith superior quality. The key parameters are:• Acquisition parameters• Reconstruction parameters• Contrast media application• Different phases of hepatic vascular and
parenchymal enhancement.
Acquisition Parameters
As the number of detector channels increases, ap-plication of thin collimation has become a routinepart of MDCT. The minimum section collimationof 16-, 32-, and 64-slice scanners is 0.625 mm (GE,Philips), 0.60 mm (Siemens), or 0.50 mm (Toshi-ba). This submillimeter feature allows for isotropicdata acquisition.An isotropic voxel is cubic, havingequal dimensions in the X-, Y- and Z-axis. Sincethe X- and Y-axes are determined by both field-of-view (FOV) and matrix size, isotropic voxels canbe acquired only when slice thickness (Z-axis)measures 0.75 mm or less. The major advantage ofthese nearly isotropic data sets is the ability to re-format images in any desired plane, having similar
spatial resolution to that of the axial plane. In re-cent studies, our group found multiplanar refor-mations particularly helpful for diagnosis of acuteappendicitis and for evaluation of small-bowel ob-struction [2, 3]. Further work is needed to evaluatethe contribution of MDCT to hepatobiliary imag-ing.
Owing to increased spatial resolution and re-duced partial volume averaging, thinner-slice col-limation also results in an improved ability to de-tect small hepatic lesions. However, there is noconsensus in the literature about the optimal colli-mation needed to detect small hepatic lesions[4–7]. The study performed by Haider et al. [7] us-ing a 4-slice MDCT scanner did not find an im-provement in the detection of hepatic metastasesmeasuring 1.5 cm or smaller at collimation widthsof less than 5 mm. Similar results were reported byAbdelmoumene et al. [5] when comparing fourprotocols with different slice collimations (5.0 and2.5 mm) to detect small liver metastases (<2 cm).No improvement in lesion detection was foundwith a collimation width less than 2.5 mm. Fur-thermore, hepatic imaging with thinner sectionscaused an increase in image noise, with signifi-cantly lower performance in the detection of he-patic lesions [5]. To reduce noise associated withthinner sections, radiation dose to the patientshould be increased. Typical scanning protocolsfor hepatobiliary imaging by MDCT are shown inTable 1. Section collimation should be tailored tothe indication for hepatobiliary CT scan.
Reconstruction Parameters
With the development of 16-slice scanners, it be-came possible to scan the entire abdomen during asingle, comfortable breath hold at a resolution ofless than 1 mm in the X-, Y-, and Z-axes, resultingin a nearly isotropic data set. This three-dimen-
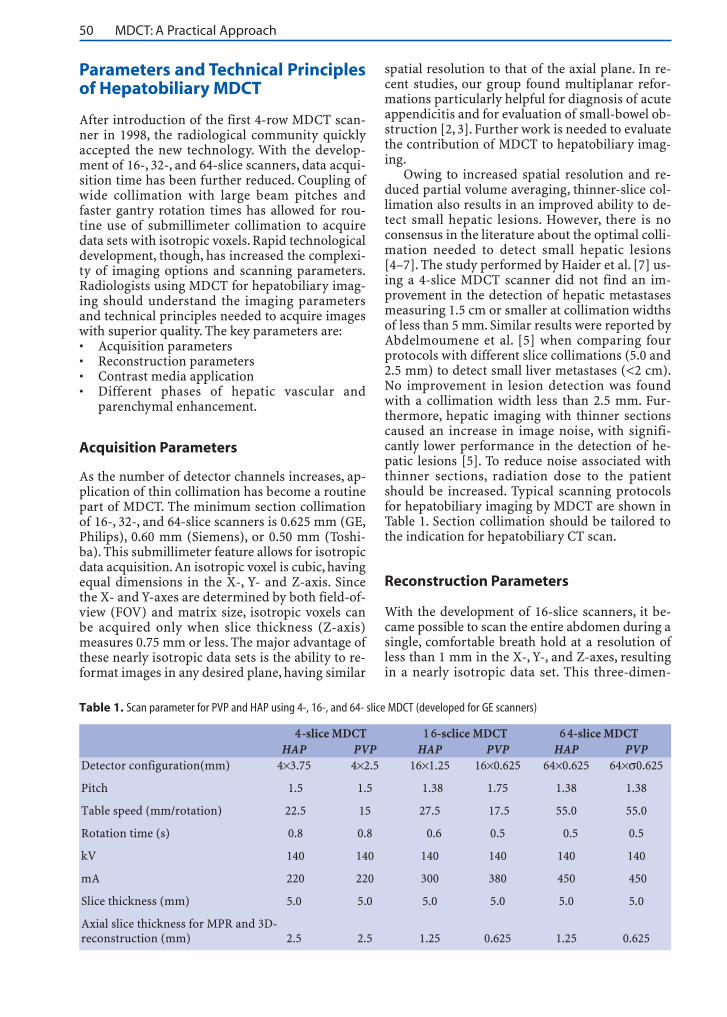
Table 1. Scan parameter for PVP and HAP using 4-, 16-, and 64- slice MDCT (developed for GE scanners)
4-slice MDCT 1 6-sclice MDCT 6 4-slice MDCTHAP PVP HAP PVP HAP PVP
Detector configuration(mm) 4×3.75 4×2.5 16×1.25 16×0.625 64×0.625 64×σ0.625
Pitch 1.5 1.5 1.38 1.75 1.38 1.38
Table speed (mm/rotation) 22.5 15 27.5 17.5 55.0 55.0
Rotation time (s) 0.8 0.8 0.6 0.5 0.5 0.5
kV 140 140 140 140 140 140
mA 220 220 300 380 450 450
Slice thickness (mm) 5.0 5.0 5.0 5.0 5.0 5.0
Axial slice thickness for MPR and 3D-reconstruction (mm) 2.5 2.5 1.25 0.625 1.25 0.625
II.2 • Hepatobiliary Imaging by Multidetector Computed Tomography (MDCT) 51
sional (3-D) volume can be used for further two-dimensional (2-D) and 3-D postprocessing. Themost important rendering techniques for hepato-biliary MDCT are straight or curved multiplanarreformation (MPR), maximum intensity projec-tion (MIP), minimum intensity projection(minIP), and volume rendering (VR). The type ofreconstruction primarily depends on the indica-tion for the study.
MPR, representing a 2-D reformatted planeother than the axial plane, is mainly used as a toolto visualize complex hepatic anatomic and patho-logical findings. Using a 4-slice CT scanner, Honget al. [8] evaluated image quality and diagnosticvalue of abdominal MPRs. There was superior vi-sualization of liver segments and lesions withMPRs compared with axial images alone; however,no significant difference in liver lesion detectionbetween axial and MPR images could be found.The key to optimizing image quality of MPRs is toincrease the reconstruction thickness to severalmillimeters. Recently, our group demonstrated in aqualitative analysis that 2- and 3-mm-thick coro-nal reformations provide the best image quality[9]; 1-mm-thick sections were too noisy whereas4- to 5-mm slice thickness was too smooth, yield-ing little anatomical detail, especially for bloodvessels and lymph nodes.
MIPs are routinely used to evaluate hepatic ar-teries and the portal veins since these projectionsdisplay the greatest attenuation difference betweenvessels and adjacent tissue. Another indication forMIP is CT cholangiography, which is well suited tovisualization of the biliary tract anatomy and thepresence of congenital anomalies [10–12]. In pa-tients with bile duct obstruction, minIPs may behelpful for demonstrating the biliary tract whenMDCT is performed without a cholangiographicagent [13–15]. To improve image quality of MIPsand minIPs, partial volume averaging effects canbe reduced by choosing the volume of interest assmall as possible.
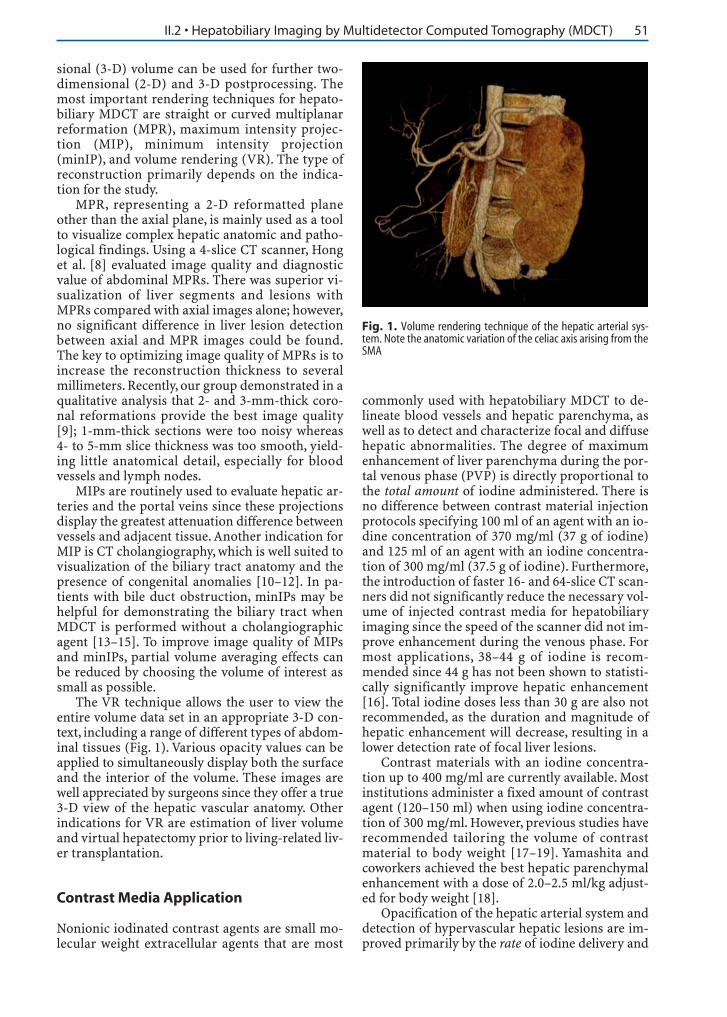
The VR technique allows the user to view theentire volume data set in an appropriate 3-D con-text, including a range of different types of abdom-inal tissues (Fig. 1). Various opacity values can beapplied to simultaneously display both the surfaceand the interior of the volume. These images arewell appreciated by surgeons since they offer a true3-D view of the hepatic vascular anatomy. Otherindications for VR are estimation of liver volumeand virtual hepatectomy prior to living-related liv-er transplantation.
Contrast Media Application
Nonionic iodinated contrast agents are small mo-lecular weight extracellular agents that are most
commonly used with hepatobiliary MDCT to de-lineate blood vessels and hepatic parenchyma, aswell as to detect and characterize focal and diffusehepatic abnormalities. The degree of maximumenhancement of liver parenchyma during the por-tal venous phase (PVP) is directly proportional tothe total amount of iodine administered. There isno difference between contrast material injectionprotocols specifying 100 ml of an agent with an io-dine concentration of 370 mg/ml (37 g of iodine)and 125 ml of an agent with an iodine concentra-tion of 300 mg/ml (37.5 g of iodine). Furthermore,the introduction of faster 16- and 64-slice CT scan-ners did not significantly reduce the necessary vol-ume of injected contrast media for hepatobiliaryimaging since the speed of the scanner did not im-prove enhancement during the venous phase. Formost applications, 38–44 g of iodine is recom-mended since 44 g has not been shown to statisti-cally significantly improve hepatic enhancement[16]. Total iodine doses less than 30 g are also notrecommended, as the duration and magnitude ofhepatic enhancement will decrease, resulting in alower detection rate of focal liver lesions.
Contrast materials with an iodine concentra-tion up to 400 mg/ml are currently available. Mostinstitutions administer a fixed amount of contrastagent (120–150 ml) when using iodine concentra-tion of 300 mg/ml. However, previous studies haverecommended tailoring the volume of contrastmaterial to body weight [17–19]. Yamashita andcoworkers achieved the best hepatic parenchymalenhancement with a dose of 2.0–2.5 ml/kg adjust-ed for body weight [18].
Opacification of the hepatic arterial system anddetection of hypervascular hepatic lesions are im-proved primarily by the rate of iodine delivery and
Fig. 1. Volume rendering technique of the hepatic arterial sys-tem. Note the anatomic variation of the celiac axis arising from theSMA
52 MDCT: A Practical Approach
the timing of imaging relative to the contrast mediabolus. Improved lesion-to-liver contrast can be at-tained either by an accelerated injection rate or byan increased iodine concentration.While the injec-tion rate of contrast media (3–6 ml/s) may be phys-iologically limited, the use of contrast agents withhigher iodine concentration (350–400 mgI/ml) iscompelling. Regardless of iodine concentration,faster injection rates are superior in detection of hy-pervascular liver lesions. A recent study, Itoh et al.[20] reported improved arterial enhancement withcontrast agents having high iodine concentration(350 mgI/ml) by shortening the injection duration.Awai et al. [21] found a significantly higher tumor-to-liver contrast with hepatocellular carcinoma(HCC) in the arterial phase after administration ofcontrast material with high iodine concentration(370 mgI/ml) compared with moderate iodine con-centration (300 mgI/ml). However, there was no sig-nificant difference in hepatic enhancement duringthe PVP since the same iodine load was adminis-tered to both groups. There may be a potential costsaving when using a contrast material with a higheriodine concentration since the volume of contrastcan be decreased to maintain the same number ofgrams of iodine per milliliter per second.
In the case of MDCT angiography, when onlyarterial enhancement is of interest, Ho et al. [19]reported a significant reduction of contrast mate-rial dose with the use of an interactive injectionprotocol that included an immediate interruptionof the contrast injection after the aorta enhancedqualitatively. Contract media dose was reduced be-cause of the increased speed of the MDCT scanner.
The recent development and introduction ofdouble-syringe mechanical power injectors sim-plified the saline flush technique. Immediate injec-tion of a saline bolus after contrast agent adminis-tration avoids accumulation of the contrast agentin the injection tubing and the venous system. Thenew injector results in superior contrast enhance-ment. Schoellnast et al. [22] noted a significantlyhigher parenchymal and vascular enhancement ofthe liver in a group of patients receiving a 20-mlsaline flush with a double-syringe power injectorcompared with the same patient population usinga single-syringe power injector without flush. Thesame contrast media protocol (100 ml of contrastagent with iodine concentration of 300 mgI/ml)was used in both groups. By using the saline flushtechnique, the same group showed a decrease incontrast media dose by 17% without a significantdecrease in enhancement of hepatic parenchymaand vessels [23]. This injection technique may re-duce total yearly amounts of contrast agent and in-dividual patient doses, for example, for patientswith renal insufficiency; however, the additionalcosts of a second syringe must be taken into ac-count.
To opacify the biliary tree for diagnostic imag-ing with MDCT (CT cholangiography), either oralor intravenous cholangiographic contrast agentscan be administered. The intravenous cholangio-graphic contrast agent is infused over 30 min andis followed by a CT scan within 15–30 min. Mostinstitutions administer intravenous diphenhy-dramine prior to infusion of cholangiographiccontrast material to diminish the incidence of al-lergic reactions. For CT cholangiography with oralcontrast medium, the patient has to ingest 6 g ofiopanoic acid after a low-fat meal the night before.Several studies have shown that intravenous MDCT cholangiography is feasible for noninvasiveevaluation of the biliary anatomy [11, 12, 24].Nonetheless, intravenous cholangiography israrely used in the United States, not only due to thehigh rate of allergic reactions and of renal and he-patic toxicity, but also due to the fact that there issuboptimal visualization of the biliary tract in upto 36% of patients [12, 25].
Different Phases of Hepatic Vascular andParenchymal Enhancement
The increasing speed of MDCT scanners has im-proved the ability to perform multiphasic exami-nations of the liver. Most of the recently intro-duced 64-slice MDCT scanners image the wholeliver in less than 2 s. Since acquisitions are becom-ing closer to a snapshot, timing of contrast-materi-al bolus is even more important. Most of the re-cently introduced 64-slice MDCT scanners imagethe whole liver in less than 2 s, which may result insuperior hepatic scans during multiple phaseswith more optimal enhancement. Table 2 demon-strates the indication for dynamic hepatobiliaryMDCT imaging.
There are selected cases in which an unen-hanced CT scan of the liver is helpful and recom-mended. Reasonable clinical indications for a non-contrast hepatic CT include:• Depiction of acute hemorrhage of the liver• Delineation of siderotic nodules• Detection and characterization of hepatic calci-
fication (e.g., calcified metastases, epithelioidhemangioendothelioma, hydatid cysts)
• Evaluation of parenchymal liver diseases (e.g.,fatty infiltration, hepatic cirrhosis, hemochro-matosis)
• Follow-up CT scan after embolization of hyper-vascular liver lesionsContrast-enhanced MDCT of the liver is com-
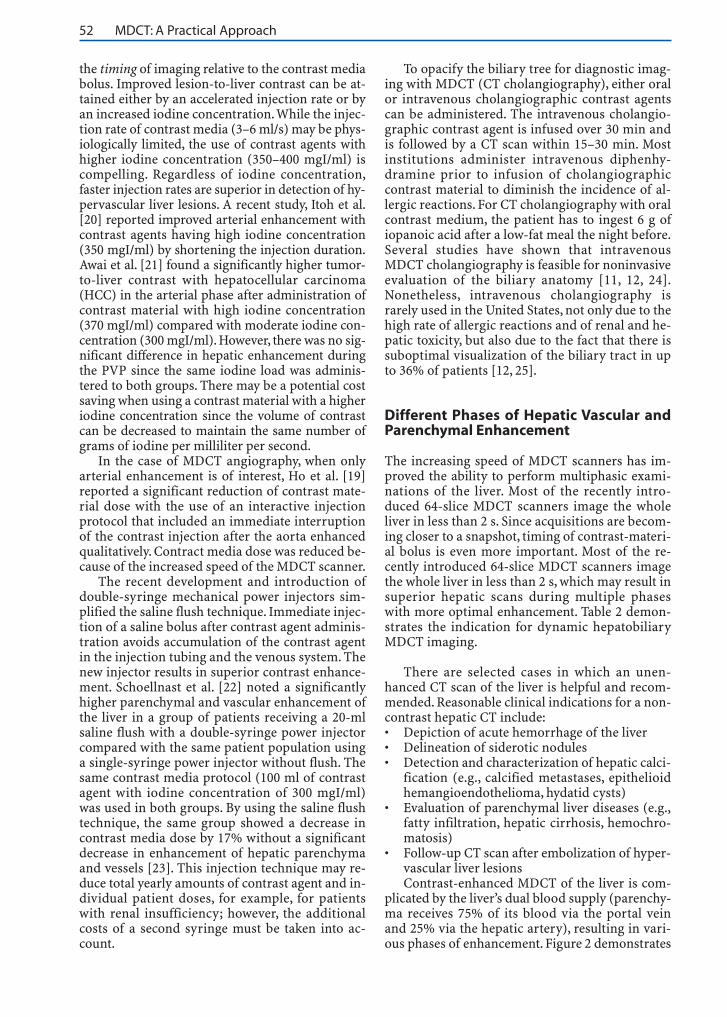
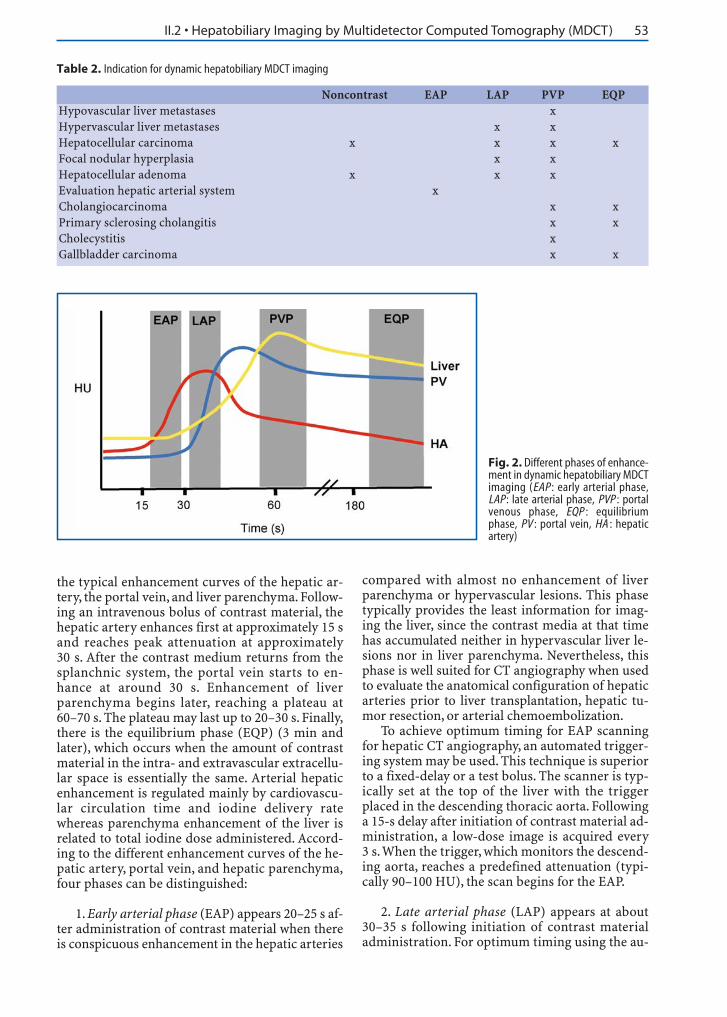
plicated by the liver’s dual blood supply (parenchy-ma receives 75% of its blood via the portal veinand 25% via the hepatic artery), resulting in vari-ous phases of enhancement. Figure 2 demonstrates
II.2 • Hepatobiliary Imaging by Multidetector Computed Tomography (MDCT) 53
the typical enhancement curves of the hepatic ar-tery, the portal vein, and liver parenchyma. Follow-ing an intravenous bolus of contrast material, thehepatic artery enhances first at approximately 15 sand reaches peak attenuation at approximately30 s. After the contrast medium returns from thesplanchnic system, the portal vein starts to en-hance at around 30 s. Enhancement of liverparenchyma begins later, reaching a plateau at60–70 s. The plateau may last up to 20–30 s. Finally,there is the equilibrium phase (EQP) (3 min andlater), which occurs when the amount of contrastmaterial in the intra- and extravascular extracellu-lar space is essentially the same. Arterial hepaticenhancement is regulated mainly by cardiovascu-lar circulation time and iodine delivery ratewhereas parenchyma enhancement of the liver isrelated to total iodine dose administered. Accord-ing to the different enhancement curves of the he-patic artery, portal vein, and hepatic parenchyma,four phases can be distinguished:
1. Early arterial phase (EAP) appears 20–25 s af-ter administration of contrast material when thereis conspicuous enhancement in the hepatic arteries
compared with almost no enhancement of liverparenchyma or hypervascular lesions. This phasetypically provides the least information for imag-ing the liver, since the contrast media at that timehas accumulated neither in hypervascular liver le-sions nor in liver parenchyma. Nevertheless, thisphase is well suited for CT angiography when usedto evaluate the anatomical configuration of hepaticarteries prior to liver transplantation, hepatic tu-mor resection, or arterial chemoembolization.
To achieve optimum timing for EAP scanningfor hepatic CT angiography, an automated trigger-ing system may be used. This technique is superiorto a fixed-delay or a test bolus. The scanner is typ-ically set at the top of the liver with the triggerplaced in the descending thoracic aorta. Followinga 15-s delay after initiation of contrast material ad-ministration, a low-dose image is acquired every3 s.When the trigger, which monitors the descend-ing aorta, reaches a predefined attenuation (typi-cally 90–100 HU), the scan begins for the EAP.
2. Late arterial phase (LAP) appears at about30–35 s following initiation of contrast materialadministration. For optimum timing using the au-
Fig. 2. Different phases of enhance-ment in dynamic hepatobiliary MDCTimaging (EAP : early arterial phase,LAP: late arterial phase, PVP : portalvenous phase, EQP : equilibriumphase, PV : portal vein, HA : hepaticartery)
Table 2. Indication for dynamic hepatobiliary MDCT imaging
Noncontrast EAP LAP PVP EQPHypovascular liver metastases xHypervascular liver metastases x xHepatocellular carcinoma x x x xFocal nodular hyperplasia x xHepatocellular adenoma x x xEvaluation hepatic arterial system xCholangiocarcinoma x xPrimary sclerosing cholangitis x xCholecystitis xGallbladder carcinoma x x

54 MDCT: A Practical Approach
tomated triggering technique, to avoid the EAP, anadditional 8- to 10-s delay is required. The LAP isalso referred to as the portal vein inflow phasesince the portal vein is already starting to enhanceduring this phase. The hepatic arterial systems aswell as prominent neovasculature of hypervascu-lar hepatic neoplasms continue to enhance duringthe LAP while there is only minimal enhancementof hepatic parenchyma. At this point, there is amaximum attenuation difference between hyper-vascular liver lesions and the surrounding liverparenchyma (Fig. 3). Thus, LAP is the optimalphase for detecting hypervascular neoplasms ofthe liver. Foley et al. [26] was one of the first groupsto propose three different hepatic circulatoryphases using MDCT and showed that there was asignificantly better delineation of hypervascularliver lesions during the LAP compared with theEAP. A few years later, Laghi et al. [27] investigatedwhether the use of the two arterial phases in com-bination improves the detection of hypervascularHCC with MDCT. Their data showed no significantdifference between the late and the two combinedarterial phases for depiction of HCC, so they con-cluded that acquisition of the LAP together withthe PVP is considered sufficient for detection ofHCC with MDCT.
3. Portal venous phase (PVP), or hepatic venousphase, appears at about 60–70 s following initia-tion of a contrast media bolus, when the enhance-ment of liver parenchyma reaches its peak and theportal vein and hepatic veins are well enhanced.For accurate timing of the PVP in a single-phaseexam, we again recommend automated scanningtechnology instead of a fixed time delay. The trig-ger is placed in liver parenchyma to track the en-hancement curve, and when attenuation reaches a
predefined threshold (e.g., 50–70 HU), the table ismoved to the top of the liver and the diagnosticscan initiated. For a dual-phase exam, there is afixed time delay of 40 s following the end of theLAP.
Hypovascular tumors are optimally detectedduring the PVP when enhancement of liverparenchyma is maximal and there is the greatestliver-to-lesion attenuation difference (Fig. 4). Fordetection of these tumors, a single scan during thePVP is sufficient since there is no further advantageperforming unenhanced or arterial-phase imaging.The PVP is also the appropriate phase for visualiza-tion and evaluation of intrahepatic bile ducts, whenthere is the greatest difference of attenuation be-tween the maximally enhanced liver parenchymaand the hypoattenuating intraductal bile.
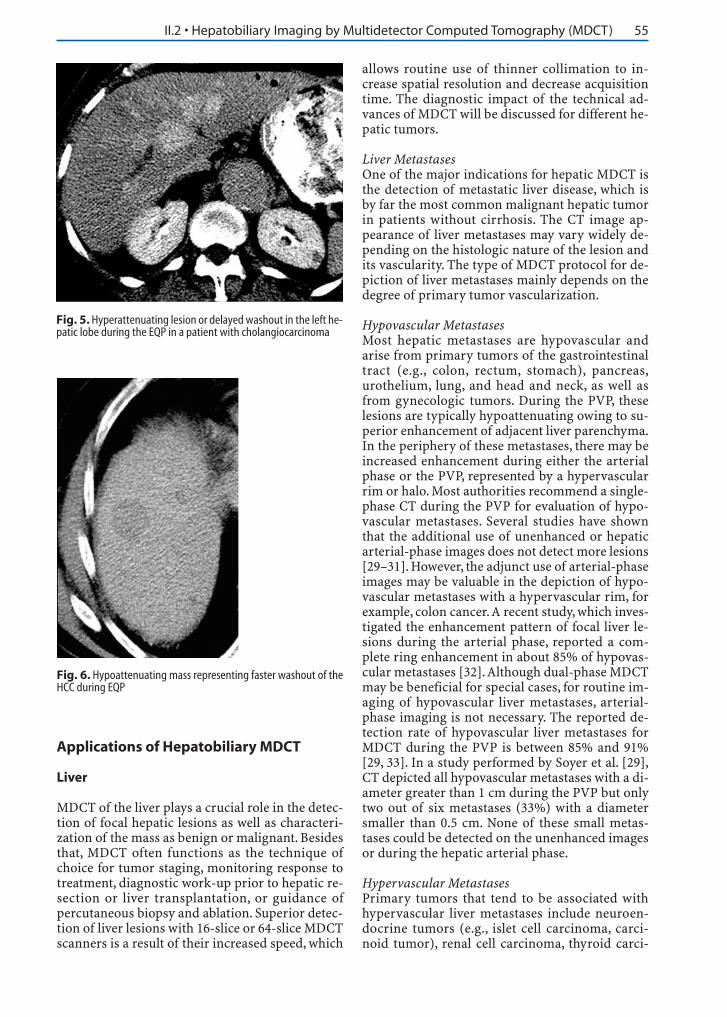
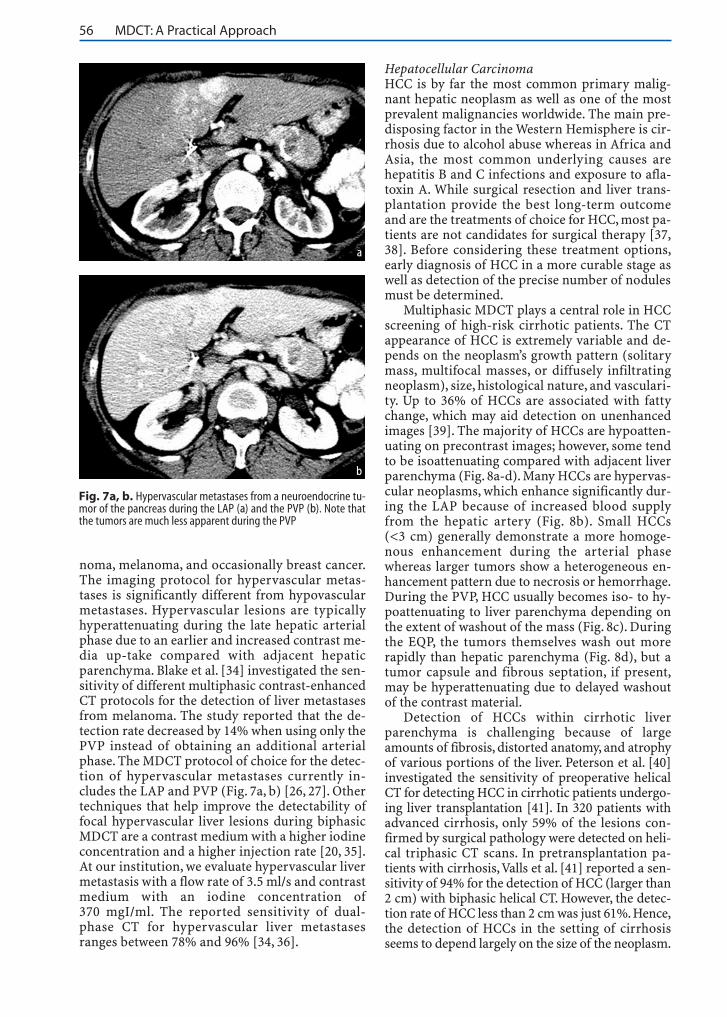
4. Equilibrium phase (EQP), or intersitial phase,appears at approximately 3 min postinjection,when there is an increased diffusion of contrastmedia into liver parenchyma and attenuation dif-ference between parenchyma and vessels is mini-mal. Washout of the contrast material in differentliver lesions may vary vastly depending on theirhistological nature. One clear indication for ac-quiring images during the EQP includes intrahep-atic cholangiocarcinoma. This tumor whendesmoplastic may accumulate the contrast agentand show a delayed washout compared with sur-rounding liver parenchyma. This delay causes hy-perattenuating lesions (Fig. 5). In a study byKeogan et al. [28], 36% of proven cholangiocarci-nomas on the EQP demonstrated as hyperattenu-ating lesions compared with the liver. By compari-son, HCC may show a faster washout during theEQP relative to the surrounding liver parenchyma,representing a hypoattenuating mass (Fig. 6).
Fig. 4. Hypoenhancing or hypovascular liver metastases in theright hepatic lobe from a colon cancer detected during portal ve-nous phase
Fig. 3. Hyperenhancing or hypervascular liver metastases from aneuroendocrine tumor of pancreas during the LAP
II.2 • Hepatobiliary Imaging by Multidetector Computed Tomography (MDCT) 55
Applications of Hepatobiliary MDCT
Liver
MDCT of the liver plays a crucial role in the detec-tion of focal hepatic lesions as well as characteri-zation of the mass as benign or malignant. Besidesthat, MDCT often functions as the technique ofchoice for tumor staging, monitoring response totreatment, diagnostic work-up prior to hepatic re-section or liver transplantation, or guidance ofpercutaneous biopsy and ablation. Superior detec-tion of liver lesions with 16-slice or 64-slice MDCTscanners is a result of their increased speed, which
allows routine use of thinner collimation to in-crease spatial resolution and decrease acquisitiontime. The diagnostic impact of the technical ad-vances of MDCT will be discussed for different he-patic tumors.
Liver MetastasesOne of the major indications for hepatic MDCT isthe detection of metastatic liver disease, which isby far the most common malignant hepatic tumorin patients without cirrhosis. The CT image ap-pearance of liver metastases may vary widely de-pending on the histologic nature of the lesion andits vascularity. The type of MDCT protocol for de-piction of liver metastases mainly depends on thedegree of primary tumor vascularization.
Hypovascular MetastasesMost hepatic metastases are hypovascular andarise from primary tumors of the gastrointestinaltract (e.g., colon, rectum, stomach), pancreas,urothelium, lung, and head and neck, as well asfrom gynecologic tumors. During the PVP, theselesions are typically hypoattenuating owing to su-perior enhancement of adjacent liver parenchyma.In the periphery of these metastases, there may beincreased enhancement during either the arterialphase or the PVP, represented by a hypervascularrim or halo. Most authorities recommend a single-phase CT during the PVP for evaluation of hypo-vascular metastases. Several studies have shownthat the additional use of unenhanced or hepaticarterial-phase images does not detect more lesions[29–31]. However, the adjunct use of arterial-phaseimages may be valuable in the depiction of hypo-vascular metastases with a hypervascular rim, forexample, colon cancer.A recent study, which inves-tigated the enhancement pattern of focal liver le-sions during the arterial phase, reported a com-plete ring enhancement in about 85% of hypovas-cular metastases [32].Although dual-phase MDCTmay be beneficial for special cases, for routine im-aging of hypovascular liver metastases, arterial-phase imaging is not necessary. The reported de-tection rate of hypovascular liver metastases forMDCT during the PVP is between 85% and 91%[29, 33]. In a study performed by Soyer et al. [29],CT depicted all hypovascular metastases with a di-ameter greater than 1 cm during the PVP but onlytwo out of six metastases (33%) with a diametersmaller than 0.5 cm. None of these small metas-tases could be detected on the unenhanced imagesor during the hepatic arterial phase.
Hypervascular MetastasesPrimary tumors that tend to be associated withhypervascular liver metastases include neuroen-docrine tumors (e.g., islet cell carcinoma, carci-noid tumor), renal cell carcinoma, thyroid carci-
Fig. 5. Hyperattenuating lesion or delayed washout in the left he-patic lobe during the EQP in a patient with cholangiocarcinoma
Fig. 6. Hypoattenuating mass representing faster washout of theHCC during EQP
56 MDCT: A Practical Approach
noma, melanoma, and occasionally breast cancer.The imaging protocol for hypervascular metas-tases is significantly different from hypovascularmetastases. Hypervascular lesions are typicallyhyperattenuating during the late hepatic arterialphase due to an earlier and increased contrast me-dia up-take compared with adjacent hepaticparenchyma. Blake et al. [34] investigated the sen-sitivity of different multiphasic contrast-enhancedCT protocols for the detection of liver metastasesfrom melanoma. The study reported that the de-tection rate decreased by 14% when using only thePVP instead of obtaining an additional arterialphase. The MDCT protocol of choice for the detec-tion of hypervascular metastases currently in-cludes the LAP and PVP (Fig. 7a, b) [26, 27]. Othertechniques that help improve the detectability offocal hypervascular liver lesions during biphasicMDCT are a contrast medium with a higher iodineconcentration and a higher injection rate [20, 35].At our institution, we evaluate hypervascular livermetastasis with a flow rate of 3.5 ml/s and contrastmedium with an iodine concentration of370 mgI/ml. The reported sensitivity of dual-phase CT for hypervascular liver metastasesranges between 78% and 96% [34, 36].
Hepatocellular CarcinomaHCC is by far the most common primary malig-nant hepatic neoplasm as well as one of the mostprevalent malignancies worldwide. The main pre-disposing factor in the Western Hemisphere is cir-rhosis due to alcohol abuse whereas in Africa andAsia, the most common underlying causes arehepatitis B and C infections and exposure to afla-toxin A. While surgical resection and liver trans-plantation provide the best long-term outcomeand are the treatments of choice for HCC, most pa-tients are not candidates for surgical therapy [37,38]. Before considering these treatment options,early diagnosis of HCC in a more curable stage aswell as detection of the precise number of nodulesmust be determined.
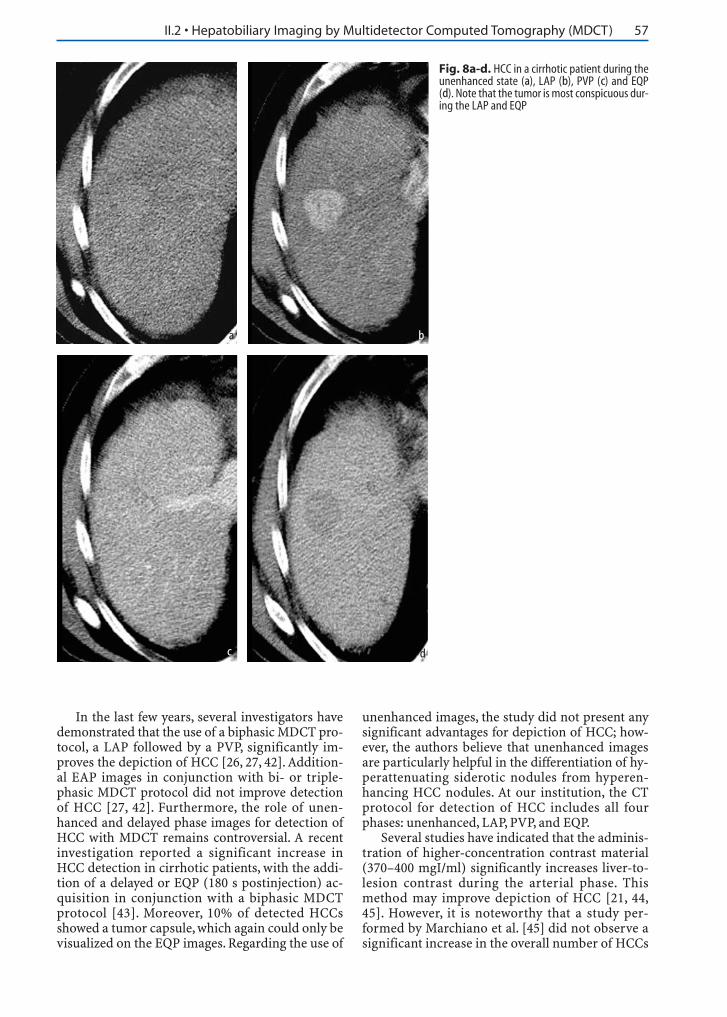
Multiphasic MDCT plays a central role in HCCscreening of high-risk cirrhotic patients. The CTappearance of HCC is extremely variable and de-pends on the neoplasm’s growth pattern (solitarymass, multifocal masses, or diffusely infiltratingneoplasm), size, histological nature, and vasculari-ty. Up to 36% of HCCs are associated with fattychange, which may aid detection on unenhancedimages [39]. The majority of HCCs are hypoatten-uating on precontrast images; however, some tendto be isoattenuating compared with adjacent liverparenchyma (Fig. 8a-d). Many HCCs are hypervas-cular neoplasms, which enhance significantly dur-ing the LAP because of increased blood supplyfrom the hepatic artery (Fig. 8b). Small HCCs(<3 cm) generally demonstrate a more homoge-nous enhancement during the arterial phasewhereas larger tumors show a heterogeneous en-hancement pattern due to necrosis or hemorrhage.During the PVP, HCC usually becomes iso- to hy-poattenuating to liver parenchyma depending onthe extent of washout of the mass (Fig. 8c). Duringthe EQP, the tumors themselves wash out morerapidly than hepatic parenchyma (Fig. 8d), but atumor capsule and fibrous septation, if present,may be hyperattenuating due to delayed washoutof the contrast material.
Detection of HCCs within cirrhotic liverparenchyma is challenging because of largeamounts of fibrosis, distorted anatomy, and atrophyof various portions of the liver. Peterson et al. [40]investigated the sensitivity of preoperative helicalCT for detecting HCC in cirrhotic patients undergo-ing liver transplantation [41]. In 320 patients withadvanced cirrhosis, only 59% of the lesions con-firmed by surgical pathology were detected on heli-cal triphasic CT scans. In pretransplantation pa-tients with cirrhosis,Valls et al. [41] reported a sen-sitivity of 94% for the detection of HCC (larger than2 cm) with biphasic helical CT. However, the detec-tion rate of HCC less than 2 cm was just 61%. Hence,the detection of HCCs in the setting of cirrhosisseems to depend largely on the size of the neoplasm.
Fig. 7a, b. Hypervascular metastases from a neuroendocrine tu-mor of the pancreas during the LAP (a) and the PVP (b). Note thatthe tumors are much less apparent during the PVP
a
b
II.2 • Hepatobiliary Imaging by Multidetector Computed Tomography (MDCT) 57
In the last few years, several investigators havedemonstrated that the use of a biphasic MDCT pro-tocol, a LAP followed by a PVP, significantly im-proves the depiction of HCC [26, 27, 42]. Addition-al EAP images in conjunction with bi- or triple-phasic MDCT protocol did not improve detectionof HCC [27, 42]. Furthermore, the role of unen-hanced and delayed phase images for detection ofHCC with MDCT remains controversial. A recentinvestigation reported a significant increase inHCC detection in cirrhotic patients, with the addi-tion of a delayed or EQP (180 s postinjection) ac-quisition in conjunction with a biphasic MDCTprotocol [43]. Moreover, 10% of detected HCCsshowed a tumor capsule, which again could only bevisualized on the EQP images. Regarding the use of
unenhanced images, the study did not present anysignificant advantages for depiction of HCC; how-ever, the authors believe that unenhanced imagesare particularly helpful in the differentiation of hy-perattenuating siderotic nodules from hyperen-hancing HCC nodules. At our institution, the CTprotocol for detection of HCC includes all fourphases: unenhanced, LAP, PVP, and EQP.
Several studies have indicated that the adminis-tration of higher-concentration contrast material(370–400 mgI/ml) significantly increases liver-to-lesion contrast during the arterial phase. Thismethod may improve depiction of HCC [21, 44,45]. However, it is noteworthy that a study per-formed by Marchiano et al. [45] did not observe asignificant increase in the overall number of HCCs
Fig. 8a-d. HCC in a cirrhotic patient during theunenhanced state (a), LAP (b), PVP (c) and EQP(d). Note that the tumor is most conspicuous dur-ing the LAP and EQP
a b
c d
58 MDCT: A Practical Approach
detected after the injection of a high concentrationof iodinated contrast material. There is also a cleartrend toward the use of faster injection rates(4–5 ml/s), which may improve conspicuity ofHCCs due to superior liver-to-lesion contrast inthe arterial phase [20, 46]. Oliver et al. [47] report-ed about a 74% detection rate for HCC with a flowrate of 4–5 ml/s during the hepatic arterial phasecompared with a 58% detection rate with a flowrate of 3 ml/s. While only 19% of the detected le-sions in this study showed an increase in enhance-ment with a flow rate of 3 ml/s, up to 83% of HCCsdemonstrated as hyperattenuating on arterial-phase images using the higher flow rate.
Focal Nodular HyperplasiaFocal nodular hyperplasia (FNH) is the secondmost common benign neoplasm of the liver afterhemangioma. FNH arises predominately inwomen. The tumors are usually solitary, in a sub-capsular location and are often discovered inci-dentally during radiological imaging. The patho-genesis of FNH is believed to be a congenital vas-cular malformation having an increased arterialblood flow. A recent study by Mathieu et al. [48]suggested that FNH is not associated with the useof oral contraceptives. The neoplasm often con-tains a stellate central scar surrounded by smallnodules of proliferating hepatocytes, bile ducts,and malformed vessels of different caliber [49, 50].Recently, a significantly higher prevalence of he-mangiomas in patients with FNH was reported byVilgrain et al. [51], perhaps because both neo-plasms are vascular malformations. The differen-tial diagnosis of FNH includes other hypervascularliver lesions, such as hepatocellular adenoma,HCC, and hypervascular metastases. Therefore,distinction between FNH and other hypervascular
liver tumors is crucial to ensure proper therapy.Multiphasic MDCT is an excellent imaging
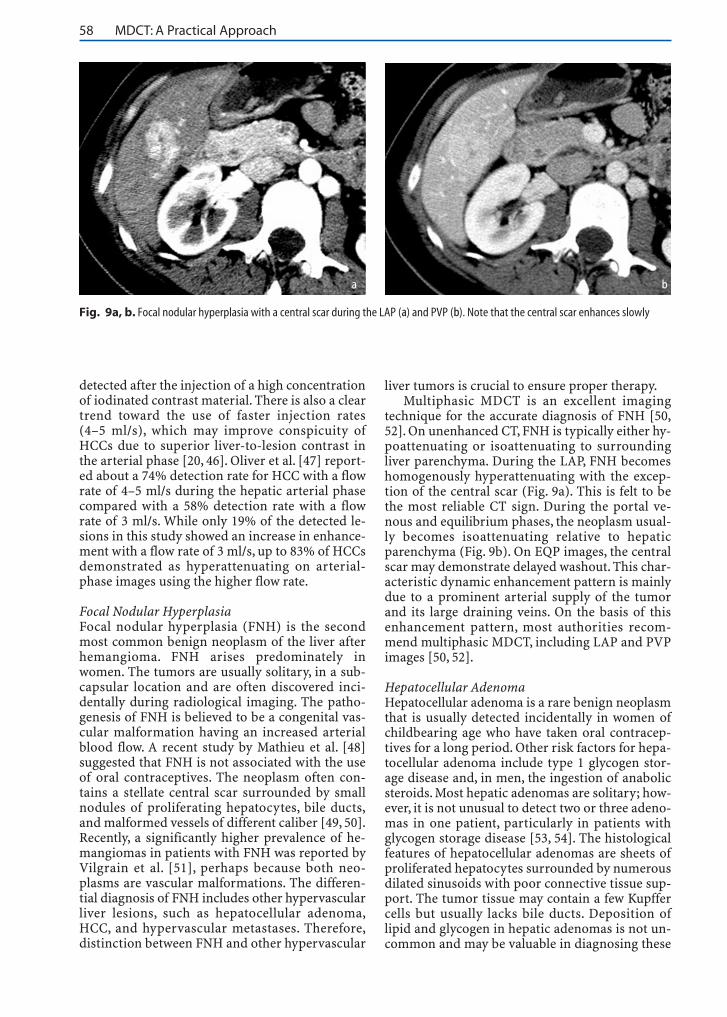
technique for the accurate diagnosis of FNH [50,52]. On unenhanced CT, FNH is typically either hy-poattenuating or isoattenuating to surroundingliver parenchyma. During the LAP, FNH becomeshomogenously hyperattenuating with the excep-tion of the central scar (Fig. 9a). This is felt to bethe most reliable CT sign. During the portal ve-nous and equilibrium phases, the neoplasm usual-ly becomes isoattenuating relative to hepaticparenchyma (Fig. 9b). On EQP images, the centralscar may demonstrate delayed washout. This char-acteristic dynamic enhancement pattern is mainlydue to a prominent arterial supply of the tumorand its large draining veins. On the basis of thisenhancement pattern, most authorities recom-mend multiphasic MDCT, including LAP and PVPimages [50, 52].
Hepatocellular AdenomaHepatocellular adenoma is a rare benign neoplasmthat is usually detected incidentally in women ofchildbearing age who have taken oral contracep-tives for a long period. Other risk factors for hepa-tocellular adenoma include type 1 glycogen stor-age disease and, in men, the ingestion of anabolicsteroids. Most hepatic adenomas are solitary; how-ever, it is not unusual to detect two or three adeno-mas in one patient, particularly in patients withglycogen storage disease [53, 54]. The histologicalfeatures of hepatocellular adenomas are sheets ofproliferated hepatocytes surrounded by numerousdilated sinusoids with poor connective tissue sup-port. The tumor tissue may contain a few Kupffercells but usually lacks bile ducts. Deposition oflipid and glycogen in hepatic adenomas is not un-common and may be valuable in diagnosing these
Fig. 9a, b. Focal nodular hyperplasia with a central scar during the LAP (a) and PVP (b). Note that the central scar enhances slowly
a b
II.2 • Hepatobiliary Imaging by Multidetector Computed Tomography (MDCT) 59
neoplasms. Hepatocellular adenomas have a ten-dency to spontaneously hemorrhage, which can befatal. Since these lesions may also undergo malig-nant transformation to an HCC, they are consid-ered surgical [53, 54].
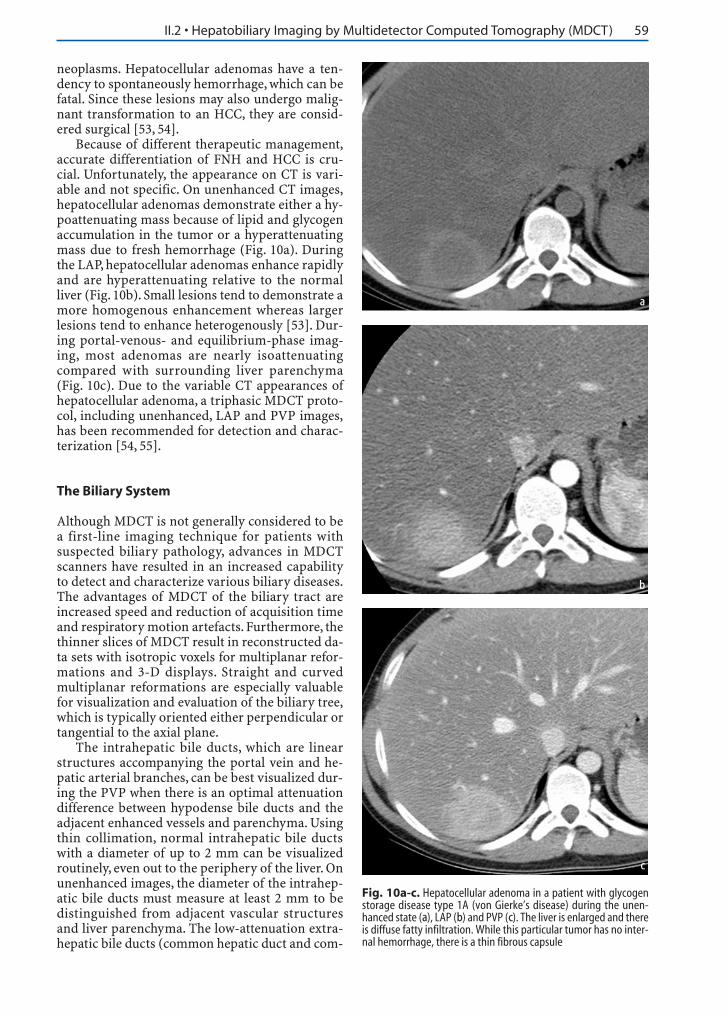
Because of different therapeutic management,accurate differentiation of FNH and HCC is cru-cial. Unfortunately, the appearance on CT is vari-able and not specific. On unenhanced CT images,hepatocellular adenomas demonstrate either a hy-poattenuating mass because of lipid and glycogenaccumulation in the tumor or a hyperattenuatingmass due to fresh hemorrhage (Fig. 10a). Duringthe LAP, hepatocellular adenomas enhance rapidlyand are hyperattenuating relative to the normalliver (Fig. 10b). Small lesions tend to demonstrate amore homogenous enhancement whereas largerlesions tend to enhance heterogenously [53]. Dur-ing portal-venous- and equilibrium-phase imag-ing, most adenomas are nearly isoattenuatingcompared with surrounding liver parenchyma(Fig. 10c). Due to the variable CT appearances ofhepatocellular adenoma, a triphasic MDCT proto-col, including unenhanced, LAP and PVP images,has been recommended for detection and charac-terization [54, 55].
The Biliary System
Although MDCT is not generally considered to bea first-line imaging technique for patients withsuspected biliary pathology, advances in MDCTscanners have resulted in an increased capabilityto detect and characterize various biliary diseases.The advantages of MDCT of the biliary tract areincreased speed and reduction of acquisition timeand respiratory motion artefacts. Furthermore, thethinner slices of MDCT result in reconstructed da-ta sets with isotropic voxels for multiplanar refor-mations and 3-D displays. Straight and curvedmultiplanar reformations are especially valuablefor visualization and evaluation of the biliary tree,which is typically oriented either perpendicular ortangential to the axial plane.
The intrahepatic bile ducts, which are linearstructures accompanying the portal vein and he-patic arterial branches, can be best visualized dur-ing the PVP when there is an optimal attenuationdifference between hypodense bile ducts and theadjacent enhanced vessels and parenchyma. Usingthin collimation, normal intrahepatic bile ductswith a diameter of up to 2 mm can be visualizedroutinely, even out to the periphery of the liver. Onunenhanced images, the diameter of the intrahep-atic bile ducts must measure at least 2 mm to bedistinguished from adjacent vascular structuresand liver parenchyma. The low-attenuation extra-hepatic bile ducts (common hepatic duct and com-
Fig. 10a-c. Hepatocellular adenoma in a patient with glycogenstorage disease type 1A (von Gierke’s disease) during the unen-hanced state (a), LAP (b) and PVP (c). The liver is enlarged and thereis diffuse fatty infiltration. While this particular tumor has no inter-nal hemorrhage, there is a thin fibrous capsule
a
b
c
60 MDCT: A Practical Approach
mon bile duct), which measure between 3 mm and6 mm, are routinely visualized on thin-sectionMDCT images. Their thin walls (1 mm) usually en-hance after administration of contrast media,which helps to differentiate them from the adja-cent vessels. The normal gallbladder wall, which is1- to 3-mm thick, also enhances postcontrast. Theenhancement and thickness of the gallbladder wallmay vary depending on luminal distension and onpathologic conditions (e.g., inflammation, tumor).There are several pathological situations in whichdensity of bile in the gallbladder increases signifi-cantly. Examples include deposition of sludge andmilk of calcium. The role of MDCT in the evalua-tion of different biliary pathologies and their char-acteristic imaging findings will be discussed be-low.
CholangiocarcinomaCholangiocarcinoma is the most common primarymalignancy of the intra- and extrahepatic biliarytract. Patients usually present with painless jaun-dice due to biliary obstruction. The majority ofcholangiocarcinomas, adenocarcinomas, are foundin the extrahepatic ducts. A tumor originating atthe confluence of the left and right hepatic duct isreferred to as a Klatskin tumor. Predisposing fac-tors for cholangiocarcinoma include ulcerative co-litis, sclerosing cholangitis, and congenital biliaryanomalies (choledochal cyst and Caroli’s disease).MDCT imaging of cholangiocarcinoma is usuallyemployed to evaluate the extent of the neoplasmand its resectability since radical surgical tumorremoval with negative histologic margins is theonly curative option.
The CT appearance of cholangiocarcinomavaries depending on the site of origin – peripheral
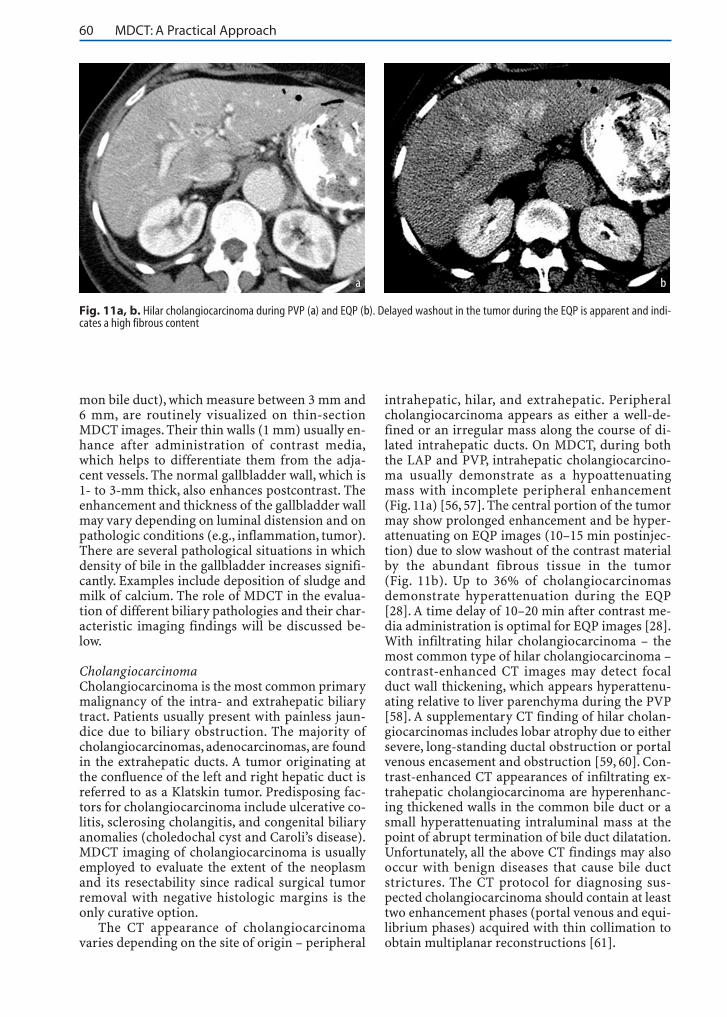
intrahepatic, hilar, and extrahepatic. Peripheralcholangiocarcinoma appears as either a well-de-fined or an irregular mass along the course of di-lated intrahepatic ducts. On MDCT, during boththe LAP and PVP, intrahepatic cholangiocarcino-ma usually demonstrate as a hypoattenuatingmass with incomplete peripheral enhancement(Fig. 11a) [56, 57]. The central portion of the tumormay show prolonged enhancement and be hyper-attenuating on EQP images (10–15 min postinjec-tion) due to slow washout of the contrast materialby the abundant fibrous tissue in the tumor(Fig. 11b). Up to 36% of cholangiocarcinomasdemonstrate hyperattenuation during the EQP[28]. A time delay of 10–20 min after contrast me-dia administration is optimal for EQP images [28].With infiltrating hilar cholangiocarcinoma – themost common type of hilar cholangiocarcinoma –contrast-enhanced CT images may detect focalduct wall thickening, which appears hyperattenu-ating relative to liver parenchyma during the PVP[58]. A supplementary CT finding of hilar cholan-giocarcinomas includes lobar atrophy due to eithersevere, long-standing ductal obstruction or portalvenous encasement and obstruction [59, 60]. Con-trast-enhanced CT appearances of infiltrating ex-trahepatic cholangiocarcinoma are hyperenhanc-ing thickened walls in the common bile duct or asmall hyperattenuating intraluminal mass at thepoint of abrupt termination of bile duct dilatation.Unfortunately, all the above CT findings may alsooccur with benign diseases that cause bile ductstrictures. The CT protocol for diagnosing sus-pected cholangiocarcinoma should contain at leasttwo enhancement phases (portal venous and equi-librium phases) acquired with thin collimation toobtain multiplanar reconstructions [61].
Fig. 11a, b. Hilar cholangiocarcinoma during PVP (a) and EQP (b). Delayed washout in the tumor during the EQP is apparent and indi-cates a high fibrous content
a b
II.2 • Hepatobiliary Imaging by Multidetector Computed Tomography (MDCT) 61
Primary Sclerosing CholangitisPrimary sclerosing cholangitis (PSC) is a rarechronic inflammatory condition of the intra- andextrahepatic bile ducts. It is associated with ulcer-ative colitis, Sjögren’s syndrome, Riedel’s thyroidi-tis, retroperitoneal fibrosis, and, occasionally,Crohn’s disease. The etiology of PSC is unknownalthough it is probably autoimmune. PSC occurspredominantly in men during the third to fifthdecade of life. The typical presentation is intermit-tent jaundice and recurrent episodes of cholangi-tis.
CT findings in PSC usually reflect pathologicalchanges, such as ductal and periductal fibrosis,that result in segmental stricturing and dilatationof the bile ducts. In the majority of cases, both theintra- and extrahepatic bile ducts are involved.Long-standing biliary obstruction may lead to cir-rhosis. Morphological changes of PSC-induced cir-rhosis include fibrosis, regenerative nodules,parenchymal atrophy, and marked hypertrophy ofthe caudate lobe.
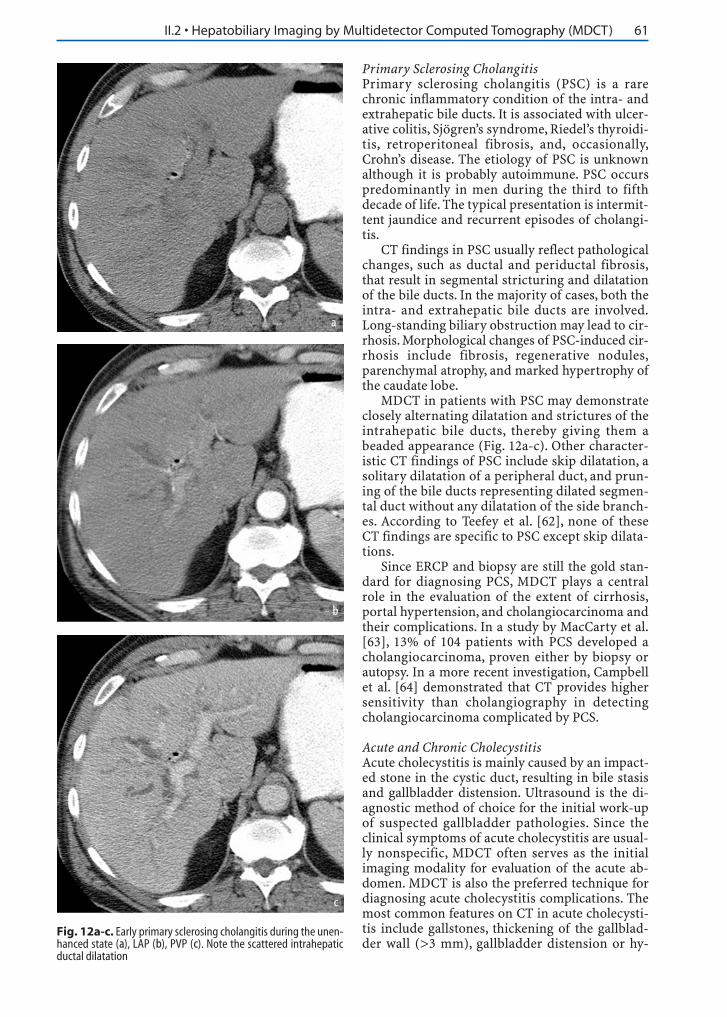
MDCT in patients with PSC may demonstrateclosely alternating dilatation and strictures of theintrahepatic bile ducts, thereby giving them abeaded appearance (Fig. 12a-c). Other character-istic CT findings of PSC include skip dilatation, asolitary dilatation of a peripheral duct, and prun-ing of the bile ducts representing dilated segmen-tal duct without any dilatation of the side branch-es. According to Teefey et al. [62], none of theseCT findings are specific to PSC except skip dilata-tions.
Since ERCP and biopsy are still the gold stan-dard for diagnosing PCS, MDCT plays a centralrole in the evaluation of the extent of cirrhosis,portal hypertension, and cholangiocarcinoma andtheir complications. In a study by MacCarty et al.[63], 13% of 104 patients with PCS developed acholangiocarcinoma, proven either by biopsy orautopsy. In a more recent investigation, Campbellet al. [64] demonstrated that CT provides highersensitivity than cholangiography in detectingcholangiocarcinoma complicated by PCS.
Acute and Chronic CholecystitisAcute cholecystitis is mainly caused by an impact-ed stone in the cystic duct, resulting in bile stasisand gallbladder distension. Ultrasound is the di-agnostic method of choice for the initial work-upof suspected gallbladder pathologies. Since theclinical symptoms of acute cholecystitis are usual-ly nonspecific, MDCT often serves as the initialimaging modality for evaluation of the acute ab-domen. MDCT is also the preferred technique fordiagnosing acute cholecystitis complications. Themost common features on CT in acute cholecysti-tis include gallstones, thickening of the gallblad-der wall (>3 mm), gallbladder distension or hy-
Fig. 12a-c. Early primary sclerosing cholangitis during the unen-hanced state (a), LAP (b), PVP (c). Note the scattered intrahepaticductal dilatation
a
b
c
62 MDCT: A Practical Approach
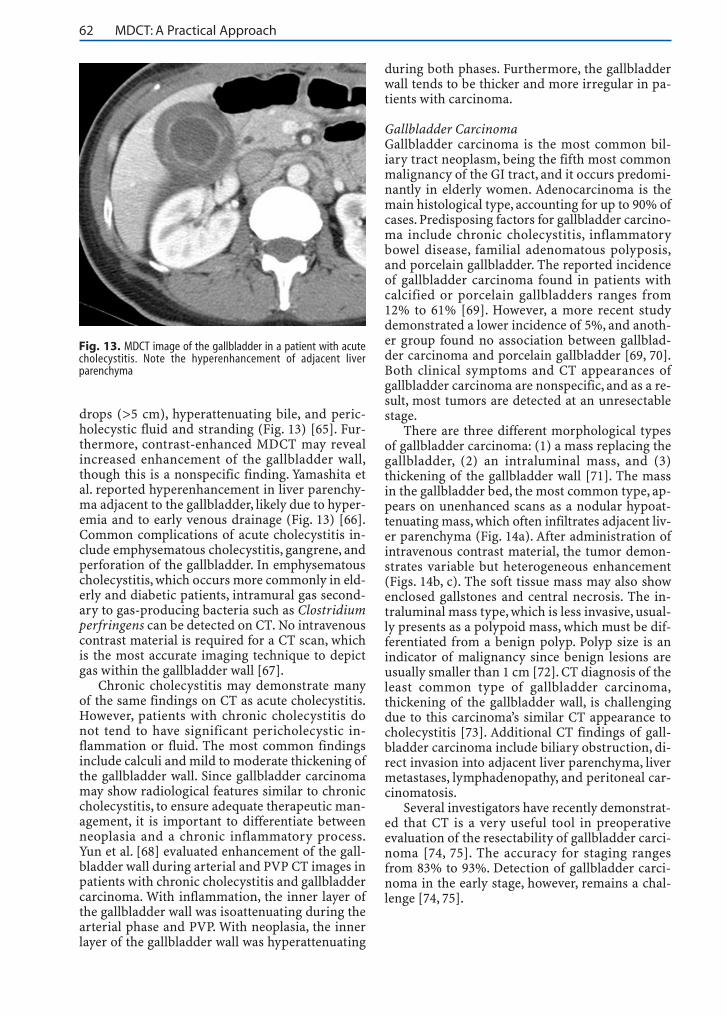
drops (>5 cm), hyperattenuating bile, and peric-holecystic fluid and stranding (Fig. 13) [65]. Fur-thermore, contrast-enhanced MDCT may revealincreased enhancement of the gallbladder wall,though this is a nonspecific finding. Yamashita etal. reported hyperenhancement in liver parenchy-ma adjacent to the gallbladder, likely due to hyper-emia and to early venous drainage (Fig. 13) [66].Common complications of acute cholecystitis in-clude emphysematous cholecystitis, gangrene, andperforation of the gallbladder. In emphysematouscholecystitis, which occurs more commonly in eld-erly and diabetic patients, intramural gas second-ary to gas-producing bacteria such as Clostridiumperfringens can be detected on CT. No intravenouscontrast material is required for a CT scan, whichis the most accurate imaging technique to depictgas within the gallbladder wall [67].
Chronic cholecystitis may demonstrate manyof the same findings on CT as acute cholecystitis.However, patients with chronic cholecystitis donot tend to have significant pericholecystic in-flammation or fluid. The most common findingsinclude calculi and mild to moderate thickening ofthe gallbladder wall. Since gallbladder carcinomamay show radiological features similar to chroniccholecystitis, to ensure adequate therapeutic man-agement, it is important to differentiate betweenneoplasia and a chronic inflammatory process.Yun et al. [68] evaluated enhancement of the gall-bladder wall during arterial and PVP CT images inpatients with chronic cholecystitis and gallbladdercarcinoma. With inflammation, the inner layer ofthe gallbladder wall was isoattenuating during thearterial phase and PVP. With neoplasia, the innerlayer of the gallbladder wall was hyperattenuating
during both phases. Furthermore, the gallbladderwall tends to be thicker and more irregular in pa-tients with carcinoma.
Gallbladder CarcinomaGallbladder carcinoma is the most common bil-iary tract neoplasm, being the fifth most commonmalignancy of the GI tract, and it occurs predomi-nantly in elderly women. Adenocarcinoma is themain histological type, accounting for up to 90% ofcases. Predisposing factors for gallbladder carcino-ma include chronic cholecystitis, inflammatorybowel disease, familial adenomatous polyposis,and porcelain gallbladder. The reported incidenceof gallbladder carcinoma found in patients withcalcified or porcelain gallbladders ranges from12% to 61% [69]. However, a more recent studydemonstrated a lower incidence of 5%, and anoth-er group found no association between gallblad-der carcinoma and porcelain gallbladder [69, 70].Both clinical symptoms and CT appearances ofgallbladder carcinoma are nonspecific, and as a re-sult, most tumors are detected at an unresectablestage.
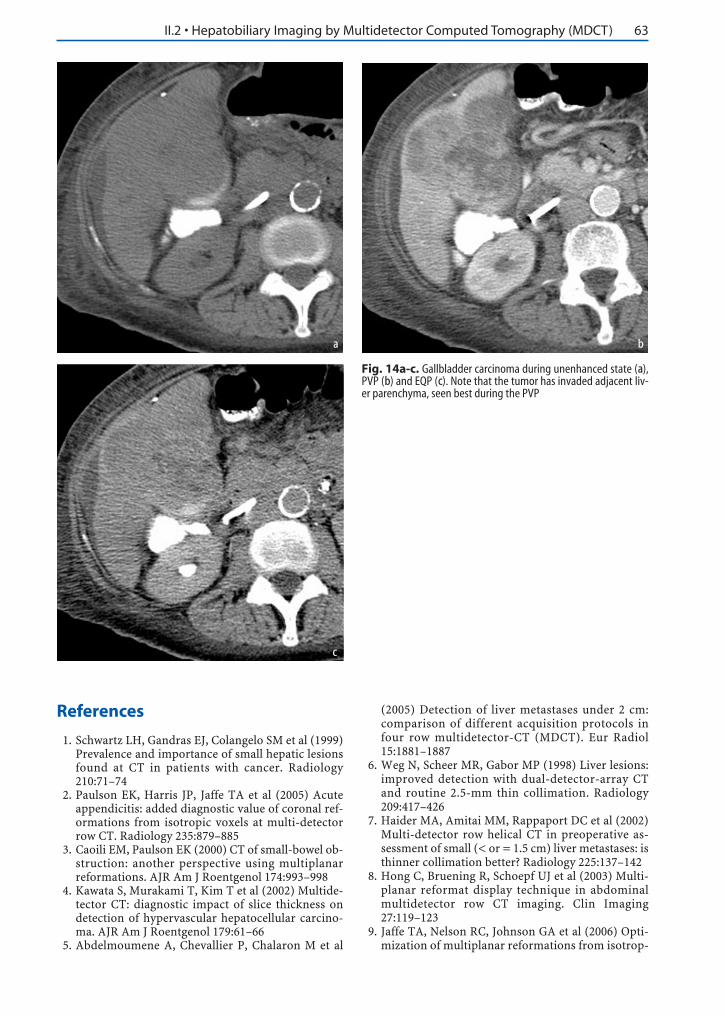
There are three different morphological typesof gallbladder carcinoma: (1) a mass replacing thegallbladder, (2) an intraluminal mass, and (3)thickening of the gallbladder wall [71]. The massin the gallbladder bed, the most common type, ap-pears on unenhanced scans as a nodular hypoat-tenuating mass, which often infiltrates adjacent liv-er parenchyma (Fig. 14a). After administration ofintravenous contrast material, the tumor demon-strates variable but heterogeneous enhancement(Figs. 14b, c). The soft tissue mass may also showenclosed gallstones and central necrosis. The in-traluminal mass type, which is less invasive, usual-ly presents as a polypoid mass, which must be dif-ferentiated from a benign polyp. Polyp size is anindicator of malignancy since benign lesions areusually smaller than 1 cm [72]. CT diagnosis of theleast common type of gallbladder carcinoma,thickening of the gallbladder wall, is challengingdue to this carcinoma’s similar CT appearance tocholecystitis [73]. Additional CT findings of gall-bladder carcinoma include biliary obstruction, di-rect invasion into adjacent liver parenchyma, livermetastases, lymphadenopathy, and peritoneal car-cinomatosis.
Several investigators have recently demonstrat-ed that CT is a very useful tool in preoperativeevaluation of the resectability of gallbladder carci-noma [74, 75]. The accuracy for staging rangesfrom 83% to 93%. Detection of gallbladder carci-noma in the early stage, however, remains a chal-lenge [74, 75].
Fig. 13. MDCT image of the gallbladder in a patient with acutecholecystitis. Note the hyperenhancement of adjacent liverparenchyma
II.2 • Hepatobiliary Imaging by Multidetector Computed Tomography (MDCT) 63
References
1. Schwartz LH, Gandras EJ, Colangelo SM et al (1999)Prevalence and importance of small hepatic lesionsfound at CT in patients with cancer. Radiology210:71–74
2. Paulson EK, Harris JP, Jaffe TA et al (2005) Acuteappendicitis: added diagnostic value of coronal ref-ormations from isotropic voxels at multi-detectorrow CT. Radiology 235:879–885
3. Caoili EM, Paulson EK (2000) CT of small-bowel ob-struction: another perspective using multiplanarreformations. AJR Am J Roentgenol 174:993–998
4. Kawata S, Murakami T, Kim T et al (2002) Multide-tector CT: diagnostic impact of slice thickness ondetection of hypervascular hepatocellular carcino-ma. AJR Am J Roentgenol 179:61–66
5. Abdelmoumene A, Chevallier P, Chalaron M et al
(2005) Detection of liver metastases under 2 cm:comparison of different acquisition protocols infour row multidetector-CT (MDCT). Eur Radiol15:1881–1887
6. Weg N, Scheer MR, Gabor MP (1998) Liver lesions:improved detection with dual-detector-array CTand routine 2.5-mm thin collimation. Radiology209:417–426
7. Haider MA, Amitai MM, Rappaport DC et al (2002)Multi-detector row helical CT in preoperative as-sessment of small (< or = 1.5 cm) liver metastases: isthinner collimation better? Radiology 225:137–142
8. Hong C, Bruening R, Schoepf UJ et al (2003) Multi-planar reformat display technique in abdominalmultidetector row CT imaging. Clin Imaging27:119–123
9. Jaffe TA, Nelson RC, Johnson GA et al (2006) Opti-mization of multiplanar reformations from isotrop-
Fig. 14a-c. Gallbladder carcinoma during unenhanced state (a),PVP (b) and EQP (c). Note that the tumor has invaded adjacent liv-er parenchyma, seen best during the PVP
a b
c
64 MDCT: A Practical Approach
ic datasets acquired on a 16-element multidetectorhelical CT scanner. Radiology (in press)
10. Stabile Ianora AA, Memeo M, Scardapane A et al(2003) Oral contrast-enhanced three-dimensionalhelical-CT cholangiography: clinical applications.Eur Radiol 13:867–873
11. Wang ZJ, Yeh BM, Roberts JP et al (2005) Livingdonor candidates for right hepatic lobe transplanta-tion: evaluation at CT cholangiography – initial ex-perience. Radiology 235:899–904
12. Caoili EM, Paulson EK, Heyneman LE et al (2000)Helical CT cholangiography with three-dimensionalvolume rendering using an oral biliary contrastagent: feasibility of a novel technique. AJR Am JRoentgenol 174:487–492
13. Zandrino F, Benzi L, Ferretti ML et al (2002) Multi-slice CT cholangiography without biliary contrastagent: technique and initial clinical results in the as-sessment of patients with biliary obstruction. EurRadiol 12:1155–1161
14. Kim HC, Park SJ, Park SI et al (2005) Multislice CTcholangiography using thin-slab minimum intensi-ty projection and multiplanar reformation in theevaluation of patients with suspected biliary ob-struction: preliminary experience. Clin Imaging29:46–54
15. Rao ND, Gulati MS, Paul SB et al (2005) Three-di-mensional helical computed tomography cholan-giography with minimum intensity projection ingallbladder carcinoma patients with obstructivejaundice: comparison with magnetic resonancecholangiography and percutaneous transhepaticcholangiography. J Gastroenterol Hepatol 20:304–308
16. Brink JA, Heiken JP, Forman HP et al (1995) Hepat-ic spiral CT: reduction of dose of intravenous con-trast material. Radiology 197:83–88
17. Heiken JP, Brink JA, McClennan BL et al (1995) Dy-namic incremental CT: effect of volume and con-centration of contrast material and patient weighton hepatic enhancement. Radiology 195:353–357
18. Yamashita Y, Komohara Y, Takahashi M et al (2000)Abdominal helical CT: evaluation of optimal dosesof intravenous contrast material – a prospectiverandomized study. Radiology 216:718–723
19. Ho LM, Nelson RC, Thomas J et al (2004) Abdomi-nal aortic aneurysms at multi-detector row helicalCT: optimization with interactive determination ofscanning delay and contrast medium dose. Radiolo-gy 232:854–859
20. Itoh S, Ikeda M, Achiwa M et al (2005) Multiphasecontrast-enhanced CT of the liver with a multisliceCT scanner: effects of iodine concentration and de-livery rate. Radiat Med 23:61–69
21. Awai K, Takada K, Onishi H, Hori S (2002) Aorticand hepatic enhancement and tumor-to-liver con-trast: analysis of the effect of different concentra-tions of contrast material at multi-detector row hel-ical CT. Radiology 224:757–763
22. Schoellnast H, Tillich M, Deutschmann HA et al(2004) Improvement of parenchymal and vascularenhancement using saline flush and power injectionfor multiple-detector-row abdominal CT. Eur Radi-ol 14:659–664
23. Schoellnast H, Tillich M, Deutschmann HA et al(2003) Abdominal multidetector row computed to-
mography: reduction of cost and contrast materialdose using saline flush. J Comput Assist Tomogr27:847–853
24. Chopra S, Chintapalli KN, Ramakrishna K et al(2000) Helical CT cholangiography with oral chole-cystographic contrast material. Radiology 214:596–601
25. Ott DJ, Gelfand DW (1981) Complications of gas-trointestinal radiologic procedures: II. Complica-tions related to biliary tract studies. Gastrointest Ra-diol 6:47–56
26. Foley WD, Mallisee TA, Hohenwalter MD et al(2000) Multiphase hepatic CT with a multirow de-tector CT scanner. AJR Am J Roentgenol 175:679–685
27. Laghi A, Iannaccone R, Rossi P et al (2003) Hepato-cellular carcinoma: detection with triple-phase mul-ti-detector row helical CT in patients with chronichepatitis. Radiology 226:543–549
28. Keogan MT, Seabourn JT, Paulson EK et al (1997)Contrast-enhanced CT of intrahepatic and hilarcholangiocarcinoma: delay time for optimal imag-ing. AJR Am J Roentgenol 169:1493–1499
29. Soyer P, Poccard M, Boudiaf M et al (2004) Detec-tion of hypovascular hepatic metastases at triple-phase helical CT: sensitivity of phases and compari-son with surgical and histopathologic findings. Ra-diology 231:413–420
30. Miller FH, Butler RS, Hoff FL et al (1998) Usingtriphasic helical CT to detect focal hepatic lesions inpatients with neoplasms. AJR Am J Roentgenol171:643–649
31. Ch’en IY, Katz DS, Jeffrey RB Jr et al (1997) Do arte-rial phase helical CT images improve detection orcharacterization of colorectal liver metastases? JComput Assist Tomogr 21:391–397
32. Nino-Murcia M, Olcott EW, Jeffrey RB Jr et al (2000)Focal liver lesions: pattern-based classificationscheme for enhancement at arterial phase CT. Radi-ology 215:746–751
33. Valls C, Andia E, Sanchez A et al (2001) Hepaticmetastases from colorectal cancer: preoperative de-tection and assessment of resectability with helicalCT. Radiology 218:55–60
34. Blake SP, Weisinger K, Atkins MB, Raptopoulos V(1999) Liver metastases from melanoma: detectionwith multiphasic contrast-enhanced CT. Radiology213:92–96
35. Furuta A, Ito K, Fujita T et al (2004) Hepatic en-hancement in multiphasic contrast-enhanced MD-CT: comparison of high- and low-iodine-concentra-tion contrast medium in same patients with chronicliver disease. AJR Am J Roentgenol 183:157–162
36. Oliver JH 3rd, Baron RL, Federle MP et al (1997) Hy-pervascular liver metastases: do unenhanced andhepatic arterial phase CT images affect tumor detec-tion? Radiology 205:709–715
37. Figueras J, Jaurrieta E, Valls C et al (2000) Resectionor transplantation for hepatocellular carcinoma incirrhotic patients: outcomes based on indicatedtreatment strategy. J Am Coll Surg 190:580–587
38. Island ER, Pomposelli J, Pomfret EA (2005) Twenty-year experience with liver transplantation for hepa-tocellular carcinoma. Arch Surg 140:353–358
39. Kutami R, Nakashima Y, Nakashima O (2000) Path-omorphologic study on the mechanism of fatty
II.2 • Hepatobiliary Imaging by Multidetector Computed Tomography (MDCT) 65
change in small hepatocellular carcinoma of hu-mans. J Hepatol 33:282–289
40. Peterson MS, Baron RL, Marsh JW Jr (2000) Pre-transplantation surveillance for possible hepatocel-lular carcinoma in patients with cirrhosis: epidemi-ology and CT-based tumor detection rate in 430 cas-es with surgical pathologic correlation. Radiology217:743–749
41. Valls C, Cos M, Figueras J et al (2004) Pretransplan-tation diagnosis and staging of hepatocellular carci-noma in patients with cirrhosis: value of dual-phasehelical CT. AJR Am J Roentgenol 182:1011–1017
42. Kim SK, Lim JH, Lee WJ et al (2002) Detection ofhepatocellular carcinoma: comparison of dynamicthree-phase computed tomography images andfour-phase computed tomography images usingmultidetector row helical computed tomography. JComput Assist Tomogr 26:691–698
43. Iannaccone R, Laghi A, Catalano C et al (2005) He-patocellular carcinoma: role of unenhanced and de-layed phase multi-detector row helical CT in pa-tients with cirrhosis. Radiology 234:460–467
44. Sultana S, Morishita S, Awai K et al (2003) Evalua-tion of hypervascular hepatocellular carcinoma incirrhotic liver by means of helical CT: comparisonof different contrast medium concentrations withinthe same patient. Radiat Med 21:239–245
45. Marchiano A, Spreafico C, Lanocita R et al (2005)Does iodine concentration affect the diagnostic effi-cacy of biphasic spiral CT in patients with hepato-cellular carcinoma? Abdom Imaging 30:274–280
46. Kim T, Murakami T, Takahashi S et al (1998) Effectsof injection rates of contrast material on arterialphase hepatic CT. AJR Am J Roentgenol 171:429–432
47. Oliver JH, Baron RL (1999) High flow injection ratesversus low flow injection rates: does increasing theinjection rate result in greater detection of enhance-ment of hepatocellular carcinoma during hepatic ar-terial phase CT? 213:92–96
48. Mathieu D, Kobeiter H, Maison P et al (2000) Oralcontraceptive use and focal nodular hyperplasia ofthe liver. Gastroenterology 118:560–564
49. Hussain SM, Terkivatan T, Zondervan PE et al(2004) Focal nodular hyperplasia: findings at state-of-the-art MR imaging, US, CT, and pathologicanalysis. Radiographics 24:3–19
50. Brancatelli G, Federle MP, Grazioli L (2001) Focalnodular hyperplasia: CT findings with emphasis onmultiphasic helical CT in 78 patients. Radiology219:61–68
51. Vilgrain V, Uzan F, Brancatelli G (2003) Prevalenceof hepatic hemangioma in patients with focal nodu-lar hyperplasia: MR imaging analysis. Radiology229:75–79
52. Carlson SK, Johnson CD, Bender CE, Welch TJ(2000) CT of focal nodular hyperplasia of the liver.AJR Am J Roentgenol 174:705–712
53. Grazioli L, Federle MP, Brancatelli G et al (2001) He-patic adenomas: imaging and pathologic findings.Radiographics 21:877–892
54. Ichikawa T, Federle MP, Grazioli L, Nalesnik M(2000) Hepatocellular adenoma: multiphasic CTand histopathologic findings in 25 patients. Radiol-ogy 214:861–868
55. Ruppert-Kohlmayr AJ, Uggowitzer MM, Kugler C et
al (2001) Focal nodular hyperplasia and hepatocel-lular adenoma of the liver: differentiation with mul-tiphasic helical CT. AJR Am J Roentgenol 176:1493–1498
56. Kim TK, Choi BI, Han JK et al (1997) Peripheralcholangiocarcinoma of the liver: two-phase spiralCT findings. Radiology 204:539–543
57. Valls C, Guma A, Puig I et al (2000) Intrahepatic pe-ripheral cholangiocarcinoma: CT evaluation. Ab-dom Imaging 25:490–496
58. Han JK, Choi BI, Kim AY et al (2002) Cholangiocar-cinoma: pictorial essay of CT and cholangiographicfindings. Radiographics 22:173–187
59. Vazquez JL, Thorsen MK, Dodds WJ et al (1985) At-rophy of the left hepatic lobe caused by a cholangio-carcinoma. AJR Am J Roentgenol 144:547–548
60. Jarnagin WR, Fong Y, DeMatteo RP et al (2001)Staging, resectability, and outcome in 225 patientswith hilar cholangiocarcinoma. Ann Surg234:507–517
61. Zech CJ, Schoenberg SO, Reiser M, Helmberger T(2004) Cross-sectional imaging of biliary tumors:current clinical status and future developments. EurRadiol 14:1174–1187
62. Teefey SA, Baron RL, Schulte SJ et al (1992) Patternsof intrahepatic bile duct dilatation at CT: correla-tion with obstructive disease processes. Radiology182:139–142
63. MacCarty RL, LaRusso NF, May GR et al (1985)Cholangiocarcinoma complicating primary scleros-ing cholangitis: cholangiographic appearances. Ra-diology 156:43–46
64. Campbell WL, Peterson MS, Federle MP et al (2001)Using CT and cholangiography to diagnose biliarytract carcinoma complicating primary sclerosingcholangitis. AJR Am J Roentgenol 177:1095–1100
65. Grand D, Horton KM, Fishman EK (2004) CT of thegallbladder: spectrum of disease. AJR Am JRoentgenol 183:163–170
66. Yamashita K, Jin MJ, Hirose Y et al (1995) CT find-ing of transient focal increased attenuation of theliver adjacent to the gallbladder in acute cholecysti-tis. AJR Am J Roentgenol 164:343–346
67. Grayson DE, Abbott RM, Levy AD, Sherman PM(2002) Emphysematous infections of the abdomenand pelvis: a pictorial review. Radiographics22:543–561
68. Yun EJ, Cho SG, Park S et al (2004) Gallbladder car-cinoma and chronic cholecystitis: differentiationwith two-phase spiral CT. Abdom Imaging29:102–108
69. Stephen AE, Berger DL (2001) Carcinoma in theporcelain gallbladder: a relationship revisited.Surgery 129:699–703
70. Towfigh S, McFadden DW, Cortina GR et al (2001)Porcelain gallbladder is not associated with gall-bladder carcinoma. Am Surg 67:7–10
71. Itai Y, Araki T, Yoshikawa K et al (1980) Computedtomography of gallbladder carcinoma. Radiology137:713–718
72. Koga A, Watanabe K, Fukuyama T et al (1988) Diag-nosis and operative indications for polypoid lesionsof the gallbladder. Arch Surg 123:26–29
73. Kim BS, Ha HK, Lee IJ et al (2002) Accuracy of CT inlocal staging of gallbladder carcinoma. Acta Radiol43:71–76
66 MDCT: A Practical Approach
74. Kumaran V, Gulati S, Paul B et al (2002) The role ofdual-phase helical CT in assessing resectability ofcarcinoma of the gallbladder. Eur Radiol 12:1993–1999
75. Yoshimitsu K, Honda H, Shinozaki K et al (2002)
Helical CT of the local spread of carcinoma of thegallbladder: evaluation according to the TNM sys-tem in patients who underwent surgical resection.AJR Am J Roentgenol 179:423–428