Embed Size (px)
DESCRIPTION
hemodynamics fundamentals
Citation preview

Fundamentals of Hemodynamic
Monitoring
Self-Learning Packet
* See SWIFT for list of qualifying boards for continuing education hours.

Fundamentals of Hemodynamic Monitoring
2011 Orlando Health, Education & Development Page 2
Table of Contents
Introduction................................................................................................................... 4
Fundamental Concepts .................................................................................................. 5
Pressure Monitoring Systems ........................................................................................ 7
Arterial Blood Pressure Monitoring ............................................................................. 17
Central Venous Pressure (CVP) Monitoring................................................................. 28
Hemodynamic Case Studies......................................................................................... 40
Conclusion.................................................................................................................... 41
Glossary........................................................................................................................ 42
References ................................................................................................................... 44
Posttest ........................................................................................................................ 45
Appendix 1: Troubleshooting Arterial and CVP Monitoring Systems .......................... 50
Appendix 2: Accurate Measurement of Noninvasive Blood Pressure.......................... 52

Fundamentals of Hemodynamic Monitoring
2011 Orlando Health, Education & Development Page 3
Purpose This packet was designed for healthcare personnel who care for patients with arterial and central venous catheters in the critical care and intermediate care units. Prerequisites for this packet are a working knowledge of basic cardiovascular anatomy and physiology, cardiovascular pharmacology, and basic ECG interpretation skills.
Objectives Upon completion of this self-learning packet, the participant should be sufficiently familiar with hemodynamic principles to: 1. Define cardiac output, stroke volume, preload, afterload and contractility 2. Describe the technical set-up of intra-arterial and central venous monitoring equipment 3. Discuss the clinical significance of arterial blood pressure and central venous pressure 4. Describe accurate non-invasive arterial blood pressure measurement 5. Discuss clinical indications and contraindications for hemodynamic monitoring using intra-
arterial and central venous catheters 6. Identify normal values and waveforms for the hemodynamic values that are obtained from
intra-arterial and central venous catheters 7. Calculate pulse pressure and mean arterial pressure 8. Interpret CVP and arterial pressure and relate them to various normal and abnormal
physiologic states 9. Calculate and evaluate the accuracy of invasive hemodynamic monitoring data using the
square wave test and waveform analysis. 10. Identify potential troubleshooting techniques when an inaccurate system is identified. 11. Identify potential complications of hemodynamic monitoring with intra-arterial and central
venous catheters 12. Recognize conditions which may alter hemodynamic readings obtained from intra-arterial and
central venous catheters 13. Describe and troubleshoot abnormal assessment findings encountered with intra-arterial and
central venous monitoring 14. Describe correct removal of arterial and central venous catheters

Fundamentals of Hemodynamic Monitoring
2011 Orlando Regional Healthcare, Education & Development Page 4
Instructions In order to receive contact hours, you must:
complete the posttest at the end of this packet
achieve an 84% on the posttest
For Non-Orlando Health employees: Complete the test using the bubble sheet provided. Be sure to complete all the information at the top of the answer sheet. You will be notified if you do not pass, and you will be asked to retake the posttest. Return to: Orlando Health Education & Development, MP14, 1414 Kuhl Ave, Orlando, FL 32806 For Orlando Health Team Member: Please complete testing via Online Testing Center. Log on to: SWIFT� Departments� E-Learning� Testing Center. Use your Orlando Health Network Login and password. Select “SLP” under type of test; choose correct SLP Title. Payroll authorization is required to download test.
Introduction Hemodynamics, by definition, is the study of the motion of blood through the body. In simple clinical application this may include the assessment of a patient’s heart rate, pulse quality, blood pressure, capillary refill, skin color, skin temperature, and other parameters. As the complexity of the patient’s status increases, invasive hemodynamic monitoring may be utilized to provide a more advanced assessment and to guide therapeutic interventions.
Invasive hemodynamic monitoring is now used routinely in many critical care and intermediate care units to assist in the assessment of single and multi-system disorders and their treatment. Hemodynamic monitoring might include waveform and numeric data derived from the central veins, right atrium, pulmonary artery, left atrium, or peripheral arteries.
The data provided by invasive hemodynamic monitoring does not take the place of careful nursing assessment. In fact, using hemodynamic data without regard to assessment findings can result in harm. Thorough nursing assessment provides the framework for interpretation of hemodynamic data and aids in selection of interventions that enhance patient outcomes.
This self-learning packet will present information concerning the use of intra-arterial and central venous catheters and introduce techniques to enhance the accuracy of data obtained from these catheters. Physiologic states will be presented that may suggest or contraindicate the use of these devices in the clinical setting. This packet includes a review of the essential components of arterial and central venous waveforms, and it examines normal and abnormal pressures and their implications in patient outcomes. It will also examine interventions that may be indicated based on the patient’s clinical presentation.

Fundamentals of Hemodynamic Monitoring
2011 Orlando Regional Healthcare, Education & Development Page 5
Fundamental Concepts The study of hemodynamics has its own vocabulary and requires an understanding of the interactions between the heart, blood vessels, and blood. A basic discussion of these terms and concepts is presented here. The cardiac output pushes the blood through the vascular system. Cardiac output (CO) is calculated by multiplying the heart rate (HR) by the stroke volume (SV).
Stroke volume is the volume of blood pumped out of the heart with each heartbeat. If the stroke volume drops, the body will compensate by increasing the heart rate to maintain cardiac output. This is known as compensatory tachycardia. Tachycardia is an effective compensatory mechanism up to a point. At heart rates greater than 150 bpm, diastolic filling time becomes so short that the tachycardia itself produces a drop in stroke volume, and cardiac output can no longer be maintained. Stroke volume is affected by three factors, preload, afterload, and contractility.
Preload Preload is defined as the amount of stretch on the cardiac myofibril at the end of diastole (when the ventricle is at its fullest). The amount of stretch is directly affected by the amount of fluid volume in the ventricle thus preload is most directly related to fluid volume. Starling’s curve describes the relationship of preload to cardiac output.
As preload (fluid volume) increases, cardiac output will also increase until the cardiac output levels off. If additional fluid is added after this point, cardiac output begins to fall. This reaction of the heart muscle to stretch can be likened to a slingshot. The farther the slingshot is stretched, the farther it propels a stone. If the slingshot is only slightly stretched, the stone will travel a very short distance. If the slingshot is repeatedly overstretched, however, it weakens and eventually loses its ability to launch the stone at all. The slingshot functions best when it is stretched just the right amount, neither too little nor too much. The same is true of the heart. Too little preload and the cardiac output cannot propel enough blood forward, too much and the heart will become overwhelmed leading to failure. Just the right amount of preload produces the best possible cardiac output; finding this level of preload is called “preload optimization.”
How is preload measured? There is not a practical way to measure myofibril stretch in living beings, nor is there a widely available method to measure ventricular end-diastolic volume. Because of this, pressures within the cardiovascular system are measured and used as a rough indicator of fluid volume. The theory is that as fluid volume in chamber increases, so too will the pressures measured in the chamber. This correlation is true only in a limited sense, because the pressures measured are affected by more than just the fluid volume present. Preload pressures are also affected by intrathoracic pressure, intra-abdominal pressure, and myocardial compliance. The key to remember is that pressure is not equal to volume. The pressure is trended as an indicator of volume status, but must be correlated to physical assessment findings and the patient’s history to come to an accurate clinical impression.
Physical assessment of preload includes assessment parameters one would use to evaluate fluid volume status. Signs of inadequate and excess preload are listed below. Note that not all patients will exhibit all signs, and some symptoms are common to both extremes. Signs of inadequate preload include poor skin turgor, dry mucous membranes, low urine output, tachycardia, thirst, weak pulses and flat neck veins. Signs of excess preload in a patient with adequate cardiac function include distended neck veins, crackles in the lungs, and bounding pulses. Increased preload in a patient with poor cardiac function presents with crackles in the
CO =HR X SV
Fundamentals of Hemodynamic Monitoring
2011 Orlando Regional Healthcare, Education & Development Page 6
lungs, an S3 heart sound, low urine output, tachycardia, cold clammy skin with weak pulses, and edema.
Afterload Afterload is defined as the resistance that the ventricle must overcome to eject its volume of blood. The focus in this packet is afterload of the left ventricle. The most important determinant of afterload is vascular resistance. Other factors affecting afterload include blood viscosity, aortic compliance and valvular disease. As arterial vessels constrict, the afterload increases; as they dilate, afterload decreases.
High afterload increases myocardial work and decreases stroke volume. Patients with high afterload present with signs and symptoms of arterial vasoconstriction including cool clammy skin, capillary refill greater than 5 seconds, and narrow pulse pressure. The pulse pressure is calculated by subtracting the diastolic blood pressure (DBP) from the systolic blood pressure (SBP). The normal pulse pressure at the brachial artery is 40 mm Hg. There are not specific values of pulse pressure that are defined as excessively wide or narrow. Serial measurements of pulse pressure are compared against one another to detect changes in vascular resistance.
Low afterload decreases myocardial work and results in increased stroke volume. Patients with low afterload present with symptoms of arterial dilation such as warm flushed skin, bounding pulses and wide pulse pressure. If the afterload is too low, hypotension may result.
CLINICAL APPLICATION
Preload
Insufficient preload is commonly called hypovolemia or dehydration. When insufficient volume is present in the vascular tree, the sympathetic nervous system is stimulated to release the catecholamines epinephrine and norepinephrine. These hormones cause increased heart rate and arterial vasoconstriction. The increased heart rate produces a compensatory tachycardia while the vasoconstriction helps maintain an adequate blood pressure. If these patients are treated with catecholamine drugs rather than receiving volume infusions, the tachycardia becomes very pronounced and the vasoconstriction can become severe enough that the organs fail and the distal extremities become ischemic. The first step in treating any form of hemodynamic instability is to assess the patient for signs of insufficient preload (e g volume or blood loss)
CLINICAL APPLICATION
Afterload
A key component of treatment for heart failure is afterload reduction using beta-blockers and ACE inhibitors. By decreasing the resistance to ventricular ejection the cardiac output is increased and myocardial workload is decreased. The increase in cardiac output frequently improves the functional status of these patients.
Pulse Pressure = SBP - DBP
Fundamentals of Hemodynamic Monitoring
2011 Orlando Regional Healthcare, Education & Development Page 7
Contractility & Compliance When used in a discussion of hemodynamics, the term contractility refers to the inherent ability of the cardiac muscle to contract regardless of preload or afterload status. Contractility is enhanced by exercise, catecholamines, and positive inotropic drugs. It is decreased by hypothermia, hypoxemia, acidosis, and negative inotropic drugs. Many other factors can affect afterload, but they are beyond the scope of this packet.
Myocardial compliance refers to the ventricle’s ability to stretch to receive a given volume of blood. Normally the ventricle is very compliant so large changes in volume will produce small changes in pressure. If compliance is low, small changes in volume will result in large changes in pressure within the ventricle. Refer back to the illustration of Starling’s curve on page 5. If the ventricle cannot stretch, it will be unable to increase cardiac output with increased preload as described by the curve.
Tissue Perfusion The whole point of assuring adequate cardiac output is to make sure the patient has adequate tissue perfusion. Tissue perfusion is the transfer of oxygen and nutrients from the blood to the tissues. When performing interventions designed to improve hemodynamics, the bottom-line for evaluation of effectivess is whether or not the intervention was successful in improving tissue perfusion.
Many of the signs of inadequate preload, afterload and contractility also reflect poor tissue perfusion. These signs include: cool clammy skin, cyanosis, low urine output, decreased level of consciousness, metabolic acidosis, tachycardia, tachypnea, and hypoxemia. Labs and diagnostic testing that are used to evaluate tissue perfusion include arterial blood gases, arterial lactate levels and pulse oximetry. Poor tissue perfusion is reflected by a low pH, low base excess and elevated lactate level. Pulse oximetry readings are typically low when tissue perfusion is compromised to a significant degree.
Pressure Monitoring Systems Hemodynamic pressure monitoring systems detect changes in pressure within the vascular system and convert those changes into digital signals. The digital signals are then displayed on a monitor as waveforms and numeric data.
The intra-arterial catheter is typically a 20-gauge intravenous-type catheter, inserted via the radial, brachial or femoral artery. The central venous catheter may be a large or small-bore catheter with one or more lumens inserted via the subclavian, internal jugular or external jugular vein.
Semi-rigid pressure tubing attaches the catheter to a transducer set-up. The tubing must be more rigid than standard IV tubing so that the pressure of the fluid within it does not distort the tubing. If the tubing is distorted in this way, the pressure readings will be inaccurate. The tubing must also be as short as reasonably possible. Longer tubing will cause distortion of the pressure as it travels over the longer distance.
The transducer is a device that converts the pressure waves generated by vascular blood flow into electrical signals that can be displayed on electronic monitoring equipment.
The transducer cable attaches the transducer to the monitor, which displays a pressure waveform and numeric readout.

Fundamentals of Hemodynamic Monitoring
2011 Orlando Regional Healthcare, Education & Development Page 8
The flush system consists of a pressurized bag of normal saline (which may or may not contain added heparin, depending on the unit and facility where you work). The pressure must be maintained at 300 mm Hg to prevent blood from the arterial system from backing up into the pressure tubing.
An intraflow valve is part of the transducer setup and maintains a continuous flow of flush solution (approximately 3-5 ml/hr) into the monitoring system to prevent clotting at the catheter tip.
A fast flush device allows for general flushing of the system and rapid flushing following withdrawal of blood from the system or when performing a square wave test.
Line Setup & Zeroing of a Transduced System The majority of hemodynamic monitoring systems are set up in a similar manner. The exact type of transducer system used varies among institutions. Review the policies and guidelines where you work for more specific information.
Equipment
Assemble all components of the system prior to set up (this may be performed by a nurse, a respiratory therapist or a technician). The components include:
Pressure cuff (pressure pack) for IV bag
One liter bag of normal saline
Pre-assembled, disposable pressure tubing with flush device and disposable transducer and stopcocks
I.V. pole with transducer mount (called a manifold)
Carpenter’s level or other leveling device
Patient monitor, pressure module and monitor cable
Equipment Set-up
1. Obtain a 1000 ml bag of 0.9% saline; invert the bag and spike it with IV tubing, then turn it upright and fill the drip chamber until it is completely full.
2. The tubing comes with stopcock caps with holes in them so one does not have to remove the caps prior to priming the tubing. Position all stopcocks so the flush solution will flow through the entire system. Be sure to flush all the stopcock ports. Roll the tubing’s flow regulator to the OFF position.
3. Activate the fast flush device and flush the saline through the entire setup one more time. Check to be sure that all air has been purged from the system. Examine the transducer and each stopcock carefully, as small bubbles tend to cling to these components. Air left in the tubing can cause inaccurate transmission of pressure to the transducer.
4. Replace all vented (the ones with holes) port caps with closed (dead-end) caps, making sure to maintain the sterility of each cap’s insertion end.
5. Place the bag of saline into the pressure cuff, and adjust the pressure to at least 300 mm Hg. This is the pressure that is required to maintain a continuous flow of 3-5 ml/minute
Fundamentals of Hemodynamic Monitoring
2011 Orlando Regional Healthcare, Education & Development Page 9
through the intraflow valve. This helps prevent clotting of the catheter and backflow of blood into the tubing.
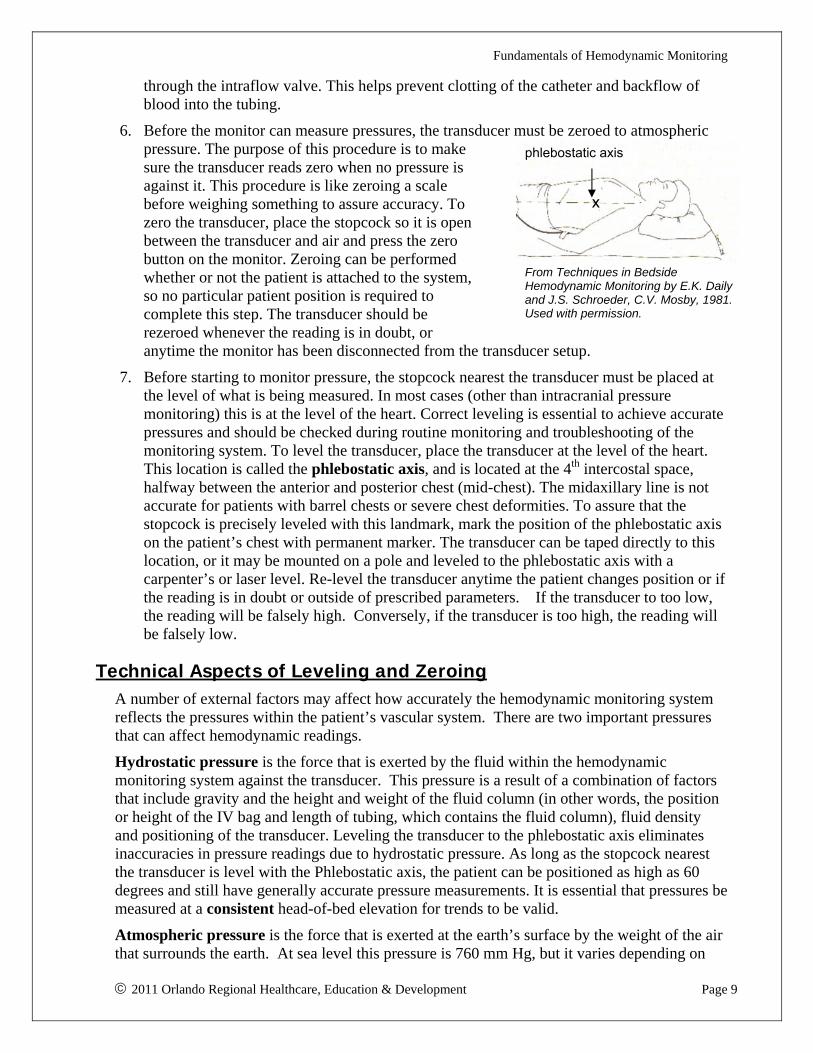
6. Before the monitor can measure pressures, the transducer must be zeroed to atmospheric pressure. The purpose of this procedure is to make sure the transducer reads zero when no pressure is against it. This procedure is like zeroing a scale before weighing something to assure accuracy. To zero the transducer, place the stopcock so it is open between the transducer and air and press the zero button on the monitor. Zeroing can be performed whether or not the patient is attached to the system, so no particular patient position is required to complete this step. The transducer should be rezeroed whenever the reading is in doubt, or anytime the monitor has been disconnected from the transducer setup.
7. Before starting to monitor pressure, the stopcock nearest the transducer must be placed at the level of what is being measured. In most cases (other than intracranial pressure monitoring) this is at the level of the heart. Correct leveling is essential to achieve accurate pressures and should be checked during routine monitoring and troubleshooting of the monitoring system. To level the transducer, place the transducer at the level of the heart. This location is called the phlebostatic axis, and is located at the 4th intercostal space, halfway between the anterior and posterior chest (mid-chest). The midaxillary line is not accurate for patients with barrel chests or severe chest deformities. To assure that the stopcock is precisely leveled with this landmark, mark the position of the phlebostatic axis on the patient’s chest with permanent marker. The transducer can be taped directly to this location, or it may be mounted on a pole and leveled to the phlebostatic axis with a carpenter’s or laser level. Re-level the transducer anytime the patient changes position or if the reading is in doubt or outside of prescribed parameters. If the transducer to too low, the reading will be falsely high. Conversely, if the transducer is too high, the reading will be falsely low.
Technical Aspects of Leveling and Zeroing A number of external factors may affect how accurately the hemodynamic monitoring system reflects the pressures within the patient’s vascular system. There are two important pressures that can affect hemodynamic readings.
Hydrostatic pressure is the force that is exerted by the fluid within the hemodynamic monitoring system against the transducer. This pressure is a result of a combination of factors that include gravity and the height and weight of the fluid column (in other words, the position or height of the IV bag and length of tubing, which contains the fluid column), fluid density and positioning of the transducer. Leveling the transducer to the phlebostatic axis eliminates inaccuracies in pressure readings due to hydrostatic pressure. As long as the stopcock nearest the transducer is level with the Phlebostatic axis, the patient can be positioned as high as 60 degrees and still have generally accurate pressure measurements. It is essential that pressures be measured at a consistent head-of-bed elevation for trends to be valid.
Atmospheric pressure is the force that is exerted at the earth’s surface by the weight of the air that surrounds the earth. At sea level this pressure is 760 mm Hg, but it varies depending on
From Techniques in Bedside Hemodynamic Monitoring by E.K. Daily and J.S. Schroeder, C.V. Mosby, 1981. Used with permission.
phlebostatic axis
x

Fundamentals of Hemodynamic Monitoring
2011 Orlando Regional Healthcare, Education & Development Page 10
altitude. Zeroing the monitor eliminates the effect of atmospheric pressure on the pressure readings. Remember, zeroing can be accomplished even before the patient is attached to the system.
Accurate Hemodynamic Monitoring
If invasive hemodynamic monitoring is used, it is essential that it is accurate; otherwise the patient should not be subjected to the risks associated with this type of monitoring. Hemodynamic readings are often used to titrate therapy, and inaccuracies in measurement can lead to inappropriate treatment strategies and potential harm to the patient.
System dynamics are tested to assure that the system is accurately reflecting the patient’s pressures. To accomplish this, the system is subjected to a high, sudden pressure and observed for its response. The pressure bag attached to the transducer is a convenient source of high pressure. Since the pressure in the pressure bag is kept at 300 mm Hg and most pressure monitoring systems have a high end of 200 mm Hg or so, a fast flush of the system appears as a high flat line during flushing that returns rapidly to baseline when the flush is released. Because the waveform produced during this maneuver looks like 3 sides of a square, this is known as a square-wave test.
The ideal square-wave waveform is depicted above. The initial sharp upstroke is produced by activation of the fast flush system. The flat line is produced for the duration of activation of the fast flush system, and reflects the high pressure present in the flush bag. The sharp downstroke represents release of the fast flush device.
The square wave should return quickly to baseline after a few rapid sharp waves called oscillations. If the oscillations are sluggish and far apart, the system is referred to as “overdamped”. Think of the way sound carries in a soundproofed room; it sounds muffled and flat. The sound waves in such a room are dampened. An overdamped system muffles pressure waves, and will underestimate systolic pressures and overestimate diastolic pressures as a result.
Sharp rise with fast flush
Duration of flush
1-2 sec
Brief flat line
Sharp rapid downstroke that extends below
Fundamentals of Hemodynamic Monitoring
2011 Orlando Regional Healthcare, Education & Development Page 11
If the oscillations are too pronounced, the system is referred to as “underdamped”. Other synonyms for underdamped include “whip” or “fling.” In the sound wave analogy, underdamping would be like sound in a tiled bathroom. All sounds are magnified, and louder sounds may ring or echo in the room. Underdamped systems reflect pressure waves in the same way. All pressures are magnified. An underdamped system will overestimate systolic pressures and underestimate diastolic pressures.
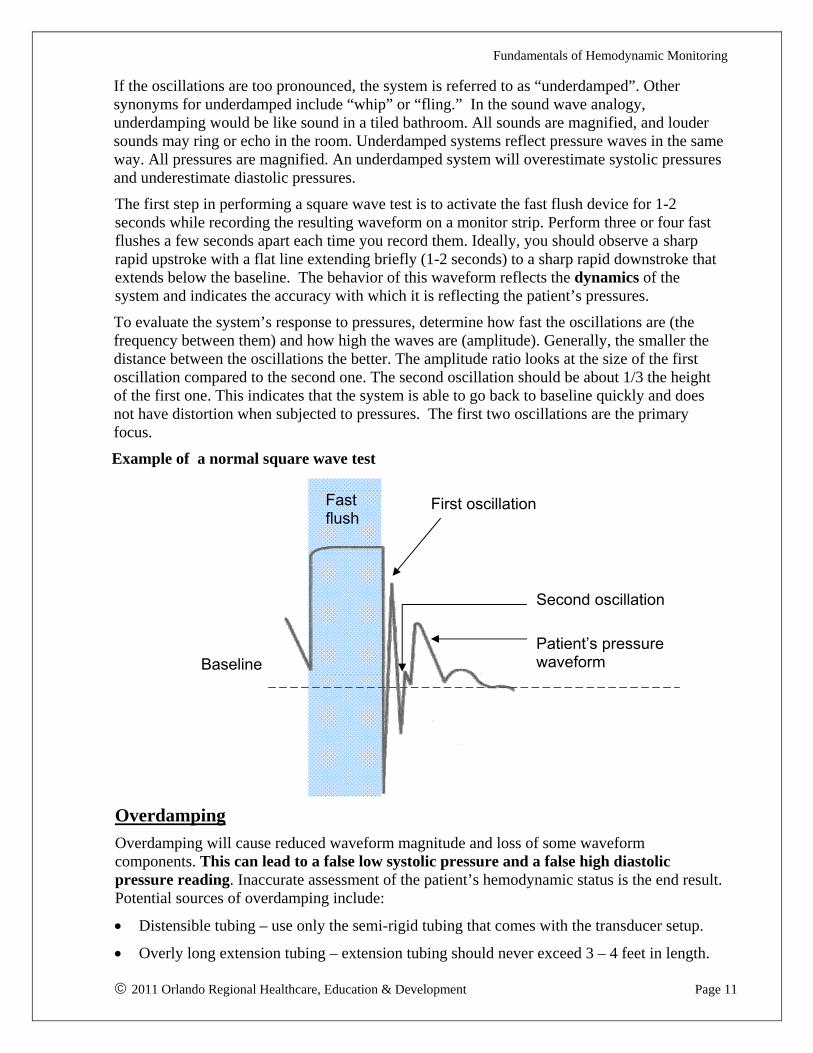
The first step in performing a square wave test is to activate the fast flush device for 1-2 seconds while recording the resulting waveform on a monitor strip. Perform three or four fast flushes a few seconds apart each time you record them. Ideally, you should observe a sharp rapid upstroke with a flat line extending briefly (1-2 seconds) to a sharp rapid downstroke that extends below the baseline. The behavior of this waveform reflects the dynamics of the system and indicates the accuracy with which it is reflecting the patient’s pressures.
To evaluate the system’s response to pressures, determine how fast the oscillations are (the frequency between them) and how high the waves are (amplitude). Generally, the smaller the distance between the oscillations the better. The amplitude ratio looks at the size of the first oscillation compared to the second one. The second oscillation should be about 1/3 the height of the first one. This indicates that the system is able to go back to baseline quickly and does not have distortion when subjected to pressures. The first two oscillations are the primary focus.
Example of a normal square wave test
Overdamping
Overdamping will cause reduced waveform magnitude and loss of some waveform components. This can lead to a false low systolic pressure and a false high diastolic pressure reading. Inaccurate assessment of the patient’s hemodynamic status is the end result. Potential sources of overdamping include:
Distensible tubing – use only the semi-rigid tubing that comes with the transducer setup.
Overly long extension tubing – extension tubing should never exceed 3 – 4 feet in length.
First oscillation
Second oscillation
Fast flush
Patient’s pressure waveform Baseline
Fundamentals of Hemodynamic Monitoring
2011 Orlando Regional Healthcare, Education & Development Page 12
Air bubbles in the circuit – check stopcocks and connections with meticulous care, as air bubbles tend to cling to these components.
Catheter diameter, length and stiffness - small diameter catheters, long catheters, and soft, compliant catheters can all cause overdamping.
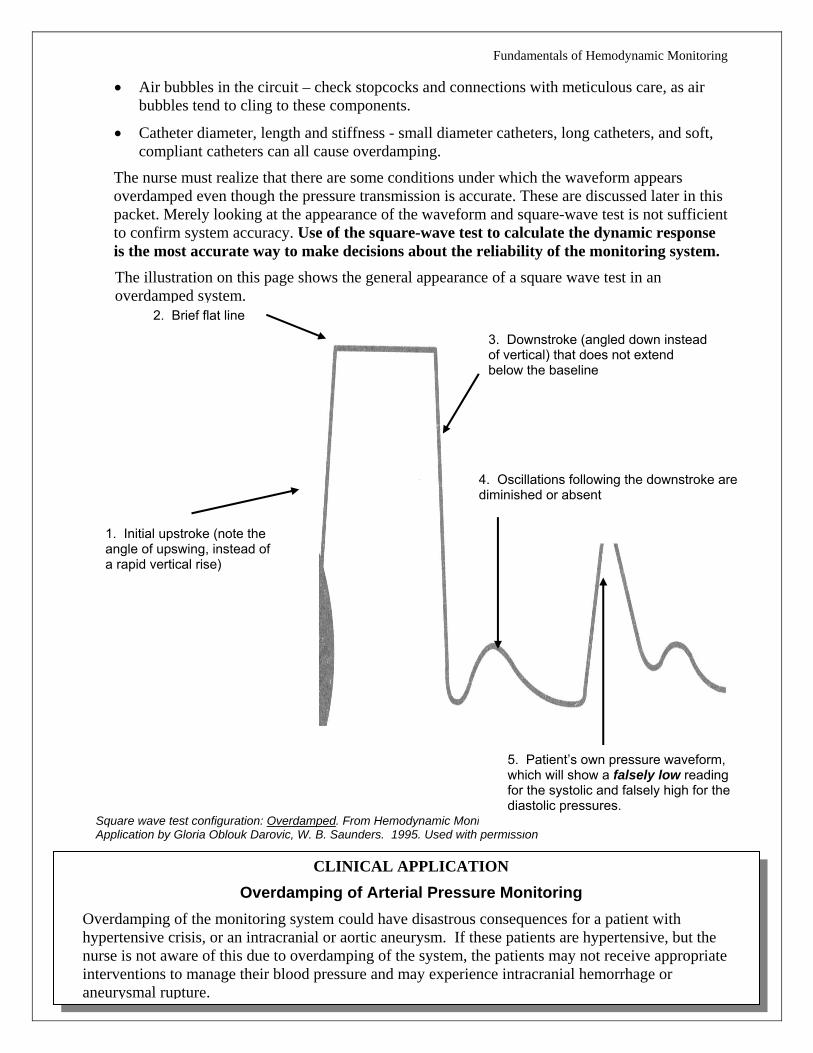
The nurse must realize that there are some conditions under which the waveform appears overdamped even though the pressure transmission is accurate. These are discussed later in this packet. Merely looking at the appearance of the waveform and square-wave test is not sufficient to confirm system accuracy. Use of the square-wave test to calculate the dynamic response is the most accurate way to make decisions about the reliability of the monitoring system.
The illustration on this page shows the general appearance of a square wave test in an overdamped system.
Square wave test configuration: Overdamped. From Hemodynamic Monitoring: Invasive and Noninvasive Clinical Application by Gloria Oblouk Darovic, W. B. Saunders. 1995. Used with permission
2. Brief flat line
1. Initial upstroke (note the angle of upswing, instead of a rapid vertical rise)
3. Downstroke (angled down instead of vertical) that does not extend below the baseline
4. Oscillations following the downstroke are diminished or absent
5. Patient’s own pressure waveform, which will show a falsely low reading for the systolic and falsely high for the diastolic pressures.
CLINICAL APPLICATION
Overdamping of Arterial Pressure Monitoring
Overdamping of the monitoring system could have disastrous consequences for a patient with hypertensive crisis, or an intracranial or aortic aneurysm. If these patients are hypertensive, but the nurse is not aware of this due to overdamping of the system, the patients may not receive appropriate interventions to manage their blood pressure and may experience intracranial hemorrhage or aneurysmal rupture.

Fundamentals of Hemodynamic Monitoring
2011 Orlando Regional Healthcare, Education & Development Page 13
Underdamping
In an underdamped system, the square wave will be followed by multiple large oscillations, as noted in the graphic on the next page. Underdamping will cause a false high systolic pressure reading and a false low diastolic pressure reading, resulting in an inaccurate assessment of the patient’s hemodynamic status.
Underdamping occurs when the natural frequency of the system is identical to one frequency of the pressure waves being transmitted by the patient. When this happens the tubing vibrates more intensely, producing overshoot and undershoot spikes. The end result is false high systolic pressures and false low diastolic pressures. These discrepancies are often referred to as artifact or whip. At times, artifact may be so pronounced that accurate waveform interpretation is impossible.
The illustration below is a depiction of a typical square-wave test in an underdamped system. The presence of underdamping may not always be this pronounced.
Square wave test configuration: Underdamping. From Hemodynamic Monitoring: Invasive and Noninvasive Clinical application, by Gloria Oblouk Darovic. W. B. Saunders, 1995. Used with permission.
2. Flat line 3. Normal downstroke
1. Normal initial upstroke
4. Downstroke followed by multiple large oscillations
5. Patient’s own pressure waveform, which will show a falsely high systolic pressure and falsely low diastolic pressure. This will cause the pulse pressure to be falsely wide.

Fundamentals of Hemodynamic Monitoring
2011 Orlando Health, Education & Development Page 14
CLINICAL APPLICATION
Underdamping of Arterial Pressure Monitoring
An underdamped arterial monitoring system can delay identification of hypovolemia in patients recovering from surgery or trauma. The normal hemodynamic response to hypovolemia is vasoconstriction, identified clinically by a narrowed pulse pressure. Narrowing of the pulse pressure occurs long before hypotension appears. If the patient has an underdamped arterial monitoring system, the narrowed pulse pressure and early decreases in systolic blood pressure may go unrecognized by the nurse. This may result in failure to intervene appropriately, and the patient may experience hypovolemic shock.
Tips for Maintaining an Accurate Hemodynamic Monitoring System
Use as simple a system as possible. Large numbers of stopcocks and extensions decrease the accuracy of the monitoring system, increase the risk of fluid leak and line contamination, and can be a source of air bubble collection.
Use short, non-compliant connecting tubing. Standard IV connecting tubing is too compliant (soft), and absorbs waveform energy, causing overdamping. Shorter tubing length (less than 3-4 feet) increases the natural frequency of the monitoring system and lessens the chance of underdamping.
Maintain tight connections. Inspect connections frequently for fluid leaks. Keep connections as visible as possible. Luer-lock connections reduce the likelihood of accidental disconnection.
Maintain the fast flush system. Pressure bags frequently lose pressure. Check that the pressure is maintained at 300 mm Hg during routine monitoring of the system and any time the pressure reading is in question. An increase in the frequency of fast flushes may be necessary to maintain system patency in hypercoagulable patients.
Inspect for bubbles. Carefully inspect all fluid-filled components after setup and periodically thereafter. Dissolved air may come out of solution during monitoring. Even pinpoint air bubbles affect the accuracy of the system. These small bubbles tend to cling to stopcocks and other connections.
Keep tubing away from areas of patient movement. Movement of the tubing produces fluid movement in the system and produces external artifact.

Fundamentals of Hemodynamic Monitoring
2011 Orlando Regional Healthcare, Education & Development Page 15
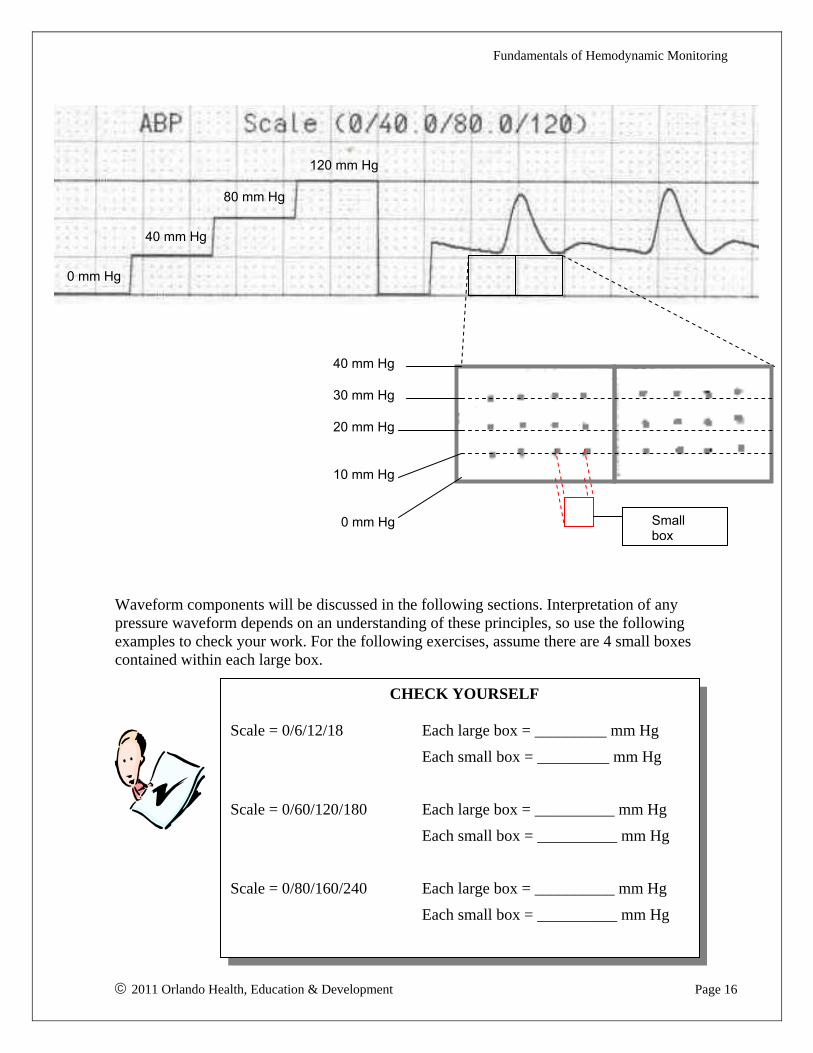
Interpreting Pressure Scales In order to verify whether the digital display on the monitor reflects accurate hemodynamic pressures, the nurse must be able to read a pressure from a printed monitor strip. Because different hemodynamic waveforms have different sizes, monitors are designed to allow the clinician to select an appropriate pressure scale. The scale for each printout is displayed at the beginning of the monitor strip, and looks like a stair step. Each step represents an amount of pressure identified in parentheses above the pressure waveform. This information is circled in the monitor strip below.
In order to interpret the pressure displayed on the strip, first identify the correct portion of the waveform to be measured and then determine the pressure based on the scale. On the strip pictured above, each large box is equal to one step and represents a pressure difference of 40 mm Hg. If a different scale were used, the pressure difference represented by the large box would be different.
On this scale, each small box represents a pressure difference of 10 mm Hg. How is this determined? Each large box is 4 small boxes tall. Each large box represents 40 mm Hg. Divide the pressure value of each large box by its height in small boxes to find the value of each small box. Refer to the picture on the next page for details.
80 mm Hg Steps
0 mm Hg
40 mm Hg
120 mm Hg
40 mm Hg = 10 mm Hg/small box 4 small boxes
Fundamentals of Hemodynamic Monitoring
2011 Orlando Health, Education & Development Page 16
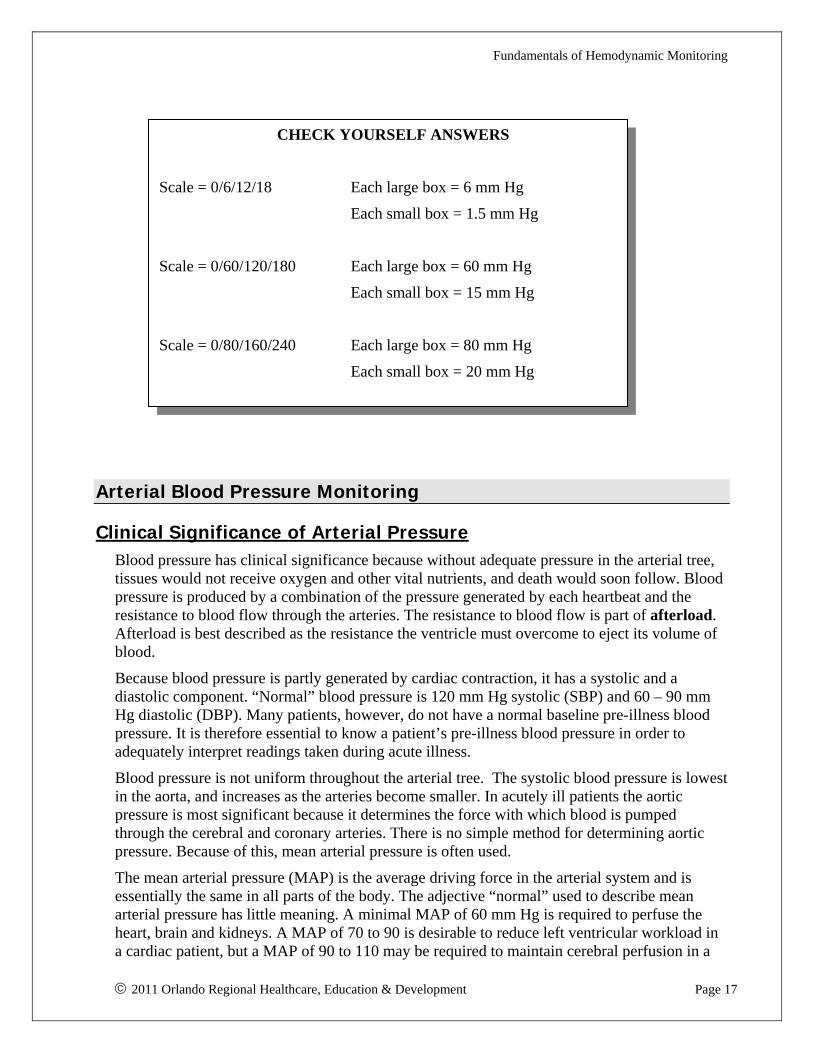
Waveform components will be discussed in the following sections. Interpretation of any pressure waveform depends on an understanding of these principles, so use the following examples to check your work. For the following exercises, assume there are 4 small boxes contained within each large box.
0 mm Hg
40 mm Hg
0 mm Hg
40 mm Hg
80 mm Hg
120 mm Hg
20 mm Hg
10 mm Hg
30 mm Hg
CHECK YOURSELF
Scale = 0/6/12/18 Each large box = _________ mm Hg
Each small box = _________ mm Hg
Scale = 0/60/120/180 Each large box = __________ mm Hg
Each small box = __________ mm Hg
Scale = 0/80/160/240 Each large box = __________ mm Hg
Each small box = __________ mm Hg
Small box
Fundamentals of Hemodynamic Monitoring
2011 Orlando Regional Healthcare, Education & Development Page 17
Arterial Blood Pressure Monitoring
Clinical Significance of Arterial Pressure Blood pressure has clinical significance because without adequate pressure in the arterial tree, tissues would not receive oxygen and other vital nutrients, and death would soon follow. Blood pressure is produced by a combination of the pressure generated by each heartbeat and the resistance to blood flow through the arteries. The resistance to blood flow is part of afterload. Afterload is best described as the resistance the ventricle must overcome to eject its volume of blood.
Because blood pressure is partly generated by cardiac contraction, it has a systolic and a diastolic component. “Normal” blood pressure is 120 mm Hg systolic (SBP) and 60 – 90 mm Hg diastolic (DBP). Many patients, however, do not have a normal baseline pre-illness blood pressure. It is therefore essential to know a patient’s pre-illness blood pressure in order to adequately interpret readings taken during acute illness.
Blood pressure is not uniform throughout the arterial tree. The systolic blood pressure is lowest in the aorta, and increases as the arteries become smaller. In acutely ill patients the aortic pressure is most significant because it determines the force with which blood is pumped through the cerebral and coronary arteries. There is no simple method for determining aortic pressure. Because of this, mean arterial pressure is often used.
The mean arterial pressure (MAP) is the average driving force in the arterial system and is essentially the same in all parts of the body. The adjective “normal” used to describe mean arterial pressure has little meaning. A minimal MAP of 60 mm Hg is required to perfuse the heart, brain and kidneys. A MAP of 70 to 90 is desirable to reduce left ventricular workload in a cardiac patient, but a MAP of 90 to 110 may be required to maintain cerebral perfusion in a
CHECK YOURSELF ANSWERS
Scale = 0/6/12/18 Each large box = 6 mm Hg
Each small box = 1.5 mm Hg
Scale = 0/60/120/180 Each large box = 60 mm Hg
Each small box = 15 mm Hg
Scale = 0/80/160/240 Each large box = 80 mm Hg
Each small box = 20 mm Hg

Fundamentals of Hemodynamic Monitoring
2011 Orlando Regional Healthcare, Education & Development Page 18
neurosurgical patient. The best MAP depends on the physiologic circumstances of each individual patient.
To calculate mean arterial pressure, use the following formula and round to the nearest whole number:
MAP = SBP + (2 x DBP) 3
Comparison of Invasive and Noninvasive Blood Pressure Measurements
Invasive and noninvasive (cuff) measurement of blood pressure often yield markedly different measurements. It is important to realize that there is no direct relationship between the results obtained from the two methods. Invasive arterial monitoring measures pressure whereas non-invasive blood pressure measurement reflects blood flow. Blood pressure and blood flow are two distinct phenomena that follow different rules of physics and physiology. In addition, there are many potential sources of error when taking a blood pressure (see Appendix 2 for accurate blood pressure measurement).
CHECK YOURSELF
Calculation of Mean Arterial Pressure (MAP)
Blood Pressure = 100/60 MAP = _________________
Blood Pressure = 180/98 MAP = _________________
Blood Pressure = 150/70 MAP = _________________
Example: MAP for a patient with a blood pressure of 120/60 is:
MAP= 120+ (2 x 60) = 120 + 120 = 240 =80 3 3 3
CHECK YOURSELF ANSWERS
Calculation of Mean Arterial Pressure (MAP)
Blood Pressure = 100/60 MAP = 73 Blood Pressure = 180/98 MAP = 125 Blood Pressure = 150/70 MAP = 97
Fundamentals of Hemodynamic Monitoring
2011 Orlando Regional Healthcare, Education & Development Page 19
Non-invasive measurements will yield lower readings than the invasive system in low-flow states such as hypotension or vasoconstriction. Conversely, non-invasive readings are higher than invasive ones when arterial vasodilation is pronounced, as in sepsis.
Which measurement should be trusted? Direct monitoring of arterial blood pressure is the only scientifically and clinically validated method for real-time continuous monitoring of blood pressure. Good correlation of invasive and non-invasive blood pressure measurement is not a valid gauge for the accuracy of the invasive monitoring system. The take-home message is that the invasive monitoring system provides the most accurate measurement of blood pressure when the following criteria have been met:
The transducer is leveled to the phlebostatic axis
The system is zeroed appropriately
All system components are in working order
The system dynamics have been analyzed and determined to be optimal or acceptable
Indications for Invasive Arterial Monitoring
Intra-arterial catheters are routinely used in the critical care environment to provide continuous blood pressure measurements or access for frequent blood collection. Specific indications may include patients:
experiencing prolonged shock of any type
with hemodynamic instability
undergoing any major vascular, thoracic, abdominal or neurologic procedures or surgery.
with acute hypotension or hemorrhage
receiving vasoactive infusions
in hypertensive crisis, including those with dissecting aortic aneurysm or CVA
receiving intra-aortic balloon counterpulsation
with significant pulmonary system compromise requiring mechanical ventilation, or those who may have severe acid-base imbalance requiring frequent monitoring of arterial blood gases
undergoing thrombolytic therapy for coronary, cerebral or vascular occlusions (must be inserted prior to initiation of thrombolytic therapy) to allow for continuous blood pressure monitoring and to permit blood collection for diagnostic laboratory studies without the need for venipuncture
requiring frequent venipunctures for diagnostic blood testing
Relative Contraindications for Intra-Arterial Monitoring There are few, if any, absolute contraindications to the use of arterial lines; however, there are some relative contraindications. This means that the conditions listed below will increase the risk of complications when using an intra-arterial catheter. This increased risk must be examined relative to the benefit that the patient will receive in the form of more accurate assessments and interventions. Relative contraindications include the following:

Fundamentals of Hemodynamic Monitoring
2011 Orlando Regional Healthcare, Education & Development Page 20
Peripheral vascular disease due to increased risk of limb ischemia
Coagulopathies or bleeding disorders due to increased risk of hemorrhage at the insertion site
Current or recent use of fibrinolytics or anticoagulants causing an increased risk of bleeding at the insertion site. (However, as noted above under “Indications,” an arterial line is generally inserted prior to initiation of fibrinolytic therapy for continuous blood pressure monitoring and to allow for blood collection for diagnostic laboratory studies)
Insertion sites that are infected or burned
Insertion sites where previous vascular surgery has been performed, or that would involve catheter placement through vascular grafts
Catheter Site Determination A physician, nurse, or respiratory therapist, depending on the policies of the facility or unit where you work, may perform the actual insertion of the intra-arterial catheter. The most preferred insertion site is the radial artery. Alternate insertion sites include the femoral and brachial arteries. The femoral artery is not a preferred site due to its anatomic location. If the femoral artery is used, the monitoring catheter must be a minimum of two inches in length.
If the radial artery is used, the modified Allen test must be performed prior to cannulation to ensure that the ulnar artery provides adequate circulation to the hand to prevent tissue ischemia or necrosis.
To perform the modified Allen test, pressure is applied to both the radial and ulnar arteries. The patient opens and closes their fist several times until the hand blanches. Pressure is then maintained on the radial artery while releasing pressure from the ulnar artery. The hand is observed for the return of blood flow or flushing. If color does not return to the hand within 5 to 10 seconds, the radial artery should not be used.
Care and Maintenance of Arterial Catheters Proper assessment and care of arterial catheters helps prevent complications, ensure accuracy of intra-arterial pressure readings, and promote patient comfort. Arterial line care may be
Compression of ulnar artery Compression of radial artery

Fundamentals of Hemodynamic Monitoring
2011 Orlando Regional Healthcare, Education & Development Page 21
performed by nurses or respiratory therapists. Specific points involved in care and maintenance of an intra-arterial pressure monitoring system include the following:
Frequently monitoring distal pulses, skin temperature, nail blanching and capillary refill
Monitoring and limiting motion of an underlying joint closest to insertion site.
Observing insertion site for redness, drainage, bruising and discoloration
Assessing skin integrity at the insertion site and around any devices applied to limit joint mobility
Changing the dressing using sterile technique any time the dressing is soiled or disrupted, or when required by hospital policy
Using proper technique when obtaining blood from an intra-arterial catheter:
- Maintain aseptic technique for any line access and use standard precautions - Withdraw blood gently and slowly from the line - Flush the collection port to prevent clot formation and bacterial colonization - Maintain sterility of the system; place a new sterile cap over the sample port. - Fast-flush the system to the patient for no more than 3 seconds at a time - Do not use a syringe to manually flush arterial catheters. Manual flushing with a
syringe generates enough pressure that the injected fluid can invade the cerebral circulation.
- Maintain any blood conservation devices placed in the monitoring system according to manufacturer’s guidelines and your hospital’s policies
Hazards and Complications of Arterial Catheters Any invasive procedure involves a degree of risk for complications. When properly inserted and monitored, the risk of complications from an indwelling intra-arterial catheter can be minimized by frequent assessment of the patient. Specific complications may include the following:
Failure to analyze system dynamics, which may result in over- or under-estimation of the patient's true blood pressure
Infection, which may be local or systemic. The risk of infection becomes greater the longer the catheter remains in place.
Embolization from fibrin, particulate matter, flush solution or air, which may result in embolic infarctions of distal tissue and digital necrosis
Vascular insufficiency, caused by the catheter, arterial spasm or plaque
Bleeding, which may include minor surface bleeding from the site, hematoma and vascular compression under the insertion site, or massive occult bleeding (the femoral artery may leak up to 1,500 ml of blood into the retroperitoneal space)
Accidental disconnection or opening of the system, which may result in rapid external blood loss
Excessive blood loss and decreased hemoglobin/hematocrit due to multiple blood draws for diagnostic laboratory studies

Fundamentals of Hemodynamic Monitoring
2011 Orlando Regional Healthcare, Education & Development Page 22
Arterial spasm due to catheter irritation or trauma to the vessel during insertion, which may decrease blood flow distal to the insertion site
Inadvertent removal due to excessive patient movement or the pressure exerted on the site by limb restraints
Skin breakdown and arterial erosion related to indwelling catheters and tubing.
Intra-Arterial Waveforms A normal arterial pressure waveform has five main components. See diagram below.
1. The anacrotic limb, or anacrotic rise, is a rapid upstroke that begins at the opening of
the aortic valve in early systole. The steepness, rate of ascent, and height of this initial upswing is related to the contractility and stroke volume of the left ventricle.
2. The systolic peak represents the highest pressure generated by the left ventricle during myocardial contraction. This point marks the patient’s actual systolic blood pressure.
3. The dicrotic limb begins during late systole as the flow of blood out of the left ventricle starts to decrease.
4. The dicrotic notch marks the closure of the aortic valve and the beginning of diastole.
5. The end diastole landmark is the location at which the patient’s actual diastolic blood pressure is measured.
In the following examples, note the effect of hypertension and hypotension on the arterial line waveform. Hypertension generally results in a very steep anacrotic limb and a shortened early systolic phase of contraction. On the dicrotic limb, this rapid ejection of blood from the left ventricle early in systole may result in changes to the waveform prior to the dicrotic notch. On the tracing below, note the variations from one waveform to another while the appearance of the dicrotic notch remains very consistent.

Fundamentals of Hemodynamic Monitoring
2011 Orlando Regional Healthcare, Education & Development Page 23
In the example below, hypotension has resulted in an overdamped appearance of the waveform with a decrease in the steepness of the anacrotic limb. When the blood is ejected from the left ventricle with decreased force, there may not be a pronounced dicrotic notch since there is less of a difference between the systolic and diastolic pressures.
Note the variability in the waveform near the systolic peak.
Note the scale printed on the paper by the monitor showing the pressure levels. The blood pressure is 180/100.
Dicrotic notch showing aortic valve closure (note consistent configuration)
Decreased rise and slope of anacrotic limb
Note the scale printed on the paper by the monitor allowing the determination of pressure levels from the waveforms. In this case, it appears that the diastolic is about 75 and the systolic is about 50.
Diminished or absent dicrotic notch
Systolic pressure, here about 75
Diastolic pressure, here about 50

Fundamentals of Hemodynamic Monitoring
2011 Orlando Regional Healthcare, Education & Development Page 24
Arterial Waveform Examples The following are some examples of arterial line waveforms for practice and determination of actual pressures.
Example 1
In the example below, the top waveform is the cardiac rhythm reflected in lead II. The bottom waveform reflects the arterial pressure tracing. Note the scale displayed at the beginning of the strip, and the notation as to what that scale is.
Locate the dicrotic notch in this example. Based on this waveform, what is the arterial line blood pressure? Measure the systolic blood pressure at the peak of systole and the diastolic pressure just prior to the anacrotic rise. The correct locations for measurement of systolic and diastolic pressure are marked with bold horizontal lines on the strip.
The dicrotic notch is not clearly visible on this waveform. Lack of a distinct dicrotic notch indicates this waveform may be overdamped. The nurse should perform a square wave test and analyze the system dynamics to determine if this system is reflecting accurate pressures. What is the estimated arterial blood pressure in this case? The pressure here was documented at 120/55, but cannot be considered reliable until system dynamics have been assessed.
Example 2
The top waveform is the ECG tracing of lead II. The bottom waveform represents the arterial pressure tracing. Look at the stairstep scale at the beginning of the bottom waveform. In this case, the initial flat line represents a pressure of 40 mm Hg, the second is at 58 mm Hg, the third is at 76 mm Hg, and the top one is at 94 mm Hg. Most scales begin at zero, but this one does not. Why? Some monitors have a setting called “optimize” that will automatically select a scale to fit the waveform displayed. This strip was obtained using an “optimized” scale. This type of scale can help show increased detail, but the scale must be reset any time the patient’s pressures change significantly.
DBP = 55 mm Hg
SBP = 120 mm Hg
0 40
80 120

Fundamentals of Hemodynamic Monitoring
2011 Orlando Regional Healthcare, Education & Development Page 25
The dicrotic notch is identified with an arrow. Recall that the dicrotic notch on the arterial waveform represents closure of the aortic valve and the onset of diastole.
What is this patient’s arterial blood pressure? In this case, the pressure is 90/49 with a mean arterial pressure of 63. This pressure was obtained by calculating the value of each small box using the scale on the strip. In this case, each step is equal to 18 mm Hg, and each small box is equal to 4.5 mm Hg. Refer back to the section on interpreting pressure scales for more information.
Note that the pressure obtained would be slightly different if the first waveform had been analyzed. There will always be beat-to-beat variations in pressure waveforms.
Example 3
Once again, the top waveform is the ECG tracing. The bottom waveform is the arterial pressure tracing. Cover the waveform at the bottom of the page and check your skills. Label the pressure scale, locate the dicrotic notch, and determine this patient’s arterial blood pressure. Are any interventions or troubleshooting called for?
94
76 58
SBP = 90
DBP = 49
Dicrotic Notch
40

Fundamentals of Hemodynamic Monitoring
2011 Orlando Regional Healthcare, Education & Development Page 26
Waveform Analysis Answer: Example 3
In this case, the pressure waveform is off the scale the majority of the time, so the pressure cannot be accurately calculated. The scale and dicrotic notch are marked on the strip. The appropriate intervention in this case is to assess the level of the transducer and re-level if needed. If the transducer is level with the phlebostatic axis, the scale should be increased.
Example 4
Cover the waveform analysis at the bottom of the page before completing this skill. What is the scale on this waveform? What is the arterial blood pressure? Where is the dicrotic notch? Is any intervention or troubleshooting necessary?
Waveform Analysis Answer: Example 4
This waveform appears dampened; the dicrotic notch is not visible. This may be due to hypotension, poor system dynamics (overdamping) or a scale that is too large for the waveform. Note the marked scale. The patient’s pressure according to the strip is 105/45, but this is not accurate if the waveform is overdamped. The appropriate interventions (in order) would be to check the patient, correct the level of the transducer if needed, aspirate and flush
0 mm Hg
40 mm Hg
80 mm Hg
120 mm Hg
Dicrotic Notch

Fundamentals of Hemodynamic Monitoring
2011 Orlando Regional Healthcare, Education & Development Page 27
the line, and select a smaller scale. If these interventions failed to improve the waveform, system dynamics should be assessed using a square-wave test.
Troubleshooting Whenever a change occurs in the waveform appearance or numeric readings always check the patient first. If the patient’s assessment is unchanged and there is reason to believe that the waveform appearance or numeric values are not an accurate reflection of the patient’s status, zero and level the transducer again. If this does not resolve the problem, assess the system dynamics using the square wave test. To further troubleshoot the system, refer to Appendix 1: Troubleshooting Arterial and CVP Monitoring Systems.
Removal of Arterial Catheters The arterial catheter should be removed as soon as it is no longer needed, the site appears infected, or the tissues distal to the catheter become ischemic. In any case, it should not remain in place for longer than five days. A physician’s order is required for removal.
To remove the arterial catheter, obtain clean gloves, sterile gauze squares, and materials for a pressure dressing. Tell the patient what you are doing and instruct him/her to remain still. Don gloves. Remove the dressing carefully and cleanse the site with sterile saline if needed. If sutures are in place, remove them carefully. Palpate the pulse proximal to the insertion site and lightly place the fingers of one hand directly over the pulse and keep them there. With the other hand, gently remove the catheter. Allow the artery to bleed briefly (it should spurt) before firmly compressing the artery with the first hand. Allowing the artery to bleed helps ensure that any particulate matter present on the catheter is expelled. Hold firm pressure on the artery for at least five minutes for a radial site, longer for a femoral or brachial site. Gently release the pressure, keeping the fingers over the pulse. If there is no bleeding or swelling, apply a pressure dressing to the site. If bleeding or swelling is noted upon release of pressure, immediately
0
60
120
180
SBP = 105 mm Hg
DBP = 45 mm Hg

Fundamentals of Hemodynamic Monitoring
2011 Orlando Regional Healthcare, Education & Development Page 28
reapply pressure proximal to the insertion site and hold for five minutes longer. Longer pressure holds may be required for patients with low platelet counts or elevated PT/PTT.
Monitor the site after removal according to your hospital’s policies. Document the appearance of the site, the length of time required to achieve hemostasis, and the patient’s tolerance of the procedure in addition to vital signs. Also document the appearance of the catheter after removal. Instruct the patient to notify the nurse if any bleeding, pain, or numbness occurs at or distal to the site. If any bleeding or swelling is noted after removal, apply pressure again as previously described and notify the physician.
Central Venous Pressure (CVP) Monitoring
Clinical Significance of CVP Monitoring The CVP is the pressure of the blood emptying into the right ventricle during diastole (the right ventricular end-diastolic pressure, or RVEDP). This pressure reflects what is known as right ventricular preload. Thus, measuring CVP is one method of assessing right ventricular preload in the absence of a pulmonary artery catheter. The normal CVP ranges from 0 to 8 mm Hg.
There are many factors that may alter the CVP, resulting in a pressure that is not an accurate indication of right ventricular end-diastolic volume. Any condition that causes increased intrathoracic pressure, such as pneumothorax or some types of mechanical ventilation will cause the CVP to be quite high, while end-diastolic volume is acutely low. Conditions that diminish elasticity or contractility and cause the right ventricle to become stiff, such as pericardial tamponade and myocardial ischemia or infarction, can also result in a high pressure with a low blood volume. Because of this, the CVP is not extremely helpful in patients with increased intrathoracic pressure or abnormal myocardial contractility. In clinical practice, the CVP is most appropriately used to help monitor fluid status or guide fluid resuscitation in dehydrated or hypovolemic patients in the absence of cardiac dysfunction. As with any hemodynamic pressure, the trend of values is more significant than any one reading.
A decreased CVP generally indicates that there is a diminished volume of blood returning from the venous system to the right side of the heart. This may be due to absolute hypovolemic states caused by dehydration, hemorrhage, vomiting or diarrhea. It may also be caused by relative hypovolemic states caused by fluid losses from the intravascular space due to an alteration in capillary membrane permeability, caused by conditions such as peritonitis, bowel obstruction or the systemic inflammatory response syndrome (SIRS). In addition, vasodilation may allow blood to pool within the blood vessels and decrease venous return and CVP; vasodilatation may be a result of medications, anaphylaxis, sepsis or neurogenic shock.
What do absolute hypovolemia, relative hypovolemia and vasodilatation have in common? In each case the overall intravascular capacity is greater than the volume of blood contained within the intravascular space. A decreased CVP
Conditions other than Hypervolemia that Elevate CVP
Pneumothorax Hemothorax Intra-abdominal hypertension Pericardial tamponade Mechanical Ventilation with positive
end-expiratory pressure (PEEP)

Fundamentals of Hemodynamic Monitoring
2011 Orlando Regional Healthcare, Education & Development Page 29
reading should thus be considered in combination with a patient’s diagnosis, history and assessment findings in order to determine the best way to equalize the intravascular capacity with the intravascular volume and restore a normal CVP. Fluids and/or vasopressors may be indicated depending on the cause of a decreased CVP to reverse hypovolemia or vasodilatation. In any case, the numeric CVP value alone is meaningless without correlation with the patient’s diagnosis, history and thorough physical assessment.
An elevated CVP indicates that the pressure within the right ventricle is increased above normal when the ventricle is full just prior to systole. This can be due to many factors, including fluid overload, myocardial infarction, cardiogenic shock, heart failure, pulmonary
edema, COPD, pulmonary embolus, pneumothorax, pulmonary hypertension, pericardial effusion, or tamponade. Right-sided valvular disorders such as tricuspid regurgitation and pulmonic stenosis may also elevate the CVP reading.
Description and Function of CVP Lines Central venous catheters may be small or large-bore, and single or multi-lumen. They can be inserted peripherally (PICC) or via the jugular or subclavian veins. Any catheter that is inserted centrally and has its tip in the superior vena cava can be used to monitor central venous pressure. This includes Hickman catheters, Groshong catheters, dual-lumen dialysis catheters as well as the more common dual or triple lumen central venous catheters. If a multi-lumen catheter is used, the CVP is measured via the distal port. Other ports are too far away from the right atrium to accurately reproduce the CVP waveform.
CVP monitoring cannot be performed through PICC lines. These long, pliable catheters do not produce accurate waveforms. Other types of catheters unsuitable for CVP monitoring include
CLINICAL APPLICATION
Elevated CVP with Hypovolemia
The CVP can be elevated even when fluid volume status is normal or depleted if the intrathoracic pressure is high. Sources of increased intrathoracic pressure include mechanical ventilation with PEEP, pneumothorax, hemothorax, and high intra-abdominal pressure. Remember that pressure is not equal to volume.
As with any hemodynamic findings, an elevation in the CVP must be examined in light of other assessment findings to determine the cause for the elevation. Interventions must be based on the pathophysiologic basis for the pressure increase. Patients with heart failure, volume overload and pulmonary edema may require diuresis and positive inotropes, but these interventions would not help the patient with an elevated CVP due to a tension pneumothorax
Placement of a central venous catheter, from Techniques in Bedside Hemodynamic Monitoring by E.K. Daily and J.S. Schroeder C V Mosby 1981 Used with permission
Fundamentals of Hemodynamic Monitoring
2011 Orlando Regional Healthcare, Education & Development Page 30
Port-A-Caths and introducers. The Port-A-Cath has a one-way valve that interferes with monitoring and the tip of the introducer is too far away from the right atrium to be suitable.
Central venous catheters are placed so that the catheter tip (distal end) is located in the superior vena cava as it opens into the right atrium. This allows measurement of the pressure within the venous system at the point at which it empties into the right atrium. The catheter tip should not enter the right atrium. A catheter inside the atrium can induce atrial dysrhythmias and could perforate the myocardium.
Indications for the Use of Central Venous Catheters Central venous catheters are commonly used in the clinical setting for monitoring and therapeutic purposes. Primary indications include the following:
Rapid administration of fluids and blood products in patients with any form of shock
Administration of vasoactive and caustic drugs
Administration of parenteral nutrition, electrolytes or hypertonic solutions
Venous access for monitoring CVP and assessing the response to fluid or vasoactive drug therapy
Insertion of transvenous pacemaker
Lack of accessible peripheral veins
Hemodynamic instability
Relative Contraindications There are few absolute contraindications to the use of central venous catheters. The relative contraindications listed below will increase the risk of complications when using a central venous catheter. However, this increased risk must be considered relative to the benefit that the patient will receive in the form of more advanced assessments and interventions. Relative contraindications include the presence of the following:
Coagulopathies or bleeding disorders (monitor platelet count, PT, PTT)
Current or recent use of fibrinolytics or anticoagulants
Insertion sites that are infected or burned, or where previous vascular surgery has been performed, or involve catheter placement through vascular grafts
Patients with a high risk of pneumothorax (such as those with COPD, or those on mechanical ventilation with PEEP or CPAP)
Patients with suspected or confirmed vena cava injury
Selection of Catheter and Insertion Site Various types of central venous catheters exist. The choice of catheter is made by the physician and based on the clinical indication. For the purposes of this self-learning packet, discussion will be limited to those catheters that are centrally inserted, most commonly through the subclavian, internal jugular or external jugular veins.

Fundamentals of Hemodynamic Monitoring
2011 Orlando Regional Healthcare, Education & Development Page 31
Large gauge single-lumen catheters may be used for rapid fluid administration in patients in shock or following major trauma, or in patients receiving only maintenance fluid administration and intermittent monitoring of the central venous pressure using a water manometer. The most common practice is to use multi-lumen catheters, especially the triple-lumen central venous catheter. Multi-lumen catheters allow for simultaneous administration of fluids and multiple drugs that may not be compatible when administered through a single line. These catheters also allow for continuous monitoring of the central venous pressure through the distal port while drugs and fluids are being administered through the proximal ports. Do not monitor and infuse through the same port; the CVP will not be accurate.
The choice of insertion site is generally determined by the physician, based on his or her experience, and patient-related factors, such as anatomy, burn, surgical or trauma sites, and pulmonary hyperinflation due to chronic lung disease or mechanical ventilation.
Insertion of a Central Venous Catheter Physicians generally insert the types of central venous catheters (CVC) discussed in this self-learning packet. In some institutions, physicians’ assistants or nurse practitioners may be credentialed to perform the procedure. Unless an emergency situation exists, the physician obtains informed consent from the patient or healthcare surrogate before the catheter is placed. Check your hospital’s policies for specific information.
Nursing personnel often assist with catheter insertion. It is preferable to have two nurses assisting; one to assist with the technical procedure and another to monitor and comfort the patient. While assisting a physician with a CVC insertion, the following steps should be used as general guidelines:
The physician explains the procedure to the patient to obtain informed consent Prepare IV solution, and set up the monitoring system as previously described Obtain medication for pain or sedation as ordered by physician Position the patient as needed using pillows or rolled towels, or place the patient in the
Trendelenberg position; this prevents air from being passively drawn into the venous system during the negative intrathoracic pressure generated by inspiration
Wear surgical cap, face mask, sterile gown and gloves and provide these items for the physician and others in the immediate area
Assist with cleansing and draping of the insertion site (using sterile towels) as needed Provide patient comfort and emotional support during procedure Monitor respiratory rate and status, heart rate and rhythm, and patient response to the
procedure. Observe the cardiac monitor, if available, during the procedure and inform the physician immediately if a dysrhythmia occurs.
Assist with keeping the patient’s head and hands away from the insertion site and maintaining a sterile field
Assist with connection of the hemodynamic monitoring setup to the catheter hub as requested, and apply a sterile occlusive dressing to the insertion site
If using a multi-lumen catheter, aspirate air from each lumen and flush with appropriate solution or initiate IV fluids as ordered
Obtain a CVP reading as previously described Immediately obtain a chest x-ray. Unless an emergency situation exists, medications are not
administered via the CVC until placement is confirmed with a chest x-ray.

Fundamentals of Hemodynamic Monitoring
2011 Orlando Regional Healthcare, Education & Development Page 32
Document the insertion, the patient’s response and the results of the chest x-ray. Also document the length marking at the skin on the catheter. Length is marked in 10 cm increments using black rings. One black ring equals 10 cm, two black rings equals 20 cm, etc.
Obtain orders from the physician for CVP monitoring, the desired CVP, and high and low CVP values requiring notification.
Hazards and Complications The insertion and maintenance of a central venous catheter involves some significant risks to the patient. The CVC is a flexible tube that is placed through a puncture in a large blood vessel (usually the subclavian, femoral or jugular) and threaded through the venous system towards the right atrium. These catheters are frequently used for infusing high volumes of fluids, or for infusing fluids that may be irritating to blood vessels. Specific complications may include the following:
Infection, either local or systemic
Bleeding, either on the surface or below it, which may lead to hematoma, vascular compromise and hypovolemia
Air or fluid (IV fluid or blood) in the mediastinum, thoracic cavity, pleural or pericardial space, leading to a pneumothorax, hemothorax, pleural effusion, pericardial tamponade or widened mediastinum
Vascular erosion due to catheter or irritating fluids
Cardiac dysrhythmias resulting from irritation by catheter tip or electrical microshock (electricity transmitted by the catheter to the heart)
Embolism caused by air, particulate matter, catheter tip, or clot formation
The most significant risk to the patient is infection. To minimize the risk to your patients, use meticulous sterile technique when caring for the CVC. Follow your hospital’s policies for dressing changes and CVC access. Most hospitals require the dressing be changed whenever it is soiled, but discourage routine daily dressing changes. The more the site is exposed to the environment, the greater the risk of infection. A sterile occlusive dressing is used for all CVC sites. If there is no drainage at the site, a transparent dressing is preferred so the site can be assessed visually. If drainage is present at the site, a sterile absorbent dressing must be used and changed as needed. Document the insertion site as outlined by the policies and guidelines in your hospital.
In most cases, the CVC will remain in place a maximum of 5 days. After 5 days, the catheter site is changed or the catheter is replaced using an over-the-wire technique at the current site. The decision on whether to change the site is made by the physician and is based on the condition of the current site, culture results, and availability of other access sites.
CVP Line Setup Central venous catheters are used in a variety of units and settings. In critical care units, they may be attached to a transducer and monitored by a hardwire system in a manner similar to intra-arterial lines. Guidelines on transducing this system are covered in the Pressure Monitoring section of this self-learning packet. In general care and step-down units, a central

Fundamentals of Hemodynamic Monitoring
2011 Orlando Regional Healthcare, Education & Development Page 33
venous catheter may also be connected to a water manometer to measure the CVP. However, water manometer systems do not allow for waveform interpretation or square-wave testing, making them more prone to error than transduced systems. Because of this, water manometer systems are becoming less common and will not be discussed in this packet.
CVP Waveforms When a properly placed central venous catheter is attached to an electronic monitor, a classic waveform that reflects the pressure within the right atrium is produced. The components of a normal CVP waveform reflect pressure changes in the right atrium resulting from the movement of blood in and out of the atrium during the cardiac cycle. They are shown below, along with their relationship to a normal ECG rhythm tracing.
Components of the CVP Waveform. From Thelan’s Critical Care Nursing: Diagnosis and Management by Linda Urden, Kathleen Stacy and Mary Lough, C.V. Mosby, 2002. Used with permission.
Components of the CVP waveform include:
The A wave occurs after the P wave of the ECG complex during the PR interval. It reflects the increased atrial pressure that occurs with atrial contraction. Note that the A wave will be absent in patients who do not have a distinct atrial contraction, such as those with atrial fibrillation. Since the CVP value should be a reflection of the Right Ventricular End-Diastolic Pressure, the CVP reading is taken at the last half of the A wave at the midpoint of the X descent. Calculate the CVP by averaging the pressure measured at the peak of the A wave and at the subsequent trough.
The X descent reflects atrial relaxation.
The C wave occurs at the end of the QRS complex at the beginning of the ST segment on the ECG tracing. It reflects closure of the tricuspid valve between the right atrium and right ventricle and the slight bulging of the tricuspid valve during ventricular contraction. The C wave is not always visualized.
Normal ECG rhythm tracing
CVP waveform
CVP value recorded at the midpoint of the X descent.

Fundamentals of Hemodynamic Monitoring
2011 Orlando Regional Healthcare, Education & Development Page 34
The V wave occurs at the end of the T wave on the ECG tracing. It reflects the increased pressure during passive atrial filling.
The Y descent occurs prior to the P wave on the ECG tracing. It reflects the opening of the tricuspid valve and the passive flow of blood from the right atrium into the right ventricle prior to atrial contraction.
Obtaining a CVP Reading A CVP waveform consists of a number of components that may generate constantly changing numeric values on the monitor. Which number is recorded as the actual CVP? It is important not to take the reading from the digital display on the monitor, since this value represents the average pressure throughout the entire cardiac and respiratory cycles.
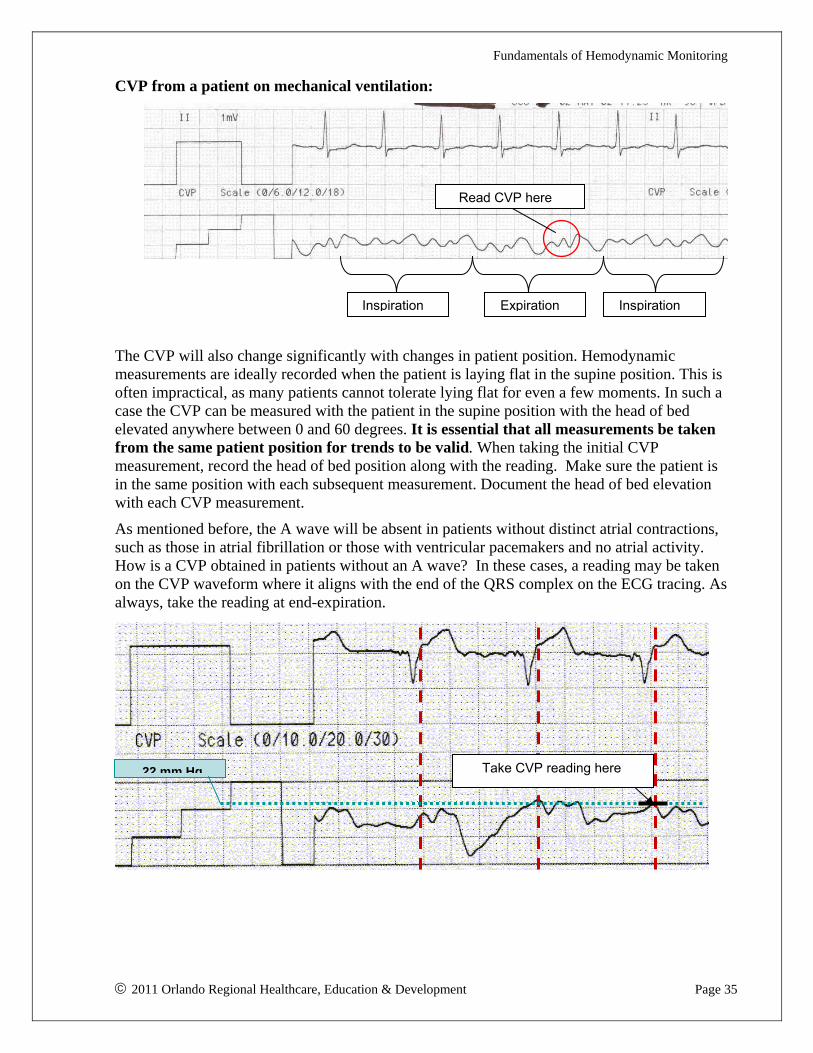
The CVP may vary considerably from inspiration to expiration due to changes in intrathoracic pressure. To eliminate this variation in readings, all hemodynamic measurements are taken at end-expiration. The most accurate method is to obtain an actual printout of the CVP waveform and ECG tracing and average the A wave at end-expiration. The CVP value is recorded at the midpoint in the X descent. The waveform below demonstrates how to determine where end-expiration occurs on the monitor strip. In spontaneously breathing patients the CVP baseline will fall during inspiration and rise during expiration. Take the measurement just prior to the baseline fall of inspiration.
Patients receiving positive-pressure ventilation exhibit baseline rise during inspiration with baseline fall during expiration. In these patients, take the reading just prior to the rise of inspiration. When in doubt as to which part of the patient’s waveform represents expiration, try this; place a hand on the patient’s chest while watching the CVP waveform on the monitor. Note whether the baseline rise is occurring on inspiration or expiration then take the measurement.
Measure CVP here
Expiration Inspiration
Fundamentals of Hemodynamic Monitoring
2011 Orlando Regional Healthcare, Education & Development Page 35
CVP from a patient on mechanical ventilation:
The CVP will also change significantly with changes in patient position. Hemodynamic measurements are ideally recorded when the patient is laying flat in the supine position. This is often impractical, as many patients cannot tolerate lying flat for even a few moments. In such a case the CVP can be measured with the patient in the supine position with the head of bed elevated anywhere between 0 and 60 degrees. It is essential that all measurements be taken from the same patient position for trends to be valid. When taking the initial CVP measurement, record the head of bed position along with the reading. Make sure the patient is in the same position with each subsequent measurement. Document the head of bed elevation with each CVP measurement.
As mentioned before, the A wave will be absent in patients without distinct atrial contractions, such as those in atrial fibrillation or those with ventricular pacemakers and no atrial activity. How is a CVP obtained in patients without an A wave? In these cases, a reading may be taken on the CVP waveform where it aligns with the end of the QRS complex on the ECG tracing. As always, take the reading at end-expiration.
Inspiration InspirationExpiration
Read CVP here
22 mm Hg Take CVP reading here
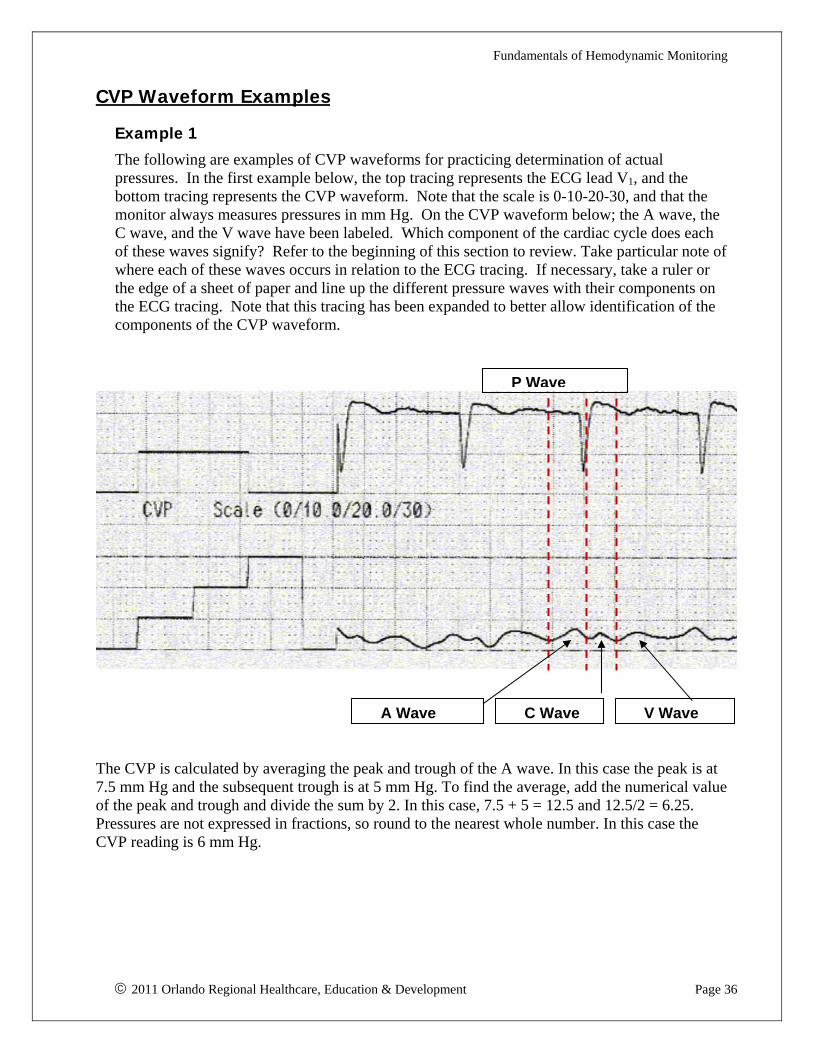
Fundamentals of Hemodynamic Monitoring
2011 Orlando Regional Healthcare, Education & Development Page 36
CVP Waveform Examples
Example 1
The following are examples of CVP waveforms for practicing determination of actual pressures. In the first example below, the top tracing represents the ECG lead V1, and the bottom tracing represents the CVP waveform. Note that the scale is 0-10-20-30, and that the monitor always measures pressures in mm Hg. On the CVP waveform below; the A wave, the C wave, and the V wave have been labeled. Which component of the cardiac cycle does each of these waves signify? Refer to the beginning of this section to review. Take particular note of where each of these waves occurs in relation to the ECG tracing. If necessary, take a ruler or the edge of a sheet of paper and line up the different pressure waves with their components on the ECG tracing. Note that this tracing has been expanded to better allow identification of the components of the CVP waveform.
The CVP is calculated by averaging the peak and trough of the A wave. In this case the peak is at 7.5 mm Hg and the subsequent trough is at 5 mm Hg. To find the average, add the numerical value of the peak and trough and divide the sum by 2. In this case, 7.5 + 5 = 12.5 and 12.5/2 = 6.25. Pressures are not expressed in fractions, so round to the nearest whole number. In this case the CVP reading is 6 mm Hg.
P Wave
C Wave V WaveA Wave

Fundamentals of Hemodynamic Monitoring
2011 Orlando Regional Healthcare, Education & Development Page 37
Example 2
In this example, the strip has been greatly enlarged to show greater detail. Locate the A wave, the C wave, and the V wave on the CVP tracing of this spontaneously breathing patient. Note once again that the A wave occurs immediately after the P wave on the ECG tracing above it, reflecting atrial contraction. Measure the CVP by averaging the peak and trough of the A wave. What pressure reading should be documented on this waveform? Check your answers against the waveform analysis on the following page.
Waveform Analysis Answer: Example 2
In this example, the A wave is identified by lining up the P wave from the ECG tracing above. Note that it would be impossible to identify the A wave correctly without the ECG tracing. In this strip the C wave is not always present; this is a normal variation.
Respiratory variation is slight, but present on this strip. Note that the pressure was read from the circled A wave. This A wave was selected because it is the last complete A wave before the
0
10
20
30
A
C
V
P wave
Expiration Inspiration
15 mm Hg 10 mm Hg

Fundamentals of Hemodynamic Monitoring
2011 Orlando Regional Healthcare, Education & Development Page 38
baseline falls. Recall that in spontaneously breathing patients the baseline drops during inspiration. In this case the peak of the A wave is at 15 mm Hg and the trough is at 10 mm Hg. The average of these two numbers is (15+10)/2 = 25/2 = 12.5. The CVP is rounded to 13 mm Hg.
Example 3
This waveform was taken from a patient on a mechanical ventilator. Identify the scale, the A wave, C wave (if present) and V wave, and calculate the CVP. Remember to make your measurement at end-expiration. In the mechanically ventilated patient the baseline falls during expiration. Compare your answers with the waveform analysis below.
Waveform Analysis Answer: Example 3
Note the difference in the appearance of the baseline change with mechanical ventilation. The A wave has been marked with a broken line and is followed by a C wave and a V wave. The scale was obtained using the optimize setting on the monitor and includes positive and negative pressures. The peak of the A wave is at 2 mm Hg and the trough is at -4 mm Hg. This gives a mean pressure of -1 mm Hg. There should not be a negative pressure generated by passive exhalation on mechanical ventilation. The correct intervention is to check the patient, then check the level of the transducer and re-level if needed.
Mechanical
-4 +2
+8 A V
Insp. Exp. Insp. Exp.
-10

Fundamentals of Hemodynamic Monitoring
2011 Orlando Regional Healthcare, Education & Development Page 39
Troubleshooting Whenever a change occurs in the waveform appearance or numeric readings always check the patient first. If the CVP is high, auscultate heart and lung sounds to assess for the development of murmurs, rales and an S3 or S4. If the CVP reading is low, examine other indices of fluid status, such as skin turgor, jugular vein distension, condition of mucous membranes, skin temperature and color, and pulse quality. If the patient’s assessment is unchanged and there is reason to believe that the waveform appearance or numeric values are not an accurate reflection of the patient’s status, begin by re-zeroing and re-leveling the transducer. If this does not resolve the issue, assess the system dynamics using a square wave test. For other common problems and possible solutions refer to Appendix 1 at the end of the packet.
Removal of Central Venous Catheters The central venous catheter should be removed as soon as it is no longer needed or if the site appears infected. In any case, it should not remain in place for longer than five days. A physician’s order is required for removal.
To remove the central venous catheter, obtain clean gloves and sterile gloves, sterile gauze squares, and materials for a dressing. Explain the procedure to the patient and instruct them to remain still. Place the patient flat to minimize the risk of air aspiration. Don clean gloves. Remove the dressing carefully and cleanse the site with sterile saline if needed. If sutures are in place, remove them carefully.
Instruct the patient to take a deep breath and hold it. If the patient is unable to perform a breath hold, time the removal of the catheter to coincide with a period of positive intrathoracic pressure. In spontaneously breathing patients this will occur during exhalation. In mechanically ventilated patients positive intrathoracic pressure occurs when the ventilator delivers a breath. This step is extremely important. If the catheter is removed during a period of negative intrathoracic pressure, an air embolus could be drawn in through the open tract.
While the patient holds his/her breath, remove the catheter smoothly. Once the catheter has been removed, apply moderate pressure with sterile gauze and tell the patient to resume breathing. Obtain any catheter cultures that have been ordered now. Usually the intercutaneous portion of the catheter is cultured. This is the portion of the catheter that tunneled through the skin. Sometimes a catheter tip culture is also requested.
After a minute or two, gently release the pressure. If there is no bleeding or swelling, apply a sterile dressing to the site according to the policies of your hospital. If bleeding or swelling is noted on release of pressure, immediately reapply the pressure and hold again. Longer pressure holds may be required for patients with low platelet counts or elevated PT/PTT. Apply a sterile dressing to the site. At this point the patient’s head may be elevated to a position of comfort.
Monitor the site after removal according to your hospital’s policies. Document the appearance of the site, the length of time required to achieve hemostasis, and the patient’s tolerance of the procedure in addition to vital signs. Also document the appearance of the catheter upon removal. Instruct the patient to notify the nurse if bleeding or pain occurs at the site. If bleeding or swelling is noted after removal, apply pressure again as previously described and notify the physician.

Fundamentals of Hemodynamic Monitoring
2011 Orlando Regional Healthcare, Education & Development Page 40
Hemodynamic Case Studies These cases will provide the opportunity to see how hemodynamic monitoring may assist in determining appropriate interventions for differing situations.
Case 1
You are caring for a 29-year old male patient with a BP of 74/30. What should you do about his hypotension? You can’t be sure without knowing the reason for it. In addition, the CVP reading is 1 mm Hg. This additional information indicates that the patient has a diminished blood volume returning to the right heart, but still doesn’t tell you what interventions should receive the highest priority. Further assessment reveals that the patient received approximately 10-12 bee stings approximately 15 minutes ago and has a pre-existing allergy to bee stings. You now correctly determine that the patient is in anaphylactic shock, and that he is hypotensive not because he has lost blood volume, but because anaphylaxis results in massive vasodilation and decreased blood return to the right atrium. Note the patient’s pulse pressure; it is wide, indicating arterial vasodilation. Taking all the data into consideration allows you to intervene appropriately with epinephrine, antihistamines, and IV fluids to fill the vascular space.
Case 2
You are caring for a 79-year old male patient with a BP of 74/50. Should you treat him in the same manner as the patient in case 1 because he is hypotensive? Note that the pulse pressure is much narrower in this case, indicating vasoconstriction and increased left ventricular afterload. Additional information includes a CVP reading of 15 mm Hg. What does this tell us? Only that we have an increased right ventricular end diastolic pressure. We don’t yet know if this is due to MI, fluid overload, valvular disease, COPD, pericardial tamponade or a pneumothorax, since all of these can cause the combination of an elevated CVP with hypotension. However, as we continue our patient assessment we will assess heart and lung sounds, peripheral pulses, skin condition, etc. Our assessment reveals heart sounds to be S1-S2-S3-S4; lung sounds include bilateral rales approximately ½ up. Upon examining peripheral pulses, we note them to be weak but find that our patient has 2+ bilateral pedal pitting edema. This patient has symptoms of heart failure and elevated right ventricular preload and will likely benefit from positive inotropic agents and diuretic therapy. Vasodilators might also be used to diminish the venous return to the heart, but their use will require caution due to his hypotension.
Case 3
You are caring for a 63-year old female with a BP of 84/70 and a CVP of 24 mm Hg. Should we diurese this patient because she has an elevated CVP? History reveals that she was admitted last night with a diagnosis of acute inferior wall MI. Your assessment reveals that her lungs are clear, and heart sounds reveal S1-S2 with a pansystolic murmur over the left lower sternal border. So what do we do? The CVP alone would seem to indicate fluid overload and the need for diuretics. However, based on your assessment findings, the physician orders an echocardiogram that reveals tricuspid regurgitation due to papillary muscle dysfunction caused by the MI. In this case, diuretics would greatly diminish the amount of blood reaching the left ventricle and would then result in a significant decrease in cardiac output, shock and possibly death. The results of the echocardiogram lead the physician to consult a cardiac surgeon for an immediate valve replacement.

Fundamentals of Hemodynamic Monitoring
2011 Orlando Regional Healthcare, Education & Development Page 41
Conclusion In addition to the guidelines contained in this packet, there are many other considerations in the insertion, management and removal of invasive lines. Check your hospital’s guidelines, policies, and procedures for other essential information regarding central lines, such as the manner in which fluids or drugs are administered through a central line, which nursing personnel may access a central line and how to perform dressing changes.
Hemodynamic monitoring does not take the place of careful nursing assessment. Using hemodynamic data without regard to patient assessment findings can result in harm. Thorough nursing assessment provides the framework for interpretation of hemodynamic data and aids in selection of interventions that enhance patient outcomes.

Fundamentals of Hemodynamic Monitoring
2011 Orlando Regional Healthcare, Education & Development Page 42
Glossary “A” wave: The portion of the CVP waveform caused by atrial contraction; located just after the P wave on the ECG tracing. The “A” wave is averaged to obtain the CVP.
“C” wave: The portion of the CVP waveform caused by closure of the tricuspid valve; located between the “A” and “V” waves. It may not always be present.
“V” wave: The portion of the CVP waveform caused by passive atrial filling. The “V” wave occurs during ventricular systole and appears just after the QRS complex on the ECG waveform.
Afterload: The resistance the ventricle must overcome to eject its volume of blood. Afterload is most strongly affected by vascular resistance.
Allen’s test: A clinical assessment of ulnar arterial blood flow
Amplitude: Height of a waveform
Amplitude ratio: Comparison of the height of the first and second oscillations after a square-wave test. It is used in analysis of system dynamics.
Anacrotic limb: The portion of the arterial waveform that coincides with ventricular ejection
Atmospheric pressure: The pressure exerted on all objects by the weight of the earth’s atmosphere. The atmospheric pressure varies with altitude.
Cardiac Output: The amount of blood pumped out of the heart in one minute. The cardiac output is the product of the heart rate times the stroke volume.
Central venous pressure (CVP): The pressure of blood in the superior or inferior vena cava just before it enters the right atrium.
Compliance: The ability of a tissue to stretch
Contractility: The inherent ability of a muscle fiber to forcefully contract.
Dicrotic notch: The portion of the arterial waveform caused by closure of the aortic valve
Distal port: The port on a catheter that is farthest away from the catheter hub, usually at the tip of the catheter.
Fling: See Underdamped
Hydrostatic pressure: The pressure exerted by the weight of a fluid. In hemodynamics, it is the pressure exerted by the column of fluid between the patient and the transducer.
Inotropic: Affecting contractility; a positive inotropic effect increases contractility and a negative inotropic effect decreases it.
Manometer: Pressure gauge
Mean arterial pressure: The average pressure throughout the arterial tree during systole and diastole. Mean arterial pressure is fairly uniform throughout the arterial tree, and is a better marker of perfusion than systolic blood pressure.
Natural frequency: The frequency with which a system responds to a stimulus.
Oscillations: Rapid up-and-down changes in a waveform. In hemodynamics, refers to the waveform immediately following the square-wave test.

Fundamentals of Hemodynamic Monitoring
2011 Orlando Regional Healthcare, Education & Development Page 43
Overdamped: Sluggish, under-responsive. An overdamped hemodynamic monitoring system will yield false low systolic pressures and false high diastolic pressures; normal waveform components may appear slurred or be absent.
Phlebostatic axis: The approximate anatomic location of the heart, located at the fourth intercostal space, halfway between the anterior and posterior chest wall.
Preload: The amount of stretch on the cardiac myofibril at the end of diastole. Preload is most closely related to fluid volume present in the ventricle but is commonly measured as pressure. The CVP reflects the preload of the right ventricle.
Pulse pressure: The difference between the systolic and diastolic blood pressure. Pulse pressure is wide (high) in vasodilated states and narrow (low) in vasoconstricted states.
Square-wave test: A series of rapid fast-flushes of the hemodynamic monitoring system used to assess the system’s response to sudden large changes in pressure.
Stroke volume: The amount of blood pumped with each heartbeat
System dynamics: The response of a system to an extreme stimulus. In hemodynamics, system dynamics are evaluated using the square-wave test.
Titrate: Adjust therapy in response to a prescribed parameter. This term is generally used in reference to IV drugs that are adjusted frequently based on a prescribed parameter such as blood pressure.
Transducer: A device that converts pressure waves or pulses into a digital signal that can be displayed as a waveform on a monitor.
Underdamped: also described as hyperdynamic, hyper-responsive. An underdamped hemodynamic monitoring system will yield false high systolic pressures and false low diastolic pressures. This phenomenon is also called catheter “whip” or “fling”.
Whip: See Underdamped

Fundamentals of Hemodynamic Monitoring
2011 Orlando Regional Healthcare, Education & Development Page 44
References Alspach, J., et. al. (2006). AACN Core Curriculum for Critical Care Nursing. Philadelphia, PA:
W.B. Saunders.
McGhee, B. H. & Bridges, E. J. (2002). Monitoring arterial blood pressure: What you may not know. Critical Care Nurse, 22(2), 60-79.
Diehl, T. S. (Ed) (2011) Hemodynamic Monitoring Made Easy (2nd ed). Ambler, PA: Lippincott, Williams, & Wilkins
Lynn-McHale Wiegand, D., (2011) AACN Procedure Manual for Critical Care. Philadelphia, PA: Elsevier Saunders.
Sole, Mary Lou, et. al. (2008). Introduction to Critical Care Nursing (5th ed). Philadelphia, PA: W.B. Saunders.
Lough, M. E., Stacy, K. M., & Urden, L. D. (2010). Critical Care Nursing: Diagnosis and Management (6th ed.). St. Louis: Mosby.
Puntillo, K. A., & Schell, H. M. (2006). Critical Care Nursing Secrets (2nd ed). Philadelphia, PA: Hanley & Belfus.
Carlson, K.K, et. al. (2009). AACN Advanced Critical Care Nursing. St. Louis, MO: Saunders Elsevier.

Fundamentals of Hemodynamic Monitoring
2011 Orlando Regional Healthcare, Education & Development Page 45
Posttest Please submit your answers via the online testing center found on the E-Learning page in Swift.
1. The pressure bag around the flush solution for a transduced hemodynamic monitoring
system is correctly maintained at what pressure? A. 3-5 mm Hg B. 150 mm Hg C. 180 mm Hg D. 300 mm Hg
2. Which of the following solutions is most commonly used as the continuous flush for transduced hemodynamic monitoring systems? A. Normal saline B. Lactated ringers C. D51/4 Normal saline D. D51/2 Normal saline
3. When setting up pressure monitoring system, it is important to use pressure (semi-rigid) tubing because: A. Use of standard IV tubing may result in an overdamped waveform B. Standard IV tubing will not connect properly to the transducer hub C. Use of standard IV tubing may result in catheter whip and overestimation of the
patient’s systolic blood pressure D. Standard IV tubing may allow leaking of blood from the system
4. The transducer from a hemodynamic monitoring system should be leveled at which of the
following locations? A. 2nd intercostal space at the midclavicular line B. 2nd intercostal space at the mid-chest C. 4th intercostal space at the mid-chest D. 4th intercostal space at the midaxillary line
5. The square-wave test is a method of assessing which of the following about a transduced
hemodynamic monitoring system? A. Zeroing of the system B. Dynamic response of the system C. Harmonic response of the system D. Compensation for atmospheric pressure within the system

Fundamentals of Hemodynamic Monitoring
2011 Orlando Regional Healthcare, Education & Development Page 46
6. Overdamping of the hemodynamic monitoring system may result in: A. A false low systolic and false high diastolic pressure reading B. A falsely high systolic and falsely low diastolic pressure reading C. A falsely low systolic pressure reading D. A falsely low diastolic pressure reading
7. What could potentially occur when underdamping of a patient’s intra-arterial line setup is
present? A. Overestimation of the patient’s blood pressure and a false widened pulse pressure B. Improper administration of diuretics to reduce volume overload C. Underestimation of the patient’s blood pressure D. Clotting of the catheter tip
8. Air bubbles in the transducer or connecting tubing may cause :
A. Clotting at the catheter tip B. Overdamping of the pressure waveform C. Underdamping of the pressure waveform D. Overestimation of the patient’s systolic pressure
9. Which of the following represents a relative contraindication for the use of invasive
arterial monitoring? A. Presence of an intra-aortic balloon pump B. Current or recent or use of fibrinolytics and anticoagulants C. Hemodynamic instability D. Recent CVA or head trauma
10. A narrow pulse pressure is associated with:
A. Low afterload states B. Arterial vasodilation C. Low heart rates D. High afterload states
11. You suspect that a clot has formed at the tip of your patient’s intra-arterial catheter. Which
of the following interventions should receive the highest priority at this time? A. “Fast flush” using the intraflow valve for 2-3 seconds B. Inflate the pressure bag to at least 300 mm Hg C. Attempt to manually aspirate the clot with a syringe D. Attempt to manually flush the line with a syringe using no more than 5-10 cc of
flush solution
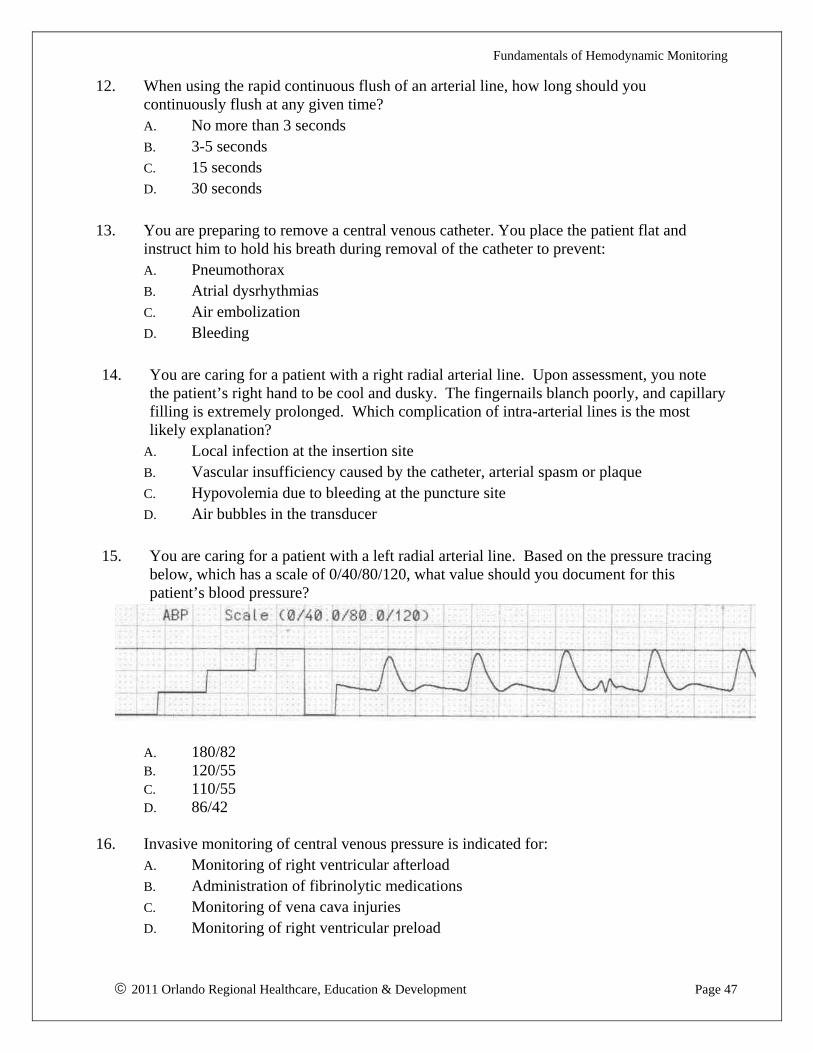
Fundamentals of Hemodynamic Monitoring
2011 Orlando Regional Healthcare, Education & Development Page 47
12. When using the rapid continuous flush of an arterial line, how long should you continuously flush at any given time? A. No more than 3 seconds B. 3-5 seconds C. 15 seconds D. 30 seconds
13. You are preparing to remove a central venous catheter. You place the patient flat and instruct him to hold his breath during removal of the catheter to prevent: A. Pneumothorax B. Atrial dysrhythmias C. Air embolization D. Bleeding
14. You are caring for a patient with a right radial arterial line. Upon assessment, you note the patient’s right hand to be cool and dusky. The fingernails blanch poorly, and capillary filling is extremely prolonged. Which complication of intra-arterial lines is the most likely explanation?
A. Local infection at the insertion site B. Vascular insufficiency caused by the catheter, arterial spasm or plaque C. Hypovolemia due to bleeding at the puncture site D. Air bubbles in the transducer
15. You are caring for a patient with a left radial arterial line. Based on the pressure tracing
below, which has a scale of 0/40/80/120, what value should you document for this patient’s blood pressure?
A. 180/82 B. 120/55 C. 110/55 D. 86/42
16. Invasive monitoring of central venous pressure is indicated for:
A. Monitoring of right ventricular afterload B. Administration of fibrinolytic medications C. Monitoring of vena cava injuries D. Monitoring of right ventricular preload

Fundamentals of Hemodynamic Monitoring
2011 Orlando Regional Healthcare, Education & Development Page 48
17. The CVP of a patient in normal sinus rhythm is calculated by averaging the:
A. Peak and trough of the A wave B. Peak and trough of the V wave C. Top of the V waves during inspiration D. Midpoint of the Y descent
18. The central venous pressure (CVP) most closely reflects:
A. Volume within the right ventricle just before ventricular contraction B. Pressure within the right ventricle just before ventricular contraction C. The volume of blood ejected from the right ventricle during systole D. The resistance to ejection of blood from the right ventricle during systole
19. Which of the following conditions can cause an increase in the CVP?
A. Arterial vasoconstriction, tachycardia and decreased preload B. Arterial vasoconstriction, decreased contractility, and elevated preload C. Arterial vasodilation, tachycardia and bronchospasm D. Arterial vasodilation, venous vasodilation and third spacing
20. Which of the following conditions can cause a decrease in the CVP?
A. Pneumothorax B. Tricuspid regurgitation C. Pulmonary hypertension D. Severe sepsis
21. You are caring for a 71-year old female patient who was admitted with a diagnosis of
COPD and respiratory failure. Her cardiac monitor shows atrial fibrillation with a ventricular response of 90-100. In this case, the CVP is read by drawing a vertical line to the CVP waveform from the A. Beginning of the P wave on the ECG B. End of the P wave on the ECG C. End of the QRS on the ECG D. Beginning of the T wave on the ECG
22. Numeric values should be taken from the hemodynamic waveform:
A. While the patient holds his breath B. With the patient flat C. At end-inspiration D. At end-expiration

Fundamentals of Hemodynamic Monitoring
2011 Orlando Regional Healthcare, Education & Development Page 49
23. According to the waveform below, the CVP is:
A. 6 mm Hg B. 8 mm Hg C. 12 mm Hg D. 17 mm Hg
24. You are caring for a patient in normal sinus rhythm with a central venous catheter who is
on a mechanical ventilator. The CVP waveform rises and falls with the patient’s respiratory cycle. The monitor gives a digital CVP reading of 32. How can you most accurately determine the correct CVP reading? A. Take the CVP reading immediately following the QRS complex B. Take the CVP reading by averaging the peak and trough of the A wave closest to
the end of expiration C. Determine the average of the CVP reading throughout the respiratory cycle D. Report the value of the lowest point on the CVP tracing
25. You are caring for a post-operative patient following vascular surgery who has a right
radial intra-arterial line. The monitor has been displaying an intra-arterial blood pressure of approximately 128/70 for the past two hours since the patient returned from PACU. Unexpectedly, the monitor alarms and displays an intra-arterial blood pressure of 64/40. Which of the following actions should receive the highest priority at this time? A. Pull back, rotate, or reposition the catheter B. Place the patient flat in bed and level the transducer at the phlebostatic axis C. Assess the patient for signs of low blood pressure, then check the system D. Open the patient’s IV wide to provide intravascular volume and restore fluid
balance
Spontaneous Ventilation

Fundamentals of Hemodynamic Monitoring
2011 Orlando Regional Healthcare, Education & Development Page 50
Appendix 1: Troubleshooting Arterial and CVP Monitoring Systems
Overdamping or absent pressure wave form
Causes Prevention Intervention Catheter tip against vessel wall
Secure catheter after insertion to prevent movement
Pull back, rotate, or reposition catheter
Partial occlusion of catheter due to clot formation
Eliminate kinks from tubing
Use continuous flush device under 300 mm Hg pressure
Consider heparinized flush solution
Aspirate clot with a syringe. Then flush line for 2-3 seconds using the intraflow valve
Positional catheter Immobilize area of catheter insertion
Securely tape catheter at insertion site
Reposition external portion of catheter (CVP)
Reposition patient to eliminate kinks in the monitoring catheter
Air bubbles in transducer or connector tubing
Carefully flush transducer and tubing during set-up
Maintain tight connections
Do not allow flush solution bag to completely empty
Keep flush solution drip chamber completely full
Check system, aspirate air, close system to patient, disconnect transducer and flush out air bubbles, reconnect system maintaining sterility, inspect for any bubbles and aspirate if needed, fast flush
Pressure bag not at 300 mm Hg
Maintain pressure bag at 300 mm Hg Inflate pressure bag to 300 mm Hg
Stopcock turned off Maintain stopcocks in proper position
Keep stopcocks visible and out of reach of patient
Turn stopcock to proper position
Transducer placed too high
Maintain transducer at the level of the 4th intercostal space at mid-chest (phlebostatic axis)
Return transducer to proper level
Improper scale Maintain scale to approximate expected pressures. Scales that are much higher than the pressure displayed will cause waveform components to disappear.
Adjust scale to approximate pressure to obtain adequate waveform
Tubing or connections loosened
Prevent tubing from kinking; maintain tight connections
Tighten all connections; straighten any kinks in tubing

Fundamentals of Hemodynamic Monitoring
2011 Orlando Regional Healthcare, Education & Development Page 51
Excessively high pressure waveform (including catheter whip or fling)
Causes Prevention Intervention Excessive catheter movement in vessel, excessive tubing length, catheter too small for vessel
Use optimal size catheter for artery, and correct semi-rigid tubing; Do not use excess extension tubing
Reduce tubing length by removing any extensions and stopcocks that are not necessary, observe for and remove micro-bubbles from tubing
Transducer placed too low
Maintain transducer at the level of the 4th intercostal space at mid-chest (known as the phlebostatic axis)
Return transducer to proper level
Inability to flush line or to withdraw blood
Causes Prevention Intervention Clot on catheter tip, kinked tubing, incorrect stopcock positioning, catheter bent or positional, inadequate pressure in pressure bag
Maintain
pressure bag at 300 mm Hg stopcock and tubing in proper
position joint at insertion site in straight
line position
Check position of stopcocks, tubing and joint underlying insertion site; use immobilization device if necessary; check pressure in pressure bag and inflate to 300 mm Hg if necessary.
If problem cannot be resolved, notify physician and prepare for possible removal of catheter; label affected ports “do not use”
Fundamentals of Hemodynamic Monitoring
2011 Orlando Regional Healthcare, Education & Development Page 52
Appendix 2: Accurate Measurement of Noninvasive Blood Pressure In order to obtain an accurate blood pressure measurement the equipment must be functioning correctly. If a mercury manometer is used, check that there is no cloudiness in the chamber, the meniscus is exactly at zero and the meniscus can be viewed at eye level. If an aneroid manometer is used, check that the needle is at zero at the start and end of the pressure measurement, and position the manometer in your direct line of vision. Suspect a cuff leak if the pressure on the manometer does not rise steadily as the cuff is inflated. Also, check to see that the screw valve on the bulb is functioning well.
Follow these steps to take accurate blood pressure measurements:
1. Select the appropriate size cuff. Compare the length of the bladder inside the cuff with the circumference of the patient’s arm. If the bladder is at least 80% of arm circumference and does not overlap itself, the size is correct. A cuff that is too small will cause a false high reading and a cuff that is too large will result in a false low reading.
2. Palpate the brachial artery along the inner arm. Avoid measuring blood pressures in an arm that has an I.V., shunt, edema, injury or paralysis.
3. Wrap the cuff smoothly and snugly around the upper arm, centering the bladder over the brachial artery. Don’t place the cuff over clothing or let a rolled-up sleeve constrict the arm. The lower cuff edge should be one inch above the antecubital space. Instruct the patient not to talk during the measurement. Support the patient’s arm at the level of his heart, and flex the elbow slightly.
4. Determine the level of maximum inflation by rapidly inflating the cuff until you can no longer feel the brachial pulse, and add 30 mm Hg to that reading.
5. Deflate the cuff rapidly and and steadily, then wait 15 – 30 seconds before reinflating. 6. Insert the earpieces of the stethoscope, making sure they point forward and apply the bell of
the stethoscope lightly but with complete contact over the brachial pulse. Korotkoff’s sounds are low frequency and may be missed when listening with the diaphragm of the stethoscope.
7. Inflate the cuff rapidly and steadily to the level of maximum inflation determined in step 4. 8. Release the air slowly so the pressure falls at a rate of 2 – 3 mm Hg per second, listening
for the onset of at least two consecutive beats. Note the closest mark on the manometer, this is the systolic pressure.
9. Listen for the cessation of sound (or a muffling of sound in children), this is the diastolic pressure. Continue listening for 10 – 20 mm Hg below the last sound to confirm the reading, then make sure to deflate the cuff rapidly and completely.
10. If you need to repeat the measurement, wait 1 – 2 minutes so the blood trapped in the arm veins can be released.
If an automatic blood pressure cuff is used, follow the same procedure for finding the correct size and placing the cuff on the arm. Automatic cuff measurements are frequently inaccurate. If an automatic cuff is used, an initial pressure reading must be compared to a blood pressure obtained using a manual cuff. If there is more than 10 mm Hg difference between the automatic and manual cuff measurements, the automatic cuff should not be used. When using an automatic cuff, remove the cuff from the arm after each measurement to prevent skin breakdown. If frequent automatic cuff measurements must be taken, remove the cuff as soon as clinically feasible. If frequent blood pressure measurements are required for a period longer than a few hours, consider whether invasive measurement of blood pressure is warranted.