Embed Size (px)
Citation preview
2014-15 School Accountability Report Card for Helen Estock Elementary School Page 1 of 13
Helen Estock Elementary School
School Accountability Report Card
Reported Using Data from the 2014-15 School Year
Published During 2015-16
By February 1 of each year, every school in California is required by state law to publish a School Accountability Report Card (SARC). The SARC contains information about the condition and performance of each California public school. Under the Local Control Funding Formula (LCFF) all local educational agencies (LEAs) are required to prepare a Local Control Accountability Plan (LCAP), which describes how they intend to meet annual school-specific goals for all pupils, with specific activities to address state and local priorities. Additionally, data reported in an LCAP is to be consistent with data reported in the SARC. • For more information about SARC requirements, see the California Department of Education (CDE) SARC Web page at
http://www.cde.ca.gov/ta/ac/sa/. • For more information about the LCFF or LCAP, see the CDE LCFF Web page at http://www.cde.ca.gov/fg/aa/lc/. • For additional information about the school, parents/guardians and community members should contact the school principal or
the district office. DataQuest DataQuest is an online data tool located on the CDE DataQuest Web page at http://dq.cde.ca.gov/dataquest/ that contains additional information about this school and comparisons of the school to the district, the county, and the state. Specifically, DataQuest is a dynamic system that provides reports for accountability (e.g., test data, enrollment, high school graduates, dropouts, course enrollments, staffing, and data regarding English learners. Internet Access Internet access is available at public libraries and other locations that are publicly accessible (e.g., the California State Library). Access to the Internet at libraries and public locations is generally provided on a first-come, first-served basis. Other use restrictions may include the hours of operation, the length of time that a workstation may be used (depending on availability), the types of software programs available on a workstation, and the ability to print documents.
About This School Contact Information (Most Recent Year)
School Contact Information
School Name------- Helen Estock Elementary School
Street------- 14741 North B Street
City, State, Zip------- Tustin, CA 92780
Phone Number------- (714) 730-7390
Principal------- Beth Rabel Blackman
E-mail Address------- [email protected]
Web Site------- http://www.tustin.k12.ca.us/estockes
Grades Served TK-5
CDS Code 30-73643-6030613
2014-15 School Accountability Report Card for Helen Estock Elementary School Page 2 of 13
District Contact Information
District Name------- Tustin Unified School District
Phone Number------- (714) 730-7301
Superintendent-------
Gregory A. Franklin, Ed.D.
E-mail Address------- [email protected]
Web Site------- http://www.tustin.k12.ca.us
School Description and Mission Statement (Most Recent Year)
Helen Estock Elementary was named to honor an eighth grade history teacher in the district (1940-1961). The school is located on 12.4 acres near Old Town Tustin and was opened in 1964. Helen Estock Elementary educates around 350 scholars in grades kindergarten through fifth. The Estock Elementary community is dedicated to mindfully and compassionately engaging, elevating, and supporting all learners. Our Mission Statement at Helen Estock Elementary School is to create a rich and rigorous learning environment that reaches all learners. We foster a safe and positive community where scholars take ownership of their learning taking risks, persevering, reflecting, and collaborating. We, the parents, students, and staff, commit to empower each other on our journey to success. Student Enrollment by Grade Level (School Year 2014-15)
Grade Number of
Level Students
Kindergarten 68
Grade 1 49
Grade 2 58
Grade 3 74
Grade 4 71
Grade 5 64
Total Enrollment 384
Student Enrollment by Group (School Year 2014-15)
Student Percent of
Group Total Enrollment
Black or African American 2.3
Asian 1
Filipino 1
Hispanic or Latino 89.1
Native Hawaiian or Pacific Islander 0.5
White 4.9
Two or More Races 0.8
Socioeconomically Disadvantaged 89.3
English Learners 58.1
Students with Disabilities 10.7
Foster Youth 0.3
2014-15 School Accountability Report Card for Helen Estock Elementary School Page 3 of 13
A. Conditions of Learning
State Priority: Basic The SARC provides the following information relevant to the Basic State Priority (Priority 1): • Degree to which teachers are appropriately assigned and fully credentialed in the subject area and for the pupils they are
teaching; • Pupils have access to standards-aligned instructional materials; and • School facilities are maintained in good repair. Teacher Credentials
Teachers School District
2013-14 2014-15 2015-16 2015-16
With Full Credential 14 14 15 914
Without Full Credential 0 0 0 0
Teaching Outside Subject Area of Competence (with full credential) 0 0 0 63
Teacher Misassignments and Vacant Teacher Positions
Indicator 2013-14 2014-15 2015-16
Misassignments of Teachers of English Learners 0 0 0
Total Teacher Misassignments * 0 0 0
Vacant Teacher Positions 0 0 0 Note: “Misassignments” refers to the number of positions filled by teachers who lack legal authorization to teach that grade level, subject area, student group, etc. * Total Teacher Misassignments includes the number of Misassignments of Teachers of English Learners. Core Academic Classes Taught by Highly Qualified Teachers (School Year 2014-15)
Location of Classes Percent of Classes In Core Academic Subjects
Taught by Highly Qualified Teachers Not Taught by Highly Qualified Teachers
This School 100.0 0.0
All Schools in District 100.0 0.0
High-Poverty Schools in District 100.0 0.0
Low-Poverty Schools in District 100.0 0.0 Note: High-poverty schools are defined as those schools with student eligibility of approximately 40 percent or more in the free and reduced price meals program. Low-poverty schools are those with student eligibility of approximately 39 percent or less in the free and reduced price meals program.
2014-15 School Accountability Report Card for Helen Estock Elementary School Page 4 of 13
Quality, Currency, Availability of Textbooks and Instructional Materials (School Year 2015-16) Year and month in which data were collected: October 12, 2015 On October 12, 2015, the Tustin Unified School District Board of Education verified by resolution that each student at this school has a textbook and/or instructional materials for each core subject area that are aligned to the content and cycles of the curriculum framework adopted by the State of California.
Core Curriculum Area Textbooks and Instructional Materials/
Year of Adoption
From Most Recent
Adoption?
Percent of Students Lacking Own
Assigned Copy
Reading/Language Arts State-Adopted Textbooks
Textbooks and support materials are state-adopted and consistent with the content and cycles of the curriculum frameworks adopted by the State Board of Education. The school district has purchased and provided each student with textbooks and materials in this subject area that are aligned to state standards. Houghton Mifflin Reading: California, Medallion Edition (2010 is the state adopted textbook for the District).
Supplemental Textbooks and Materials
Susana Dutro Systematic ELD curriculum and Kits and EL Achieve lesson plans are used as supplemental materials for English Language Learners. Additionally, GATEWAYs is used in upper grade SDC class.
Yes 0%
Mathematics State-Adopted Textbooks
Textbooks and support materials are state-adopted and consistent with the content and cycles of the curriculum frameworks adopted by the State Board of Education. The school district has purchased and provided each student with textbooks and materials in this subject area that are aligned to state standards. Houghton Mifflin Harcourt California Math Expressions Common Core (2015) is the state adopted core curriculum for the district.
Supplemental Textbooks and Materials
In mathematics, we are using Math Pacing Guides developed through the University of California, Irvine Math Project, which provide standards-based alignment with our Houghton-Mifflin math text, as well as manipulative based, experiential learning activities.
Yes 0%
2014-15 School Accountability Report Card for Helen Estock Elementary School Page 5 of 13
Core Curriculum Area Textbooks and Instructional Materials/
Year of Adoption
From Most Recent
Adoption?
Percent of Students Lacking Own
Assigned Copy
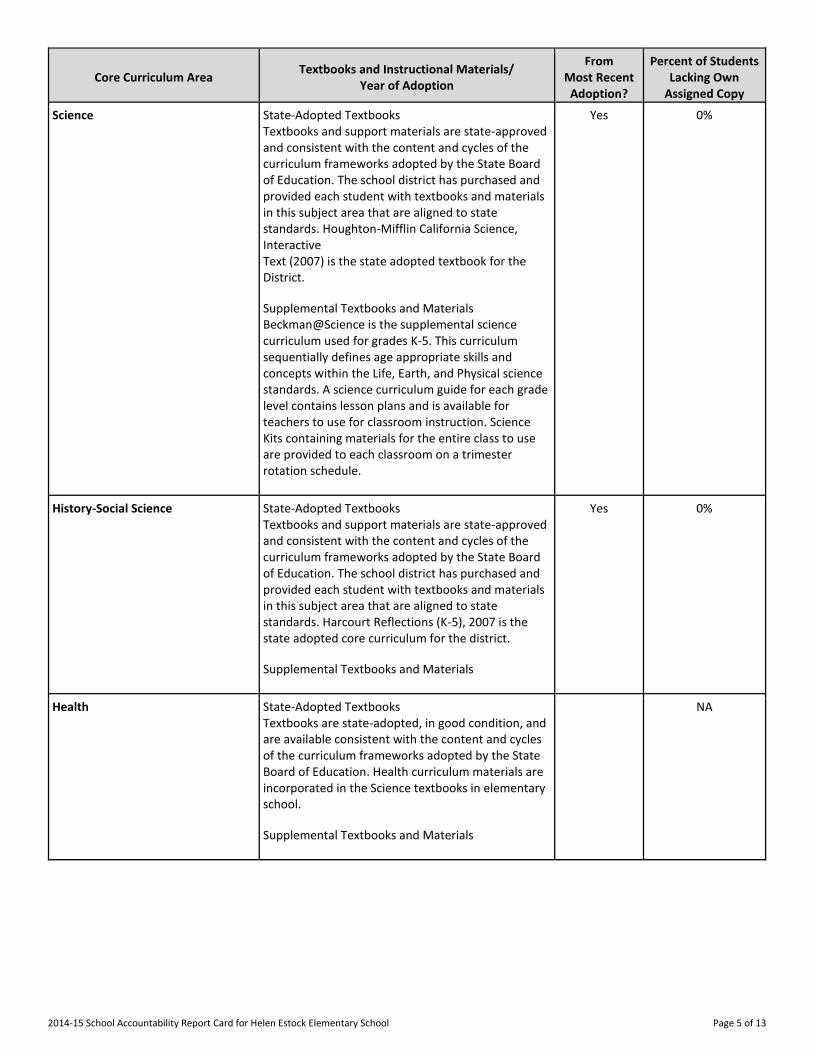
Science State-Adopted Textbooks
Textbooks and support materials are state-approved and consistent with the content and cycles of the curriculum frameworks adopted by the State Board of Education. The school district has purchased and provided each student with textbooks and materials in this subject area that are aligned to state standards. Houghton-Mifflin California Science, Interactive
Text (2007) is the state adopted textbook for the District.
Supplemental Textbooks and Materials
Beckman@Science is the supplemental science curriculum used for grades K-5. This curriculum sequentially defines age appropriate skills and concepts within the Life, Earth, and Physical science standards. A science curriculum guide for each grade level contains lesson plans and is available for teachers to use for classroom instruction. Science Kits containing materials for the entire class to use are provided to each classroom on a trimester rotation schedule.
Yes 0%
History-Social Science State-Adopted Textbooks
Textbooks and support materials are state-approved and consistent with the content and cycles of the curriculum frameworks adopted by the State Board of Education. The school district has purchased and provided each student with textbooks and materials in this subject area that are aligned to state standards. Harcourt Reflections (K-5), 2007 is the state adopted core curriculum for the district.
Supplemental Textbooks and Materials
Yes 0%
Health State-Adopted Textbooks
Textbooks are state-adopted, in good condition, and are available consistent with the content and cycles of the curriculum frameworks adopted by the State Board of Education. Health curriculum materials are incorporated in the Science textbooks in elementary school.
Supplemental Textbooks and Materials
NA
2014-15 School Accountability Report Card for Helen Estock Elementary School Page 6 of 13
Core Curriculum Area Textbooks and Instructional Materials/
Year of Adoption
From Most Recent
Adoption?
Percent of Students Lacking Own
Assigned Copy
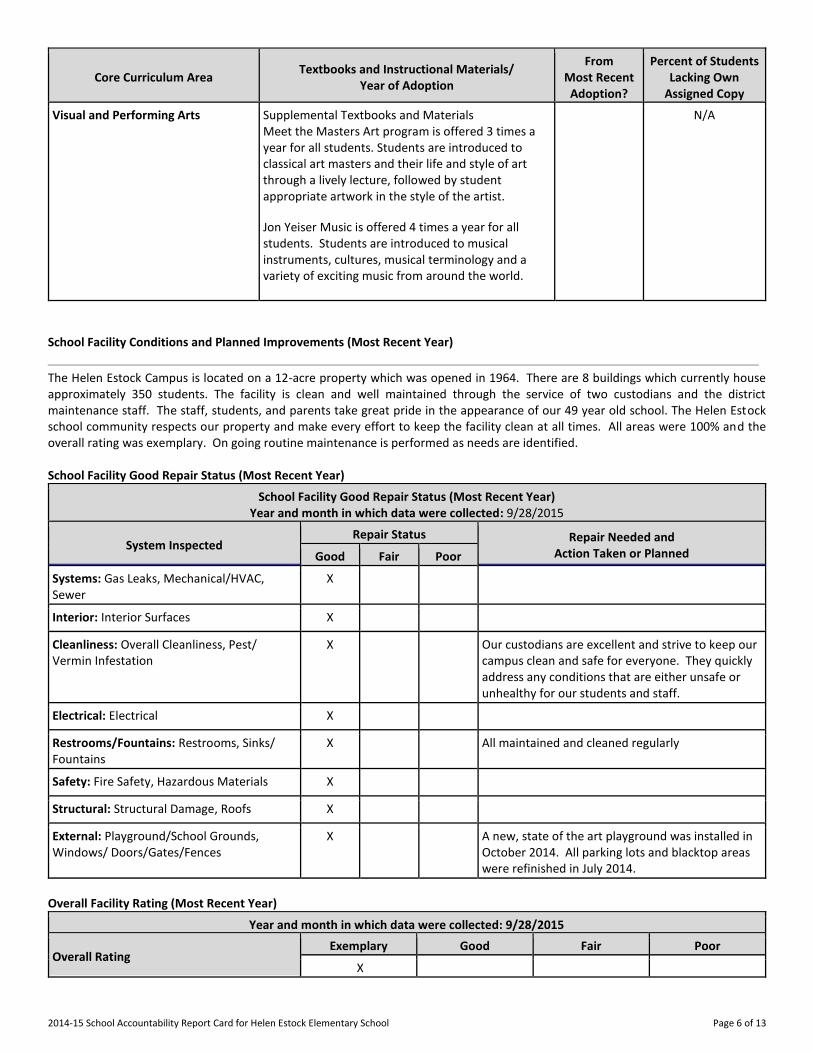
Visual and Performing Arts Supplemental Textbooks and Materials
Meet the Masters Art program is offered 3 times a year for all students. Students are introduced to classical art masters and their life and style of art through a lively lecture, followed by student appropriate artwork in the style of the artist.
Jon Yeiser Music is offered 4 times a year for all students. Students are introduced to musical instruments, cultures, musical terminology and a variety of exciting music from around the world.
N/A
School Facility Conditions and Planned Improvements (Most Recent Year)
The Helen Estock Campus is located on a 12-acre property which was opened in 1964. There are 8 buildings which currently house approximately 350 students. The facility is clean and well maintained through the service of two custodians and the district maintenance staff. The staff, students, and parents take great pride in the appearance of our 49 year old school. The Helen Estock school community respects our property and make every effort to keep the facility clean at all times. All areas were 100% and the overall rating was exemplary. On going routine maintenance is performed as needs are identified. School Facility Good Repair Status (Most Recent Year)
School Facility Good Repair Status (Most Recent Year) Year and month in which data were collected: 9/28/2015
System Inspected Repair Status Repair Needed and
Action Taken or Planned Good Fair Poor
Systems: Gas Leaks, Mechanical/HVAC, Sewer
X
Interior: Interior Surfaces X
Cleanliness: Overall Cleanliness, Pest/ Vermin Infestation
X Our custodians are excellent and strive to keep our campus clean and safe for everyone. They quickly address any conditions that are either unsafe or unhealthy for our students and staff.
Electrical: Electrical X
Restrooms/Fountains: Restrooms, Sinks/ Fountains
X All maintained and cleaned regularly
Safety: Fire Safety, Hazardous Materials X
Structural: Structural Damage, Roofs X
External: Playground/School Grounds, Windows/ Doors/Gates/Fences
X A new, state of the art playground was installed in October 2014. All parking lots and blacktop areas were refinished in July 2014.
Overall Facility Rating (Most Recent Year)
Year and month in which data were collected: 9/28/2015
Overall Rating Exemplary Good Fair Poor
X
2014-15 School Accountability Report Card for Helen Estock Elementary School Page 7 of 13
B. Pupil Outcomes
State Priority: Pupil Achievement The SARC provides the following information relevant to the State priority: Pupil Achievement (Priority 4): • Statewide assessments (i.e., California Assessment of Student Performance and Progress [CAASPP], Science California Standards
Tests); and • The percentage of pupils who have successfully completed courses that satisfy the requirements for entrance to the University
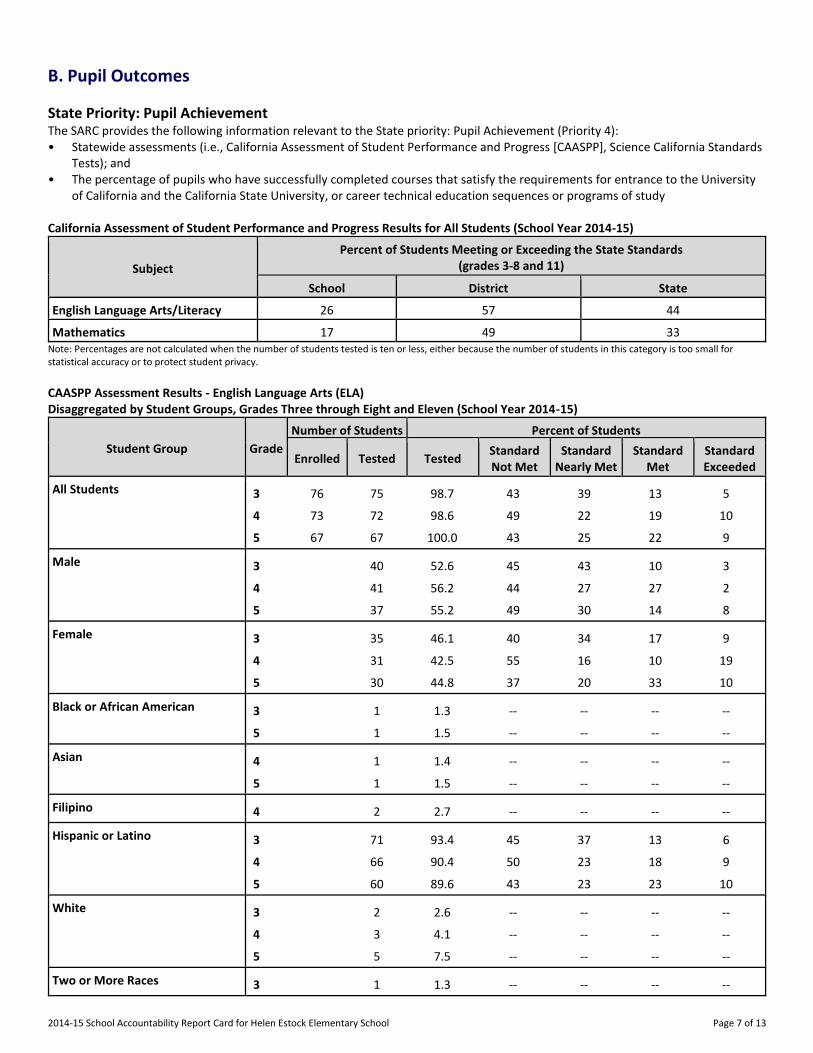
of California and the California State University, or career technical education sequences or programs of study California Assessment of Student Performance and Progress Results for All Students (School Year 2014-15)
Subject
Percent of Students Meeting or Exceeding the State Standards (grades 3-8 and 11)
School District State
English Language Arts/Literacy 26 57 44
Mathematics 17 49 33 Note: Percentages are not calculated when the number of students tested is ten or less, either because the number of students in this category is too small for statistical accuracy or to protect student privacy.
CAASPP Assessment Results - English Language Arts (ELA) Disaggregated by Student Groups, Grades Three through Eight and Eleven (School Year 2014-15)
Student Group Grade
Number of Students Percent of Students
Enrolled Tested Tested Standard Not Met
Standard Nearly Met
Standard Met
Standard Exceeded
All Students 3 76 75 98.7 43 39 13 5
4 73 72 98.6 49 22 19 10
5 67 67 100.0 43 25 22 9
Male 3 40 52.6 45 43 10 3
4 41 56.2 44 27 27 2
5 37 55.2 49 30 14 8
Female 3 35 46.1 40 34 17 9
4 31 42.5 55 16 10 19
5 30 44.8 37 20 33 10
Black or African American 3 1 1.3 -- -- -- --
5 1 1.5 -- -- -- --
Asian 4 1 1.4 -- -- -- --
5 1 1.5 -- -- -- --
Filipino 4 2 2.7 -- -- -- --
Hispanic or Latino 3 71 93.4 45 37 13 6
4 66 90.4 50 23 18 9
5 60 89.6 43 23 23 10
White 3 2 2.6 -- -- -- --
4 3 4.1 -- -- -- --
5 5 7.5 -- -- -- --
Two or More Races 3 1 1.3 -- -- -- --
2014-15 School Accountability Report Card for Helen Estock Elementary School Page 8 of 13
Student Group Grade
Number of Students Percent of Students
Enrolled Tested Tested Standard Not Met
Standard Nearly Met
Standard Met
Standard Exceeded
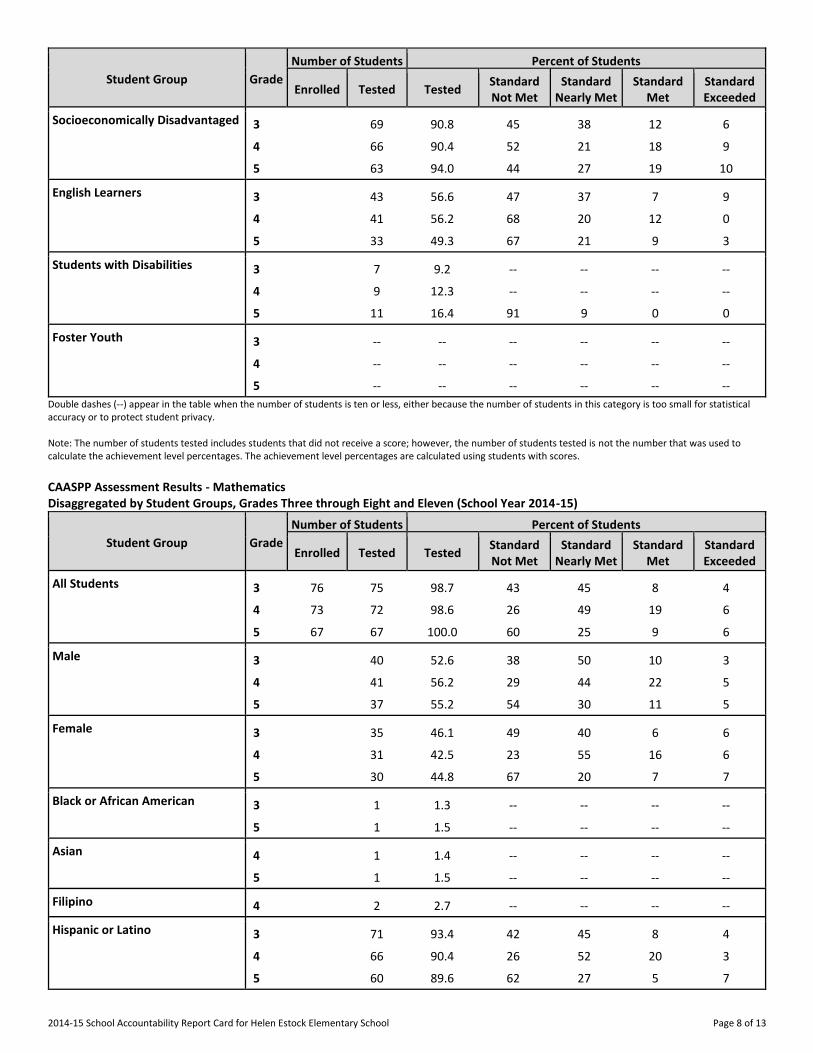
Socioeconomically Disadvantaged 3 69 90.8 45 38 12 6
4 66 90.4 52 21 18 9
5 63 94.0 44 27 19 10
English Learners 3 43 56.6 47 37 7 9
4 41 56.2 68 20 12 0
5 33 49.3 67 21 9 3
Students with Disabilities 3 7 9.2 -- -- -- --
4 9 12.3 -- -- -- --
5 11 16.4 91 9 0 0
Foster Youth 3 -- -- -- -- -- --
4 -- -- -- -- -- --
5 -- -- -- -- -- --
Double dashes (--) appear in the table when the number of students is ten or less, either because the number of students in this category is too small for statistical accuracy or to protect student privacy. Note: The number of students tested includes students that did not receive a score; however, the number of students tested is not the number that was used to calculate the achievement level percentages. The achievement level percentages are calculated using students with scores.
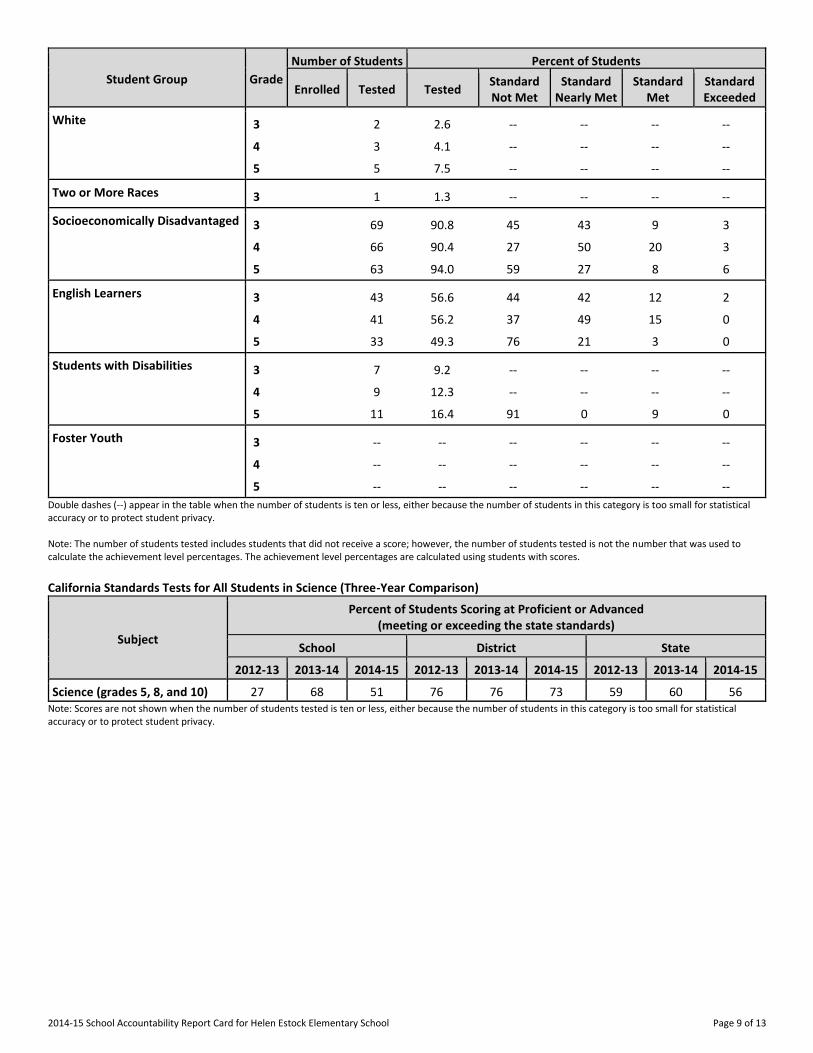
CAASPP Assessment Results - Mathematics Disaggregated by Student Groups, Grades Three through Eight and Eleven (School Year 2014-15)
Student Group Grade
Number of Students Percent of Students
Enrolled Tested Tested Standard Not Met
Standard Nearly Met
Standard Met
Standard Exceeded
All Students 3 76 75 98.7 43 45 8 4
4 73 72 98.6 26 49 19 6
5 67 67 100.0 60 25 9 6
Male 3 40 52.6 38 50 10 3
4 41 56.2 29 44 22 5
5 37 55.2 54 30 11 5
Female 3 35 46.1 49 40 6 6
4 31 42.5 23 55 16 6
5 30 44.8 67 20 7 7
Black or African American 3 1 1.3 -- -- -- --
5 1 1.5 -- -- -- --
Asian 4 1 1.4 -- -- -- --
5 1 1.5 -- -- -- --
Filipino 4 2 2.7 -- -- -- --
Hispanic or Latino 3 71 93.4 42 45 8 4
4 66 90.4 26 52 20 3
5 60 89.6 62 27 5 7
2014-15 School Accountability Report Card for Helen Estock Elementary School Page 9 of 13
Student Group Grade
Number of Students Percent of Students
Enrolled Tested Tested Standard Not Met
Standard Nearly Met
Standard Met
Standard Exceeded
White 3 2 2.6 -- -- -- --
4 3 4.1 -- -- -- --
5 5 7.5 -- -- -- --
Two or More Races 3 1 1.3 -- -- -- --
Socioeconomically Disadvantaged 3 69 90.8 45 43 9 3
4 66 90.4 27 50 20 3
5 63 94.0 59 27 8 6
English Learners 3 43 56.6 44 42 12 2
4 41 56.2 37 49 15 0
5 33 49.3 76 21 3 0
Students with Disabilities 3 7 9.2 -- -- -- --
4 9 12.3 -- -- -- --
5 11 16.4 91 0 9 0
Foster Youth 3 -- -- -- -- -- --
4 -- -- -- -- -- --
5 -- -- -- -- -- --
Double dashes (--) appear in the table when the number of students is ten or less, either because the number of students in this category is too small for statistical accuracy or to protect student privacy. Note: The number of students tested includes students that did not receive a score; however, the number of students tested is not the number that was used to calculate the achievement level percentages. The achievement level percentages are calculated using students with scores.
California Standards Tests for All Students in Science (Three-Year Comparison)
Subject
Percent of Students Scoring at Proficient or Advanced (meeting or exceeding the state standards)
School District State
2012-13 2013-14 2014-15 2012-13 2013-14 2014-15 2012-13 2013-14 2014-15
Science (grades 5, 8, and 10) 27 68 51 76 76 73 59 60 56 Note: Scores are not shown when the number of students tested is ten or less, either because the number of students in this category is too small for statistical accuracy or to protect student privacy.
2014-15 School Accountability Report Card for Helen Estock Elementary School Page 10 of 13
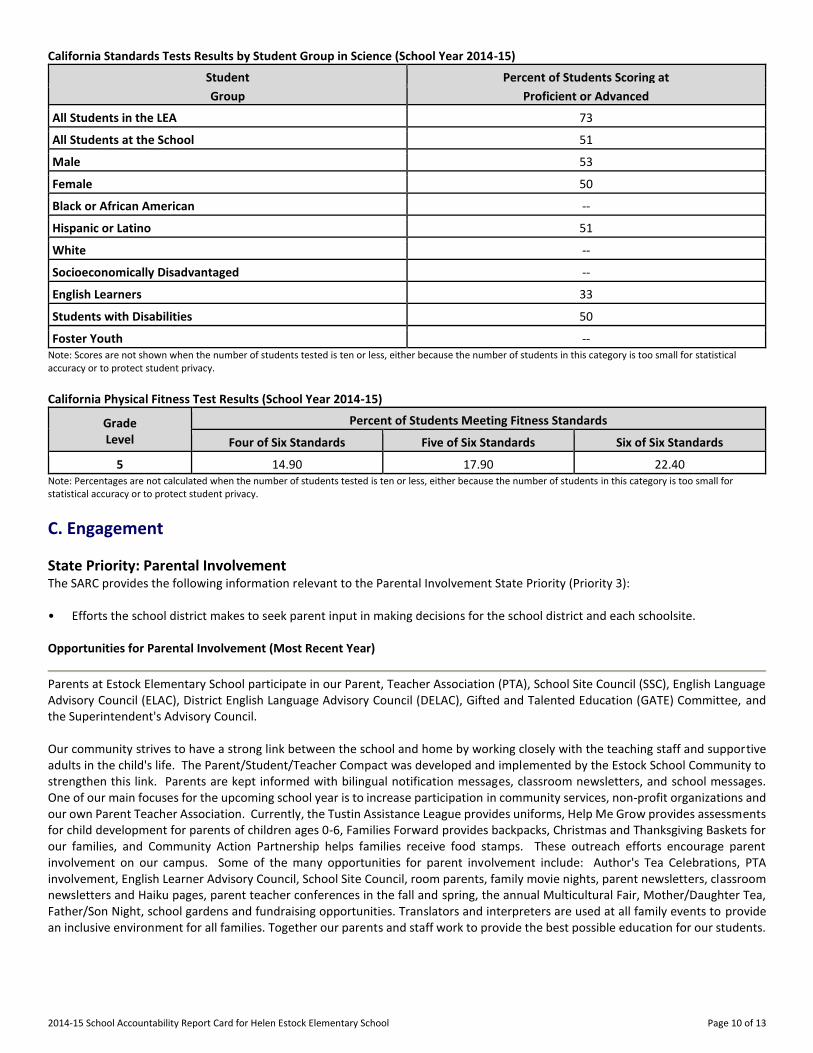
California Standards Tests Results by Student Group in Science (School Year 2014-15)
Student Percent of Students Scoring at
Group Proficient or Advanced
All Students in the LEA 73
All Students at the School 51
Male 53
Female 50
Black or African American --
Hispanic or Latino 51
White --
Socioeconomically Disadvantaged --
English Learners 33
Students with Disabilities 50
Foster Youth -- Note: Scores are not shown when the number of students tested is ten or less, either because the number of students in this category is too small for statistical accuracy or to protect student privacy.
California Physical Fitness Test Results (School Year 2014-15)
Grade Level
Percent of Students Meeting Fitness Standards
Four of Six Standards Five of Six Standards Six of Six Standards
---5--- 14.90 17.90 22.40 Note: Percentages are not calculated when the number of students tested is ten or less, either because the number of students in this category is too small for statistical accuracy or to protect student privacy.
C. Engagement
State Priority: Parental Involvement The SARC provides the following information relevant to the Parental Involvement State Priority (Priority 3): • Efforts the school district makes to seek parent input in making decisions for the school district and each schoolsite. Opportunities for Parental Involvement (Most Recent Year)
Parents at Estock Elementary School participate in our Parent, Teacher Association (PTA), School Site Council (SSC), English Language Advisory Council (ELAC), District English Language Advisory Council (DELAC), Gifted and Talented Education (GATE) Committee, and the Superintendent's Advisory Council. Our community strives to have a strong link between the school and home by working closely with the teaching staff and supportive adults in the child's life. The Parent/Student/Teacher Compact was developed and implemented by the Estock School Community to strengthen this link. Parents are kept informed with bilingual notification messages, classroom newsletters, and school messages. One of our main focuses for the upcoming school year is to increase participation in community services, non-profit organizations and our own Parent Teacher Association. Currently, the Tustin Assistance League provides uniforms, Help Me Grow provides assessments for child development for parents of children ages 0-6, Families Forward provides backpacks, Christmas and Thanksgiving Baskets for our families, and Community Action Partnership helps families receive food stamps. These outreach efforts encourage parent involvement on our campus. Some of the many opportunities for parent involvement include: Author's Tea Celebrations, PTA involvement, English Learner Advisory Council, School Site Council, room parents, family movie nights, parent newsletters, classroom newsletters and Haiku pages, parent teacher conferences in the fall and spring, the annual Multicultural Fair, Mother/Daughter Tea, Father/Son Night, school gardens and fundraising opportunities. Translators and interpreters are used at all family events to provide an inclusive environment for all families. Together our parents and staff work to provide the best possible education for our students.
2014-15 School Accountability Report Card for Helen Estock Elementary School Page 11 of 13
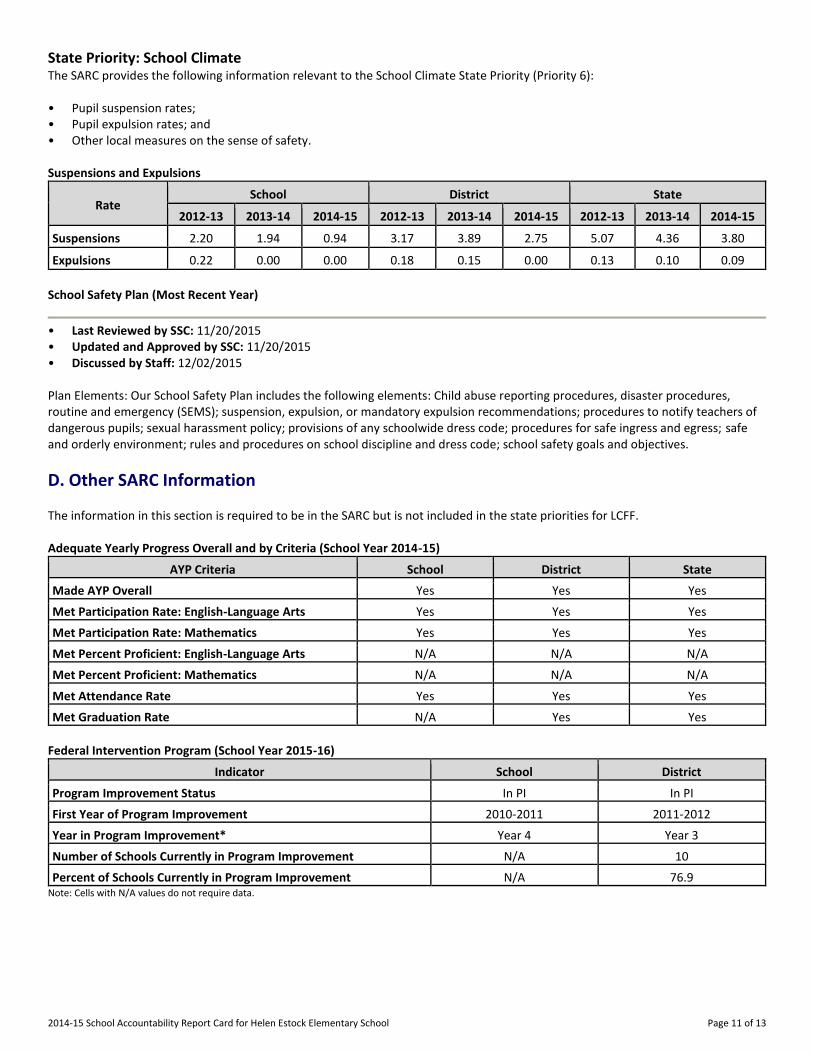
State Priority: School Climate The SARC provides the following information relevant to the School Climate State Priority (Priority 6): • Pupil suspension rates; • Pupil expulsion rates; and • Other local measures on the sense of safety. Suspensions and Expulsions
Rate School District State
2012-13 2013-14 2014-15 2012-13 2013-14 2014-15 2012-13 2013-14 2014-15
Suspensions------- 2.20 1.94 0.94 3.17 3.89 2.75 5.07 4.36 3.80
Expulsions------- 0.22 0.00 0.00 0.18 0.15 0.00 0.13 0.10 0.09
School Safety Plan (Most Recent Year)
• Last Reviewed by SSC: 11/20/2015 • Updated and Approved by SSC: 11/20/2015 • Discussed by Staff: 12/02/2015 Plan Elements: Our School Safety Plan includes the following elements: Child abuse reporting procedures, disaster procedures, routine and emergency (SEMS); suspension, expulsion, or mandatory expulsion recommendations; procedures to notify teachers of dangerous pupils; sexual harassment policy; provisions of any schoolwide dress code; procedures for safe ingress and egress; safe and orderly environment; rules and procedures on school discipline and dress code; school safety goals and objectives.
D. Other SARC Information
The information in this section is required to be in the SARC but is not included in the state priorities for LCFF. Adequate Yearly Progress Overall and by Criteria (School Year 2014-15)
AYP Criteria School District State
Made AYP Overall Yes Yes Yes
Met Participation Rate: English-Language Arts Yes Yes Yes
Met Participation Rate: Mathematics Yes Yes Yes
Met Percent Proficient: English-Language Arts N/A N/A N/A
Met Percent Proficient: Mathematics N/A N/A N/A
Met Attendance Rate Yes Yes Yes
Met Graduation Rate N/A Yes Yes
Federal Intervention Program (School Year 2015-16)
Indicator School District
Program Improvement Status In PI In PI
First Year of Program Improvement 2010-2011 2011-2012
Year in Program Improvement* Year 4 Year 3
Number of Schools Currently in Program Improvement N/A 10
Percent of Schools Currently in Program Improvement N/A 76.9 Note: Cells with N/A values do not require data.
2014-15 School Accountability Report Card for Helen Estock Elementary School Page 12 of 13
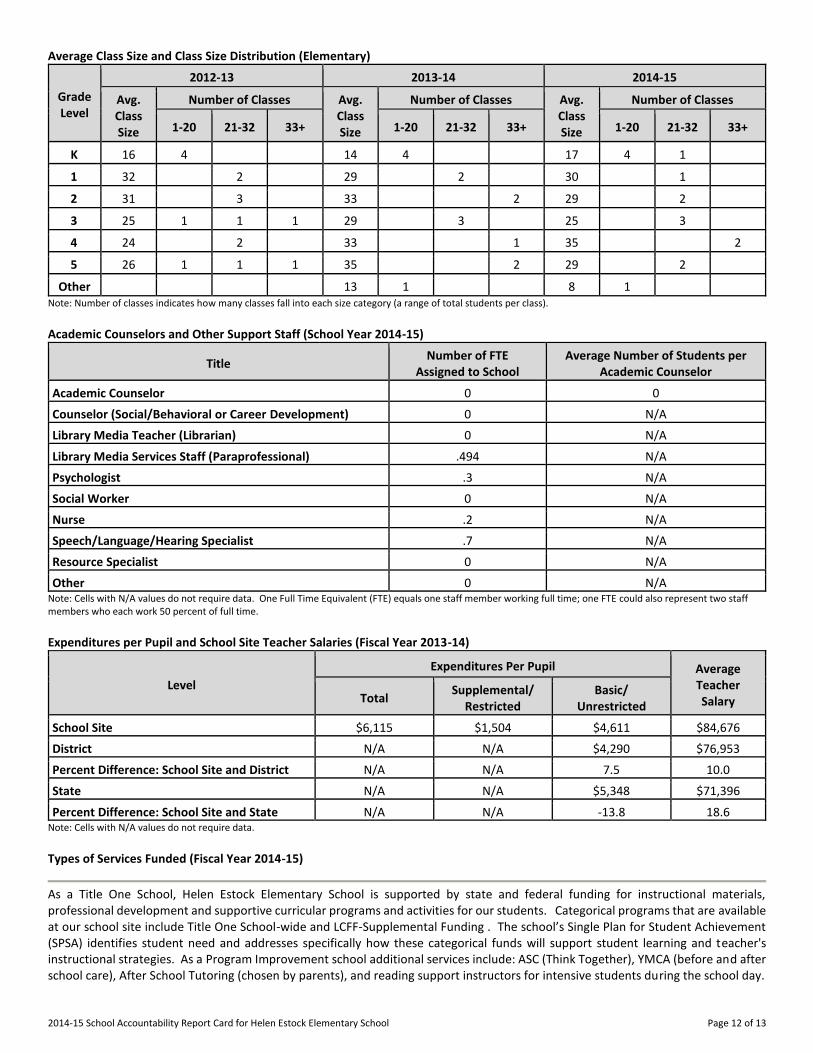
Average Class Size and Class Size Distribution (Elementary)
Grade Level
2012-13 2013-14 2014-15
Avg. Class Size
Number of Classes Avg. Class Size
Number of Classes Avg. Class Size
Number of Classes
1-20 21-32 33+ 1-20 21-32 33+ 1-20 21-32 33+
K
16 4 14 4 17 4 1
1
32 2 29 2 30 1
2
31 3 33 2 29 2
3
25 1 1 1 29 3 25 3
4
24 2 33 1 35 2
5
26 1 1 1 35 2 29 2
Other
13 1 8 1 Note: Number of classes indicates how many classes fall into each size category (a range of total students per class).
Academic Counselors and Other Support Staff (School Year 2014-15)
Title Number of FTE
Assigned to School Average Number of Students per
Academic Counselor
Academic Counselor------- 0 0
Counselor (Social/Behavioral or Career Development) 0 N/A
Library Media Teacher (Librarian) 0 N/A
Library Media Services Staff (Paraprofessional) .494 N/A
Psychologist------- .3 N/A
Social Worker------- 0 N/A
Nurse------- .2 N/A
Speech/Language/Hearing Specialist .7 N/A
Resource Specialist------- 0 N/A
Other------- 0 N/A Note: Cells with N/A values do not require data. One Full Time Equivalent (FTE) equals one staff member working full time; one FTE could also represent two staff members who each work 50 percent of full time.
Expenditures per Pupil and School Site Teacher Salaries (Fiscal Year 2013-14)
Level
Expenditures Per Pupil Average Teacher Salary Total
Supplemental/ Restricted
Basic/ Unrestricted
School Site------- $6,115 $1,504 $4,611 $84,676
District------- N/A N/A $4,290 $76,953
Percent Difference: School Site and District N/A N/A 7.5 10.0
State------- N/A N/A $5,348 $71,396
Percent Difference: School Site and State N/A N/A -13.8 18.6 Note: Cells with N/A values do not require data.
Types of Services Funded (Fiscal Year 2014-15)
As a Title One School, Helen Estock Elementary School is supported by state and federal funding for instructional materials, professional development and supportive curricular programs and activities for our students. Categorical programs that are available at our school site include Title One School-wide and LCFF-Supplemental Funding . The school’s Single Plan for Student Achievement (SPSA) identifies student need and addresses specifically how these categorical funds will support student learning and teacher's instructional strategies. As a Program Improvement school additional services include: ASC (Think Together), YMCA (before and after school care), After School Tutoring (chosen by parents), and reading support instructors for intensive students during the school day.
2014-15 School Accountability Report Card for Helen Estock Elementary School Page 13 of 13
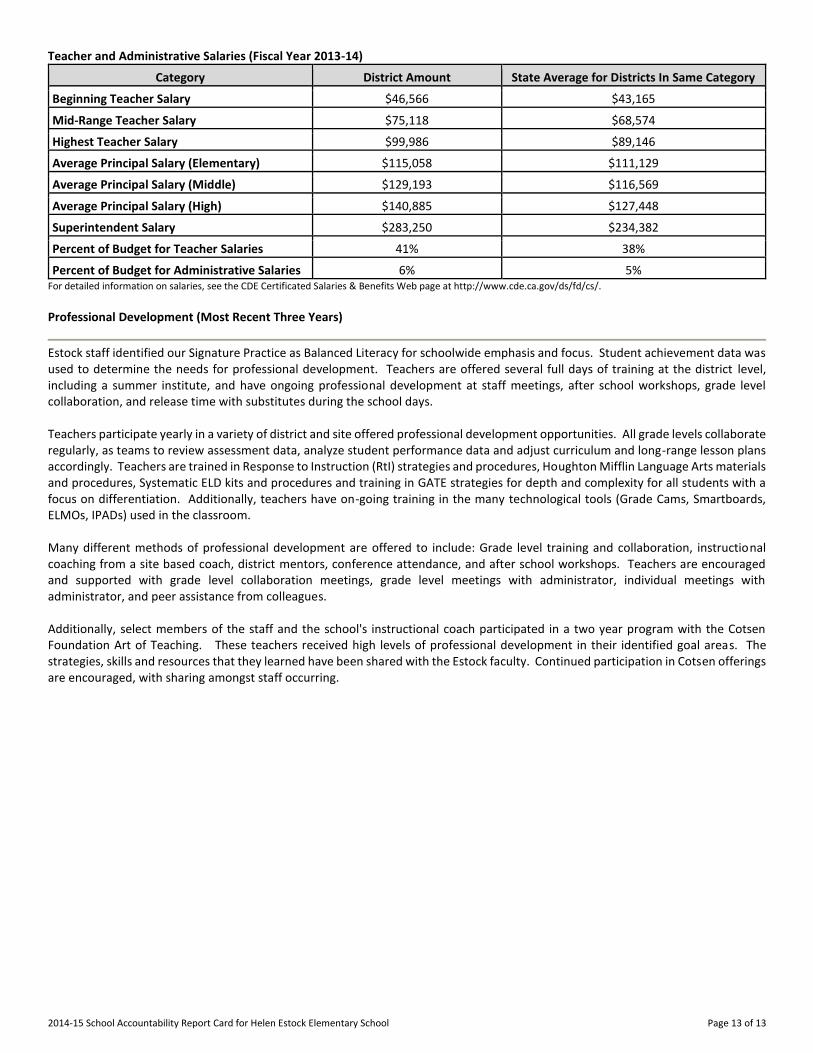
Teacher and Administrative Salaries (Fiscal Year 2013-14)
Category District Amount State Average for Districts In Same Category
Beginning Teacher Salary $46,566 $43,165
Mid-Range Teacher Salary $75,118 $68,574
Highest Teacher Salary $99,986 $89,146
Average Principal Salary (Elementary) $115,058 $111,129
Average Principal Salary (Middle) $129,193 $116,569
Average Principal Salary (High) $140,885 $127,448
Superintendent Salary $283,250 $234,382
Percent of Budget for Teacher Salaries 41% 38%
Percent of Budget for Administrative Salaries 6% 5% For detailed information on salaries, see the CDE Certificated Salaries & Benefits Web page at http://www.cde.ca.gov/ds/fd/cs/. Professional Development (Most Recent Three Years)
Estock staff identified our Signature Practice as Balanced Literacy for schoolwide emphasis and focus. Student achievement data was used to determine the needs for professional development. Teachers are offered several full days of training at the district level, including a summer institute, and have ongoing professional development at staff meetings, after school workshops, grade level collaboration, and release time with substitutes during the school days. Teachers participate yearly in a variety of district and site offered professional development opportunities. All grade levels collaborate regularly, as teams to review assessment data, analyze student performance data and adjust curriculum and long-range lesson plans accordingly. Teachers are trained in Response to Instruction (RtI) strategies and procedures, Houghton Mifflin Language Arts materials and procedures, Systematic ELD kits and procedures and training in GATE strategies for depth and complexity for all students with a focus on differentiation. Additionally, teachers have on-going training in the many technological tools (Grade Cams, Smartboards, ELMOs, IPADs) used in the classroom. Many different methods of professional development are offered to include: Grade level training and collaboration, instructional coaching from a site based coach, district mentors, conference attendance, and after school workshops. Teachers are encouraged and supported with grade level collaboration meetings, grade level meetings with administrator, individual meetings with administrator, and peer assistance from colleagues. Additionally, select members of the staff and the school's instructional coach participated in a two year program with the Cotsen Foundation Art of Teaching. These teachers received high levels of professional development in their identified goal areas. The strategies, skills and resources that they learned have been shared with the Estock faculty. Continued participation in Cotsen offerings are encouraged, with sharing amongst staff occurring.