Embed Size (px)
Citation preview
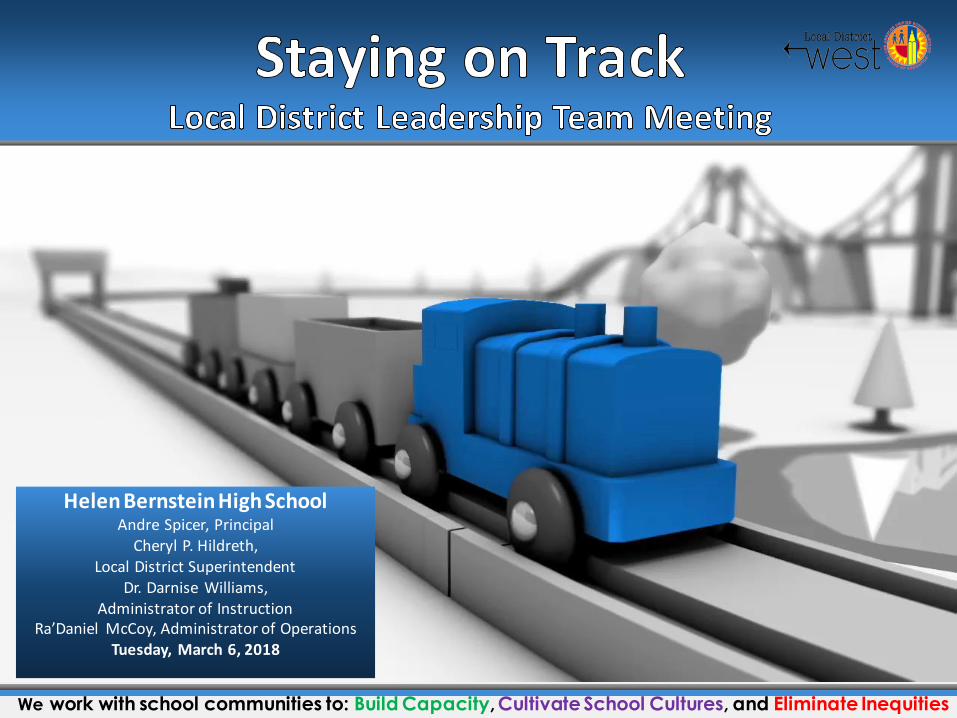
Helen Bernstein High School Andre Spicer, Principal
Cheryl P. Hildreth, Local District Superintendent
Dr. Darnise Williams, Administrator of Instruction
Ra’Daniel McCoy, Administrator of OperationsTuesday, March 6, 2018
We work with school communities to: Build Capacity, Cultivate School Cultures, and Eliminate Inequities

“ Everyday more educators are showing that they value students by involving them in meaningful ways in school…...Their experience shows that when educators partner with students to improve learning, teaching and leadership in schools, school change is positive and effective.”
The Student Voice Effect
(Fletcher, 2005)
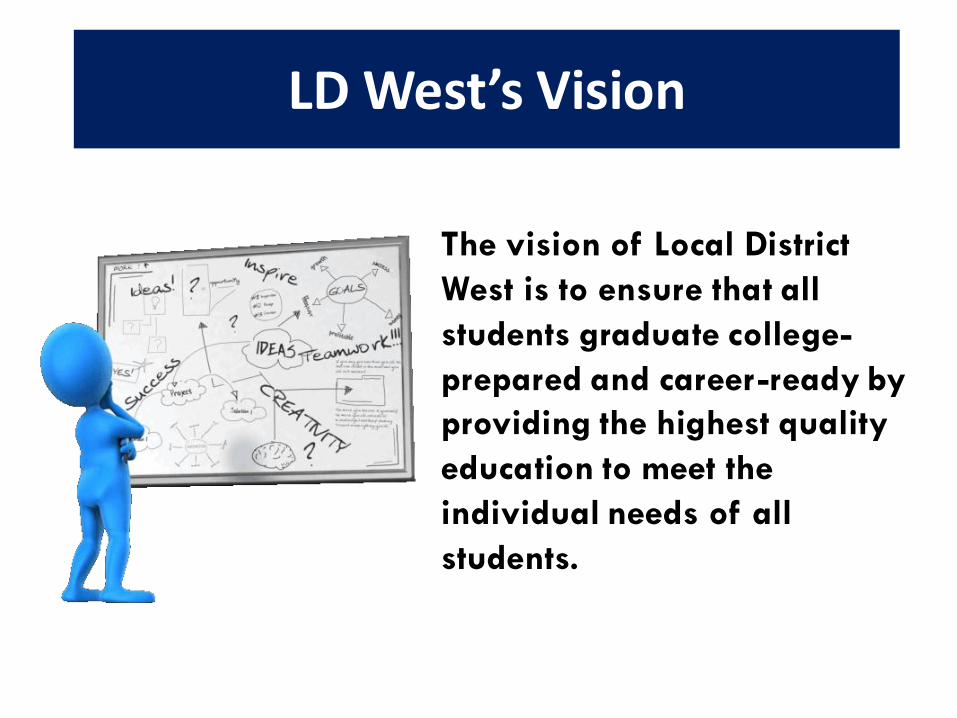
LD West’s Vision
The vision of Local District
West is to ensure that all
students graduate college-
prepared and career-ready by
providing the highest quality
education to meet the
individual needs of all
students.
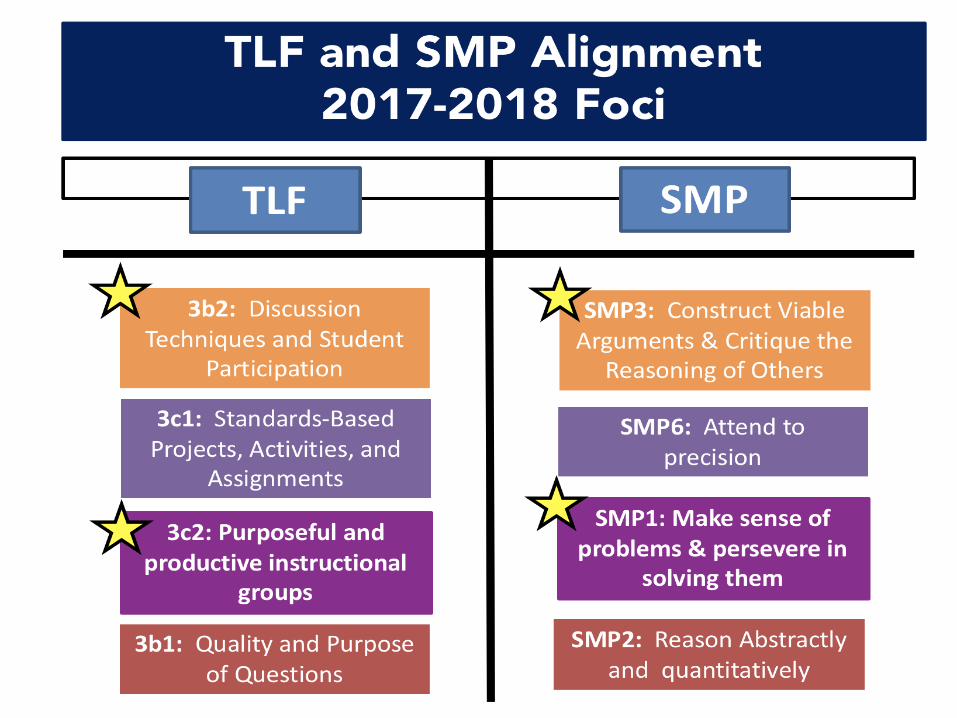
Standards for Mathematical Practices (SMPs) 2017-18 Foci
Teaching and Learning Framework (TLF) 2017-18 Foci
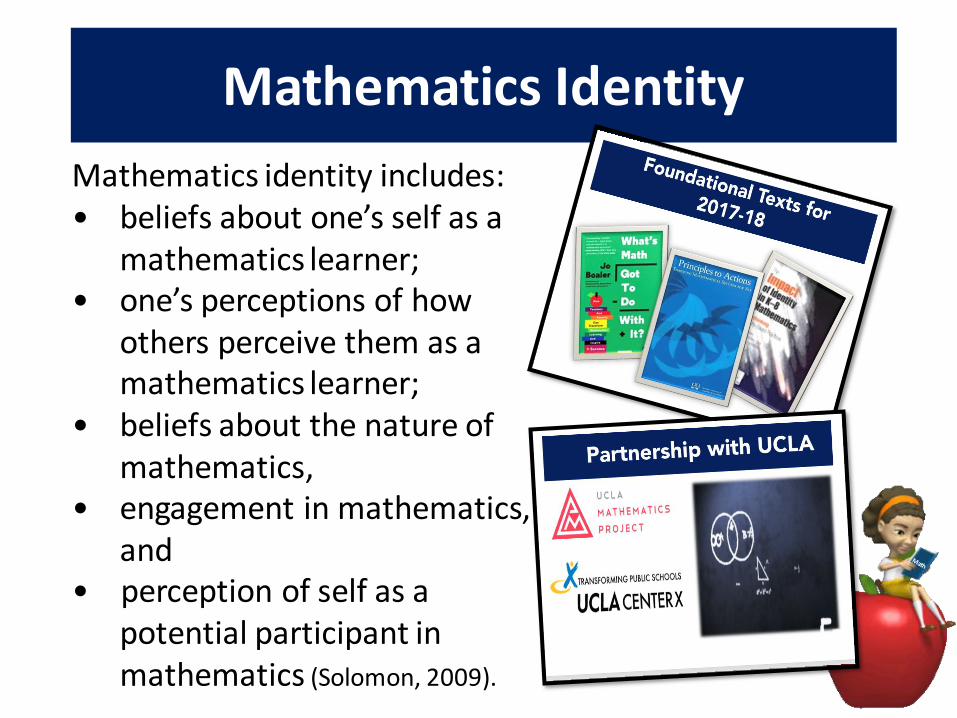
Mathematics identity includes:• beliefs about one’s self as a
mathematics learner;• one’s perceptions of how
others perceive them as a mathematics learner;
• beliefs about the nature ofmathematics,
• engagement in mathematics,and
• perception of self as a potential participant in mathematics (Solomon, 2009).
Mathematics Identity
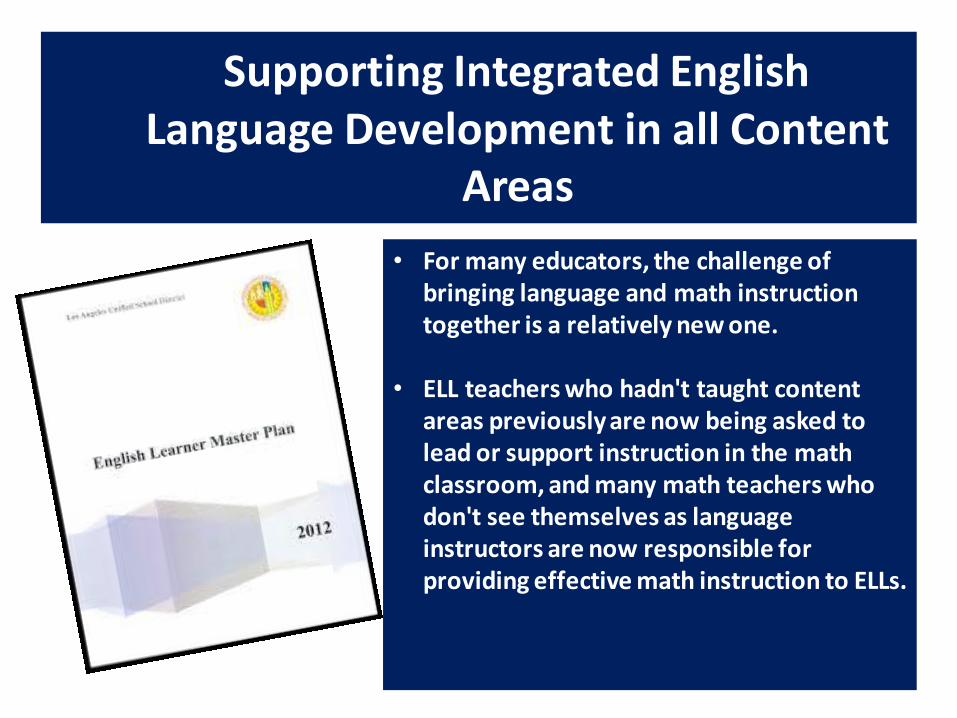
Supporting Integrated English Language Development in all Content
Areas
“As the largest English learner enrolling school district in the United States, whose students speak more than 90 different languages, the Los Angeles Unified School District has the privilege and responsibility of ensuring that all multilingual students become proficient in English and master the academic content required of every student in California… We know that English learners face enormous challenges, yet they also bring vital linguistic and cultural assets to our communities.”
English Learner Master Plan
• For many educators, the challenge of bringing language and math instruction together is a relatively new one.
• ELL teachers who hadn't taught content areas previously are now being asked to lead or support instruction in the math classroom, and many math teachers who don't see themselves as language instructors are now responsible for providing effective math instruction to ELLs.
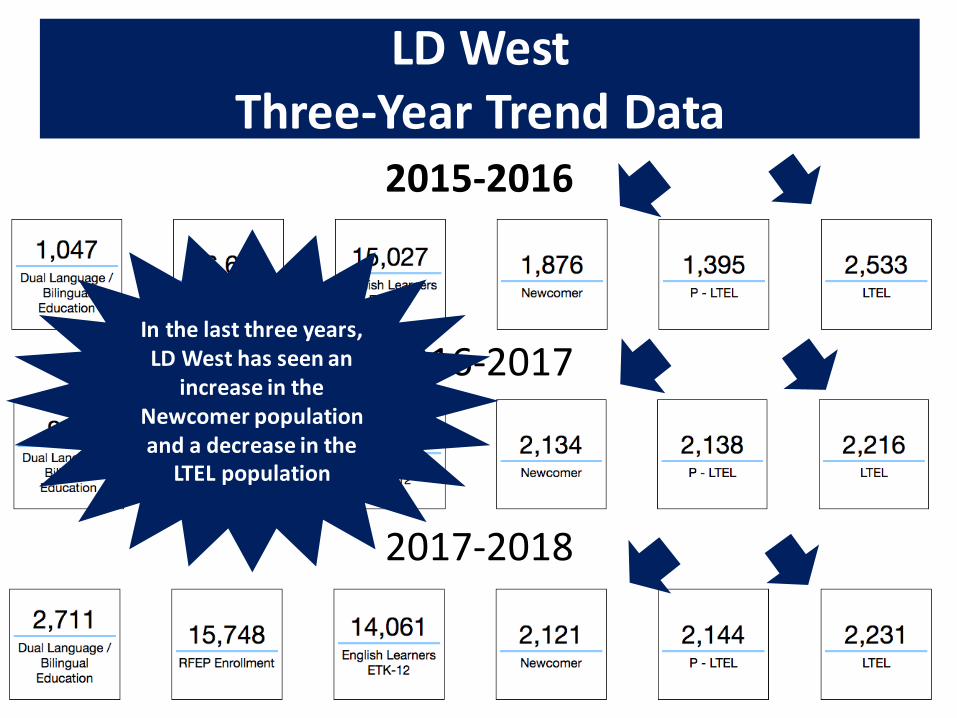
LD WestThree-Year Trend Data
2015-2016
2016-2017
2017-2018
In the last three years, LD West has seen an
increase in the Newcomer population and a decrease in the
LTEL population
0%
5%
10%
15%
20%
25%
2012-2013 2013-2014 2014-2015 2015-2016 2016-2017
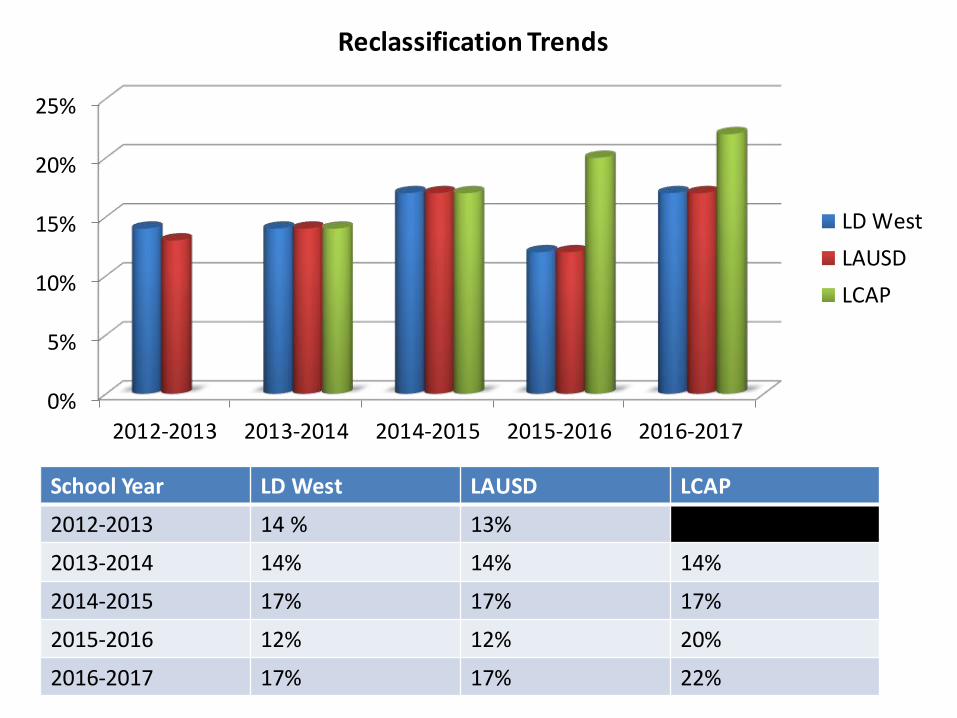
Reclassification Trends
LD West
LAUSD
LCAP
School Year LD West LAUSD LCAP
2012-2013 14 % 13%
2013-2014 14% 14% 14%
2014-2015 17% 17% 17%
2015-2016 12% 12% 20%
2016-2017 17% 17% 22%
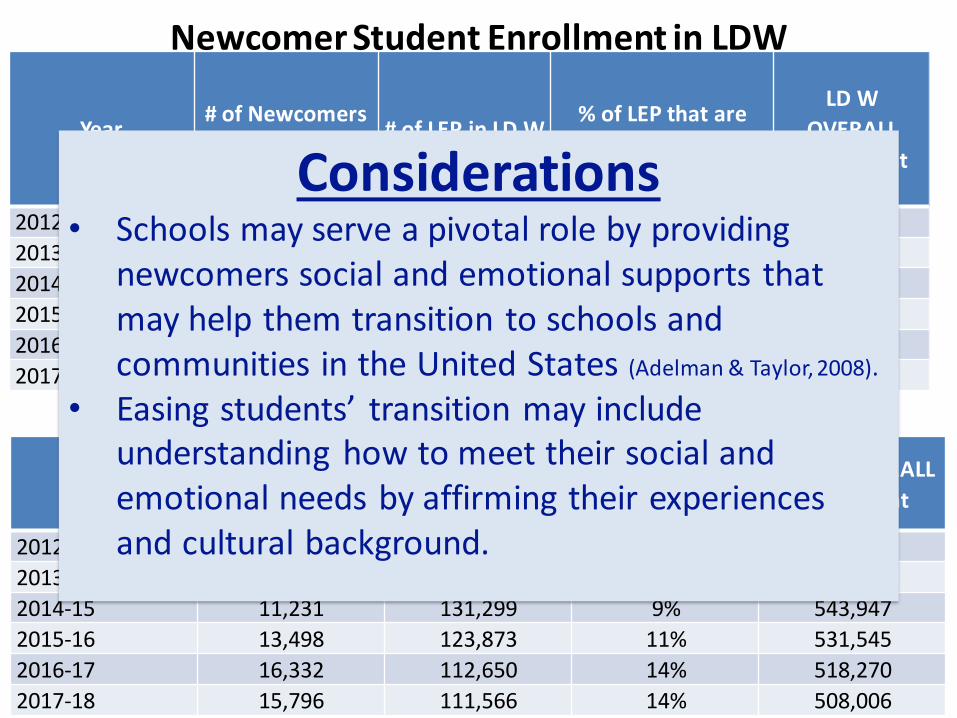
Newcomer Student Enrollment in LDW
Year# of Newcomers
in LDW# of LEP in LD W
% of LEP that are
Newcomers in LD W
LD W
OVERALL
Enrollment
2012-13 1,471 17,761 8% 87,833
2013-14 1,959 15,653 13% 84,785
2014-15 1,891 16,460 11% 84,901
2015-16 2,243 15,627 14% 82,243
2016-17 2,590 14,457 18% 79,964
2017-18 2,596 14,249 18% 78,378
Year# of Newcomers
in LAUSD# of LEP in LAUSD
% of LEP that are
Newcomers in
LAUSD
LAUSD OVERALL
Enrollment
2012-13 8,274 146,176 6% 567,627
2013-14 10,587 126,651 8% 547,654
2014-15 11,231 131,299 9% 543,947
2015-16 13,498 123,873 11% 531,545
2016-17 16,332 112,650 14% 518,270
2017-18 15,796 111,566 14% 508,006
Newcomer Student Enrollment in LAUSD
Considerations• Schools may serve a pivotal role by providing
newcomers social and emotional supports that may help them transition to schools and communities in the United States (Adelman & Taylor, 2008).
• Easing students’ transition may include understanding how to meet their social and emotional needs by affirming their experiences and cultural background.
Our Story

The Voices of Bernstein HS

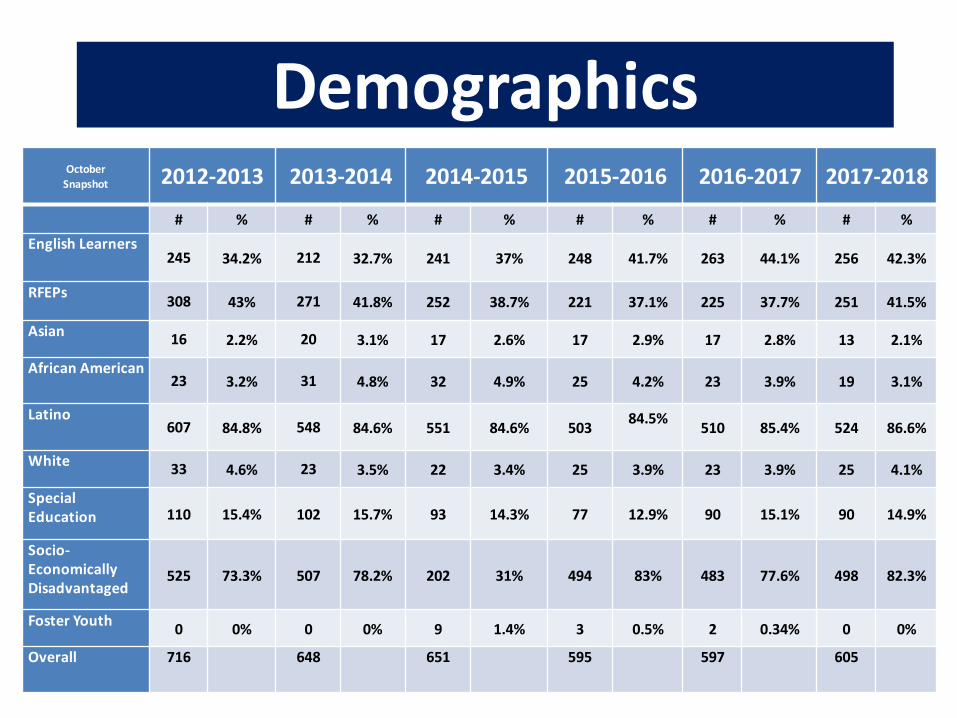
DemographicsOctober
Snapshot 2012-2013 2013-2014 2014-2015 2015-2016 2016-2017 2017-2018
# % # % # % # % # % # %
English Learners245 34.2% 212 32.7% 241 37% 248 41.7% 263 44.1% 256 42.3%
RFEPs308 43% 271 41.8% 252 38.7% 221 37.1% 225 37.7% 251 41.5%
Asian16 2.2% 20 3.1% 17 2.6% 17 2.9% 17 2.8% 13 2.1%
African American23 3.2% 31 4.8% 32 4.9% 25 4.2% 23 3.9% 19 3.1%
Latino607 84.8% 548 84.6% 551 84.6% 503
84.5%510 85.4% 524 86.6%
White33 4.6% 23 3.5% 22 3.4% 25 3.9% 23 3.9% 25 4.1%
Special Education 110 15.4% 102 15.7% 93 14.3% 77 12.9% 90 15.1% 90 14.9%
Socio-Economically Disadvantaged
525 73.3% 507 78.2% 202 31% 494 83% 483 77.6% 498 82.3%
Foster Youth0 0% 0 0% 9 1.4% 3 0.5% 2 0.34% 0 0%
Overall 716 648 651 595 597 605
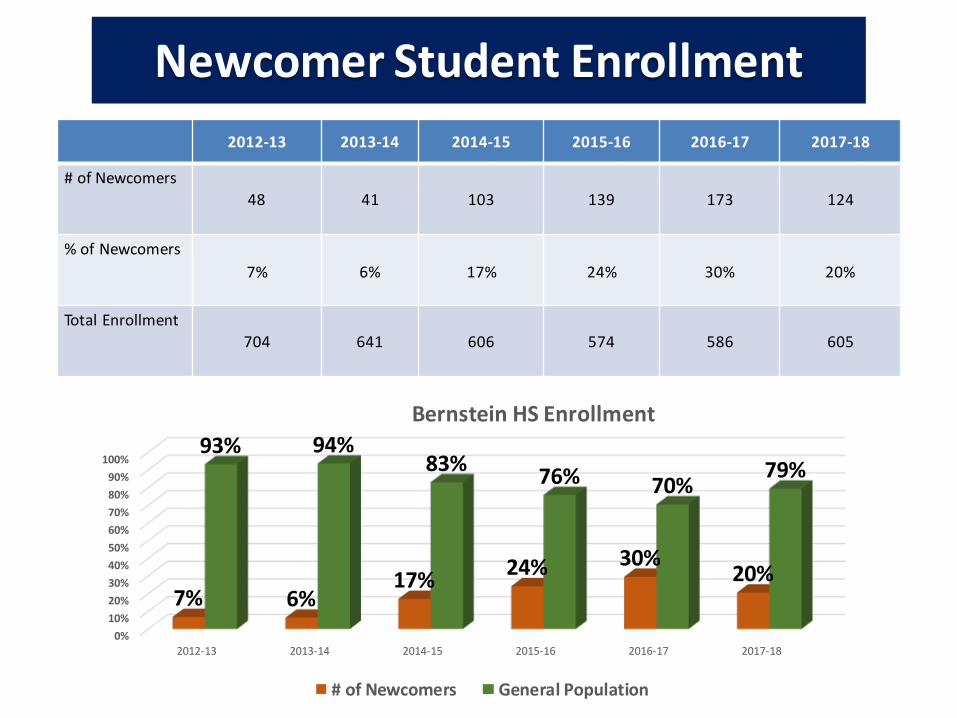
Newcomer Student Enrollment
2012-13 2013-14 2014-15 2015-16 2016-17 2017-18
# of Newcomers
48 41 103 139 173 124
% of Newcomers
7% 6% 17% 24% 30% 20%
Total Enrollment
704 641 606 574 586 605
0%
10%
20%
30%
40%
50%
60%
70%
80%
90%
100%
2012-13 2013-14 2014-15 2015-16 2016-17 2017-18
7% 6%17%
24% 30%20%
93% 94%83%
76% 70%79%
Bernstein HS Enrollment
# of Newcomers General Population
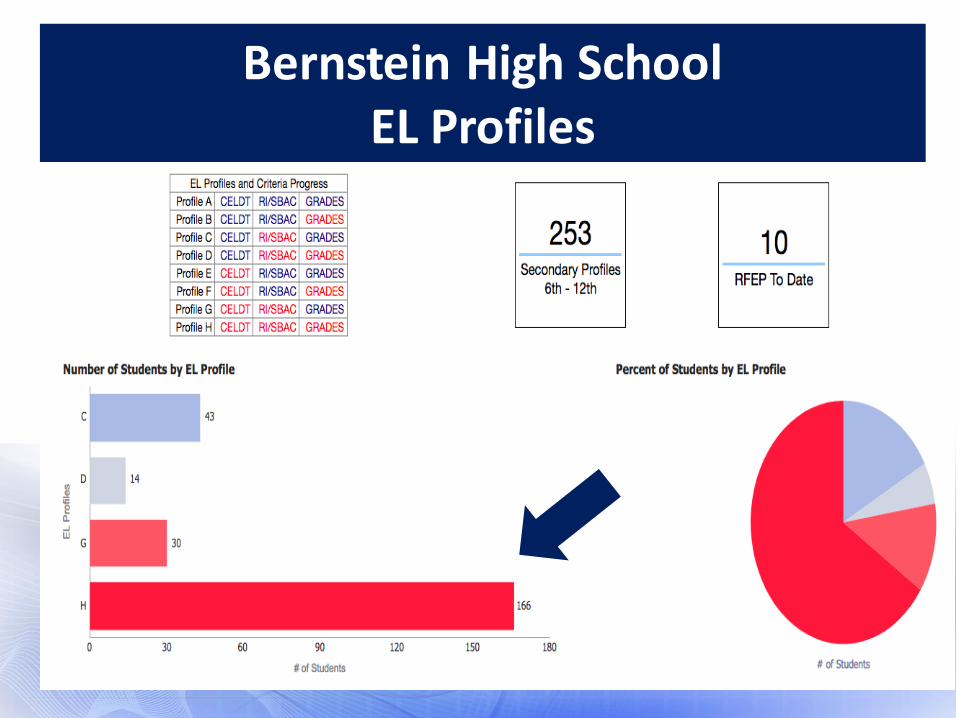
Bernstein High School EL Profiles
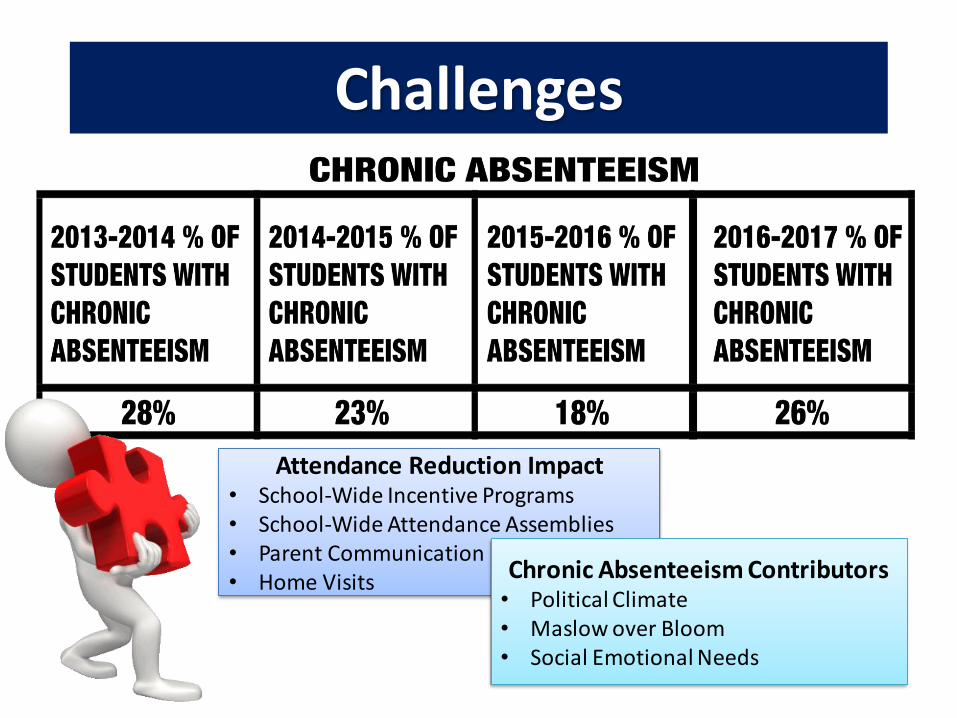
Challenges
Attendance Reduction Impact• School-Wide Incentive Programs• School-Wide Attendance Assemblies• Parent Communication• Home Visits Chronic Absenteeism Contributors
• Political Climate• Maslow over Bloom• Social Emotional Needs
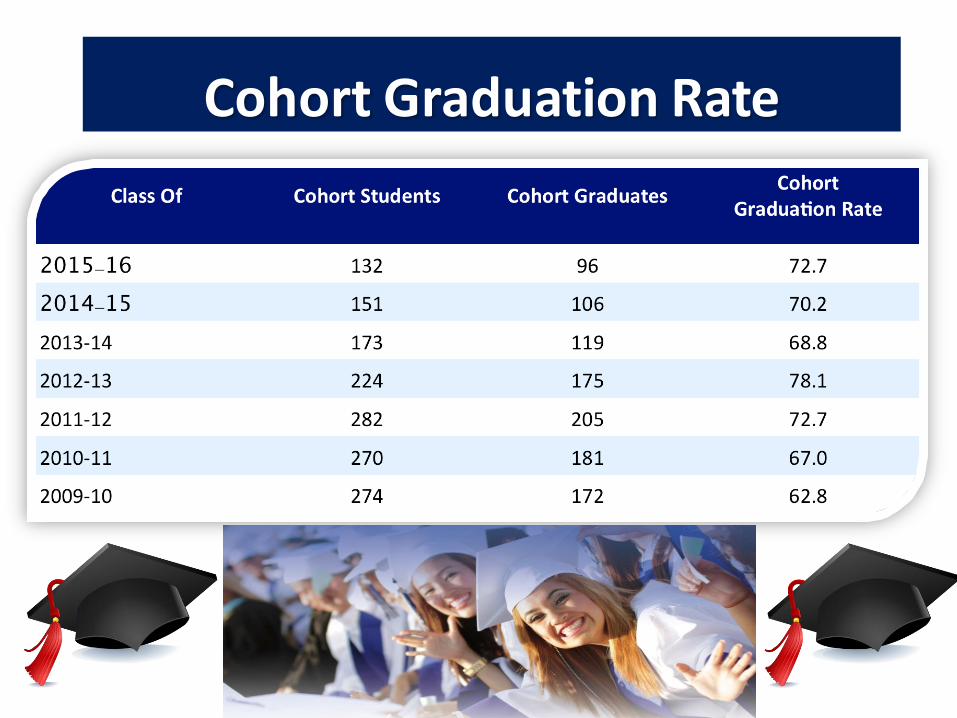
Cohort Graduation Rate
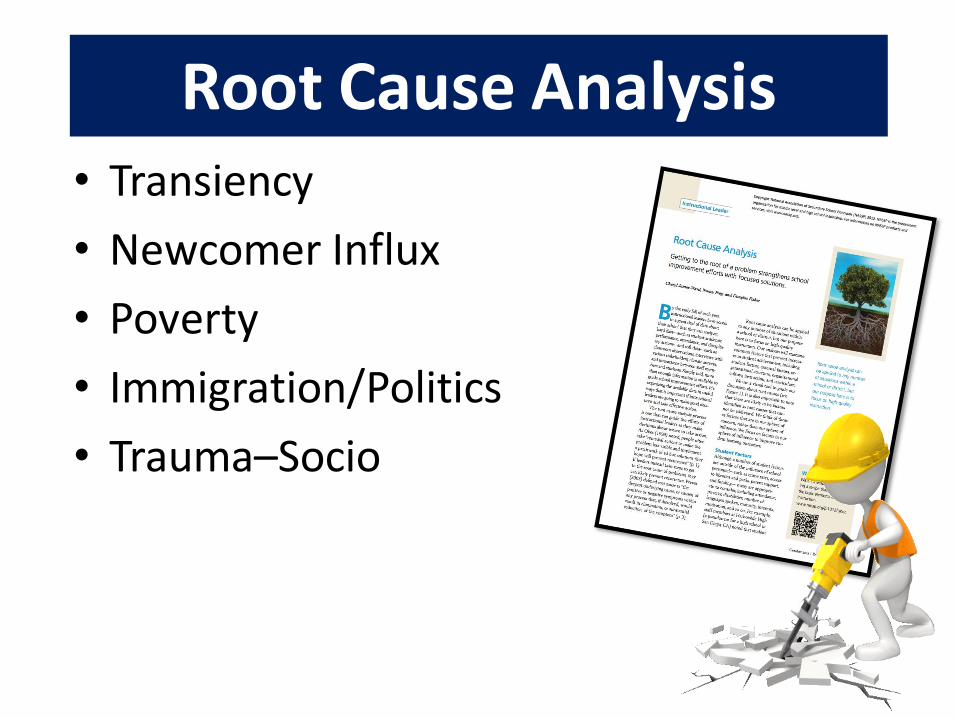
Root Cause Analysis• Transiency
• Newcomer Influx
• Poverty
• Immigration/Politics
• Trauma–Socio-Emotional
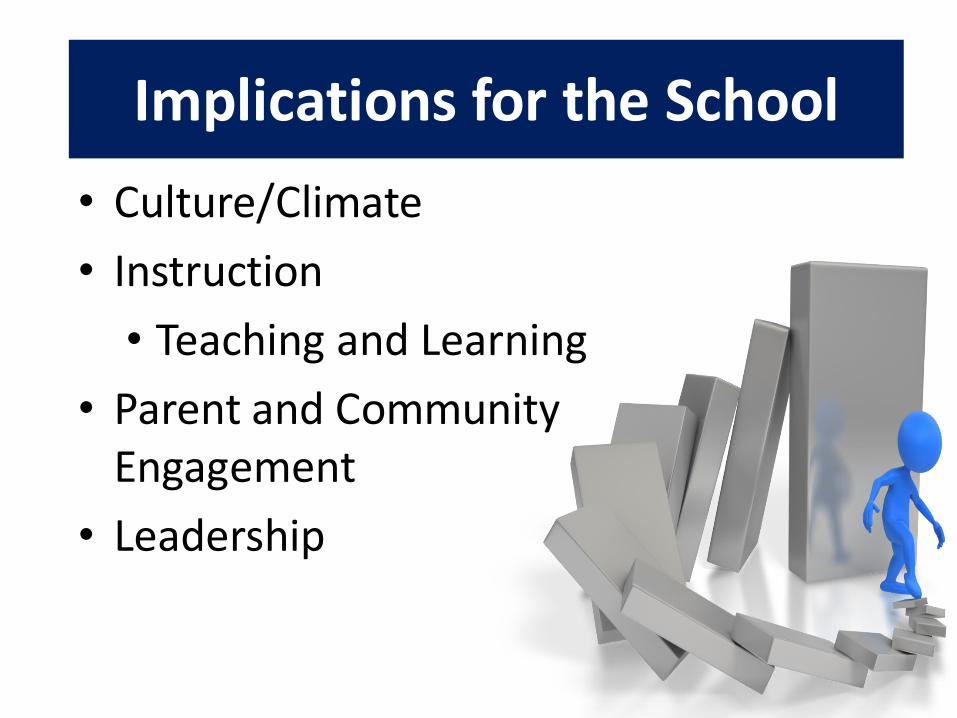
Implications for the School
• Culture/Climate
• Instruction
• Teaching and Learning
• Parent and Community Engagement
• Leadership
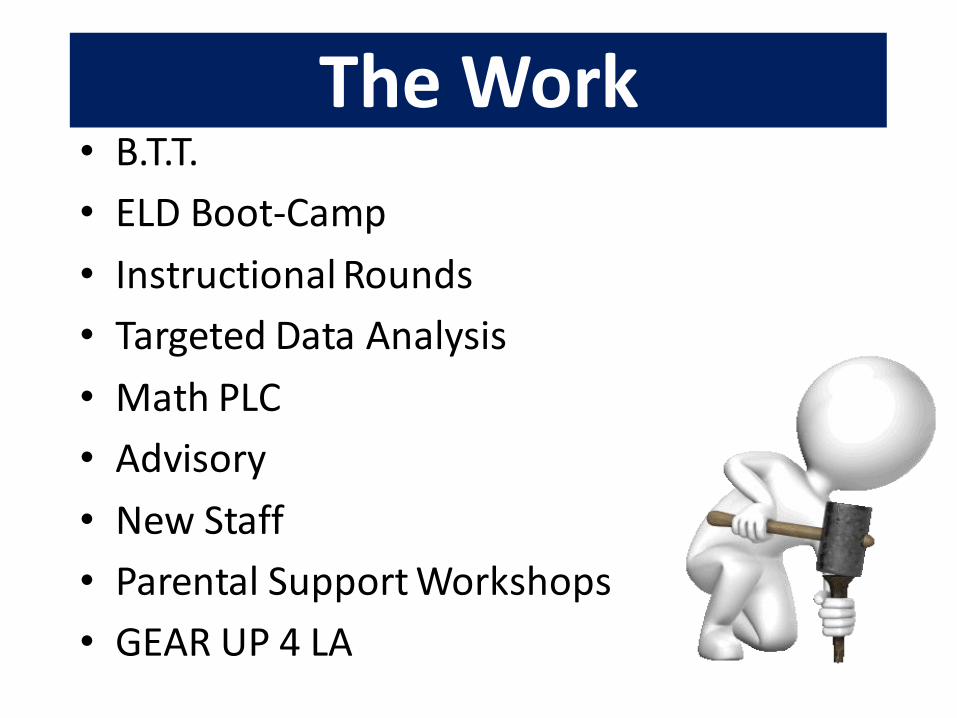
The Work• B.T.T.
• ELD Boot-Camp
• Instructional Rounds
• Targeted Data Analysis
• Math PLC
• Advisory
• New Staff
• Parental Support Workshops
• GEAR UP 4 LA
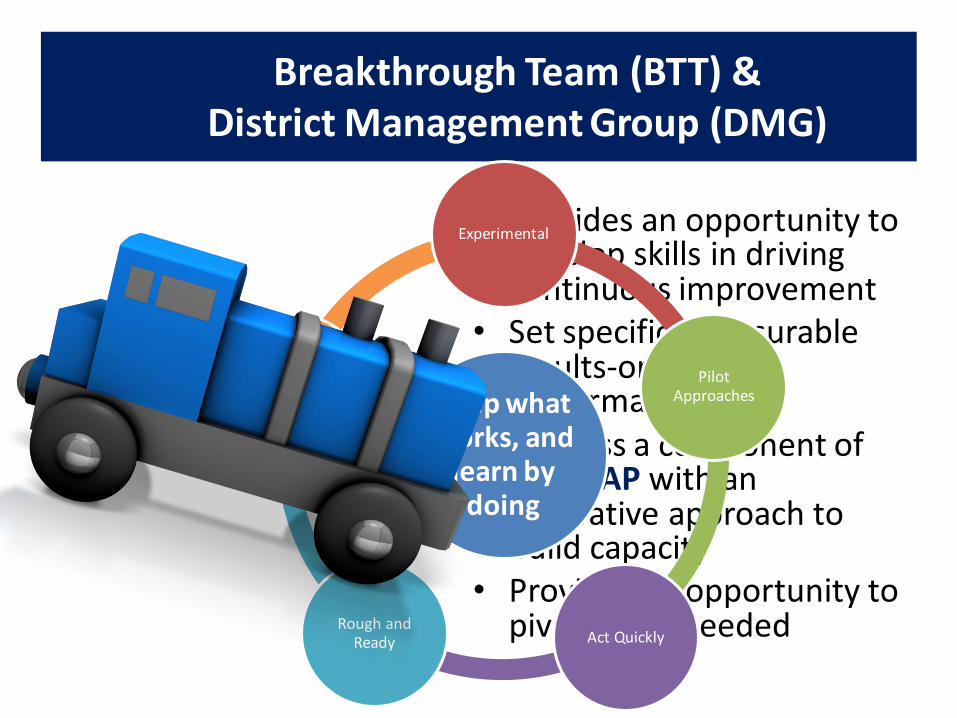
• Provides an opportunity to develop skills in driving continuous improvement
• Set specific, measurable results-oriented performance goals
• Address a component of the LCAP with an innovative approach to build capacity
• Provides an opportunity to pivot when needed
Breakthrough Team (BTT) & District Management Group (DMG)
Keep what works, and
learn by doing
Experimental
Pilot Approaches
Act Quickly Rough and
Ready
Get Results
S.M.A.R.T. Goals
Math S.M.A.R.T. Goal #1: By December 8, 2017, 73 out of 120 (60%) of students with a baseline Level 0 in Equation and Equalities will move to Level 1 proficiency.
Opportunity to pivot and redirect when necessary
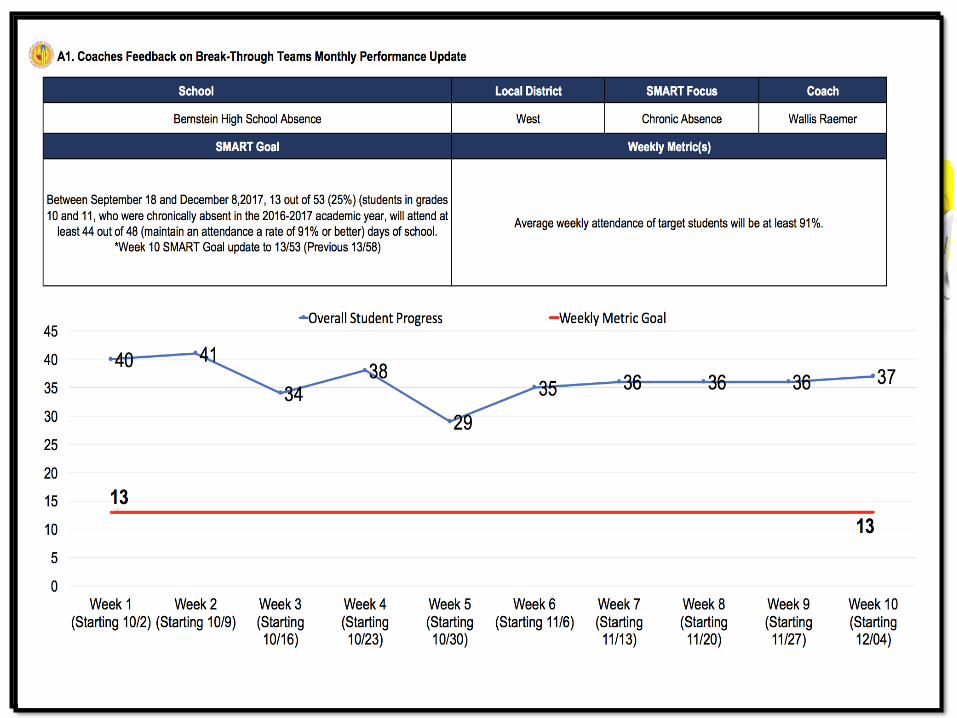
Attendance S.M.A.R.T. Goal #2: By December 8, 2017 13out of 58 (20%) (students in grades 10 and 11, who were chronically absent in the 2016-2017 academic year, will attend at least 44 out of 48 (maintain an attendance a rate of 91% or better) days of school.
GOALS MET!
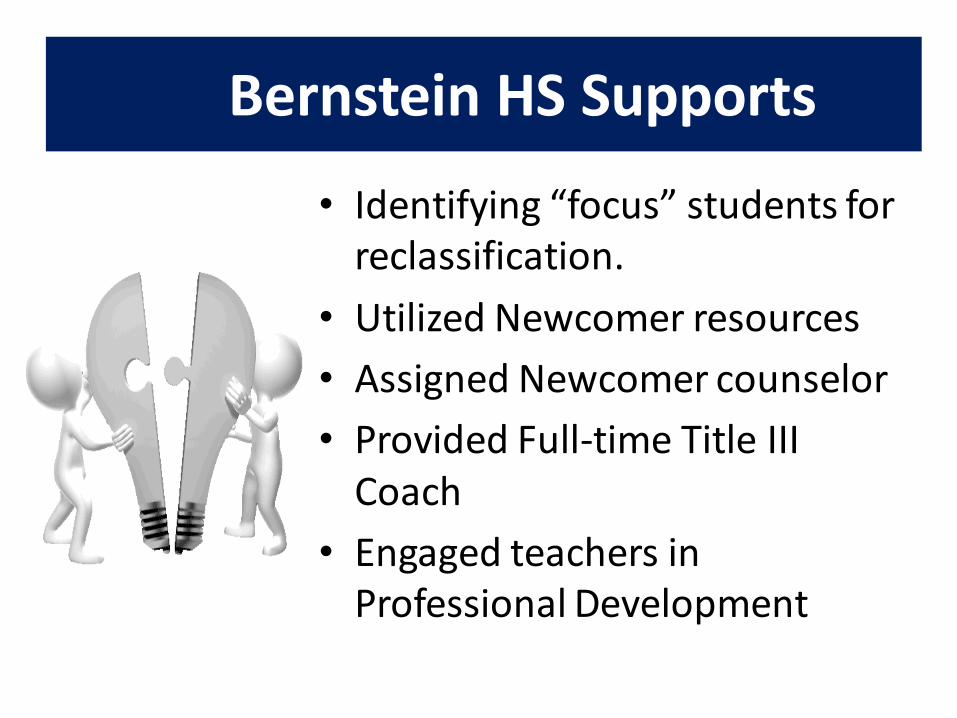
• Identifying “focus” students for reclassification.
• Utilized Newcomer resources
• Assigned Newcomer counselor
• Provided Full-time Title III Coach
• Engaged teachers in Professional Development
Bernstein HS Supports

Actionable Feedback and Debrief: The Work
Ahead
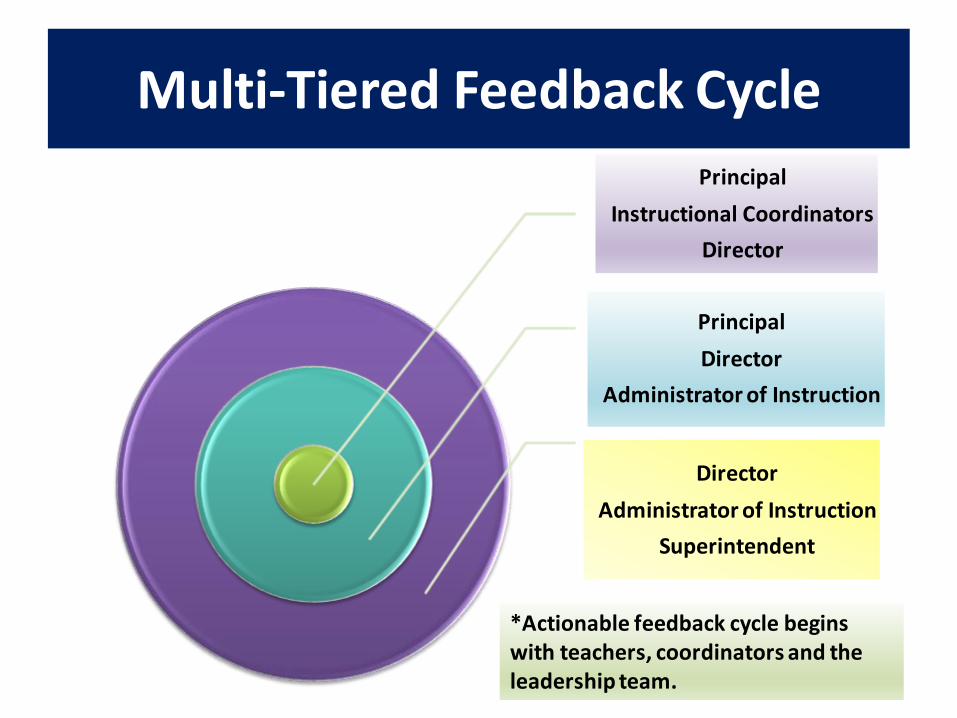
Multi-Tiered Feedback Cycle
Principal
Secondary Director
Principal
Secondary Director
SecondaryDirector
Principal
Instructional Coordinators
Director
Principal
Director
Administrator of Instruction
Director
Administrator of Instruction
Superintendent
*Actionable feedback cycle begins with teachers, coordinators and the leadership team.
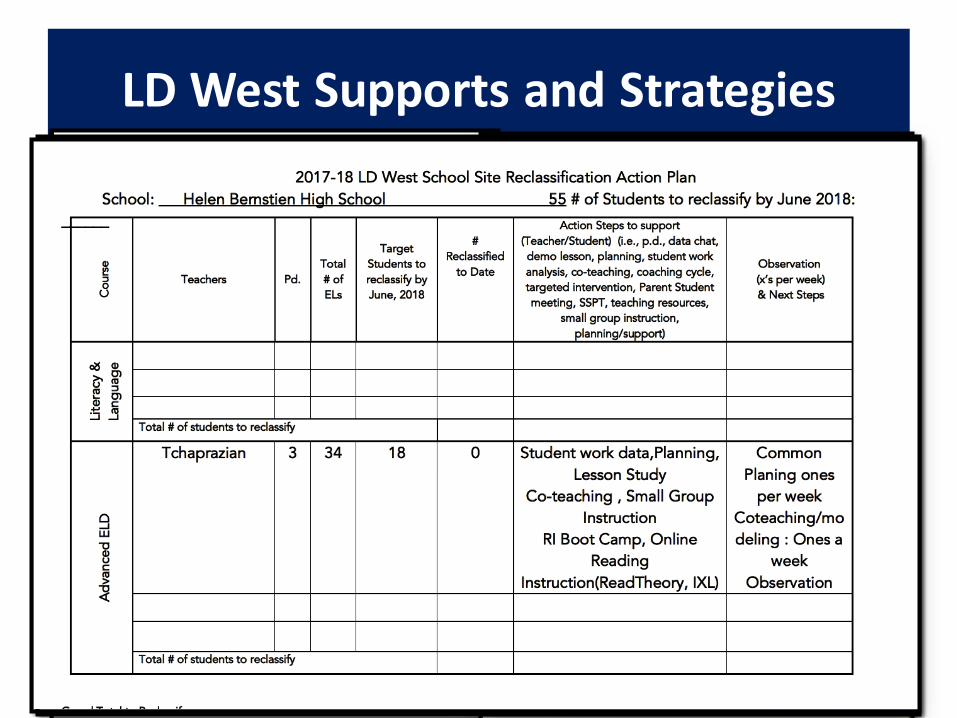
LD West Supports and Strategies
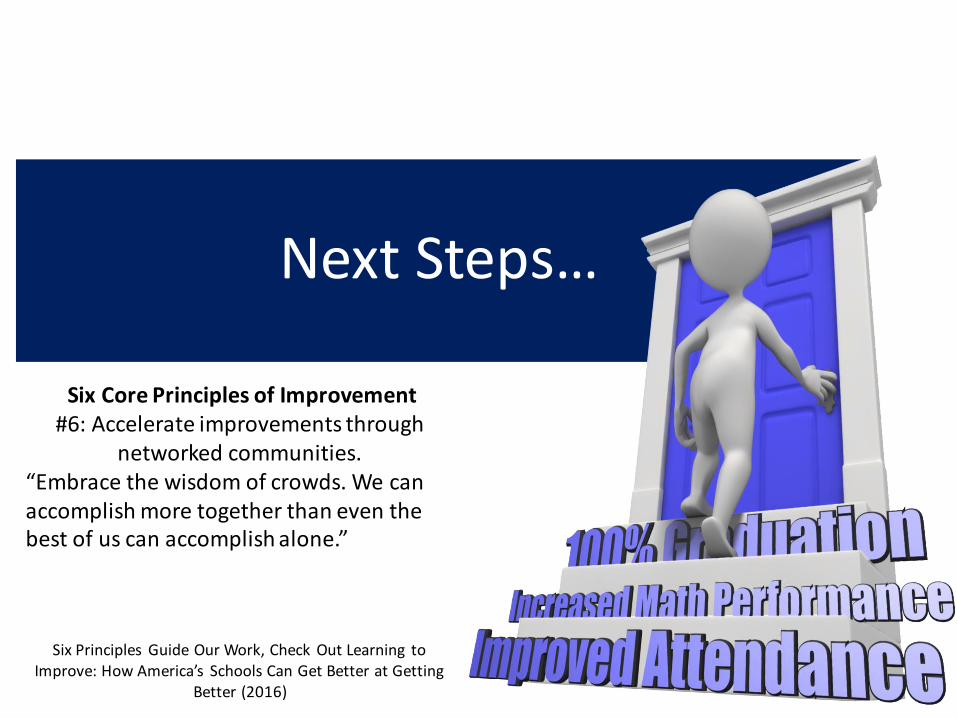
Next Steps…
Six Core Principles of Improvement#6: Accelerate improvements through
networked communities.“Embrace the wisdom of crowds. We can accomplish more together than even the best of us can accomplish alone.”
Six Principles Guide Our Work, Check Out Learning to Improve: How America’s Schools Can Get Better at Getting
Better (2016)

![Praise for Denise Hildreth Jones - files.tyndale.comfiles.tyndale.com/thpdata/FirstChapters/978-1-4143-6683-8.pdf · Praise for Denise Hildreth Jones “[Reclaiming Your Heart] is](https://img.dokumen.tips/doc/110x75/5ed025bd137588523c69a1e4/praise-for-denise-hildreth-jones-files-praise-for-denise-hildreth-jones-aoereclaiming.jpg)