Embed Size (px)
DESCRIPTION
Application of Stage IV Precipitation Data to Estimate Spatially Variable Recharge for a Groundwater Flow Model. Heather Moser. Mentor: Dr. William Simpkins. Groundwater for Meteorologists. Groundwater and the atmosphere: very similar! Both are fluids Flows from high to low potential. - PowerPoint PPT Presentation
Citation preview
Application of Stage IV Application of Stage IV Precipitation Data to Estimate Precipitation Data to Estimate
Spatially Spatially Variable Recharge for a Variable Recharge for a
Groundwater Flow ModelGroundwater Flow Model
Heather MoserHeather Moser
Mentor: Dr. William SimpkinsMentor: Dr. William Simpkins
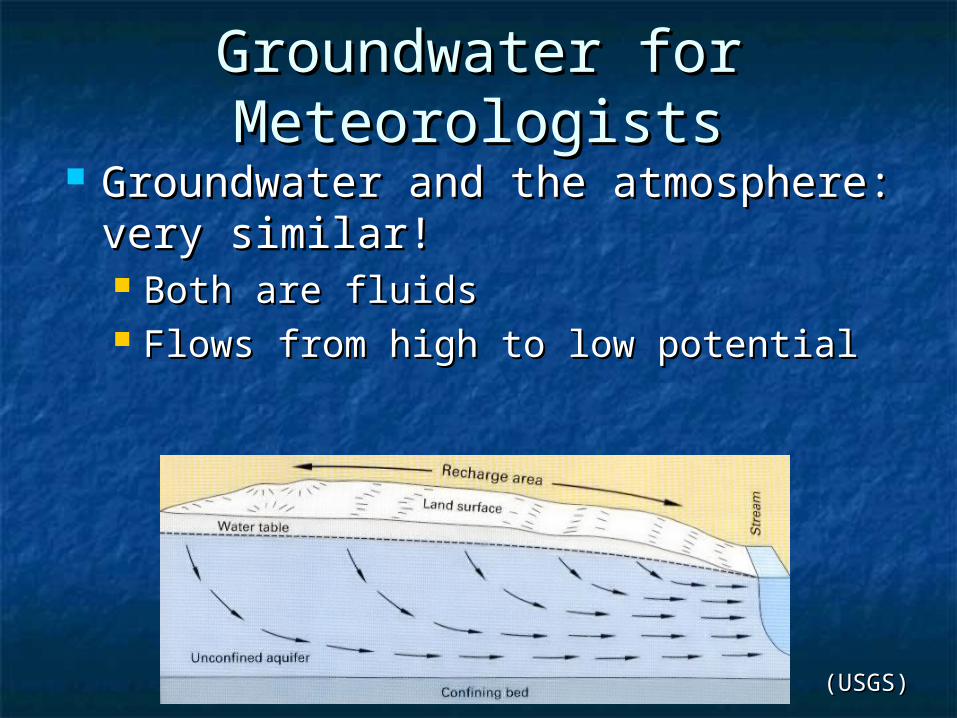
Groundwater for MeteorologistsGroundwater for Meteorologists Groundwater and the atmosphere: Groundwater and the atmosphere:
very similar!very similar! Both are fluidsBoth are fluids Flows from high to low potentialFlows from high to low potential
(USGS)(USGS)
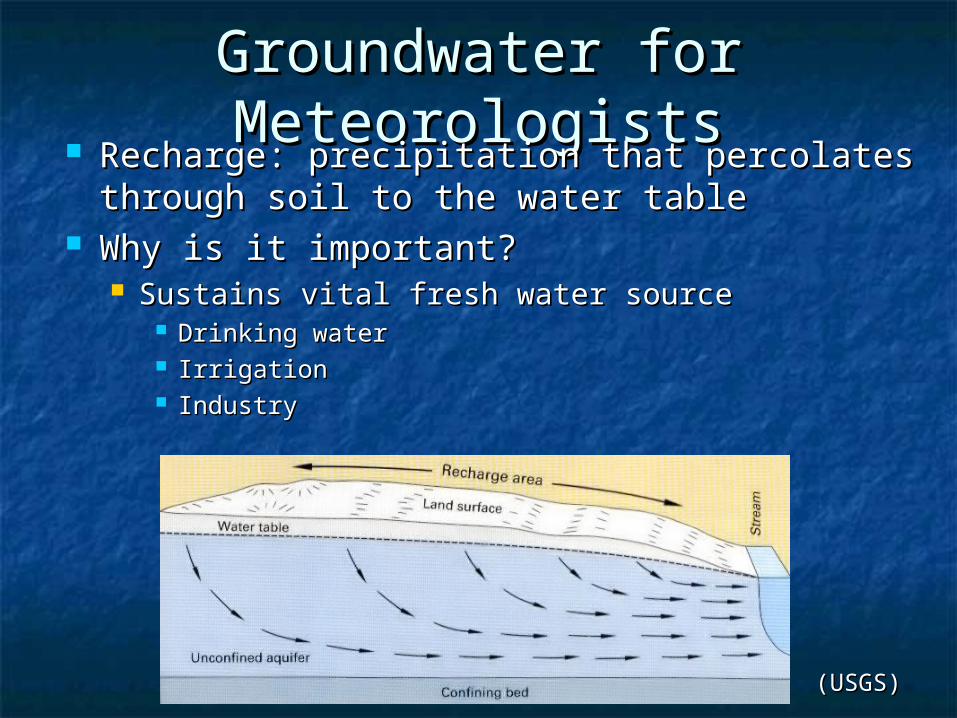
Groundwater for MeteorologistsGroundwater for Meteorologists Recharge: precipitation that percolates Recharge: precipitation that percolates
through soil to the water tablethrough soil to the water table Why is it important?Why is it important?
Sustains vital fresh water sourceSustains vital fresh water source Drinking waterDrinking water IrrigationIrrigation IndustryIndustry
(USGS)(USGS)
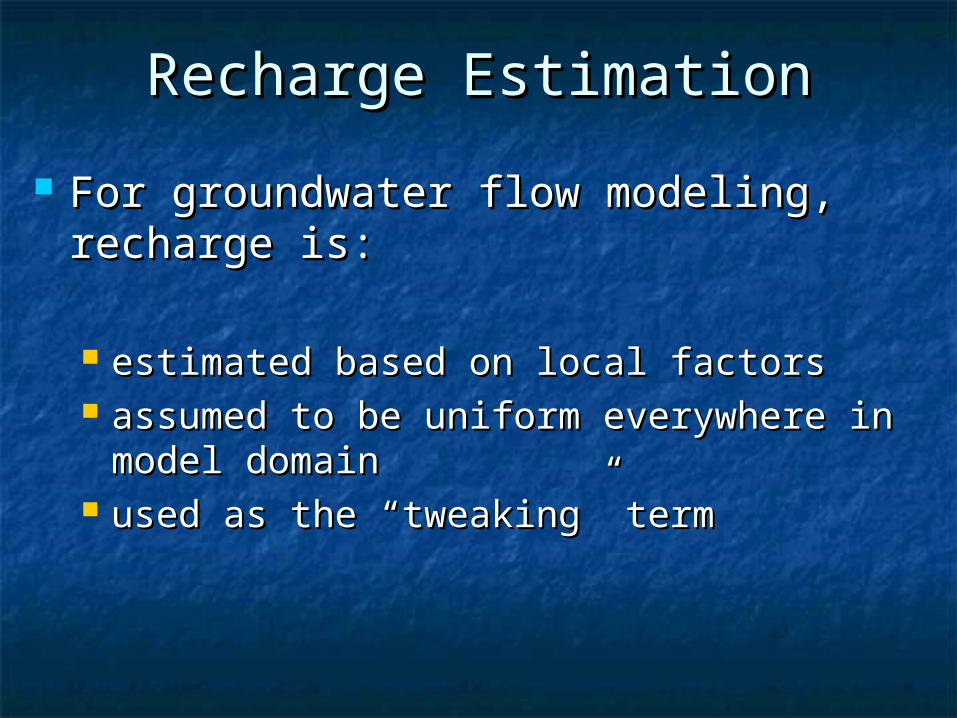
For groundwater flow modeling, For groundwater flow modeling, recharge is:recharge is:
estimated based on local factorsestimated based on local factors assumed to be uniform everywhere in assumed to be uniform everywhere in
model domainmodel domain used as the “tweaking” termused as the “tweaking” term
Recharge EstimationRecharge Estimation
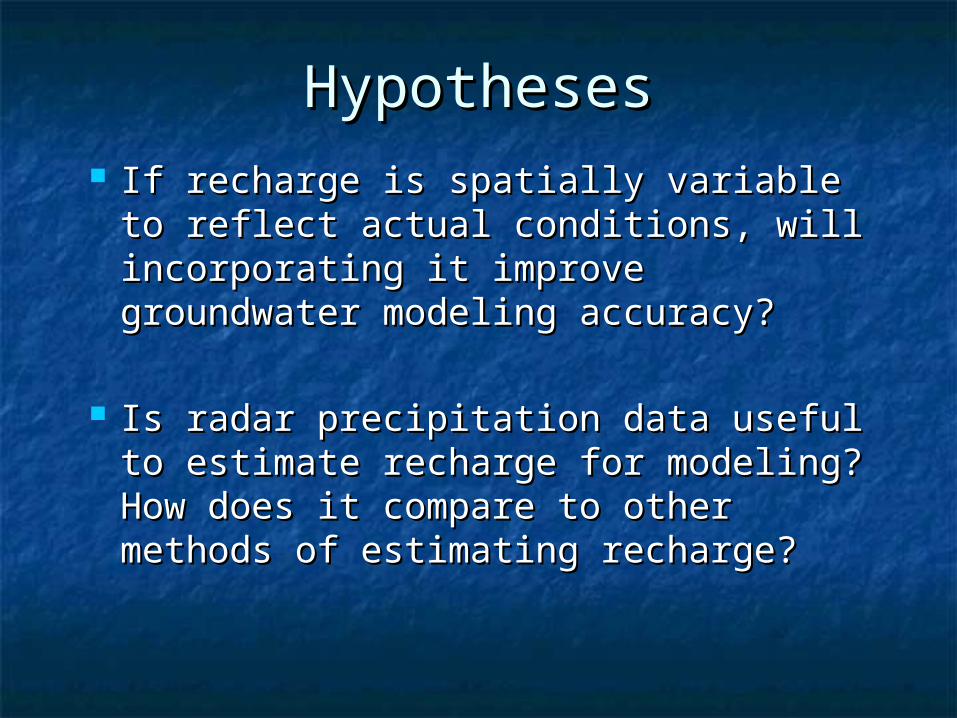
HypothesesHypotheses If recharge is spatially variable to If recharge is spatially variable to
reflect actual conditions, will reflect actual conditions, will incorporating it improve groundwater incorporating it improve groundwater modeling accuracy?modeling accuracy?
Is radar precipitation data useful to Is radar precipitation data useful to estimate recharge for modeling? How estimate recharge for modeling? How does it compare to other methods of does it compare to other methods of estimating recharge?estimating recharge?
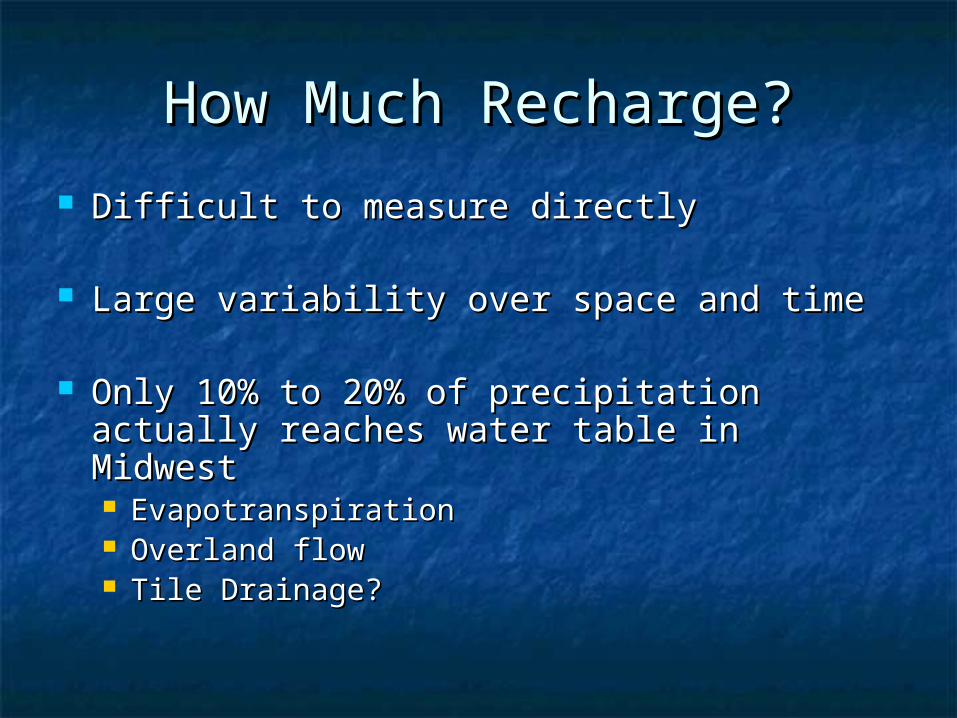
How Much Recharge?How Much Recharge?
Difficult to measure directlyDifficult to measure directly
Large variability over space and timeLarge variability over space and time
Only 10% to 20% of precipitation actually Only 10% to 20% of precipitation actually reaches water table in Midwestreaches water table in Midwest EvapotranspirationEvapotranspiration Overland flowOverland flow Tile Drainage?Tile Drainage?
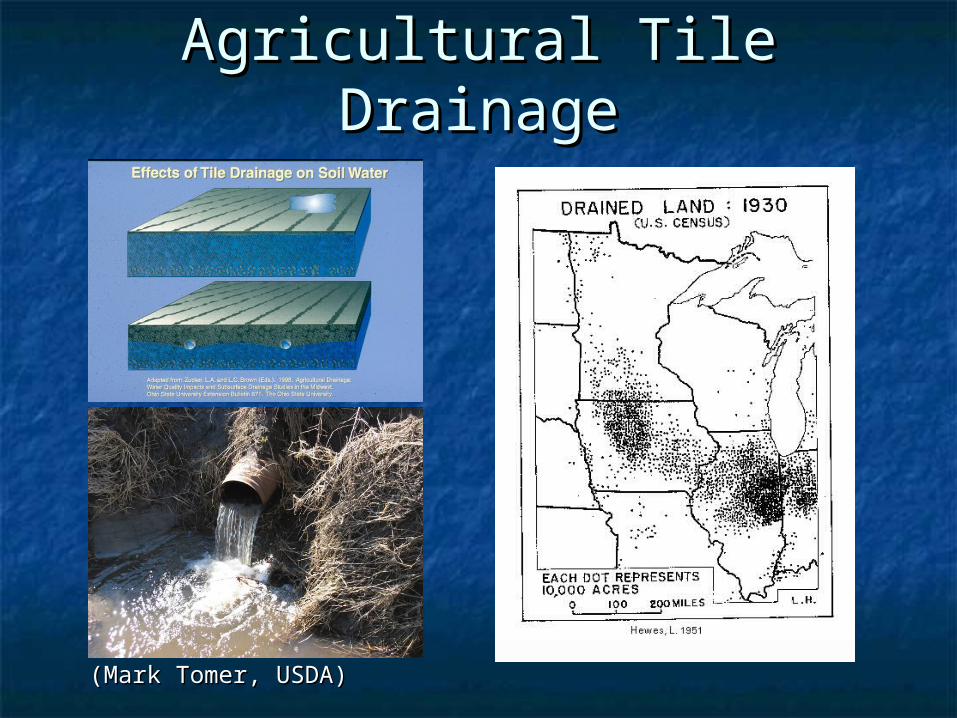
Agricultural Tile DrainageAgricultural Tile Drainage
(Mark Tomer, USDA)(Mark Tomer, USDA)
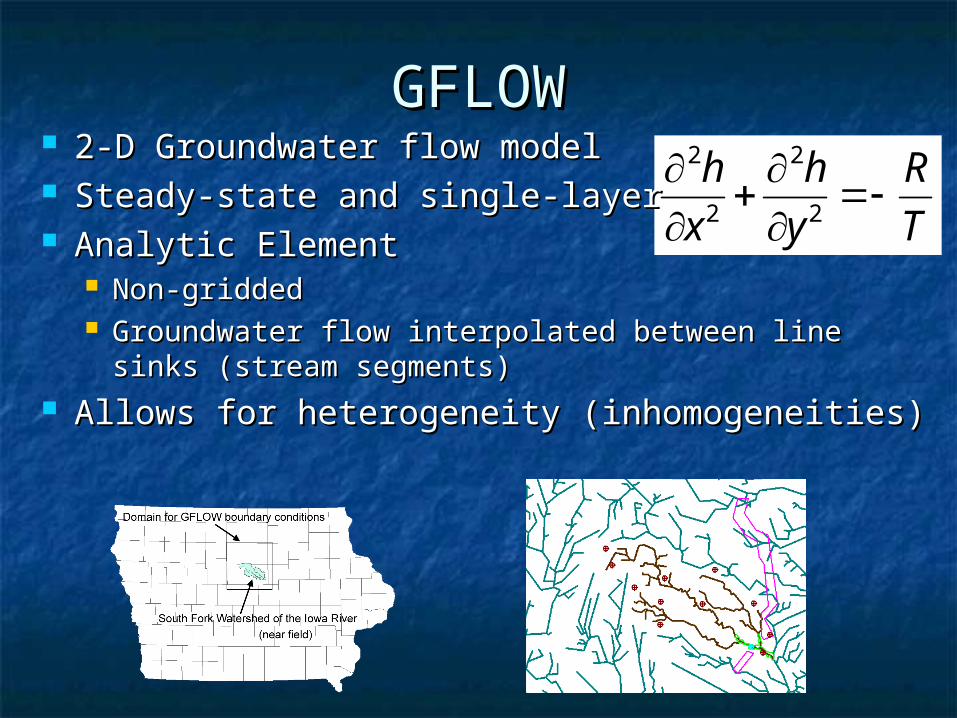
GFLOWGFLOW 2-D Groundwater flow model2-D Groundwater flow model Steady-state and single-layerSteady-state and single-layer Analytic ElementAnalytic Element
Non-griddedNon-gridded Groundwater flow interpolated between line sinks Groundwater flow interpolated between line sinks
(stream segments)(stream segments) Allows for heterogeneity (inhomogeneities)Allows for heterogeneity (inhomogeneities)
T
R
y
h
x
h
2
2
2
2
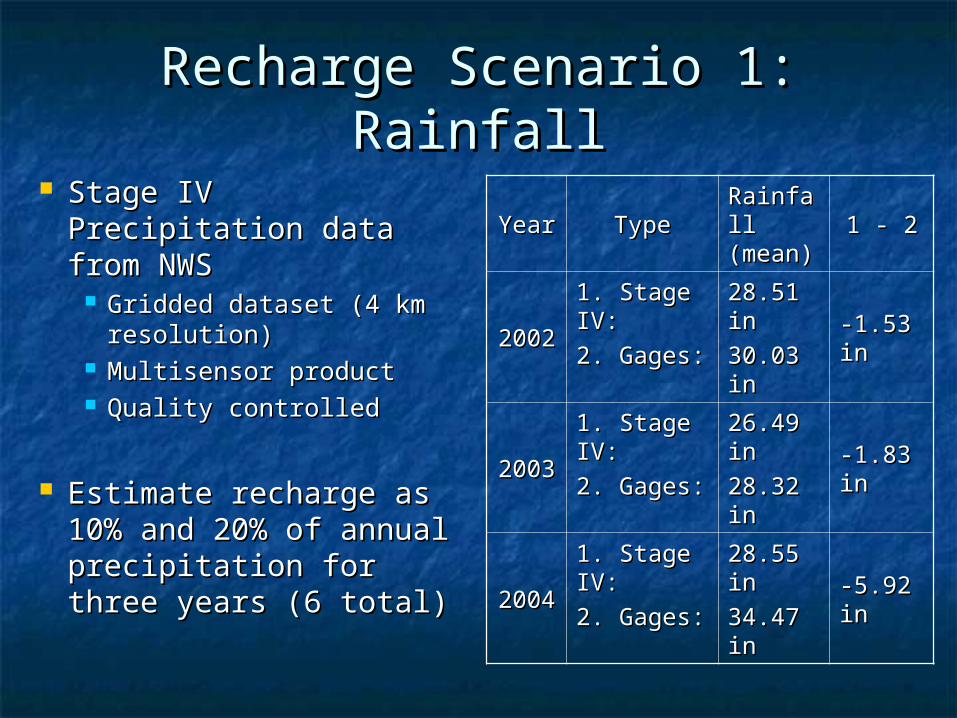
Recharge Scenario 1: RainfallRecharge Scenario 1: Rainfall
Stage IV Precipitation Stage IV Precipitation data from NWSdata from NWS
Gridded dataset (4 km Gridded dataset (4 km resolution)resolution)
Multisensor productMultisensor product Quality controlledQuality controlled
Estimate recharge as Estimate recharge as 10% and 20% of 10% and 20% of annual precipitation for annual precipitation for three years (6 total)three years (6 total)
YearYear TypeType Rainfall Rainfall (mean)(mean) 1 - 21 - 2
20022002
1. Stage 1. Stage IV:IV:
2. Gages:2. Gages:
28.51 28.51 inin
30.03 30.03 inin
-1.53 -1.53 inin
20032003
1. Stage 1. Stage IV:IV:
2. Gages:2. Gages:
26.49 26.49 inin
28.32 28.32 inin
-1.83 -1.83 inin
20042004
1. Stage 1. Stage IV:IV:
2. Gages:2. Gages:
28.55 28.55 inin
34.47 34.47 inin
-5.92 -5.92 inin
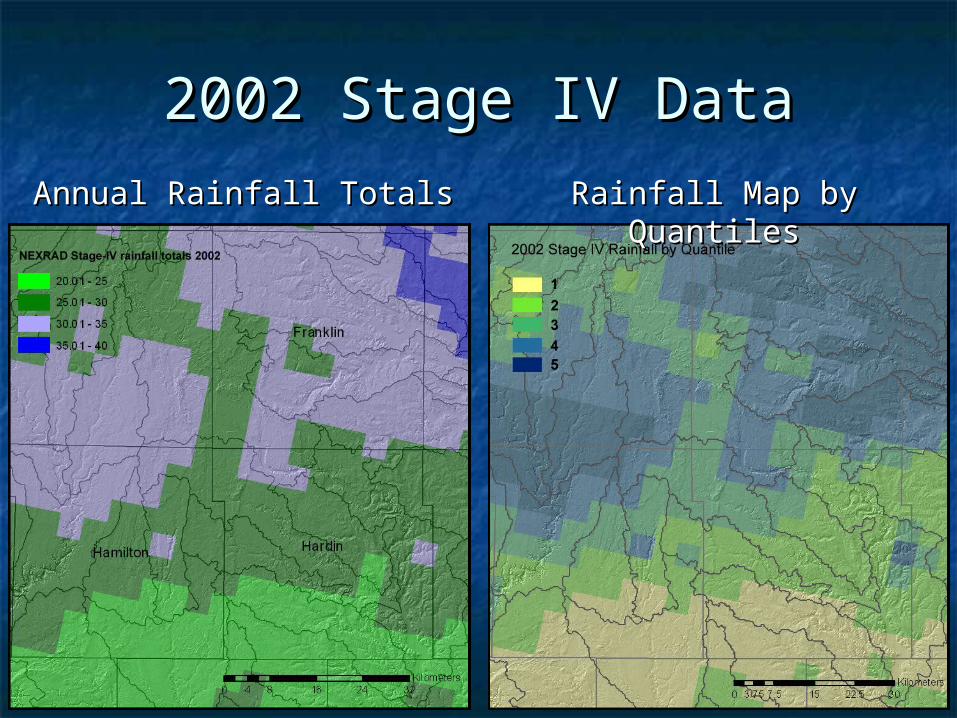
2002 Stage IV Data2002 Stage IV Data
Annual Rainfall TotalsAnnual Rainfall Totals Rainfall Map by QuantilesRainfall Map by Quantiles
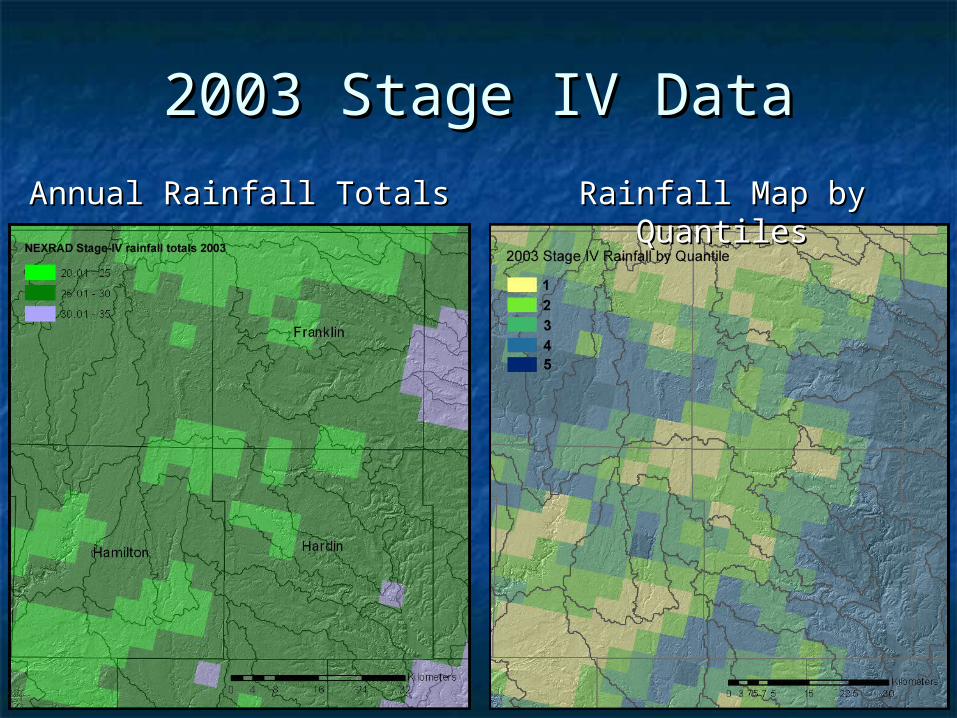
2003 Stage IV Data2003 Stage IV Data
Annual Rainfall TotalsAnnual Rainfall Totals Rainfall Map by QuantilesRainfall Map by Quantiles
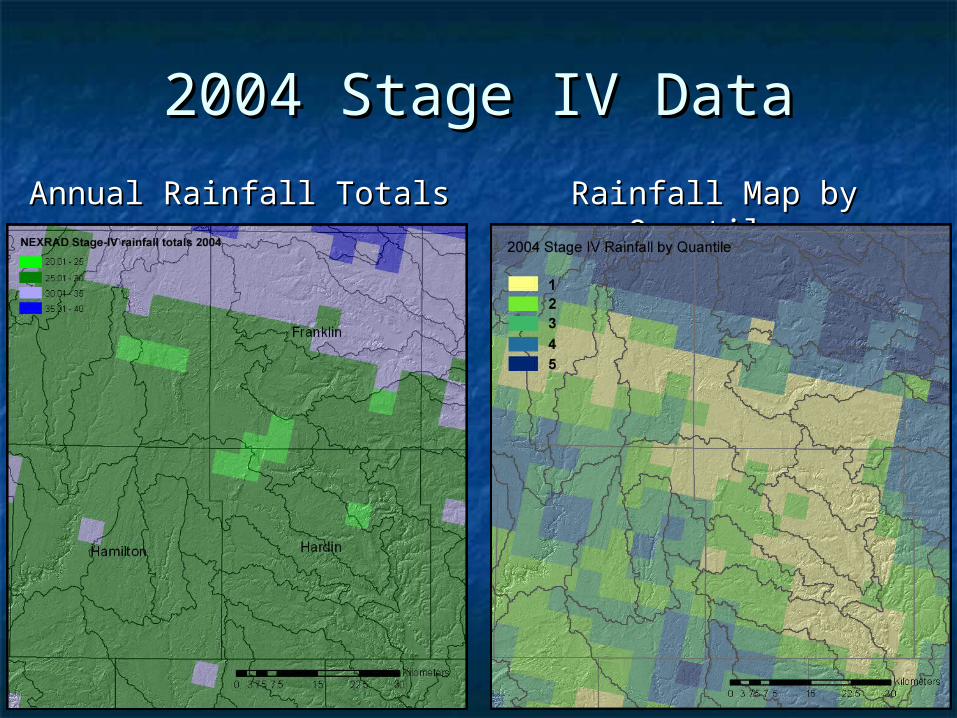
2004 Stage IV Data2004 Stage IV Data
Annual Rainfall TotalsAnnual Rainfall Totals Rainfall Map by QuantilesRainfall Map by Quantiles
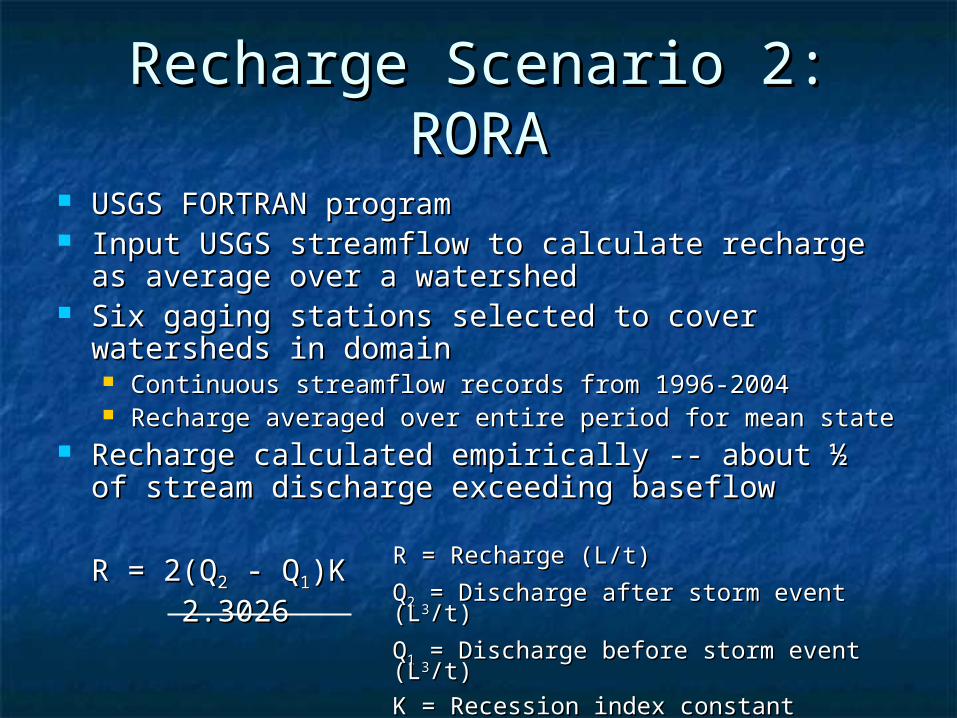
USGS FORTRAN programUSGS FORTRAN program Input USGS streamflow to calculate recharge as Input USGS streamflow to calculate recharge as
average over a watershedaverage over a watershed Six gaging stations selected to cover watersheds Six gaging stations selected to cover watersheds
in domainin domain Continuous streamflow records from 1996-2004Continuous streamflow records from 1996-2004 Recharge averaged over entire period for mean stateRecharge averaged over entire period for mean state
Recharge calculated empirically -- about ½ of Recharge calculated empirically -- about ½ of stream discharge exceeding baseflow stream discharge exceeding baseflow
R = 2(QR = 2(Q22 - Q - Q11)K)K 2.30262.3026
R = Recharge (L/t)R = Recharge (L/t)
QQ22 = Discharge after storm event (L = Discharge after storm event (L33/t)/t)
QQ11 = Discharge before storm event (L = Discharge before storm event (L33/t)/t)
K = Recession index constantK = Recession index constant
Recharge Scenario 2: RORARecharge Scenario 2: RORA
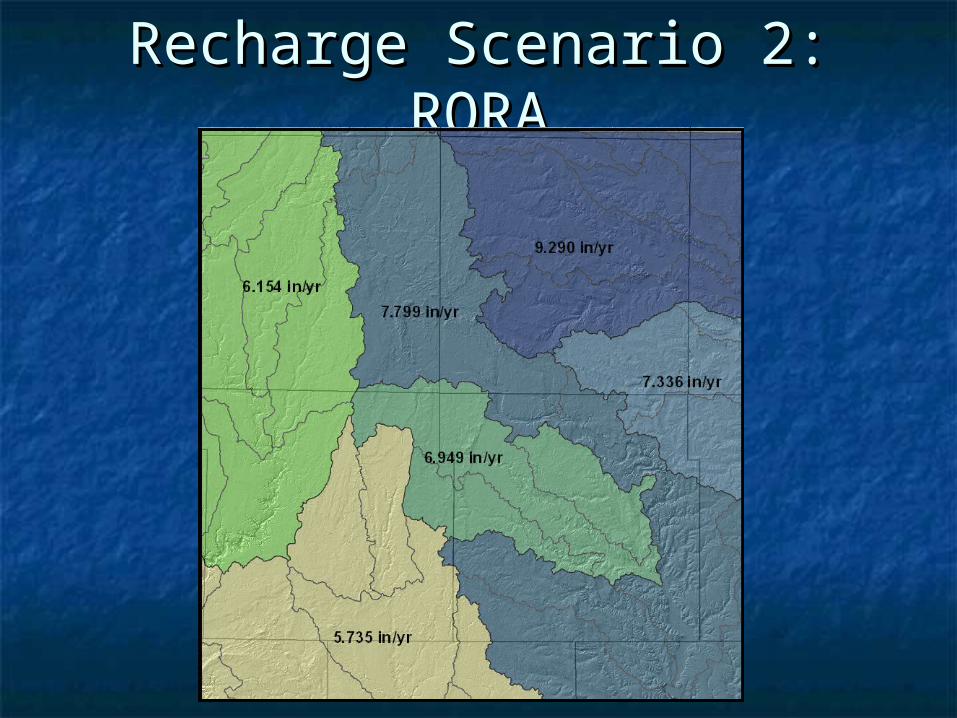
Recharge Scenario 2: RORARecharge Scenario 2: RORA
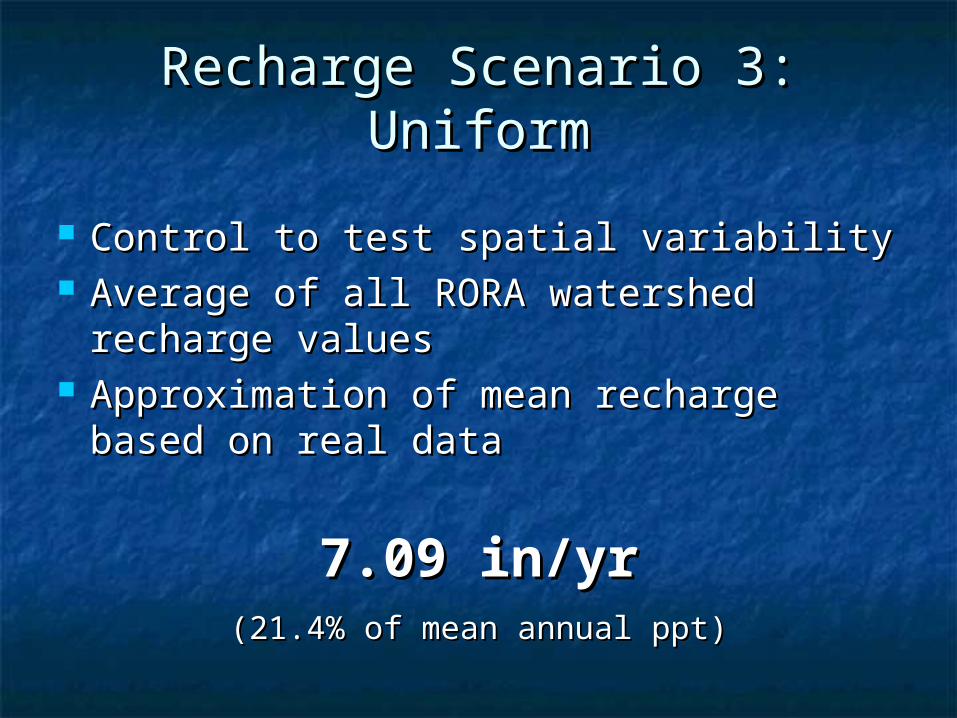
Control to test spatial variabilityControl to test spatial variability Average of all RORA watershed Average of all RORA watershed
recharge valuesrecharge values Approximation of mean recharge Approximation of mean recharge
based on real databased on real data
Recharge Scenario 3: UniformRecharge Scenario 3: Uniform
7.09 in/yr7.09 in/yr(21.4% of mean annual ppt)(21.4% of mean annual ppt)
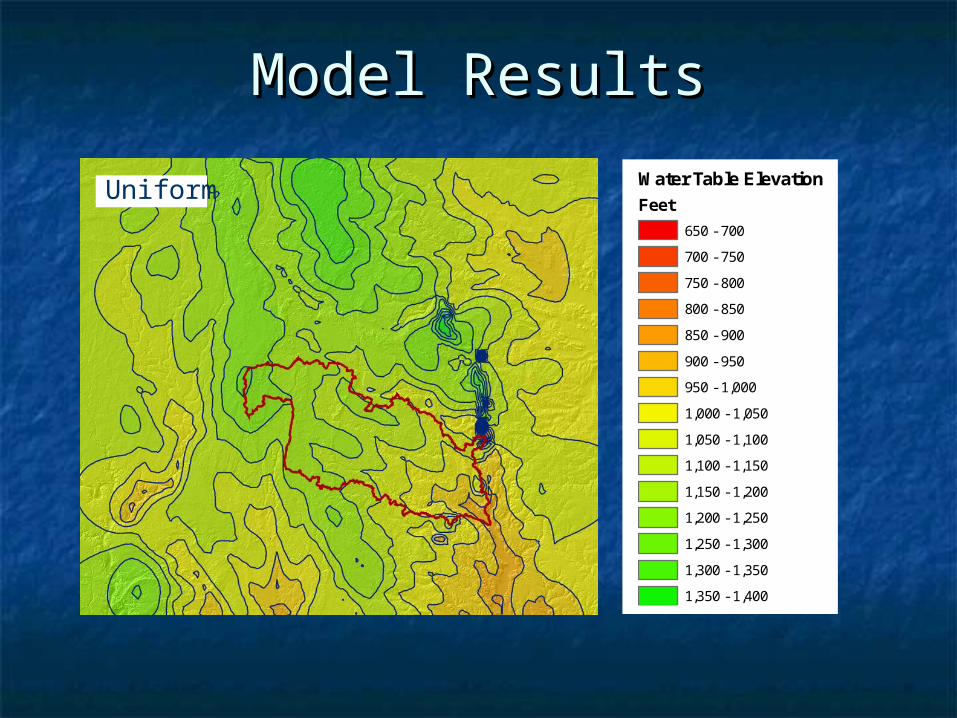
Water Table Elevation
Feet
650 - 700
700 - 750
750 - 800
800 - 850
850 - 900
900 - 950
950 - 1,000
1,000 - 1,050
1,050 - 1,100
1,100 - 1,150
1,150 - 1,200
1,200 - 1,250
1,250 - 1,300
1,300 - 1,350
1,350 - 1,400
Uniform
Model ResultsModel Results
Uniform
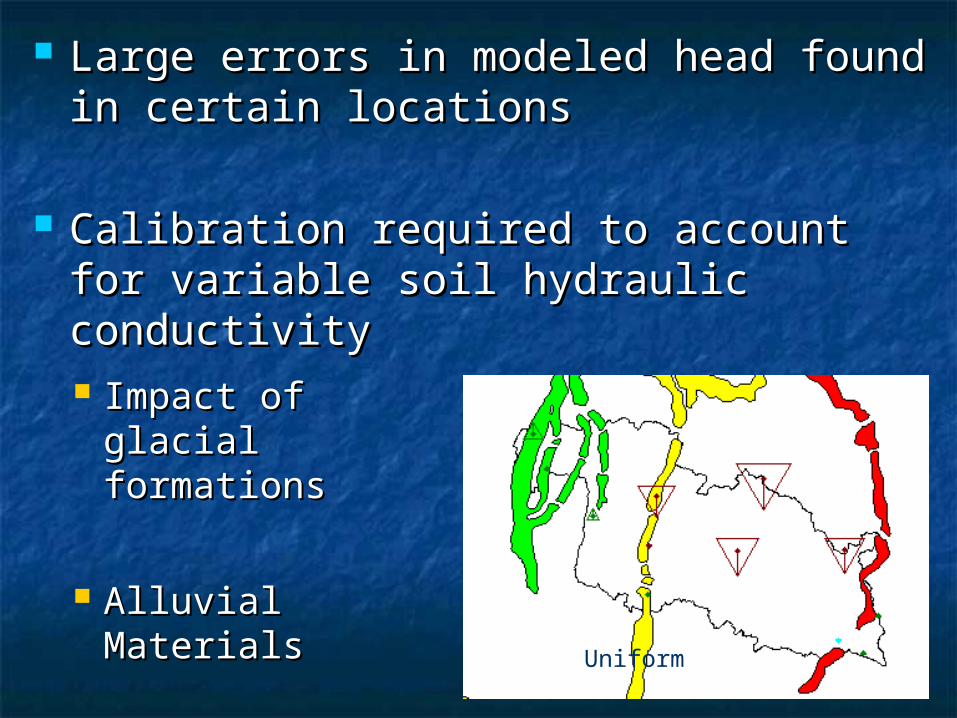
Large errors in modeled head found in Large errors in modeled head found in certain locationscertain locations
Calibration required to account for Calibration required to account for variable soil hydraulic conductivityvariable soil hydraulic conductivity
Impact of glacial Impact of glacial formationsformations
Alluvial MaterialsAlluvial Materials
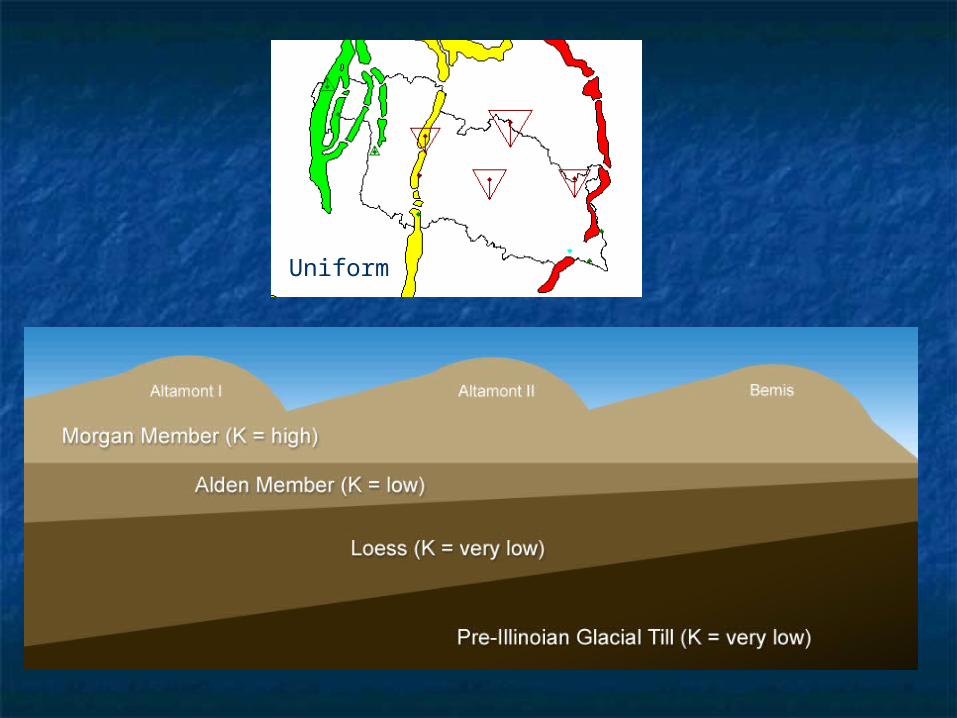
Uniform
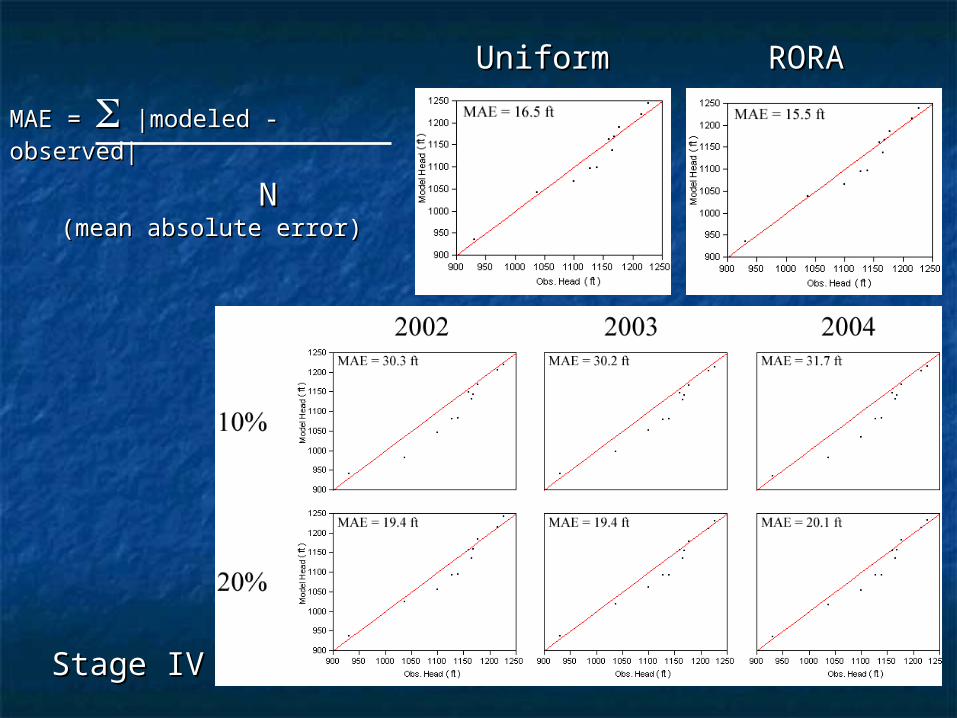
UniformUniform RORARORA
Stage IVStage IV
MAE =MAE = |modeled - observed||modeled - observed|
NN
(mean absolute error)(mean absolute error)
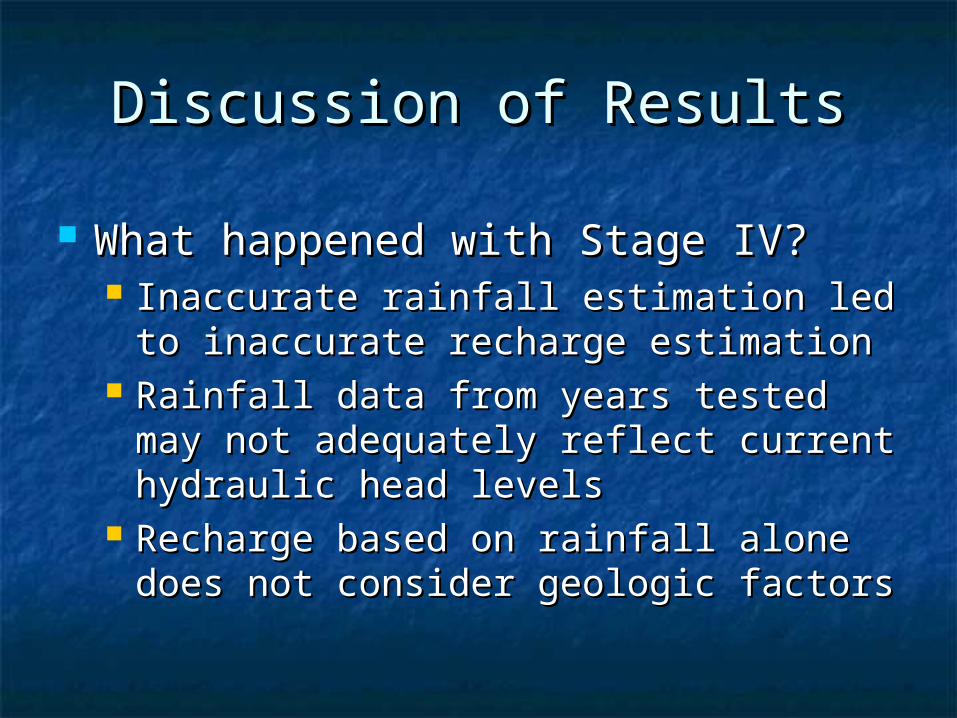
Discussion of ResultsDiscussion of Results
What happened with Stage IV?What happened with Stage IV? Inaccurate rainfall estimation led to Inaccurate rainfall estimation led to
inaccurate recharge estimationinaccurate recharge estimation Rainfall data from years tested may not Rainfall data from years tested may not
adequately reflect current hydraulic adequately reflect current hydraulic head levelshead levels
Recharge based on rainfall alone does Recharge based on rainfall alone does not consider geologic factorsnot consider geologic factors
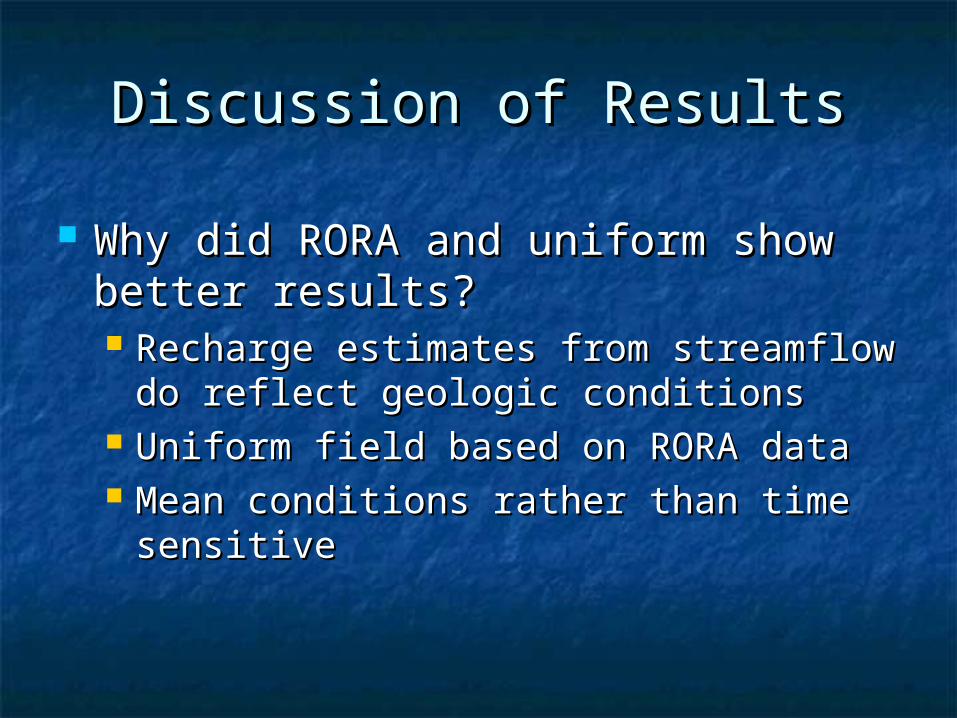
Discussion of ResultsDiscussion of Results
Why did RORA and uniform show Why did RORA and uniform show better results?better results? Recharge estimates from streamflow do Recharge estimates from streamflow do
reflect geologic conditionsreflect geologic conditions Uniform field based on RORA dataUniform field based on RORA data Mean conditions rather than time Mean conditions rather than time
sensitivesensitive
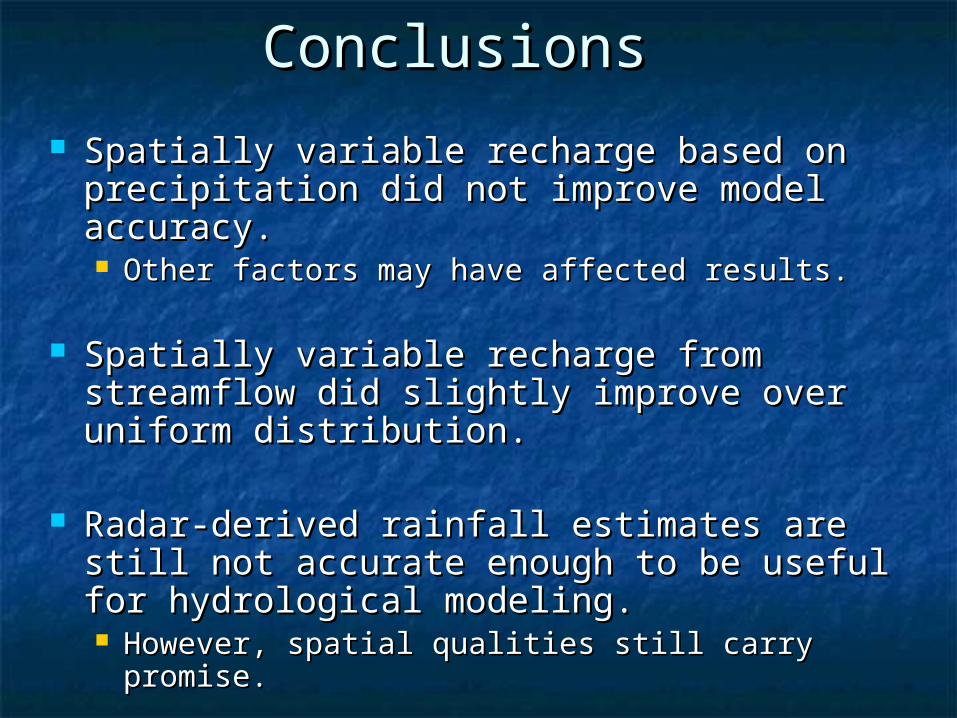
ConclusionsConclusions
Spatially variable recharge based on Spatially variable recharge based on precipitation did not improve model precipitation did not improve model accuracy.accuracy. Other factors may have affected results.Other factors may have affected results.
Spatially variable recharge from Spatially variable recharge from streamflow did slightly improve over streamflow did slightly improve over uniform distribution.uniform distribution.
Radar-derived rainfall estimates are still Radar-derived rainfall estimates are still not accurate enough to be useful for not accurate enough to be useful for hydrological modeling.hydrological modeling. However, spatial qualities still carry promise.However, spatial qualities still carry promise.
Future WorkFuture Work
Put rainfall and soil data togetherPut rainfall and soil data together
Account for effective hydraulic Account for effective hydraulic conductivityconductivity
Test a watershed where tile drainage Test a watershed where tile drainage does not effect aquiferdoes not effect aquifer
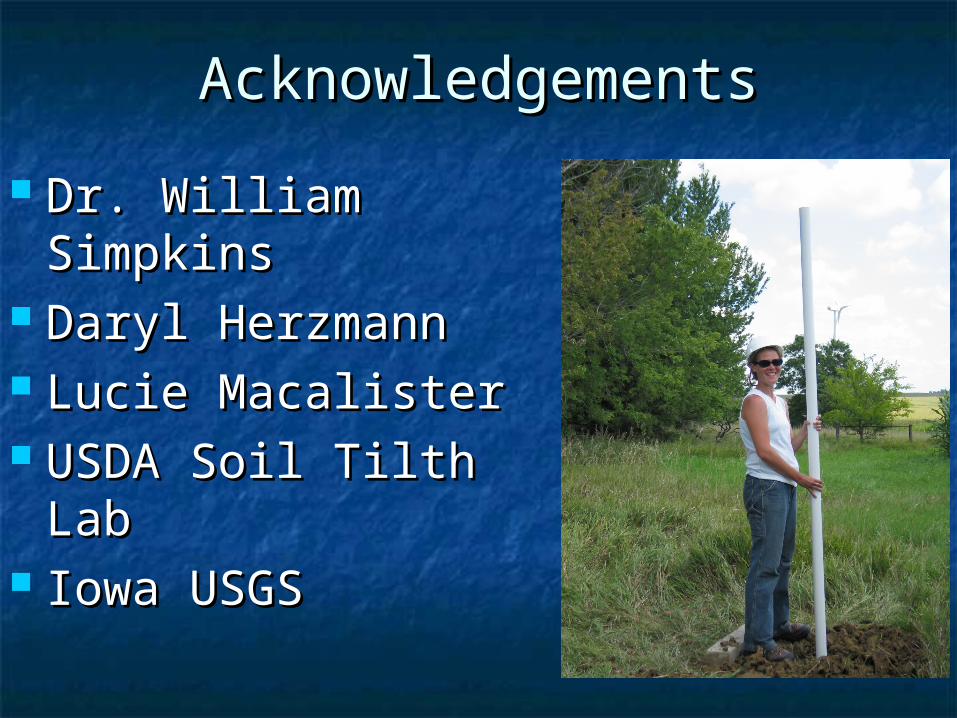
AcknowledgementsAcknowledgements
Dr. William SimpkinsDr. William Simpkins Daryl HerzmannDaryl Herzmann Lucie MacalisterLucie Macalister USDA Soil Tilth LabUSDA Soil Tilth Lab Iowa USGSIowa USGS
Questions?Questions?
[email protected]@iastate.edu
http://www.meteor.iastate.edu/~miraje/http://www.meteor.iastate.edu/~miraje/thesisthesis