Embed Size (px)
Citation preview

Healthy People 2020 Progress Review: Diabetes & Chronic Kidney Disease
September 29, 2014

Prevention Treatment and Care of Diabetes and Chronic Kidney Diseases:
A Healthy People 2020 Progress Review

Wanda Jones, DrPH Acting Assistant Secretary for Health
U.S. Department of Health and Human Services

Overview and Presenters
Chair ■ Wanda Jones, DrPh, Acting Assistant Secretary for Health U.S. Department of Health and Human Services Presentations
■ Rebecca Hines, MHS, Chief, Health Promotion Statistics Branch National Center for Health Statistics, CDC
■ Andrew Narva, MD, Director, National Kidney Disease Education Program National Institute of Diabetes & Digestive & Kidney Disease, NIH
■ Ann Albright, PhD, RD, Director, Division of Diabetes Translation, National Center for Chronic Disease Prevention and Health Promotion, CDC
Community Highlight
■ Karen Wauchope, RN, BSN, CDE, Manager, Clinical Community Programs, EmblemHealth

Healthy People 2020 Evolves

What is Diabetes?
■ Diabetes is a group of diseases marked by high levels of blood glucose resulting from problems in how insulin is produced, how insulin works, or both.
■ Diabetes types:
– Type 1 Diabetes
– Type 2 Diabetes – 90-95% of all adults diagnosed
– Gestational Diabetes
– Other Types of Diabetes
SOURCES: Centers for Disease Control and Prevention. National Diabetes Statistics Report: Estimates of Diabetes and Its Burden in the United States, 2014. Atlanta, GA: US Department of Health and Human Services; 2014. 6

Obesity and diabetes prevalence 1991-2011
7

Chronic Kidney Disease (CKD)
■ Chronic Kidney Disease is a gradual and permanent loss of kidney function
■ CKD is caused by:
Diabetes Hypertension Glomerulonephritis or Polycystic kidney disease Other conditions (atherosclerosis, HIV, sickle cell
disease, kidney stones, chronic kidney infections) ■ More than 20 million US adults may have CKD
8
U.S. Renal Data System, USRDS 2013 Annual Data Report: Atlas of Chronic Kidney Disease and End-Stage Renal Disease in the United States. National Institutes of Health, National Institute of Diabetes and Digestive and Kidney Diseases, Bethesda, MD, 2013. Available at http://www.usrds.org/atlas.aspx.

CKD and End Stage Renal Disease (ESRD)
■ Medical treatment goals for CKD patients:
Slow the progression of CKD Treat underlying causes Treat complications Replace loss of kidney function
■ ESRD is a total and permanent kidney failure
■ Renal replacement therapies for ESRD patients:
Hemodialysis Peritoneal dialysis Kidney transplantation
9
U.S. Renal Data System, USRDS 2013 Annual Data Report: Atlas of Chronic Kidney Disease and End-Stage Renal Disease in the United States. National Institutes of Health, National Institute of Diabetes and Digestive and Kidney Diseases, Bethesda, MD, 2013. Available at http://www.usrds.org/atlas.aspx.

Diabetes and Chronic Kidney Disease: Connection
■ Adults with diabetes are two to three times as likely to have CKD and make up 44% of new ESRD cases
■ Similar disease management
■ In 2011:
■ $85.9 billion – diabetes Medicare expenditures
■ $45.5 billion – CKD Medicare expenditures
SOURCES: Centers for Disease Control and Prevention. National Diabetes Statistics Report: Estimates of Diabetes and Its Burden in the United States, 2014. Atlanta, GA: US Department of Health and Human Services; 2014. U.S. Renal Data System, USRDS 2013 Annual Data Report: Atlas of Chronic Kidney Disease and End-Stage Renal Disease in the United States, National Institutes of Health, National Institute of Diabetes and Digestive and Kidney Diseases, Bethesda, MD, 2013. Centers for Disease Control and Prevention. Chronic Kidney Disease Surveillance System—United States. Available at http://nccd.cdc.gov/CKD. Centers for Disease Control and Prevention (CDC). National Chronic Kidney Disease Fact Sheet, 2014. Atlanta, GA: US Department of Health and Human Services, Centers for Disease Control and Prevention; 2014.
10

Rebecca Hines, MHS Chief, Health Promotion Statistics Branch
National Center for Health Statistics Centers for Disease Control and Prevention

■ Tracking the Nation’s Progress
■ Diabetes
Burden
Treatment and Care
Prevention
■ Chronic Kidney Disease Prevalence of Chronic Kidney Disease (CKD)
Medical evaluation
New cases of End-Stage Renal Disease (ESRD)
ESRD deaths
Presentation Overview
12

Tracking the Nation’s Progress
■ 18 HP2020 Measurable Diabetes Objectives:
■ 24 HP2020 Measurable Chronic Kidney Disease Objectives:
NOTES: The Diabetes Topic Area contains 1 informational objective and 2 developmental objectives. The CKD Topic Area contains 2 informational objectives. Measurable objectives are defined as having at least one data point currently available, or a baseline, and anticipate additional data points throughout the decade to track progress. Informational objectives are also measurable objectives, however, they do not have a target associated with their data. Developmental objectives lack baseline data and targets.
13
4 Target met 1 Improving
11 Little or No detectable change 0 Getting worse 1 Baseline data only 1 Informational
9 Targets met 5 Improving 4 Little or No detectable change 2 Getting worse 2 Baseline data only 2 Informational

Burden of Diabetes
■ Affects 29.1 million or 9.3% of the U.S. population (2012, all ages)
Diagnosed: 21.0 million people
Undiagnosed: 8.1 million people
■ 7th leading underlying cause of death (2011)
■ The total cost of diabetes in the U.S.: $245 billion (2012)
$176 billion in direct medical costs
$69 billion in indirect costs including disability, work loss, premature mortality
■ NCHS data for diabetes do not differentiate by type of diabetes. Gestational diabetes is excluded from our data.
SOURCES: Centers for Disease Control and Prevention. National Diabetes Statistics Report: Estimates of Diabetes and Its Burden in the United States, 2014. Atlanta, GA: US Department of Health and Human Services; 2014; CDC/NCHS, National Vital Statistics System, Mortality 2011. Available at http://www.cdc.gov/nchs/data/dvs/LCWK9_2011.pdf. 14

0
2
4
6
8
10
2002 2004 2006 2008 2010 2012
Prevalence of Diagnosed Diabetes, 1997–2012
NOTES: Data are for prevalence of diagnosed diabetes. Diagnosed diabetes is defined as self-reported physician diagnosed diabetes. Women who only had diabetes while pregnant and persons with borderline diabetes are excluded. Data for total are for adults aged 18 years and over and are age adjusted to the 2000 standard population.
Percent
SOURCE: National Health Interview Survey (NHIS), CDC/NCHS; Summary Health Statistics for U.S. Adults: National Health Interview Survey, 1997-2012. 15

Obj. D-1 Decrease desired
0
3
6
9
12
15
1997-1999
2000-2002
2003-2005
2006-2008
2009-2011
2011-2013
New Cases of Diagnosed Diabetes Per 1,000 Per Year, Adults 18–84 Years, 1997–2013
Rate Per 1,000
SOURCE: National Health Interview Survey (NHIS), CDC/NCHS. 16
NOTES: Data are for three year estimates of diagnosed diabetes in the past year. Data are for adults aged 18-84 years and are age adjusted to the 2000 standard population. Diagnosed diabetes is defined as self-reported physician diagnosed diabetes. Women who only had diabetes while pregnant and persons with borderline diabetes are excluded. 2011-2013 is the most recent data year currently available.
Total HP2020 Target: 7.2

Obj. D-1 Decrease desired
0
3
6
9
12
15
1997-1999
2000-2002
2003-2005
2006-2008
2009-2011
2011-2013
New Cases of Diagnosed Diabetes Per 1,000 Per Year, Adults 18–84 Years, 1997–2013
Rate Per 1,000
SOURCE: National Health Interview Survey (NHIS), CDC/NCHS. 17
NOTES: Data are for three year estimates of diagnosed diabetes in the past year. Diagnosed diabetes is defined as self-reported physician diagnosed diabetes. Women who only had diabetes while pregnant and persons with borderline diabetes are excluded. 2011-2013 is the most recent data year currently available.
45–64 years
65–74 years
75–84 years
18–44 years

0 5 10 15
2006-2008 Total*2011-2013 Total
Male Female
BlackHispanic
WhiteAsian
<100 100-199 200-399 400-599
600+
Rate Per 1,000
New Cases of Diagnosed Diabetes Per 1,000 Per Year, Adults 18–84 Years, 2011–2013
HP2020 Target: 7.2 per 1000
Obj. D-1
18
NOTES: = 95% confidence interval. *2006-2008 data – HP2020 baseline. Data are for three year average of diagnosed diabetes in the past year for adults aged 18-84 years and are age adjusted to the 2000 standard population. Diagnosed diabetes is defined as self-reported physician diagnosed diabetes. Women who only had diabetes while pregnant and persons with borderline diabetes are excluded. Persons of Hispanic origin may be any race. The categories Black and White exclude persons of Hispanic origin. Respondents were asked to select one or more races. Data for the single race categories are for persons who reported only one racial group. Data for American Indian/Alaska Native, Native Hawaiian or other Pacific Islander, and 2 or more races are not shown because they are statistically unreliable (DSU). SOURCE: National Health Interview Survey (NHIS), CDC/NCHS.
Family Income
(percent poverty
threshold)
Decrease desired
I

0 20 40 60 80 100
2005-2008 Total*
2009-2012 Total
Male
Female
Black
White
Hispanic
Private
Public
Uninsured
Percent
Proportion of Diabetes That is Diagnosed, Adults 20+ Years, 2009–2012
HP2020 Target: 80.1%
Obj. D-15
19
NOTES: = 95% confidence interval. *2005-2008 data – HP2020 baseline. Data are for adults aged 20 years and over with diabetes and are age adjusted to the 2000 standard population. Diabetes is defined as diagnosed diabetes -OR- fasting blood glucose greater or equal to 126 mg/dL -OR- HbA1c level greater or equal to 6.5%. Diagnosed diabetes is defined as self-reported physician diagnosed diabetes. Women who only had diabetes while pregnant and persons with borderline diabetes are excluded. The categories black and white include persons who reported only one racial group and exclude persons of Hispanic origin. Persons of Hispanic origin may be any race.
SOURCE: National Health and Nutrition Examination Survey (NHANES), CDC/NCHS.
Increase desired
I
Health Insurance
Status (aged 20-64)

Diabetes: Co-Existing Conditions and Complications
■ Hypoglycemia and hyperglycemic crisis ■ High blood pressure ■ High LDL cholesterol ■ Heart disease and stroke ■ Blindness and eye problems ■ Kidney disease ■ Amputations ■ Nerve disease ■ Non-alcoholic fatty liver disease ■ Periodontal disease ■ Hearing loss ■ Erectile dysfunction ■ Depression ■ Complications of pregnancy
SOURCES: Centers for Disease Control and Prevention. National Diabetes Statistics Report: Estimates of Diabetes and Its Burden in the United States, 2014. Atlanta, GA: US Department of Health and Human Services; 2014. 20

0
10
20
30
40
50
60
7
80 Increase desired
0 HP2020 Target: HP2020 Target: 58.3% 57.0%
90 2005-2008 2009-2012 Percent
LDL Cholesterol Blood pressure <100 mg/dL <130/80 mm Hg
ed 18 years and over with diagnosed diabetes and are age adjusted to the 2000 eported physician diagnosed diabetes. Women who only had diabetes while . Criteria for LDL Cholesterol control and blood pressure control were chosen to
t the time the objectives were set. s (NHANES), CDC/NCHS. Objs. D-5.1, D-6, D-7 21
HbA1c >9%
Increase desired
HP2020 Target: 16.1%
Decrease desired
Glycemic, Cholesterol, and Blood Pressure Control in Adults with Diagnosed Diabetes
SOURCE: National Health and Nutrition Examination Survey
NOTES: I = 95% confidence interval. Data are for adults agstandard population. Diagnosed diabetes is defined as self-rpregnant and persons with borderline diabetes are excludedfollow the 2010 American Diabetes Association guidelines a

0
2
4
6
8
10
Total Black White Male Female
Race Sex
NOTES: I = 95% confidence interval. *Indicates Healthy People 2020 baseline year for this measure. This objective is being tracked without a target. Data are age adjusted to the 2000 standard population and include any amputation of lower limb. For NHDS data prior to 2000, only one race category was recorded; reporting more than one race was not an option. For NHIS data prior to 1999, respondents reported one or more races and identified one race as best representing their race. Respondents were asked to select one or more races starting in 1999 (NHIS) or 2000 (NHDS), although more than one race selection was not used for 1999 NHIS data in order to be consistent with 1997-1998 data. Data for the single race categories shown are for persons who reported only one racial group. SOURCE: National Hospital Discharge Survey (NHDS) and National Health Interview Survey (NHIS), CDC/NCHS. Obj. D-4 22
Lower Extremity Amputations Among Persons with Diabetes
Rate per 1,000 1997-1999 2005-2007* 2008-2010 12

Prediabetes (High Risk Group)
■ Prediabetes is a condition in which people have high blood glucose or hemoglobin A1c levels above normal, but not high enough to be classified as diabetes.
■ Prediabetes affects 86 million or 37% of the U.S. adult population (ages 20+, 2009-2012).
■ For Healthy People measures, persons are considered at high risk for diabetes if they:
did not report diagnosed diabetes -and- had fasting glucose ≥100 and <126 mg/dL -or-
an HbA1c value ≥5.7% and <6.5%.
SOURCE: Centers for Disease Control and Prevention. National Diabetes Statistics Report: Estimates of Diabetes and Its Burden in the United States, 2014. Atlanta, GA: US Department of Health and Human Services; 2014. 23

0
10
20
30
40
50
60
70
Increased Physical Activity
HP2020 Target: 49.1% HP2020 Target: 53.4% HP2020 Target: 55.0%
Fat or Calorie Reduction
Percent
24 SOURCE: National Health and Nutrition Examination Surveys (NHANES), CDC/NCHS.
NOTES: I = 95% confidence interval. Data are for adults aged 18 years and over at high risk for diabetes and are age adjusted to the 2000 standard population. Persons are considered at high risk for diabetes if they: did not report diagnosed diabetes and had fasting glucose ≥100 and <126 mg/dL or an HbA1c value ≥5.7% to <6.5%. Two-year and four-year data are not comparable. Different age adjustment groups are used for two-year and four-year data. Two-year estimates are generally less stable and reliable than four-year estimates.
Weight Control/Loss
Prevention Behaviors in Adults at High Risk for Diabetes
Objs. D-16.1, 16.2, 16.3 Increase desired
2005-2008 2011-2012

■ Tracking the Nation’s Progress
■ Diabetes
■ Chronic Kidney Disease
Prevalence of Chronic Kidney Disease (CKD)
Medical evaluation
New cases of End-Stage Renal Disease (ESRD)
ESRD deaths
Presentation Overview
25

CKD and ESRD Burden, 2011
■ 615,899 patients received treatment for ESRD
■ 115,643 new ESRD cases reported
■ 17,671 patients received kidney transplantations
■ Median time on transplant wait list for adults: 2.6 years
■ Medicare CKD expenditures: $45.5 billion (nearly 20% of total Medicare expenditures)
■ Total ESRD costs: $49.3 billion including $34.4 billion of Medicare expenditures
26
SOURCE: National Chronic Kidney Disease Fact Sheet, 2014. US DHHS, Centers for Disease Control and Prevention, Atlanta, GA: 2014. Available at http://www.cdc.gov/diabetes/pubs/factsheets/kidney.htm. U.S. Renal Data System, USRDS 2013 Annual Data Report: Atlas of Chronic Kidney Disease and End-Stage Renal Disease in the United States. National Institutes of Health, National Institute of Diabetes and Digestive and Kidney Diseases, Bethesda, MD, 2013. Available at http://www.usrds.org/atlas.aspx.

0 10 20 30 40 50
-04 Total*Total
Male Female
White American Black
<100 100-199 200-399 400-499
500+
18-44 45-64
65+s)
Decrease desired
Percent
HP2020 Target: 13.7% 1999
Mexican
Age (year
Family Income
(percent poverty
threshold)
Chronic Kidney Disease, Adults, 2005–2010
Obj. CKD-1
27
NOTES: = 95% confidence interval. *HP2020 baseline. Data are for adults 18 years+ with CKD stages 1-4. Stage 1 is defined as estimated glomerular filtration rate (eGFR) ≥90 ml/min/1.73 m² and urinary albumin/creatinine ratio (ACR) ≥30 mg/g; stage 2: eGFR 60-89 ml/min/1.73 m² and ACR ≥30 mg/g; stages 3 and 4: eGFR 30-59 and 15-29 ml/min/1.73 m², respectively. Except for age specific groups, data are age adjusted to the 2000 standard population. Respondents were asked to select one or more races. The categories black and white include persons who reported only one racial group and exclude persons of Hispanic origin. Mexican American persons may be of any race.
SOURCE: National Health and Nutrition Examination Survey (NHANES), CDC/NCHS.
I

0 10 20 30 40 50 60 70 80 90 100
1999-04 Total*Total
FemaleMale
WhiteMexican American
Black
<100100-199200-399400-499
500+
18-4445-64
65+
Percent
Hypertension in Adults with CKD, 2005–2010 HP2020 Target: 49.2%
Obj. CKD-6.1 28
NOTES: = 95% confidence interval. *HP2020 baseline. Data are for adults 18 years+ with CKD stages 1-4 and either self-reported hypertension, reported prescription for hypertension medication, or measured high systolic (≥140 mmHg) or diastolic (≥90 mmHg) blood pressure. Except for age specific groups, data are age adjusted to the 2000 standard population. Respondents were asked to select one or more races. The categories black and white include persons who reported only one racial group and exclude persons of Hispanic origin. Mexican American persons may be of any race. SOURCE: National Health and Nutrition Examination Survey (NHANES), CDC/NCHS.
Age (years)
Family Income
(percent poverty
threshold)
Decrease desired
I

2001 2011
HP2020 Target: 28.3%
0
5
10
15
20
25
30
35
40
45Percent
Total Female Male AIAN White Black Hispanic Asian 65-74 75-84 85+
Age (years) ct one or exclude Obj. CKD-4.1
Increase desired 2
Adults 65+ Years with CKD
NOTES: I = 95% confidence interval. AIAN – American Indian/Alaska Native. Recommended medicalevaluation included serum creatinine, lipids, and urine albumin tests. Respondents were asked to selemore races. The categories black and white include persons who reported only one racial group and persons of Hispanic origin. Persons of Hispanic origin may be of any race. SOURCE: United States Renal Data System (USRDS), NIH/NIDDK. 9
Recommended Medical Evaluation,

0
5
10
15
20
25
30
35
40
45
Total Female Male AIAN Black Hispanic White Asian 65-74 75-84 85+
30
Recommended Medical Evaluation, Adults 65+ Years with CKD and Diabetes
NOTES: I = 95% confidence interval. AIAN – American Indian/Alaska Native. Recommended medical evaluation for adults with type 1 and type 2 diabetes and CKD included serum creatinine, urine albumin, A1c, lipids tests, and eye examinations. Respondents were asked to select one or more races. The categories black and white include persons who reported only one racial group and exclude persons of Hispanic origin. Persons of Hispanic origin may be of any race. SOURCE: United States Renal Data System (USRDS), NIH/NIDDK.
Obj. CKD-4.2 Increase desired
Percent
2001 2011
HP2020 Target: 25.3%
Age (years)

31
New Cases of End-Stage Renal Disease, 1980–2011
NOTES: The data are adjusted for age, sex, race and ethnicity. SOURCE: United States Renal Data System (USRDS), NIH/NIDDK.
Per 1,000,000
0
50
100
150
200
250
300
350
400
450
1980 1985 1990 1995 2000 2005 2011
HP2020 Target: 344.3
Obj. CKD-8 Decrease desired

0
200
400
600
800
1,000
1,200
1,400
1,600
1,800
Total Female Male White Asian Hispanic AIAN Black <18 18-44 45-64 65+
32
New Cases of End-Stage Renal Disease
NOTES: I = 95% confidence interval. AIAN – American Indian/Alaska Native. The data are adjusted for age, sex, and race/ethnicity. Respondents were asked to select one or more races. The categories black and white include persons who reported only one racial group and exclude persons of Hispanic origin. Persons of Hispanic origin may be of any race. SOURCE: United States Renal Data System (USRDS), NIH/NIDDK.
Obj. CKD-8 Decrease desired
Per 1,000,000
2001 2011
HP2020 Target: 344.3
Age (years)

0
1,000
2,000
3,000
4,000
5,000
6,000
Total Female Male White Asian AIAN Hispanic Black <18 18-44 45-64 65+
33
New Cases of ESRD due to Diabetes, Patients with Diabetes
NOTES: I = 95% confidence interval. AIAN – American Indian/Alaska Native. Data are for patients with ESRD and diabetes whose cause of renal failure was due to diabetes. The data are adjusted for age, sex, and race/ethnicity. Respondents were asked to select one or more races. The categories black and white include persons who reported only one racial group and exclude persons of Hispanic origin. Persons of Hispanic origin may be of any race. SOURCE: United States Renal Data System (USRDS), NIH/NIDDK.
Obj. CKD-9.2 Decrease desired
Per 1,000,000
2007 2011
HP2020 Target: 2380.5
Age (years)

0
50
100
150
200
250
300
350
400
Total Male Female Asian Hispanic Black AIAN White <18 18-44 45-64 65+
34
Deaths in Patients with ESRD on Dialysis
NOTES: I = 95% confidence interval. AIAN – American Indian/Alaska Native. Respondents were asked to select one or more races. The categories black and white include persons who reported only one racial group and exclude persons of Hispanic origin. Persons of Hispanic origin may be of any race. SOURCE: United States Renal Data System (USRDS), NIH/NIDDK.
Obj. CKD-14.1 Decrease desired
Per 1,000 patient years
2001 2011
HP2020 Target: 190.0
Age (years)

0
20
40
60
80
100
120
Total Female Male Asian Hispanic Black White AIAN <18 18-44 45-64 65+
35
Deaths in ESRD Patients with a Functioning Kidney Transplant
NOTES: I = 95% confidence interval. AIAN – American Indian/Alaska Native. Respondents were asked to select one or more races. The categories black and white include persons who reported only one racial group and exclude persons of Hispanic origin. Persons of Hispanic origin may be of any race. SOURCE: United States Renal Data System (USRDS), NIH/NIDDK.
Obj. CKD-14.4 Decrease desired
Per 1,000 patient years
2001 2011
HP2020 Target: 29.3
Age (years)

Key Takeaways – Diabetes
■ Prevalence of diagnosed diabetes in adults has increased over the last decade, but has leveled off in recent years.
■ New cases of diagnosed diabetes have also increased over the past decade, but have decreased since the HP2020 baseline and have met the HP2020 target.
■ About two-thirds of adults with diabetes had their condition diagnosed.
■ About 20% of adults with diagnosed diabetes have a hemoglobin A1c > 9.0%.
■ Over half of diabetes objectives have seen little or no change thus far in the decade.
36

Key Takeaways – CKD
37
■ CKD estimates have shown little or no change over the last decade.
■ Since 2001 there has been a significant reduction in new cases of ESRD and ESRD deaths.
■ About 50% of patients with CKD had hypertension in 2005–2010.
■ Medical evaluation has improved for Medicare CKD patients and for patients with diabetes and CKD.
■ Although there have been improvements, disparities still persist.
■ Over half of HP2020 CKD objectives, 14 out of 24, have met or moved towards their HP2020 targets thus far in the decade.

NIH Research to Improve Outcomes in People with Diabetes and Kidney Disease
Andrew Narva, MD National Kidney Disease Education Program
National Institutes of Health

Chronic Kidney Disease
Type 2 Diabetes Obesity
NIDDK’s Integrated Research Programs

† Age 20 and older with IGT +/or IFG +/or A1c between 5.7 and 6.4 (2012) *All ages, 2012
U.S. Prediabetes 86 million†
U.S. Diabetes 29.1 million* 21 million diagnosed; 8.1 million undiagnosed
Diabetes: The Tip of the Iceberg

■ 3234 participants (45% minority) with IGT who were overweight or obese
■ Compared 3 approaches to diabetes
prevention for 3 years:
The Diabetes Prevention Program Clinical Trial (DPP)

0
4
8
12
Caucasian (n=1768)
African American (n=645)
Hispanic (n=508)
American Indian (n=171)
Asian (n=14
2)
Case
s/10
0 pe
rson
-yr
DPP Results

Partnership
Translating from Efficacy Research to Public Health

DPP Affects on Coverage of Care

Eye Disease
76% 60%
Nerve Disease
57%
Cardio-vascular Disease
50%
Kidney Disease
Reductions in Risk:
DCCT/EDIC: Glucose Control Can Significantly Reduce the Risk of Complications

Source: NEJM 365: 2366, 2011
GFR<60
Impaired GFR Reduced by Half

6.9% 10.8%
16.8%
34.5%
0
10
20
30
40
Total Albuminuria Impaired GFR Both
Pre
vale
nce
(%)
JAMA 305:2532-2539, 2011
Albuminuria = ACR ≥30 mg/g Impaired GFR = eGFR <60 ml/min/1.73m²
Prevalence of Diabetic Kidney Disease (DKD) Among Adults with Diabetes; United States, 2005-2008

Reference: USRDS Annual Data Report (NIDDK, 2013)
Incident ESRD patients. Adj: age/gender/race; ref: 2010 ESRD patients.
Incident counts & adjusted rates of ESRD, by primary diagnosis
Diabetes is the leading cause of ESRD

Reference: USRDS Annual Data Report (NIDDK, 2013)
Incident counts & adjusted rates of ESRD, by race
Disparities in the Burden of ESRD

NHANES 2007-2010
7.6 8.4 6.9 7.3
9.2
6.2 7.4 6.6 6.2
8.8 8.3 8.2 5.7
0
5
10
15
20
25
30Pe
rcen
t
Awareness of Kidney Disease among adults with CKD is Poor

– Research-based program leverages influence of faith leaders to share health information
– Engages faith organizations to host educational events on kidney health
– Reached 100,000 people in March 2014
Encouraging African Americans to Make the Kidney Connection

Diamantidis, CJASN, 2012
Testing Interventions “Usability of a CKD Educational Website Targeted to Patients and Their Family Members”

■ Integrated Population Program for Diabetic Kidney Disease (Duke)
■ Goal: Improve identification and care of diabetic kidney disease (DKD) patients with uncontrolled hypertension
■ Group-based Chronic Kidney Disease Care (Einstein)
■ Goal: Improve blood pressure control among CKD patients
■ Health IT Enhanced for CKD in Safety-Net Primary Care (UCSF)
■ Goal: Mitigate disparities through improved delivery of CKD care
Translational Research in CKD

■ Improving Chronic Kidney Disease Management with Pieces (ICD-Pieces) UT-Southwestern
■ Goal: Leverage EHR information to improve care for patients with diabetes, hypertension, and CKD
■ Interventions: Collaborative model of primary care and subspecialty care implemented through Parkland intelligent e-coordination and evaluation system (Pieces)
■ Challenges: Lack of electronic health records (EHR) interoperability, primary care provider hesitance to engage, lack of CKD education resources in EHRs
Pragmatic Research in Multiple Chronic Conditions

Translational research in CKD

CDC’s Priorities in the Public Health Response to Diabetes

Ann Albright, PhD, RD Director
Division of Diabetes Translation Centers for Disease Control and Prevention


County-level Estimates of Diagnosed Diabetes among Adults Aged ≥20 Years: United States 2004
Percentage
National Diabetes Surveillance System www.cdc.gov/diabetes
59

County-level Estimates of Diagnosed Diabetes among Adults Aged ≥20 Years: United States 2005
Percentage
National Diabetes Surveillance System www.cdc.gov/diabetes
60

County-level Estimates of Diagnosed Diabetes among Adults Aged ≥20 Years: United States 2006
Percentage
National Diabetes Surveillance System www.cdc.gov/diabetes
61
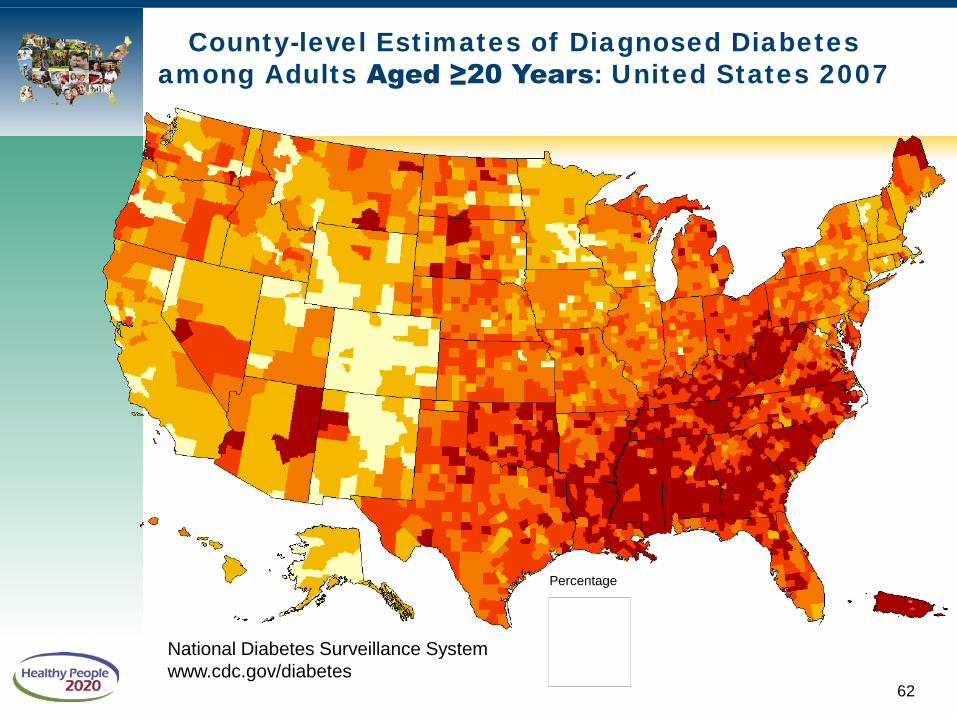
County-level Estimates of Diagnosed Diabetes among Adults Aged ≥20 Years: United States 2007
Percentage
National Diabetes Surveillance System www.cdc.gov/diabetes
62

County-level Estimates of Diagnosed Diabetes among Adults Aged ≥20 Years: United States 2008
Percentage
National Diabetes Surveillance System www.cdc.gov/diabetes
63

County-level Estimates of Diagnosed Diabetes among Adults Aged ≥20 Years: United States 2009
Percentage
National Diabetes Surveillance System www.cdc.gov/diabetes
64

County-level Estimates of Diagnosed Diabetes among Adults Aged ≥20 Years: United States 2010
Percentage
National Diabetes Surveillance System www.cdc.gov/diabetes
65
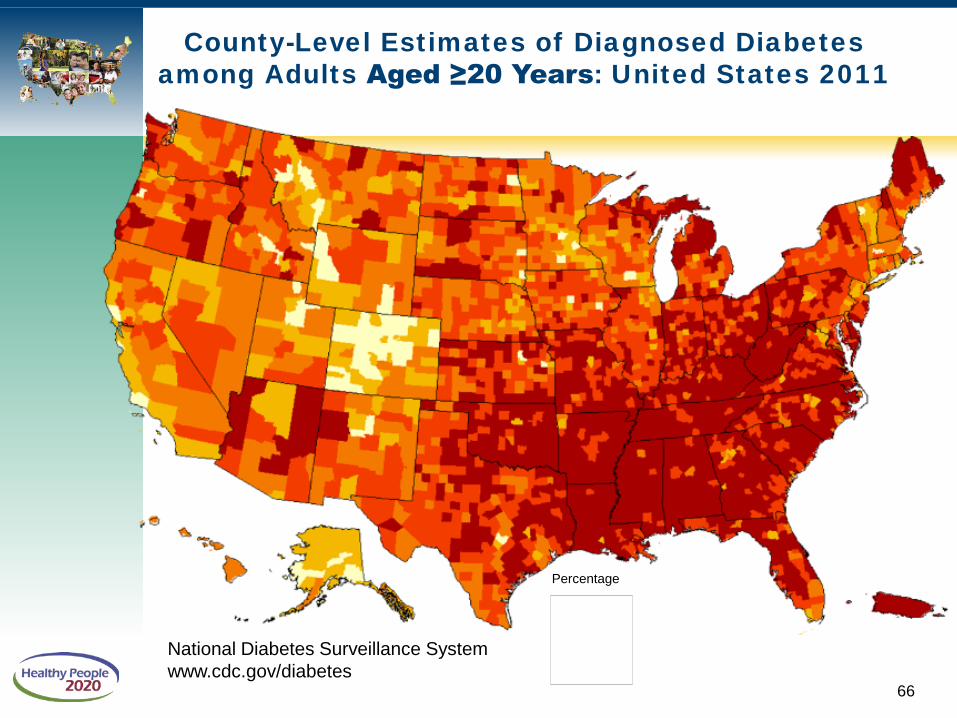
County-Level Estimates of Diagnosed Diabetes among Adults Aged ≥20 Years: United States 2011
Percentage
National Diabetes Surveillance System www.cdc.gov/diabetes
66

Trends in Type 2 Diabetes Prevalence, 2001–2009, among Youth Age 10–19 Years
0.0
0.2
0.4
0.6
0.8
1.0
1.2
1.4
Overall Female Male 10-14 15-19 NHW AA HISP API AI
Prev
alen
ce p
er 1
,000
2001 2009
p<0.0001
p=0.0004
p<0.0001
p<0.0001
p<0.0001
p<0.0001
p<0.0001
p=0.023
31% relative increase
Dabelea D et al. JAMA. 2014 May 7;311(17):1778–86.
67

Changes in Lifetime Risk for Diagnosed Diabetes after Age 20 Years in the United States, 1985 to 2011
0
5
10
15
20
25
30
35
40
45
Men Women
Life
time
Prob
abili
ty
1985-1989 1990-1999 2000-2011
Gregg et al., Lancet Diabetes & Endocrinology, 2014
68

Gregg et al., New Engl J Med, 2014
Trends in Age-Standardized Rates of Diabetes-Related Complications from 1990 to 2010 among U.S. Adults with Diagnosed Diabetes
1990 1995 2000 2005 2010
Myocardial Infarction
t S r oke
Amputation
ESRD
H ype r gl y c emic D e a th
10
30
5
3
1
50
70
90
110
130
150
69

Successes and Challenges in the Public Health Response to Diabetes
1990 1995 2000 2005 2010
Mortality and
Complications
1990 1995 2000 2005 2010
Continued increases Reductions and Improvements
Incidence and Prevalence
70

Public Health Response to Diabetes
■ Prevent diabetes – Increase diabetes preventive behaviors – Improve the access to effective lifestyle intervention – Promote healthy environments for the whole population
■ Prevent diabetes complications – Increase access and delivery of preventive health care – Enhance and improve community and environmental
strategies to support people with diabetes
Prevent chronic kidney disease – Increase awareness and early diagnosis – Build a national CKD surveillance program – Promote use of evidence-based, cost-effective care
■ Eliminate diabetes-related health disparities
71

DISTRIBUTION (Diffusion of interventions)
AVAILABILITY (Supply)
EFFICIENCY (Biggest effect on most people)
EFFECTIVENESS (Real world settings)
EFFICACY (Ideal settings)
BASIC SCIENCE (Molecular/physiological)
Adapted from information in Sinclair JC, et al. N Engl J Med. 1981;305:489–94 and Detsky AS, et al. Ann Intern Med. 1990;113:147–54.
72

i i i i hi
Albright A, Gregg EW. Am J Prev Med. 2013;44(4S4):S346–51. 73

Progress to Date for National Diabetes Prevention Program
Copyright © 2005-2014 Zee Source. All rights reserved.
74
Source: Diabetes Prevention Recognition Program (CDC/National Diabetes Prevention Program)

Summary
• The number of and health impact from diabetes-related complications, including kidney complications, have declined substantially
• Incidence (new cases) of diagnosed diabetes has increased over two decades. Preventing type 2 diabetes is an important step in preventing kidney disease
• Continued improvements are needed for preventing diabetes and its complications
• Strong community lifestyle-change programs are needed for high-risk individuals and healthy communities to reduce risk and prevent diabetes in the population as a whole
75

Please visit the Division of Diabetes Translation web site at
www.cdc.gov/diabetes www.cdc.gov/ckd
For more information, please contact: The Centers for Disease Control and Prevention 1600 Clifton Road NE, Atlanta, Georgia 30333 Telephone, 1-800-CDC-INFO (232-4636)/TTY: 1-888-232-6348 E-mail: [email protected] Web: www.cdc.gov
Thank You!
76

EmblemHealth National Diabetes Prevention Program
■ Bulleted Text

EmblemHealth

Neighborhood Care
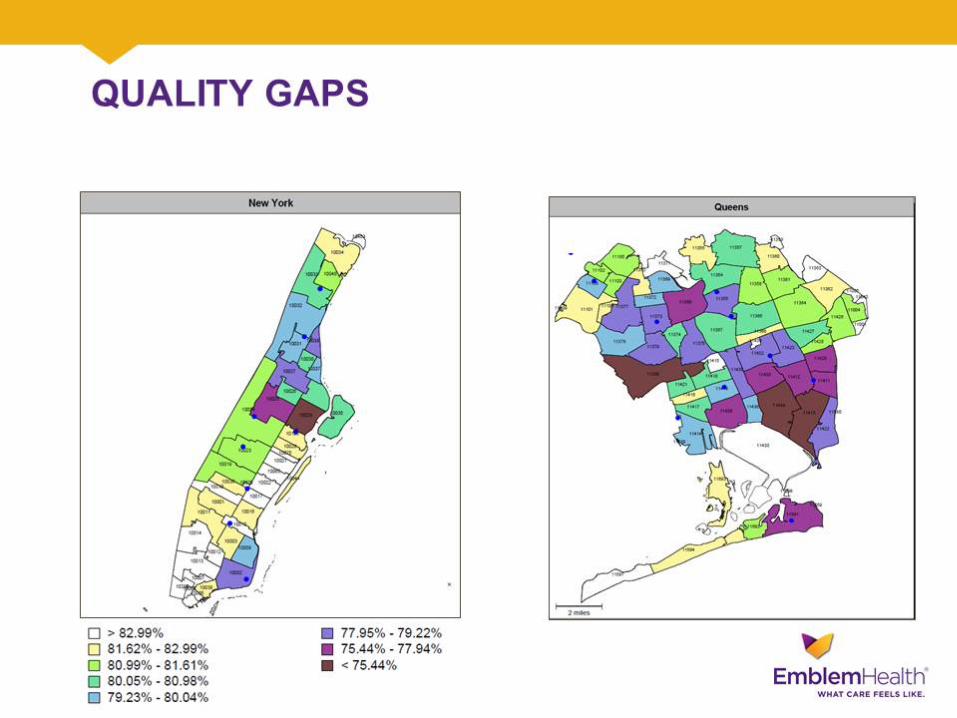
Quality Gaps

Why DPP?

EmblemHealth DDP

Program Model

Metrics

Overall Results

Participant Demographics

Hemoglobin A1C Results slide 1

Hemoglobin A1C Results

Weight Results slide 1

Weight Results

Blood Pressure Results

Results

Challenges

Lessons Leanred

Testimonials

A success story

Graduation – May 2014

Thank you.

Roundtable Discussion Please submit your questions using the Q&A function.
Thank you for filling out our brief survey.

LHI Infographic Gallery http://www.healthypeople.gov/2020/LHI/infographicGallery.aspx

New Training on Diabetes Agents
Preventing Adverse Drug Events: Individualizing Glycemic Targets Using Health Literacy Strategies
Earn continuing education credit (CME, CNE, CEU, CPE)
Available on the training tab of www.health.gov

Please join us as we review select
Healthy People 2020 objectives in the Environmental Health and Tobacco Use
topic areas.
Friday, December 5, 2014
Hear from a community-based
organization that is working to improve outcomes
in the community.
To register, visit: www.healthypeople.gov
Healthy People 2020 Progress Review Webinar

Stay Connected
WEB healthypeople.gov
EMAIL [email protected]
TWITTER @gohealthypeople
LINKEDIN Healthy People 2020
YOUTUBE ODPHP (search “healthy people”)
JOIN THE HEALTHY PEOPLE LISTSERV & CONSORTIUM

Healthy People 2020 Sharing Library
A library of stories highlighting ways organizations across the country are implementing Healthy People 2020
Healthy People in Action - Sharing Library http://healthypeople.gov/2020/implement/MapSharingLibrary.aspx

Healthy People 2020 Progress Review Planning Group
■ Ed Greg (CDC/NCCDPHP)
■ Desmond Williams (CDC /NCCDPHP)
■ Paul Eggers (NIH/NIDDK)
■ Lawrence Agodoa (NIH/NIDDK)
■ Peter Savage (NIDDK/NIH)
■ Nilka Rios Burrows (CDC/NCCDPHP)
■ Sharon Saydah (CDC/NCCDPHP) ■ Stan Lehman (CDC /NCCHSTP)
■ Denise Stredrick (NIH/OD)
■ Rebecca Hines (CDC/NCHS)
■ Leda Gurley (CDC/NCHS)
■ Asel Ryskulova (CDC/NCHS)
■ Lesley Dobrzynski (CDC/NCHS)
■ Mark Eberhardt (CDC/NCHS)
■ David Lacher (CDC/NCHS)
■ Carter Blakey (HHS/ODPHP)
■ Emmeline Ochiai (HHS/ODPHP)
■ Debbie Hoyer (HHS/ODPHP)
■ Yen Luong (HHS/ODPHP)