Embed Size (px)
DESCRIPTION
A Profile of Health among Massachusetts Adults: 2000-2001 Highlights from the Massachusetts Behavioral Risk Factor Surveillance System (BRFSS). Health Survey Program Division of Research and Epidemiology Bureau of Health Statistics, Research and Evaluation - PowerPoint PPT Presentation
Citation preview
A Profile of Health among Massachusetts Adults: 2000-2001
Highlights from the Massachusetts Behavioral Risk Factor Surveillance System (BRFSS)
Health Survey Program Division of Research and Epidemiology
Bureau of Health Statistics, Research and EvaluationMassachusetts Department of Public Health
September 2003
Source: Health Survey Program, Division of Research and Epidemiology Bureau of Health Statistics, Research and Evaluation, MDPH
2
Overview
• What is the BRFSS?
• Selected topics
- Health Risks
- Preventive Health Behaviors
- Health Conditions
• Summary
Source: Health Survey Program, Division of Research and Epidemiology Bureau of Health Statistics, Research and Evaluation, MDPH
3
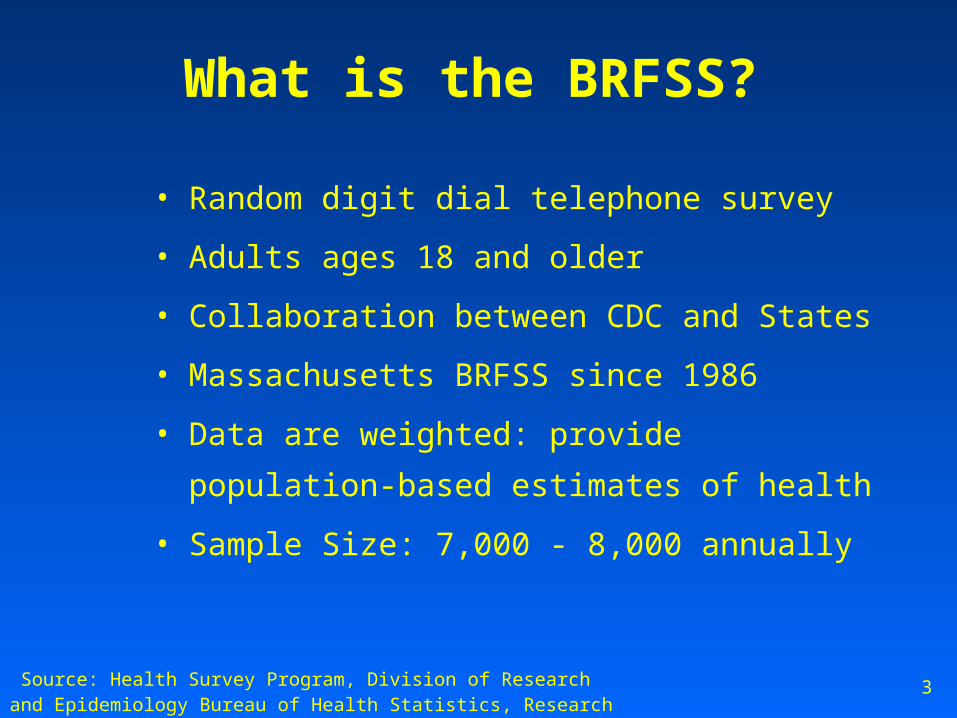
What is the BRFSS?
• Random digit dial telephone survey
• Adults ages 18 and older
• Collaboration between CDC and States
• Massachusetts BRFSS since 1986
• Data are weighted: provide population-based
estimates of health
• Sample Size: 7,000 - 8,000 annually
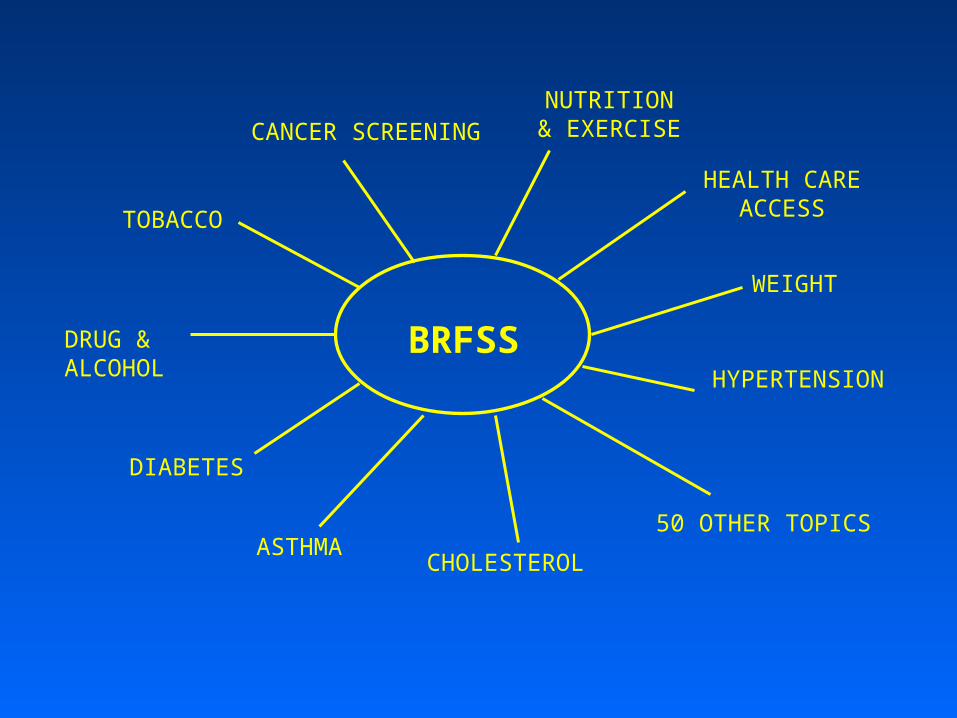
BRFSS
TOBACCO
CANCER SCREENING
DRUG &ALCOHOL
ASTHMACHOLESTEROL
NUTRITION& EXERCISE
HEALTH CARE ACCESS
HYPERTENSION
DIABETES
50 OTHER TOPICS
WEIGHT
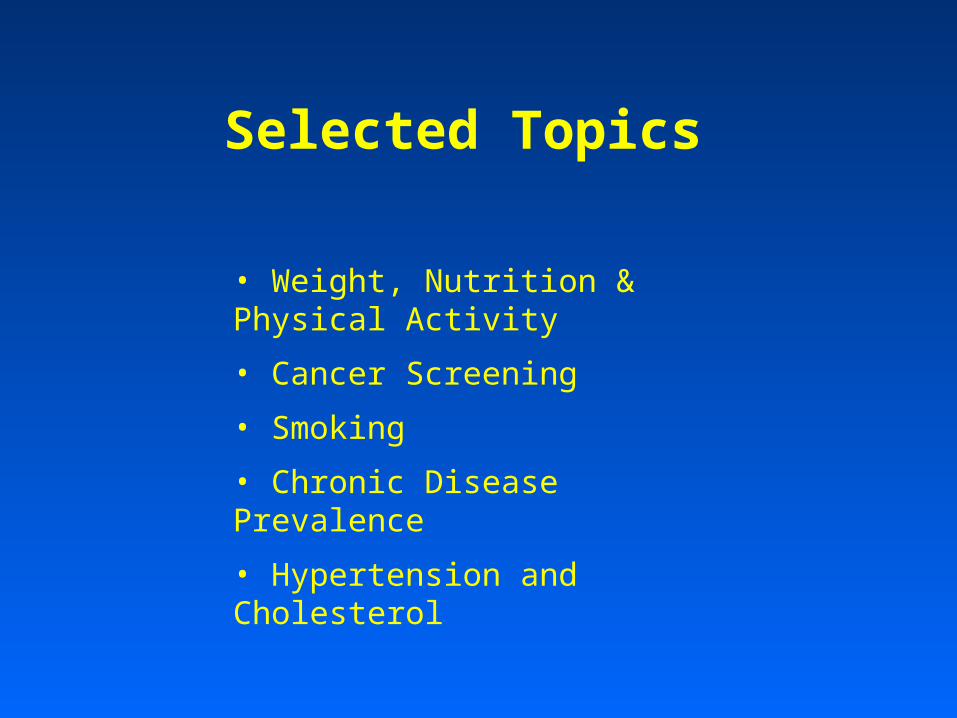
Selected Topics
• Weight, Nutrition & Physical Activity
• Cancer Screening
• Smoking
• Chronic Disease Prevalence
• Hypertension and Cholesterol
Source: Health Survey Program, Division of Research and Epidemiology Bureau of Health Statistics, Research and Evaluation, MDPH
6
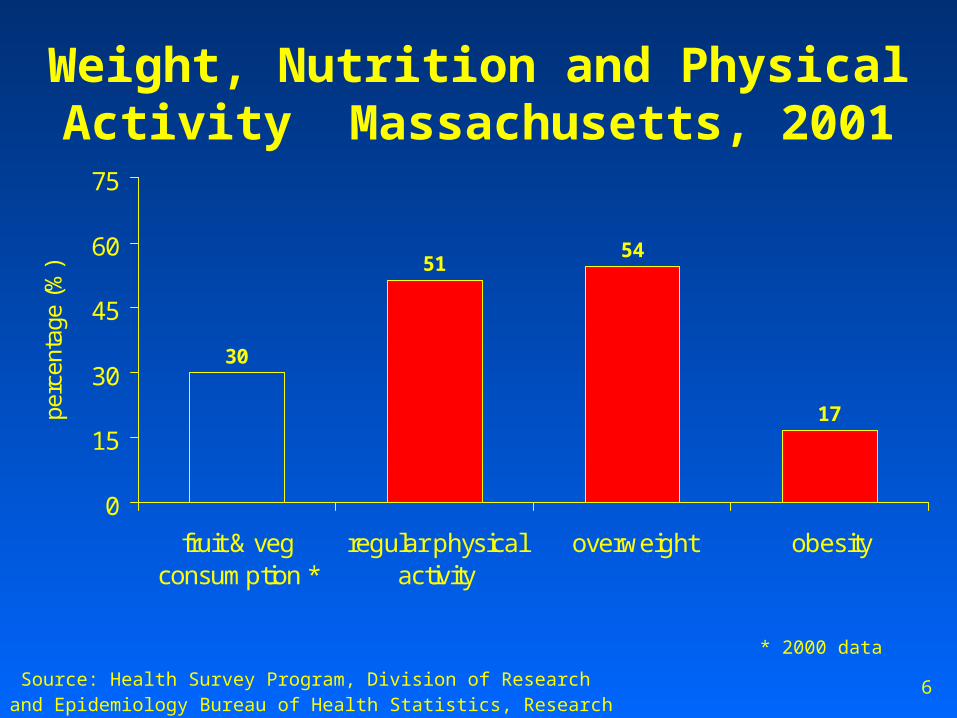
Weight, Nutrition and Physical Activity Massachusetts, 2001
30
5154
17
0
15
30
45
60
75
fruit & vegconsumption *
regular physicalactivity
overweight obesity
perc
enta
ge (
%)
* 2000 data
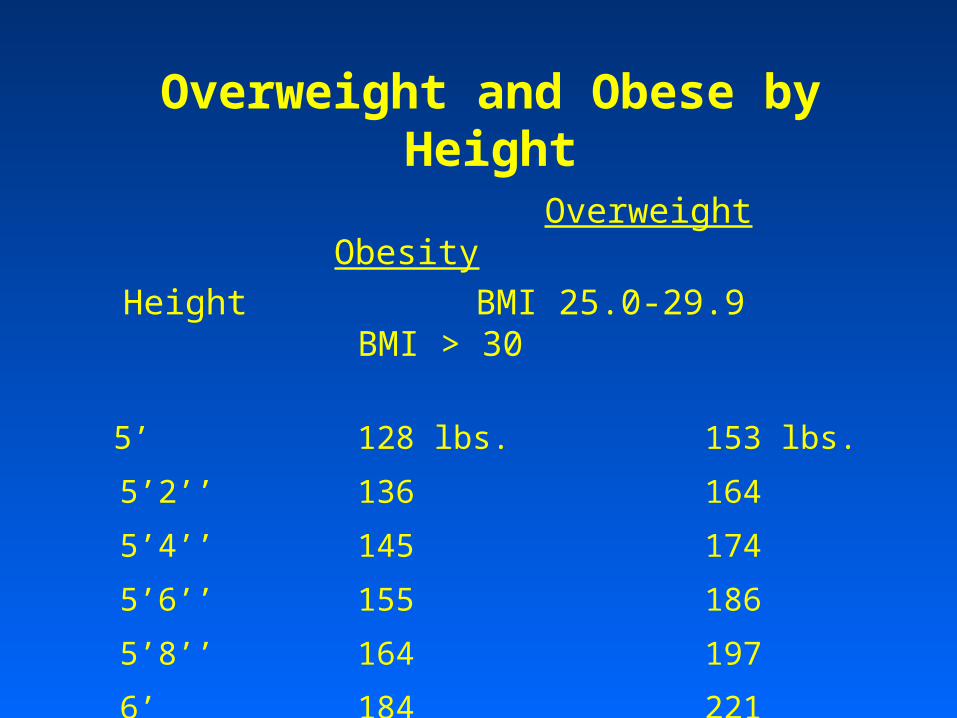
Overweight Obesity
Height BMI 25.0-29.9 BMI > 30
5’ 128 lbs. 153 lbs.
5’2’’ 136 164
5’4’’ 145 174
5’6’’ 155 186
5’8’’ 164 197
6’ 184 221
Overweight and Obese by Height
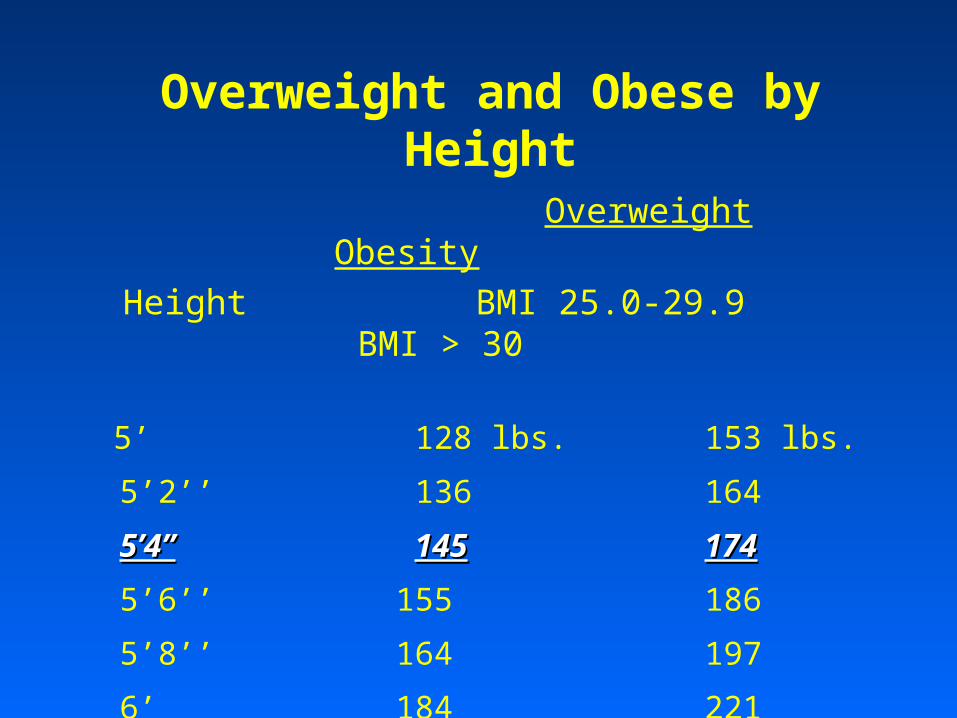
Overweight Obesity
Height BMI 25.0-29.9 BMI > 30
5’ 128 lbs. 153 lbs.
5’2’’ 136 164
5’4’’5’4’’ 145145 174174
5’6’’ 155 186
5’8’’ 164 197
6’ 184 221
Overweight and Obese by Height
Source: Health Survey Program, Division of Research and Epidemiology Bureau of Health Statistics, Research and Evaluation, MDPH
9
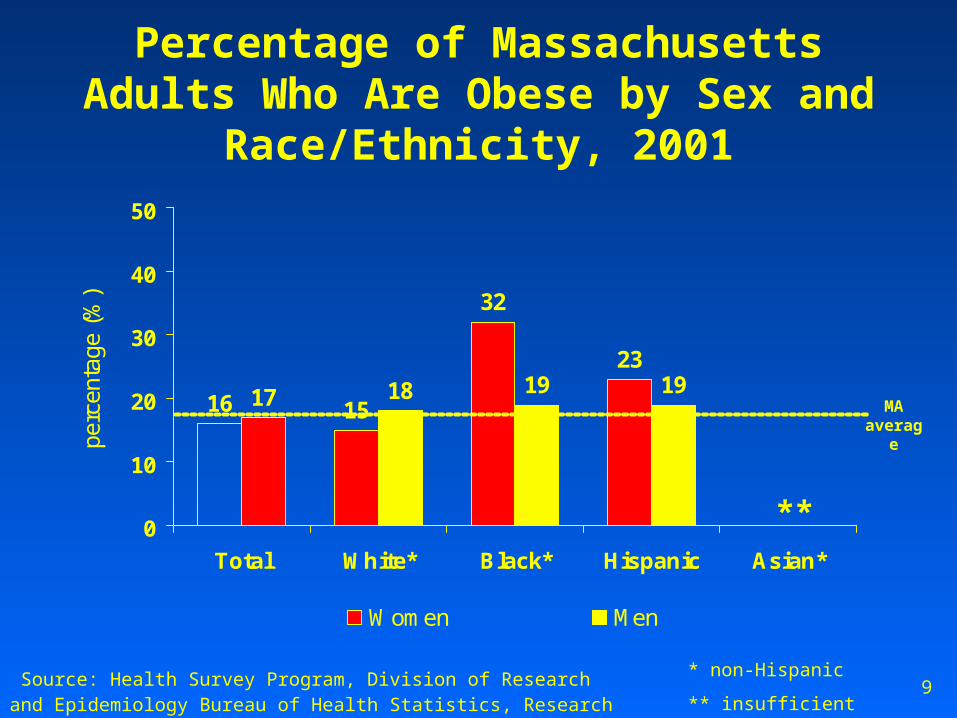
Percentage of Massachusetts Adults Who Are Obese by Sex and
Race/Ethnicity, 2001
16 15
32
23
17 18 19 19
0
10
20
30
40
50
Total White* Black* Hispanic Asian*
perc
enta
ge (
%)
Women Men
MA average
**
* non-Hispanic
** insufficient numbers
Source: Health Survey Program, Division of Research and Epidemiology Bureau of Health Statistics, Research and Evaluation, MDPH
10
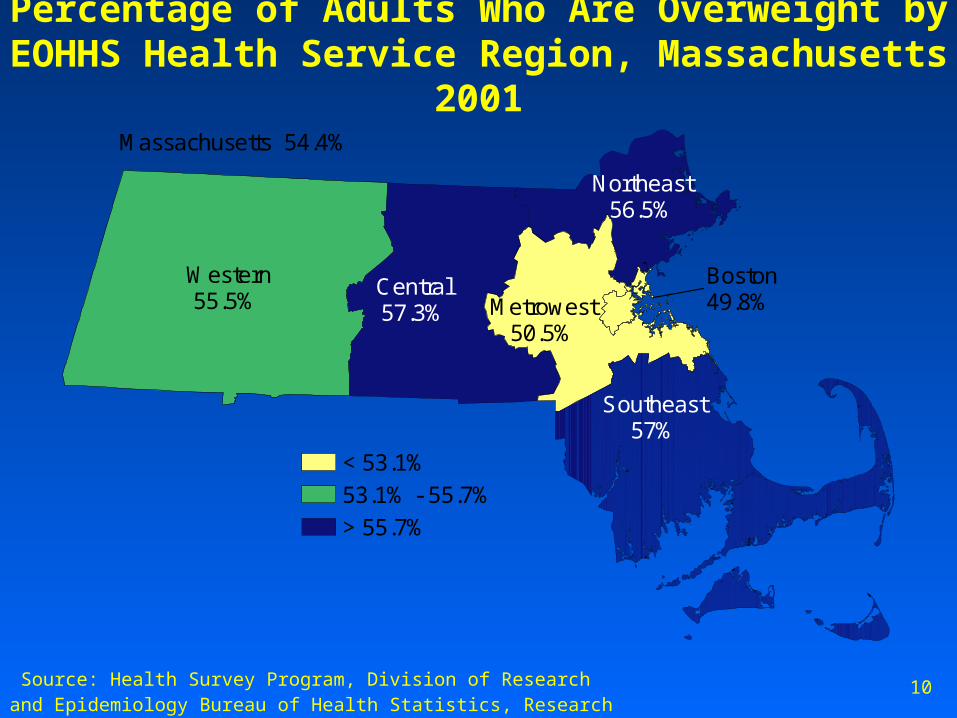
Percentage of Adults Who Are Overweight by EOHHS Health Service Region, Massachusetts 2001
< 53.1%
53.1% - 55.7%
> 55.7%
Western 55.5%
Central 57.3%
Southeast 57%
Metrowest 50.5%
Northeast 56.5%
Boston 49.8%
Massachusetts 54.4%
Source: Health Survey Program, Division of Research and Epidemiology Bureau of Health Statistics, Research and Evaluation, MDPH
11
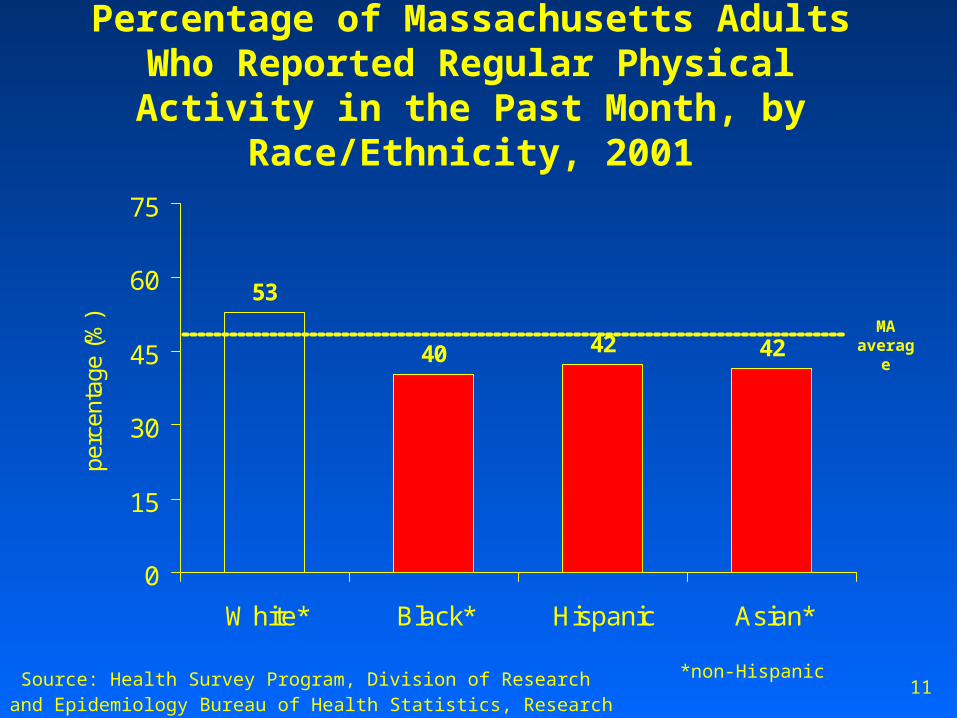
Percentage of Massachusetts Adults Who Reported Regular Physical Activity in the
Past Month, by Race/Ethnicity, 2001
53
40 42 42
0
15
30
45
60
75
White* Black* Hispanic Asian*
perc
enta
ge (
%)
MA average
*non-Hispanic
Source: Health Survey Program, Division of Research and Epidemiology Bureau of Health Statistics, Research and Evaluation, MDPH
12
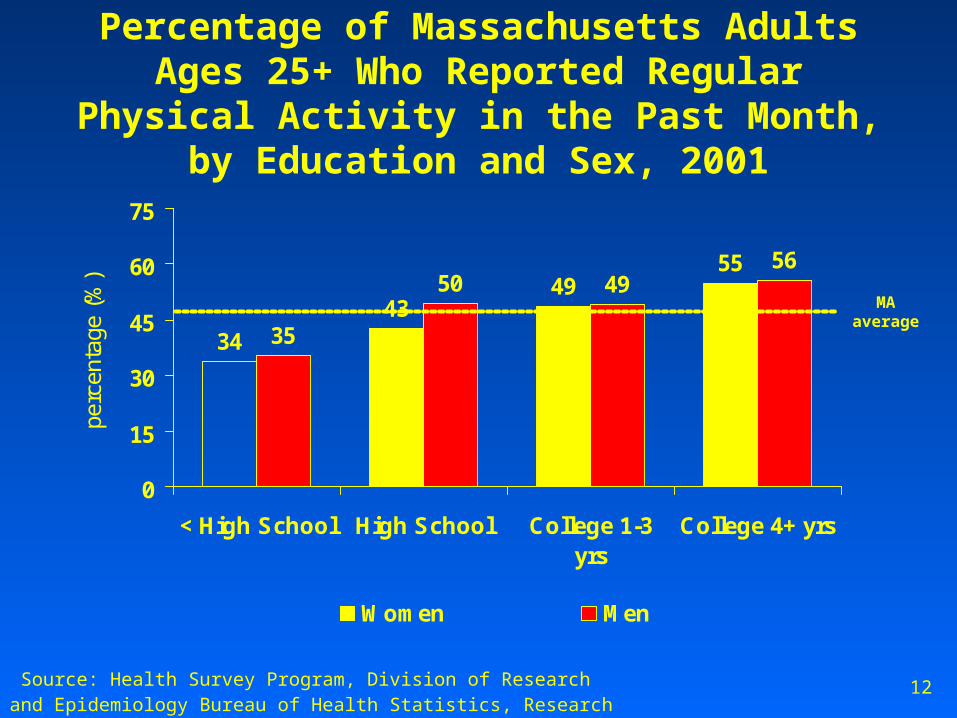
Percentage of Massachusetts Adults Ages 25+ Who Reported Regular Physical Activity in the
Past Month, by Education and Sex, 2001
34
4349
55
35
5056
49
0
15
30
45
60
75
< High School High School College 1-3yrs
College 4+ yrs
perc
enta
ge (
%)
Women Men
MA average
Source: Health Survey Program, Division of Research and Epidemiology Bureau of Health Statistics, Research and Evaluation, MDPH
13
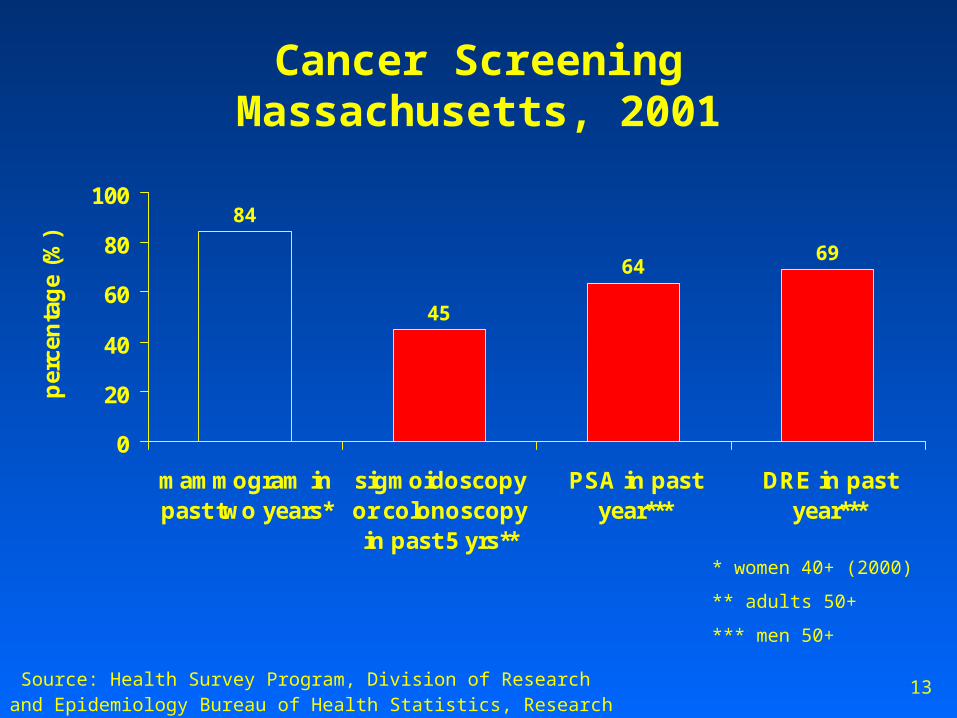
Cancer ScreeningMassachusetts, 2001
84
45
6469
0
20
40
60
80
100
mammogram inpast two years*
sigmoidoscopyor colonoscopyin past 5 yrs**
PSA in pastyear***
DRE in pastyear***
per
cen
tag
e (%
)
* women 40+ (2000)
** adults 50+
*** men 50+
Source: Health Survey Program, Division of Research and Epidemiology Bureau of Health Statistics, Research and Evaluation, MDPH
14
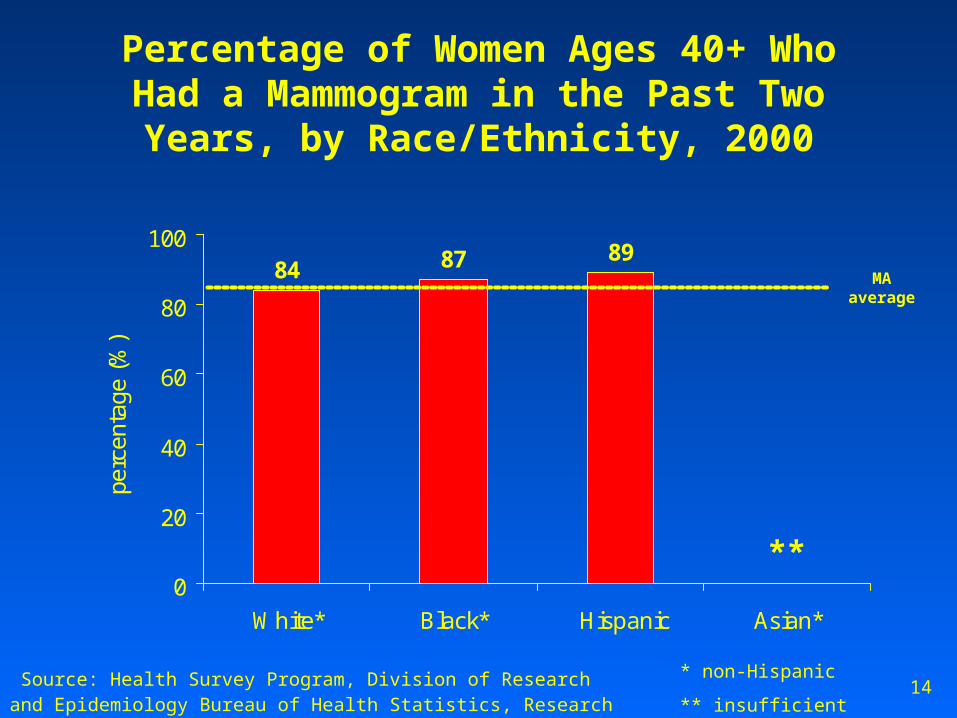
Percentage of Women Ages 40+ Who Had a Mammogram in the Past Two Years, by
Race/Ethnicity, 2000
84 87 89
0
20
40
60
80
100
White* Black* Hispanic Asian*
perc
enta
ge (
%)
MA average
* non-Hispanic
** insufficient numbers
**
Source: Health Survey Program, Division of Research and Epidemiology Bureau of Health Statistics, Research and Evaluation, MDPH
15
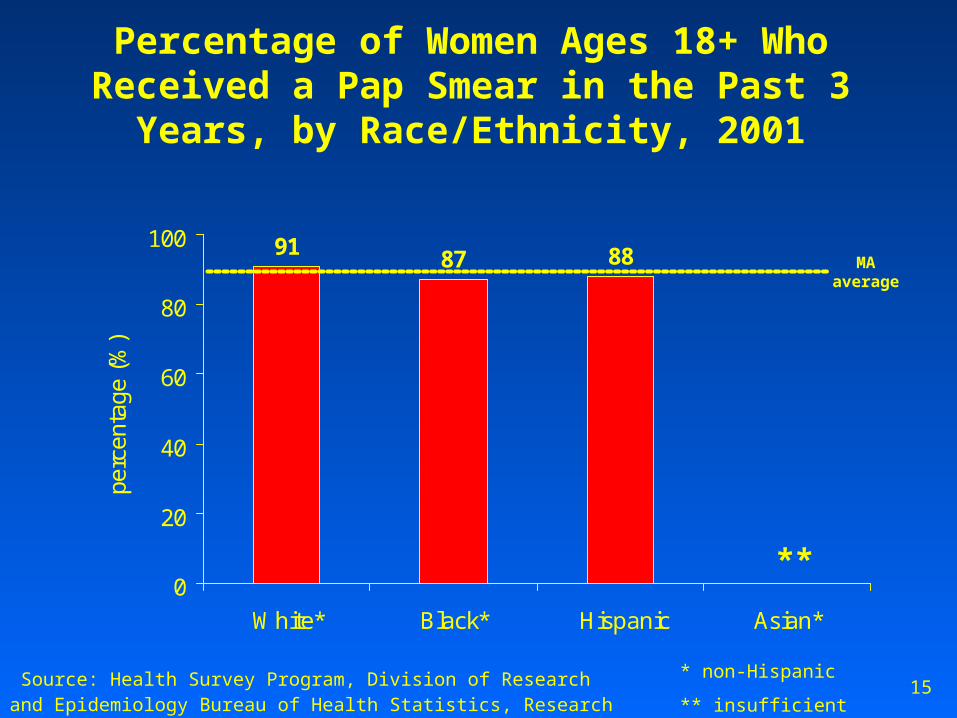
Percentage of Women Ages 18+ Who Received a Pap Smear in the Past 3 Years,
by Race/Ethnicity, 2001
91 87 88
0
20
40
60
80
100
White* Black* Hispanic Asian*
perc
enta
ge (
%)
MA average
**
* non-Hispanic
** insufficient numbers
Source: Health Survey Program, Division of Research and Epidemiology Bureau of Health Statistics, Research and Evaluation, MDPH
16
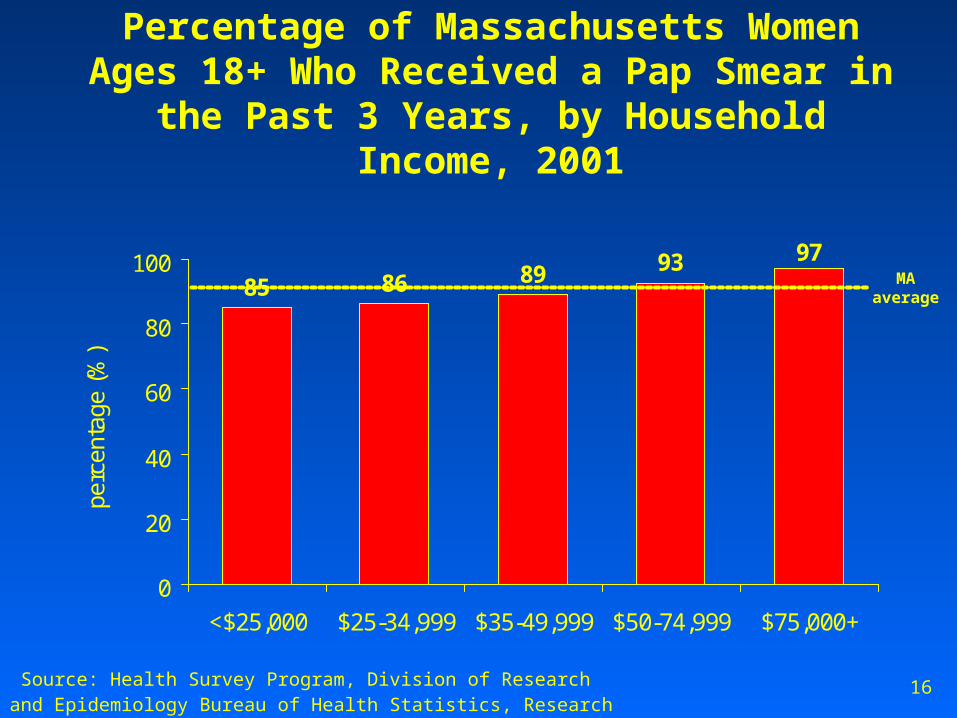
Percentage of Massachusetts Women Ages 18+ Who Received a Pap Smear in the Past 3
Years, by Household Income, 2001
85 8693 97
89
0
20
40
60
80
100
<$25,000 $25-34,999 $35-49,999 $50-74,999 $75,000+
perc
enta
ge (
%)
MA average
Source: Health Survey Program, Division of Research and Epidemiology Bureau of Health Statistics, Research and Evaluation, MDPH
17
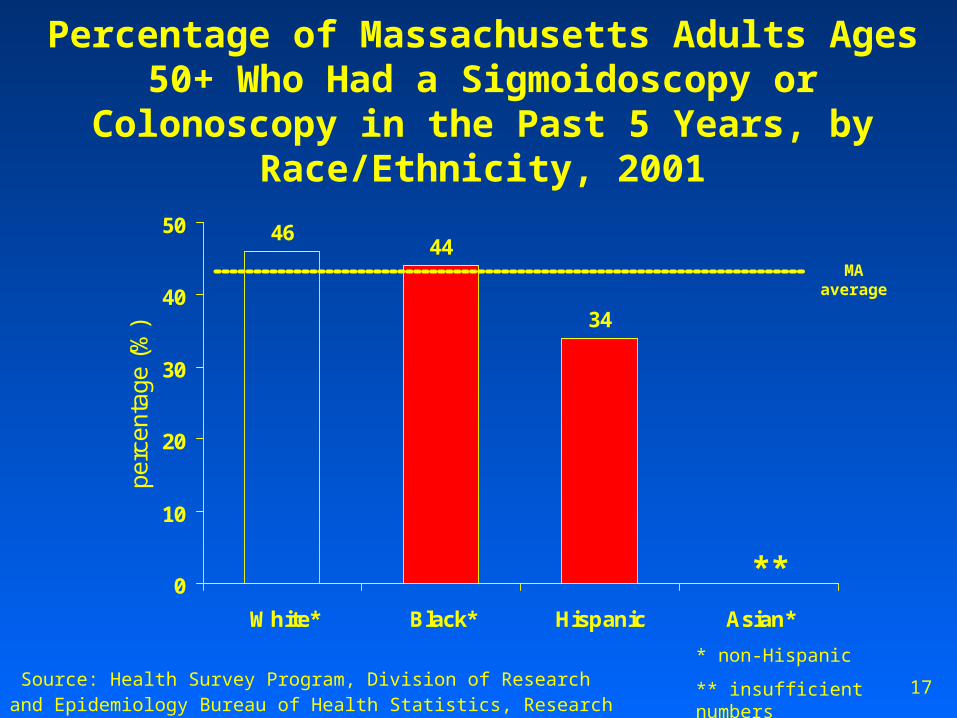
Percentage of Massachusetts Adults Ages 50+ Who Had a Sigmoidoscopy or Colonoscopy in the
Past 5 Years, by Race/Ethnicity, 2001
4644
34
0
10
20
30
40
50
White* Black* Hispanic Asian*
perc
enta
ge (
%)
MA average
**
* non-Hispanic
** insufficient numbers
Source: Health Survey Program, Division of Research and Epidemiology Bureau of Health Statistics, Research and Evaluation, MDPH
18
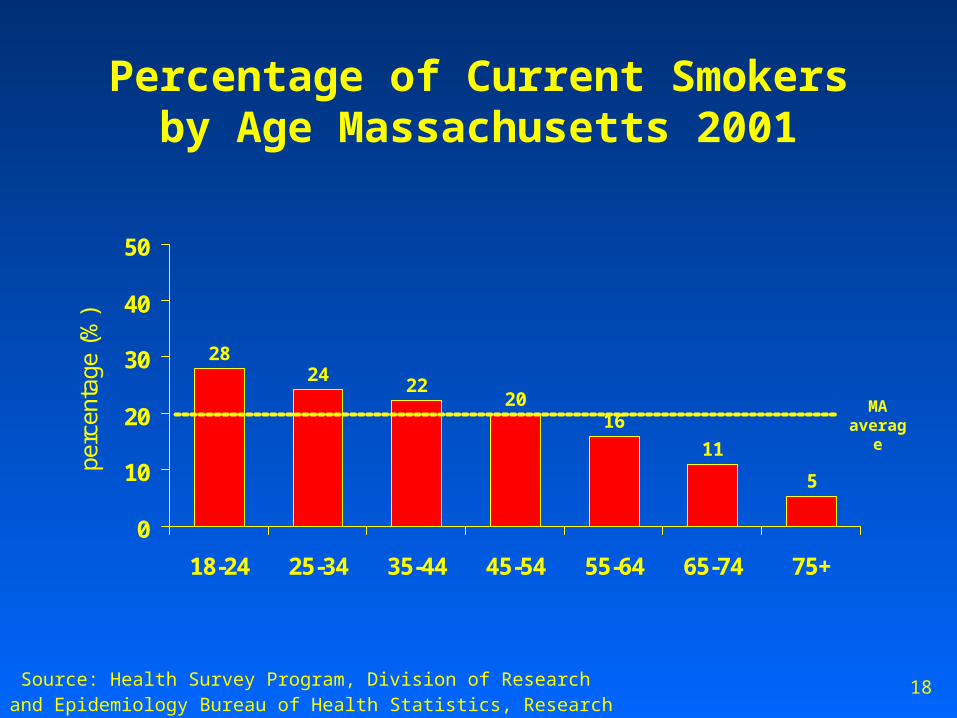
Percentage of Current Smokers by Age Massachusetts 2001
2824
2016
11
5
22
0
10
20
30
40
50
18-24 25-34 35-44 45-54 55-64 65-74 75+
perc
enta
ge (
%)
MA average
Source: Health Survey Program, Division of Research and Epidemiology Bureau of Health Statistics, Research and Evaluation, MDPH
19
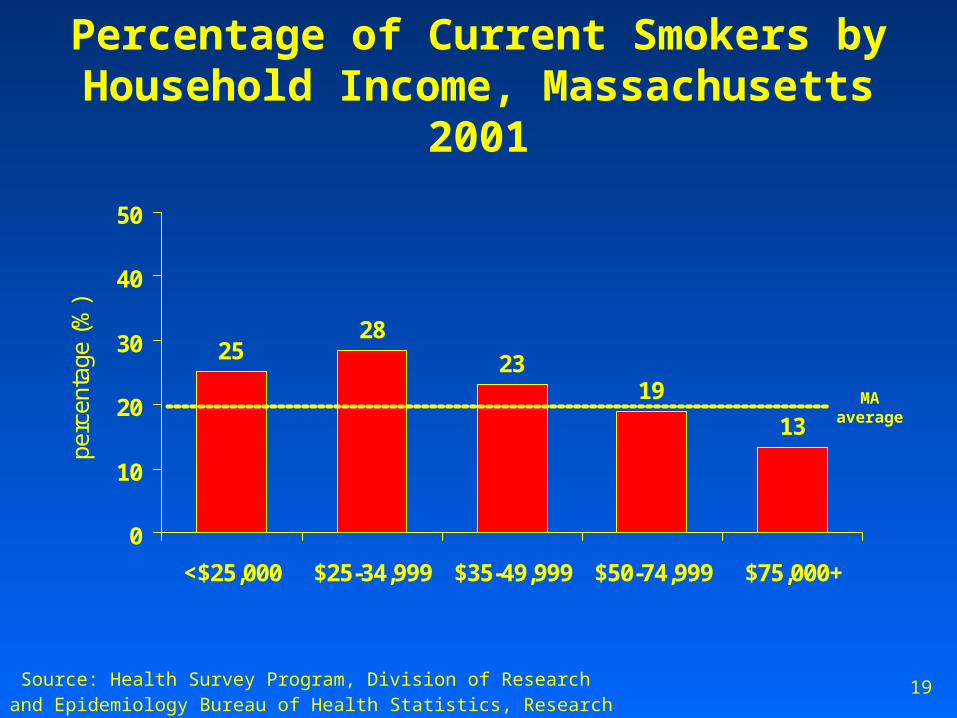
Percentage of Current Smokers by Household Income, Massachusetts 2001
2528
19
13
23
0
10
20
30
40
50
<$25,000 $25-34,999 $35-49,999 $50-74,999 $75,000+
perc
enta
ge (
%)
MA average
Source: Health Survey Program, Division of Research and Epidemiology Bureau of Health Statistics, Research and Evaluation, MDPH
20
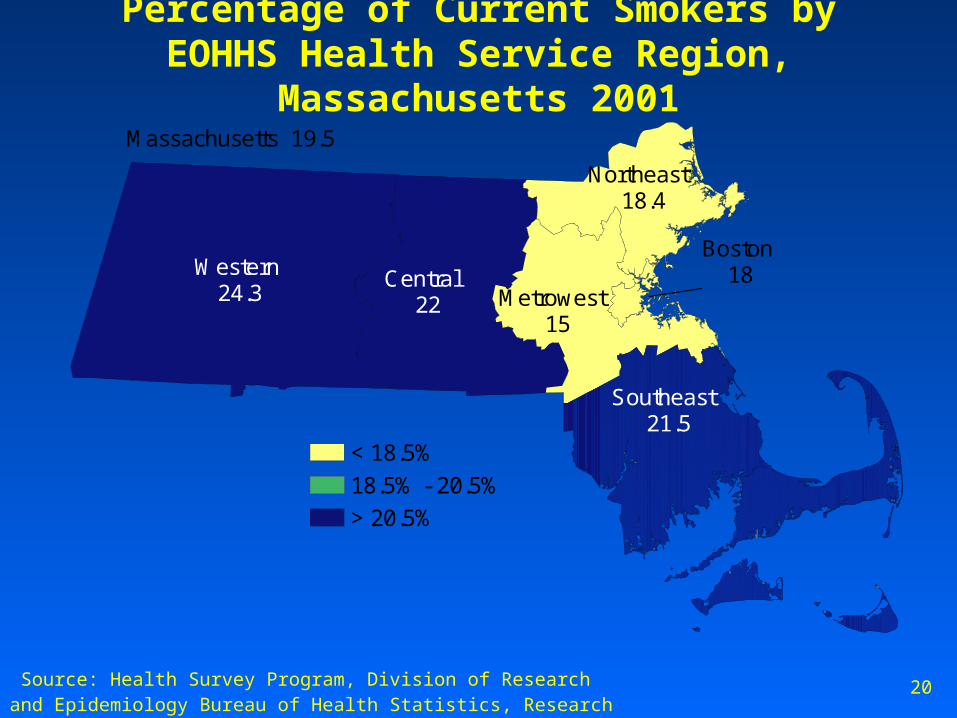
Percentage of Current Smokers by EOHHS Health Service Region, Massachusetts 2001
< 18.5%
18.5% - 20.5%
> 20.5%
Western 24.3
Central 22
Southeast 21.5
Metrowest 15
Northeast 18.4
Boston 18
Massachusetts 19.5
Source: Health Survey Program, Division of Research and Epidemiology Bureau of Health Statistics, Research and Evaluation, MDPH
21
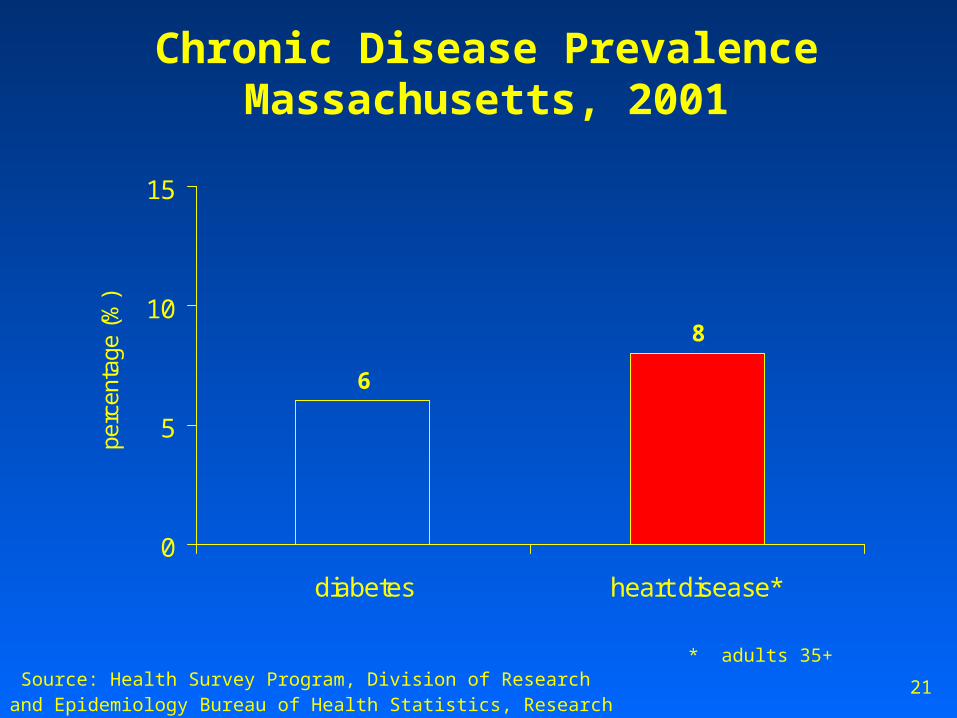
Chronic Disease PrevalenceMassachusetts, 2001
6
8
0
5
10
15
diabetes heart disease*
perc
enta
ge (
%)
* adults 35+
Source: Health Survey Program, Division of Research and Epidemiology Bureau of Health Statistics, Research and Evaluation, MDPH
22
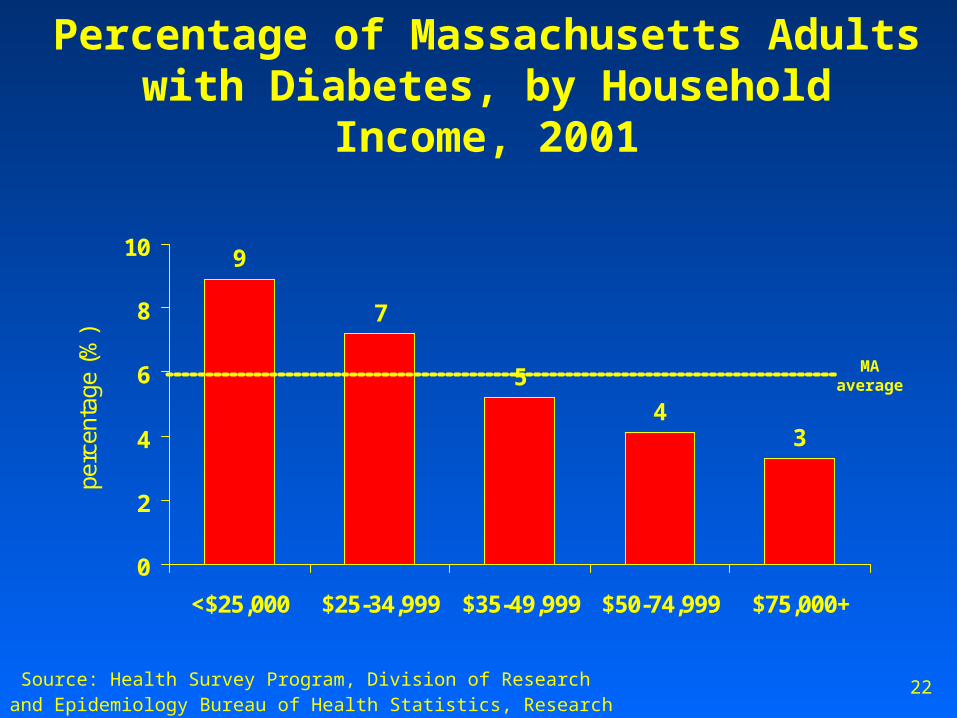
Percentage of Massachusetts Adults with Diabetes, by Household Income, 2001
9
7
43
5
0
2
4
6
8
10
<$25,000 $25-34,999 $35-49,999 $50-74,999 $75,000+
perc
enta
ge (
%)
MA average
Source: Health Survey Program, Division of Research and Epidemiology Bureau of Health Statistics, Research and Evaluation, MDPH
23
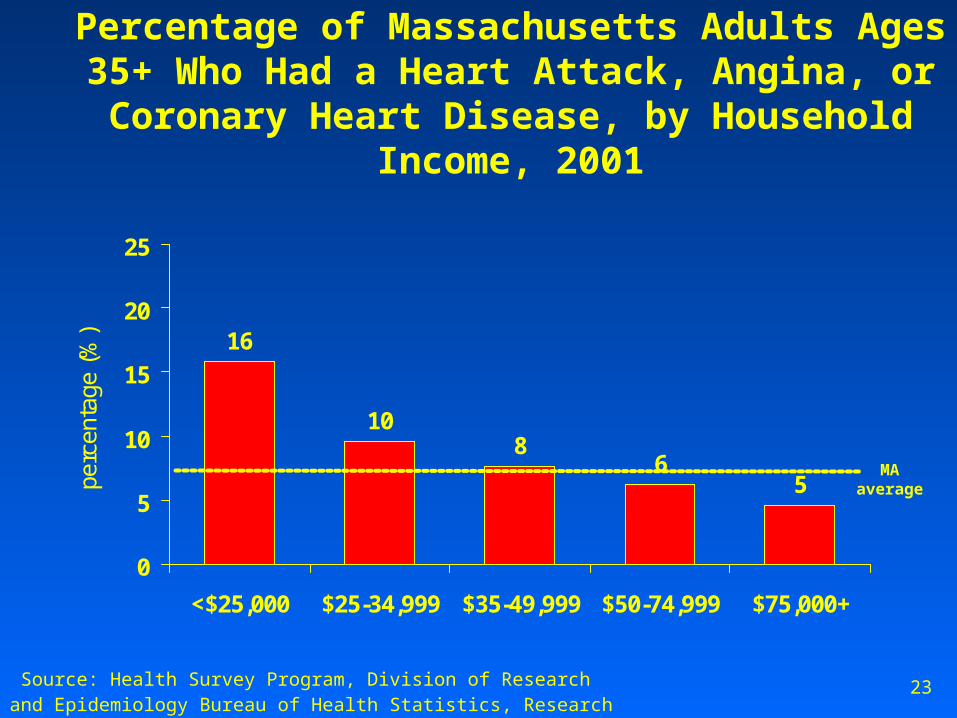
Percentage of Massachusetts Adults Ages 35+ Who Had a Heart Attack, Angina, or Coronary
Heart Disease, by Household Income, 2001
16
10
65
8
0
5
10
15
20
25
<$25,000 $25-34,999 $35-49,999 $50-74,999 $75,000+
perc
enta
ge (
%)
MA average
Source: Health Survey Program, Division of Research and Epidemiology Bureau of Health Statistics, Research and Evaluation, MDPH
24
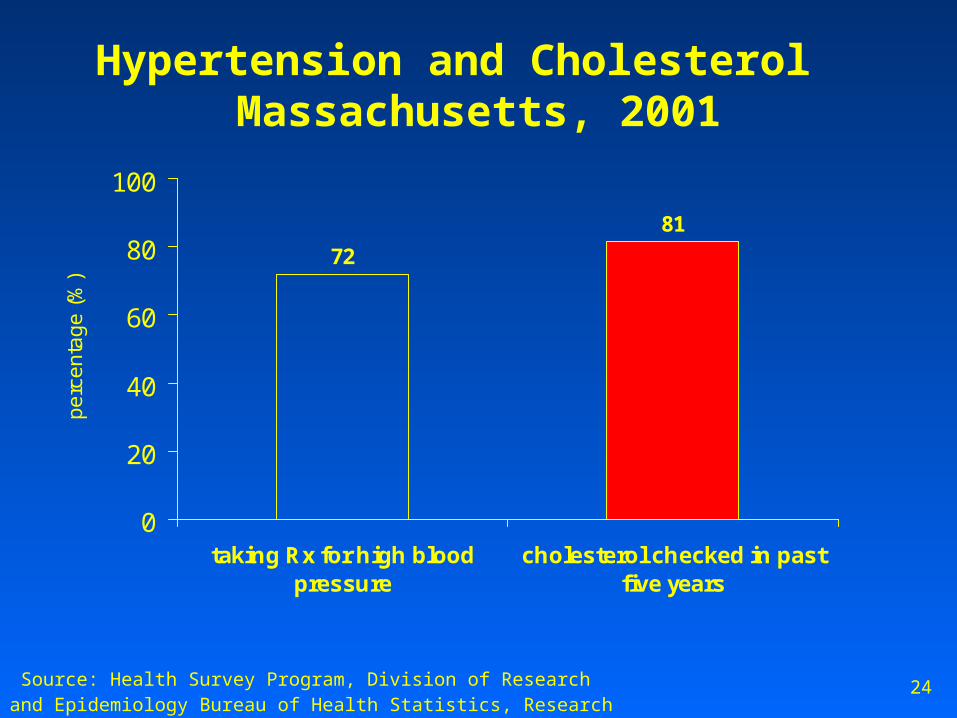
Hypertension and Cholesterol Massachusetts, 2001
72
81
0
20
40
60
80
100
taking Rx for high bloodpressure
cholesterol checked in pastfive years
pe
rce
nta
ge
(%
)
Source: Health Survey Program, Division of Research and Epidemiology Bureau of Health Statistics, Research and Evaluation, MDPH
25
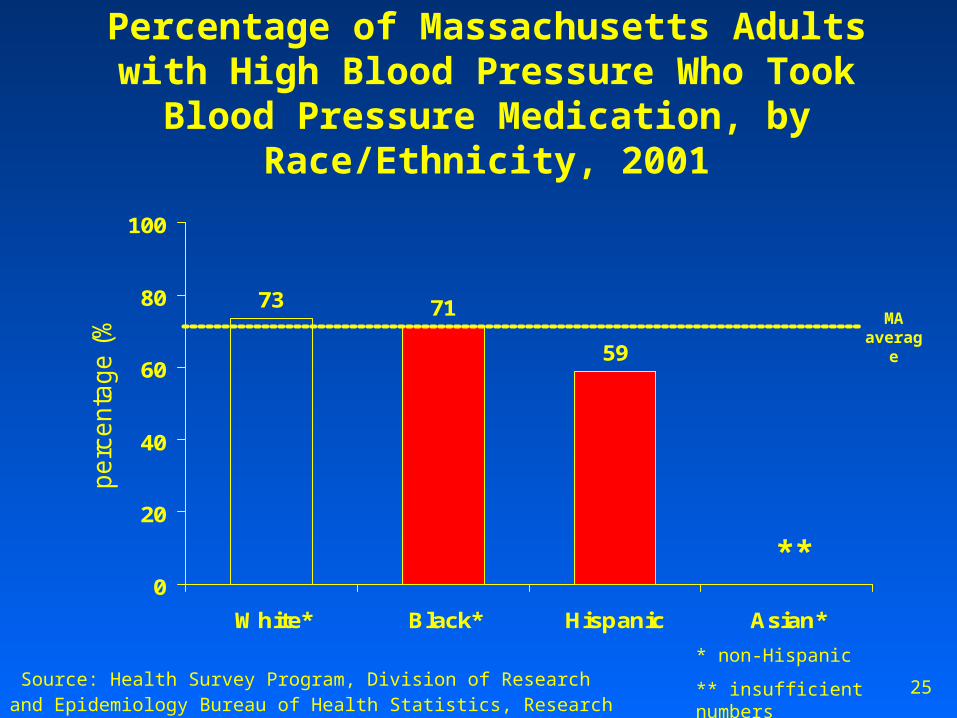
Percentage of Massachusetts Adults with High Blood Pressure Who Took Blood
Pressure Medication, by Race/Ethnicity, 2001
73 71
59
0
20
40
60
80
100
White* Black* Hispanic Asian*
pe
rce
nta
ge
(%
)
MA average
**
* non-Hispanic
** insufficient numbers
Source: Health Survey Program, Division of Research and Epidemiology Bureau of Health Statistics, Research and Evaluation, MDPH
26
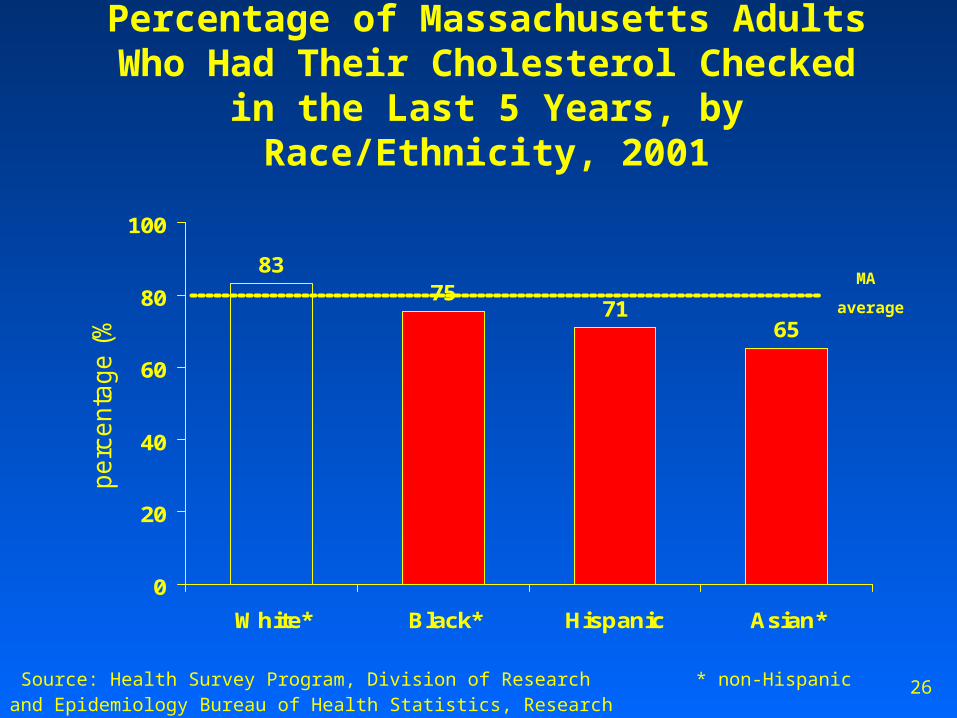
Percentage of Massachusetts Adults Who Had Their Cholesterol Checked in the Last 5
Years, by Race/Ethnicity, 2001
8375
7165
0
20
40
60
80
100
White* Black* Hispanic Asian*
pe
rce
nta
ge
(%
)
MA
average
* non-Hispanic
Source: Health Survey Program, Division of Research and Epidemiology Bureau of Health Statistics, Research and Evaluation, MDPH
27
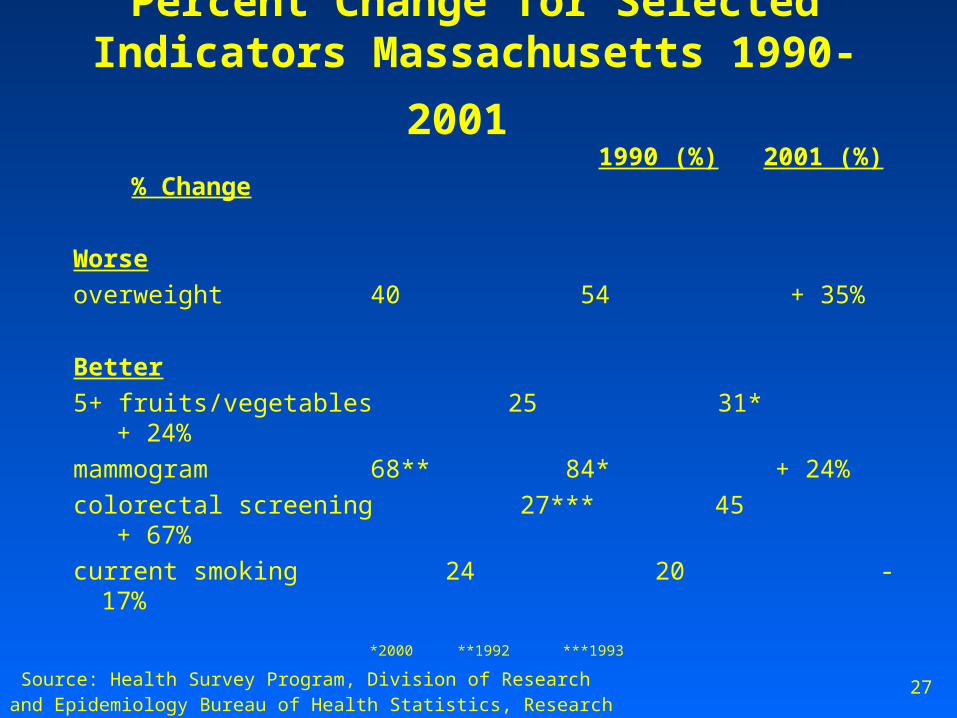
Percent Change for Selected Indicators
Massachusetts 1990-2001 1990 (%) 2001 (%) % Change
Worse
overweight 40 54 + 35%
Better
5+ fruits/vegetables 25 31* + 24%
mammogram 68** 84* + 24%
colorectal screening 27*** 45 + 67%
current smoking 24 20 - 17%
*2000 **1992 ***1993
Source: Health Survey Program, Division of Research and Epidemiology Bureau of Health Statistics, Research and Evaluation, MDPH
28
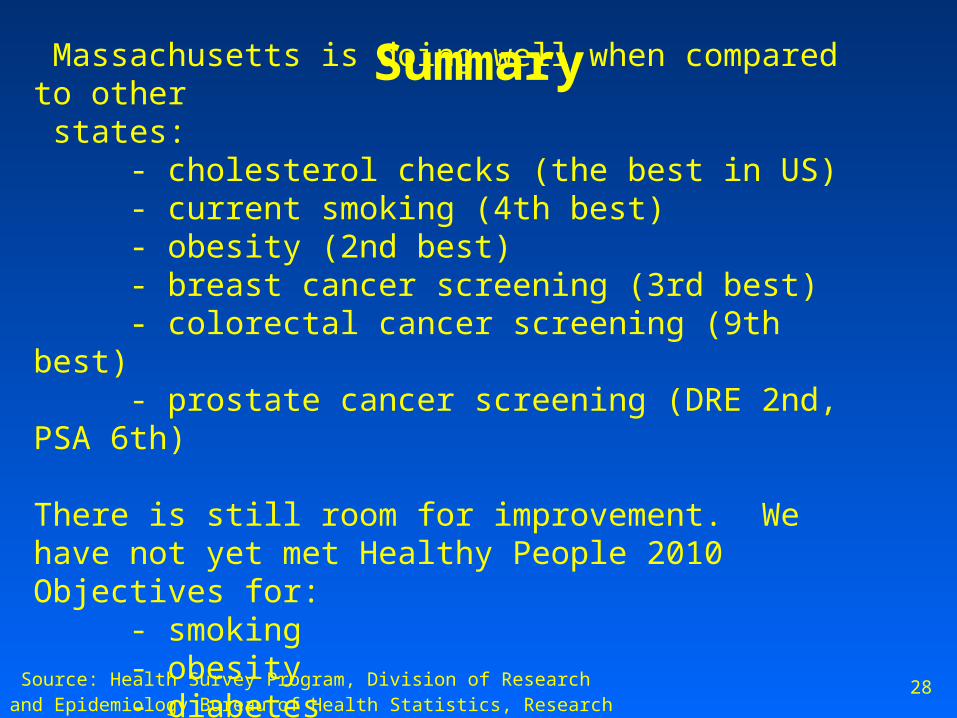
Summary Massachusetts is doing well when compared to other states:
- cholesterol checks (the best in US) - current smoking (4th best) - obesity (2nd best)
- breast cancer screening (3rd best) - colorectal cancer screening (9th best)
- prostate cancer screening (DRE 2nd, PSA 6th) There is still room for improvement. We have not yet met Healthy People 2010 Objectives for: - smoking
- obesity- diabetes
Source: Health Survey Program, Division of Research and Epidemiology Bureau of Health Statistics, Research and Evaluation, MDPH
29
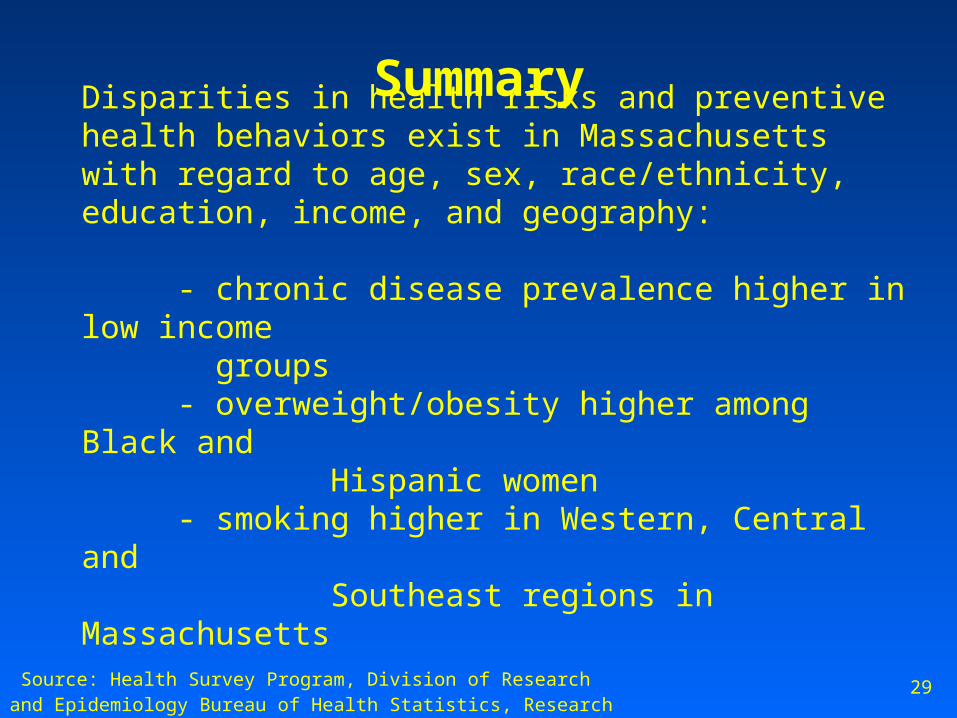
Summary
Disparities in health risks and preventive health behaviors exist in Massachusetts with regard to age, sex, race/ethnicity, education, income, and geography:
- chronic disease prevalence higher in low income groups - overweight/obesity higher among Black and Hispanic women - smoking higher in Western, Central and Southeast regions in Massachusetts
Source: Health Survey Program, Division of Research and Epidemiology Bureau of Health Statistics, Research and Evaluation, MDPH
30
Contents of BRFSS Reports
* Percent estimates of key variables by age, sex, race/ethnicity, education, income, and health service region
* Trends over time
* Comparisons of MA data to: - National median - Healthy People 2010 objectives
Source: Health Survey Program, Division of Research and Epidemiology Bureau of Health Statistics, Research and Evaluation, MDPH
31
How to obtain these data?
For access to reports and data:
* Visit BRFSS web site: http://www.state.ma.us/dph/bhsre/cdsp/brfss/brfss.htm * MassCHIP: 2000 and 2001 BRFSS data will be available late in 2003
For more information about BRFSS, please contact: Zi Zhang, Director of Health Survey Program Tel: (617) 624-5623 E-mail: [email protected]