Embed Size (px)
Citation preview

Health Economic Evaluation and Public Health Decision
Making
Prof. Andres Pichon-RiviereExecutive Director – Institute for Clinical Effectiveness and Health Policy, ArgentinaProfessor of Public Health, University of Buenos Aires
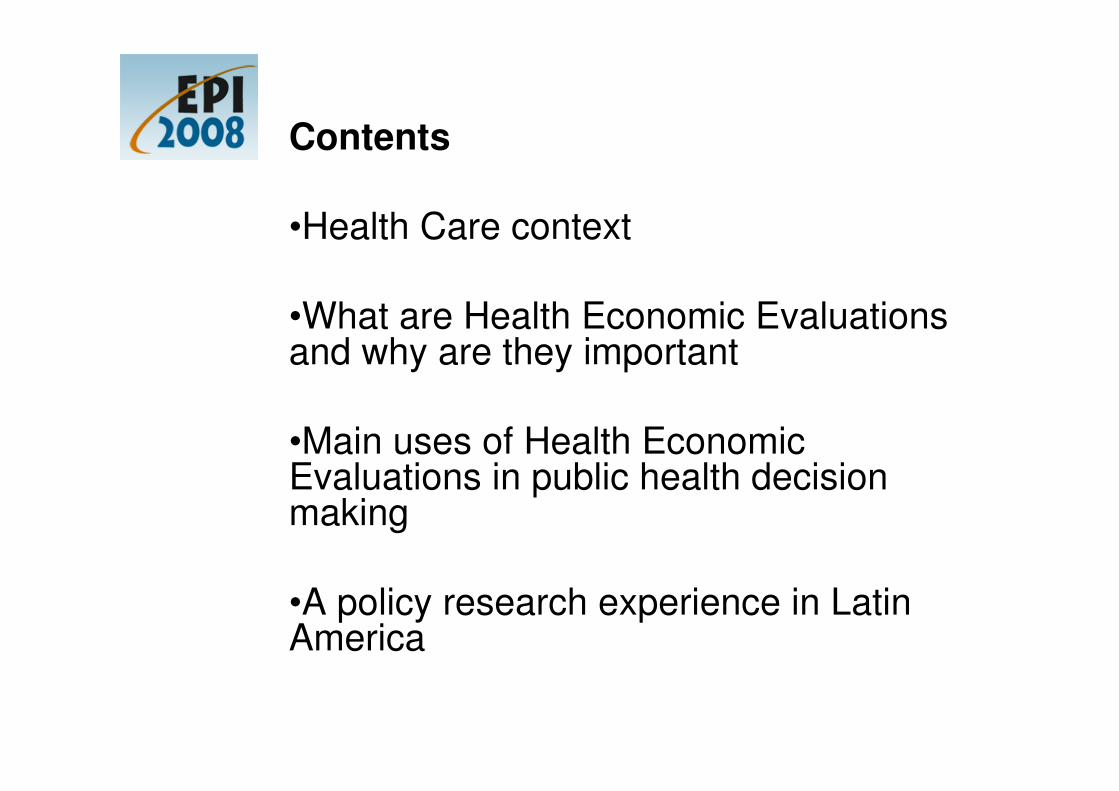
Contents
•Health Care context
•What are Health Economic Evaluations and why are they important
•Main uses of Health Economic Evaluations in public health decision making
•A policy research experience in Latin America
www.iecs.org.ar
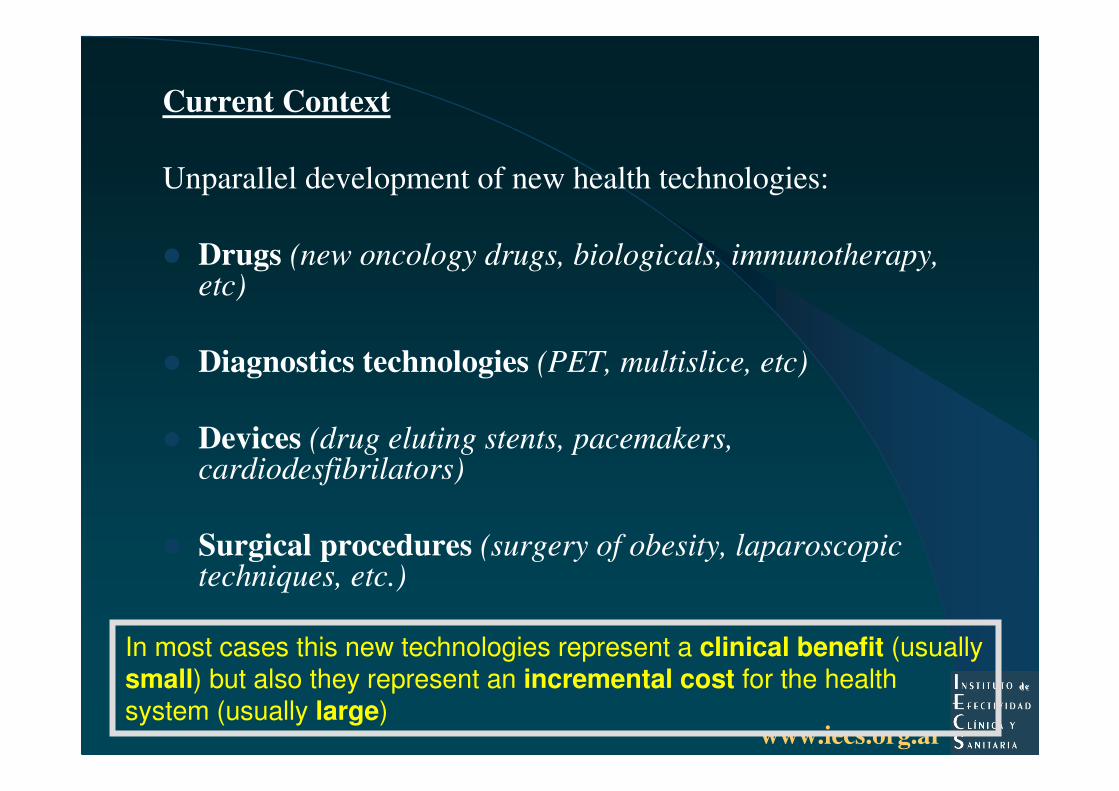
Current Context
Unparallel development of new health technologies:
� Drugs (new oncology drugs, biologicals, immunotherapy, etc)
� Diagnostics technologies (PET, multislice, etc)
� Devices (drug eluting stents, pacemakers, cardiodesfibrilators)
� Surgical procedures (surgery of obesity, laparoscopic techniques, etc.)
In most cases this new technologies represent a clinical benefit (usually small) but also they represent an incremental cost for the health system (usually large)
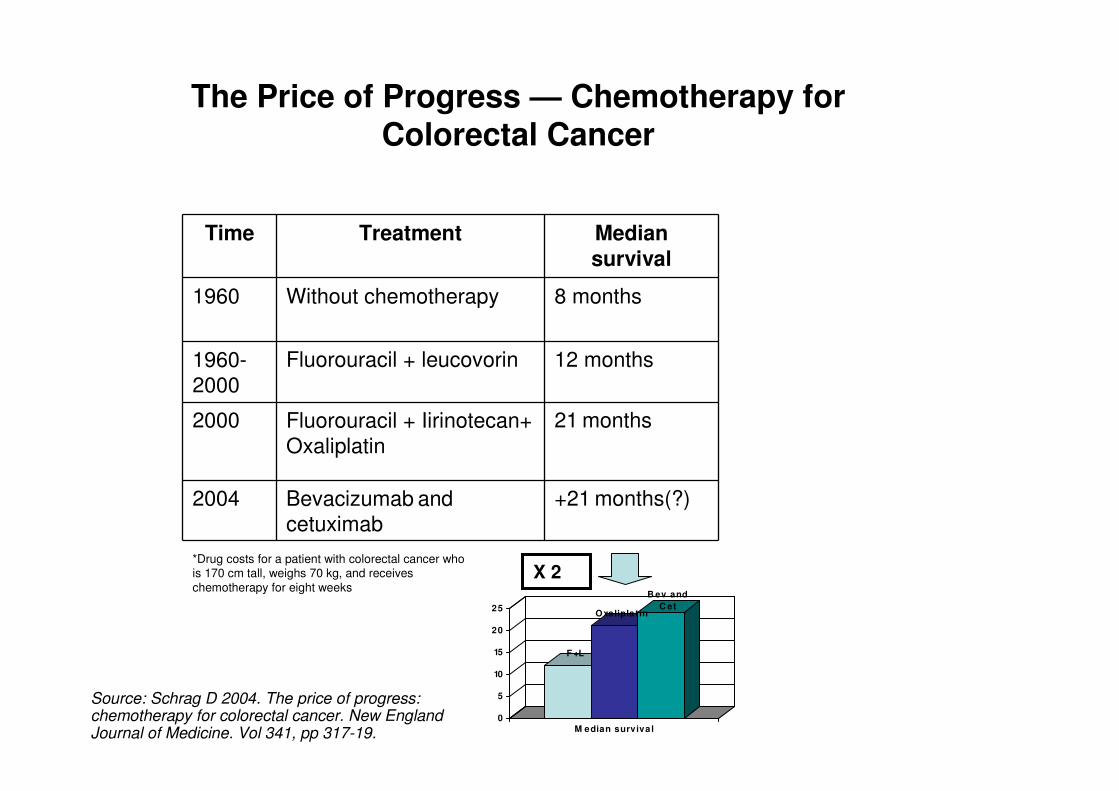
Time Treatment Median survival
1960 Without chemotherapy 8 months
1960-2000
Fluorouracil + leucovorin 12 months
2000 Fluorouracil + Iirinotecan+ Oxaliplatin
21 months
2004 Bevacizumab and cetuximab
+21 months(?)
F +L
Oxaliplat in
B ev and C et
0
5
10
15
20
25
M edian surviva l
X 2
The Price of Progress — Chemotherapy for Colorectal Cancer
*Drug costs for a patient with colorectal cancer who is 170 cm tall, weighs 70 kg, and receives chemotherapy for eight weeks
Source: Schrag D 2004. The price of progress: chemotherapy for colorectal cancer. New England Journal of Medicine. Vol 341, pp 317-19.
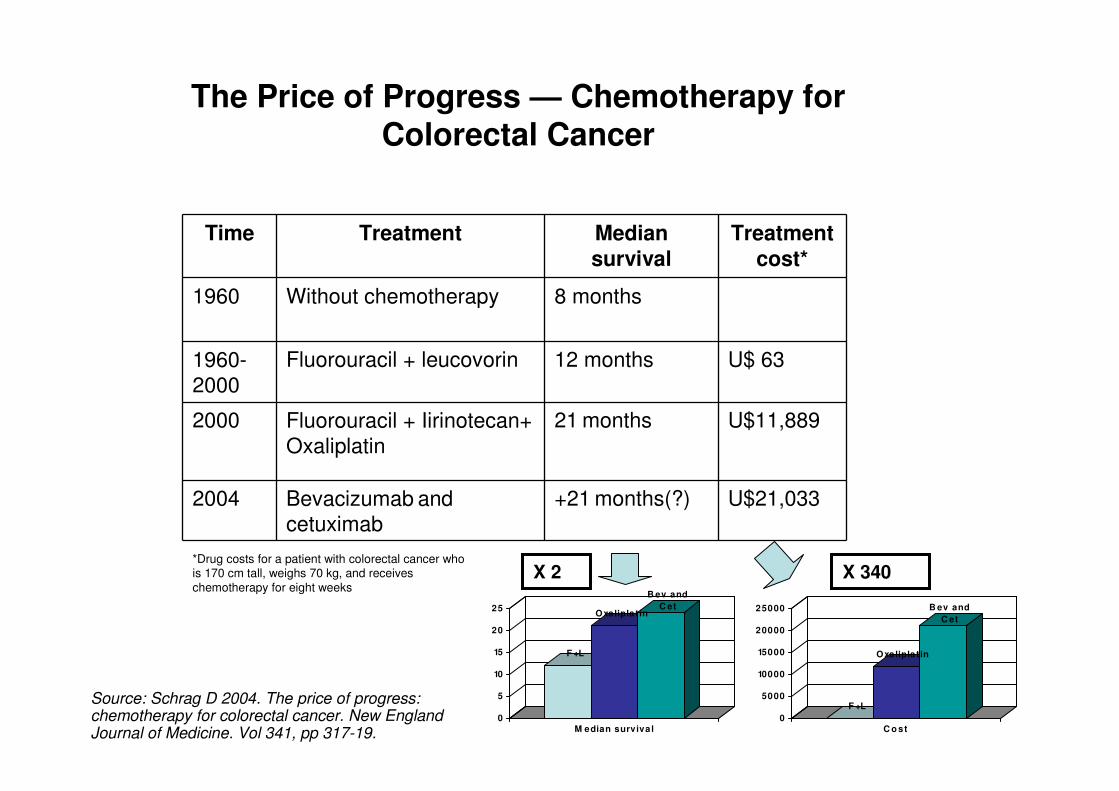
Time Treatment Median survival
Treatment cost*
1960 Without chemotherapy 8 months
1960-2000
Fluorouracil + leucovorin 12 months U$ 63
2000 Fluorouracil + Iirinotecan+ Oxaliplatin
21 months U$11,889
2004 Bevacizumab and cetuximab
+21 months(?) U$21,033
F +L
Oxaliplat in
B ev and C et
0
5
10
15
20
25
M edian surviva l
F +L
Oxaliplat in
B ev and C et
0
5000
10000
15000
20000
25000
C o st
X 2 X 340
The Price of Progress — Chemotherapy for Colorectal Cancer
*Drug costs for a patient with colorectal cancer who is 170 cm tall, weighs 70 kg, and receives chemotherapy for eight weeks
Source: Schrag D 2004. The price of progress: chemotherapy for colorectal cancer. New England Journal of Medicine. Vol 341, pp 317-19.
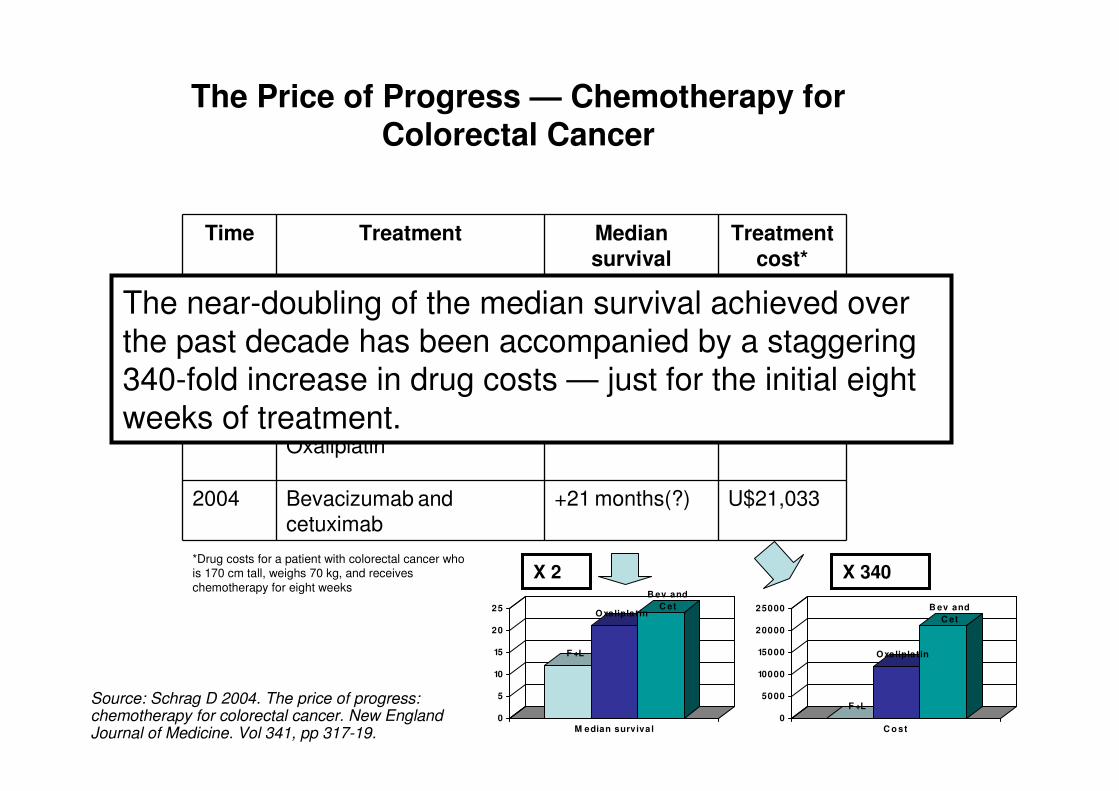
Time Treatment Median survival
Treatment cost*
1960 Without chemotherapy 8 months
1960-2000
Fluorouracil + leucovorin 12 months U$ 63
2000 Fluorouracil + Iirinotecan+ Oxaliplatin
21 months U$11,889
2004 Bevacizumab and cetuximab
+21 months(?) U$21,033
F +L
Oxaliplat in
B ev and C et
0
5
10
15
20
25
M edian surviva l
F +L
Oxaliplat in
B ev and C et
0
5000
10000
15000
20000
25000
C o st
X 2 X 340
The Price of Progress — Chemotherapy for Colorectal Cancer
*Drug costs for a patient with colorectal cancer who is 170 cm tall, weighs 70 kg, and receives chemotherapy for eight weeks
Source: Schrag D 2004. The price of progress: chemotherapy for colorectal cancer. New England Journal of Medicine. Vol 341, pp 317-19.
The near-doubling of the median survival achieved over the past decade has been accompanied by a staggering 340-fold increase in drug costs — just for the initial eight weeks of treatment.
www.iecs.org.ar
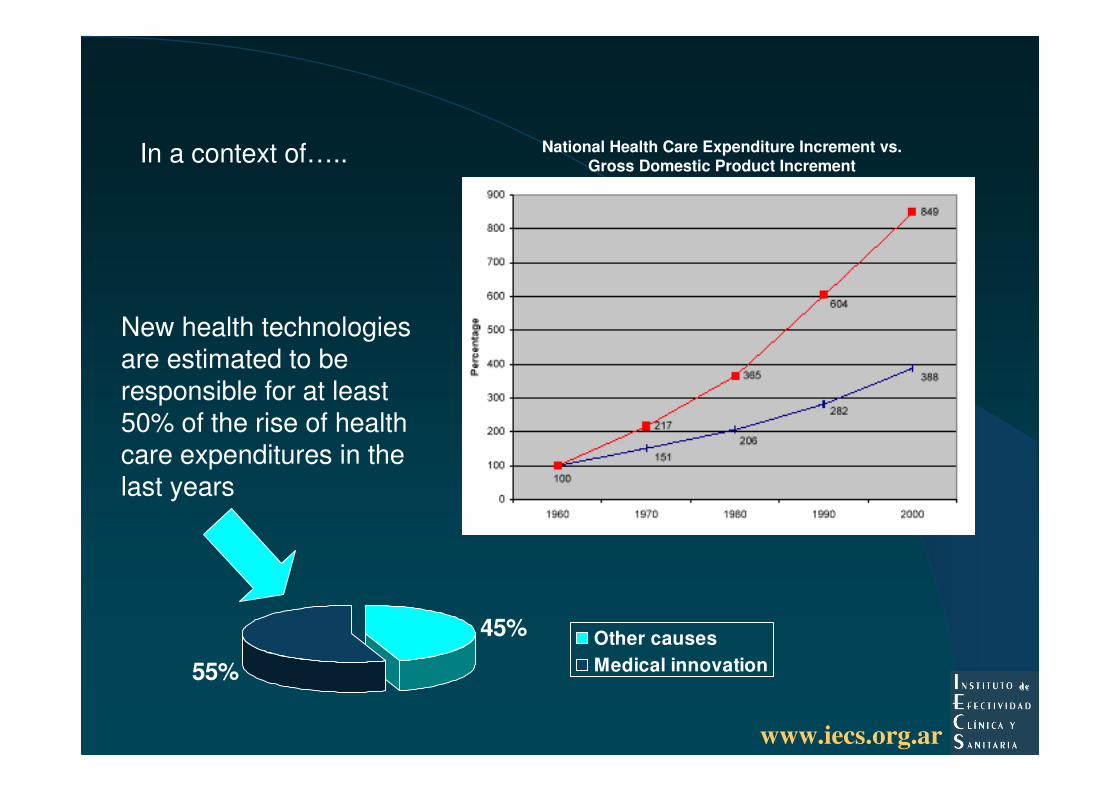
45%
55%
Other causesMedical innovation
New health technologies are estimated to be responsible for at least 50% of the rise of health care expenditures in the last years
National Health Care Expenditure Increment vs.Gross Domestic Product IncrementIn a context of…..
www.iecs.org.arEvaluación de Tecnologías Sanitarias. Prof. Dr. Andrés Pichon-Riviere
New (and old) health technologies are not available to all….
Impressive improvements have occurred in global health status in the past century. Unfortunately, these improvements have not been shared equally and health inequalities within and among countries are entrenched.
If all countries had the Japanese child (under-5 years of age) mortality rates, the lowest in the world, there would be only one million child deaths each year, instead of the 11 million deaths which occur now.
Seven of ten deaths in children under the age of 5 years occur in low-income countries and can be attributed to just five preventable conditions—pneumonia, diarrhoeal diseases, malaria, measles, and malnutrition; these conditions overlap and are exacerbated by poverty
Global health status: two steps forward, one step back. Kasturi Sen, Ruth Bonita. Lancet 2000;
356: 577–82
www.iecs.org.arEvaluación de Tecnologías Sanitarias. Prof. Dr. Andrés Pichon-Riviere
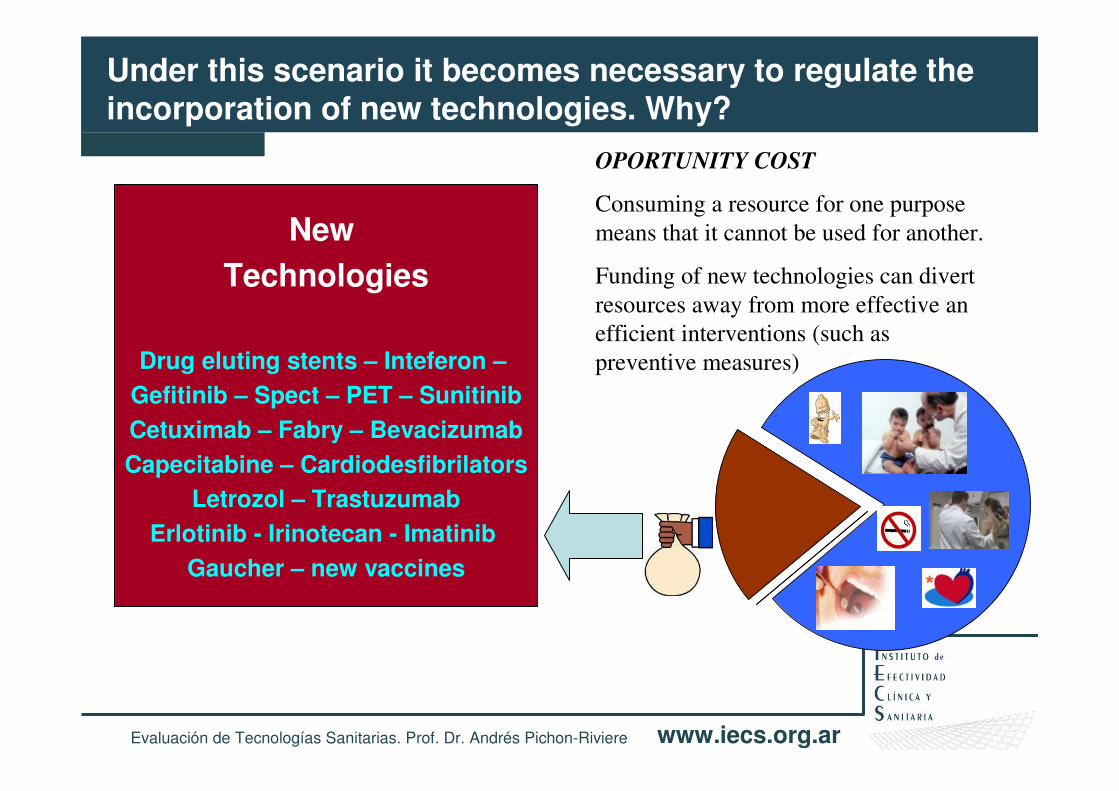
New
Technologies
Drug eluting stents – Inteferon –
Gefitinib – Spect – PET – Sunitinib
Cetuximab – Fabry – Bevacizumab
Capecitabine – Cardiodesfibrilators
Letrozol – Trastuzumab
Erlotinib - Irinotecan - Imatinib
Gaucher – new vaccines
Under this scenario it becomes necessary to regulate the incorporation of new technologies. Why?
OPORTUNITY COST
Consuming a resource for one purpose
means that it cannot be used for another.
Funding of new technologies can divert
resources away from more effective an
efficient interventions (such as
preventive measures)
www.iecs.org.arEvaluación de Tecnologías Sanitarias. Prof. Dr. Andrés Pichon-Riviere
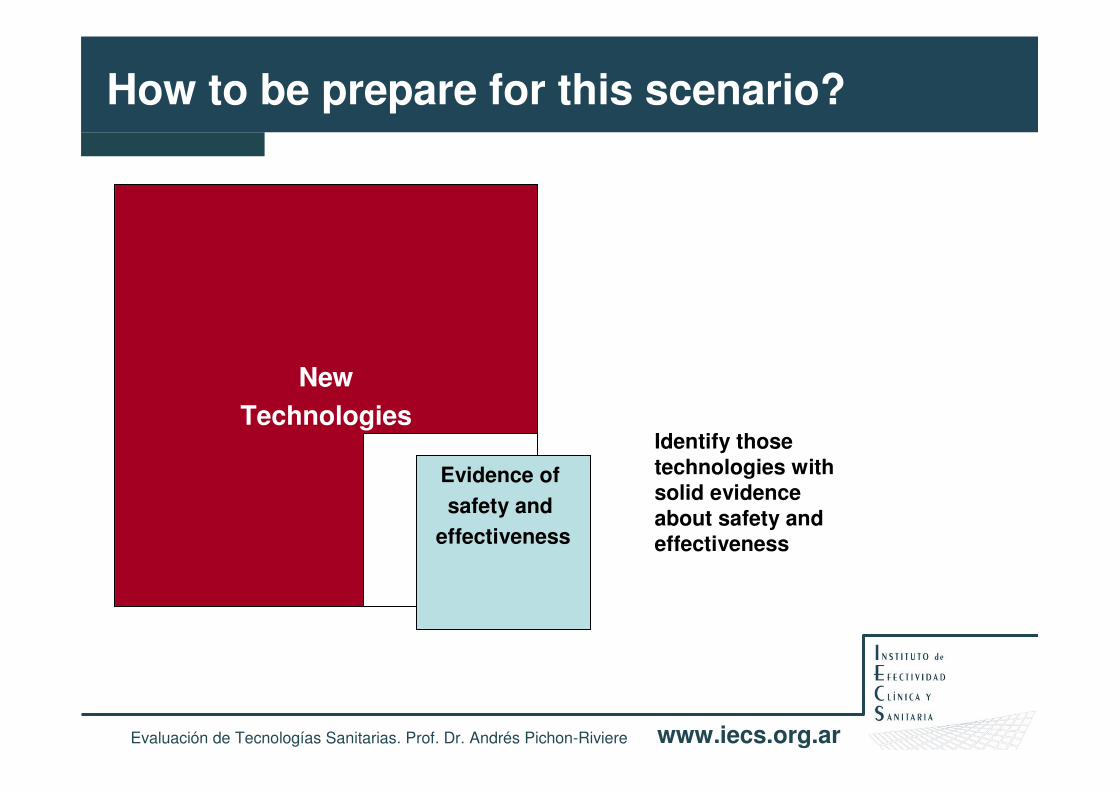
New
Technologies
Evidence of
safety and
effectiveness
How to be prepare for this scenario?
Identify those technologies with solid evidence about safety and effectiveness
www.iecs.org.arEvaluación de Tecnologías Sanitarias. Prof. Dr. Andrés Pichon-Riviere
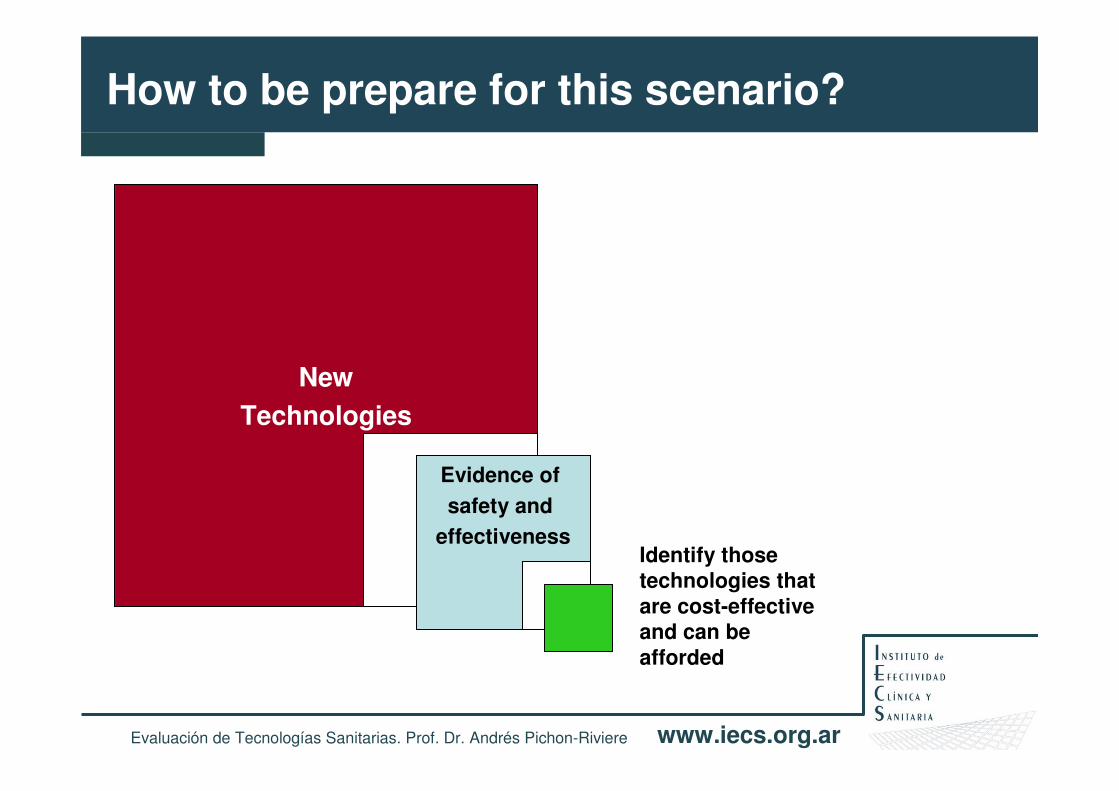
New
Technologies
Evidence of
safety and
effectiveness
How to be prepare for this scenario?
Identify those technologies that are cost-effective and can be afforded
www.iecs.org.arEvaluación de Tecnologías Sanitarias.
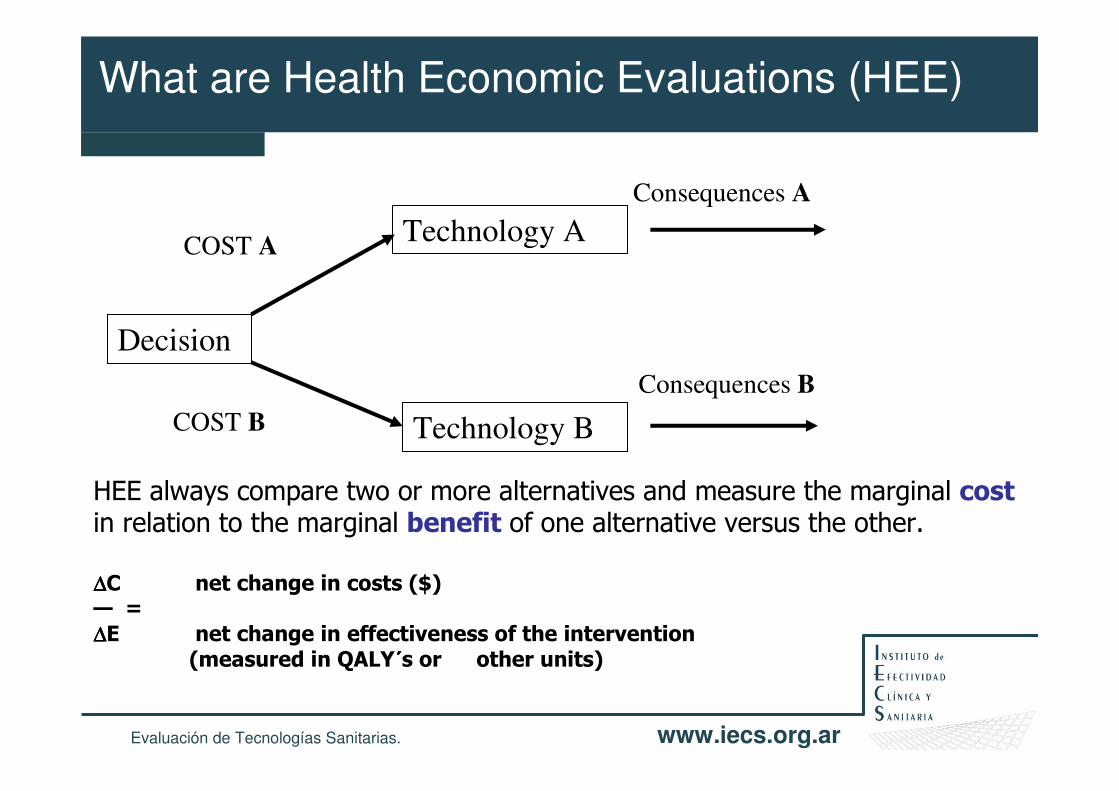
What are Health Economic Evaluations (HEE)
HEE always compare two or more alternatives and measure the marginal costin relation to the marginal benefit of one alternative versus the other.
∆∆∆∆C net change in costs ($)— = ∆∆∆∆E net change in effectiveness of the intervention
(measured in QALY´́́́s or other units)
Decision
Technology A
Technology B
COST A
COST B
Consequences A
Consequences B
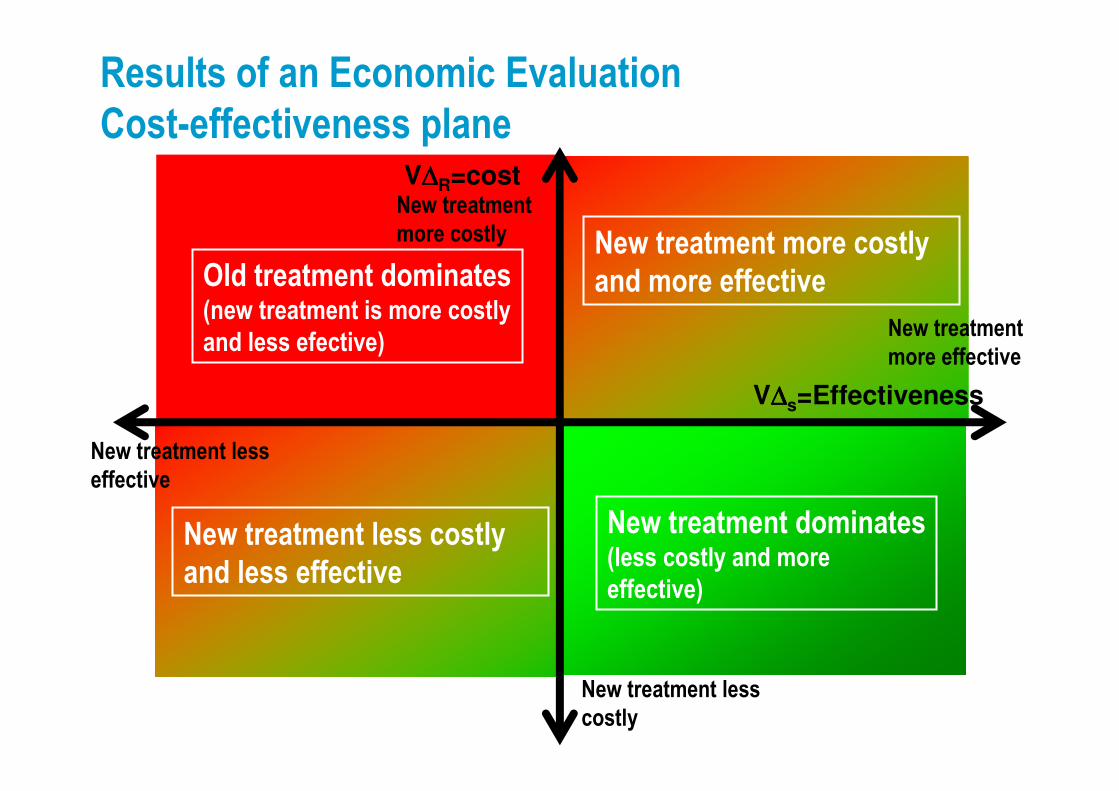
Results of an Economic Evaluation
Cost-effectiveness plane
New treatment
more effective
New treatment less
effective
New treatment
more costly
New treatment less
costly
New treatment dominates(less costly and more
effective)
Old treatment dominates(new treatment is more costly
and less efective)
New treatment more costly
and more effective
New treatment less costly
and less effective
V∆∆∆∆s=Effectiveness
V∆∆∆∆R=cost
Evaluaciones Económicas – Dr. Andres Pichon-Riviere www.iecs.org.ar
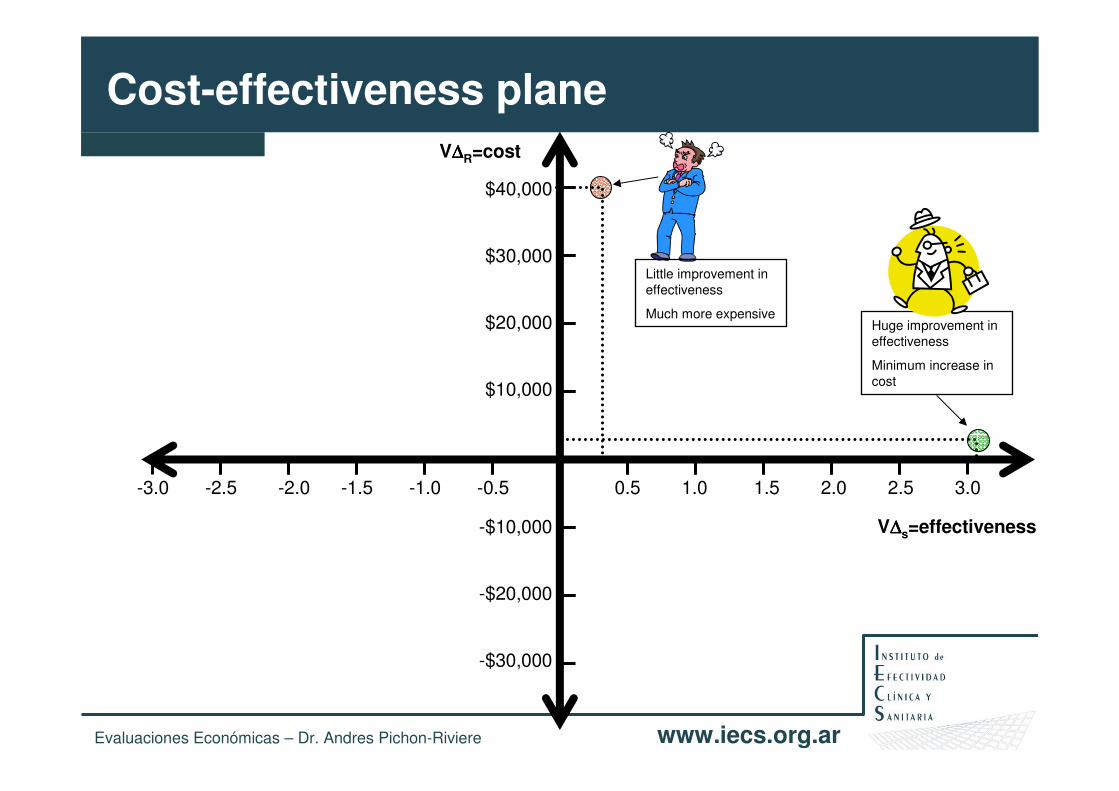
Cost-effectiveness planeV∆∆∆∆R=cost
V∆∆∆∆s=effectiveness
0.5 1.0 1.5 2.0 2.5 3.0-3.0 -2.5 -2.0 -1.5 -1.0 -0.5
$40,000
$30,000
$20,000
$10,000
-$10,000
-$20,000
-$30,000
Huge improvement in effectiveness
Minimum increase in cost
Little improvement in effectiveness
Much more expensive
Evaluaciones Económicas – Dr. Andres Pichon-Riviere www.iecs.org.ar
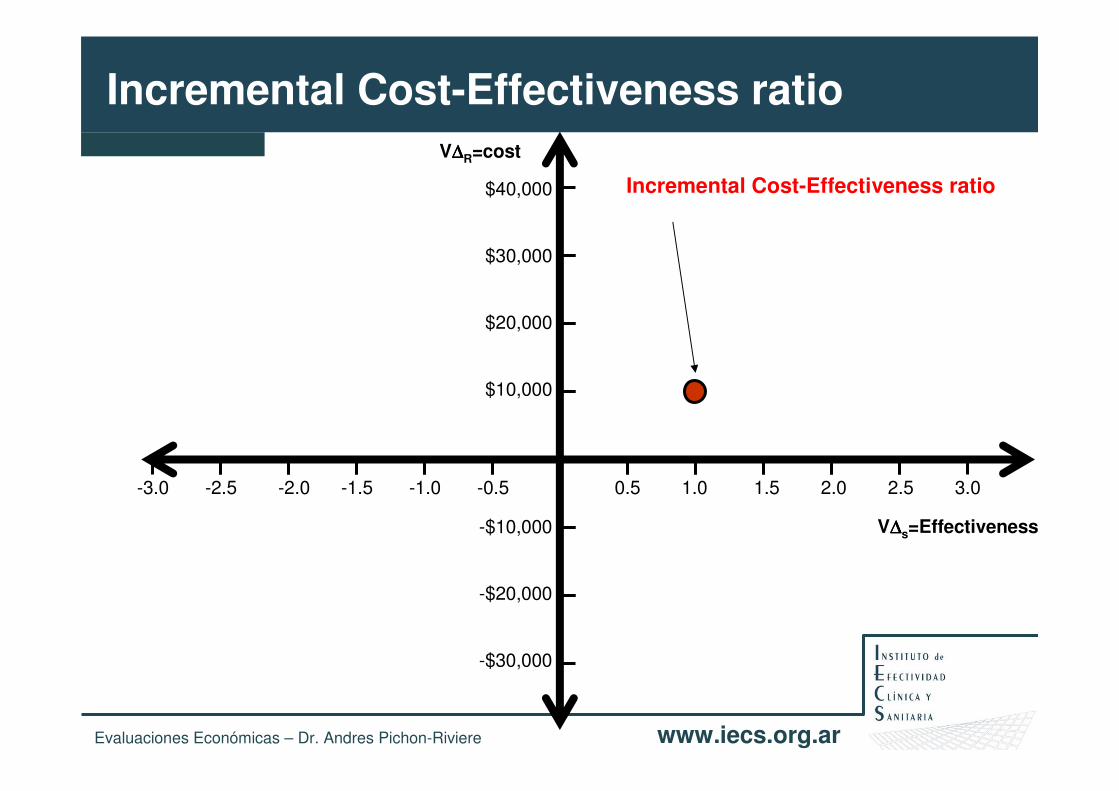
V∆∆∆∆R=cost
V∆∆∆∆s=Effectiveness
0.5 1.0 1.5 2.0 2.5 3.0-3.0 -2.5 -2.0 -1.5 -1.0 -0.5
$40,000
$30,000
$20,000
$10,000
-$10,000
-$20,000
-$30,000
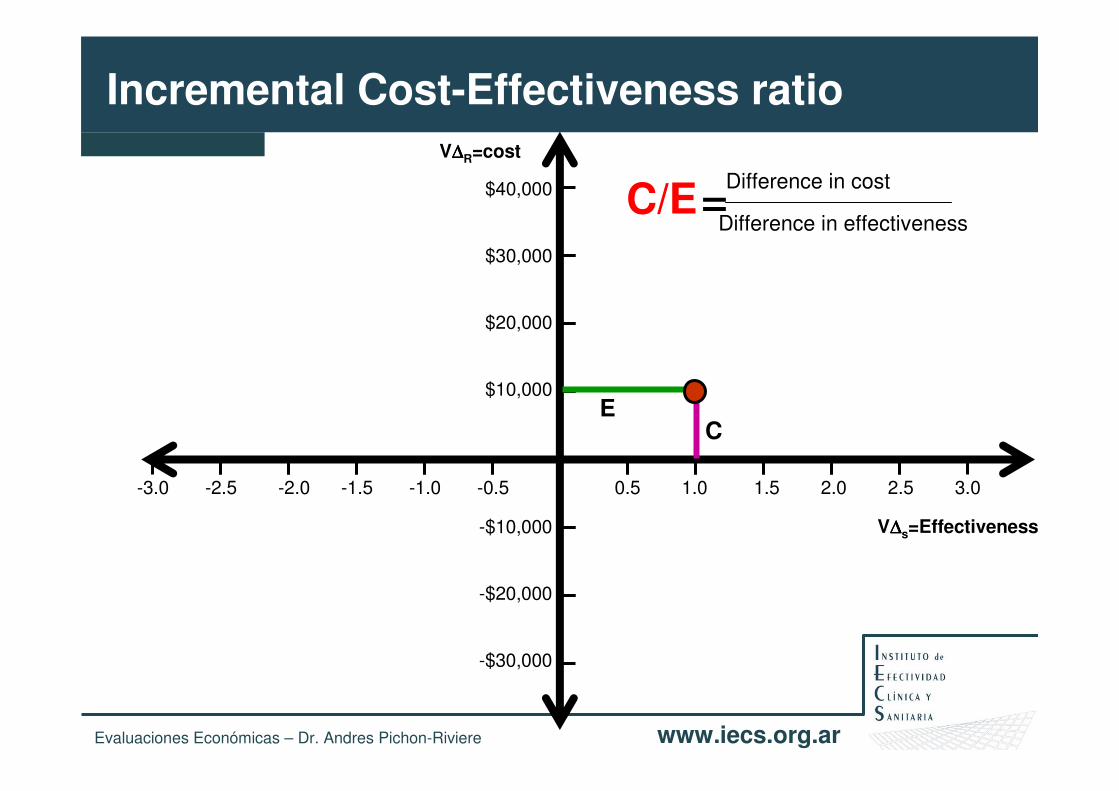
Incremental Cost-Effectiveness ratio
Incremental Cost-Effectiveness ratio
Evaluaciones Económicas – Dr. Andres Pichon-Riviere www.iecs.org.ar
V∆∆∆∆R=cost
V∆∆∆∆s=Effectiveness
0.5 1.0 1.5 2.0 2.5 3.0-3.0 -2.5 -2.0 -1.5 -1.0 -0.5
$40,000
$30,000
$20,000
$10,000
-$10,000
-$20,000
-$30,000
Incremental Cost-Effectiveness ratio
Difference in cost
Difference in effectiveness=C/E
CE
Evaluaciones Económicas – Dr. Andres Pichon-Riviere www.iecs.org.ar
V∆∆∆∆R=cost
V∆∆∆∆s=Effectiveness
0.5 1.0 1.5 2.0 2.5 3.0-3.0 -2.5 -2.0 -1.5 -1.0 -0.5
$40,000
$30,000
$20,000
$10,000
-$10,000
-$20,000
-$30,000
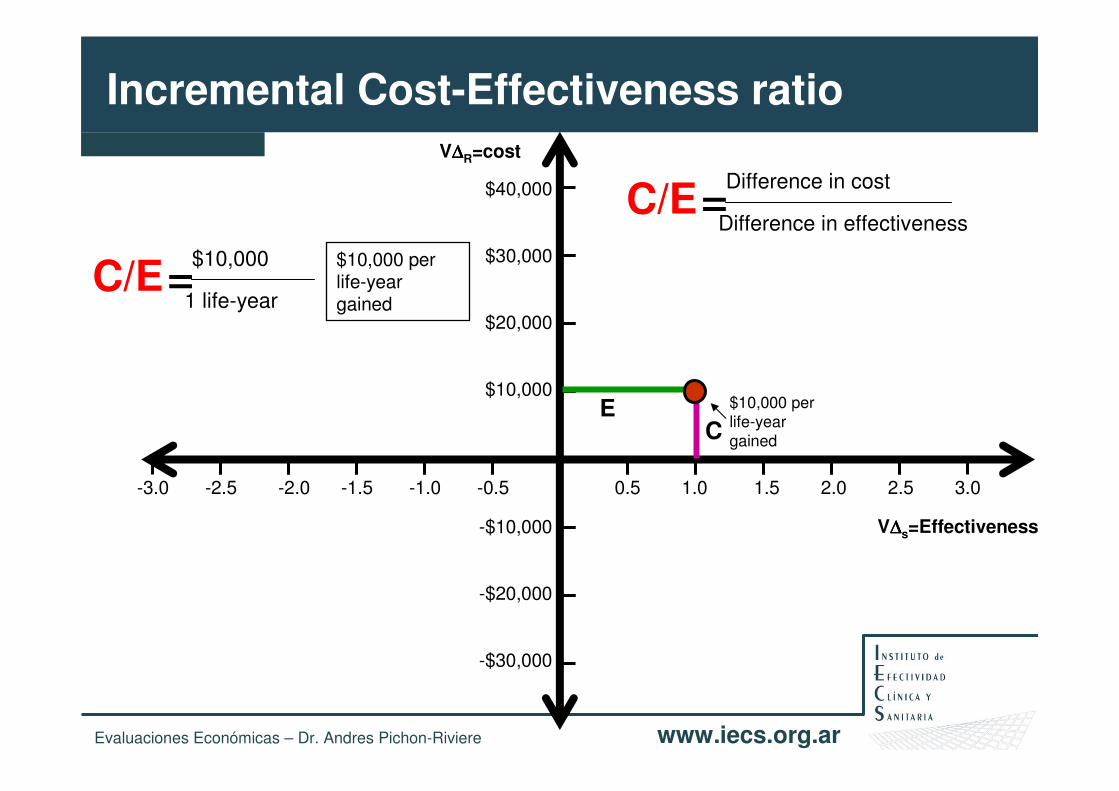
Incremental Cost-Effectiveness ratio
Difference in cost
Difference in effectiveness=C/E
CE
$10,000
1 life-year=C/E
$10,000 per life-year gained
$10,000 per life-year gained
Evaluaciones Económicas – Dr. Andres Pichon-Riviere www.iecs.org.ar
V∆∆∆∆R=cost
V∆∆∆∆s=Effectiveness
0.5 1.0 1.5 2.0 2.5 3.0-3.0 -2.5 -2.0 -1.5 -1.0 -0.5
$40,000
$30,000
$20,000
$10,000
-$10,000
-$20,000
-$30,000
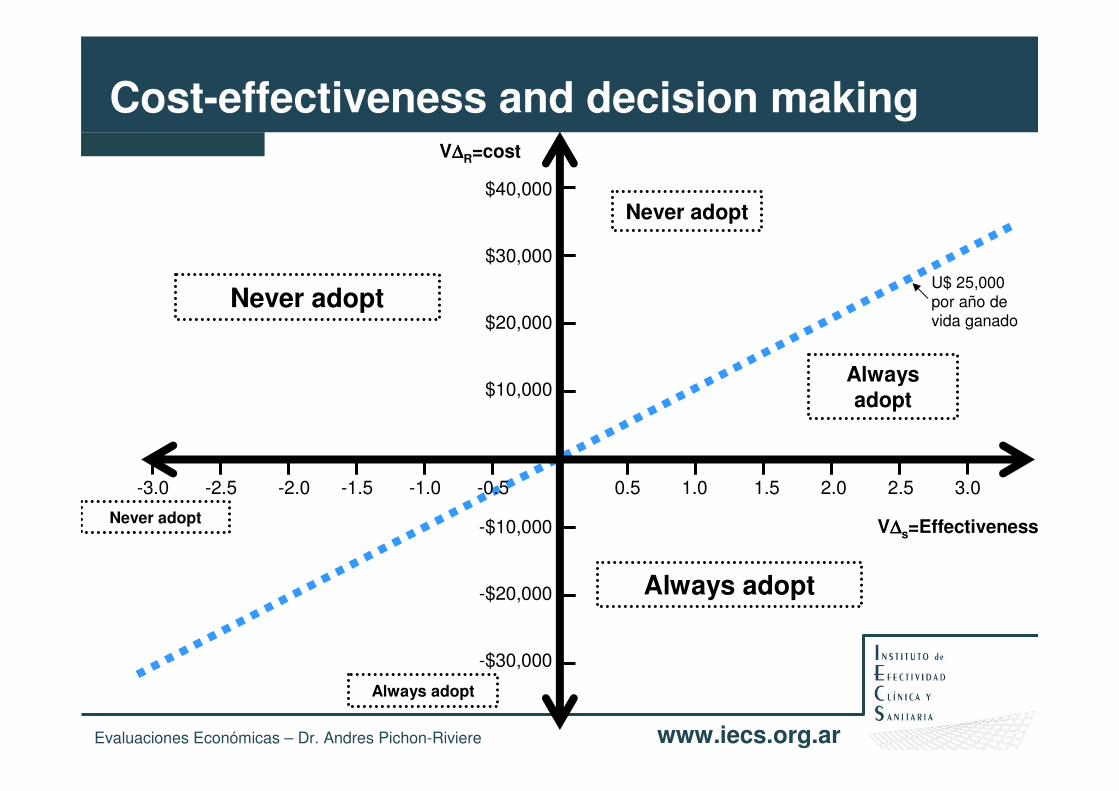
Cost-effectiveness and decision making
U$ 25,000 por año de vida ganado
Never adopt
Always adopt
Never adopt
Never adopt
Always adopt
Always adopt

Evaluaciones Económicas – Dr. Andres Pichon-Riviere www.iecs.org.ar
V∆∆∆∆R=cost
V∆∆∆∆s=Effectiveness
0.5 1.0 1.5 2.0 2.5 3.0-3.0 -2.5 -2.0 -1.5 -1.0 -0.5
$40,000
$30,000
$20,000
$10,000
-$10,000
-$20,000
-$30,000
Cost-effectiveness and decision making
U$ 25,000 por año de vida ganado
Never adopt
Always adopt
Never adopt
Never adopt
Always adopt
Always adopt
U$ 50,000 per life-year gained
U$ 10,000 per life-year gained
Politics, equity, public relations
Arbitrary
Politics, equity, public relations

www.iecs.org.arDr. Andrés Pichon-Riviere
ICER y aprobación
Source: George et al. PharmacoEconomics 2001; 19(11): 1103-1109.

Cost-effectiveness and decision making: the
‘4th hurdle’ in reimbursement regulation
Australia Australia
Ontario Ontario
The NetherlandsThe Netherlands
NorwayNorway
Portugal Portugal
Finland Finland
United KingdomUnited Kingdom
++
++
• Mandatory use of economics in
decision making

FUNDING1) International Clinical Epidemiology Network (INCLEN Trust)2) Initiative for Cardiovascular Health Research in the Developing Countries (IC-Health) –
WHO3) International Development Research Centre (IDRC), Canadian Tobacco Control
Research Initiative (CTCRI), American Cancer Society (ACS), Cancer Research UK, Institut National du Cancer France, Department for International Development UK (DFID).
Country Institution
Argentina Instituto de Efectividad Clínica y Sanitaria
Argentina Universidad Nacional de Tucumán
Bolivia Universidad Mayor de San Andrés (UMSA)
Brasil Universidade Federal do Rio de Janeiro
Chile Universidad de la Frontera
Colombia Pontificia Universidad Javeriana
México Instituto Mexicano del Seguro Social/ Facultad de Medicina UNAM
Peru Universidad Peruana Cayetano Heredia
Cost-Effectiveness of smoking cessation interventions in Seven Latin American Countries

Objective:To evaluate the cost-effectiveness of smoking cessation interventions (SCI) in seven Latin American countries
Methods:A first order Monte Carlo, or probabilistic microsimulation of individual patients was built, incorporating the natural history, costs and quality of life impact of the main tobacco-related diseases: coronary and non-coronary heart disease, cerebrovascular disease, COPD, pneumonia/influenza, lung cancer as well as 9 other neoplasms. The model incorporated background quitting rates (2.5% per year) and background relapsing rates (30% in the first 5 years after quitting). The public health perspective and a base-case discount rate of 5% were used.
Cost-Effectiveness of smoking cessation interventions in Seven Latin American Countries

Results (1):The validation showed adequate internal validity, with all simulated events rates falling within ±10% of the source publications. R2 between predicted and observed values ranged from 0.758 to 0.999. External validation showed an excellent correlation between published data and model results.
Cost-Effectiveness of smoking cessation interventions in Seven Latin American Countries
0
50
100
150
200
250
300
35 40 45 50 55 60 65 70 75 80 85 90 95 100
Age (years)
Po
pu
lati
on
an
nu
al M
I de
ath
s
0
5
10
15
20
25
35 40 45 50 55 60 65 70 75 80 85 90 95 100
Age (years)
Po
pula
tion
an
nual
kid
ney
ca
nce
r de
ath
sModelpredicted
Observed
values
0
10
20
30
40
50
60
0 10 20 30 40 50
Argentinean vital statistics data
Mo
de
l pre
dic
ted
va
lue
s
Esophagus cancer deaths y =1.0543x R² =0.8964
0
50
100
150
200
250
300
350
400
450
500
0 100 200 300 400 500
Argentinean vital statistics data
Mo
de
l pre
dic
ted
va
lue
s
Stroke deaths
y =0.9858x R² =0.9959
Figure 1. Calibration: Annual number of deaths predicted by the model in Argentina for each age strata compared to the 2005 Argentinean national vital data (35) in two selected conditions: (a) Myocardial Infarction (females); (b) Kidney cancer (males)
Figure 2. Correlation plot of model predicted versus reported age specific deaths in two selected conditions: (a) Stroke (females); (b) Esophageal cancer (males). The gradients of regression lines (y) and the correlation coefficients (R2) are reported in each graph. Reference population: Argentina 2005.

Cost-Effectiveness of smoking cessation interventions in Seven Latin American Countries
Results (2):Predicted life years, QALYs and health care costs were calculated for continuing smokers and for quitters at different ages, both for males and females in each of the countries. Incremental Cost perQALY were calculated for different sets of interventions and target populations in each of the participant countries.
-1000
-500
0
500
1000
1500
2000
-0.2 -0.1 0 0.1 0.2 0.3 0.4
Effect difference (QALYs)
Co
st
dif
fere
nc
e (
Arg
en
tin
e p
es
os
20
07
)
0%
10%
20%
30%
40%
50%
60%
70%
80%
0K 10K 20K 30K 40K 50K 60K 70K
maximun acceptable ceiling ratio in $'000 Argentine pesos
pro
ba
bilt
y n
ew
SC
I is
co
st-
eff
ec
tiv
e
(a) Cost effectiveness plane of cost- and effect-related differences between two Smoking Cessation Interventions (SCI). SCI-A: cost $472, effectiveness: 15% smoking cessation rate at one year; SCI-B: cost $1.254, effectiveness: 23% smoking cessation rate at one year - Argentine pesos 2007. Preliminary results for 500 simulated cohorts of 5000 50-year-old male smokers after one quit attempt. Discount rate for costs and effects: 5%. (b) Cost-effectiveness acceptability curve showing the probability that SCI-B is cost-effective as compared to SCI-A over a range of values for the maximum acceptable ceiling ratio.

New EE projects in LatinCLEN
• Distance Learning Course in Health Technology Assessment• IECS: www.iecs.org.ar
• Funding: Global Health Leadership Award (CIDA – IDRC)
• Economic Evaluation of new oncology drugs• LatinCLEN units from ARGENTINA – BOLIVIA – CHILE – PERU
• Funding: Global Health Leadership Award (CIDA – IDRC)
• Economic Evaluation of a neumococal vaccine• LatinCLEN units: ARGENTINA – CHILE – PERU - MEXICO

Summary
• Without good evidence, uptake & spread of technologies likely to be influenced by range of social, financial & institutional factors, and not produce healthiest outcomes for most efficient use of resources
• HTA and EE potentially plays a major role in evidence-based policy making.
• Last decade has seen an increasing international trend towards healthcare systems use HTA (and cost effectiveness) in order to assist pricing, reimbursement and technology access decisions
• Number of challenges currently face HTA• Harmonisation & transferability• Transparency, openness & fairness• Engagement of the stakeholders/public

Resultados de Costo-efectividad de Intervenciones
SIN DESCONTAR DESCONTADOSCE: 1,938 $ CE: 3,019 $
Dif COSTOS Dif QALYs Dif COSTOS Dif QALYs
Promedio 352 $ 0.18 n= 100 Promedio 379 $ 0.13
Min: -20,311 $ 3.91 - Min: -8,241 $ 2.59 -
Max: 27,365 $ 4.10 Max: 9,300 $ 2.79
De: 6995.0034 1.18 De: 2625.3621 0.80
PACIENTES DE 55 AÑOS sin ANTECEDENTE DE IAM PREVIO, 2,000 100:100 todos fumadores que intentan año 1: RR 1.5 costo 600
-5
-4
-3
-2
-1
0
1
2
3
4
5
-30,000 $ -20,000 $ -10,000 $ 0 $ 10,000 $ 20,000 $ 30,000 $
-3
-2
-1
0
1
2
3
4
-10,000 $ -5,000 $ 0 $ 5,000 $ 10,000 $ 15,000 $

Evaluaciones Económicas – Dr. Andres Pichon-Riviere www.iecs.org.ar
Ejemplo: como pueden tomarse las decisiones
Problema: Alta mortalidad infantil Presupuesto: $3,000,000
¿Cómo utilizarlo de la mejor manera posible?

Evaluaciones Económicas – Dr. Andres Pichon-Riviere www.iecs.org.ar
Ejemplo: como pueden tomarse las decisiones
Problema: Alta mortalidad infantil Presupuesto: $3,000,000
1. Hacer lo primero que le viene a la cabeza y después ir viendo (total por ahora tiene plata) o Hacer lo mismo que se hizo siempre y si hay algo más de presupuesto…..hacer lo primero que le viene a la cabeza.
2. Analizar las alternativas….y elgegir según “…a mi me parece..”
IntervenciónAgua potable
Vacunación
Atención médica
Nutrición
Deportes
Vivienda
Hierro y vitaminas
Alta complejidad

Evaluaciones Económicas – Dr. Andres Pichon-Riviere www.iecs.org.ar
Ejemplo: como pueden tomarse las decisiones
Problema: Alta mortalidad infantil Presupuesto: $3,000,000
3. Analizar los Costos y las Consecuencias de cada estrategia
¿Cómo elegir?
Intervención Efecto CostoAgua potable 20 $ 520,000
Vacunación 10 $ 850,000
Atención médica 16 $ 2,600,000
Nutrición 15 $ 450,000
Deportes 0.5 $ 75,000
Vivienda 12 $ 1,100,000
Hierro y vitaminas 3 $ 200,000
Alta complejidad 1.5 $ 400,000

Evaluaciones Económicas – Dr. Andres Pichon-Riviere www.iecs.org.ar
Ejemplo: como pueden tomarse las decisiones
Problema: Alta mortalidad infantil Presupuesto: $3,000,000
3. Analizar los Costos y las Consecuencias de cada estrategia: elegir las más efectivas
¿Cómo elegir?
Intervención Efecto CostoAgua potable 20 $ 520,000
Vacunación 10 $ 850,000
Atención médica 16 $ 2,600,000
Nutrición 15 $ 450,000
Deportes 0.5 $ 75,000
Vivienda 12 $ 1,100,000
Hierro y vitaminas 3 $ 200,000
Alta complejidad 1.5 $ 400,000

Evaluaciones Económicas – Dr. Andres Pichon-Riviere www.iecs.org.ar
Intervención Efecto CostoAgua potable 20 $ 520,000
Atención médica 16 $ 2,600,000
Nutrición 15 $ 450,000
Vivienda 12 $ 1,100,000
Vacunación 10 $ 850,000
Hierro y vitaminas 3 $ 200,000
Alta complejidad 1.5 $ 400,000
Deportes 0.5 $ 75,000
Ejemplo: como pueden tomarse las decisiones
Problema: Alta mortalidad infantil Presupuesto: $3,000,000
3. Analizar los Costos y las Consecuencias de cada estrategia Elegimos las más efectivas
hasta que se nos acabe el dinero

Evaluaciones Económicas – Dr. Andres Pichon-Riviere www.iecs.org.ar
Ejemplo: como pueden tomarse las decisiones
Problema: Alta mortalidad infantil Presupuesto: $3,000,000
3. Analizar los Costos y las Consecuencias de cada estrategia Elegimos las más efectivas
hasta que se nos acabe el dinero
Logramos reducir en 36 puntos la mortalidad infantil a un costo anual de $3,120,000
Intervención Efecto CostoAgua potable 20 $ 520,000Atención médica 16 $ 2,600,000Nutrición 15 $ 450,000
Vivienda 12 $ 1,100,000
Vacunación 10 $ 850,000
Hierro y vitaminas 3 $ 200,000
Alta complejidad 1.5 $ 400,000
Deportes 0.5 $ 75,000

Evaluaciones Económicas – Dr. Andres Pichon-Riviere www.iecs.org.ar
Ejemplo: como pueden tomarse las decisiones
Problema: Alta mortalidad infantil Presupuesto: $3,000,000
4. Calcular la costo-efectividad de cada estrategia
Intervención Efecto Costo C/EAgua potable 20 $ 520,000
Vacunación 10 $ 850,000
Atención médica 16 $ 2,600,000
Nutrición 15 $ 450,000
Deportes 0.5 $ 75,000
Vivienda 12 $ 1,100,000
Hierro y vitaminas 3 $ 200,000
Alta complejidad 1.5 $ 400,000

Evaluaciones Económicas – Dr. Andres Pichon-Riviere www.iecs.org.ar
Intervención Efecto Costo C/EAgua potable 20 $ 520,000 $ 26,000
Vacunación 10 $ 850,000
Atención médica 16 $ 2,600,000
Nutrición 15 $ 450,000
Deportes 0.5 $ 75,000
Vivienda 12 $ 1,100,000
Hierro y vitaminas 3 $ 200,000
Alta complejidad 1.5 $ 400,000
Ejemplo: como pueden tomarse las decisiones
Problema: Alta mortalidad infantil Presupuesto: $3,000,000
4. Calcular la costo-efectividad de cada estrategia

Evaluaciones Económicas – Dr. Andres Pichon-Riviere www.iecs.org.ar
Intervención Efecto Costo C/EAgua potable 20 $ 520,000 $ 26,000
Vacunación 10 $ 850,000 $ 85,000
Atención médica 16 $ 2,600,000 $ 162,500
Nutrición 15 $ 450,000 $ 30,000
Deportes 0.5 $ 75,000 $ 150,000
Vivienda 12 $ 1,100,000 $ 91,667
Hierro y vitaminas 3 $ 200,000 $ 66,667
Alta complejidad 1.5 $ 400,000 $ 266,667
Ejemplo: como pueden tomarse las decisiones
Problema: Alta mortalidad infantil Presupuesto: $3,000,000
4. Calcular la costo-efectividad de cada estrategia

Evaluaciones Económicas – Dr. Andres Pichon-Riviere www.iecs.org.ar
Intervención Efecto Costo C/EAgua potable 20 $ 520,000 $ 26,000
Nutrición 15 $ 450,000 $ 30,000
Hierro y vitaminas 3 $ 200,000 $ 66,667
Vacunación 10 $ 850,000 $ 85,000
Vivienda 12 $ 1,100,000 $ 91,667
Deportes 0.5 $ 75,000 $ 150,000
Atención médica 16 $ 2,600,000 $ 162,500
Alta complejidad 1.5 $ 400,000 $ 266,667
Ejemplo: como pueden tomarse las decisiones
Problema: Alta mortalidad infantil Presupuesto: $3,000,000
4. Calcular la costo-efectividad de cada estrategia

Evaluaciones Económicas – Dr. Andres Pichon-Riviere www.iecs.org.ar
Ejemplo: como pueden tomarse las decisiones
Problema: Alta mortalidad infantil Presupuesto: $3,000,000
4. Hacer un análisis de costo-efectividad de las estrategias
Elegimos las más costo-efectivas hasta
que se nos acabe la plata
Logramos reducir en 60 puntos la mortalidad infantil a un costo anual de $3,120,000
Intervención Efecto Costo C/EAgua potable 20 $ 520,000 $ 26,000Nutrición 15 $ 450,000 $ 30,000Hierro y vitaminas 3 $ 200,000 $ 66,667Vacunación 10 $ 850,000 $ 85,000Vivienda 12 $ 1,100,000 $ 91,667Deportes 0.5 $ 75,000 $ 150,000
Atención médica 16 $ 2,600,000 $ 162,500
Alta complejidad 1.5 $ 400,000 $ 266,667

Evaluaciones Económicas – Dr. Andres Pichon-Riviere www.iecs.org.ar
Vale la pena pensar en costo-efectividad……….
Problema: Alta mortalidad infantil
Con las estrategias 1 y 2 quien sabe que habría pasado.
Beneficio: reducción en 36 puntosCosto: $3,120,000 ($86,666/punto)
Beneficio: reducción en 60 puntosCosto: $3,120,000 ($52,000/punto)
Intervención Efecto Costo C/EAgua potable 20 $ 520,000 $ 26,000Nutrición 15 $ 450,000 $ 30,000Hierro y vitaminas 3 $ 200,000 $ 66,667Vacunación 10 $ 850,000 $ 85,000Vivienda 12 $ 1,100,000 $ 91,667Deportes 0.5 $ 75,000 $ 150,000
Atención médica 16 $ 2,600,000 $ 162,500
Alta complejidad 1.5 $ 400,000 $ 266,667
Intervención Efecto CostoAgua potable 20 $ 520,000Atención médica 16 $ 2,600,000Nutrición 15 $ 450,000
Vivienda 12 $ 1,100,000
Vacunación 10 $ 850,000
Hierro y vitaminas 3 $ 200,000
Alta complejidad 1.5 $ 400,000
Deportes 0.5 $ 75,000