Embed Size (px)
Citation preview

University of Central Florida University of Central Florida
STARS STARS
Electronic Theses and Dissertations, 2004-2019
2006
Health Attitudes, Knowledge And Literacy Of Primary Caregivers Health Attitudes, Knowledge And Literacy Of Primary Caregivers
With Elementary School Children With Elementary School Children
Susan Stuib University of Central Florida
Part of the Curriculum and Instruction Commons
Find similar works at: https://stars.library.ucf.edu/etd
University of Central Florida Libraries http://library.ucf.edu
This Doctoral Dissertation (Open Access) is brought to you for free and open access by STARS. It has been accepted
for inclusion in Electronic Theses and Dissertations, 2004-2019 by an authorized administrator of STARS. For more
information, please contact [email protected].
STARS Citation STARS Citation Stuib, Susan, "Health Attitudes, Knowledge And Literacy Of Primary Caregivers With Elementary School Children" (2006). Electronic Theses and Dissertations, 2004-2019. 1082. https://stars.library.ucf.edu/etd/1082

HEALTH ATTITUDES, KNOWLEDGE AND LITERACY OF PRIMARY CAREGIVERS WITH ELEMENTARY SCHOOL CHILDREN
by
SUSAN STUIB B.S. University of Central Florida, 2000
M.S.N., University of Central Florida, 2001
A dissertation submitted in partial fulfillment of the requirements for the degree of Doctor of Education
in the Department of Educational Studies in the College of Education
at the University of Central Florida Orlando, Florida
Fall Term 2006
Major Professor: Stephen Sivo

© 2006 Susan Stuib
ii

ABSTRACT
Previous research has indicated that physical activity and healthy eating in elementary
school children are the exception rather than the norm. Increased attention to the rising rates of
childhood obesity, coupled with the recognition that changes in the school environment are
critical to reducing this trend, has intensified the need to adopt better practices in school
nutrition, physical activity and physical education.
Apart from being physically active, children need to learn fundamental motor skills and
develop health related physical fitness (cardiovascular endurance, muscular strength and
endurance, flexibility, and body composition). Primary caregivers play an important part in
developing and teaching children these things through example and through conversations with
their children.
The purpose of this study was to examine the level of knowledge primary caregivers have
about health and nutritional practices and whether primary caregivers’ health practices, health
knowledge or health literacy about nutrition and health affects their children’s well-being and
health practices. Based on the results from the questionnaire in this study targeted at primary
caregivers of elementary school-age children, primary caregivers’ health literacy, knowledge and
attitudes of health were directly linked with their children’s health and well-being and children’s
health practices.
iii

This dissertation is dedicated for those who have influenced my life in the quest for greater
understanding of the world’s mysteries, my mother, Meta, my brother, Jonathan, and my son
Jonathan. Thank you for your inspiration.
iv
ACKNOWLEDGMENTS
“Travel on, travel free, travel by that brand new road. Meet what life has to offer.”
I am grateful to all who have helped me along this path, encouraged me to trudge on, and
not despair. I would like to thank my dissertation committee for providing feedback, support and
motivation.
For his genuine enthusiasm and expertise, I wish to give my appreciation to Dr. Stephen
Sivo; my Committee Chair. In addition, I thank Dr. Jeffrey Kaplan, Dr. Montserrat Casado-
Kehoe and Dr. Kathy Cook for their helpfulness and kindness.
The winds that blow, for leaves to fall to Earth, the flowery vests, o’er spring time vales.
Life runs its course through sad and joyous tears. But still there comes a brighter day. For me
there is no sense of being away (Jonathan Stuart, 1978).
v
TABLE OF CONTENTS
LIST OF TABLES.........................................................................................................................ix LIST OF FIGURES ....................................................................................................................... x LIST OF ABBREVIATIONS........................................................................................................xi CHAPTER ONE: INTRODUCTION.............................................................................................1 Background and Conceptual Framework.............................................................................1 Significance of the Study .....................................................................................................3 Problem Statement ...............................................................................................................4 Definition of Terms..............................................................................................................5 Delimitations, Limitations and Assumptions.......................................................................8 Research Questions..............................................................................................................9 Organization of the Remaining Dissertation.........................................................................9 CHAPTER TWO: REVIEW OF LITERATURE.........................................................................11 Introduction........................................................................................................................11 Psychological, Emotional and Behavioral Health of Children ..........................................25 Eating Habits of Children ..................................................................................................28 Benefits of Physical Activity .............................................................................................28 Obesity and Overweight Children ......................................................................................31 Nutrition..............................................................................................................................37 Fast Food.............................................................................................................................41 Dental Health of Children……………………………………………...............................43
Mortality Rates of Children and Child Morbidity .............................................................45
vi

Household and Social Environment of Children ..................................................................47 School Environment .............................................................................................................48 Child Immunizations.............................................................................................................51 Summary of the Chapter .......................................................................................................54 CHAPTER THREE: METHODOLOGY .....................................................................................58 Study Population.................................................................................................................60 Measures .............................................................................................................................60 Procedure.............................................................................................................................61 Statistical Procedures ...........................................................................................................62 Summary of the Chapter ......................................................................................................63 CHAPTER FOUR: DATA ANALYSIS.......................................................................................64 Answer to Research Question 1 .........................................................................................64 Answer to Research Question 2...........................................................................................74 Answer to Research Question 3...........................................................................................75 Additional Findings .............................................................................................................77 Summary of the Chapter ......................................................................................................78 CHAPTER FIVE: CONCLUSION...............................................................................................82 Summary of the Study .........................................................................................................83 Summary of the Findings.....................................................................................................84 Implications and Recommendations ....................................................................................86 APPENDIX A: PROTOCOL........................................................................................................92 APPENDIX B: VERBAL CONSENT FORM .............................................................................94 APPENDIX C: COVER LETTER................................................................................................96
vii
APPENDIX D: SURVEY INSTRUMENT.................................................................................98 APPENDIX E: INSTITUTIONAL REVIEW BOARD APPROVAL ......................................106 APPENDIX F: FREQUENCY TABLES BASED ON RESPONSES ......................................113 APPENDIX G: CROSSTABULATIONS OF THREE SCHOOLS..........................................126 REFERENCES..........................................................................................................................144
viii
LIST OF TABLES Table 1: Blueprint ...................................................................……….......................61 Table 2: Logistic Regression for Research Question 2...........……….......................75 Table 3: Logistic Regression for Research Question 3...........……….......................76 Table 4: Logistic Regression for Additional Findings............……….......................78
ix
LIST OF FIGURES Figure 1: Parental Knowledge Across Three Studied Schools…………............. 65 Figure 2: Servings of Fruit and Vegetables PCs Thought Children
Should Have…………………………………………………. ………….............67
Figure 3: Number of Servings of Fruit and Vegetables Children ate…................67 Figure 4: Crosstabulation of Healthy Weight and Snacks per day……................69 Figure 5: Crosstabulation of Child Healthy Weight and Physical Activity...................................................................................................................71 Figure 6: Crosstabulation of Child Healthy Weight and PC Healthy Weight....................................................................................................................73
x

LIST OF ABBREVIATIONS
BMI Body Mass Index
CP Child Practice
CDC Center for Disease Control
CW Child Wellness
FDA Food and Drug Administration
HHS U.S. Department of Health and Human Ser vices
PC(s) Primary Caregiver(s)
PK Parent Knowledge
PP Parent Practice
SPSS Statistical Package for the Social Sciences
Kg Kilogram
USDA United States Department of Agriculture
xi

CHAPTER ONE INTRODUCTION
Background and Conceptual Framework
Based on recent multidisciplinary studies, children at an early age, as early as in
elementary school, are suffering from low physical fitness and poor health (Corbin, 1996). Low
activity levels and poor health habits have led to many serious general health risks to this
population. Many of these risks may be minimized with better educational systems and programs
targeted to the children and to their primary caregivers instructing them about the importance of
maintaining a healthier lifestyle and, thereby, preventing disease.
Physical activity has been defined as "bodily movement produced by skeletal muscles
that results in energy expenditure" (Pate & Pratt, 1995, p. 402). There is no question as to the
importance of physical exercise. Regular exercise has significant health benefits, and even slight
increments in energy output can enhance health drastically. Some of these effects include:
reduction in chronic diseases and conditions such as, hypertension, type 2 diabetes, high blood
lipids, cardiovascular disease, obesity, reduction in anxiety in the classroom, and, improvement
of body image and mood.
Another important point to note is that schools should ensure that meals offered
throughout the school meet federal nutrition standards and prohibit student access to vending
machines, and other sources where children might find foods of low nutritional value. Schools
should also provide children with sufficient daily physical education that will help them to
develop the knowledge, attitudes, skills, behaviors and confidence needed to be physically active
for life. Physical education in school is an ideal way to promote activity and fitness among

children, especially since it will be, at least for some, their only venue, where they will learn an
active lifestyle.
For this reason, the National Center for Chronic Disease Prevention and Health
Promotion, the National Association for Sport and Physical Education, and the American Heart
Association have all recommended comprehensive daily physical education for elementary
school children (Arbeit, 1992).
Pate & Pratt (1995) investigated the effects of a nutrition education program on dietary
behavior and nutrition knowledge among elementary school children participating in a Social
Cognitive Theory–based nutrition education program. Participants included 1100 second-grade
and third-grade students selected by convenience-type sampling from public schools. They
assessed dietary behavior and nutrition knowledge. Children that were placed in the treatment
group exhibited significant improvement in overall dietary behavior and nutritional knowledge,
such as consumption of dairy products, fruits, and vegetables, than children in the control group.
They concluded that nutrition education programs that aim at teaching positive dietary practices
can improve dietary behavior and nutritional knowledge in children.
Increasing obesity has been alarming politicians, health experts and the public. Latest
estimates, made in the United States by the Centers for Disease Control and Prevention dealing
with National Health and Nutrition Examination Survey, indicate that 64% of adults are
overweight of which 31% are clinically obese (Gleason & Suitor, 2003). Although obesity has
increased across all educational levels, the highest increase has been among the lowest
educational levels (Gleason & Suitor, 2003).
The obesity of children is on the rise as well. 10-15% of children in the United States are
overweight, compared to 5-6% in 1976-80 (Freedman, Dietz, Srinivasan & Berenson, 1999).
2
Obesity is associated with higher mortality, increased risk of high blood pressure and cardiac
disease, even some forms of cancer (Freedman, Dietz, Srinivasan & Berenson, 1999). For
children, obesity and poor health are associated with problems in the short run and long run,
including childhood diabetes, increased blood pressure, cardiac problems and orthopedic
disorders among other things (Freedman, Dietz, Srinivasan & Berenson, 1999). Obesity has other
effects on children including developmental, social and psychological effects, like depression,
discrimination and low self-esteem (Freedman, Dietz, Srinivasan & Berenson, 1999).
Significance of Study
The purpose of this study was to examine what the level of knowledge primary caregivers
have about health and nutritional practices and whether primary caregivers’ health practices,
health knowledge or health literacy about nutrition and health affects their children’s well-being
and health practices. This study has derived useful data about primary caregivers’ health literacy,
attitudes and knowledge of their elementary school children’s health. It is now well documented
that children are experiencing a variety of health problems such as diabetes, obesity, etc.
(O’Hara, 1999).
After an extensive research of pertinent resources and literature and clinical evaluations
and investigation, it is apparent that there has not been a comprehensive study on the topic and
issues raised in this study. The significance of this study and the conclusions drawn from it will
help school administrators, health education teachers, primary caregivers and healthcare
professionals monitor the health of the population of elementary school children. Furthermore,
medical personnel in clinical settings can better understand the dichotomy between what the
3
primary caregivers think their children’s health is like and what the actual health of the children
is, so as to investigate and test children’s health independently without too much emphasis on the
primary caregivers’ perception.
Problem Statement
Modern society, including many primary caregivers, deemphasize the importance of well
balanced nutrition and physical activity. Many primary caregivers lack health knowledge and
health literacy, as well as, adequate attitudes toward their health and their children’s health.
Other primary caregivers have some knowledge, but have also many misconceptions or are not
ready to admit they do not know enough about health issues.
The problem studied in this dissertation was the knowledge, literacy and attitudes of
primary caregivers in regard to health and fitness. School administrators should adopt
appropriate measures in their schools to ensure physical activity and nutrition. Primary
caregivers have to learn what their children’s health is really like and not rely on their
perception. Medical professionals have to investigate and study children’s health and
deemphasize the primary caregivers’ perceptions in their clinical decisions and courses of action
and treatment.
4
Definition of Terms
For the purpose of this study, the following definitions and terms that are used in the field
of health education will be used:
Body Mass Index (BMI): BMI is a ratio of bodyweight and height. It is calculated as
weight in kilograms divided by height in meters squared. Overweight for children and
adolescents is defined as BMI at or above the sex-and age-specific 95th percentile BMI cut
points from the revised CDC Growth Charts. Also referred to as height/weight ratio:
Chronic Condition: A chronic condition is any condition that lasts 3 months or more. .
Death Rate: A death rate is a certain number derived from the number of deaths in a
population in a year by the population. Also referred to as mortality rate.
Demographic Information: the characteristics of a person, such as age, sex, race, and
occupation.
Dental Caries (dental decay or cavities): An infectious disease that results in
demineralization and ultimately cavitation of the tooth surface if not controlled or remineralized.
Dental cavities may be either treated (filled) or untreated (unfilled).
Dependent variable in the study (effect) is the child well-being.
Fitness: The Good health or physical condition, especially, as the result of exercise and
proper nutrition.
Epidemic: The occurrence of more cases of disease than expected in a given area or
among a specific group of people over a particular period of time.
Epidemiology: Study of the recurrence and types of diseases and injuries, and their
factors, distribution and causes in certain populations.
5
Health Insurance: Includes managed care such as health maintenance organizations
(HMOs), public forms of health insurance such as Medicare, Medicaid, public assistance, a state-
sponsored health plan, other government-sponsored programs, or a military health plan.
Health Maintenance Organization (HMO): An HMO is a prepaid health plan which
delivers comprehensive care to policyholders through designated providers, in consideration of a
fixed monthly payment for health care services.
Health: A state of complete physical, mental, and social well-being and not merely the
absence of disease or infirmity. Also referred to as the general condition of body and mind of the
individual.
Healthy Smart Choice school lunches: School lunches with low fat and low carbohydrate
content.
Independent variables in the study: (cause) are Primary Caregiver Health Knowledge,
Primary Caregiver Reported Personal Health Practice and Primary Caregiver Reported Child
Health Practice.
Life Expectancy: Life expectancy is the average number of years of life remaining to a
person at a particular age and is based on a given set of age-specific death rates, generally, the
mortality conditions existing in the period mentioned. Life expectancy may be determined by
race, sex, or other characteristics using age-specific death rates for the population with that
characteristic.
Logistic regression: A form of regression analysis that is narrowly defined to a situation
in which the dependent variable is binary.
6
Measurements used and conversions, Volume: 1 gallon (3.786 liters; 3,786 ml) 4 quarts,
1 quart (0.946 liter; 946 ml) 4 cups or 2 pints, 1 cup (237 ml) 8 fluid ounces. Weight 1 pound
(16 ounces) 453.6 grams, 1 ounce 28.35 grams.
Morbidity: Any subjective or objective departure from a state of physiological or
psychological well-being.
Overweight: Overweight for children and adolescents is defined as body mass index (as
defined above) at or above the sex-and age-specific 95th percentile of body mass index cut
points from the revised Center for Disease Control Growth Charts.
Obesity: To health professionals and researchers, it signifies a BMI equal to or greater
than 30.0kg/meter square.
Physical activity: is defined as any bodily movement produced by skeletal muscles
resulting in energy expenditure.
Pollutant: A pollutant is any substance that contaminates the atmosphere, water supply,
or is generally harmful to an individual’s health.
Population: The total number of inhabitants of a given specific area. In sampling,
population may refer to the sample from which the test subjects are drawn, not the total
population of people.
Poverty Level: Poverty level is based on statistics developed by the Social Security
Administration and the Department of Labor. These include a set of income thresholds adjusted
by family size and composition. Families or individuals with income that is below their
appropriate levels are classified as below the poverty level. These thresholds are updated
annually by the U.S. Census Bureau.
7
Prevalence: Prevalence is the number of cases of a disease, infected persons, or persons
with some other attribute present during a particular interval of time. It is often expressed as a
rate (for example, the prevalence of diabetes per 1,000 persons during a year).
Primary Caregiver(s): Individual(s) responsible for the overall well-being of the child.
Rate: A rate is a measure of some event, disease, or condition in relation to a unit of
population, along with some specification of time.
Regression: The relationship between the mean value of a random variable and the
corresponding values of one or more independent variables.
Risk Factor: An aspect of personal behavior or lifestyle, an environmental exposure, or
an inborn or inherited characteristic that is associated with an increased occurrence of disease or
other health-related event or condition.
Serving: Approximately 4 ounces of the particular food or fluid. A standardized amount
of a food, such as a cup or an ounce, used in providing dietary guidance or in making
comparisons.
Well-being: The degree of healthiness of an individual. In this study a healthy
height/weight ratio was viewed as the deciding factor to determine the degree of healthiness.
Delimitations, Limitations and Assumptions
This study will be limited to the information obtained from questionnaires given to the
primary caregivers of three Elementary Schools in Orange County, Florida. Results of this study
are limited to the accuracy and truthfulness of the responses obtained on the questionnaires.
Sample size is also a limitation to this study.
8

Research Questions
1. What trends in the primary caregivers’ responses may be identified by the descriptive
statistics?
2. To what degree do primary caregivers’ health knowledge, primary caregivers’ health
practices and child’s health practices affect the child’s weight status (well-being) as
reported by the primary caregivers?
3. To what degree do primary caregivers’ health knowledge, primary caregivers’ health
practices and child’s health practices affect the child’s number of sick days taken from
school as reported by the primary caregivers?
Organization of the Remaining Dissertation
The remaining chapters were organized as follows:
Chapter Two consists of a review of the literature in the areas of nutrition, physical
education, health, psychology, statistical data, primary caregiver education and child education
dealing with health and nutrition. This chapter concludes with a section that briefly summarizes
the chapter.
Chapter Three explains the methodology of this research. This chapter focuses on the
methods used for the questionnaire used in this dissertation, the population, the instrumentation,
procedures and measures. This chapter also concludes with a brief summary of the chapter.
9

Chapter Four presents the data analysis and results obtained in the study. This chapter
includes relevant statistics derived from diverse statistical tests and procedures. This chapter also
concludes with a brief summary of the chapter.
Chapter Five contains the conclusions, recommendations and implications of the study.
This chapter also contains recommendations for future research and investigation. Lastly, this
chapter also concludes with a brief summary of the chapter. The following chapter will explore
the review of literature performed in this study.
10

CHAPTER TWO REVIEW OF LITERATURE
Introduction
A significant portion of the U.S. population has serious problems with both literacy and
understanding of how to effectively use and understand health-related information. This lack of
literacy in adults, not only affects their own health, but, that of their children, as well. An
understanding of the breadth and significance of this problem and its impact on health outcomes
are now clear based on scientific and medical research. Interventions and strategies for
effectively working with patients with limited literacy must be developed and evaluated. An
agenda for medical and public health workers, health educators, and researchers is suggested.
Illiteracy has become a wide spread problem. The National Adult Literacy Survey
(NALS) found that 75% of respondents with a chronic disease, also, had limited literacy skills.
People with limited literacy skills have problems accessing services and have worse health
outcomes than patients with full literacy (Thompson, Midthune, Subar, McNeel, Berrigan &
Kipnis, 2000). The U.S. healthcare system should attempt to better educate the public.
Individuals should be able to access information, get health services, communicate with
healthcare professionals about their illness, understand treatment options, and follow through on
treatment plans.
Patients, who have low literacy, do not speak English, or have limited English fluency,
are at a disadvantage and are consequently severely challenged, when they access health services
for themselves and their families. According to Parker (2000), a public health approach to health
literacy involves four steps. First, there must be an evaluation, in other words, what the problem
11
is. Second, risk factors should be identified, in other words, what the cause is. Third, there should
be an intervention evaluation, or identify what works. Lastly, implement what has been learned
from the process.
According to Parker (2000), poor health literacy exists because of lack of education and
high reading level expectations in the medical setting. In order to elevate literacy levels, there
must be effective and accessible teaching. Effective teaching requires communication skills that
enable the clear transmission of information from teacher to student and the breakdown of
complex ideas into understandable segments. Teaching children involves the additional
challenge of conveying messages in age-appropriate terms.
The importance of activities that promote healthy lifestyle among children is irrefutable.
The importance of this has been studied in several articles (Kolbe, Collins, & Cortese, 1997).
According to these articles, health promotion and disease prevention activities in the area of
nutrition education are important to begin early in childhood because of the well-established
relationships between diet and health. Inadequate nutritional intake and poor dietary habits in
childhood are directly related to children’s health status and ability to learn. For children to
develop lifelong, healthy nutritional habits, prevention activities should begin early, should
involve active, participatory learning that capitalizes upon social learning principles, and should
be novel. Additionally, a prevention message to be effective should be both culturally relevant,
culturally sensitive and developmentally appropriate (Lytle, 1997).
The school environment is considered an optimal place for health promotion and disease
prevention activities. Clinical settings are also excellent to target those children at risk. Large
numbers of children can be targeted in elementary school setting. School personnel can be
instrumental in the promotion of health.
12
According to a study performed by Jarvis (2005), data collected during this study
suggested that while most primary caregivers were confident that their children were
knowledgeable about healthy eating, exercise, etc., they felt they knew less about, arguably, the
more contentious issues of alcohol and drug misuse, and dealing with risks. For example, over
65% of primary caregivers reported that they thought their children knew a lot about exercise
and keeping healthy compared to less than 20% of primary caregivers, who thought their
children knew a lot about alcohol and drug misuse. A more surprising result was that only 10%
of primary caregivers reported that their children were well informed in first aid. Based on these
results, Jarvis (2005) came to a conclusion that some primary caregivers believe their children
know a lot about a particular health issue, but that the majority of primary caregivers only
sometimes talk with their children about this issue. Jarvis (2005) stated that since there was a
discrepancy of knowledge, it implied that children were learning about health issues from other
sources, such as their teachers or the media, not necessarily from their parents. Jarvis (2005) also
stated that children’s main source of information about health issues are peers, health
professionals, teachers and primary caregivers.
Nevertheless, the children in the study of Jarvis (2005) were more eager to report that
their primary caregivers had talked to them about health issues, rather than teachers or health
professionals. Furthermore, the majority of children in the study, which amounted to eighty
percent, reported that they preferred to discuss health problems with primary caregivers.
In Jarvis (2005) when primary caregivers were asked, who had the responsibility of
teaching children, some primary caregivers felt that they shared responsibility with teachers and
health professionals. However, the majority of primary caregivers, sixty one percent, indicated
13

that they themselves should be the main source of information for their children, regarding health
issues.
According to Reed & Jernstedt (2000), some primary caregivers feel uncomfortable about
discussing health issues with their children and lack knowledge about these issues or may lack
confidence to have these discussions with their children or feel their children do not need to have
this information, or for some it may never occur to primary caregivers to talk to their children
about any health issues whatsoever. Some primary caregivers look to the schools to teach
children about the importance of health.
Undernutrition in childhood has been estimated to cause half of all preventable deaths in
infants worldwide (Thompson, Midthune, Subar, McNeel, Berrigan & Kipnis, 2000). Large-
scale educational interventions have also been effective in changing the way caregivers give
food, increasing dietary intake, and in improving child growth, although results have usually
been based on preintervention versus postintervention assessments or on comparisons with
children, not included in the education program (Reed, 2000).
Another study by Derri (2004) investigated the effect of an eight-week health-related
fitness and nutrition education program on fitness components and dietary habits in upper
elementary school children. Forty children from the fifth and sixth grade, ages 10 to 12,
participated in the study. The experimental group consisted of 20 children, who participated in
the program three days per week for one hour outside the time allotted for school physical
education. The control group participated in the typical school physical education program.
Health-related fitness components (cardiorespiratory endurance, abdominal strength and
endurance, flexibility, and body composition) were examined (Kolbe, 1997). Certain health-
14

related fitness components and dietary habits, as well, can be improved with a three hour a week
program, consisting of physical fitness and nutrition education activities.
Fitness has become synonymous with cardiorespiratory fitness, especially in the context
of health. However, other fitness components, such as muscle strength and endurance,
flexibility, and body composition may be related to health, particularly in pediatric populations,
but, are often ignored (Pate, 1995). Therefore, a broader definition of fitness needs to be adopted,
in which, all the above components considered to reduce risk factors for chronic diseases and
contribute to the retention of fitness and health in every day life, are included.
Caring for children’s health carries some important benefits including: an increase in the
children’s physical ability and increase in their willingness to become more physically active.
Children may be able to self-regulate their physical activity levels. The development of positive
attitudes toward physical activity and fitness during childhood may affect the level of fitness
during adulthood (Sallis, 1997). Substantial evidence also indicates that unfit and overweight
children exhibit early signs of coronary artery disease, high blood pressure, and high cholesterol
(Sallis, 1997).
Pate (1995) stressed that school physical education has the primary role in promoting
physical activity in youth. The goal of physical education programs is also to provide students
the opportunity to be active. Pate (1995) also pointed out that recess is very important, since
recess encourages children to be physically active.
Werner and Durham (1988) conducted a study to identify the effect of a 9-week
supplemental physical education program, based on health-related fitness factors on fourth, fifth
and sixth grade children. The experimental group received extra physical education three days
per week for twenty minutes each day. Information about nutrition was also given. The results of
15

this study showed a treatment effect in favor of the experimental group in all four health-related
fitness components studied. More specifically, the fourth grade experimental group had
significantly better scores for the mile run at the end of the 9-week period than the other groups.
Fourth and fifth grade experimental groups had also significant gains in sit-up scores, while other
groups showed no significant gain. Concerning the sit and reach test, the experimental group had
a positive gain score, while the control group had a negative gain score. Moreover, the
experimental group reduced its skinfold measurements, while the control group actually showed
larger scores.
Sallis (1997) conducted a two-year supervised program, which was implemented with
elementary school children to show the effects of physical education programs in
cardiorespiratory endurance, abdominal strength and endurance of children. In these studies,
nutrition education was not included in the health-related fitness programs. However, on the
contrary, in the current study by Sallis (1997), found that children received nutrition education
during the implementation of the health-related fitness program and this might have contributed
to the earlier improvement of the two fitness components mentioned above.
At the end of this study by Sallis (1997), children significantly improved their dietary
habits. The improvement of these habits was shown by the children’s reports on their food
preferences. In the study of Pate (1995), children, who participated in nutrition education classes
improved their knowledge and their attitudes toward nutrition, but not their dietary habits.
It seems that providing information about nutrition through physical activities is more
effective than providing it in the absence of physical activity. Children learn differently from
adults. Providing knowledge about nutrition through game-type activities is also recommended
in the model of nutrition education of Mass (1997).
16

According to Pate (1995) the education of primary caregivers on healthy foods might be
necessary for the enhancement of the effectiveness of a health- related fitness program and the
improvement of fitness and health. He suggests that such programs could be successfully
incorporated in the physical education curriculum, in order to achieve goals oriented to health
improvement. Schools, according to Pate (1995), have a role in guiding children to participate in
aerobic activities, such as walking and housework, in order to improve health and to develop
positive attitudes for physical exercise for a lifetime. Apart from improving health, a health-
related fitness program could promote participation in physical exercise during adulthood
(Corbin, 1996).
Though cognitive development is a major internal factor of health awareness in primary
school children, the prime external influence may be the dominant primary caregiver. Primary
caregivers serve as health role-models for their children (Pate, 1995).
During adolescence, primary caregiver power over food choices may be displaced by the effects
of advertising and peer pressure, but, younger children copy their primary caregivers’ attitudes
and habits. Qualitative studies have been used in order to investigate health and nutrition of
children (Dietz, 1997). Dietz (1997) studied the aspects of primary caregiver control over food
choices and food rules that interact with food provision; how diet and diseases are connected,
specifically, dental health and obesity; and the categorization of food into groups and the
schemes children use to do this.
In this article, Dietz (1997) discusses wellness for children from a developmental
perspective and presents the results of the effects of wellness promotion guidance activities
among fifth-grade children. According to the article, children need to learn ways of promoting
17
wellness at an early age. Wellness promotion can assist children in their academic, social,
emotional, and physical development (Corbin, 1996).
According to Dietz (1997), there are many definitions of wellness. He describes wellness,
as an attitude about one's own process of self-care, involving understanding of basic emotional
and physical needs and the kind of habits and life-style necessary to meet those needs. From this
perspective, the primary purpose of promoting wellness is to reach high levels of physical,
psychological, and emotional fitness and to increase resistance to both minor illness and life-
threatening disease. Wellness typically includes the provision of nutritional information, services
designed to improve value clarification and self-understanding, stress management, physical
fitness, and self-care. Because both healthy and unhealthy habits are frequently established early
in life and are often difficult to break, it makes invaluable sense to teach youngsters how to live
healthy lives, as a part of their elementary school experiences. To further underscore the
rationale for this sort of recommendation, it is noted that many adults are not good role models,
when it comes to demonstrating a healthy, well-balanced life-style.
According to Pate (1995), primary caregivers, teachers, administrators, and counselors
are all responsible for promoting children’s wellness. Building on this latter point, it is
suggested, that using classroom guidance activities, is a particularly effective format for
promoting children’s wellness and personal development.
During the elementary school years, a child's wellness and personal development are
manifested in a number of similar and complementary ways. At this stage of the life span,
healthy children are characterized by the emergence of a variety of interdependent physical,
cognitive, and psychological competencies. For instance, middle childhood is highlighted by a
noticeable increase in a child's physical strength, coordination, agility, and flexibility in
18
comparison to early childhood. During middle childhood, youngsters are, indeed, busy building
a host of physical, psychological, and cognitive competencies that have a significant impact on
their later development in adolescence and adulthood.
As pointed out by Dewey (1938) in “Experience and Education,” facilitating healthy
child development requires more than attending to children’s academic potential. It necessitates
that children be given the opportunity to develop a broader wellness mindset that will influence
both their present and future ways of thinking and acting. In short, children need schools that will
help prepare them to deal with a complex society that is rapidly changing. Schools should also
teach about life itself and not just be a place of acquiring skills such as reading and writing
necessary to make a living.
During the elementary school years, children demonstrate a growth in intellectual
abilities in what Piaget (1958) called a transition from preoperational thinking to concrete
operational thinking. As a result of this developmental change, school-age children begin to
demonstrate an increased understanding of themselves and the consequences of their behaviors
and the environment that surrounds them. During these years Piaget also pointed out that
children manifest improvement in memory, concentration, verbal expression, and problem-
solving abilities.
According to Reed (2000), the increasing incidence of overweight and obesity and the
emergence of type II diabetes as a childhood condition, mean that children represent an
important target for health promotion. Primary caregivers represent a potentially powerful
intermediary in behavior change strategies, aimed at improving the lifestyle behaviors of their
young children. However, to fulfill this role, primary caregivers need to have the necessary
knowledge and motivation to change their habits and adopt better practices.
19

Reed (2000) aimed to assess the psychosocial factors mentioned above, it studied
parental receptiveness to nutrition education, barriers that might exist to primary caregivers and
the primary caregivers’ perceived benefits to change and to adopt a healthy diet and adequate
exercise for themselves and their children. This study used a qualitative methodology, and 41
primary caregivers took part in seven focus groups separated by socio-economic status. What
was observed was that across all groups there appeared to be a combination of reported external
barriers and unconscious internal barriers, stemming from high optimistic bias, low perceived
control and unrealistic health expectations. Reed concluded that defining appropriate behavior
and empowering primary caregivers to tackle children’s health issues should be targeted in future
education programs.
In Reed (2000) primary caregivers indicated that they were aware of their potentially
powerful education impact upon their children’s developing food behaviors and attitudes and
health practices. Primary caregivers understood that their children’s health was impacted by their
behaviors and the models they gave to their children. Primary caregivers also reported that
willingness to adopt health recommendations for themselves and their children would affect their
health. However, they also reported that their desire to comply with external guidance about food
choices or health practices were influenced by internal and external factors, some of which were
not in their control, such as socio-economic status of the family, food availability and so on.
Reed (2000) reported that socio-economic status differences in access to affordable healthy food,
nutrition knowledge and uptake of health services are well-documented, resulting in the current
social inequalities in health.
Reed (2000) suggested that a way to counter inequalities in health was to investigate
parental feeding practices, nutrition awareness and perceived barriers to behavior change, and
20
pinpointing overall health disparities in the population, in order to develop tailored health
promotion programs, which can stabilize existing levels of motivation and understanding and
support behavior change.
Reed (2000) also found that primary caregivers appeared to have some difficulty in
expressing what they would need to adopt better health behaviors. Among primary caregivers, it
was found that there was a reliance on short-term health issues such as healthy hair, skin and
teeth, not on long-term issues such as diabetes, cholesterol, cardiac problems and such. There
appeared to be as well some misinformation about health benefits of certain health practices such
as exercise. Based on the results, Reed (2000) found that primary caregivers answered that the
physical health benefits of exercise for children were largely deemed less important than the
psychological benefits, in terms of improving social skills and providing a break from the mental
exertion of academic work, which, of course, is only partially accurate, since the overall physical
benefits outweigh, social benefits.
In Reed (2000) primary caregivers unanimously accepted responsibility for providing a
healthy diet for their children, but, responsibility for exercise was less decisively accepted. The
school also occupied an equivocal position, with those primary caregivers from lower economic
status areas less likely to attribute responsibility to the school than their high economic status
counterparts, despite viewing its influence more positively: Primary caregivers from different
socio-economic classes seemed in general to answer differently to some questions.
Reed (2000) is not the only one that has viewed these discrepancies. It is important to
note at this time that Pate (1995) also saw these discrepancies in some of his results. Pate found
that higher socio-economic status primary caregivers were more likely to report enforcing food
rules in the home, with soda and chips or other “junk” food being restricted and fruit or
21
vegetables frequently served instead. In contrast, primary caregivers from the low economic
status groups, appeared more concerned with protecting the social aspects of mealtimes and
ensuring an adequate quantity of food was consumed, rather than with enforcing specific
restrictions or prescriptions. These findings are significant and curious since it seemed that
higher socio-economic classes were more likely to be concerned as to the quality of food and its’
nutritional value rather than the quantity. On the other hand, lower socio-economic classes were
concerned with quantity not quality. In other words, lower socio-economic classes seemed to be
more likely to consume more food than their higher socio-economic counterparts. As it will be
seen later on, there is a higher number of low socio-economic individuals and children that are
overweight and obese which is consistent with the results obtained by Pate (1995), regarding
quality and quantity of food being consumed by low and high socio-economic classes.
Reed (2000) concludes that primary caregivers occupy a key position in their children’s
food and health behaviors and attitudes. Reed suggested that primary caregivers have a short-
term health focus, similar to that previously described for children, with little concern regarding
the potential long-term consequences of their actions.
Reed (2000) also suggested that exercise is not only afforded lower priority within family
lifestyle decisions, but, is also perceived to be subject to greater external inhibitory factors and a
lower requirement for parental involvement. By absolving themselves of personal responsibility
in this way, because of low perceived control and significant optimistic bias in favor of their
current behavior, primary caregivers are constructing a major barrier to the impact of
intervention campaigns.
Primary caregivers, according to Reed (2000), need to be encouraged to assert their own
control alongside these concurrent environmental influences, rather than assuming an ‘all or
22

nothing’ approach, whereby anything less than complete control is deemed inadequate. It also
appeared important to Reed to raise awareness, amongst primary caregivers, of the power of their
unconscious actions, i.e., the behavior they model and the attitudes they express, in order to
promote an effective, whole-family approach to behavior modifications.
Reed (2000) suggests that key parent-targeted strategies should include: awareness
raising interventions to promote an internal focus for health behaviors and encourage family
responsibility for diet and exercise; a move away from specific food rules towards more generic,
whole-diet, whole-family advice, concerning positive feeding behavior and positive food
environments; promotion of dietary variety to tackle the myth of healthy eating as restrictive,
expensive and unattainable and finally, promoting everyday activity, as a vital, yet achievable,
component of a healthy lifestyle.
Piaget (1958) noted that many factors contribute to a child's good health and
development. Genetics and environment are both factors in healthy development of children.
Humans are physical, social and emotional beings, therefore, these factors ultimately affect their
development. For example, economic status of a child, leads to poor nutrition, inadequate
housing, exposure to environmental hazards and other health and developmental problems.
Piaget (1958) also points out that active participation of primary caregivers and other
adults such as teachers, relatives, religious leaders and neighbors are also crucial in a child’s
development and realization of their potential. It is not surprising that primary caregivers that
engage in destructive behavior either directly or indirectly ruin the lives of their children. Child
abuse, domestic violence, alcoholism, and smoking destroy the safe-haven of the family home
and, ultimately, everyone that lives in such environments.
23

The elementary school age child makes a big transition from living at home and being
primarily only with family to school and interacting with others and learning and being
influenced by others other than family members. After learning from primary caregivers basic
social habits and physical practices, the school environment comes into children’s lives and
expects them to use symbols and letters, to be one of a group, to be judged in comparison to the
work of others and to learn in a group setting (Piaget, 1958).
Piaget (1958) stated that a family's health habits and socioeconomic conditions become
apparent and visible when children enter elementary school. For example, some children come to
school hungry, with inadequate clothing, without a bath and without the necessary basic care
needs being provided. On the other hand, some come into elementary school knowing how to
read already proficiently, while others do not, some may have dental caries and some will not,
some will have behavioral and emotional health problems. From the very beginning, elementary
school children that are in at-risk families come with certain health problems either
psychological or physical or social that preclude them from achieving their potential and school
success. Nevertheless, not all these problems are apparent and will be identified at a later time,
when the harm is more difficult to abate.
Reed (2000) reported that elementary school children had the lowest mortality rates of all
age groups in 2000 and there was a significant drop in the number of children hospitalized. Falls
were the primary cause for injury hospitalization. While elementary age children were less likely
to die from child abuse than younger children, they were more likely to sustain moderate
physical injury when abused. Traffic related motor vehicle crashes were the major cause of
death and an important reason for hospitalization. The second leading cause of death was cancer.
24
From a public health perspective, the elementary school years offer a wonderful
opportunity to provide primary and specialized health care services (Telfar, & Kotch, 1997)..
Children with health care problems can receive school health screenings and, once identified,
appropriate school health services and referrals can be initiated. The basics of personal health
care and the promotion of healthy lifestyles and behaviors can be taught through health education
curriculum in the schools.
Psychological, Emotional and Behavioral Health of Children
Children’s psychological, emotional and behavioral health are linked to physiological,
social and higher needs. Maslow’s theory of Human Motivation clearly explains how a person
needs certain things before achieving self-actualization, in other words, “being” all that we can
be (Maslow, 1943). Maslow's Hierarchy of Needs is a theory in psychology, which contends that
as humans meet basic needs, they seek to satisfy successively higher needs that occupy a set
hierarchy (Maslow, 1943). Maslow's hierarchy of needs is often depicted as a pyramid consisting
of five levels: the four lower levels are grouped together as deficiency needs associated with
physiological needs, while the top level is termed growth needs, associated with psychological
needs (Maslow, 1943). While our deficiency needs must be met, our being needs are continually
shaping our behavior. The basic concept is that the higher needs in this hierarchy only come into
focus once all the needs that are lower down in the pyramid are mainly or entirely satisfied.
Growth forces create upward movement in the hierarchy, whereas regressive forces push
prepotent needs further down the hierarchy (Maslow, 1943).
25

The physiological needs of the organism, those enabling homeostasis, take first
precedence (Maslow, 1943). These include things such as proper food and water nourishment,
sleep, etc. When some of these needs are unmet, a human's physiological needs take the highest
priority. Maslow indicated that as a result of the prepotency of physiological needs, an individual
will deprioritize all other desires and capacities. Physiological needs can control thoughts and
behaviors, and can cause people to feel sickness, pain, and discomfort. Maslow also placed such
things as bodily comfort, activity, exercise in this category.
When the physiological needs are met, the need for safety will emerge. Safety and
security rank above all other desires. These include security of resources, physical security
(safety from violence, delinquency and aggressions), moral and physiological security, family
security and health security (Maslow, 1943).
After physiological and safety needs are fulfilled, the third layer of human needs is social.
This involves emotionally-based relationships in general, such as friendship and having a family.
Humans are social beings and as such, they want to be accepted and to have a sense of
belonging. In the absence of these elements, people become increasingly susceptible to
loneliness, social anxiety and depression (Maslow, 1943).
The next level of needs are esteem needs. Humans have a need to be respected, to self-
respect and to respect others. People need to engage themselves in order to gain recognition and
have an activity or activities that give the person a sense of contribution and self-value.
Imbalances at this level can result in low self-esteem, inferiority complexes or an inflated sense
of self-importance (Maslow, 1943).
Finally, being needs, self-actualization and transcendence are "being" or "growth needs,"
they are enduring motivations or drivers of behavior. Self-actualization is the instinctual need of
26
humans to make the most of their unique abilities and to strive to be the best they can be.
Maslow describes self-actualization as follows: “Self Actualization is the intrinsic growth of what
is already in the organism, or more accurately, of what the organism is.” (Maslow, 1943).
Maslow describes people that have attained self-actualization, as people who embrace facts and
realities of the world rather than denying or avoiding them, they are spontaneous and creative;
they are interested in solving problems (including those of others) and appreciate life, they judge
others without prejudice and they possess an internal independent system of morality.
Causes of mental health problems are both biological and environmental or can be a
mixture of both (Telfar & Kotch, 1997). Some events or a mixture of events that have been
found to lead to serious mental health problems according to Telfar and Kotch for children and
youth include: 1. Lead or mercury poisoning and environmental toxins. 2. Witnessing or being
the victim of violence, such as abuse or domestic violence. 3. Mental illness or depression in a
parent or guardian. 4. A natural trauma, such as hospitalization, death of a parent, divorce, or
discrimination. 5. Being relentlessly bullied or socially ostracized by peers or adults. 6. Poor
attachment and bonding between infants and their caregivers. 7. Child/caregiver difficulties with
behavior and development such as eating, toileting, sleeping are important issues for infants and
young children. 8. Factors related to being a child with a disability or special health care need.
Telfar and Kotch further indicated that mental health problems that are recognized early
can prevent the cycle of increasing risk factors that may cause serious disruption of a child's
healthy social and emotional development and ability to function For instance, they point out
that children with conduct/behavioral disorders such as Attention Deficit Hyperactivity Disorder
( ADHD) or severe trauma may display impulsive anti-social and disruptive behaviors that
significantly affect their learning and social interactions with families and peers. Identifying the
27
cause, treating behavior disorders and supporting caregivers early, regardless of original source
(nutritional, biological, social emotional or environmental), may prevent school failure, violence,
drug misuse and suicide (Telfar & Kotch, 1997). The CDC reported that about 5% of children
ages 4-12, were reported by a parent to have a severe emotional or behavioral problem in the
United States in 2004 (CDC, 2004).
Eating Habits of Children
Eating fruits and vegetables is important to provide growing bodies the vitamins,
minerals, and fiber needed for healthy growth and development. Adequate calcium consumption
is important for the prevention of osteoporosis later in life. Establishing healthy dietary patterns
in childhood is correlated with a healthier diet in adulthood and the prevention of chronic
disease, obesity, and poor birth outcomes. Results from the 2001 Youth Behavioral Risk Survey
showed that less than 25 percent of the Florida high school students surveyed had consumed five
or more vegetables and fruit per day and less than 20 percent of the boys and only 10 percent of
the girls consumed three or more glasses of milk per day (Florida Department of Health Family
Health Services School Health. 2005).
. Benefits of Physical Activity
Physical activity is critical to the overall health and well-being of children and youth.
The primary benefits include greater flexibility, balance, and the stimulation of developing
muscle and bones, muscle strength, endurance, maintenance of weight and prevention in the
28
severity and onset of obesity related illnesses such as type 2 diabetes, removal of toxins and
waste products, cardio-respiratory fitness, mental health through the reduction of anxiety, stress
and improvement in self esteem, social skills of team work and leadership, and development of
healthy behaviors that will sustain the quality and length of life through adulthood (Francis,
1996).
According to Francis (1996) caloric expenditure per hour assuming a 154 lb. individual in
common physical activities are as follows: Hiking (370 calories/hr.), Yard Work (330
calories/hr.), Dancing (330 calories/hr.), Bicycling less than 10 miles per hour (290 calories/hr.),
Walking at 3.5 miles/hour (280 calories/hr.), Light Weight Lifting (220 calories/hr.), Running at
5 miles/hours (590 calories/hr.), Swimming (510 calories/hr.), Aerobics (480 calories/hr.). As it
can be seen, aerobic exercise has a higher caloric expenditure per hour than other non-aerobic
exercises such as weightlifting.
In 2005, the CDC reported that 52% of children in the United States and in Florida did
not exercise regularly (CDC, 2005). The Youth Risk Behavior Surveillance System performed
by the United States Health Department shows us the percentages of children engaging in
physical exercise and TV watching. It can be noted that TV watching is higher among African-
American populations and Hispanic populations, than in the White population. In addition,
vigorous exercise, moderate exercise and no vigorous exercise rates are quite uniform, showing
little variation. In general, TV watching was high among all populations (CDC, 2005).
In order to be healthy, children must engage in regular physical activity and reduce
sedentary activities. By doing regular physical exercise, children’s health will be benefited
overall, their psychological well-being will be boosted and their body weight will be healthy. By
29

exercising, children will reduce the risk of chronic disease in adulthood (U.S. Department of
Health and Human Services, 2002).
The Department of Health recommends that children should engage in at least 30 minutes
of moderate-intensity physical activity, above usual activity, 4-5 days a week. It is obvious some
children may need to consult with a healthcare provider before participating in this level of
activity. Children should be able to achieve physical fitness by increasing their cardiovascular
conditioning, stretching exercises for flexibility, and resistance exercises or calisthenics for
muscle strength and endurance (U.S. Department of Health and Human Services, 2002)..
Primary caregivers play a big role in the amount of exercise children participate in.
Therefore, the U.S. Department of Health and Human Services (2002) suggests that primary
caregivers might consider using the following tactics to increase the total number of hours that
their children participate in physical activity. Primary caregivers should encourage participation
in sports (team sports are recommended). Primary caregivers should encourage walking instead
of driving whenever it is feasible. Families should take family walks after dinner, avoid taking
elevators or escalators. Primary caregivers should walk their children to school and when going
shopping, park farther from the store and walk there and walk at a fast pace inside the store.
Children should be allowed to participate in supervised and safe yard work and in household
chores. Finally, primary caregivers should reserve thirty minutes a day or more to play with their
children.
30

Obesity and Overweight Children
The main calculation to calculate obesity and overweight is the BMI formula. The
formula of BMI is calculated as follows (provided in kilograms and in meters, and pounds and
inches). The formula can be summarized as: BMI= (weight in kilograms)/ (height squared in
meters squared). If we are to calculate BMI in pounds and inches the formula can be summarized
as: BMI= (weight (in pounds) x 703)/ (height squared in inches squared) (Merck, 2004).
Body Mass Index (BMI) is a number calculated from a child’s weight and height. BMI is
a reliable indicator of body fatness for most children and teens (Merck, 2004). BMI does not
measure body fat directly, but research has shown that BMI correlates to direct measures of body
fat, such as underwater weighing and dual energy x-ray absorptiometry (Merck, 2004).. BMI can
be considered an alternative for direct measures of body fat (Merck, 2004). Additionally, BMI is
an inexpensive and easy-to-perform method of screening for weight categories that may lead to
health problems. For children and teens, BMI is age- and sex-specific and is often referred to as
BMI-for-age (Merck, 2004).
After BMI is calculated for children and teens, the BMI number is plotted on the CDC
BMI-for-age growth charts (for either girls or boys) to obtain a percentile ranking (Thompson,
Midthune, Subar, McNeel, Berrigan, & Kipnis, 2000). Percentiles are the most commonly used
indicator to assess the size and growth patterns of individual children in the United States. The
percentile indicates the relative position of the child’s BMI number among children of the same
sex and age (Thompson, Midthune, Subar, McNeel, Berrigan, & Kipnis, 2000). The growth
charts show the weight status categories used with children and teens (underweight, healthy
weight, at risk of overweight, and overweight). BMI-for-age weight status categories and the
31
corresponding percentiles are as follows: underweight is considered to be in the lower 5th
percentile; healthy weight is considered to be from the 5th up to the 85th percentile; at risk
overweight is considered to be at the 85th to less than 95th percentile; overweight is considered to
be at 95th percentile or more (CDC, 2002).
For children, BMI is used to screen for overweight, at risk of overweight, or underweight.
However, BMI is not a diagnostic tool. For example, a child may have a high BMI for age and
sex, but to determine if excess fat is a problem, a health care provider would need to perform
further assessments. These assessments might include skinfold thickness measurements,
evaluations of diet, physical activity, family history, and other appropriate health screenings
(CDC, 2002).
Must and Anderson (2003) show how to calculate and interpret BMI using the BMI
Percentile Calculator involves the following steps. First, one must obtain accurate height and
weight measurements. Second, one must calculate the BMI and percentile using the Child and
Teen BMI Calculator. The BMI number is calculated using standard formulas. Third, one must
review the calculated BMI-for-age percentile and results. The BMI-for-age percentile is used to
interpret the BMI number because BMI is both age-and sex-specific for children and teens.
These criteria are different from those used to interpret BMI for adults-which do not take into
account age or sex. Age and sex are considered for children and for teens, because the amount of
body fat changes with age. (BMI for children and teens is often referred to as BMI-for-age.) and
the amount of body fat differs between girls and boys. The CDC BMI-for-age growth charts for
girls and boys take into account these differences and allow translation of a BMI number into a
percentile for a child’s or teen’s sex and age. Lastly, find the weight status category for the
calculated BMI-for-age percentile as described above (Must & Anderson, 2003).
32

Healthy weight ranges cannot be provided for children and teens because healthy weight
ranges change with each month of age for each sex and healthy weight changes as height
increases. Children who are overweight may begin to experience health consequences during
their youth as well as putting themselves at risk for weight-related health problems later in life
(Dietz, 2002).
Overweight children and teens have been found to have risk factors for cardiovascular
disease, including high cholesterol, elevated insulin levels, and elevated blood pressure during
childhood (Merck, 2004). Must & Anderson (2003) showed that approximately 60% of
overweight children had a least one cardiovascular risk factor, such as high cholesterol or high
blood pressure; in comparison, only 10% of children with healthy weight had at least one risk
factor. They also pointed out that 25% of overweight children had two or more risk factors
including the following potential problems: Type 2 diabetes; sleep apnea (not breathing for at
least 10 seconds during sleep) and social consequences including poor self-esteem and social
discrimination.
In addition to the health problems they may experience during their youth, overweight
children and teens are at increased risk for various chronic diseases as adults (including
hypertension, type 2 diabetes, and coronary heart disease). Obesity also leads to emotional
problems caused by social pressure. Overweight adolescents are at greater risk of becoming
overweight or obese as adults, about one third of all severely obese adults were overweight
children (Deckelbaum & Williams, 2001).
Maintaining a healthy weight during childhood and adolescence may reduce the risk of
becoming overweight or obese as an adult. A lower weight also signifies a better self-image,
which leads to better health overall. Children and teens should be encouraged to keep up healthy
33
eating habits, participate in physical activity on most (preferably all) days of the week, and limit
television viewing (Deckelbaum & Williams, 2001).
The interpretation of BMI-for-age varies by age and sex so if the children are not exactly
the same age and of the same sex, the BMI numbers have different meanings (Deckelbaum &
Williams, 2001). Calculating BMI-for-age for children of different ages and sexes may yield the
same numeric result, but that number will fall at a different percentile for each child, this is due
to the normal BMI-related changes that take place as children age and grow, and the normal
BMI-related differences between sexes.
The Merck Manual (2004) shows an example of how some sample BMI numbers would
be interpreted for a 10-year-old boy: A 10 year old boy with a BMI of 23 would be in the
overweight category and would be in the 95th percentile or greater. If he would have a BMI of 21
he would be at risk of being overweight, which is between the 85th to 95th percentile. If he would
have a BMI of 18 he would be in a healthy weight and would be in the 5th to 85th percentile.
Finally, if he would have a BMI of 13 he would be underweight and below the 5th percentile
(Merck Manual, 2004).
The percentage of children ages 6-11, who are overweight, has increased exponentially.
As it can be seen from the statistics of the CDC (2004) there has been a tremendous increase in
overweight children, which is alarming and is reaching epidemic proportions.
It is curious to note that in Florida, there is a higher percentage of children that are
overweight than in the United States as a whole (CDC, 2004). The CDC reported that 40% of
Florida male children are overweight or obese, as compared to the United States rate of 35%, and
the female child overweight/obese rate is on target with the national rate. The CDC reported that
34

in total, children, both male and female are heavier in Florida than the average (based on the
national rate).
Deckelbaum and Williams reported that the prevalence of overweight among children
aged 6 to 11 more than doubled in the past 20 years, going from 7% in 1980 to 18.8% in 2004.
They stated that caloric imbalance was to blame. In other words they stated that too few calories
were being expended and too many calories were being consumed. However they pointed out
that genetics, quality of food, etc., had a lot to do with this dramatic rise. They also estimated
61% of overweight young people have at least one additional risk factor for heart disease, such
as high cholesterol or high blood pressure. In addition, children who are overweight are at
greater risk for bone and joint problems, sleep apnea, and social and psychological problems
such as stigmatization and poor self-esteem. Overweight young people are more likely than
children of normal weight to become overweight or obese adults, and therefore more at risk for
associated adult health problems, including heart disease, type 2 diabetes, stroke, several types of
cancer, and osteoarthritis (Deckelbaum & Williams, 2001). Healthy lifestyle habits, including
healthy eating and physical activity, can lower the risk of becoming overweight and developing
related diseases.
The risk of death rises with increasing weight. According to the CDC, even moderate
weight excess (10 to 20 pounds for a person of average height) increases the risk of death,
particularly among adults aged 30 to 64 years. Individuals who are obese (BMI > 30)* have a 50
to 100% increased risk of premature death from all causes, compared to individuals with a
healthy weight (CDC, 2004).
Deckelbaum and Williams stated that the incidence of heart disease (heart attack,
congestive heart failure, sudden cardiac death, angina or chest pain, and abnormal heart rhythm)
35
is increased in persons, who are overweight or obese (BMI > 25). High blood pressure is twice as
common in adults who are obese, than in those who are at a healthy weight. Obesity is associated
with elevated triglycerides (blood fat) and decreased HDL cholesterol ("good cholesterol")
(Deckelbaum & Williams, 2001).
Dietz pointed out that a weight gain of 11 to 18 pounds increases a person's risk of
developing type 2 diabetes to twice that of individuals, who have not gained weight He also
noted that over 80% of people with diabetes are overweight or obese. Dietz described the risks
involved of being overweight or obese, among these he included: some types of cancer including
endometrial (cancer of the lining of the uterus), colon, gall bladder, prostate, kidney, and
postmenopausal breast cancer, sleep apnea (interrupted breathing while sleeping), asthma,
arthritis, gall bladder disease, increased surgical risk, depression, incontinence, social
discrimination, academic discrimination, job discrimination, loss of muscle mass, loss of
mobility and physical endurance, and specifically for females it can cause complications in
pregnancy, including increased risk of death in both the baby and the mother and an increased
the risk of maternal high blood pressure by 10 times (Dietz, 1998).
Dietz also noted that overweight children may have any of the above risk factors in the
short- or long-run, but the most severe in children is high cholesterol and high blood pressure
since it can lead to cardiovascular issues and heart disease at an early age. Type 2 diabetes,
previously considered an adult disease, has increased dramatically in children and adolescents.
Overweight and obesity are closely linked to type 2 diabetes (Dietz, 1998).
Dietz explains that weight loss, as modest as 5 to 15% of total body weight in a person,
who is overweight or obese, reduces the risk factors for some diseases, particularly heart disease.
Weight loss can result in lower blood pressure, lower blood sugar, and improved cholesterol
36
levels. A person with a BMI above the healthy weight range may benefit from weight loss,
especially if he or she has other health risk factors, such as high blood pressure, high cholesterol,
smoking, diabetes, a sedentary lifestyle, and a personal and/or family history of heart disease
(Dietz, 1998).
Healthcare for children is different from adult health care chiefly because children are
growing and developing and they are reliant on families and caregivers for health care Charting a
child's height, weight and development over time is an important part of screening for potential
health problems. Children, on average, double their weight in one year, triple it by age 3 and by
age 15, they will be 13 times their birth weight (CDC, 2004).
Nutrition
Children should consume a variety of nutrient-dense foods and beverages within and
among the basic food groups while choosing foods that limit the intake of saturated and transfats,
cholesterol, added sugars and salt. The recommended pyramid by the FDA suggests that in a day
an individual should consume fats, oils and sweets sparingly, and consume two to three servings
of dairy products, five to seven ounces of meat, three to five vegetable servings, two to four
fruit servings and six to 11 servings of grain (FDA, 2006).
To maintain body weight in a healthy range, one must balance calories from foods and
beverages with calories expended. To prevent gradual weight gain over time, one must make
small decreases in food and beverage calories and increase physical activity (FDA, 2006).
Children should consume a sufficient amount of fruits and vegetables while staying
within energy needs. Two cups of fruit and 2½ cups of vegetables per day are recommended for
37

a reference 2,000-calorie intake, with higher or lower amounts depending on the calorie level
(FDA, 2006). A variety of fruits and vegetables should be chosen each day. In particular, all five
vegetable subgroups (dark green, orange, legumes, starchy vegetables, and other vegetables)
several times a week should be chosen (FDA, 2006).
Three or more ounce-equivalents of whole-grain products per day, with the rest of the
recommended grains coming from enriched or whole-grain products should be consumed. In
general, at least half the grains should come from whole grains. Three cups of fat-free or low-fat
milk or equivalent milk products should be consumed (Pate, 1995).
It is recommended that children consume plenty of liquids to avoid dehydration. Most of
the liquids consumed should be non-sugar based drinks, mainly water about 6 glasses a day and
milk about 3 glasses a day. Juices and sodas should be limited due to high contents of sugar and
other sweeteners (Pate, 1995).
As to fats, less than 20 percent of calories should come from fats and saturated fatty acids
and less than 300 mg/day of cholesterol is recommended by the American Medical Association.
Pate suggests that transfatty acid consumption should be kept as low as possible. He further
suggests that most fats should come from monounsaturated fatty acids and polyunsaturated acids
from fish, nuts, and vegetable oils, preferably olive or corn oil, which have been proven as the
best oil alternatives (olive oil, being the best and helping lower bad cholesterol). He further states
that when selecting and preparing meat, poultry, dry beans, and milk or milk products, choices
made should be lean or low-fat (Pate, 1995).
As to carbohydrates, fiber-rich fruits, vegetables, and whole grains should be chosen.
Foods and beverages should be consumed with low added sugars or caloric sweeteners, such as
amounts suggested by the USDA Food Guide (FDA, 2006).
38

As to sodium, one should consume less than 2,300 mg (approximately 1 teaspoon of salt)
of sodium per day. Foods should be prepared with little salt. At the same time, potassium-rich
foods, such as fruits and vegetables, should be consumed (FDA, 2006).
Moving into the topic of food safety, primary caregivers should avoid handling food with
unclean hands. Children should wash their hands also before eating or touching food. Primary
caregivers should also clean food contact surfaces, and thoroughly clean fruits and vegetables,
since most are sprayed with chemicals (FDA, 2006).
Meat and poultry should not be washed or rinsed. Separate raw, cooked, and ready-to-eat
foods, while shopping, preparing, or storing foods. Foods should be cooked to a safe temperature
to kill microorganisms. Perishable foods should be promptly refrigerated and foods should be
properly defrosted (FDA, 2006).
According to the CDC study in regards to the Healthy Eating Index rating performed
between 2002 and 2005, only 16 % of the U.S. population had a good diet, a 74% needed
improvement with their diet and 10% were classified as having a poor diet (CDC, 2002).
This same study performed by the Center for Disease Control also discovered that
individuals were not eating the recommended ranges or amounts of particular food groups. Mean
scores of the participants for food groups (grains, vegetables, fruits, milk, meat, etc.) reached the
recommended scale of 10. Fruits reached 3.8, vegetables reached 6.0, grains reached 6.7, milk
5.9, which indicates low consumption of beneficial foods On the other hand, the data indicated
that cholesterol and fat and sodium were consumed in greater quantities in the United States
(CDC, 2002).
A maximum score of 10 was assigned to each of the five food group components of the
Index, when a person’s diet met or exceeded the recommended number of servings for a food
39
group. For example, when a person’s diet met the serving recommendations of the fruits group,
that person’s diet was awarded 10 points. For each of the five major food groups, a score of zero
was assigned to the respective components, when a person did not consume any item from the
food group. Intermediate scores were computed proportionately to the number of servings or
partial servings consumed. For example, if the serving recommendation for a food group was
eight and a person consumed four servings, the component score was 5 points. Similarly, if six
servings were consumed, a score of 7.5 was assigned (CDC, 2002).
Another important issue to discuss is the caloric intake which particular age groups need.
Female and male children also have different caloric requirements. In addition, sedentary
children need fewer calories than their more active peers. The CDC reported caloric
requirements, divided by age and gender and quantity of physical activity needed. As it can be
seen children ages 4-8 need a caloric intake of 1,200-1,800, 1,200 being for a sedentary child and
1,800 being for a physically active child. Children ages 9-13 need a caloric intake of 1,600-
2,200, 1,600 for sedentary children and 2,200 for physically active children (CDC, 2002).
These are some recommendations that have been published by the FDA (2006) that
primary caregivers and children should follow to have better eating practices. First, children
should drink water before a meal. Second, if fruit is not being chosen as dessert, only allow half
a portion. Third, children should eat off smaller plates. Fourth, families should not eat late at
night, since eating at night distorts and affects glucemic indexes and does not allow the
metabolism to burn calories as fast. Fifth, skip buffets. Sixth, meals should be grilled, steamed,
or baked, limiting the use of frying. Seventh, primary caregivers should eat before going grocery
shopping and make a shopping list and choose a checkout line without a candy display, to avoid
children wanting sweets. Eighth, children should drink water or low-fat milk over soda and other
40

sugary drinks. Ninth, primary caregivers should have a regular eating schedule for the children.
Tenth, children should not skip breakfast. Eleventh, primary caregivers should encourage
children to stop eating, when they see they are full and give children fruits and vegetables as
snacks. Twelfth, children should have several servings of wholegrain foods daily. Finally
primary caregivers should encourage children to eat meals sitting down and eat them slowly and
have children participate in low-fat school lunches or prepare healthy meals for them to take to
school (FDA, 2006).
Fast Food
It is important to discuss the impact of fast food in children, since fast food is one of the
primary sources of meals for American children. Fanning, Marsh, & Stiegert (2003) conducted a
study to determine the nutritional dietary quality and caloric intake among children in the United
States. Fanning, Marsh and Stiegert examined dietary intake data from six thousand children,
ages four to twelve. Based on this study, U.S. children, who ate fast food, compared with those
who did not, consumed more total calories, more calories per gram of food, more total and
saturated fat, more total carbohydrate, more added sugars and more sugar-sweetened beverages,
but less milk, fiber, fruit and non-starchy vegetables.
According to FDA (2006) estimates, childhood consumption of fast foods increased
drastically in the late 70s, and up to ten percent of meals per day by the mid-90s. These results
are crucial because childhood obesity is increasing. Fanning, Marsh and Stiegert warn that
inadequate consumption of fruits and vegetables has been associated with obesity-related
problems, such as cardiovascular disease and diabetes On the other hand, they point out that
41
fruits and vegetables may protect against weight gain, because of their low caloric value and high
fiber content (Fanning, Marsh, & Stiegert, 2003).
Food away from home is a large and growing component of U.S. food expenditure.
Given this change in food consumption, there is a considerable need to identify the determinants
of fast food consumption and the implications of these changes for the fast food industry
(Fanning, Marsh, & Stiegert, 2003). Dietz (2002) examined the effect of price, income, and
demographic characteristics on fast food. He suggested that growth in the fast food consumption
was related to an increasing supply of convenience.
The media has marketed fast food very well. Consumers would not increase consumption
of fast food unless they had an incentive to do so. (Fanning, Marsh, & Stiegert, 2003). In other
words, fast food must be relatively cheap with respect to one or a combination of the following:
price, time, or taste. Dietz (2002) also noted that fast food consumption was related to
opportunity costs of the household, especially, due to the fact that one or both primary caregivers
work nowadays away from home and time for preparation of food has decreased. The FDA
(2006) argues that preparing foods at home has a relatively high time cost and that the effect is
low percentage of home-cooked meals.
It is sad to note, that children’s diets in the United States are one of the least healthy in
the Western World. Society today has complicated life beyond what it was every imagined.
Cooking has become a luxury for many, and impossible for some. Cooking is not only fun, it can
also be educational. In fact, cooking helps children and primary caregivers bond with each other,
it also helps children develop important skills in a number of areas, including language, science,
nutrition, art, socio-emotional development, and mathematics among other things.
42

Dental Health of Children
Another topic to be discussed is oral health in children. Despite all the advances in
dentistry and odontology, children are still suffering from poor oral health, primarily, due to poor
diet and poor oral hygiene. Before discussing the issue of oral health, it is important to discuss, in
brief, tooth development in children. At birth people usually have 20 primary (baby) teeth, which
often erupt as early as six months of age. They are then shed at various times throughout
childhood. By age 21, all 32 of the permanent teeth have usually erupted (American Academy of
Pediatric Dentistry, 1999).
Dental caries is a common chronic disease that causes pain and disability across all age
groups. If left untreated, dental caries can lead to pain and infection, tooth loss, and edentulism
(total tooth loss). Dental sealants are effective in preventing dental caries in the occlusal
(chewing) and other pitted and fissured surfaces of the teeth. Exposure to fluoride throughout life
is effective in preventing dental caries (American Academy of Pediatric Dentistry, 1999).
Even though there are highly effective methods for primary prevention of tooth decay, it
remains one of the most common childhood chronic diseases (American Academy of Pediatric
Dentistry, 1999). Dental sealants are very effective in preventing tooth decay on the chewing
surfaces of first and second permanent molar teeth, though they remain underused, especially by
those children from low socio-economic families and from minority groups (Evans, 2000).
A child's mouth needs frequent cleaning to maintain it healthy. Research now points out
that the health of one’s mouth affects the health of the rest of your body (Evans, 2000).
Consequently, the better a child's oral health is, the more likely a child will be healthier as well.
Children should have their teeth cleaned after every meal or snack.
43

Primary caregivers must carefully brush their child’s teeth until two or more baby teeth
touch each other, or until molars position themselves into position against one another at around
age three or as late as age six. According to Evans, flossing becomes necessary when teeth start
touching each other. Furthermore she states that flossing is extremely important due to the fact
that toothbrushes cannot reach in between baby teeth and thus these areas are very likely to
become problematic and develop cavities (Evans, 2000)
It is obvious sometimes young children lack the dexterity and discipline to brush and
floss their teeth well. Therefore, as stated above, primary caregivers need to participate in tooth
brushing and flossing (Evans, 2000). Young children observe and learn best by example and
modeling and will be more interested in learning to brush and later floss their own teeth, when
they see their primary caregivers doing so every day (Evans, 2000).
The most important time to clean a child's mouth is before bed after he or she has had the
last thing to eat or drink for the day. This is because saliva flow slows down during sleep and
provides less protection against cavities than during the day. Contrary to popular belief, fluoride
in toothpaste more so than the brushing itself does more to prevent cavities, though toothpaste
should be used sparingly, since more is not better. An excess of toothpaste may put a child at risk
of developing fluorosis, which is characteristic of having white or brown spots on permanent
teeth (American Academy of Pediatric Dentistry, 1999).
44

Mortality Rates of Children and Child Morbidity
Guyer & Ellers (1990) point out that children are more prone to be a victim of an
unintentional injury that results in death. Most of these unintentional injuries they contend are
due to traffic-related incidents. Primary caregivers should care for their children, teach them
proper traffic rules, how to look both ways before crossing, teach them about common dangers
inside and outside the home. They also point out that the second most frequent occurrence that
results in the death of a child is that primary caregivers fail to properly buckle up their children
in motor vehicles.
According to Guyer and Ellers, child mortality data and child abuse data are difficult to
measure and are inaccurate. They indicate that the only data available comes from vital statistics,
mortality for child homicides and child abuse reports, sometimes hospitals or schools, or social
services. In addition, they state that child abuse may sometimes be misreported or under-
reported, as an accidental or unintentional injury, and some child abuse reports measure how
many reports were made to the hotline, not actual incidence (Guyer & Ellers, 1990).
The leading causes of morbidity and mortality are often different. Some injuries cause or
lead to a death; others result in illnesses or disabilities that affect a child's quality of life and
stunts their potential for development (Guyer & Ellers, 1990). According to the statistics
gathered by the Florida Department of Health (2005), the order from highest to lowest by which
children are hospitalized for are: falls, that comprise the majority of hospitalizations; motor
vehicle related accident, as a pedestrian or as a passenger in a vehicle, or in a bicycle accident..
Turning our attention to child abuse, each year more than one million children are victims
of child abuse nationally (Guyer & Ellers, 1990). However, Guyer and Ellers believe this number
45
may be flawed, because of the many victims that never receive any help, because they are not
reported to the system. It is sad to say that statistically speaking, children are at the highest risk
of abuse and death. In 2005, 77 percent of perpetrators of child abuse or neglect in Florida were
primary caregivers, and 13 percent were other relatives. Recurrence occurred in 6.2 percent of
cases (Florida Department of Health, 2005).
Florida has adopted several programs to combat child abuse which include the Guardian-
ad-Litem program to give each child an advocate and the community primary prevention and
early intervention programs to support families in stressful situations (for example: Florida
healthy families, healthy start, child care, and preschool (Florida Department of Health, 2005).
The Florida Department of Health reported that Florida death rates from motor vehicle
crashes are higher than the national average and are highest among six to eleven year olds than
any other age group. More than eighty percent of pedestrian deaths to children and youth are
motor vehicle-related. Pedestrian death rates among six to eleven year-olds in 2005 were higher
than the national average. Death and disability to children from motor vehicle accidents can be
prevented most of the time. By increasing the use of safety restraints, reducing incidents of DUIs
(Driving under the influence) and DWIs (Driving while intoxicated), and obeying the traffic
laws, there will be a decrease of children falling victims to serious traffic accidents that lead to
death or serious bodily harm as occupants of motor vehicle crashes or as pedestrians (Florida
Department of Health, 2005).
46
Household and Social Environment of Children
Primary caregivers should be a role model to their children. Children look up to their
parents and want to do the things that they are doing. If primary caregivers, for example, eat
nutritious foods, are physically active, and maintain a healthy weight, chances are their children
will do the same. For example, when primary caregivers participate in an exercise class a couple
of times a week, eat lots of fruits and vegetables, or drink water instead of soda, primary
caregivers are sending a powerful message to their children.
Family situations are a factor to child well-being. As noted above, according to Maslow,
family and social needs, physiological needs (of shelter, food, etc.), esteem needs, and stability in
the family and love are vital to a child’s development. A child cannot function properly with
basic needs of survival (Maslow, 1943).
Poverty is a big problem in the United States today. According to the United States
Census Bureau (2004) 18% of children lived in poverty in the United States. In addition, it has
been reported that 8% of children in the United States live in extreme poverty (CDC, 2002). In
general, poverty is lower for families than for all individuals, but when families have children,
they are more likely to live in poverty (Florida Department of Health, 2005). The CDC reported
that children in single female-headed households are more than four times more likely to live in
poverty and children under age five are the most likely to live in poverty. Poverty presents
serious problems and challenges to families. Among these challenges are difficulties in providing
adequate housing, clothing, safety and nutrition, medical and dental care and health insurance, all
of which, affect the health of children (CDC, 2002).
47

Though illness and disability exist in every strata and community, the conditions of
poverty, lack of insurance coverage, or rural location place a family with a child with a disability
and chronic condition at greater risk Poor families of minority populations are underserved and
are, therefore, at greater risk when they have chronic conditions. Children, with special health
care needs, are also at greater risk for child abuse or neglect as compared to the general
population (CDC, 2002).
It is estimated, based on the results from the Children's Insurance Survey, that
approximately 15 percent of all children in the state of Florida are currently uninsured (Monheit,
1992). Florida has made great strides in insuring children in recent years, through government
subsidized insurance programs, but despite this fact, many of Florida's children remain uninsured
(Florida Department of Insurance, 2001).
Another factor to be considered is that the number of households with two married
individuals is decreasing. This is caused by a lower number of marriages and a higher number of
divorces in the United States. The number of children living in a household with two married
primary caregivers has decreased from almost 80% in 1980 to about 65% in 2005. Moreover, the
rates of children living in a household only with their mother are pretty much constant from
1980-2005, staying around 20% (Florida Department of Health, 2005).
School Environment
Schools are important venues for health care services for children. Schools contribute to a
child’s development through physical education, providing meals, education, providing
48

healthcare and checkups among other things (Florida Department of Health and Family Health
Services and School Health, 2005).
. The early identification of conditions that may affect later health is critical in the early
years of a life of a child. A school should be required to provide well child check-ups, dental
health, mental health, and screenings for children lacking or in need of these services (Kolbe,
1997). Increasing funding for school nurses and healthcare programs for children can help in
aiding in the early identification and treatment of children with special health care needs
(Proctor, 1993). Schools are ideal for providing health care education and counseling on
unhealthy behaviors, outreach to families without insurance, and to deliver or help families
arrange for primary, preventive and chronic health care services (Kolbe, 1997).
Although teachers are busy in the difficult task of educating children, they do see them
every day and should have some responsibility in identifying health problems or possible family
issues that the child may be suffering. For example, teachers are to be alert for children that have
chronic conditions such as asthma or diabetes, since these two conditions can flair up at any
moment (Proctor, 1993).
Healthcare professionals are critical members of the educational team. The recommended
nurse-to-student ratio by the National Association of School Nurses is one nurse to 750 students
(Proctor, 1993). In 2005, Florida's school health services nurse to student ratio was 1 to 3,076
students in the basic school health program and 1 to 1,604 students in the Comprehensive School
Health Services Projects. Due to the rapid growth of the Florida population the nurse to student
ratio is increasing at a huge rate (Florida Department of Health and Family Health Services and
School Health, 2005).
49
. Meals provided by schools are also a key element in a child’s development. Several
studies have been performed where the results suggest that the availability of a school breakfast
program or other meal programs by schools have beneficial effects for children. For example, in
Devaney (2001), the researchers found that children who had a school breakfast program
available consumed a better overall diet, consumed a lower percentage of calories from fat, were
less likely to have a low intake of magnesium, and were less likely to have low serum levels of
vitamin C and folate.
The government has two school programs in force. Both the School Breakfast Program
(SBP) and the National School Lunch Program (NSLP) provide nutritionally balanced, low-cost
meals to children each school day. Both programs are administered by the United States
Department of Agriculture (USDA) through its Food and Nutrition Service (FNS). Participating
school districts receive a cash and commodity subsidy for each meal they serve, and in turn, they
serve meals which must meet minimum dietary standards (United States Department of Health,
2005).
Even though these alternatives are available, some schools use unhealthy practices and
procedures in preparing food at school. Some schools add unnecessary butter, oils and margarine
to foods, or do not properly take away excess fat in food, or use trans-fatty acids or saturated
fats, etc (Florida Department of Health and Family Health Services and School Health, 2005).
Besides nutritional practices from schools, physical activity is vital to children’s
development, thus, children obviously need sufficient time provided for recess and physical
education in schools to promote better overall fitness and health. In Florida, according to the
Florida Department of Education, 71.4% of elementary schools provide regularly scheduled
recess for students in all grades kindergarten through 5, 49.0% of all schools offer intramural
50
activities or physical activity clubs for students and 84.0% of elementary schools follow national
or state physical education standards or guidelines (Florida Department of Education, 2005).
Child Immunizations
The Department of Health (2006) has recently published a new immunizations schedule
which indicates the recommended ages for routine administration of currently licensed childhood
vaccines, for children through age 18 years. The Department of Health recommends that a given
dose not given at the recommended age should be given at a subsequent visit.
The Hepatitis B (HepB) vaccine must be given to all newborns before hospital discharge.
Mothers should have blood drawn as soon as possible to determine her HBsAg status; if HBsAg-
positive, the infant should receive HBIG as soon as possible (no later than age 1 week). For
infants born to HBsAg-negative mothers, the birth dose can be delayed in rare circumstances but
only if a physician's order to withhold the vaccine and a copy of the mother's original HBsAg-
negative laboratory report are documented in the infant's medical record (Department of Health,
2006)..
Following the birth doses: The HepB series should be completed with either monovalent
HepB or a combination vaccine containing HepB. The second dose should be administered at
age 1–2 months. The final dose should be administered at age ≥24 weeks. It is permissible to
administer 4 doses of HepB (e.g., when combination vaccines are given after the birth dose);
however, if monovalent HepB is used, a dose at age 4 months is not needed. Infants born to
HBsAg- positive mothers should be tested for HBsAg and antibody to HBsAg after completion
51
of the HepB series, at age 9–18 months (generally at the next well-child visit after completion of
the vaccine series) (Department of Health, 2006)..
The fourth dose Diphtheria and tetanus toxoids and acellular pertussis (DTaP) may be
administered as early as age 12 months, provided 6 months have elapsed since the third dose and
the child is unlikely to return at age 15–18 months. The final dose in the series should be given at
age ≥ 4 years. Tetanus and diphtheria toxoids and acellular pertussis vaccine (Tdap – adolescent
preparation) is recommended at age 11–12 years for those who have completed the
recommended childhood DTP/DTaP vaccination series and have not received a Td booster dose
(Department of Health, 2006).
The Haemophilus influenzae type b (Hib) conjugate vaccine are licensed for infant use. If
PRP-OMP (PedvaxHIB® or ComVax® [Merck]) is administered at ages 2 and 4 months, a dose
at age 6 months is not required. DTaP/Hib combination products should not be used for primary
immunization in infants at ages 2, 4 or 6 months but can be used as boosters after any Hib
vaccine. The final dose in the series should be administered at age ≥12 months. 4. Measles,
mumps, and rubella vaccine (MMR) (Department of Health, 2006).
The second dose of MMR is recommended routinely at age 4–6 years but may be
administered during any visit, provided at least 4 weeks have elapsed since the first dose and
both doses are administered beginning at or after age 12 months. Those who have not previously
received the second dose should complete the schedule by age 11–12 years (Department of
Health, 2006).
Varicella vaccine is recommended at any visit at or after age 12 months for susceptible
children (i.e., those who lack a reliable history of chickenpox) Susceptible persons aged ≥13
years should receive 2 doses administered at least 4 weeks apart (Department of Health, 2006).
52

Meningococcal conjugate vaccine (MCV4) should be given to all children at the 11–12
year old visit as well as to unvaccinated adolescents at high school entry (15 years of age). Other
adolescents who wish to decrease their risk for meningococcal disease may also be vaccinated.
All college freshmen living in dormitories should also be vaccinated, preferably with MCV4,
although meningococcal polysaccharide vaccine (MPSV4) is an acceptable alternative.
Vaccination against invasive meningococcal disease is recommended for children and
adolescents aged ≥ 2 years with terminal complement deficiencies or anatomic or functional
asplenia and certain other high risk groups (Department of Health, 2006).
The heptavalent pneumococcal conjugate vaccine (PCV) is recommended for all children
aged 2–23 months and for certain children aged 24–59 months. The final dose in the series
should be given at age ≥ 12 months. Pneumococcal polysaccharide vaccine (PPV) is
recommended in addition to PCV for certain high-risk groups (Department of Health, 2006).
Influenza vaccine is recommended annually for children aged ≥6 months with certain risk
factors (including, but not limited to, asthma, cardiac disease, sickle cell disease, human
immunodeficiency virus [HIV], diabetes, and conditions that can compromise respiratory
function or handling of respiratory secretions or that can increase the risk for aspiration),
healthcare workers, and other persons (including household members) in close contact with
persons in groups at high risk. In addition, healthy children aged 6–23 months and close contacts
of healthy children aged 0–5 months are recommended to receive influenza vaccine because
children in this age group are at substantially increased risk for influenza-related hospitalizations.
For healthy persons aged 5–49 years, the intranasally administered, live, attenuated influenza
vaccine (LAIV) is an acceptable alternative to the intramuscular trivalent inactivated influenza
vac- cine (TIV). Children receiving TIV should be administered a dosage appropriate for their
53
age (0.25 mL if aged 6–35 months or 0.5 mL if aged ≥3 years). Children aged ≤8 years who are
receiving influenza vaccine for the first time should receive 2 doses (separated by at least 4
weeks for TIV and at least 6 weeks for LAIV) (Department of Health, 2006).
HepA is recommended for all children at 1 year of age (i.e., 12–23 months). The 2 doses
in the series should be administered at least 6 months apart. States, counties, and communities
with existing HepA vaccination programs for children 2–18 years of age are encouraged to
maintain these programs. In these areas, new efforts focused on routine vaccination of 1-year-old
children should enhance, not replace, ongoing programs directed at a broader population of
children. HepA is also recommended for certain high risk groups (Department of Health, 2006).
Summary of the Chapter
This chapter consisted of a review of the literature. The first section gave an introduction
of the problem discussed further in detail in the following sections of the review of literature.
This section specifically addressed the lack of health literacy of primary caregivers in the U.S.,
and how this affects their children well-being, the importance of healthy nutritional and health
promotion practices, such as exercise, and how these must be implemented at an early age in
order to combat short and long-term negative consequences. The importance of primary
caregiver and children nutritional education and how they affect children’s nutritional choices
was discussed. Other important factors, such as, primary caregiver perceptions, parenting, and
school and clinical environments were also discussed. This section also introduced the increase
of childhood obesity and unhealthy weight, and consequences and the important role primary
caregivers have to prevent this epidemic.
54

Most importantly, the introductory section discussed the higher incidence of unhealthy
weight in lower socio-economic classes, the fact that higher socio-economic classes were more
likely to report enforcing food rules in the home and promoting fruits and vegetables and
restricting the consumption of “junk,” food, the fact that primary caregivers from low economic
status groups were more concerned with protecting the social aspects of mealtimes and ensuring
an adequate quantity of food was consumed rather than with enforcing specific foods
The second section of the review of literature dealt with the psychological, emotional and
behavioral health of children. This section discussed the importance of psychological health in
children and the link between psychological health and physiological health. A summary of
Maslow’s theory of the Hierarchy of Needs was introduced, which can be summarized as
follows: higher needs-such as higher education- of an individual may not be fully attained
without the satisfaction of more basic needs, such as shelter, food or clothing.
The third and fourth sections dealt with eating habits of children and benefits of physical
activity, respectively. Section three discussed that establishing healthy dietary patterns in
childhood was correlated with a healthier diet in adulthood and the prevention of chronic disease
and obesity. Section four discussed the importance of physical activity to the overall health and
well-being of children, both physical and emotional. In addition, section four explained caloric
expenditure, recommended days per week and types of exercise that do a better job in promoting
a healthy lifestyle, and provided current rates of exercise activity, as compared to T.V. watching
in the United States. This section ended with some recommendations directed to parents from the
U.S. Department of Health.
Section five discussed more in detail the health risks associated with being overweight
and obese, the benefits of maintaining a healthy weight, and ways to determine whether someone
55

is at a healthy weight or not (such as through the use of the Body Mass Index equation). It is
curious to note that in Florida, according to the literature, there was a higher percentage of
children that were overweight than in the United States as a whole (for example it was found that
40% of Florida male children were overweight or obese, as compared to the United States rate of
35%).
Section six explored the realm of nutritional habits and nutritional standards as
recommended by the Food and Drug Administration through the suggested FDA food pyramid
and quantities of nutrients a child or adult must have per day to remain healthy. A child or adult,
has to balance calories from foods and beverages with calories expended to maintain body
weight in a healthy range. Based on the literature, children and adults alike in the United States
eat very few vegetables per day. This section ended with recommendations for children and their
primary caregivers from the FDA.
Section seven dealt with the issue of fast food. This section attempted to explain why
people eat so much fast food and why is it the primary source of food for children. The literature
concluded that, the United States, consumes excessive amounts of fast food. An examination of
economics was also explored in this section.
Section eight discussed how poor nutritional habits can lead to poor oral health and caries
and gingivitis among other things, and also gave recommendations as to children’s oral hygiene.
Section nine dealt with child mortality rates, child morbidity, and child abuse. Section ten,
discussed the importance of the home environment and social surroundings in the overall well-
being of a child. Emphasis was given in this section to parenting and the ever-growing problem
of poverty. According to the literature, 18% of children live in poverty in the United States, and
8% out of the 18% of those children live in extreme poverty. Section eleven dealt with the school
56

environment and how schools can promote good eating and exercise habits. Section twelve
discussed in brief child immunizations. The following chapter will explain the methodology of
this study.
57
CHAPTER THREE METHODOLOGY
The purpose of this section is to explain the design and methodology behind this research
used to identify the levels of knowledge and practices of primary caregivers, practices of their
children and their children’s well-being. This section includes: study participants, measures,
blueprint of the questionnaire and procedures.
For the most part, there was quite a bit of resistance on the part of some of the elementary
schools to participate in the survey questionnaire. In one of the 20 schools in the pool of schools
chosen, I had to attend a three hour faculty preparation meeting at which time I had to give a
very detailed presentation to the faculty, including the principal, assistant principal and all the
faculty committee members. After several telephone calls and e-mails, and after three weeks of
deliberation, I was told they were fearful the primary caregivers might not like the questionnaire,
because they might feel they were being singled out. Attempts were made to assure the principal
the questionnaire would be anonymous, but, the answer was still in the negative.
Another attempt at one of the elementary schools proved to be very odd. After the school
principal had said he would participate, upon delivery of the questionnaires to the school, I was
told they were too busy preparing for the FCAT and did not have the time to participate and that
they were concerned that the parents might link FCAT preparation efforts with the questionnaire.
Another school, which finally consented to participate in the questionnaire, asked me to
come back to talk to primary caregivers and teachers about my study and results. Surprisingly, I
would have thought elementary schools would be more willing and anxious to participate in a
research survey questionnaire, which could potentially shed light on areas of the students’ needs,
as to their health and well-being. However, it seemed like schools did not want to meddle in
58
parenting nor health issues, and that might have been the reason of the schools’ apathy to this
study. To say the least, participation was an issue. I thought I would have had more participants
with all the effort I put in recruiting participants. Not only did I visit schools in a radius of more
than 20-25 miles in Orange County, I made countless telephone calls and sent a lot of e-mails,
and most of the time I had to make the trip more than once to collect the questionnaires, since the
questionnaire took more than expected to be collected by the teachers. One school actually
approached me with the question: “what prize are you going to offer to the primary caregivers
for participating in the research questionnaire?” I was disappointed to think the schools would
not participate, unless there were given some material prize, rather than the benefit of personal
satisfaction to have participated in a research study, which could eventually help the well-being
of their children and their own.
The study involved the collection and analysis of PCs with children in elementary school
in three different schools in Orange County, Florida. This study was carried out in the following
stages: a review of the literature; development of a survey instrument that was distributed
anonymously in three different schools in Orange County; collection and analysis of data; and
reporting the major findings; analyses and conclusions with data collected during the study. The
review of literature and research examined several aspects of health and well-being.
The items on the survey instrument included key issues drawn from the literature. After
the survey was developed and permission was received from the participating schools and the
IRB of the University of Central Florida, the questionnaires were distributed and later collected
anonymously.
59

Study Population
The survey population for this study consisted of a random sample of primary caregivers
of public elementary school children of a diverse ethnic and demographic group in Orange
County, Florida from three Orange County Elementary Schools. The sample size was 102
primary caregivers of elementary school age children, ages 5 to 10, of different ethnic and
economic backgrounds.
Measures
The instrument, a survey questionnaire, was created after an extensive review of the
literature of this topic. The questionnaire developed for this dissertation was entitled “What do
you think your children’s health is like?” See Appendix D. This questionnaire consisted of 51
multiple-choice style questions related to the primary caregivers’ health knowledge and
practices, their children’s health practices and overall well-being. The responses to the
questionnaires were anonymous and participation was voluntary.
No reliability or validity tests were performed, the accuracy of answers to the questions
were dependent on the truthfulness of the responses. The respondents were primary caregivers,
who responded as to their children’s health and their own knowledge and practices. There was no
tampering of the questionnaires, and no exposure to any other individuals but the primary
caregivers that responded to the questionnaires and the teachers who collected the
questionnaires.
60
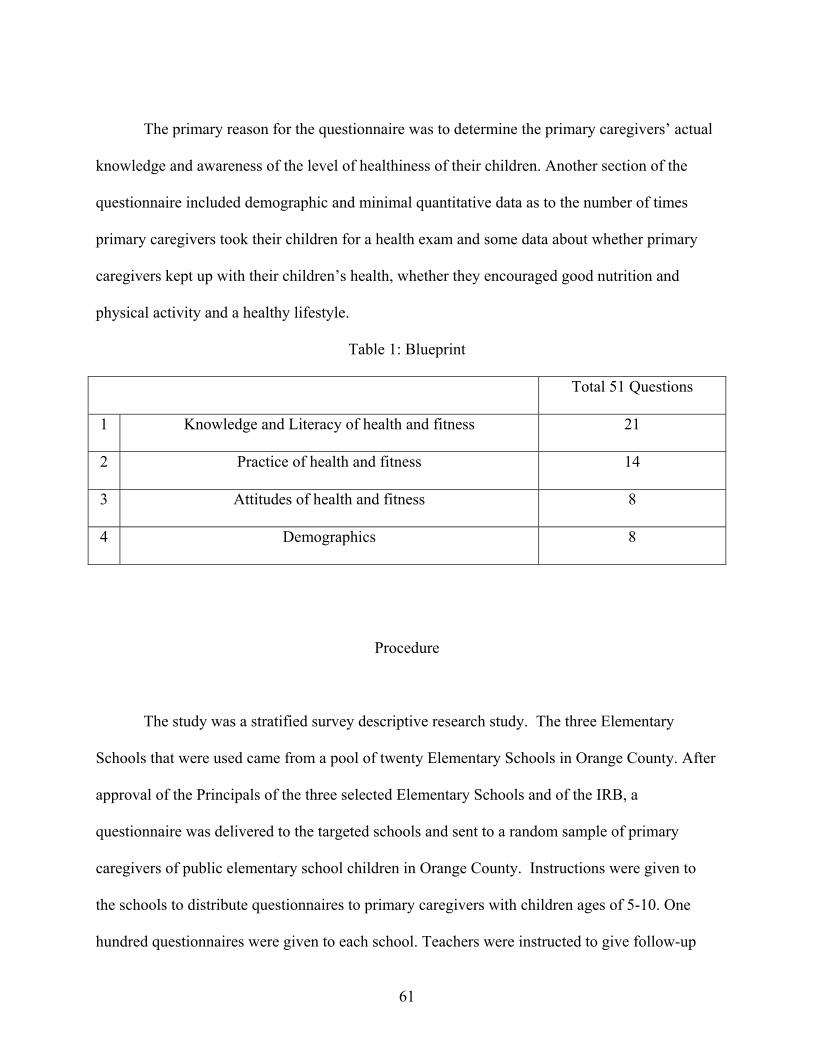
The primary reason for the questionnaire was to determine the primary caregivers’ actual
knowledge and awareness of the level of healthiness of their children. Another section of the
questionnaire included demographic and minimal quantitative data as to the number of times
primary caregivers took their children for a health exam and some data about whether primary
caregivers kept up with their children’s health, whether they encouraged good nutrition and
physical activity and a healthy lifestyle.
Table 1: Blueprint
Total 51 Questions
1 Knowledge and Literacy of health and fitness 21
2 Practice of health and fitness 14
3 Attitudes of health and fitness 8
4 Demographics 8
Procedure
The study was a stratified survey descriptive research study. The three Elementary
Schools that were used came from a pool of twenty Elementary Schools in Orange County. After
approval of the Principals of the three selected Elementary Schools and of the IRB, a
questionnaire was delivered to the targeted schools and sent to a random sample of primary
caregivers of public elementary school children in Orange County. Instructions were given to
the schools to distribute questionnaires to primary caregivers with children ages of 5-10. One
hundred questionnaires were given to each school. Teachers were instructed to give follow-up
61

letters provided initially with the questionnaires when delivered to the schools. The teachers
were instructed to collect the questionnaires and put them in a numbered envelope with the age
of the participant group and deliver them sealed to the office of the principal. This was done to
protect anonymity and to be able to better organize and keep track of the returned questionnaires.
Once the results were collected, they were kept confidential and kept in a locked file cabinet.
Out of the 300 questionnaires given out in total to the three schools, 102 were returned
completed. School number 1 returned 43 questionnaires. School number 2 returned 44
questionnaires. School number 3 returned 15 questionnaires.
Statistical Procedures
Once the survey was conducted of the primary caregivers’ health literacy, knowledge and
attitudes of their children’s health and physical fitness level, the results were compiled
statistically with SPSS Version 10.0. Frequencies, cross-tabulations, means, standard deviations
were used to answer research question 1, dealing with trends of primary caregivers’ responses.
Research questions 2, dealing with primary caregiver’s knowledge and practice and child
practice and their relation to child well-being, and research question 3, dealing with primary
caregiver’s knowledge and practice and child practice and their relation to number of sick days
taken, were answered using discriminant analyses or logistic regression.
62

Summary of the Chapter
This chapter covered the methodology behind this study starting with a discussion of the
study population, measures used in the study, including a blueprint of the questionnaire utilized
in the study, procedure and statistical procedures used in order to answer the research questions.
This chapter also discussed data collection methods. Sample size and description of sample size
were also discussed. The next chapter will describe the data analysis and the results obtained in
this study.
63

CHAPTER FOUR DATA ANALYSIS
The results have been sorted into subsections, grouped by research question. Trends in
descriptive results were further sorted by topic and relevance. Frequency tables are contained in
Appendix F, Appendix G contains crosstabulations performed across the three schools in order to
compare results among them. Research question 2 and 3 were answered using logistic regression.
Research Question 1: What trends in the primary caregivers’ responses may be identified
by the descriptive statistics?
Question 1 of the survey instrument, dealing with knowledge of primary caregivers about
health and fitness showed 24% were highly knowledgeable, 49% responded they were
knowledgeable and 25% were somewhat knowledgeable about nutrition, fitness and general
health issues. However, when comparing schools, there was a difference of knowledge between
schools according to the percentage values (See Figure 1: Parental Knowledge Across Three
Studied Schools below), which can be an indicator that among primary caregivers (PCs) there
are some that have less knowledge about health due to education, geographical area or other
factors.
64

Figure 1: Parental Knowledge Across Three Studied Schools
Although there was a high degree of knowledge of PCs, the responses to questions 38 and
39 indicated that 54% felt they were healthy while 81% thought their children were healthy. On
the other hand, 96% of PCs considered themselves interested in their own health and 99% were
interested in their children’s health. What can be concluded from these results is that although
PCs care for their own health and their children’s health, their practices may not be consistent
with their desire to be healthy or beliefs of how to be healthy and fit.
As to the amount of sleep needed, 82% of PCs stated they needed to sleep 6-8 hours a
night, however, only 65% actually slept that amount of time. As to children, 69% of PCs stated
that children needed 9 or more hours of sleep a night and 65% of children actually slept that
amount of time. 30% of PCs thought children should sleep 6-8 hours a night, 32% of the children
actually did sleep that amount of time a night.
65

100% of all children received their immunizations on time. Only 5% of children had any
known chronic illnesses. 34% of children missed 3-5 days of the school year, 7% missed 6-10
days and 57% missed 0-2 days.
Only 40% of PCs took their children often to the doctor, 8% very often, and 51% seldom.
34% of PCs, on the other hand, seldom went to the doctor, 47% went often and 19% went very
often.
Nutrition
Based on question 3 of the survey instrument, only 61% of PCs knew about Healthy
Smart Choice school lunches, however 80% of PCs had a copy of school lunch menus. This
shows that PCs know what children are eating at school. In addition, 29% of children
participated in the free or reduced lunch program at school. 47% did not participate and 24%
brought lunch from home.
As to the amount of days per week children ate fast food, 65% ate fast food 1-2 times per
week, 12% ate fast food 3-5 times a week, 5% more than 5 times per week and 19% ate no fast
food. On the other hand, 15% of children ate home-cooked meals 1-2 times a week, 46% 3-5
times a week and 40% more than 5 times a week.
Children should eat more than 5 servings of fruit and vegetables a day and 3-5 servings of
dairy products a day (FDA, 2006). However, only 15% of PCs believed that their children
needed more than 5 servings of fruit and vegetables a day, 66% 3-5 servings and 20% 1-2
servings. When PCs were asked how many servings of fruit and vegetables their children had a
day, 54% had 1-2 servings a day, 40% had 3-5 servings a day and only 5% had the optimal more
66

than 5 servings a day. Figure 2: Servings of Fruit and Vegetables PCs Thought Children Should
Have and Figure 3: Number of Servings of Fruit and Vegetables Children ate, indicate that most
PCs believed that children should have 3-5 servings of fruit and vegetables, most children had
only 1-2 servings of fruit and vegetables
Figure 2: Servings of Fruit and Vegetables PCs Thought Children Should Have
Figure 3: Number of Servings of Fruit and Vegetables Children ate
67

As to dairy products, 43% of PCs answered that their children needed 1-2 servings of
dairy products a day and 53% of PCs said 3-5 servings of dairy products a day. These results are
similar to the responses given of what children actually had, since 49% of the children were
having 1-2 servings a day and 47% were having 3-5 servings a day.
It can be concluded that children’s actual nutritional practices are correlated to the PCs
understanding of what is required for them. Moreover, on average children had recommended
values for dairy products, but, did not have recommended values for fruits and vegetables.
Turning the attention to the number of snacks PCs and children consume a day,
interestingly enough, knowledge and practice both followed a similar pattern as to the number of
snacks believed to be needed and consumed a day. 42% of PCs ate 2-3 snacks a day, 48% 1-2
snacks a day, and 58% of children ate 2-3 snacks a day and 35% ate 1-2 snacks a day. If in fact
the snacks chosen by PCs and children were healthy, these percentages would not be alarming.
However, if these snacks were not healthy, the number of snacks consumed per day would be too
high. Most likely, snack choices will be chosen from what PCs make available, and what schools
make available in vending machines. Based on the graph below, Figure 4: Crosstabulation of
Healthy Weight and Snacks per day, represents a crosstabulation of number of snacks and weight
of children, 78% of children that were reported as being at an unhealthy weight by PCs had 2-3
snacks a day. Nevertheless, 55% of children that were reported as being at a healthy weight had
2-3 snacks a day; this may be due to the fact that some children are more active than others and
expend more calories than others that are more sedentary.
68

Figure 4: Crosstabulation of Healthy Weight and Snacks per day
Communication With Children and Parenting
25% of PCs talked with children about their children’s health very often, 60% often, and
13% seldom. According to the results 9% of PCs talked with teachers and health professionals
very often about their children, 37% often, 40% seldom and 15% never. When PCs were asked
how often they had to discuss health issues such as drug and alcohol abuse and sexual education,
33% stated very often, 49% often, 12% seldom and 6% never. In addition, 23% of PCs stated
they general spoke about health issues very often, 48% often, 26% seldom and 3% never.
69

54% of PCs spent very much time with their child, 36% quite a bit, 8% little. 96% of PCs
were aware of their child’s health and 94% promptly took their child for a health check-up if
they found any health issues. 87% of PCs felt very comfortable discussing health and fitness with
their child. All PCs believed the communication with their child was adequate. 87% of PCs felt
very comfortable asking advice from health professionals, 18% somewhat comfortable.
Physical Activity, Sedentary Life and Height/Weight Ratio
9% of PCs never engaged in physical activity, 35%, 1-2 times a week, 43%, 3-5 times a
week and 12% more than 5 times a week. On the other hand, 2% of children never engaged in
physical activity, 26%, 1-2 times a week, 53%, 3-5 times a week, and 19% more than 5 times a
week.
A graph was created as a cross tabulation of days per week spent by children doing
exercise and weight of children (See Figure 5: Crosstabulation of Child Healthy Weight and
Physical Activity). Based on the results, 54% of children that were reported by PCs as having a
healthy weight engaged in physical activity 3-5 times a week, 24% that were reported by PCs as
having a healthy weight engaged in physical activity 1-2 times a week, and 22% that were
reported by PCs as having a healthy weight engaged in physical activity more than 5 times a
week. If the percentages of the healthy levels of exercise for a child are added (results of 3-5
times a week + more than 5 times a week) the total is 76%. More than three quarters of children
participating in exercise at least 3-7 times a week are at a healthy weight. Nevertheless, it is
interesting to note that although exercise might be beneficial, if the intensity is not sufficient, it
70

may not be enough to expend sufficient calories or there might be other factors that might not
allow a healthy weight.
Figure 5: Crosstabulation of Child Healthy Weight and Physical Activity
As we can see from this crosstabulation in Figure 5: Crosstabulation of Child Healthy
Weight and Physical Activity, 60% of PCs that reported that their children had an unhealthy
weight, also stated that their children engaged in 3-5 days of exercise per week and 32% of PCs
that reported that their children had an unhealthy weight stated that their children engaged in 1-2
days of exercise per week and only 8% of PCs reported that their children had an unhealthy
weight and that their children did not engage in any physical activity.
Even if the results are not very significant, it must be noted that, unhealthy and healthy
weight might be interpreted differently by PCs. Unhealthy weight can be viewed as one thing for
71

one culture or another, also unhealthy weight might include underweight, not only overweight,
and the fact that some children might be overweight even if they engage in physical exercise may
be due to two of the following: metabolism levels and heredity.
63% of children spent 0-2 hours of T.V. viewing, computer or videogames a day, 30% 3-
5 hours, and 6% more than 5 hours a day. On the other hand, 61% of PCs had 0-2 hours a day
with T.V. or computer games, 25%, 3-5 hours a day, and 13% more than 5 hours a day. If the
percentages of children that spend 3-5 hours and more than 5 hours are combined, that is a total
of 36% which is close to the percentage of children in Florida, of 40%, which are overweight or
obese.
When PCs were asked whether they had a healthy weight based on their height/weight
ratio 58% said yes, 38% said no and 3% said they did not know. When PCs were asked whether
their child was at a healthy weight, 80% said yes, 13% said no and 6% said they did not know. A
crosstabulation was performed between height/weight ratio of the PCs and of the child’s
height/weight ratio, this was done to determine whether it was more likely that a child would
have an unhealthy height/weight ratio if a child had a PC that had an unhealthy height/ratio.
Based on the graph below (See Figure 6: Crosstabulation of Child Healthy Weight and
PC Healthy Weight) it can be seen that about 65% of children that had a PC with a healthy
weight had a healthy weight themselves. Furthermore, 54% of children that had a PC with an
unhealthy weight had an unhealthy weight themselves. It is also curious to note that 66% of
children that had a PC that reported that they did not know whether their child had an unhealthy
or healthy weight had an unhealthy weight themselves.
72

Figure 6: Crosstabulation of Child Healthy Weight and PC Healthy Weight
Hygiene and Oral Health
87% of children washed their hands before eating and 11% did not. 5% of PCs stated that
children needed to brush their teeth once a day, 50% twice a day and 45% more than twice. On
average, 9% of children went to the dentist very often, 63% often, 24% seldom and 4% never.
When asked how many times a day their child actually brushed their teeth, 20% stated once, 72%
twice, and 8% said more than twice. The suggested formula for number of times to brush one’s
teeth is: number of times to brush teeth=number of meals eaten per day. Therefore, if there are 3
meals, a child must brush their teeth 3 times a day, before going to sleep being the most
important.
73

Demographics in the Study
81% of PCs filling out this questionnaire were mothers of the child, 15% fathers, 2%
grandparents, 1% other. 4% of PCs were 18-25 years old, 23%, 26-35 years old, 48%, 33-40
years old, 24%, over 40 years old. 6% of children in this questionnaire were 5 years old, 19%, 6
years old, 16%, 7 years old, 19%, 8 years old, 13%, 9 years old, 26%, 10 years old.
Research Question 2: To what degree do primary caregivers’ health knowledge, primary
caregivers’ health practices and child’s health practices affect the child’s weight status (well-
being) as reported by the primary caregivers?
Overall, the composite of the independent variables, Primary Caregiver Reported
Personal Health Practices, Primary Caregiver Reported Child Health Practices and Primary
Caregiver Health Knowledge entered into the logistic regression procedure predicted (or
explained) 9.5% of the variation in the dependent criterion (whether primary caregivers
identified their child at a healthy weight, χ2= 5.866, p=.118).
The b weight for Primary Caregiver Reported Child Health Practices was statistically
significant (p=.045) while neither Primary Caregiver Reported Knowledge nor Primary
Caregiver Personal Health Practices were statistically significant.
This suggests that the results for Primary Caregiver Reported Child Health Practices have
sufficient precision to be retained in the specified logistic regression model. Closer inspection of
the b weight for Primary Caregiver Reported Child Health Practices suggested that with every
unit increase in independent variable a .512 unit increase occurred in terms of whether primary
caregivers who correctly identified among 13 questions of child practices that are best, were
more likely to report their child to be at a healthy weight.
74

Table 2: Logistic Regression for Research Question 2
Research Question 3: To what degree do primary caregivers’ health knowledge, primary
caregivers’ health practices and child’s health practices affect the child’s number of sick days
taken from school as reported by the primary caregivers?
Overall, the composite of the independent variables, Primary Caregiver Reported
Personal Health Practices, Primary Caregiver Child Health Practices, and Primary Caregiver
Health Knowledge, entered into the logistic regression procedure predicted (or explained) 4.7%
of the variation in the dependent criterion (whether Primary Caregiver Reported Personal Health
75
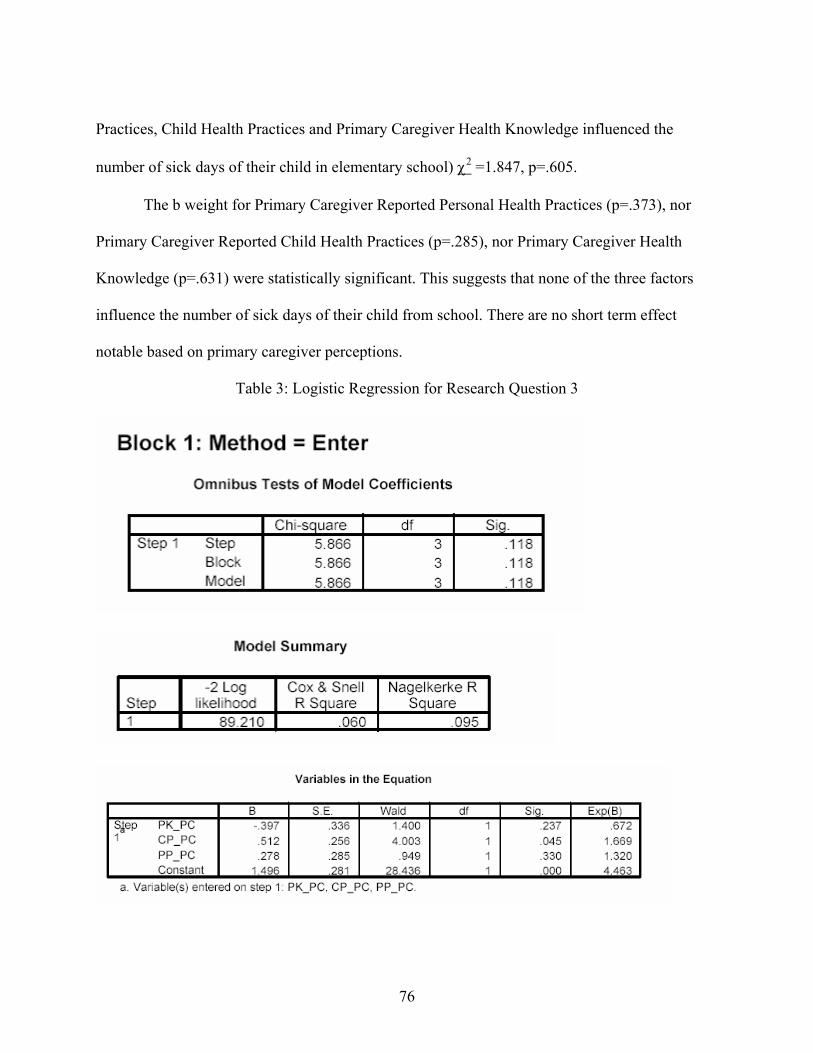
Practices, Child Health Practices and Primary Caregiver Health Knowledge influenced the
number of sick days of their child in elementary school) χ2 =1.847, p=.605.
The b weight for Primary Caregiver Reported Personal Health Practices (p=.373), nor
Primary Caregiver Reported Child Health Practices (p=.285), nor Primary Caregiver Health
Knowledge (p=.631) were statistically significant. This suggests that none of the three factors
influence the number of sick days of their child from school. There are no short term effect
notable based on primary caregiver perceptions.
Table 3: Logistic Regression for Research Question 3
76

Additional Findings
Overall, the composite of the independent variables (Primary Caregiver Reported
Personal Health Practices, Primary Caregiver Reported Child Health Practices, and Primary
Caregiver Health Knowledge) entered into the logistic regression procedure predicted (or
explained) 53.2% of the variation in the dependent criterion (whether parents identified their
child as having a chronic condition), χ2 (3) = 18.616, p < .001.
The b weight for Primary Caregiver Reported Personal Health Practices was statistically
significant (p=.006) while neither the Primary Caregiver Knowledge nor Primary Caregiver
Reported Child Practices were statistically significant. This suggests that the results for Parental
Reported Personal Health Practices have sufficient precision to be retained in the specified
logistic regression model. Closer inspection of the b weight for Parental Reported Personal
Health Practices, suggested that with every unit increase in independent variable #1 (X1), a
2.543 unit decrease occurred in terms of whether parents identified their child with a chronic
condition.
77

Table 4: Logistic Regression for Additional Findings
.
Summary of the Chapter
This chapter examined data analysis and the results obtained from this study in order to
answer the three research questions. The first research question focused on the trends of primary
caregivers’ responses identified from the descriptive statistics. Primary caregivers reported
overall that they were knowledgeable about health and fitness. When comparing schools there
was a difference of reported health and fitness knowledge between schools according to the
78

percentage values, which can be an indicator that among primary caregivers (PCs) there are
some that have less knowledge about health due to education, geographical area, etc.
Only 54% of PCs felt they were healthy while and 81% of PCs reported that they thought
their children were healthy. On the other hand, 96% of PCs considered themselves interested in
their own health and 99% were interested in their children’s health. Both PCs and children were
sleeping less than the recommended amount of hours (82% of PCs stated they needed to sleep 6-
8 hours a night, however, only 65% actually slept that amount of time, 69% of PCs stated that
children needed 9 or more hours of sleep a night and 65% of children actually slept that amount
of time).
Only 41% of PCs took their children often to the doctor, 8% very often, and 51% seldom.
As to the amount of days per week children ate fast food, 65% ate fast food 1-2 times per week,
12% ate fast food 3-5 times a week, 5% more than 5 times per week and 19% ate no fast food.
On the other hand, 15% of children ate home-cooked meals 1-2 times a week, 46% 3-5 times a
week and 40% more than 5 times a week.
Only 15% of PCs believed that their children needed more than 5 servings of fruit and
vegetables a day, 66% 3-5 servings and 20% 1-2 servings. When PCs were asked how many
servings of fruit and vegetables their children had a day, 54% had 1-2 servings a day, 40% had 3-
5 servings a day and only 5% had the optimal more than 5 servings a day. Although children had
recommended values for dairy products, they obviously did not have recommended values for
fruits and vegetables.
9% of PCs and 2% of children never engaged in physical activity, 35% of PCs and 26%
of children 1-2 times a week, and 55% of PCs and 76% of children 3-5 times a week or more.
79

More than three quarters of children participating in exercise at least 3-7 times a week were at a
healthy weight.
63% of children and 61% of PCs spent 0-2 hours of T.V. viewing, computer or
videogames a day, 30% of children and 25% of PCs 3-5 hours, and 6% of children and 13% of
PCs more than 5 hours a day. When PCs were asked whether they had a healthy weight based on
their height/weight ratio 58% said yes, 38% said no and 3% said they did not know. When PCs
were asked whether their child was at a healthy weight, 80% said yes, 13% said no and 6% said
they did not know. A crosstabulation was performed between height/weight ratio of the PCs and
of the child’s height/weight ratio, this was done to determine whether it was more likely that a
child would have an unhealthy height/weight ratio if a child had a PC that had an unhealthy
height/ratio. 65% of children that had a PC with a healthy weight had a healthy weight
themselves. Furthermore, 54% of children that had a PC with an unhealthy weight had an
unhealthy weight themselves.
The second research question focused on the degree primary caregivers’ health
knowledge, primary caregivers’ health practices and child health practices affected the child’s
weight status (well-being) as reported by the primary caregivers. The b weight for Primary
Caregiver Reported Child Health Practices was statistically significant (p=.045) while neither
Primary Caregiver Reported Knowledge nor Primary Caregiver Personal Health Practices were
statistically significant. Practices suggested that with every unit increase in independent variable
a .512 unit increase occurred in terms of whether primary caregivers who correctly identified
among 13 questions of child practices that are best, were more likely to report their child to be at
a healthy weight.
80

The third research question focused on the degree primary caregivers’ health knowledge,
primary caregivers’ health practice and child health practice affected the child’s number of sick
days taken from school as reported by the primary caregiver. The b weight for Primary Caregiver
Reported Personal Health Practices (p=.373), nor Primary Caregiver Reported Child Health
Practices (p=.285), nor Primary Caregiver Health Knowledge (p=.631) were statistically
significant. This suggests that none of the three factors influenced the number of sick days of
children from school. There are no short term effect notable based on primary caregiver
perceptions.
Some additional findings were obtained dealing with whether primary caregivers
identified their children with a chronic condition. Primary Caregiver Reported Personal Health
Practices was statistically significant (p=.006), while neither the Primary Caregiver Knowledge
or Primary Caregiver Reported Child Practices were statistically significant. The next chapter
will discuss the findings, conclusions, implications and recommendations, as well as suggestions
for future research.
81
CHAPTER FIVE CONCLUSION
This study was designed to collect, organize and analyze data about PC’s health
knowledge and practices and their children’s health practices, and how they influence the overall
health of the children. The purpose of this chapter is to discuss the findings of the survey
instrument involved in this study, and present implications and recommendations.
As Corbin (1996) discovered children as early as in elementary school are suffering from
health problems. The results of this study have also found the same results as Corbin found.
Primary caregivers under Corbin’s study benefited from health education, and this study found
that primary caregivers need more knowledge and education to make better decisions in caring
for their children.
Pate (1995) discovered the benefits of physical exercise and school participation in the
overall well-being of children and the need to ensure meals offered at school meet federal
nutrition standards. This study has found how important the benefits of physical activity and
good nutrition are for elementary school-age children. By implementing nutritional programs
there is hope for improving dietary behavior in children.
Dewey (1938) was correct when he stated that healthy child development requires more
than attending to children’s academic potential; children need physical, emotional and social
development too. It is all interrelated. I have found this to be true in this study. Fanning &
Stiegert (2003) were also correct in stating that children who ate large amounts of fast food took
in huge amounts of total calories and were apt to be more overweight. This study has also found
this to be true. In addition, the amount of T.V. watching, video games and computer use in other
studies indicated that was very high as a nation. In this study, over 35% of children in the study
82

spent excessive hours with these sedentary activities. Curiously enough, this number
corresponded with the percentage of children overweight in Florida, 37.5% (Florida Department
of Health, 2005)..
Summary of the Study
The purpose of the research was to provide a general overview of PC’s knowledge of
health and their health practices and that of their children. Most importantly, this research was
conducted to determine if a relationship existed between PC’s knowledge and their health
practices and that of their children and the overall health and well-being of their children.
Data collected from the surveys were analyzed to gather descriptive information about
the research questions. The survey instrument was designed to analyze data using statistical
analysis software (Statistical Package for the Social Sciences, referred to as SPSS version 11.0,
2000).
In grouping some of the survey instrument questions, child well-being (1) was: Does your
child suffer from any known chronic illness to date? Since question 46 of the survey instrument
did not specify whether or not the chronic disease was congenital or developed later on, it was
been considered as additional findings.
Child well-being (2) was: How many sick days did your child use so far this school year?
Child well-being (4) was: Is your child at a healthy weight according to his/her
height/weight ratio?
Primary caregivers’ health knowledge questions were grouped as questions: 5, 7, 9, 12,
13, 16, 18, 20.
83

Primary caregivers’ health practice questions were grouped as questions: 14, 17, 22, 23,
35.
Another grouping of questions dealt with child health practices some 13 questions of the
survey instrument, being questions numbers: 6, 8, 10, 15, 19, 26, 27, 28, 29, 31, 32, 33, 34.
Summary of the Findings
1. What trends in the parent responses may be identified by the descriptive statistics?
It can be concluded that children’s actual nutritional practices are correlated to the PCs
understanding of what is required for them. Primary caregivers in general were knowledgeable
about health and fitness. However, primary caregivers’ practices may not be consistent with their
desire to be healthy or beliefs of how to be healthy. 99% of PCs were concerned about their
children’s health, but only 81% of PCs thought their children were healthy. This might be due to
the fact that PCs may not have enough knowledge to know what is good and what is bad for their
children. A high percentage of PCs reported they were knowledgeable, but at the same time the
choices they made in some of the questions indicated they did not have as much knowledge as
they thought they had. There were other factors that influenced children well-being, such as, the
amount of physical activity per week (76% of children who engaged in physical activity were at
a healthy weight). It is curious to note that children that had a primary caregiver who had an
unhealthy weight, had an unhealthy weight themselves. This phenomenon can be due to poor
primary caregiver example and poor primary caregiver knowledge. In addition, too much fast
food was consumed by primary caregivers and children in general, and although primary
84

caregivers indicated that children “should” have more servings of fruits and vegetables and eat
more home-cooked meals, it was not being done.
2. To what degree do primary caregivers’ health knowledge, primary caregivers’ health practices
and child’s health practices affect the child’s weight status (well-being) as reported by the
primary caregivers?
Primary caregivers, who correctly identified among 13 questions of child practices the
preferred choices, were more likely to report their child to be at a healthy weight. It can be
concluded that those primary caregivers who are better informed of preferred health practices
and have greater knowledge of nutrition among other things are more likely to have children that
will be healthy.
3. To what degree do primary caregivers’ health knowledge, primary caregivers’ health practices
and child’s health practices affect the child’s number of sick days taken from school as reported
by the primary caregivers?
None of the three factors influence the number of sick days taken from elementary school
by the children (there are no short-term effects notable, based on primary caregivers’
perceptions). However, further study of this group (longitudinal study) would be needed to
further clarify. There could be a possibility that over time, there might be a relationship of these
above-mentioned factors and the number of sick days taken from the elementary school by the
children.
85

Implications and Recommendations
Eating healthy is not at all inexpensive. In fact, it is very costly indeed. On very few
occasions healthy foods are on sale in supermarkets. Fresh fruits and vegetables in the United
States are expensive. Could this be because fewer individuals eat healthy, and thus, there is less
demand for healthy foods, resulting in higher prices in healthy foods and cheaper prices for
unhealthy items in the store? Or is it because food companies prefer to put fewer healthy foods
on sale to increase the volume of sales and increase profits? Could it be that certain foods are
made addictive (through the use of large amounts of sugar or other addictive substances), or
make us hungrier to increase sales? Why is it that to find a healthy product, one must look on the
bottom shelf in the supermarket, and not at eye-level? Asking a store attendant for something
like: “wheat germ,” and where it is located in the supermarket, might bring answers like: “I don’t
think we carry that. What is it anyway?”
As it can be seen from the results of this study and the literature, too much fast food is
consumed in the United States. Unfortunately, lower economic classes fall victims of fast food
and all because of not being able to afford better foods. Fast food is marketed as being so
convenient, cheap and fun to eat. Children and adults alike are fooled into thinking that a
hamburger or a shake might be healthy, or that even if it is not healthy it is alright to indulge
oneself once in a while. However, habits are made very easily; and, habits are harder to break
than to make them.
Some families are at a disadvantage, because of their social status. In other words, they
cannot afford the expensive bills associated with eating healthy. But should this be the case?
Should lower economic classes especially be victims to poor quality foods? The bottom line is
86
that children and primary caregivers that cannot afford healthy foods should not be forced to buy
unhealthy, non-wholesome and high caloric foods, just because of the scarcity of affordable food
that is wholesome and healthy.
In order for there to be an improvement to children’s overall health and well being there
must be focus on primary caregivers’ level of health knowledge and health practices through
better PC education. It is the responsibility of not only the PC, but, also, the schools, healthcare
providers, and the community to help bring about better health programs, along with better
nutrition and physical education activities to promote better health outcomes. More research and
studies should be performed in this area.
The results of this research provided important insight as to the need of health education
for PCs and for children themselves, in order to improve the overall elementary school children’s
health, beginning at a very young age. This study also provided tools to better assess health
issues, related to children in elementary school and aid in preventing unhealthy practices, which
are commonplace in modern society today.
The U.S. healthcare system should attempt to better educate the public. Individuals
should be able to access information, get health services, communicate with healthcare
professionals about their illness, understand treatment options, and follow through on treatment
plans. The data from this study could help to justify the need to carry on more financial aid for
health education programs in schools and to give parenting courses under the direction of the
Department of Health and the Board of Education through adult education and the like to all
primary caregivers. In addition, since healthcare organizations need specific information
regarding effectiveness before funding is provided, the information gained from the data
collected in this dissertation may justify further funding.
87

How do we achieve our goals? How do we get healthier and get to a healthy weight? Is it
a matter of dieting, going on and off diets? Is it a matter of cutting back on or eliminating
desserts and snacks? What about food preparation times? Why cannot there be a convenient
food, which is healthy and also can save time and is easy to prepare? Why may primary
caregivers say their children’s weight is fine and studies show it is not? Is it because primary
caregivers are in denial? Is admitting to the fact that their children are overweight too obvious a
flaw in their parenting skills? These are some of the many questions, which have been
formulated throughout the study. The answers have also been discussed. There are a lot more
questions and the answers are ready to be discovered. It is the right time to wake up the curiosity
of all the primary caregivers to seek out the answer and not wait, with the hopes for a miracle to
come along.
Why should we care so much? We should care so much, because if childhood obesity
continues to increase, it will cut three to six years off the average lifespan. Our current
generation of children could become the first in American history to live shorter lives than their
parents.
There is one company of children’s characters which recently launched a new line of
items, designed to be healthier for kids. This is definitely a step in the right direction, because
children are so influenced by who is on the packaging and what their peers will say about what
they are eating at lunch, or any meal for that matter.
We need to encourage the entire restaurant industry and the food industry, especially fast
food restaurants, to offer healthier children’s menus and we need to send a powerful message
stating we will not have unhealthy foods or substances. By serving more fruits and vegetables
and whole grains, these restaurants could be a great influence in reversing the unhealthy living of
88

children. School-based efforts to educate children about healthy eating, increase physical
education, improve the quality of cafeteria food and either do away with vending machines or fill
them with more nutritious snacks are common goals.
We inherit from our parents not only genes, but, also, many of our lifestyle choices.
Teach children good health habits early. What they eat now can influence their well-being in the
not so distant future. Better fitness can be maintained by taking a 10 minute walk with your
child, finding out what is going on, listening to what your child says, spending time doing an
activity together, because relationships are our greatest motivators. Lose weight together.
However, nothing should be done in excess. Even over-exercising can bring about things such as
dehydration, anorexia or bulimia, which can also endanger well-being and lead to severe
consequences.
Communication is a key tool to elicit cooperation among individuals. Knowing how to
talk with our children, sharing ideas and expressing feelings are ways to fundamentally influence
their behavior. A good way to share ideas is through visual aids (for example a copy of the food
pyramid can be posted on the refrigerator or an exercise schedule for that matter).
Since I have a medical background and deal with family practice, it is with insight I
recommend a new path to follow. It does not matter, who is right and who is wrong; it does not
matter what we think may be alright, if the results show differently. We must humble ourselves
and seek that new path to better health knowledge and practices for ourselves and for our
children. Sometimes, it is not an extra donut or a piece of brownie that will show love, but, rather
a sensible sharing of good health tips and practices. Maybe, the best advice is not, you are what
you eat, but, rather, you are what you do not eat!
89
This dissertation will help to assist teachers as it provides information regarding the level
of improvement needed in health policies. This study showed how important PCs’ health
knowledge is. The results of this study demonstrated the need for continuing education. This
research opens up new questions regarding the importance of a joint effort in solving the health
issues of children in our community.
Some recommendations for future research are: seeing that research stimulates, at times,
more questions than answers, it is, therefore, evident, that other possible studies could develop
from this study. If a second study were to be done, there could be one-on-one interviews with the
primary caregivers; there could be clinical physical exams done; there could be investigation into
medical records of both primary caregivers and children. Different populations could be studied
to see if similar results are found. Interviews with children and PCs could reveal more accurate
responses and lead to different perspectives. Clinical studies would also prove fruitful. Health
education should not be a luxury in our society; it is a matter of teaching through good clear
interaction, in the form of parenting classes and community symposiums and health fairs. With
reflection, empathy and an arsenal of teaching strategies for primary caregivers, children, and
educators, there can be a win-win situation for all.
If I were to write a prescription for primary caregivers, what would the prescription read?
First off, the name of the patient would be primary caregiver, however, children, relatives,
friends, schools, and the community would be nearly as responsible for filling the prescription.
Since there are many items, each one would be written on a separate line, although it is
understood, each one is as important as the others to take every day for life. It must not be taken
only for a short period and later forgotten in the back of some dresser drawer or dark closet.
Refills are easy to come by; all that is needed is to ask. First off on the prescription is a multi-
90

vitamin a day, just to be on the safe side; then, 8 hours of sleep a night; three balanced meals
with the required amounts of food from each food group on the FDA food pyramid; 6-8 glasses
of water a day; 30 minutes of moderate exercise daily; lots of family fun activities, as often as
you can; limited time with video games and T.V. watching; good tooth brushing, equal to as
many meals and snacks you eat in a day; sweets should be limited to no more than three times a
week; bathe frequently and wear clean clothes; change bed linen twice a week; keep track of
each other; go to the clinic, when you need to; keep your vaccines up-to-date; make the right
choices, what is better for you and for your health and well-being. There you go, there you have
it! Signed, Dr. S., your faithful practitioner. Prescription and examination complete. Number of
refills: infinite.
Maybe, instead of watching “the game” together or “going to the movies” together,
people should start going to “the park” together more for a walk or maybe going to “the gym” or
how about “the beach.” We, as a society, are too sedentary and all we have to do is get off of our
chair and move. Whatever the path we take, as a family, we should take it together and make
sure we all arrive at the same spot, a stop at the right spot, that is, a life of better health and well-
being.
91

APPENDIX A PROTOCOL
92
Protocol for Teachers in Distributing Health Questionnaire
Introduction: Thank you for helping me and the University of Central Florida,
College of Education, with this important study regarding the
health and fitness levels, and primary caregivers’ health knowledge
and practices for themselves and for their children.
Special
Instructions: Distribute the questionnaire and collect them as soon as you
receive them. Distribute these health and fitness questionnaires
according to the ages on the envelopes to a selection of your
students of that age to be sent home to their primary caregivers
participating in the study.
Have the children return the completed questionnaires to the
school main office within 2 weeks.
If after a few days there are some who have not returned the
questionnaire, please hand out the reminder letters to those
participants. I have also included some extra copies for those who
might need one.
Please contact me at the contact information provided as to the
progress of the return of the completed questionnaires. It would be
most appreciated if the completed questionnaires could be all
gathered together in their corresponding age envelopes by Monday
April 3rd in the main office of your school to be picked up at a later
date.
93

APPENDIX B VERBAL CONSENT FORM
94

Dear Primary Caregiver, Hello. My name is Susan Stuib and I am a doctoral candidate in the College of Education at the University of Central Florida (UCF). You are among other participants who have been selected to participate in this anonymous questionnaire about your health and your child’s health. There are no risks or benefits to participants. Your participation and honest answers are crucial for assessing health issues in Central Florida. This questionnaire is completely voluntary. You may choose not to participate or not to answer any specific questions. You may skip any question you are not comfortable answering. You must be 18 years old or older to complete this questionnaire and be a primary caregiver of a child in elementary school, ages 5-10. You can be assured that your responses will never be matched with your name, since there is no identifying information asked in the questionnaire. The information will be used for this study only. Please answer questions honestly. This questionnaire will take about 10 minutes or less to complete. Thank you for taking the time and thought to complete this questionnaire. We sincerely appreciate your participation. Your time and effort in helping us gather information is greatly appreciated and will ultimately help professionals in higher education and in health. If you have any questions about this questionnaire or this study please contact Dr. Stephen A. Sivo at: (407) 823-4147. If you have any questions about research participants’ rights, you may contact the UCF Institutional Review Board at: (407) 823-2901. You can also reach the UCF Institutional Review Board by mail at: Office of Research and Commercialization 12443 Research Pkwy, Suite 302, Orlando Tech Center, Orlando, FL 32826-3252. Thank you again. Sincerely, Susan Stuib, MSN, FNP
95

APPENDIX C COVER LETTER
96

March 6th, 2006 Dear Principal, Let me introduce myself. I am Susan Stuib, Doctoral Candidate from UCF. I am doing my dissertation about health attitudes, knowledge and literacy of primary caregivers with Elementary School children. As part of my research, I have designed a questionnaire for the primary caregivers of Elementary School children. I would like your school to participate in this study. All the staff would need to do is distribute the questionnaires to the primary caregivers of the students via the Thursday folder or something similar and then collect the questionnaires once they are returned. After this I would personally come to pick up the questionnaires at the school. No names are to be collected or put on the questionnaire, since they are to be completely anonymous. All data collected will be confidential and kept in a locked cabinet. This questionnaire has already IRB approval from the UCF Institutional Review Board. The purpose of this study is to investigate elementary school children’s health and the knowledge primary caregivers have about health issues relating to their children. Enclosed find a copy of the questionnaire to be used and the cover letter that will be given to the primary caregivers along with it. Please contact me by e-mail at: [email protected] as soon as possible to give your consent for participating in this study. Thank you. Once you consent, I will deliver copies of these questionnaires and cover letters to be distributed at your school. Sincerely, Susan Stuib Doctoral Candidate
97

APPENDIX D SURVEY INSTRUMENT
98

WHAT DO YOU THINK YOUR CHILD’S HEALTH IS LIKE?
Susan Stuib
A. Knowledge and Literacy of health and fitness
START HERE (Please circle your answer for each question) 1. Do you consider yourself to be knowledgeable about health and fitness?
a. Highly knowledgeable b. Knowledgeable c. Somewhat knowledgeable d. Not knowledgeable
2. How often do you talk to your child about his/her health? a. Very often b. Often c. Seldom d. Never
3. Do you know about Healthy Smart Choice school lunches? a. Yes b. No
4. Do you have a menu of the school lunches that your child is given at school? a. Yes b. No
5. In your opinion, how many servings of fruit and vegetables does your child need to have a day?
a. 0 b. 1-2 c. 3-5 d. More than 5
6. How many servings of fruit and vegetables does your child have a day? a. 0 b. 1-2 c. 3-5 d. More than 5
7. In your opinion, how many servings of dairy products does your child need to have a day?
a. 0 b. 1-2 c. 3-5 d. More than 5
Please Continue on Next Page
99
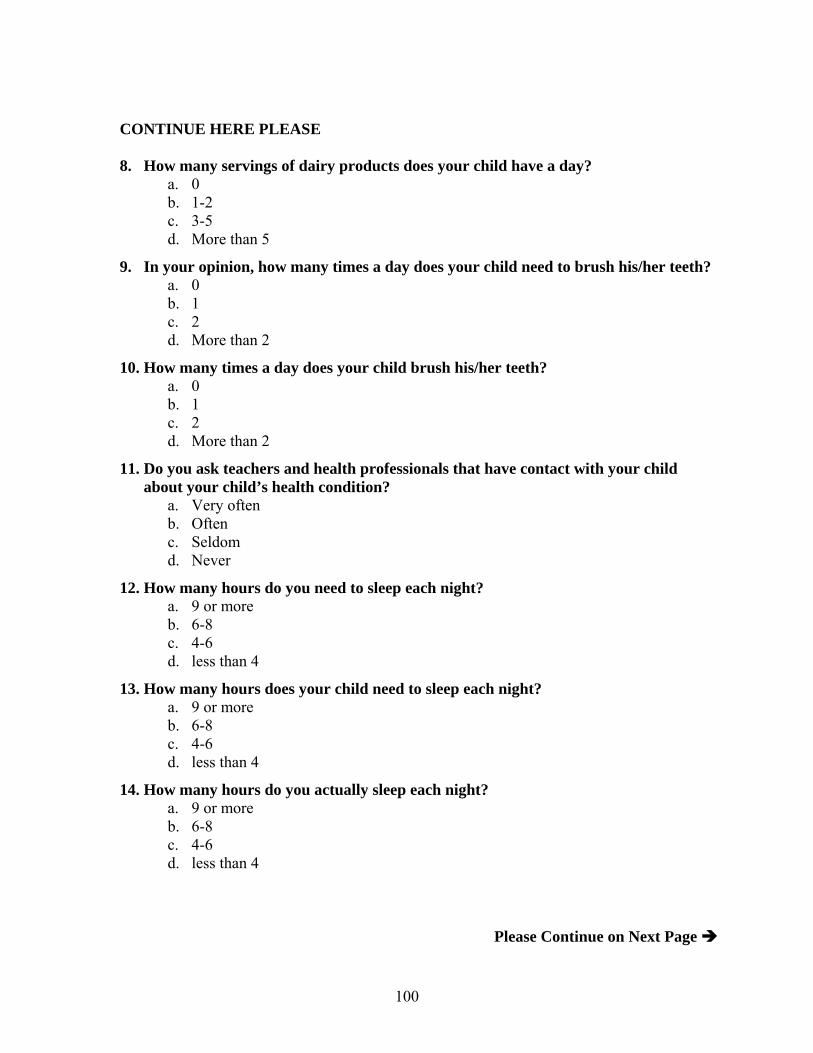
CONTINUE HERE PLEASE 8. How many servings of dairy products does your child have a day?
a. 0 b. 1-2 c. 3-5 d. More than 5
9. In your opinion, how many times a day does your child need to brush his/her teeth? a. 0 b. 1 c. 2 d. More than 2
10. How many times a day does your child brush his/her teeth? a. 0 b. 1 c. 2 d. More than 2
11. Do you ask teachers and health professionals that have contact with your child about your child’s health condition?
a. Very often b. Often c. Seldom d. Never
12. How many hours do you need to sleep each night? a. 9 or more b. 6-8 c. 4-6 d. less than 4
13. How many hours does your child need to sleep each night? a. 9 or more b. 6-8 c. 4-6 d. less than 4
14. How many hours do you actually sleep each night? a. 9 or more b. 6-8 c. 4-6 d. less than 4
Please Continue on Next Page
100

CONTINUE HERE PLEASE 15. How many hours does your child actually sleep each night?
a. 9 or more b. 6-8 c. 4-6 d. less than 4
16. How many snacks do you need to eat each day? a. 4 or more b. 2-3 c. 1-2 d. none
17. How many snacks do you eat each day? a. 4 or more b. 2-3 c. 1-2 d. none
18. How many snacks does your child need to eat each day? a. 4 or more b. 2-3 c. 1-2 d. none
19. How many snacks does your child eat each day? a. 4 or more b. 2-3 c. 1-2 d. none
20. How often does a primary caregiver need to discuss health issues, such as drug and alcohol abuse and sexual problems with their children?
a. Very often b. Often c. Seldom d. Never
21. How much time do you spend with your child? a. Very Much b. Quite a lot c. Little d. None
Please Continue on Next Page
101

CONTINUE HERE PLEASE
B. Practice of health and fitness 22. How often do you as a primary caregiver go for medical check-ups?
a. Very often b. Often c. Seldom d. Never
23. How many times a week do you engage in physical activity? a. 0 b. 1-2 c. 3-5 d. More than 5
24. How often do you speak to your child about health issues?
a. Very often b. Often c. Seldom d. Never
25. During the time you spend with your child, do you realize what his/her health is? a. Yes b. No
26. If you find any health issues with your child, do you promptly take your child for a health check up?
a. Yes b. No
27. How often do you take your child to the doctor? a. Very often b. Often c. Seldom d. Never
28. How often do you take your child to the dentist? a. Very often b. Often c. Seldom d. Never
29. Does your child wash his/her hands before eating? a. Yes b. No
Please Continue on Next Page
102

CONTINUE HERE PLEASE 30. Does your child participate in the free or reduced lunch program at school?
a. Yes b. No c. Brings lunch from home d. Does not eat lunch
31. How many times a week does your child eat fast food? a. 0 b. 1-2 c. 3-5 d. More than 5
32. How many times a week does your child eat home-cooked meals? a. 0 b. 1-2 c. 3-5 d. More than 5
33. How many days does your child participate in Physical Education and/or extra-curricular sport activities per week?
a. 0 days b. 1-2 days c. 3-5 days d. More than 5 days
34. How many hours combined between television, computer and/or videogames does your child spend a day?
a. 0-2 hours b. 3-5 hours c. More than 5
35. How many hours combined between television, computer and/or videogames do you spend a day?
a. 0-2 hours b. 3-5 hours c. More than 5
C. Attitudes of health and fitness
36. Would you consider yourself interested in your health? a. Yes b. No
37. Would you consider yourself interested in your child’s health? a. Yes b. No
Please Continue on Next Page
103
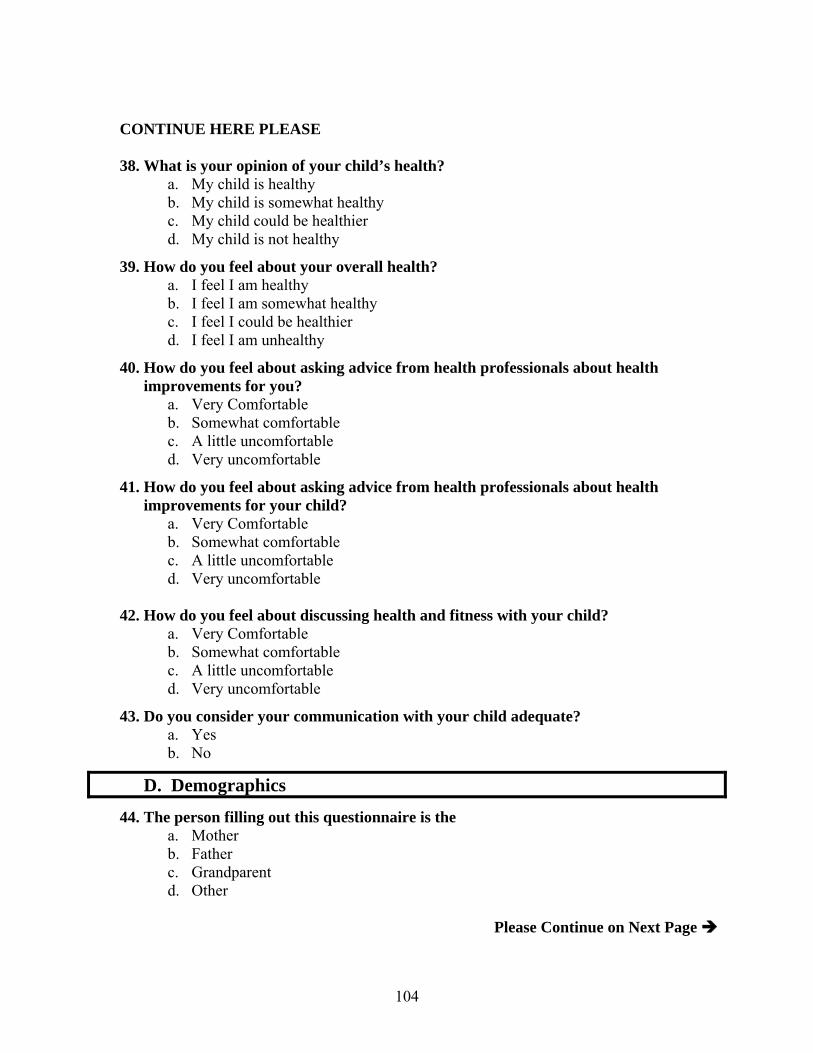
CONTINUE HERE PLEASE 38. What is your opinion of your child’s health?
a. My child is healthy b. My child is somewhat healthy c. My child could be healthier d. My child is not healthy
39. How do you feel about your overall health? a. I feel I am healthy b. I feel I am somewhat healthy c. I feel I could be healthier d. I feel I am unhealthy
40. How do you feel about asking advice from health professionals about health improvements for you?
a. Very Comfortable b. Somewhat comfortable c. A little uncomfortable d. Very uncomfortable
41. How do you feel about asking advice from health professionals about health improvements for your child?
a. Very Comfortable b. Somewhat comfortable c. A little uncomfortable d. Very uncomfortable
42. How do you feel about discussing health and fitness with your child? a. Very Comfortable b. Somewhat comfortable c. A little uncomfortable d. Very uncomfortable
43. Do you consider your communication with your child adequate? a. Yes b. No
D. Demographics
44. The person filling out this questionnaire is the a. Mother b. Father c. Grandparent d. Other
Please Continue on Next Page
104

CONTINUE HERE PLEASE 45. What is your age?
a. 18-25 b. 26-32 c. 33-40 d. Over 40
46. Does your child suffer from any known chronic illness to date? a. Yes b. No
47. What is your child’s age? a. 5 years old b. 6 years old c. 7 years old d. 8 years old e. 9 years old f. 10 years old
48. How many sick days did your child use so far this school year? a. 0-2 days b. 3-5 days c. 6-10 days d. More than 10 days
49. Have all your child’s immunizations been given on time? a. Yes b. No
50. Are you at a healthy weight according to your height/weight ratio? a. Yes b. No c. I don’t know
51. Is your child at a healthy weight according to his/her height/weight ratio? a. Yes b. No c. I don’t know
Thank you for completing my questionnaire!
105

APPENDIX E INSTITUTIONAL REVIEW BOARD APPROVAL
106
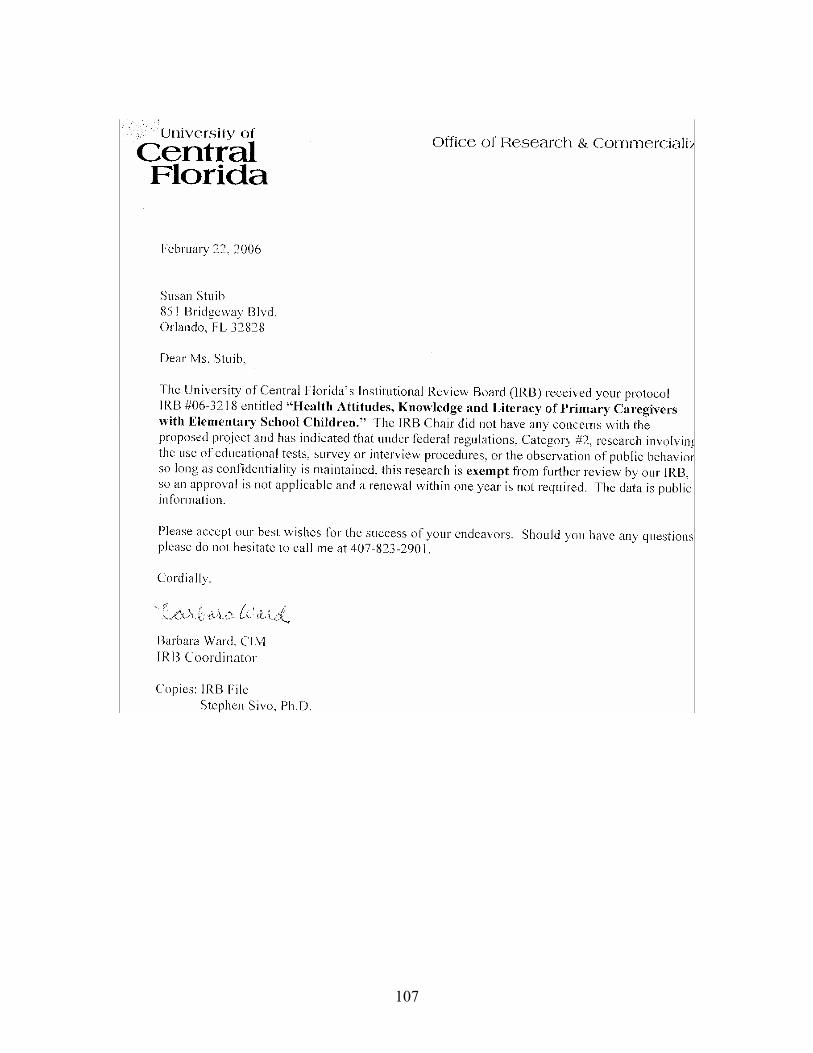
107

108
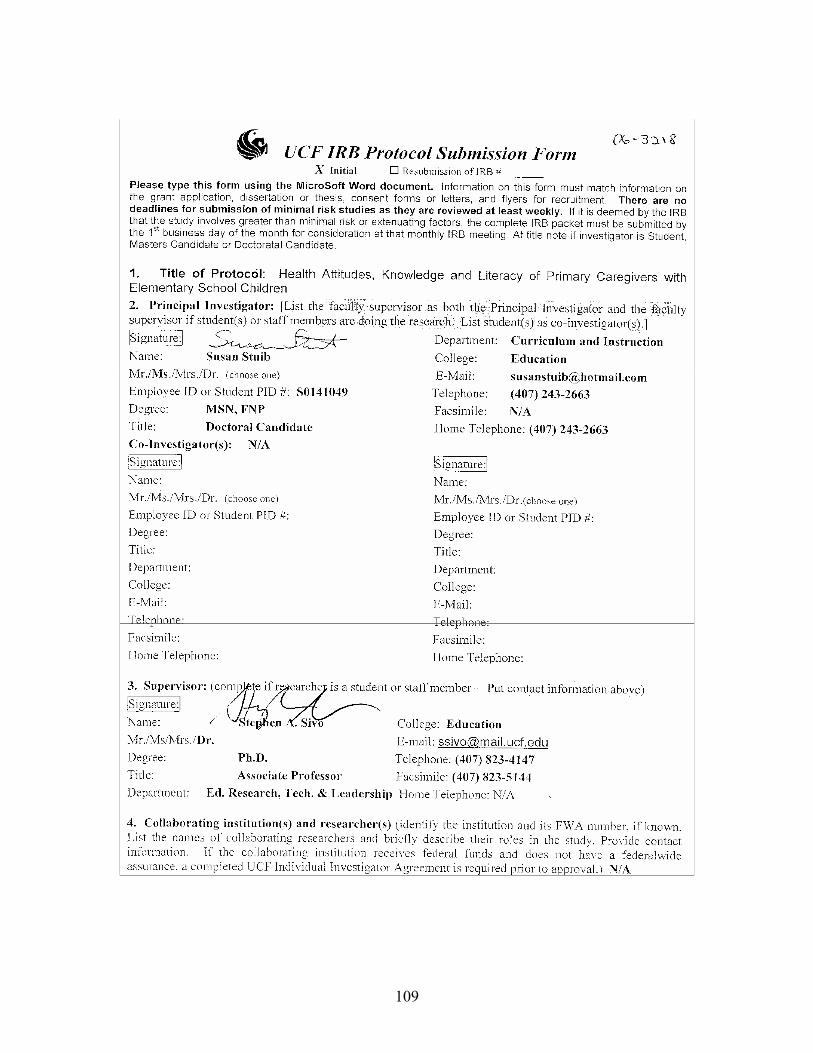
109

110
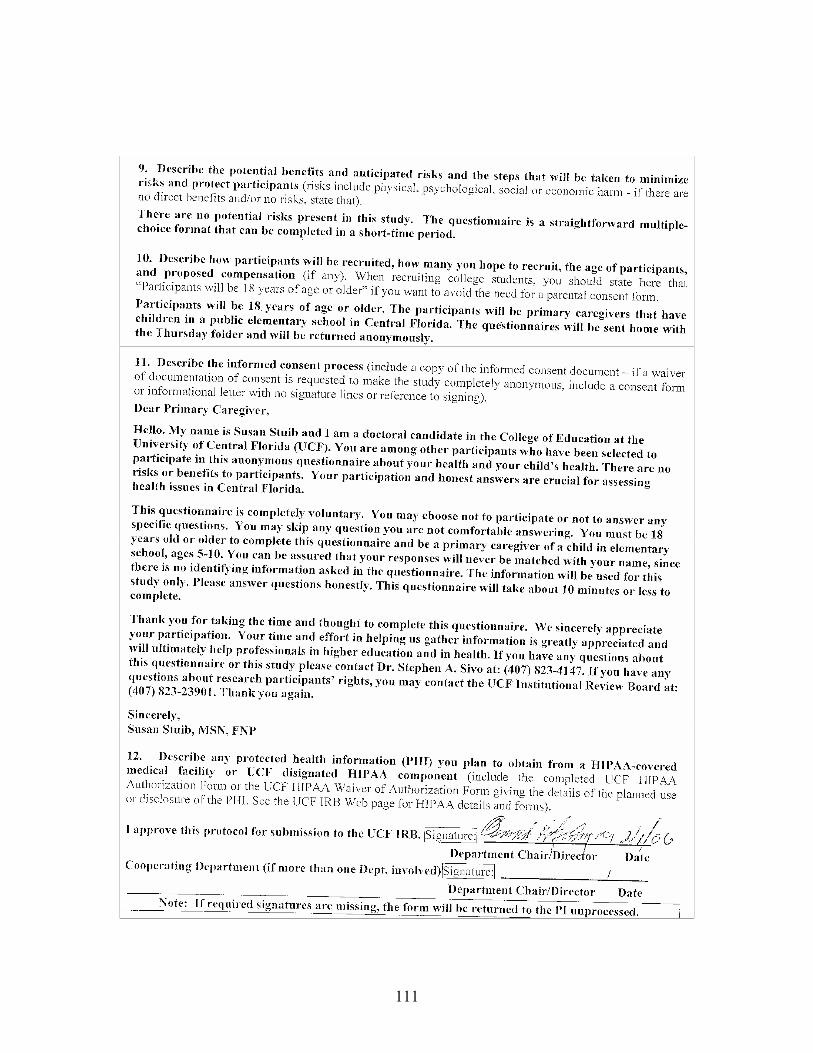
111
112

APPENDIX F FREQUENCY TABLES BASED ON RESPONSES
113
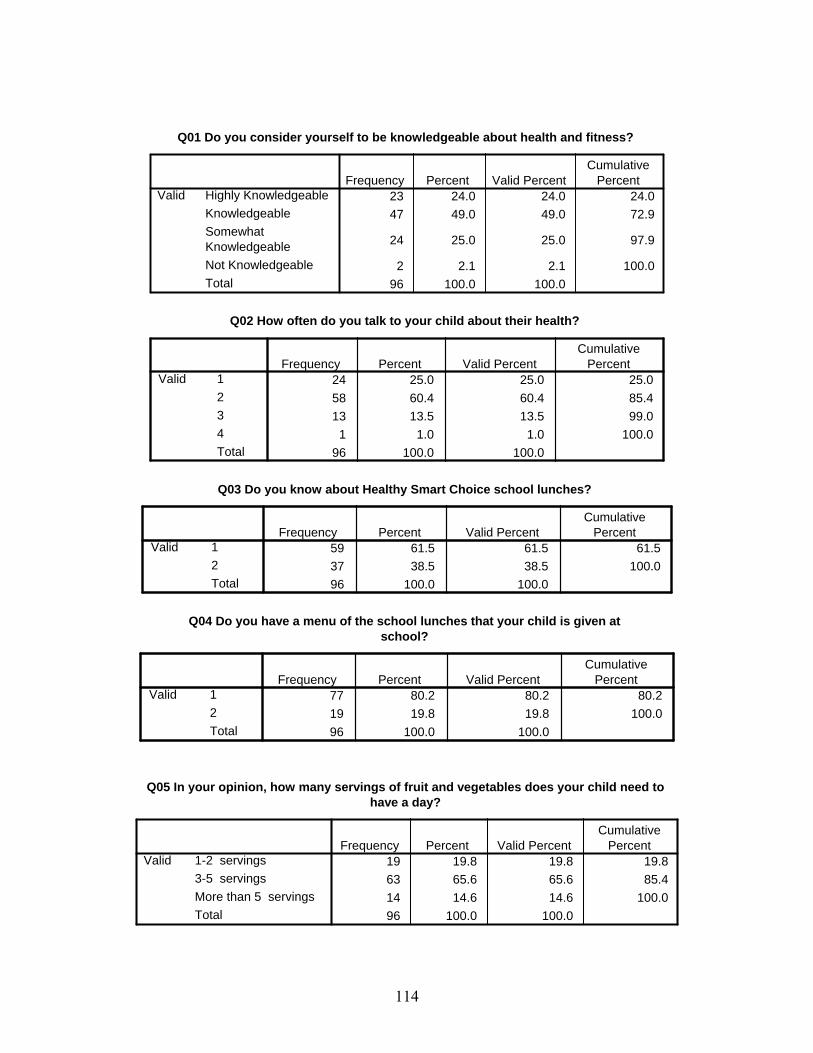
Q01 Do you consider yourself to be knowledgeable about health and fitness?
23 24.0 24.0 24.047 49.0 49.0 72.9
24 25.0 25.0 97.9
2 2.1 2.1 100.096 100.0 100.0
Highly KnowledgeableKnowledgeableSomewhatKnowledgeableNot KnowledgeableTotal
ValidFrequency Percent Valid Percent
CumulativePercent
Q02 How often do you talk to your child about their health?
24 25.0 25.0 25.058 60.4 60.4 85.413 13.5 13.5 99.0
1 1.0 1.0 100.096 100.0 100.0
1234Total
ValidFrequency Percent Valid Percent
CumulativePercent
Q03 Do you know about Healthy Smart Choice school lunches?
59 61.5 61.5 61.537 38.5 38.5 100.096 100.0 100.0
12Total
ValidFrequency Percent Valid Percent
CumulativePercent
Q04 Do you have a menu of the school lunches that your child is given at
school?
77 80.2 80.2 80.219 19.8 19.8 100.096 100.0 100.0
12Total
ValidFrequency Percent Valid Percent
CumulativePercent
Q05 In your opinion, how many servings of fruit and vegetables does your child need tohave a day?
19 19.8 19.8 19.863 65.6 65.6 85.414 14.6 14.6 100.096 100.0 100.0
1-2 servings3-5 servingsMore than 5 servingsTotal
ValidFrequency Percent Valid Percent
CumulativePercent
114

Q06 How many servings of fruit and vegetables does your child have a day?
1 1.0 1.0 1.052 54.2 54.2 55.238 39.6 39.6 94.8
5 5.2 5.2 100.096 100.0 100.0
0 servings1-2 servings3-5 servingsMore than 5 servingsTotal
ValidFrequency Percent Valid Percent
CumulativePercent
Q07 In your opinion, how many servings of dairy products does your child need to have
a day?
1 1.0 1.0 1.041 42.7 42.7 43.851 53.1 53.1 96.9
3 3.1 3.1 100.096 100.0 100.0
0 servings1-2 servings3-5 servingsMore than 5 servingsTotal
ValidFrequency Percent Valid Percent
CumulativePercent
Q08 How many servings of dairy products does your child have a day?
3 3.1 3.1 3.147 49.0 49.0 52.145 46.9 46.9 99.0
1 1.0 1.0 100.096 100.0 100.0
0 servings1-2 servings3-5 servingsMore than 5 servingsTotal
ValidFrequency Percent Valid Percent
CumulativePercent
Q09 In your opinion, how many times a day does your child need to
brush his/her teeth?
5 5.2 5.2 5.248 50.0 50.0 55.243 44.8 44.8 100.096 100.0 100.0
234Total
ValidFrequency Percent Valid Percent
CumulativePercent
Q10 How many times a day does your child brush his/her teeth?
19 19.8 19.8 19.869 71.9 71.9 91.7
8 8.3 8.3 100.096 100.0 100.0
234Total
ValidFrequency Percent Valid Percent
CumulativePercent
115

Q11 Do you ask teachers and health professionals that have contact
with your child about your child's health condition?
9 9.4 9.4 9.435 36.5 36.5 45.838 39.6 39.6 85.414 14.6 14.6 100.096 100.0 100.0
1234Total
ValidFrequency Percent Valid Percent
CumulativePercent
Q12 How many hours do you need to sleep each night?
13 13.5 13.5 13.579 82.3 82.3 95.8
4 4.2 4.2 100.096 100.0 100.0
123Total
ValidFrequency Percent Valid Percent
CumulativePercent
Q13 How many hours does your child need to sleep each night?
66 68.8 68.8 68.829 30.2 30.2 99.0
1 1.0 1.0 100.096 100.0 100.0
123Total
ValidFrequency Percent Valid Percent
CumulativePercent
Q14 How many hours do you actually sleep each night?
14 14.6 14.6 14.662 64.6 64.6 79.219 19.8 19.8 99.0
1 1.0 1.0 100.096 100.0 100.0
1.02.03.04.0Total
ValidFrequency Percent Valid Percent
CumulativePercent
Q15 How many hours does your child actually sleep each night?
62 64.6 64.6 64.631 32.3 32.3 96.9
3 3.1 3.1 100.096 100.0 100.0
123Total
ValidFrequency Percent Valid Percent
CumulativePercent
116
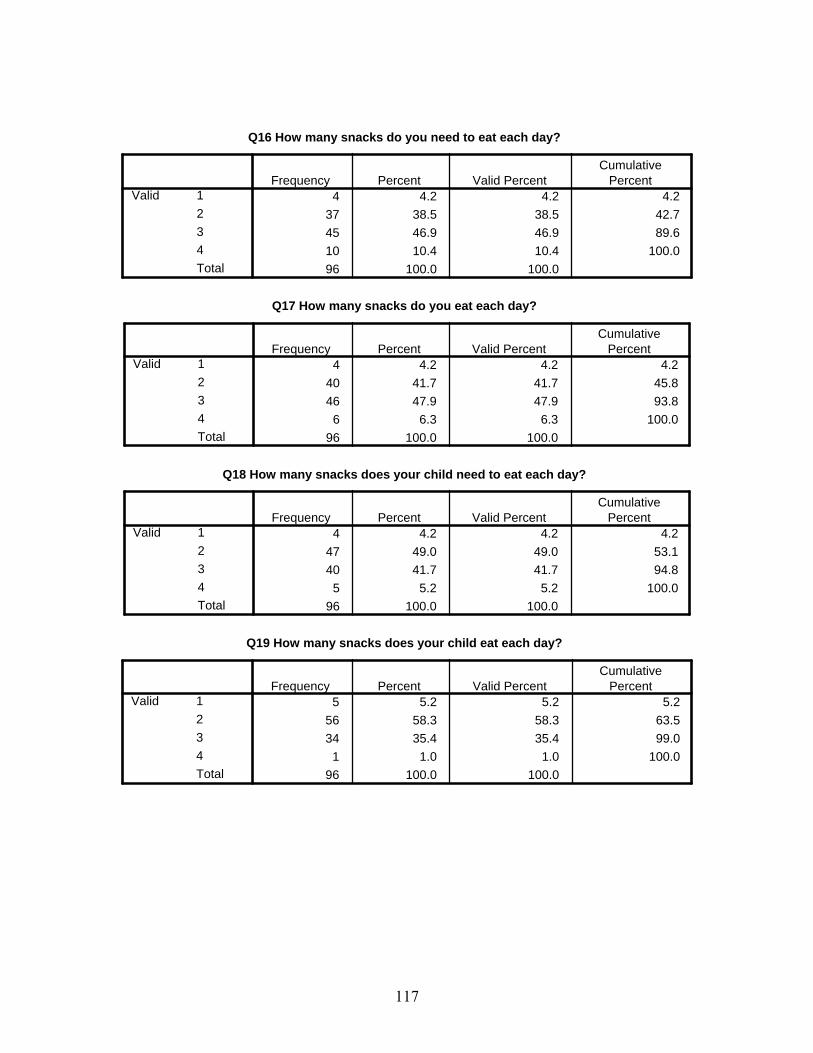
Q16 How many snacks do you need to eat each day?
4 4.2 4.2 4.237 38.5 38.5 42.745 46.9 46.9 89.610 10.4 10.4 100.096 100.0 100.0
1234Total
ValidFrequency Percent Valid Percent
CumulativePercent
Q17 How many snacks do you eat each day?
4 4.2 4.2 4.240 41.7 41.7 45.846 47.9 47.9 93.8
6 6.3 6.3 100.096 100.0 100.0
1234Total
ValidFrequency Percent Valid Percent
CumulativePercent
Q18 How many snacks does your child need to eat each day?
4 4.2 4.2 4.247 49.0 49.0 53.140 41.7 41.7 94.8
5 5.2 5.2 100.096 100.0 100.0
1234Total
ValidFrequency Percent Valid Percent
CumulativePercent
Q19 How many snacks does your child eat each day?
5 5.2 5.2 5.256 58.3 58.3 63.534 35.4 35.4 99.0
1 1.0 1.0 100.096 100.0 100.0
1234Total
ValidFrequency Percent Valid Percent
CumulativePercent
117

Q20 How often does a primary caregiver need to discuss health issues,such as drug and alcohol abuse and sexual problems with their
children?
32 33.3 33.3 33.347 49.0 49.0 82.311 11.5 11.5 93.8
6 6.3 6.3 100.096 100.0 100.0
1234Total
ValidFrequency Percent Valid Percent
CumulativePercent
Q21 How much time do you spend with your child?
52 54.2 54.7 54.735 36.5 36.8 91.6
8 8.3 8.4 100.095 99.0 100.0
1 1.096 100.0
123Total
Valid
SystemMissingTotal
Frequency Percent Valid PercentCumulative
Percent
Q22 How often do you as a primary caregiver go for medical
check-ups?
18 18.8 18.8 18.845 46.9 46.9 65.633 34.4 34.4 100.096 100.0 100.0
123Total
ValidFrequency Percent Valid Percent
CumulativePercent
Q23 How many times a week do you engage in physical activity?
9 9.4 9.4 9.434 35.4 35.4 44.841 42.7 42.7 87.512 12.5 12.5 100.096 100.0 100.0
0 times1-2 times3-5 timesMore than 5 timesTotal
ValidFrequency Percent Valid Percent
CumulativePercent
118

Q24 How often do you speak to your child about health issues?
22 22.9 22.9 22.946 47.9 47.9 70.825 26.0 26.0 96.9
3 3.1 3.1 100.096 100.0 100.0
1234Total
ValidFrequency Percent Valid Percent
CumulativePercent
Q25 During the time you spend with your child, do you realize what
his/her health is?
92 95.8 95.8 95.84 4.2 4.2 100.0
96 100.0 100.0
12Total
ValidFrequency Percent Valid Percent
CumulativePercent
Q26 If you find any health issues with your child, do you promptly take
your child for a health check up?
90 93.8 93.8 93.86 6.3 6.3 100.0
96 100.0 100.0
12Total
ValidFrequency Percent Valid Percent
CumulativePercent
Q27 How often do you take your child to the doctor?
8 8.3 8.3 8.339 40.6 40.6 49.049 51.0 51.0 100.096 100.0 100.0
123Total
ValidFrequency Percent Valid Percent
CumulativePercent
Q28 How often do you take your child to the dentist?
9 9.4 9.4 9.460 62.5 62.5 71.923 24.0 24.0 95.8
4 4.2 4.2 100.096 100.0 100.0
1234Total
ValidFrequency Percent Valid Percent
CumulativePercent
119

Q29 Does your child wash his/her hands before eating?
84 87.5 87.5 87.511 11.5 11.5 99.0
1 1.0 1.0 100.096 100.0 100.0
123Total
ValidFrequency Percent Valid Percent
CumulativePercent
Q30 Does your child participate in the free or reduced lunch program at
school?
28 29.2 29.2 29.245 46.9 46.9 76.023 24.0 24.0 100.096 100.0 100.0
123Total
ValidFrequency Percent Valid Percent
CumulativePercent
Q31 How many times a week does your child eat fast food?
18 18.8 18.8 18.862 64.6 64.6 83.311 11.5 11.5 94.8
5 5.2 5.2 100.096 100.0 100.0
1234Total
ValidFrequency Percent Valid Percent
CumulativePercent
Q32 How many times a week does your child eat home-cooked meals?
14 14.6 14.6 14.644 45.8 45.8 60.438 39.6 39.6 100.096 100.0 100.0
234Total
ValidFrequency Percent Valid Percent
CumulativePercent
120
Q33 How many days does your child participate in Physical Educationand/or extra-curricular sport activities per week?
2 2.1 2.1 2.125 26.0 26.0 28.151 53.1 53.1 81.318 18.8 18.8 100.096 100.0 100.0
1234Total
ValidFrequency Percent Valid Percent
CumulativePercent
Q34 How many hours combined between television, computer and/or
videogames does your child spend a day?
61 63.5 63.5 63.529 30.2 30.2 93.8
6 6.3 6.3 100.096 100.0 100.0
123Total
ValidFrequency Percent Valid Percent
CumulativePercent
Q35 How many hours combined between television, computer and/or
videogames do you spend a day?
59 61.5 61.5 61.524 25.0 25.0 86.513 13.5 13.5 100.096 100.0 100.0
123Total
ValidFrequency Percent Valid Percent
CumulativePercent
Q36 Would you consider yourself interested in your health?
92 95.8 95.8 95.84 4.2 4.2 100.0
96 100.0 100.0
12Total
ValidFrequency Percent Valid Percent
CumulativePercent
Q37 Would you consider yourself interested in your child's health?
95 99.0 99.0 99.01 1.0 1.0 100.0
96 100.0 100.0
13Total
ValidFrequency Percent Valid Percent
CumulativePercent
121

Q38 What is your opinion of your child's health?
78 81.3 81.3 81.312 12.5 12.5 93.8
6 6.3 6.3 100.096 100.0 100.0
123Total
ValidFrequency Percent Valid Percent
CumulativePercent
Q39 How do you feel about your overall health?
52 54.2 54.2 54.225 26.0 26.0 80.218 18.8 18.8 99.0
1 1.0 1.0 100.096 100.0 100.0
1234Total
ValidFrequency Percent Valid Percent
CumulativePercent
Q40 How do you feel about asking advice from health professionals
about health improvements for you?
64 66.7 66.7 66.729 30.2 30.2 96.9
3 3.1 3.1 100.096 100.0 100.0
123Total
ValidFrequency Percent Valid Percent
CumulativePercent
Q41 How do you feel about asking advice from health professionals about
health improvements for your child?
78 81.3 82.1 82.117 17.7 17.9 100.095 99.0 100.0
1 1.096 100.0
12Total
Valid
SystemMissingTotal
Frequency Percent Valid PercentCumulative
Percent
122

Q42 How do you feel about discussing health and fitness with your child?
84 87.5 88.4 88.410 10.4 10.5 98.9
1 1.0 1.1 100.095 99.0 100.0
1 1.096 100.0
123Total
Valid
SystemMissingTotal
Frequency Percent Valid PercentCumulative
Percent
Q43 Do you consider your communication with your child adequate?
95 99.0 100.0 100.01 1.0
96 100.0
1ValidSystemMissing
Total
Frequency Percent Valid PercentCumulative
Percent
Q44 The person filling out this questionnaire is the
78 81.3 82.1 82.114 14.6 14.7 96.8
2 2.1 2.1 98.91 1.0 1.1 100.0
95 99.0 100.01 1.0
96 100.0
1234Total
Valid
SystemMissingTotal
Frequency Percent Valid PercentCumulative
Percent
Q45 What is your age?
4 4.2 4.2 4.222 22.9 23.2 27.446 47.9 48.4 75.823 24.0 24.2 100.095 99.0 100.0
1 1.096 100.0
1234Total
Valid
SystemMissingTotal
Frequency Percent Valid PercentCumulative
Percent
123

Q46 Does your child suffer from any known chronic illness to date?
5 5.2 5.3 5.388 91.7 92.6 97.9
1 1.0 1.1 98.91 1.0 1.1 100.0
95 99.0 100.01 1.0
96 100.0
1234Total
Valid
SystemMissingTotal
Frequency Percent Valid PercentCumulative
Percent
Q47 What is your child's age?
6 6.3 6.3 6.318 18.8 18.9 25.315 15.6 15.8 41.118 18.8 18.9 60.013 13.5 13.7 73.725 26.0 26.3 100.095 99.0 100.0
1 1.096 100.0
123456Total
Valid
SystemMissingTotal
Frequency Percent Valid PercentCumulative
Percent
Q48 How many sick days did your child use so far this school year?
55 57.3 57.9 57.933 34.4 34.7 92.6
7 7.3 7.4 100.095 99.0 100.0
1 1.096 100.0
123Total
Valid
SystemMissingTotal
Frequency Percent Valid PercentCumulative
Percent
Q49 Have all your child's immunizations been given on time?
96 100.0 100.0 100.01ValidFrequency Percent Valid Percent
CumulativePercent
124
Q50 Are you at a healthy weight according to your height/weight ratio?
56 58.3 58.3 58.337 38.5 38.5 96.9
3 3.1 3.1 100.096 100.0 100.0
123Total
ValidFrequency Percent Valid Percent
CumulativePercent
Q51 Is your child at a healthy weight according to his/her height/weight
ratio?
77 80.2 80.2 80.213 13.5 13.5 93.8
6 6.3 6.3 100.096 100.0 100.0
123Total
ValidFrequency Percent Valid Percent
CumulativePercent
125

APPENDIX G CROSSTABULATIONS OF THREE SCHOOLS
126

Q01 Do you consider yourself to be knowledgeable about health and fitness? * SCHOOL Crosstabulation
Count
14 8 1 2317 24 6 47
10 8 6 24
1 1 241 41 14 96
Highly KnowledgeableKnowledgeableSomewhatKnowledgeableNot Knowledgeable
Q01 Do you consideryourself to beknowledgeable abouthealth and fitness?
Total
WaterfordLakes
ElementaryEast Lake
ElementaryNap Ford
Elementary
SCHOOL
Total
Q02 How often do you talk to your child about their health? * SCHOOL Crosstabulation
Count
10 10 4 2425 27 6 58
6 4 3 131 1
41 41 14 96
1234
Q02 How often doyou talk to yourchild about theirhealth?
Total
WaterfordLakes
ElementaryEast Lake
ElementaryNap Ford
Elementary
SCHOOL
Total
Q03 Do you know about Healthy Smart Choice school lunches? * SCHOOL Crosstabulation
Count
27 27 5 59
14 14 9 37
41 41 14 96
1
2
Q03 Do you know aboutHealthy Smart Choiceschool lunches?Total
WaterfordLakes
ElementaryEast Lake
ElementaryNap Ford
Elementary
SCHOOL
Total
127
Q04 Do you have a menu of the school lunches that your child is given at school? *SCHOOL Crosstabulation
Count
32 32 13 77
9 9 1 19
41 41 14 96
1
2
Q04 Do you have amenu of the schoollunches that your childis given at school?Total
WaterfordLakes
ElementaryEast Lake
ElementaryNap Ford
Elementary
SCHOOL
Total
Q05 In your opinion, how many servings of fruit and vegetables does your child need to have a day? *SCHOOL Crosstabulation
Count
6 7 6 19
26 29 8 63
9 5 1441 41 14 96
1-2 servings
3-5 servings
More than 5 servings
Q05 In your opinion, howmany servings of fruit andvegetables does yourchild need to have a day?Total
WaterfordLakes
ElementaryEast Lake
ElementaryNap Ford
Elementary
SCHOOL
Total
Q06 How many servings of fruit and vegetables does your child have a day? * SCHOOL Crosstabulation
Count
1 127 20 5 5214 19 5 38
2 3 541 41 14 96
0 servings1-2 servings3-5 servingsMore than 5 servings
Q06 How many servingsof fruit and vegetablesdoes your child have aday?
Total
WaterfordLakes
ElementaryEast Lake
ElementaryNap Ford
Elementary
SCHOOL
Total
128

Q07 In your opinion, how many servings of dairy products does your child need to have a day? * SCHOOLCrosstabulation
Count
1 114 18 9 4125 21 5 51
2 1 341 41 14 96
0 servings1-2 servings3-5 servingsMore than 5 servings
Q07 In your opinion, howmany servings of dairyproducts does your childneed to have a day?
Total
WaterfordLakes
ElementaryEast Lake
ElementaryNap Ford
Elementary
SCHOOL
Total
Q08 How many servings of dairy products does your child have a day? * SCHOOL Crosstabulation
Count
1 1 1 316 24 7 4724 15 6 45
1 141 41 14 96
0 servings1-2 servings3-5 servingsMore than 5 servings
Q08 How many servingsof dairy products doesyour child have a day?
Total
WaterfordLakes
ElementaryEast Lake
ElementaryNap Ford
Elementary
SCHOOL
Total
Q09 In your opinion, how many times a day does your child need to brush his/her teeth? *
SCHOOL Crosstabulation
Count
2 3 5
22 23 3 48
17 15 11 4341 41 14 96
2
3
4
Q09 In your opinion,how many times a daydoes your child need tobrush his/her teeth?Total
WaterfordLakes
ElementaryEast Lake
ElementaryNap Ford
Elementary
SCHOOL
Total
129

Q10 How many times a day does your child brush his/her teeth? * SCHOOLCrosstabulation
Count
6 9 4 1931 28 10 69
4 4 841 41 14 96
234
Q10 How many timesa day does your childbrush his/her teeth?
Total
WaterfordLakes
ElementaryEast Lake
ElementaryNap Ford
Elementary
SCHOOL
Total
Q11 Do you ask teachers and health professionals that have contact with your child about
your child's health condition? * SCHOOL Crosstabulation
Count
1 6 2 921 8 6 3516 21 1 38
3 6 5 1441 41 14 96
1234
Q11 Do you ask teachersand health professionalsthat have contact with yourchild about your child'shealth condition?Total
WaterfordLakes
ElementaryEast Lake
ElementaryNap Ford
Elementary
SCHOOL
Total
Q12 How many hours do you need to sleep each night? * SCHOOL Crosstabulation
Count
4 7 2 1335 33 11 79
2 1 1 441 41 14 96
123
Q12 How many hoursdo you need to sleepeach night?
Total
WaterfordLakes
ElementaryEast Lake
ElementaryNap Ford
Elementary
SCHOOL
Total
130
Q13 How many hours does your child need to sleep each night? * SCHOOL Crosstabulation
Count
31 30 5 669 11 9 291 1
41 41 14 96
123
Q13 How many hoursdoes your child need tosleep each night?
Total
WaterfordLakes
ElementaryEast Lake
ElementaryNap Ford
Elementary
SCHOOL
Total
Q14 How many hours do you actually sleep each night? * SCHOOL Crosstabulation
Count
7 6 1 1429 30 3 62
5 4 10 191 1
41 41 14 96
1.02.03.04.0
Q14 How many hoursdo you actually sleepeach night?
Total
WaterfordLakes
ElementaryEast Lake
ElementaryNap Ford
Elementary
SCHOOL
Total
Q15 How many hours does your child actually sleep each night? * SCHOOL Crosstabulation
Count
27 30 5 6213 10 8 31
1 1 1 341 41 14 96
123
Q15 How many hoursdoes your child actuallysleep each night?
Total
WaterfordLakes
ElementaryEast Lake
ElementaryNap Ford
Elementary
SCHOOL
Total
131
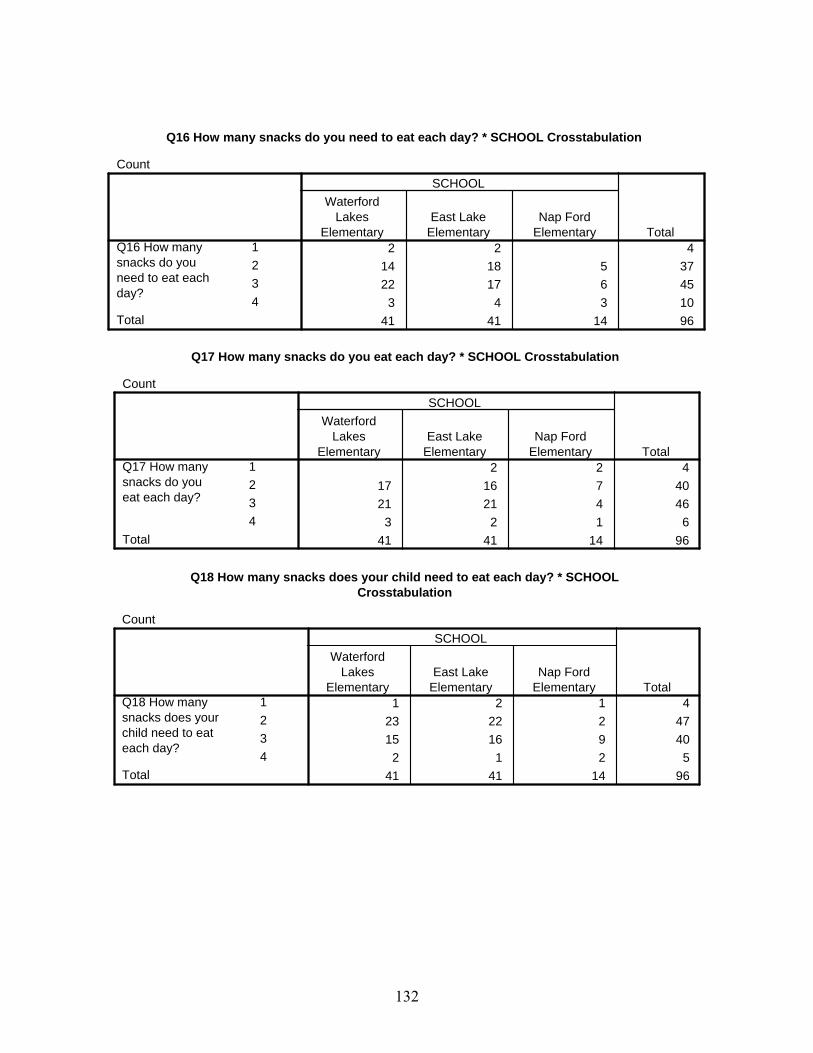
Q16 How many snacks do you need to eat each day? * SCHOOL Crosstabulation
Count
2 2 414 18 5 3722 17 6 45
3 4 3 1041 41 14 96
1234
Q16 How manysnacks do youneed to eat eachday?
Total
WaterfordLakes
ElementaryEast Lake
ElementaryNap Ford
Elementary
SCHOOL
Total
Q17 How many snacks do you eat each day? * SCHOOL Crosstabulation
Count
2 2 417 16 7 4021 21 4 46
3 2 1 641 41 14 96
1234
Q17 How manysnacks do youeat each day?
Total
WaterfordLakes
ElementaryEast Lake
ElementaryNap Ford
Elementary
SCHOOL
Total
Q18 How many snacks does your child need to eat each day? * SCHOOL
Crosstabulation
Count
1 2 1 423 22 2 4715 16 9 40
2 1 2 541 41 14 96
1234
Q18 How manysnacks does yourchild need to eateach day?
Total
WaterfordLakes
ElementaryEast Lake
ElementaryNap Ford
Elementary
SCHOOL
Total
132

Q19 How many snacks does your child eat each day? * SCHOOL Crosstabulation
Count
2 3 529 25 2 5610 13 11 34
1 141 41 14 96
1234
Q19 How manysnacks doesyour child eateach day?
Total
WaterfordLakes
ElementaryEast Lake
ElementaryNap Ford
Elementary
SCHOOL
Total
Q20 How often does a primary caregiver need to discuss health issues, such as drug and
alcohol abuse and sexual problems with their children? * SCHOOL Crosstabulation
Count
14 12 6 32
20 24 3 47
5 4 2 11
2 1 3 6
41 41 14 96
1
2
3
4
Q20 How often does aprimary caregiver needto discuss healthissues, such as drugand alcohol abuse andsexual problems withtheir children?Total
WaterfordLakes
ElementaryEast Lake
ElementaryNap Ford
Elementary
SCHOOL
Total
Q21 How much time do you spend with your child? * SCHOOL Crosstabulation
Count
25 18 9 5210 21 4 35
5 2 1 840 41 14 95
123
Q21 How much timedo you spend withyour child?
Total
WaterfordLakes
ElementaryEast Lake
ElementaryNap Ford
Elementary
SCHOOL
Total
133

Q22 How often do you as a primary caregiver go for medical check-ups? * SCHOOLCrosstabulation
Count
8 7 3 1822 19 4 4511 15 7 3341 41 14 96
123
Q22 How often do you asa primary caregiver go formedical check-ups?
Total
WaterfordLakes
ElementaryEast Lake
ElementaryNap Ford
Elementary
SCHOOL
Total
Q23 How many times a week do you engage in physical activity? * SCHOOL Crosstabulation
Count
5 2 2 915 12 7 3415 22 4 41
6 5 1 1241 41 14 96
0 times1-2 times3-5 timesMore than 5 times
Q23 How many timesa week do you engagein physical activity?
Total
WaterfordLakes
ElementaryEast Lake
ElementaryNap Ford
Elementary
SCHOOL
Total
Q24 How often do you speak to your child about health issues? * SCHOOL
Crosstabulation
Count
11 7 4 2216 25 5 4613 8 4 25
1 1 1 341 41 14 96
1234
Q24 How often doyou speak to yourchild about healthissues?
Total
WaterfordLakes
ElementaryEast Lake
ElementaryNap Ford
Elementary
SCHOOL
Total
134

Q25 During the time you spend with your child, do you realize what his/her health is? *SCHOOL Crosstabulation
Count
41 40 11 92
1 3 4
41 41 14 96
1
2
Q25 During the timeyou spend with yourchild, do you realizewhat his/her health is?Total
WaterfordLakes
ElementaryEast Lake
ElementaryNap Ford
Elementary
SCHOOL
Total
Q26 If you find any health issues with your child, do you promptly take your child for a
health check up? * SCHOOL Crosstabulation
Count
39 39 12 90
2 2 2 6
41 41 14 96
1
2
Q26 If you find anyhealth issues with yourchild, do you promptlytake your child for ahealth check up?Total
WaterfordLakes
ElementaryEast Lake
ElementaryNap Ford
Elementary
SCHOOL
Total
Q27 How often do you take your child to the doctor? * SCHOOL Crosstabulation
Count
2 3 3 817 18 4 3922 20 7 4941 41 14 96
123
Q27 How often doyou take your childto the doctor?
Total
WaterfordLakes
ElementaryEast Lake
ElementaryNap Ford
Elementary
SCHOOL
Total
135

Q28 How often do you take your child to the dentist? * SCHOOL Crosstabulation
Count
4 4 1 932 21 7 60
5 13 5 233 1 4
41 41 14 96
1234
Q28 How often doyou take your childto the dentist?
Total
WaterfordLakes
ElementaryEast Lake
ElementaryNap Ford
Elementary
SCHOOL
Total
Q29 Does your child wash his/her hands before eating? * SCHOOL Crosstabulation
Count
36 35 13 844 6 1 111 1
41 41 14 96
123
Q29 Does your childwash his/her handsbefore eating?
Total
WaterfordLakes
ElementaryEast Lake
ElementaryNap Ford
Elementary
SCHOOL
Total
Q30 Does your child participate in the free or reduced lunch program at school? *
SCHOOL Crosstabulation
Count
5 11 12 28
24 20 1 45
12 10 1 2341 41 14 96
1
2
3
Q30 Does your childparticipate in the freeor reduced lunchprogram at school?Total
WaterfordLakes
ElementaryEast Lake
ElementaryNap Ford
Elementary
SCHOOL
Total
136
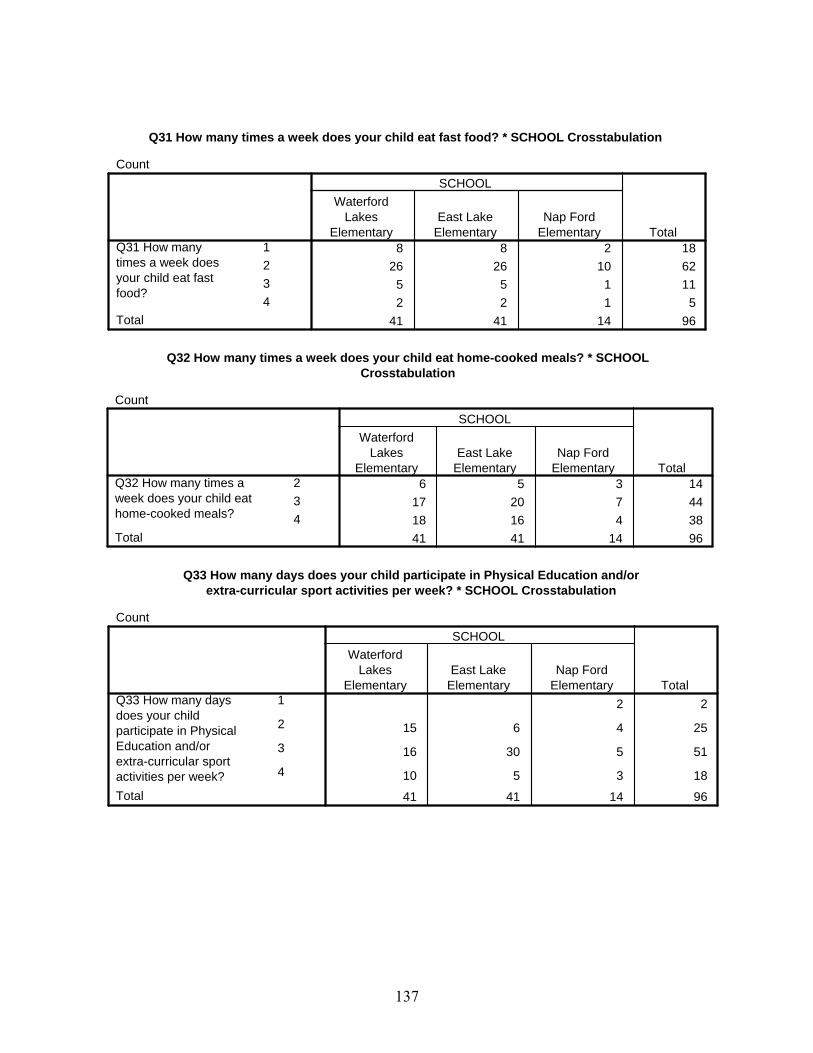
Q31 How many times a week does your child eat fast food? * SCHOOL Crosstabulation
Count
8 8 2 1826 26 10 62
5 5 1 112 2 1 5
41 41 14 96
1234
Q31 How manytimes a week doesyour child eat fastfood?
Total
WaterfordLakes
ElementaryEast Lake
ElementaryNap Ford
Elementary
SCHOOL
Total
Q32 How many times a week does your child eat home-cooked meals? * SCHOOL
Crosstabulation
Count
6 5 3 1417 20 7 4418 16 4 3841 41 14 96
234
Q32 How many times aweek does your child eathome-cooked meals?
Total
WaterfordLakes
ElementaryEast Lake
ElementaryNap Ford
Elementary
SCHOOL
Total
Q33 How many days does your child participate in Physical Education and/or
extra-curricular sport activities per week? * SCHOOL Crosstabulation
Count
2 2
15 6 4 25
16 30 5 51
10 5 3 18
41 41 14 96
1
2
3
4
Q33 How many daysdoes your childparticipate in PhysicalEducation and/orextra-curricular sportactivities per week?Total
WaterfordLakes
ElementaryEast Lake
ElementaryNap Ford
Elementary
SCHOOL
Total
137
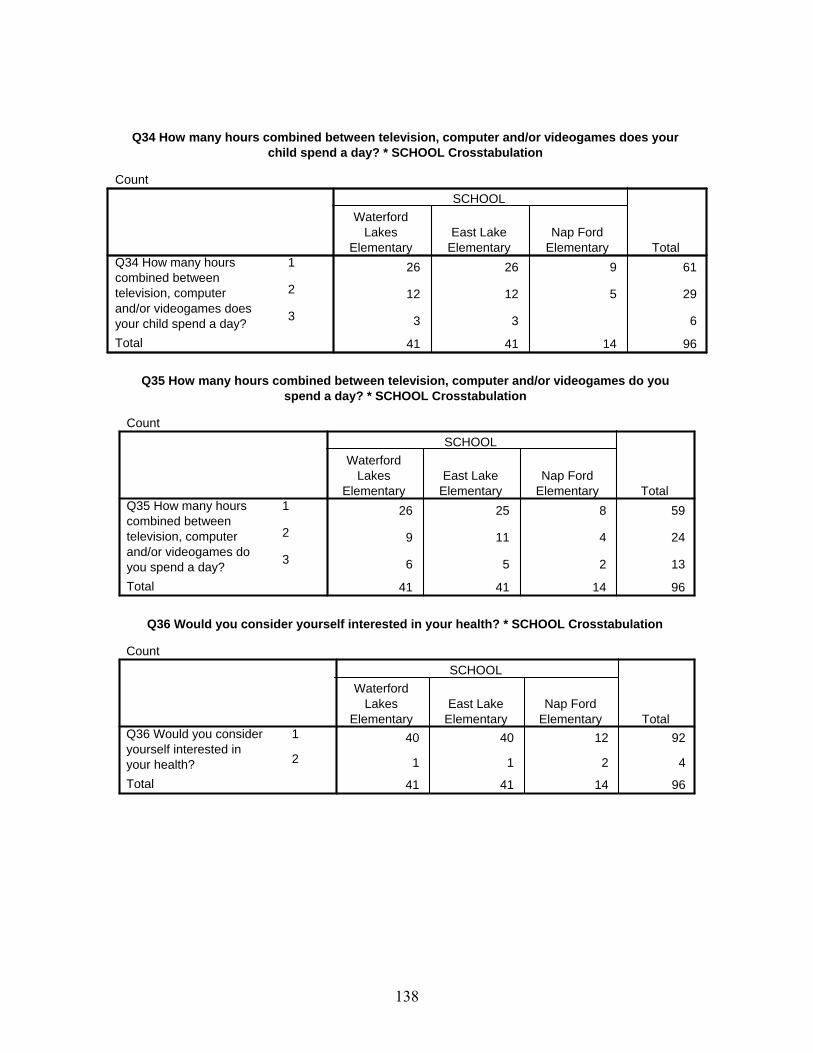
Q34 How many hours combined between television, computer and/or videogames does yourchild spend a day? * SCHOOL Crosstabulation
Count
26 26 9 61
12 12 5 29
3 3 6
41 41 14 96
1
2
3
Q34 How many hourscombined betweentelevision, computerand/or videogames doesyour child spend a day?Total
WaterfordLakes
ElementaryEast Lake
ElementaryNap Ford
Elementary
SCHOOL
Total
Q35 How many hours combined between television, computer and/or videogames do you
spend a day? * SCHOOL Crosstabulation
Count
26 25 8 59
9 11 4 24
6 5 2 13
41 41 14 96
1
2
3
Q35 How many hourscombined betweentelevision, computerand/or videogames doyou spend a day?Total
WaterfordLakes
ElementaryEast Lake
ElementaryNap Ford
Elementary
SCHOOL
Total
Q36 Would you consider yourself interested in your health? * SCHOOL Crosstabulation
Count
40 40 12 92
1 1 2 4
41 41 14 96
1
2
Q36 Would you consideryourself interested inyour health?Total
WaterfordLakes
ElementaryEast Lake
ElementaryNap Ford
Elementary
SCHOOL
Total
138
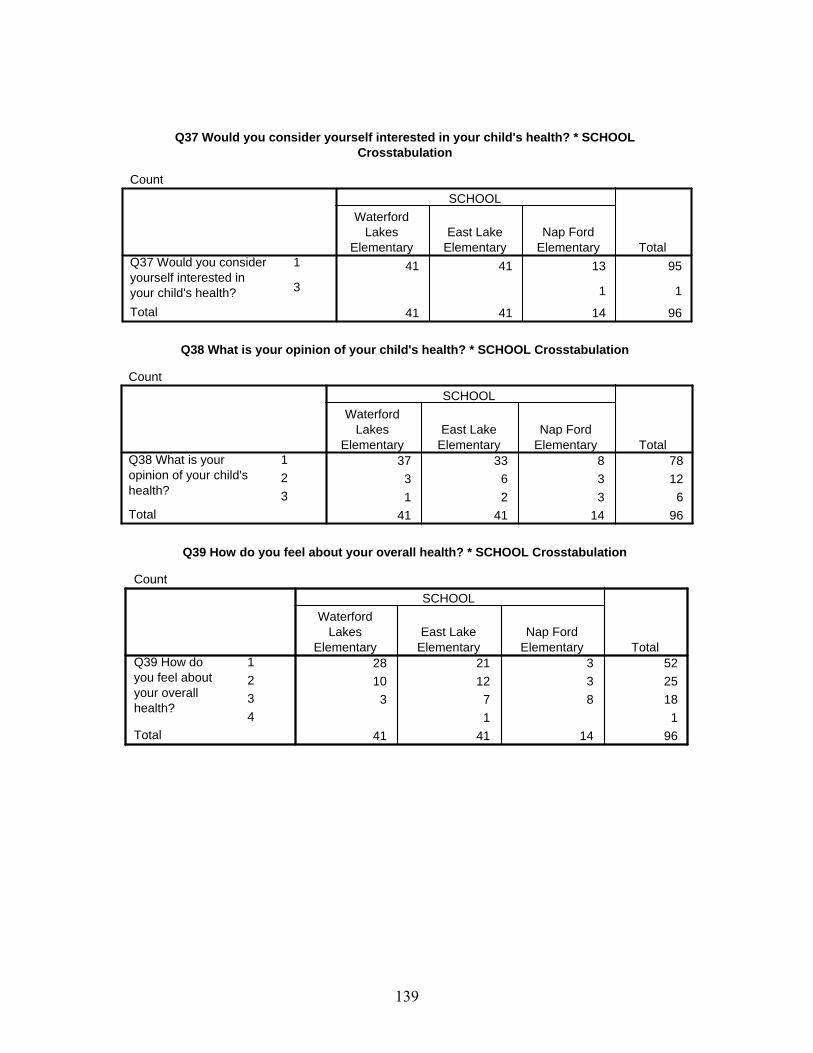
Q37 Would you consider yourself interested in your child's health? * SCHOOLCrosstabulation
Count
41 41 13 95
1 1
41 41 14 96
1
3
Q37 Would you consideryourself interested inyour child's health?Total
WaterfordLakes
ElementaryEast Lake
ElementaryNap Ford
Elementary
SCHOOL
Total
Q38 What is your opinion of your child's health? * SCHOOL Crosstabulation
Count
37 33 8 783 6 3 121 2 3 6
41 41 14 96
123
Q38 What is youropinion of your child'shealth?
Total
WaterfordLakes
ElementaryEast Lake
ElementaryNap Ford
Elementary
SCHOOL
Total
Q39 How do you feel about your overall health? * SCHOOL Crosstabulation
Count
28 21 3 5210 12 3 25
3 7 8 181 1
41 41 14 96
1234
Q39 How doyou feel aboutyour overallhealth?
Total
WaterfordLakes
ElementaryEast Lake
ElementaryNap Ford
Elementary
SCHOOL
Total
139

Q40 How do you feel about asking advice from health professionals about healthimprovements for you? * SCHOOL Crosstabulation
Count
27 26 11 64
12 15 2 29
2 1 3
41 41 14 96
1
2
3
Q40 How do you feelabout asking advice fromhealth professionalsabout healthimprovements for you?Total
WaterfordLakes
ElementaryEast Lake
ElementaryNap Ford
Elementary
SCHOOL
Total
Q41 How do you feel about asking advice from health professionals about health
improvements for your child? * SCHOOL Crosstabulation
Count
33 33 12 78
7 8 2 17
40 41 14 95
1
2
Q41 How do you feelabout asking advicefrom healthprofessionals abouthealth improvementsfor your child?Total
WaterfordLakes
ElementaryEast Lake
ElementaryNap Ford
Elementary
SCHOOL
Total
Q42 How do you feel about discussing health and fitness with your child? * SCHOOL
Crosstabulation
Count
36 35 13 84
4 5 1 10
1 140 41 14 95
1
2
3
Q42 How do you feelabout discussinghealth and fitnesswith your child?Total
WaterfordLakes
ElementaryEast Lake
ElementaryNap Ford
Elementary
SCHOOL
Total
140

Q43 Do you consider your communication with your child adequate? * SCHOOLCrosstabulation
Count
40 41 14 95
40 41 14 95
1Q43 Do you consider yourcommunication with yourchild adequate?Total
WaterfordLakes
ElementaryEast Lake
ElementaryNap Ford
Elementary
SCHOOL
Total
Q44 The person filling out this questionnaire is the * SCHOOL Crosstabulation
Count
34 32 12 786 6 2 14
2 21 1
40 41 14 95
1234
Q44 The personfilling out thisquestionnaire isthe
Total
WaterfordLakes
ElementaryEast Lake
ElementaryNap Ford
Elementary
SCHOOL
Total
Q45 What is your age? * SCHOOL Crosstabulation
Count
2 2 44 12 6 22
25 18 3 4611 9 3 2340 41 14 95
1234
Q45 Whatis yourage?
Total
WaterfordLakes
ElementaryEast Lake
ElementaryNap Ford
Elementary
SCHOOL
Total
141
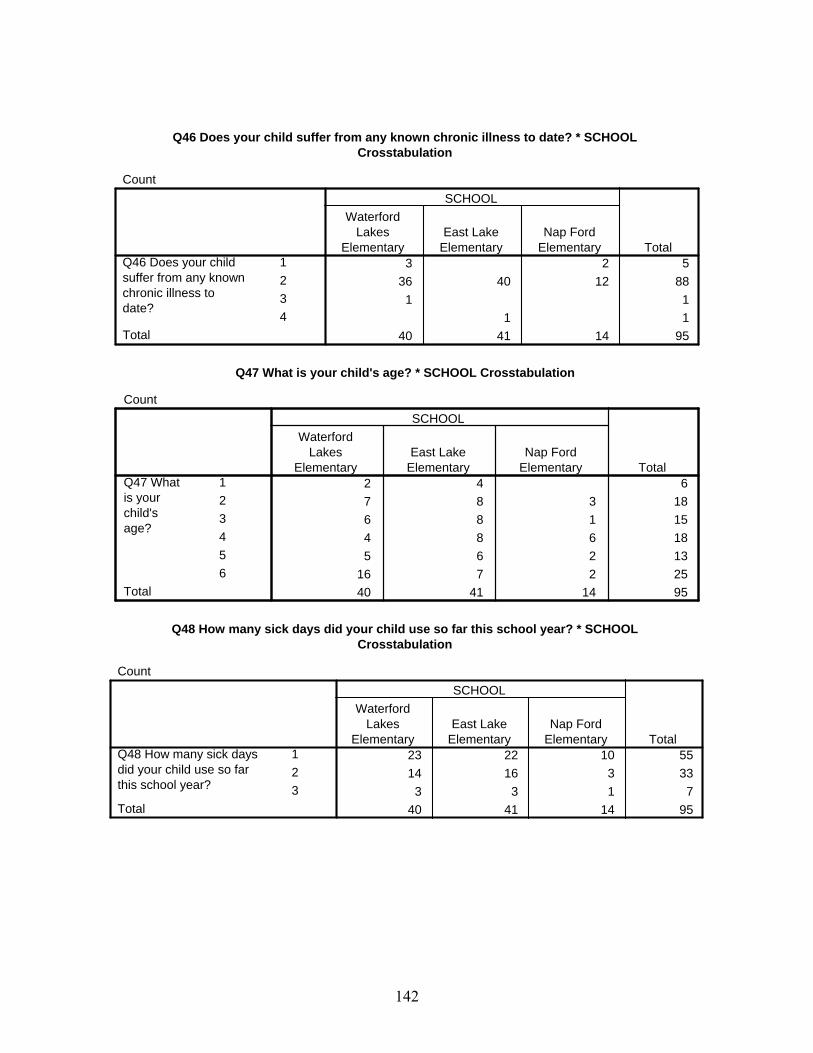
Q46 Does your child suffer from any known chronic illness to date? * SCHOOLCrosstabulation
Count
3 2 536 40 12 88
1 11 1
40 41 14 95
1234
Q46 Does your childsuffer from any knownchronic illness todate?
Total
WaterfordLakes
ElementaryEast Lake
ElementaryNap Ford
Elementary
SCHOOL
Total
Q47 What is your child's age? * SCHOOL Crosstabulation
Count
2 4 67 8 3 186 8 1 154 8 6 185 6 2 13
16 7 2 2540 41 14 95
123456
Q47 Whatis yourchild'sage?
Total
WaterfordLakes
ElementaryEast Lake
ElementaryNap Ford
Elementary
SCHOOL
Total
Q48 How many sick days did your child use so far this school year? * SCHOOL
Crosstabulation
Count
23 22 10 5514 16 3 33
3 3 1 740 41 14 95
123
Q48 How many sick daysdid your child use so farthis school year?
Total
WaterfordLakes
ElementaryEast Lake
ElementaryNap Ford
Elementary
SCHOOL
Total
142

Q49 Have all your child's immunizations been given on time? * SCHOOL Crosstabulation
Count
41 41 14 96
41 41 14 96
1Q49 Have all yourchild's immunizationsbeen given on time?Total
WaterfordLakes
ElementaryEast Lake
ElementaryNap Ford
Elementary
SCHOOL
Total
Q50 Are you at a healthy weight according to your height/weight ratio? * SCHOOL
Crosstabulation
Count
26 27 3 5613 13 11 37
2 1 341 41 14 96
123
Q50 Are you at a healthyweight according to yourheight/weight ratio?
Total
WaterfordLakes
ElementaryEast Lake
ElementaryNap Ford
Elementary
SCHOOL
Total
Q51 Is your child at a healthy weight according to his/her height/weight ratio? * SCHOOL
Crosstabulation
Count
34 33 10 77
5 6 2 13
2 2 2 641 41 14 96
1
2
3
Q51 Is your child ata healthy weightaccording to his/herheight/weight ratio?Total
WaterfordLakes
ElementaryEast Lake
ElementaryNap Ford
Elementary
SCHOOL
Total
143
REFERENCES
American Academy of Pediatric Dentistry. Handbook of Pediatric Dentistry. (1999).
Chicago, IL: The Academy.
American College of Sports Medicine. (2000). ACSM’s Guidelines for Exercise Testing
and Prescription. 6th ed. Philadelphia, PA: Lippincott, Williams & Wilkins.
Anderson, R.E., Crespo, C.J. & Bartlett, S.J. (1998). Relationship of physical activity
and television watching with body weight and level of fatness among children: Results
from the Third National Health and Nutrition Examination Survey. Journal of the
American Medical Association 279, 938-942.
Arbeit, M.L., Johnson, C.C., & Mott, D.S. (1992). The Heart Smart Cardiovascular
School Health Promotion: Behavior correlates of risk factor change. Preventive
Medicine, 21(1), 18-32.
Baker, D.W., Schillinger D., & Gazmararian J.A. (1996). The healthcare experience of
patients with low literacy. Archives of Family Medicine, 5(6), 329-334.
Bell, A.C., & Swinburn, B.A. (2001). What are the key food groups to target for
preventing obesity and improving nutrition in schools? European Journal of Clinical
Nutrition, 58, 258-263.
Bhattacharya, J., & Currie, J. (2001). Youths at Nutritional Risk: Malnourished or
Misnourished, in Risky Behavior Among Youths: An Economic Analysis, J. Gruber
(ed.), Illinois: The University of Chicago Press.
Children's Insurance Survey, Department of Insurance, State of Florida (2001).
144

Corbin, C., & Welk, G. (1996). Physical activity for children and youth. Journal of
Physical Education, 67 (4), 38-43.
Bowman, S.A., Gortmaker, S.L., Ebbeling, C.B., Pereira, M.A. & Ludwig, D.S. (2004).
Effects of fast-food consumption on energy intake and diet quality among children in
a national household survey. Pediatric, 113(1), 112-118.
Burghardt, J. A., Devaney L. B. & Gordon, A. (1995). The School Nutrition
Dietary Assessment Study: Summary and Discussion. The American Journal of
Clinical Nutrition, 61, 252S-257S.
Deckelbaum, R.J. & Williams, C.L. (2001). Childhood Obesity: The Health Issue.
Obesity Research, 9, 239S-243S.
Devaney, B. L., & Stuart, E. (1998). Eating Breakfast: Effects of the School
Breakfast Program, Report Submitted to the US Department of Agriculture, Food
and Nutrition Service, New Jersey: Mathematica Policy Research, Inc.
Dewey, J. (1938). In Experience and Education. New York: Basic Books.
Dietary Guidelines Advisory Committee 2005 Dietary Guidelines Advisory Committee
Report. Available from: http://www.health.gov/dietaryguidelines/dga2005/report/
Dietz, W.H. (1998). Health consequences of obesity in youth: Childhood predictors of
adult disease. Pediatrics, 101(3) Supp, 518-525.
Dwyer, J., Ellwood, K., Moshfegh, A.J. & Johnson, C.L. (2001). Integration of the
Continuing Survey of Food Intakes by Individuals and the National Health and
Nutrition Examination Survey. J Am Diet Assoc, 101(10), 1142-3.
145

Evans, C.A., & Kleinman, D.V. (2000). The Surgeon General's Report on America's Oral
Health: Opportunities for the Dental Profession. Journal of the American Dental
Association, 131(12), 1721-8.
Fanning, J., Marsh, T., & Stiegert, K. (2003). Determinants of fast food consumption.
Journal of The American Economics Association; 31, 102-8.
Ferraro, K.F., Thorpe, R.J. Jr. & Wilkinson, J.A. (2003). The life course of severe
obesity: does childhood overweight matter? Journal of Gerontology: Social Sciences,
58B(2):S110–S119.
Florida Department of Health Family Health Services School Health. State Summary of
School Health Services; 2004-2005.
Food and Drug Administration. Food Pyramid and Dietary Guidelines (2006).
Francis, K. (1996). Physical Activity in the Prevention of Cardiovascular Disease.
Physical Therapy, 76(5), 456-68.
Freedman D.S., Dietz W.H., Srinivasan S.R. & Berenson G.S. (1999) The relation of
overweight to cardiovascular risk factors among children and adolescents: the
Bogalusa Heart Study. Journal of Pediatrics, 103(6), 1175-1182.
Gleason, P.M. & Suitor, C.W. (2003). Eating at school: How the National School Lunch
Program affects children's diets. Am J Agric Econ, 85(4), 1047-1061.
Guyer, B. & Ellers, B. (1990). Childhood injuries in the United States: mortality,
morbidity and cost. American Journal of Disorders of Children, 144, 649-652.
Harsha, D.W. (1995). The Benefits of Physical Activity in Childhood. American Journal
of the Medical Sciences, 310 Supp. 1, S109-13.
146

Hazinski, M.F., Eddy, V.A. & Morris, J.A. Jr. (1995). Children’s traffic safety program:
influence of early elementary school safety education on family seatbelt use. Journal
of Trauma, 39, 1063-1068.
Inhelder, B., & Piaget, J. (1958). The Growth of Logical Thinking from Childhood to
Adolescence. New York: Basic Books.
Kolbe, L.J., Collins, J. & Coretese, P. (1997). Building the capacity of schools to improve
the health of the nation: A call for assistance from psychologists. American
Psychologist, 52, 256-265.
Kujala, U.M., Kaprio, J., Sarna, S. (1998). Relationship of leisure-time physical activity
and mortality: The Finnish twin cohort. Journal of the American Medical Association
279(6), 440-444.
Lytle, L.A., Eldridge, A.L., Kotz, K., Piper, J., Williams, S. & Kalina, B. (1997).
Children’s interpretation of nutritional message. Journal of Nutrition Education, 29,
128-136.
Maslow, A. H. (1943). A Theory of Human Motivation. Psychological Review, 50, 370-
396.
McKenzie, T.L., Nader, P.R., Strikmiller, P.K. (1996). School physical education: Effect
of the child and adolescent trial for cardiovascular health. Preventive Medicine
25(4), 423-431.
Mei, Z., Grummer-Strawn, L.M., Pietrobelli, A., Goulding, A., Goran, M.I. & Dietz,
W.H. (2002). Validity of body mass index compared with other body-composition
screening indexes for the assessment of body fatness in children and adolescents.
American Journal of Clinical Nutrition, 2, 7597-985.
147

Monheit, A.C., &Cunningham, P.J. (1992). Children without Health Insurance. The
Future of Children, 2(2),154-170.
Must, A., & Anderson, S.E. (2003). Effects of obesity on morbidity in children and
adolescents. Nutrition in Clinical Care, 6(1), 4–12.
Newacheck, P.W., Strickland, B., Shonkoff, J.P., Perrin, J.M., Mc Pherson, M., Mc
Manus, M., Lauver, C., Fox, H. & Arango, P. (1998). An epidemiologic profile of
children with special health care needs. Pediatrics, 102, 117-123.
Newacheck, P.W., Perrin, J.M., Shonkoff J.P. & Strickland, B. (1998). A new definition
of children with special health care needs. Pediatrics, 102, 137-140.
Newacheck, P. W., Stoddard, J. J. & McManus, M. (1993). Ethnocultural Variations in
the Prevalence and Impact of Childhood Chronic Conditions. Pediatrics, 91(5 Pt 2),
1031-9.
Newacheck, P. W., & Taylor, W. R. (1992). Childhood Chronic Illness: Prevalence,
Severity, and Impact. American Journal of Public Health, 82(3),364-71.
Nutbeam, D. (2000). Health literacy as a public health goal: a challenge for contemporary
health education and communication strategies into the 21st Century. Health
Promotion International, 15(3), 259-267.
Pangrazi, R. P., Corbin, C. B., & Welk, G. J. (1996). Physical activity for children and
youth. JOPERD, 67(4), 38-43. EJ 528 648
Pate, R. R., & Pratt, M. (1995). Physical activity and public health: A
recommendation from the Centers for Disease Control and Prevention and the
American College of Sports Medicine. Journal of the American Medical Association,
273(5), 402-407.
148
Pate, R. R., Small, M. L., Ross, J. G., Young, J. C., Flint, K. H., & Warren, C. W. (1995).
School physical education. Journal of School Health, 65(8), 339-343. EJ 520 865
Pate, R.R., Baranowski, T. & Dowda, M. (1996). Tracking of physical activity in young
children. Medicine and Science in Sports and Exercise 28(1), 92-96.
Parker, RM. (2000). Health literacy: a challenge for American patients and their health
care providers. Health Promotion International. 15(4), 537-542.
Proctor, S., Lordi, S. & Saiger, D. (1993). School Nursing Practice: Roles and Standards.
Scarborough, ME: National Association of School Nurses.
Ranney, C., & McNamara, P. Do healthier diets cost more? (2002). The American
Journal of the Economic Association, 28, 106-9.
Reed, V.A. & Jernstedt, G.C. (2000). Teaching children about health: An example of
secondary gain in an academic-community partnership. Education for Health, 13,
357 – 365.
Seifer, S.D., Hermanns, K. & Lewis, J. (Eds). (2000). Creating community-responsive
physicians. USA: American Association for Higher Education.
Sallis, J.F., McKenzie, T.L., Alcaraz, J.E. (1997). The effects of a 2-year physical
education program (SPARK) on physical activity and fitness in elementary school
students. American Journal of Public Health, 87(8), 1328-1334.
Spivak, H., & Prothrow-Stith, D. (2001). The Need to Address Bullying-an Important
Component of Violence Prevention. JAMA, 285(16),2131-2.
Storey, M.L., Forshee, R.A., Weaver, A.R., & Sansalone, W.R. (2003). Demographic and
lifestyle factors associated with body mass index among children and adolescents. Int
Journal of Food and Science and Nutrition, 54(6), 491-503.
149

Telfar, J,. & Kotch, J. B. (1997). The School-Age Child from Five to Nine. Maternal
and Child Health: Programs, Problems and Policy in Public Health. Gaithersburg,
MD: Aspen.
The Merck Manual, 5th Edition (2004). American Medical Association.
Thompson, F.E., Midthune, D., Subar, A.F., McNeel, T., Berrigan, D. & Kipnis, V.
(2000). Dietary intake estimates in the National Health Interview Survey:
Methodology, results, and interpretation. Journal of the American Diet Association,
105, 352-363.
Troiano, R.P., Flegal, K.M., Kuczmarski, R.J., Campbell, S.M. & Johnson, C.L. (1995).
Overweight Prevalence and Trends for Children and Adolescents. The National
Health and Nutrition Examination Surveys, 1963 to 1991. Pediatrics and Adolescent
Medicine, 149(10), 1085-91.
U.S. Department of Health and Human Services. Physical Activity and Health: A Report
of the Surgeon General. Atlanta, GA: Centers for Disease Control and Prevention
(CDC), National Center for Chronic Disease Prevention and Health Promotion, 2002.
U.S. Department of Health and Human Services and U.S. Department of Agriculture.
Dietary Guidelines for Americans 2005, 6th ed. U S Dep Agric, Home Garden Bull
No. 232; HHS Pub No. HHS-ODPHP-2005-01-DGA-A.
Whitaker, R.C., Wright, J.A., Pepe, M.S., Seidel, K.D. & Dietz, W.H. (1997). Predicting
obesity in young adulthood from childhood and parental obesity. New England
Journal of Medicine, 37(13), 869–873.
150