Embed Size (px)
Citation preview

Volume 56, Number 2, 2002 APPLIED SPECTROSCOPY 2170003-7028 / 02 / 5602-0217$2.00 / 0q 2002 Society for Applied Spectroscopy
Headspace FT-IR Analysis of Rapeseed Oil Oxidation
MIKKO AHRO, MARI HAKALA, JYRKI KAUPPINEN, and HEIKKI KALLIO*Department of Applied Physics, University of Turku, FIN-20014, Finland (M.A., J.K.); and Department of Biochemistry and FoodChemistry, University of Turku, FIN-20014, Finland (M.H., H.K.)
Volatile compounds formed by oxidation of rapeseed oil at 60 8C inopen beakers were studied as a function of time over 289 h. A directinlet gas-phase FT-IR method was introduced and compounds in-dicating lipid oxidation were detected and quanti� ed. The devel-opment of 1,3,5-trimethylbenzene, 2,4-hexadienal, 2-methyl-1,3-bu-tadiene, 2-methyltetrahydrofuran, acetic acid, methyl cyclopentane,methyl hexanoate, n-butanal, n-hexanal, n-octanal, n-propanal, andtrans,trans-2,4-heptadienal was followed. The results showed thatgas-phase FT-IR is a potential method of fast analysis for monitor-ing oil quality. Headspace-gas chromatography-mass spectrometry(HS-GC-MS) was used for compound identi� cation.
Index Headings: Fourier transform infrared spectroscopy; FT-IR;Volatile; Rapeseed oil; Oxidation.
INTRODUCTION
Volatile compounds formed during oxidation of edibleoils have been widely studied over several decades. Var-ious headspace collection, distillation, and solvent ex-traction methods for sample preparation have been pre-sented (see Refs. 1–4). It is possible to detect close totwo hundred volatile compounds in one gas chromato-graphic analysis, as shown by Shimoda,5 but the highsensitivity and selectivity has its price: long measurementtime, complex sample pretreatments, and a lengthy pro-cessing time of the chromatograms. In this study, direct-inlet gas phase Fourier transform infrared spectroscopy(FT-IR) was used for the analysis of volatile compoundsof rapeseed oil. IR spectroscopy is widely used in theanalysis of edible oils,6–10 but in most cases analysis isperformed on the liquid- or solid-phase. The direct-inletmeans here that no chromatographic devices were con-nected to the FT-IR spectrometer, and the sample gas wasdirectly injected into the sample cell of the spectrometer.The gas phase FT-IR has, at least potentially, signi� cantadvantages: the measurement is fast, spectral analysis canbe automated, and minimum sample pretreatment is need-ed. The FT-IR method also has its limitations: it cannotbe used without predetection of the compounds to besought from the sample spectrum. Therefore, headspace-gas chromatography-mass specrometry (HS-GC-MS) wasused for compound identi� cation.
The aim of this study was to investigate the potentialuse of gas-phase FT-IR for the analysis of volatile com-pounds of edible oils. The results presented are examplesof the applicability of the method and thus are not meantto present signi� cantly new information about oxidationof rapeseed oil. The overall experimental setup was sim-ple: the oil samples were oxidized in controlled condi-tions. The samples with different oxidation states werefreeze-stored and later analyzed by headspace FT-IR. Part
Received 3 April 2001; accepted 28 September 2001.* Author to whom correspondence should be sent.
of the samples were also analyzed by HS-GC-MS. Thepurpose of GC analysis was to screen the compounds,which should be taken into account in the FT-IR analysis.In addition to this oxidation experiment, unoxidized sam-ples from different production lots were also analyzed.
Because of the preliminary and demonstrative natureof this study, all aspects in the method of analysis werenot truly optimized. In this case HS-GC-MS was used forpreliminary compound identi� cation. In true quality con-trol applications, FT-IR is most probably used as a fastmethod for routine analysis with known components pre-sent in the sample. In this study the oil samples were alsofrozen and stored until headspace FT-IR analysis tookplace. This is also not a realistic situation; in real processapplications the samples would be analyzed immediatelywithout storing them. However, it can be assumed thatfreeze-storage of the oil samples did not signi� cantly af-fect the observed results, especially taking into accountthe analysis deviation.
EXPERIMENTAL
Oil Samples. The rapeseed oil samples were obtainedfrom Raisio Group plc, Raison Margariini (Raisio, Fin-land). Eleven samples that had passed the sensory eval-uation of the quality control represented good, acceptableproducts (zero samples). The samples were kept frozenin sealed glass jars until analyzed. The oxidation exper-iment was carried out with one sample only.
Oxidation Experiment. The oxidation experimentswere carried out at 60 8C by placing seven uncoveredglass jars containing oil in a thermostatically controlledcupboard. Each of these held 300 g sub-samples of oilselected for oxidation experiments. At time-points 0, 120,145, 157, 193, 205, and 289 h, one jar was taken andfrozen. These oil samples were later analyzed by head-space FT-IR. The peroxide value was determined beforethe jars were frozen. The method for the peroxide valuedetermination was AOCS Cd 8b-90. The peroxide valueindicates the state of oxidation of the oil.
Reference Compounds. The following chemicalswere used as reference compounds: 2-methylpentane,trans,trans-2,4-heptadienal, and trans-2-heptenal (Acros,Geel, Belgium); octamethylcyclotetrasiloxan, 2-pentene,n-propanal, n-nonanal, 2-methylbutane, 2-methyltetrahy-drofuran, methyl hexanoate, 1-hexen, cis-2-penten-1-ol,2-methyl-3-pentanone, ethylbenzene, 2,4-hexadienal,methyl cyclopentane, n-pentanal, 2-methylfuran, methylbutanoate, ethyl butanoate, hexamethylcyclotrisiloxan, n-undecane, and 3-methyl-2-pentanone (Sigma-AldrichGmbH, Steinheim , Germany); benzaldehyde (BDH,Poole, UK); 1-propanol and 2-butanone (J.T. BakerChemicals, Mallinkrod, Holland); n-heptanal, nonane, 3-methyl-2-butanone, n-octanal, 1,3,5-trimethylbenzene, 3-
218 Volume 56, Number 2, 2002
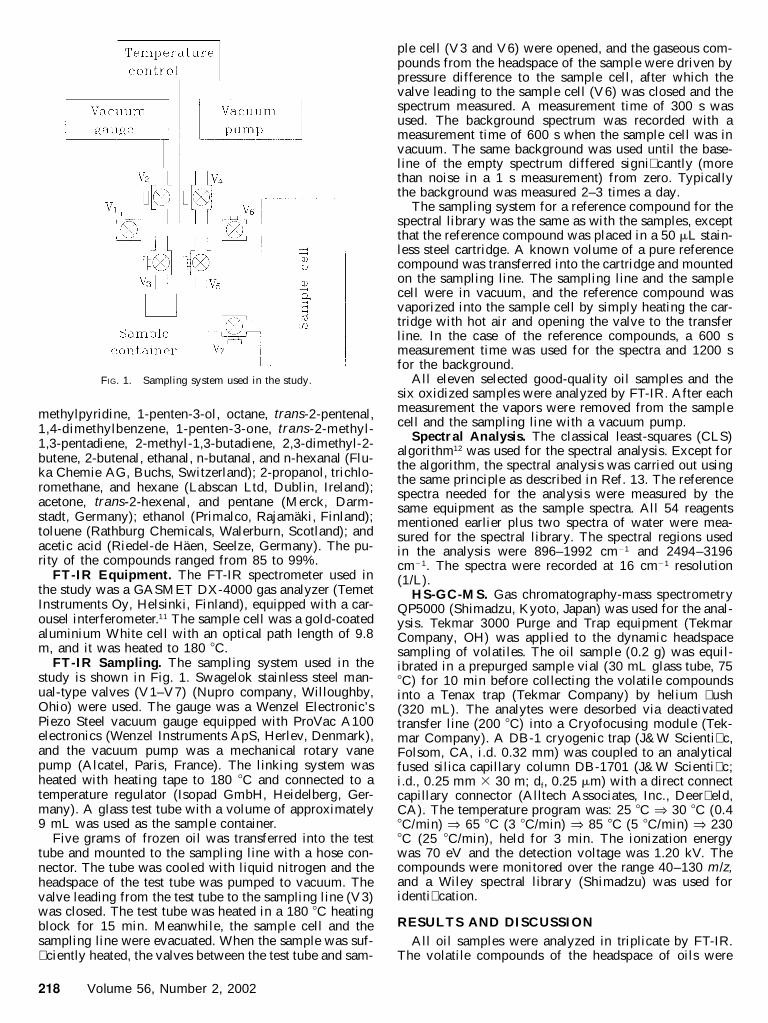
FIG. 1. Sampling system used in the study.
methylpyridine, 1-penten-3-ol, octane, trans-2-pentenal,1,4-dimethylbenzene, 1-penten-3-one, trans-2-methyl-1,3-pentadiene, 2-methyl-1,3-butadiene, 2,3-dimethyl-2-butene, 2-butenal, ethanal, n-butanal, and n-hexanal (Flu-ka Chemie AG, Buchs, Switzerland); 2-propanol, trichlo-romethane, and hexane (Labscan Ltd, Dublin, Ireland);acetone, trans-2-hexenal, and pentane (Merck, Darm-stadt, Germany); ethanol (Primalco, Rajamaki, Finland);toluene (Rathburg Chemicals, Walerburn, Scotland); andacetic acid (Riedel-de Haen, Seelze, Germany). The pu-rity of the compounds ranged from 85 to 99%.
FT-IR Equipment. The FT-IR spectrometer used inthe study was a GASMET DX-4000 gas analyzer (TemetInstruments Oy, Helsinki, Finland), equipped with a car-ousel interferometer.11 The sample cell was a gold-coatedaluminium White cell with an optical path length of 9.8m, and it was heated to 180 8C.
FT-IR Sampling. The sampling system used in thestudy is shown in Fig. 1. Swagelok stainless steel man-ual-type valves (V1–V7) (Nupro company, Willoughby,Ohio) were used. The gauge was a Wenzel Electronic’sPiezo Steel vacuum gauge equipped with ProVac A100electronics (Wenzel Instruments ApS, Herlev, Denmark),and the vacuum pump was a mechanical rotary vanepump (Alcatel, Paris, France). The linking system washeated with heating tape to 180 8C and connected to atemperature regulator (Isopad GmbH, Heidelberg, Ger-many). A glass test tube with a volume of approximately9 mL was used as the sample container.
Five grams of frozen oil was transferred into the testtube and mounted to the sampling line with a hose con-nector. The tube was cooled with liquid nitrogen and theheadspace of the test tube was pumped to vacuum. Thevalve leading from the test tube to the sampling line (V3)was closed. The test tube was heated in a 180 8C heatingblock for 15 min. Meanwhile, the sample cell and thesampling line were evacuated. When the sample was suf-� ciently heated, the valves between the test tube and sam-
ple cell (V3 and V6) were opened, and the gaseous com-pounds from the headspace of the sample were driven bypressure difference to the sample cell, after which thevalve leading to the sample cell (V6) was closed and thespectrum measured. A measurement time of 300 s wasused. The background spectrum was recorded with ameasurement time of 600 s when the sample cell was invacuum. The same background was used until the base-line of the empty spectrum differed signi� cantly (morethan noise in a 1 s measurement) from zero. Typicallythe background was measured 2–3 times a day.
The sampling system for a reference compound for thespectral library was the same as with the samples, exceptthat the reference compound was placed in a 50 mL stain-less steel cartridge. A known volume of a pure referencecompound was transferred into the cartridge and mountedon the sampling line. The sampling line and the samplecell were in vacuum, and the reference compound wasvaporized into the sample cell by simply heating the car-tridge with hot air and opening the valve to the transferline. In the case of the reference compounds, a 600 smeasurement time was used for the spectra and 1200 sfor the background.
All eleven selected good-quality oil samples and thesix oxidized samples were analyzed by FT-IR. After eachmeasurement the vapors were removed from the samplecell and the sampling line with a vacuum pump.
Spectral Analysis. The classical least-squares (CLS)algorithm12 was used for the spectral analysis. Except forthe algorithm, the spectral analysis was carried out usingthe same principle as described in Ref. 13. The referencespectra needed for the analysis were measured by thesame equipment as the sample spectra. All 54 reagentsmentioned earlier plus two spectra of water were mea-sured for the spectral library. The spectral regions usedin the analysis were 896–1992 cm21 and 2494–3196cm21. The spectra were recorded at 16 cm21 resolution(1/L).
HS-GC-MS. Gas chromatography-mass spectrometryQP5000 (Shimadzu, Kyoto, Japan) was used for the anal-ysis. Tekmar 3000 Purge and Trap equipment (TekmarCompany, OH) was applied to the dynamic headspacesampling of volatiles. The oil sample (0.2 g) was equil-ibrated in a prepurged sample vial (30 mL glass tube, 758C) for 10 min before collecting the volatile compoundsinto a Tenax trap (Tekmar Company) by helium � ush(320 mL). The analytes were desorbed via deactivatedtransfer line (200 8C) into a Cryofocusing module (Tek-mar Company). A DB-1 cryogenic trap (J&W Scienti� c,Folsom, CA, i.d. 0.32 mm) was coupled to an analyticalfused silica capillary column DB-1701 (J&W Scienti� c;i.d., 0.25 mm 3 30 m; d f, 0.25 mm) with a direct connectcapillary connector (Alltech Associates, Inc., Deer� eld,CA). The temperature program was: 25 8C Þ 30 8C (0.48C/min) Þ 65 8C (3 8C/min) Þ 85 8C (5 8C/min) Þ 2308C (25 8C/min), held for 3 min. The ionization energywas 70 eV and the detection voltage was 1.20 kV. Thecompounds were monitored over the range 40–130 m /z,and a Wiley spectral library (Shimadzu) was used foridenti� cation.
RESULTS AND DISCUSSIONAll oil samples were analyzed in triplicate by FT-IR.
The volatile compounds of the headspace of oils were
APPLIED SPECTROSCOPY 219
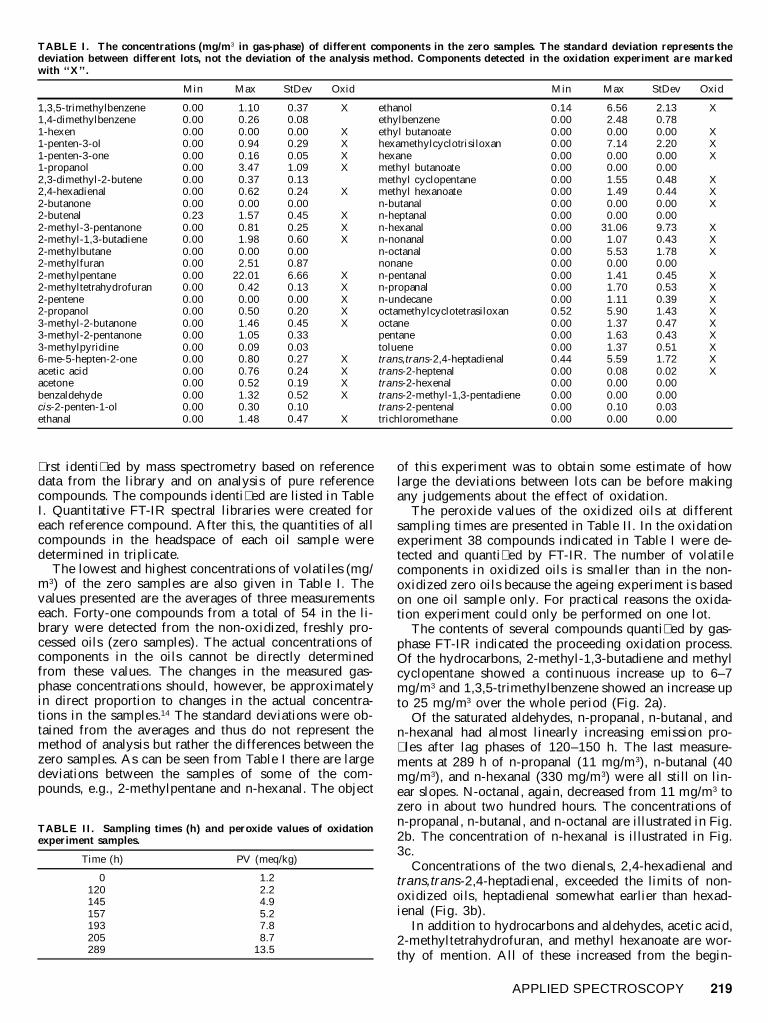
TABLE I. The concentrations (mg/m3 in gas-phase) of different components in the zero samples. The standard deviation represents thedeviation between different lots, not the deviation of the analysis method. Components detected in the oxidation experiment are markedwith ‘‘X’’.
Min Max StDev Oxid Min Max StDev Oxid
1,3,5-trimethylbenzene1,4-dimethylbenzene1-hexen1-penten-3-ol1-penten-3-one1-propanol2,3-dimethyl-2-butene2,4-hexadienal2-butanone
0.000.000.000.000.000.000.000.000.00
1.100.260.000.940.163.470.370.620.00
0.370.080.000.290.051.090.130.240.00
X
XXXX
X
ethanolethylbenzeneethyl butanoatehexamethylcyclotrisiloxanhexanemethyl butanoatemethyl cyclopentanemethyl hexanoaten-butanal
0.140.000.000.000.000.000.000.000.00
6.562.480.007.140.000.001.551.490.00
2.130.780.002.200.000.000.480.440.00
X
XXX
XXX
2-butenal2-methyl-3-pentanone2-methyl-1,3-butadiene2-methylbutane2-methylfuran2-methylpentane2-methyltetrahydrofuran2-pentene2-propanol
0.230.000.000.000.000.000.000.000.00
1.570.811.980.002.51
22.010.420.000.50
0.450.250.600.000.876.660.130.000.20
XXX
XXXX
n-heptanaln-hexanaln-nonanaln-octanalnonanen-pentanaln-propanaln-undecaneoctamethylcyclotetrasiloxan
0.000.000.000.000.000.000.000.000.52
0.0031.061.075.530.001.411.701.115.90
0.009.730.431.780.000.450.530.391.43
XXX
XXXX
3-methyl-2-butanone3-methyl-2-pentanone3-methylpyridine6-me-5-hepten-2-oneacetic acidacetonebenzaldehydecis-2-penten-1-olethanal
0.000.000.000.000.000.000.000.000.00
1.461.050.090.800.760.521.320.301.48
0.450.330.030.270.240.190.520.100.47
X
XXXX
X
octanepentanetoluenetrans,trans-2,4-heptadienaltrans-2-heptenaltrans-2-hexenaltrans-2-methyl-1,3-pentadienetrans-2-pentenaltrichloromethane
0.000.000.000.440.000.000.000.000.00
1.371.631.375.590.080.000.000.100.00
0.470.430.511.720.020.000.000.030.00
XXXXX
TABLE II. Sampling times (h) and peroxide values of oxidationexperiment samples.
Time (h) PV (meq/kg)
0120145157193205289
1.22.24.95.27.88.7
13.5
� rst identi� ed by mass spectrometry based on referencedata from the library and on analysis of pure referencecompounds. The compounds identi� ed are listed in TableI. Quantitative FT-IR spectral libraries were created foreach reference compound. After this, the quantities of allcompounds in the headspace of each oil sample weredetermined in triplicate.
The lowest and highest concentrations of volatiles (mg/m3) of the zero samples are also given in Table I. Thevalues presented are the averages of three measurementseach. Forty-one compounds from a total of 54 in the li-brary were detected from the non-oxidized, freshly pro-cessed oils (zero samples). The actual concentrations ofcomponents in the oils cannot be directly determinedfrom these values. The changes in the measured gas-phase concentrations should, however, be approximatelyin direct proportion to changes in the actual concentra-tions in the samples.14 The standard deviations were ob-tained from the averages and thus do not represent themethod of analysis but rather the differences between thezero samples. As can be seen from Table I there are largedeviations between the samples of some of the com-pounds, e.g., 2-methylpentane and n-hexanal. The object
of this experiment was to obtain some estimate of howlarge the deviations between lots can be before makingany judgements about the effect of oxidation.
The peroxide values of the oxidized oils at differentsampling times are presented in Table II. In the oxidationexperiment 38 compounds indicated in Table I were de-tected and quanti� ed by FT-IR. The number of volatilecomponents in oxidized oils is smaller than in the non-oxidized zero oils because the ageing experiment is basedon one oil sample only. For practical reasons the oxida-tion experiment could only be performed on one lot.
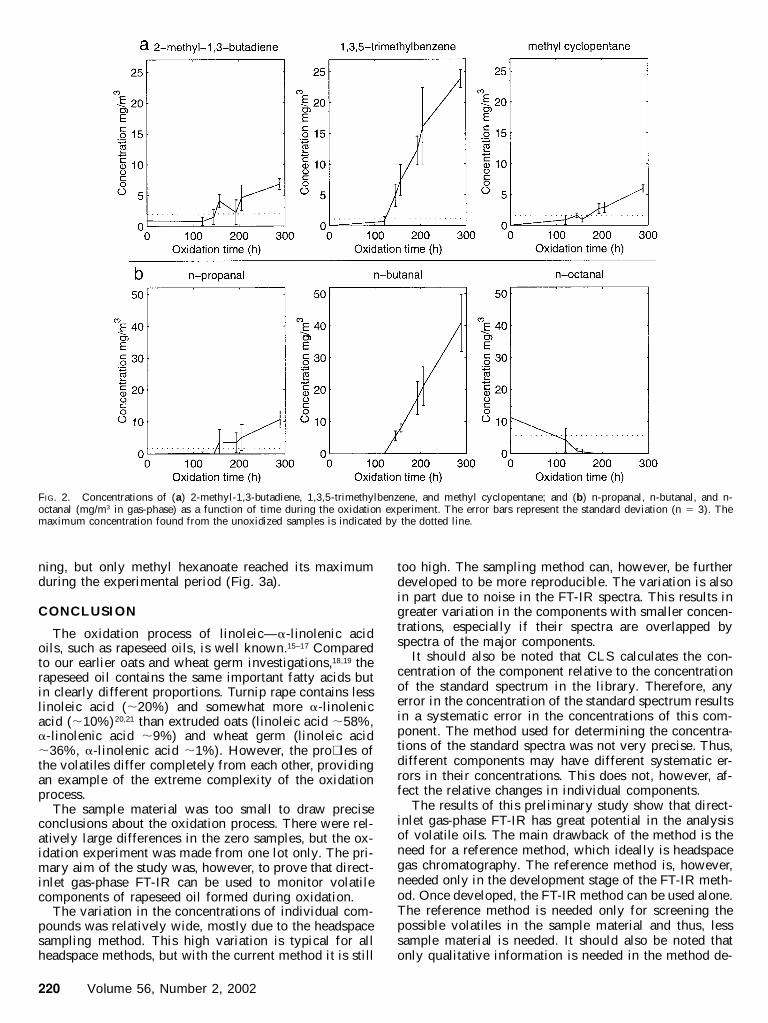
The contents of several compounds quanti� ed by gas-phase FT-IR indicated the proceeding oxidation process.Of the hydrocarbons, 2-methyl-1,3-butadiene and methylcyclopentane showed a continuous increase up to 6–7mg/m3 and 1,3,5-trimethylbenzene showed an increase upto 25 mg/m3 over the whole period (Fig. 2a).
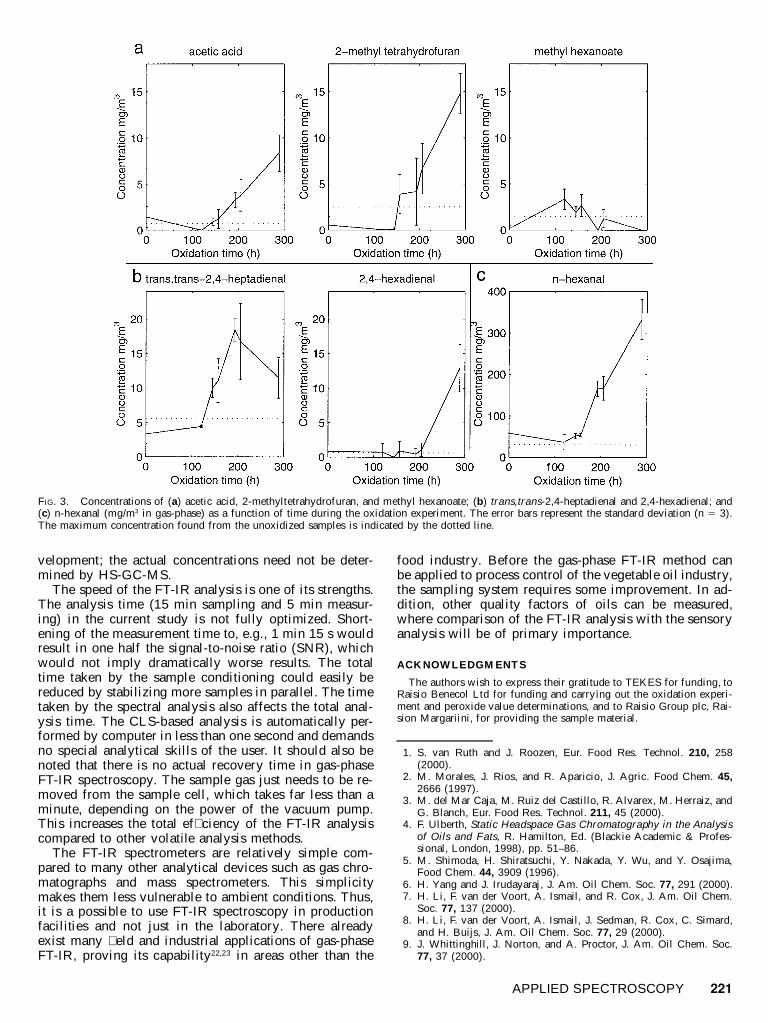
Of the saturated aldehydes, n-propanal, n-butanal, andn-hexanal had almost linearly increasing emission pro-� les after lag phases of 120–150 h. The last measure-ments at 289 h of n-propanal (11 mg/m 3), n-butanal (40mg/m3), and n-hexanal (330 mg/m 3) were all still on lin-ear slopes. N-octanal, again, decreased from 11 mg/m3 tozero in about two hundred hours. The concentrations ofn-propanal, n-butanal, and n-octanal are illustrated in Fig.2b. The concentration of n-hexanal is illustrated in Fig.3c.
Concentrations of the two dienals, 2,4-hexadienal andtrans,trans-2,4-heptadienal, exceeded the limits of non-oxidized oils, heptadienal somewhat earlier than hexad-ienal (Fig. 3b).
In addition to hydrocarbons and aldehydes, acetic acid,2-methyltetrahydrofuran, and methyl hexanoate are wor-thy of mention. All of these increased from the begin-
220 Volume 56, Number 2, 2002
FIG. 2. Concentrations of (a) 2-methyl-1,3-butadiene, 1,3,5-trimethylbenzene, and methyl cyclopentane; and (b) n-propanal, n-butanal, and n-octanal (mg/m3 in gas-phase) as a function of time during the oxidation experiment. The error bars represent the standard deviation (n 5 3). Themaximum concentration found from the unoxidized samples is indicated by the dotted line.
ning, but only methyl hexanoate reached its maximumduring the experimental period (Fig. 3a).
CONCLUSION
The oxidation process of linoleic—a-linolenic acidoils, such as rapeseed oils, is well known.15–17 Comparedto our earlier oats and wheat germ investigations,18,19 therapeseed oil contains the same important fatty acids butin clearly different proportions. Turnip rape contains lesslinoleic acid (;20%) and somewhat more a-linolenicacid (;10%)20,21 than extruded oats (linoleic acid ;58%,a-linolenic acid ;9%) and wheat germ (linoleic acid;36%, a-linolenic acid ;1%). However, the pro� les ofthe volatiles differ completely from each other, providingan example of the extreme complexity of the oxidationprocess.
The sample material was too small to draw preciseconclusions about the oxidation process. There were rel-atively large differences in the zero samples, but the ox-idation experiment was made from one lot only. The pri-mary aim of the study was, however, to prove that direct-inlet gas-phase FT-IR can be used to monitor volatilecomponents of rapeseed oil formed during oxidation.
The variation in the concentrations of individual com-pounds was relatively wide, mostly due to the headspacesampling method. This high variation is typical for allheadspace methods, but with the current method it is still
too high. The sampling method can, however, be furtherdeveloped to be more reproducible. The variation is alsoin part due to noise in the FT-IR spectra. This results ingreater variation in the components with smaller concen-trations, especially if their spectra are overlapped byspectra of the major components.
It should also be noted that CLS calculates the con-centration of the component relative to the concentrationof the standard spectrum in the library. Therefore, anyerror in the concentration of the standard spectrum resultsin a systematic error in the concentrations of this com-ponent. The method used for determining the concentra-tions of the standard spectra was not very precise. Thus,different components may have different systematic er-rors in their concentrations. This does not, however, af-fect the relative changes in individual components.
The results of this preliminary study show that direct-inlet gas-phase FT-IR has great potential in the analysisof volatile oils. The main drawback of the method is theneed for a reference method, which ideally is headspacegas chromatography. The reference method is, however,needed only in the development stage of the FT-IR meth-od. Once developed, the FT-IR method can be used alone.The reference method is needed only for screening thepossible volatiles in the sample material and thus, lesssample material is needed. It should also be noted thatonly qualitative information is needed in the method de-
APPLIED SPECTROSCOPY 221
FIG. 3. Concentrations of (a) acetic acid, 2-methyltetrahydrofuran, and methyl hexanoate; (b) trans,trans-2,4-heptadienal and 2,4-hexadienal; and(c) n-hexanal (mg/m3 in gas-phase) as a function of time during the oxidation experiment. The error bars represent the standard deviation (n 5 3).The maximum concentration found from the unoxidized samples is indicated by the dotted line.
velopment; the actual concentrations need not be deter-mined by HS-GC-MS.
The speed of the FT-IR analysis is one of its strengths.The analysis time (15 min sampling and 5 min measur-ing) in the current study is not fully optimized. Short-ening of the measurement time to, e.g., 1 min 15 s wouldresult in one half the signal-to-noise ratio (SNR), whichwould not imply dramatically worse results. The totaltime taken by the sample conditioning could easily bereduced by stabilizing more samples in parallel. The timetaken by the spectral analysis also affects the total anal-ysis time. The CLS-based analysis is automatically per-formed by computer in less than one second and demandsno special analytical skills of the user. It should also benoted that there is no actual recovery time in gas-phaseFT-IR spectroscopy. The sample gas just needs to be re-moved from the sample cell, which takes far less than aminute, depending on the power of the vacuum pump.This increases the total ef� ciency of the FT-IR analysiscompared to other volatile analysis methods.
The FT-IR spectrometers are relatively simple com-pared to many other analytical devices such as gas chro-matographs and mass spectrometers. This simplicitymakes them less vulnerable to ambient conditions. Thus,it is a possible to use FT-IR spectroscopy in productionfacilities and not just in the laboratory. There alreadyexist many � eld and industrial applications of gas-phaseFT-IR, proving its capability22,23 in areas other than the
food industry. Before the gas-phase FT-IR method canbe applied to process control of the vegetable oil industry,the sampling system requires some improvement. In ad-dition, other quality factors of oils can be measured,where comparison of the FT-IR analysis with the sensoryanalysis will be of primary importance.
ACKNOWLEDGMENTS
The authors wish to express their gratitude to TEKES for funding, toRaisio Benecol Ltd for funding and carrying out the oxidation experi-ment and peroxide value determinations, and to Raisio Group plc, Rai-sion Margariini, for providing the sample material.
1. S. van Ruth and J. Roozen, Eur. Food Res. Technol. 210, 258(2000).
2. M. Morales, J. Rios, and R. Aparicio, J. Agric. Food Chem. 45,2666 (1997).
3. M. del Mar Caja, M. Ruiz del Castillo, R. Alvarex, M. Herraiz, andG. Blanch, Eur. Food Res. Technol. 211, 45 (2000).
4. F. Ulberth, Static Headspace Gas Chromatography in the Analysisof Oils and Fats, R. Hamilton, Ed. (Blackie Academic & Profes-sional, London, 1998), pp. 51–86.
5. M. Shimoda, H. Shiratsuchi, Y. Nakada, Y. Wu, and Y. Osajima,Food Chem. 44, 3909 (1996).
6. H. Yang and J. Irudayaraj, J. Am. Oil Chem. Soc. 77, 291 (2000).7. H. Li, F. van der Voort, A. Ismail, and R. Cox, J. Am. Oil Chem.
Soc. 77, 137 (2000).8. H. Li, F. van der Voort, A. Ismail, J. Sedman, R. Cox, C. Simard,
and H. Buijs, J. Am. Oil Chem. Soc. 77, 29 (2000).9. J. Whittinghill, J. Norton, and A. Proctor, J. Am. Oil Chem. Soc.
77, 37 (2000).

222 Volume 56, Number 2, 2002
10. J. Sedman, F. van der Voort, and A. Ismail, J. Am. Oil Chem. Soc.77, 399 (2000).
11. J. Kauppinen, I. Salomaa, and J. Partanen, Appl. Opt. 34, 6081(1995).
12. C. Lawson and R. Hanson, Solving Least Squares Problems (Pren-tice-Hall, Englewood Cliffs, New Jersey, 1974), Chap. 23.
13. P. Saarinen and J. Kauppinen, Appl. Spectrosc. 45, 953 (1991).14. B. Kolb and L. Ettre, Static Headspace-Gas Chromatograpy (Wi-
ley-VCH, New York, 1997).15. J. Snyder, E. Frankel, and E. Selke, J. Am. Oil Chem. Soc. 62,
1675 (1986).16. K. Waerner, E. Frankel, and T. Mounts, J. Am. Oil Chem. Soc. 66,
558 (1989).
17. R. Przybylski, L. Malcomson, N. Eskin, S. Durance-Tod, J. Mickle,and R. Carr, Lebensm.-Wiss. Technol. 26, 205 (1993).
18. O. Sjovall, A. Lapvetelainen, A. Johansson, and H. Kallio, J. Agric.Food Chem. 45, 4452 (1997).
19. O. Sjovall, T. Virtalaine, A. Lapvetelainen, and H. Kallio, J. Agric.Food Chem. 48, 3522 (2000).
20. E. Hansen and L. Skibsted, J. Agric. Food Chem. 48, 3090 (2000).21. A. Schierholt, H. Becker, and W. Ecke, Theor. Appl. Genet. 101,
897 (2000).22. P. Jaakkola, T. Vahlman, A. Roos, P. Saarinen, and J. Kauppinen,
Water, Air, Soil Pollut. 101, 79 (1998).23. K. Larjava, K. Tormonen, P. Jaakkola, and A. Roos, J. Air Waste
Manage. Assoc. 47, 1284 (1997).