Embed Size (px)
Citation preview
Has NCLB Encouraged Educational Triage? Accountability and the Distribution of Achievement Gains
Dale Ballou Matthew G. Springer
Peabody College of Vanderbilt University*
This version: May, 2011 Previous version: Oct., 2008
Corresponding Author:
Professor Dale Ballou Peabody College of Vanderbilt University
Peabody #43, 230 Appleton Place Nashville, Tennessee 37203
615.322.5538 (o) 615.322.6018 (f)
*We thank the Northwest Evaluation Association for providing data for this study as well as an anonymous foundation and the federally-funded National Center on School Choice at Vanderbilt University for research support. We also thank Yanqin Fan, Adam Gamoran, Steve Rivkin, and Kim Rueben for their helpful comments and insights in developing this work as well as seminar participants at the American Education Finance Association, American Educational Research Association, Association for Public Policy Analysis and Management, and Amherst College. Special thanks is due to Art (Xiao) Peng for his research assistance on this project.
Abstract Under No Child Left Behind (NCLB), public schools avoid sanctions when a predetermined percentage of students reach a minimum level of performance ("proficiency"). Accountability systems with this feature have been criticized for creating an incentive to neglect students whose performance is already above the standard or so far below it there is no reasonable likelihood of closing the gap during the current year—in short, to practice a form of educational triage. We examine the effect of this legislation using longitudinal, student-level testing data from four states (N > 2,000,000) between the 2002-03 and 2005-06 school years. Our identification strategy relies on the fact that as NCLB was phased in, states had some latitude in designating which grades were to count for purposes of a school making AYP. We compare the mathematics achievement distribution in a grade before and after it becomes a high-stakes grade. We find in general no support for the strictest form of the triage hypothesis—gains concentrated on marginal students near the proficiency standard. While results vary with sample and model specification, students at the lower end of the achievement distribution generally gain more once their grade starts counting toward AYP. There is some evidence of a trade-off with students at the upper end of the distribution.
1
1. Introduction
The No Child Left Behind Act of 2001 (NCLB) represents a major effort by the federal
government to improve academic performance of students who have traditionally lagged behind.
States have been required to set minimum proficiency standards in reading and mathematics.
Sanctions of increasing severity are to be applied to schools that fail to demonstrate Adequate Yearly
Progress (AYP), determined by the percentage of students achieving the state-defined performance
standard. Over time the percentage of students required to meet this standard is ratcheted upwards,
until virtually all students must score proficient or better in 2014.
NCLB has been criticized for focusing narrowly on a single performance threshold rather
than on gains across the spectrum of achievement. Schools under short-term pressure to raise
performance (i.e., make AYP) may pay greatest attention to students near the threshold, neglecting
students who are already proficient as well as students so far below the standard that there is no
reasonable likelihood of bringing them to that level within the current year. In short, accountability
systems with this feature are thought to encourage a form of educational triage.
That NCLB has in fact had such an effect is now widely believed by educators and others
involved in the formation of education policy. Typical of these views are the following:
“I can tell you anecdotally, after visiting many states in the last several years, that focusing on the bubble kids is an explicit strategy for many districts and schools,” said Margaret Heritage, the assistant director for professional development at the National Center on Evaluation, Standards, and Student Testing, located at the University of California, Los Angeles.” (Viadero, 2007) “But because schools are under pressure to make AYP, which typically means a certain percentage of students must pass state standardized tests, some teachers say they are being told to spend less time working with students who have very little chance of passing. Instead, they are being asked to direct their energies toward so-called ‘bubble kids’ -- students who could pass standardized testing with a little extra help.” (Hart, 2010) “Any single proficiency standard invites sabotaging the goal of teaching all children, because the only ones who matter are those with scores just below passing. Educators
2
call them "bubble kids," a term from poker and basketball, where bubble players or teams are those just on the cusp of elimination. Explicit school policies now demand that teachers ignore already-proficient children to focus only focus only on bubble kids, because inching the bubbles past the standard is all that matters for ‘adequate yearly progress.’” (Rothstein, 2010)
In the research literature, support for the triage hypothesis has been reported by Booher-
Jennings (2005), Krieg (2008; 2011), and Neal and Schanzenbach (2007). The first is a qualitative
case study of instructional practices in a single public elementary school in Texas. Like much
anecdotal evidence, it finds accountability has increased the focus on students near the proficiency
threshold. The two studies by Krieg use test results in Washington state. In schools under increased
pressure to meet AYP, there is a negative effect on students well above or below the proficiency
cutscore, while the subsequent Krieg study finds that students of academically successful racial
groups at a school where another racial group failed to make AYP are expected to score considerably
lower. The fourth study, examining the introduction of high-stakes accountability in Chicago, found
greater than expected gains concentrated in the middle of the achievement distribution, with evidence
of negative effects at the low end and, on select occasions, at the top.1 Such findings lead the authors
to warn that the introduction of NCLB accountability can have a negative impact on the lowest
achievers.
Not all studies have reached this conclusion, however. Dee and Jacob (2011) and Loveless
(2008) detect more improvement in NAEP math scores at the low end of the achievement distribution
than at the top.2 In an examination of North Carolina's accountability systems, Ladd and Lauen
1 In the most dramatic example offered by Neal and Schanzenbach (2007), the fifth grade cohort of 1998, reading scores in the bottom decile fell by a full month of achievement, as large a change in the negative direction as any of the positive effects in the higher deciles. Similarly, Krieg (2011) equates the magnitude of the differential impact of NCLB on racial groups to the conditional impact of switching schools midyear and the conditional achievement differences among students with and without computers at home. 2 Dee and Jacob report that the share of students at the "basic" level (up from "below basic") in fourth grade math increased by 9 percentage points, while the percentage at the next highest level increased by 5 percentage points. In eighth grade math, the increase in the percent basic (5 percentage points) was
3
(2009) take advantage of the fact that over time the state employed two different types of
accountability: a pre-NCLB “growth” system that rewarded schools for the progress made by
students, and a “status” or “single threshold” system during NCLB. The authors report that
achievement gains were more pronounced at the lower end of the distribution than the upper end, but
in the schools facing NCLB-type pressure, there were no gains on average at the high end, while
gains at the low end were substantially greater than other groups. In another North Carolina study,
Lauen and Gaddis (2010) provide evidence that NCLB helped close the gap between the lowest
achieving students and those near the middle of the distribution. Springer (2008) also reports
evidence contrary to the triage hypothesis in that students at all achievement levels improved in an
analysis of third to eighth grade test scores in an unidentified northwestern state.3
2. Identification Strategy NCLB poses some substantial challenges to researchers seeking to measure its impact on
achievement. A simple analysis of trends does not seem satisfactory: the effects of NCLB could be
confounded with other things changing at the same time (such as the testing regime). Responses may
have taken place with a lag of indeterminate length, further complicating the analysis of trends. Most
studies rely on some variety of a difference-in-differences estimator. But because NCLB applies to
all public schools, it is unclear what comparison group provides a relevant counterfactual,
representing what would have happened in the absence of accountability. Schools receiving Title I
funds are subject to NCLB sanctions, while in most states other schools are not. But these two
groups likely differ on multiple dimensions, and even the latter are subject to increased public statistically significant, though overall effect was not. Because NAEP's basic level is close to "proficiency" as defined by many states, these results can be read in more than one way: they may lend support to the hypothesis that schools are focusing on bubble students, but they could also have been produced by gains lower in the distribution. 3 Reback, Rockoff, and Schwartz (2011) find that accountability pressure from NCLB lowers teachers’ perceptions of job security and causes untenured teachers in high-stake grades to work longer hours than their peers. A cross-state analysis by Bernstein (2010) indicates that the introduction of NCLB had no immediate impact on high-achieving students as measured by Advanced Placement test scores.
4
scrutiny and the possibility of being labeled a “failing school” under NCLB. At best this strategy
identifies only part of the effects of the system on achievement.
Other studies have exploited oddities of the system to draw inferences about the
counterfactual. This can be problematic, as in the use of regression discontinuity analysis, comparing
schools that just failed to make adequate yearly progress (AYP) under NCLB to those that barely
succeeded. In an on-going accountability system, the latter schools know that they will run the same
gauntlet again the following year. As a result, the behavior of schools that have barely passed may
differ only slightly from those that have barely failed. That some researchers find a difference
demonstrates that the comparison is not wholly uninformative, but it is likely that it falls far short of
the difference between outcomes under the accountability system and those that would obtain
without it.
In this paper we employ an identification strategy that has not to our knowledge been used by
other researchers. It, too, exploits quirks in the way NCLB was implemented—in particular, the fact
that as NCLB was phased in, not all grades counted as "high stakes" for purposes of determining
whether a school made AYP. While a full implementation of NCLB required testing in grades 3-8
and in one high school grade, in these early years (before 2005) states had the option of designating
one elementary grade and one middle school grade as the grades whose test results would determine
whether the school made AYP. Due to delays in implementing NCLB, in practice this deadline was
not always met until 2006.
The principal reason for this delayed phase-in was to permit states to develop assessments for
grades that had not previously been tested. Before a test was available, a grade was necessarily a
low-stakes grade. Once the test came on line, results for that grade were generally used to determine
AYP. Identifying the effects of NCLB by comparing low-stakes to high-stakes grades would
therefore appear to be infeasible, as the low-stakes grades are precisely those for which no
achievement data are available. However, this is not invariably the case. Districts often pursue their

5
own testing programs, a fact we exploit in order to compare outcomes in low-stakes and high-stakes
grades. Indeed, by restricting the analysis sample to a single grade at a time, we base identification
on outcomes in a grade before it is designated high-stakes with outcomes after it is so designated. By
further restricting the sample (i.e., limiting it to districts and schools that participated in testing under
both regimes), we are able to control for a wide variety of otherwise unobservable factors that
influence achievement. In a manner analogous to the use of school and district fixed effects, we
identify the effects of NCLB from changes that occur within a grade within a given set of schools
when that grade switches status from low-stakes to high-stakes.
We do not claim that this strategy fully allays all concerns about identification. Particularly
in the early years of NCLB, high-stakes grades may have received extra attention and special
treatment not feasible once all grades counted. For example, the best teachers may have been
reassigned to the high-stakes grades, if they were not already there. (Recall that these are typically
grades in which a state was already conducting achievement testing.) If so, a comparison of
outcomes in low- and high-stakes grades could overstate the effects of accountability. We would
agree this is worrisome if the goal is to estimate the effect of accountability on mean achievement.
We believe it is less troubling given the object of this study, which is to examine the effect of
accountability on the distribution of achievement. If, as some researchers have reported, schools
have explicitly instructed teachers to focus their efforts on students near the proficiency threshold, or
if the reason to do so is sufficiently obvious that teachers do not require explicit direction, we would
expect to see evidence of such practices in different achievement distributions, whatever might be
happening to the mean.
We also acknowledge that our identification strategy assumes a certain degree of myopia on
the part of schools. We assume that schools treat students in low-stakes grades differently from
students in high-stakes grades, even though many of the former will be promoted into a high-stakes
grade before leaving the school. If instead schools take the long view, we may fail to find significant
6
differences between low-stakes and high-stakes grades. However, the triage hypothesis itself rests on
very much the same assumption, postulating that schools are focusing their attention on students who
can be brought to the proficiency level within the current year. If schools instead reckon that high-
performing students need to continue to progress in order to meet tougher standards in future grades,
and that the lowest-performing students might require more than a year to catch up but that the
investment will ultimately pay off, triage is much less likely to occur. In addition, we can test the
success of our identification strategy by ascertaining whether there are any differences between the
distribution of outcomes in low-stakes and high-stakes years: to the extent that we find differences
that are not consistent with triage, it would appear that the identification strategy is successful:
schools are responding to NCLB, merely not in the way suggested by the hypothesis.
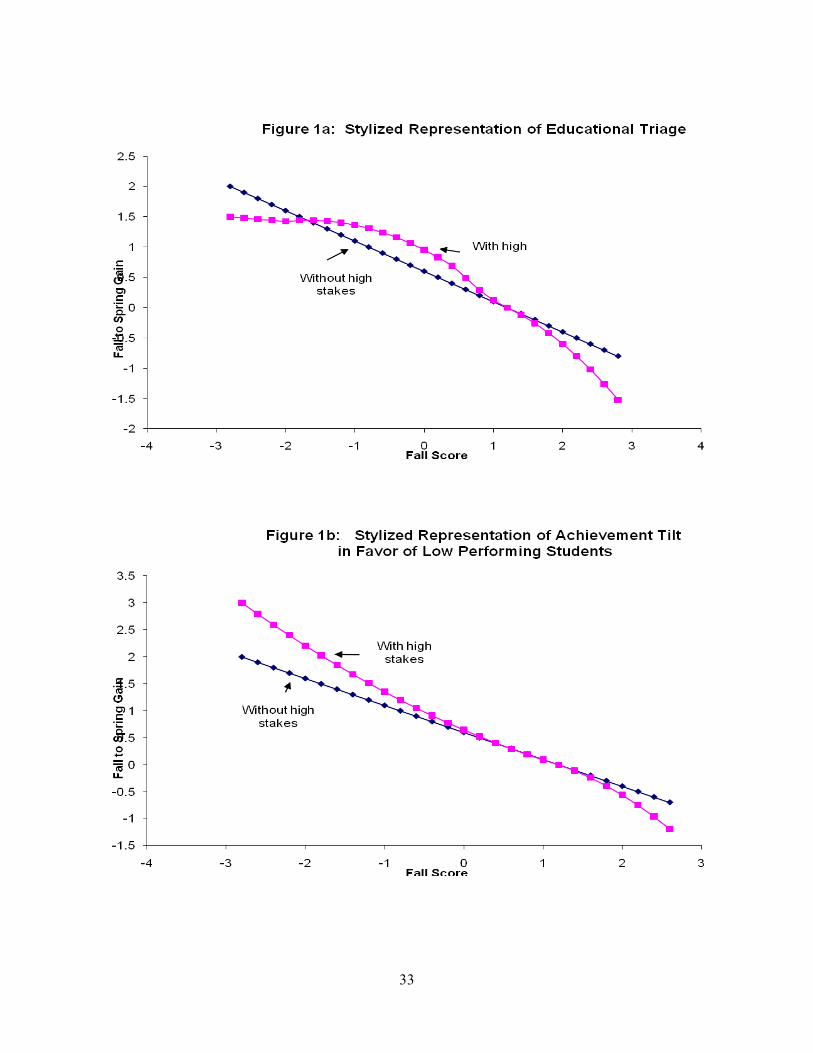
Our empirical strategy, then, is to estimate expected achievement growth over the course of
the academic year as a function of a student's beginning achievement level in the fall. Evidence of
educational triage would take the form of a distortion of that distribution wherein students just below
the proficiency cutscore gain more, while students whose initial performance is well above that level
or well below it gain less. We depict the hypothesized relationship in stylized form in Figure 1a. In
the absence of high-stakes accountability, achievement gains are depicted as a downward sloping
linear function of initial (fall) scores, though neither linearity nor the negative slope is essential.
Regression to the mean would tend to produce a downward sloping relationship, as would
compensatory instructional practices on the part of teachers (a "typical" focus on bringing up students
who are behind). The introduction of high-stakes accountability of the NCLB variety alters
instructional practices. Students "on the bubble" gain more than previously, evident in a flattening
out of the distribution in the vicinity of the cutscore (here: 0). Compared to the original relationship,
the new relationship between initial achievement and gains is more sinusoidal, with a redistribution
of achievement gains away from the ends toward students whose initial performance is nearer the
cutscore.
7
In Figure 1b we have depicted an alternative response to high-stakes accountability that
boosts gains among low-performing students at the expense of high-performing students. There is a
tradeoff here, but it is not triage: all students at the low end of the distribution gain, and those at the
bottom gain the most. The reverse is possible, a tilt that favors high-performing students at the
expense of low performers, though it would be a surprise to find a response of this kind to NCLB. A
third possibility is an across-the-board rise in scores as high-stakes accountability leads schools to
make more effective use of their resources, to the benefit of all students. Finally, there might be no
systematic difference between the high-stakes and low-stakes achievement profiles, but rather
random variation in performance of no particular pattern.
Our findings in this study can be summarized as follows: changes in the distribution of
achievement within our sample rarely resemble Figure 1a (triage). Much more commonly they
resemble Figure 1b (a tilt favoring low achievers), though we also find the other responses described
above: tilts that favor high achievers, across-the-board improvements, and the absence of a
systematic response. In the data we examine, there is exceedingly little support for the hypothesis
that triage has been a frequent—let alone dominant—response to high-stakes accountability under
NCLB.
3. Data
Data for this research are drawn from the Northwest Evaluation Association’s Growth
Research Database. During the period of our study, NWEA contracted with over 3,400 school
districts in 45 states to conduct testing primarily for diagnostic and formative purposes. NWEA has
developed tests in reading, mathematics, language arts, and, more recently, science. Exams at
different grade levels are placed on a single scale to measure student development over time and are
constructed to avoid ceiling effects.
8
Most schools contracting with NWEA test at least twice a year, in the fall and spring, though
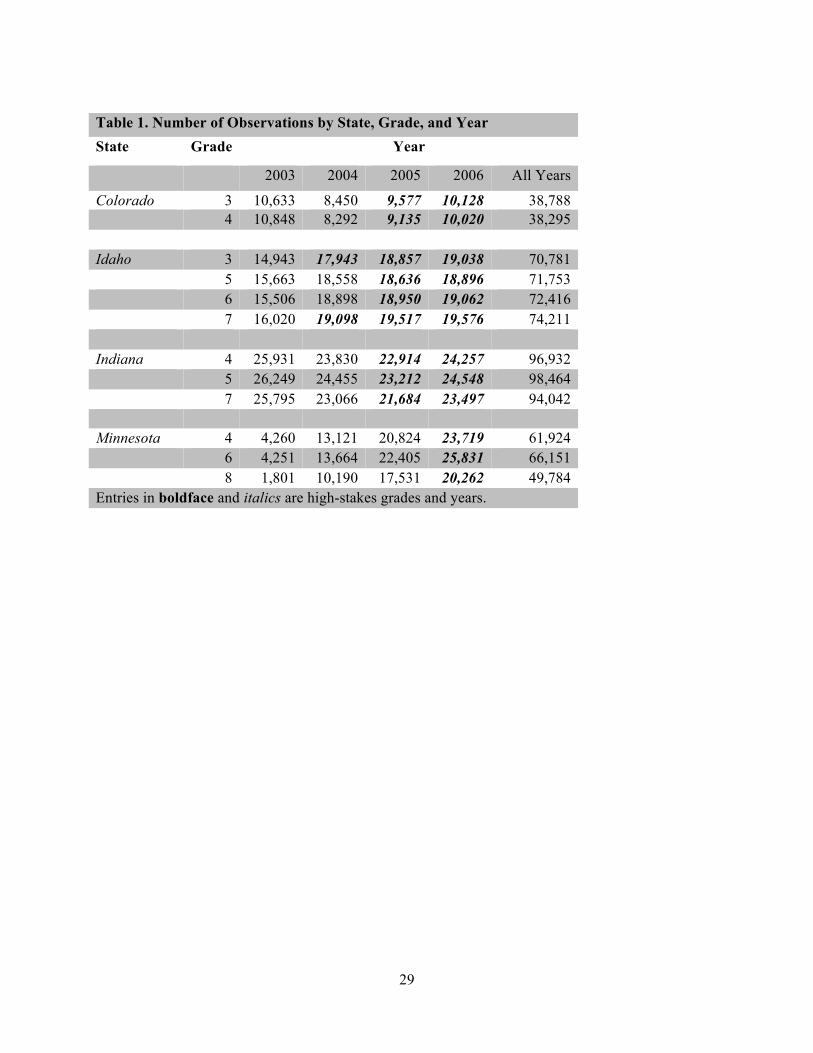
not all districts contracting with NWEA test all of their students. This study uses data from four
states in which comparatively large numbers of students were tested—Colorado, Idaho, Indiana, and
Minnesota (see Table 1 below). While there were other states in which the number of tested students
was as large, those states could not be included in the sample because they had no low-stakes grades,
having designated all grades as high-stakes from the inception of NCLB. We further restrict the
sample to schools that tested at least 80 percent of their students.4 We include only students tested
in both fall and spring in the same school.5
There are several advantages to using NWEA tests as a measure of educational outcomes.
First, the availability of fall-to-spring gain scores allows us to avoid problems that arise when only a
single score is available for a given year. In many administrative data sets, newcomers to a school
will lack prior test scores and must be dropped from the sample. Spring-to-spring gain scores are
also influenced by summer learning loss (or gain). With fall and spring testing, we avoid these
problems.
Because NWEA tests are not in general used for accountability system purposes, results
should be unaffected by attempts by teachers and administrators to game the system by narrowly
teaching to the test, coaching students during testing, or altering student answers after students
complete the assessment.6,7 In addition, NWEA uses a computer-adaptive testing system in which
4 Some districts contract with NWEA to test subpopulations of students (for example, at-risk students). Districts that meet the 80 percent are typically those give the test to everyone: the average test participation rate in our sample exceeds 90 percent. Enrollment figures were obtained from the National Center on Education Statistics’ Common Core of Data. 5 Students who switch schools mid-year do not count when determining a school's AYP status. Equally important, because their growth cannot be attributed to a single school, it is problematic to include them in a particular distribution. 6 See, for example, Grissmer and Flanagan (1998), Koretz (2002), Jacob (2005), and Jacob and Levitt (2007). 7 Idaho is an exception. Through the 2005-06 school year, the state used NWEA exams for its accountability system.
9
questions are drawn from a single, large item bank. There is no single test form used in a given year
and no concern about effects of changing from one test form to another.
Because schools are interested in using the results of NWEA tests to identify students who
need to make extra progress in order to achieve proficiency, NWEA has conducted a series of
technical studies to create crosswalks between scores on its tests in mathematics and reading and
scores on each state’s high stakes assessments. These technical studies are posted on the company’s
web site and information is disseminated to school districts to aid schools in the interpretation of
NWEA test results. Furthermore, NWEA provides reports to classroom teachers and schools within
three days of completing testing so teachers and principals know which students in their classes and
school are on track to meet proficiency standards and which students may require remediation.
NWEA has conducted a technical study of this kind for each of the four states represented in
our sample (see Appendix A: NWEA Score Alignment Studies). While it should not be supposed
that the NWEA tests and state high stakes tests are perfectly equated, the interest in using NWEA test
results to guide instructional decisions and the effort the company has made to assist schools by
providing these technical studies suggests that schools will regard the gap between a student’s fall
score and the cut-score equivalent provided by NWEA as an indication of the progress the student
needs to make in order to reach proficiency. We exploit this information to construct our key
explanatory variable, as explained below.
There are also drawbacks to using NWEA data. The mix of schools represented in the
NWEA data base changes over time as new districts sign contracts with NWEA and old districts
allow existing contracts to elapse. The changing make-up of the population of NWEA schools is
particularly problematic given that our identification strategy rests on another change that occurs
over time, the switching of a grade from low- to high-stakes status. Among our sensitivity tests, we
therefore restrict the analysis to schools that administered NWEA tests in all four sample years.
10
One might also wonder how representative NWEA districts are of the rest of their states. If
the districts signing contracts with NWEA are highly atypical of their states, questions are raised
about the generalizability of our findings (though the internal validity of our analyses is unaffected).
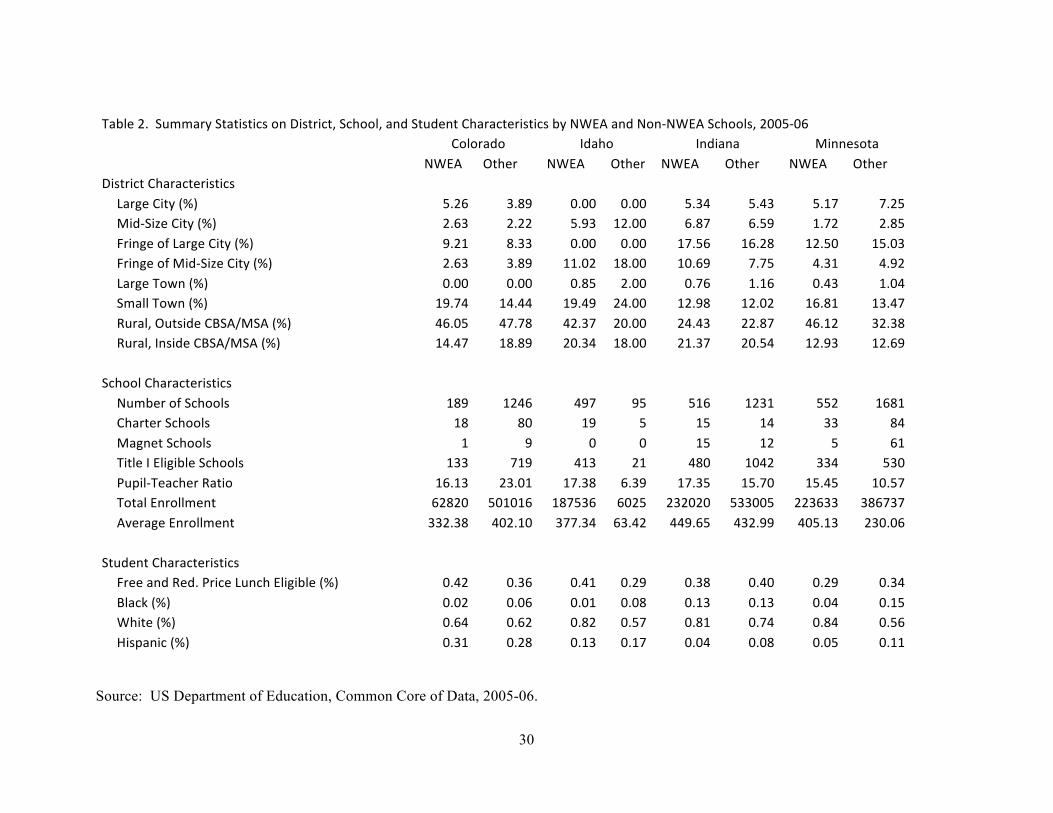
In Table 2 we present characteristics of sample schools and non-sample schools for the four states
included in this study. We use data from the 2005-06 school year for this comparison. Non-NWEA
schools are restricted to schools that have at least some students in the grade range examined in this
study, grades 3-8.
In every state except Colorado, the NWEA sample comprised at least one-fourth of all
schools serving one or more of these grades. In Idaho, the great majority of schools are in the
NWEA sample; those that are not tend to be small schools serving special populations. Elsewhere
there are minor differences between NWEA and non-NWEA schools. In Idaho and Minnesota,
NWEA schools enroll disproportionately many students who are white. In all states the NWEA
sample includes a higher proportion of schools eligible for Title I funds. Charter schools are also
over-represented in the NWEA sample. In Minnesota NWEA schools tend to be larger, with higher
pupil-teacher ratios. They are more likely to be located in rural areas. In Colorado they tend to be
somewhat smaller schools, with lower pupil-teacher ratios. By and large, however, the NWEA
sample is broadly representative of the state as a whole. Certainly nothing here suggests they are
highly atypical with respect to the characteristics shown in Table 2.
An additional complication is created by the fact that students in the same state (and even in
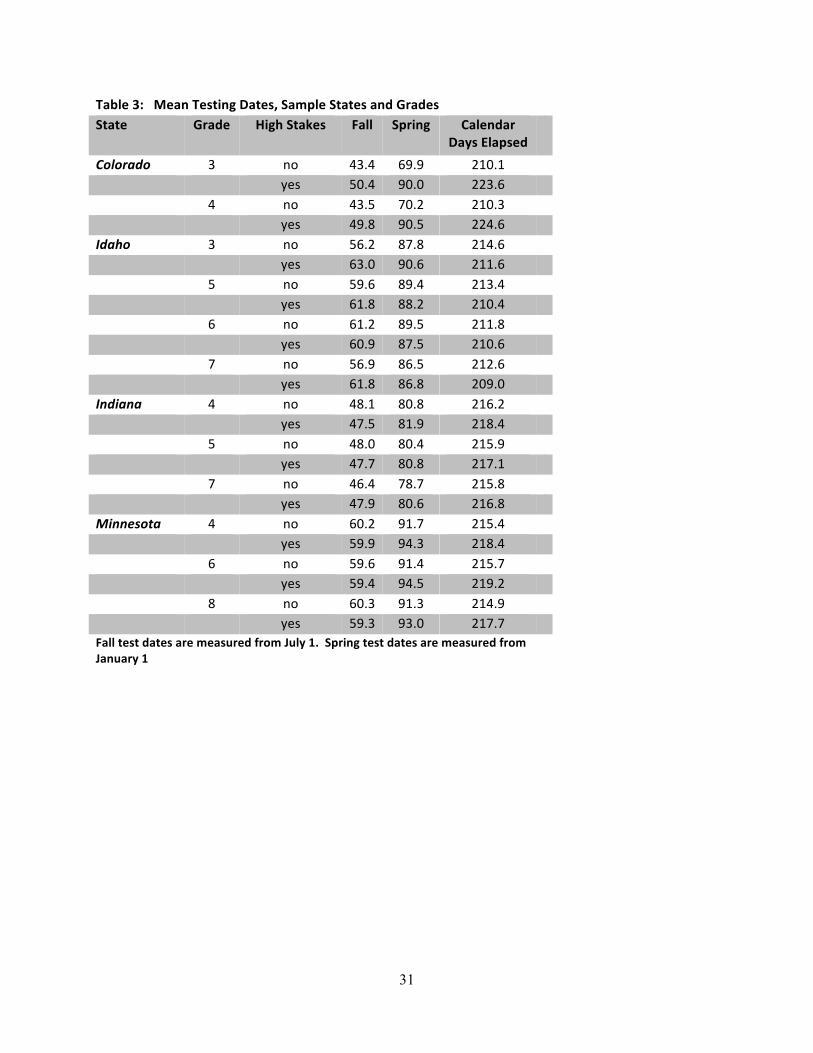
the same district and school) do not take NWEA tests at the same time. To control for the time that
elapses between testing dates, we divide a student’s test score gain by the total number of days
between fall and spring administration of the NWEA test. The assumption that all days within this
interval contribute equally to gains is strong. However, a superior metric is not obvious. Moreover,
as our estimator is based on within-grade changes in test results that accompany within-grade
changes in testing status (high-stakes vs. low-stakes), if testing dates are stable over time, the fact
11
that they vary from district to district should not affect our findings. In Table 3 we show mean fall
and spring test dates by state and grade for low-stakes versus high-stakes years. Apart from
Colorado, where spring test dates are approximately two weeks later during high-stakes years,
differences are not pronounced. We return to this issue as well in our sensitivity tests in section 5
below.
We note, finally, some idiosyncrasies in the implementation of NCLB within our states. In
Colorado separate ratings are issued for elementary and middle school grades even when these
grades are housed in the same school. We treat these cases as effectively two schools for purposes
of analysis. Also in Colorado, the level of achievement termed “proficiency” is not the level
students need to reach for the school to make AYP under NCLB. Rather, “partially proficient” is
treated as “proficient” for purposes of NCLB (though not for the state’s own accountability system).
All references to “proficiency” in Colorado should therefore be understood as applying to level of
achievement the state calls “partially proficient.” In Minnesota the situation is more complicated
than a simple substitution of one term for another. Students who score at the “basic” level in that
state count toward AYP with a weight of .5 (as compared to a student scoring at the proficient level
or higher, who counts with a weight of 1). Thus, Minnesota rewards schools for raising students
from the “below basic” to “basic” levels even if they do not reach proficiency, a policy that should
mitigate against triage.
4. Distribution of achievement: baseline results.
We investigate the effects of NCLB on a standardized gain score (the daily rate of gain
described above, standardized to have a mean of zero and standard deviation of one within each state/
grade). We also standardize the initial level of achievement in the fall. Because attention has
focused on "bubble students" near the threshold of proficiency, we center the standardized fall score
on the proficiency cutscore (literally, the score that NWEA has identified as the cutscore equivalent).
to the state’s score required on a state’s high stakes mathematics test to reach proficiency. Given that
12
the proficiency cutscore does not change over time within a given state and grade, this is an
innocuous normalization provided data for each grade and state are analyzed separately as we have
done.
We use a well-known kernel regression estimator, the Nadaraya-Watson estimator, to obtain
nonparametric estimates of the conditional mean of achievement growth.8 For these baseline
estimates, we have applied the main sample restrictions noted above: schools must test at least 80
percent of their students in the grade in question, and students must have fall and spring test results in
the same school. We examine outcomes in grades that switched from low-stakes to high-stakes
status at some point within the sample period. Counts of schools and students in our baseline sample,
as well as the other samples that we use below, are presented in Table 4.
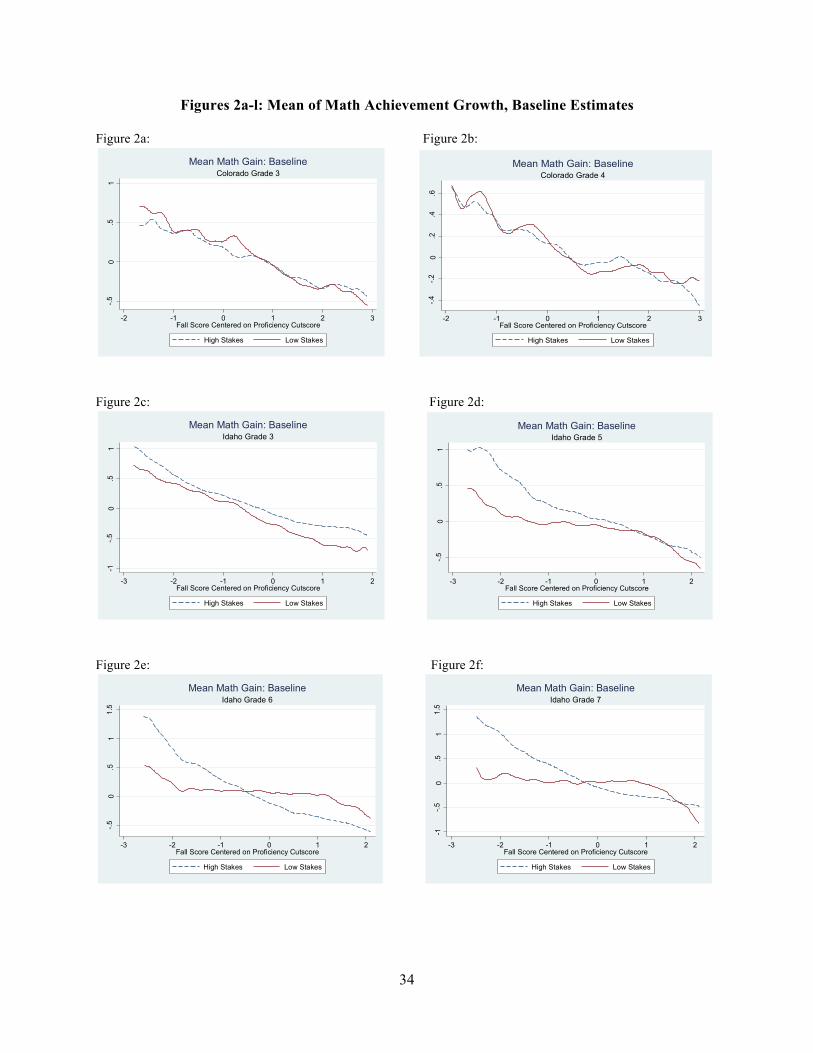
We begin with Figures 2a-b for Colorado, grades 3 and 4. Because non-parametric estimates
of the conditional means can become quite erratic at the extremes of the fall distribution, we trim
from these figures the top and bottom one percent of observations, allowing greater detail to be
shown for the part of the distribution containing 98 percent of the scores. Note also that the vertical
scale differs from one figure to the next. There is no evidence of triage in these figures. Students
scoring just below the cutscore in the fall of third grade actually had greater gains when third grade
was a low-stakes grade than when it became a high-stakes grade. In fourth grade (Fig. 2b) high-
stakes accountability appears to have benefited above average students (those whose fall scores were
a standard deviation or more above the cutscore). In the achievement range where triage would
produce the greatest gains (i.e., students who start the year slightly below the cutscore), the low-
stakes curve lies above the high-stakes curve. The difference in the interval (-.5, 0) is statistically
significant.9
8 We use a Gaussian kernel with bandwidth equal to 0.1. 9 For reasons of legibility, we have omitted error bars from these figures. In Appendix Table B we provide confidence intervals at selected points along the x-axes of all figures presented in this section. This appendix can be found in the on-line version of this paper at
13
In Idaho achievement there was a pronounced change in the distribution associated with the
shift from low- to high-stakes testing, but it did not take the form of triage. Rather, in grades 5, 6,
and 7, the distribution tilted in favor of low-performing students, with the greatest gains for students
who started farthest behind. This corresponds to the tilt depicted in Figure 1b rather than the pattern
characteristic of triage displayed in Figure 1a. In grades 6 and 7 the gains of low achievers came at
the expense of higher-performing students, though not in the lower elementary grades. Thus in Idaho
we find evidence of trade-offs, but not of triage.
In Indiana there is also a tilt in favor of low-achievers, though it is less pronounced than in
Idaho. In every grade, students below the cutscore achieve greater gains after the onset of high-
stakes testing. Detrimental impacts on high achievers vary by grade: limited in grade 4 to the top
students, more widespread in grades 5 and 7.
Minnesota presents more varied responses. In grade 4 high-stakes accountability appears to
have benefited virtually everyone. While the gains are greatest in the middle of the distribution, the
gains are too widely shared to describe this as triage. In grade 6 there are gains for students who are
a standard deviation below the cutscore in the fall. At this grade level, schools have traded off gains
of the highest-achieving students, but there is no evidence that the lowest-performing students have
also been sacrificed, as implied by triage.10 Finally, in grade 8 we see a perverse response:
throughout most of the distribution, gains are lower following the switch to the high-stakes regime,
with the only exception being students who begin the year a standard deviation above the cutscore
(Figure 2l).
To sum up, we fail to find strong, consistent evidence that schools in this sample responded
to NCLB, at least through the 2005-06 school year, by practicing educational triage. Where there http://peabody.vanderbilt.edu/ballou_dale.xml . We have more to say about the question of statistical significance below. 10 The sharp drop in achievement at the far left of Figure 2k is not evidence to the contrary, but rather illustrates how noisy these curves can become at the extremes. The confidence interval around the high-stakes curve has a width of .4 for fall scores equal to -2.3 (the trough in Figure 2k).
14
was improvement in the middle of the distribution, as often as not there was no decline in
performance at the extremes. More commonly there was a tilt in the distribution of achievement in
favor of low performing students (most notably in Idaho, but also in Indiana and Minnesota, grade 6).
Thus, our failure to find evidence of triage is not due to a more general failure of our identification
strategy to find any effects of NCLB. Schools in our sample have responded to high-stakes
accountability—but not by practicing triage.
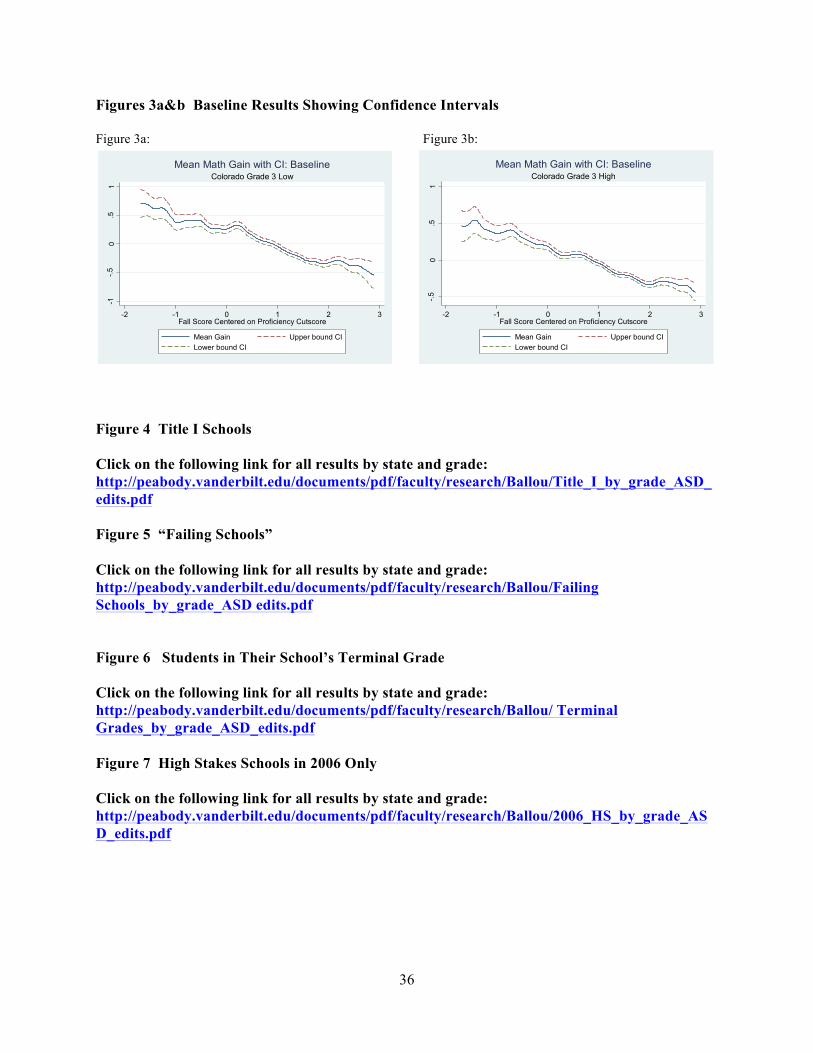
It may be wondered whether our estimates represent statistically significant changes in the
achievement profiles. In Figures 3a&b, we reproduce results for Colorado, grade 3, including
confidence intervals.11 To preserve legibility, low- and high-stakes years are shown separately.12 In
the middle of the distribution, estimates of mean gains are quite precise, though at the extremes they
are much less so. Because sample sizes for Colorado are the smallest of our four states, Figures
3a&b represent the worst case.13 Estimates for Idaho and Indiana are considerably more precise. We
therefore have considerable confidence in our ability to detect changes in the shape of the conditional
mean function in the vicinity of the cutscore: if NCLB induces a focus on "bubble students" that
raises achievement appreciably in that part of the distribution, we should be able to detect it. As one
would expect, the impact far from the cutscore is estimated with much less precision, though in many
instances differences between the high-stakes and low-stakes profiles attain conventional thresholds
of statistical significance. In Appendix Table B (available on-line) we display confidence intervals at
selected points along the x-axis for each of the figures in this paper.14
Some caution must be exercised in using these confidence intervals. The temptation to
conclude that the gap between the two curves is statistically significant when the confidence interval
11 We calculate the approximate confidence intervals given in Hardle et al. (2004, p. 119), based on the large-sample standard errors for the Nadaraya-Watson estimator. 12 Confidence intervals for Colorado are wider than for Idaho and Indiana; about the same (or slightly narrower) than for Minnesota. 13 The confidence intervals at the cutscore have a width of .13 (low-stakes) and .10 (high-stakes). 14 Available on-line at http://peabody.vanderbilt.edu/ballou_dale.xml.
15
for one curve fails to include the point estimate for the other should be resisted. The problem is
essentially that of multiple comparisons: some point estimates will lie outside these intervals simply
by chance. If the hypothesis of interest takes the form: Is achievement in the two regimes the same
for students with a fall score of (say) -.5, then it is correct to apply the conventional test of
significance. However, hypotheses formulated so narrowly are not likely to be what we are
interested in. Rather, we want to know whether one curve is generally above the other, or above the
other over a certain range of fall scores. Still more problematic are hypotheses suggested by the data:
for example, testing whether the gap between high-stakes and low-stakes curves at its widest point is
significant. Such a test requires the distribution under the null of the maximum difference between
one conditional mean function and another. We are unaware of a solution to this problem for
nonparametric regression functions like the Nadaraya-Watson estimator. In place of such tests, we
refer to conventional confidence intervals, acknowledging that the nominal significance level of these
tests is too low and warning the reader against making too much of occasional places where the gap
between the curves widens.
Did the schools in our sample have a reason to practice triage? In the next section, we
report the results of several sensitivity tests, investigating whether triage holds in subsamples of our
data: in other words, whether we can find evidence of triage if we look hard enough. Before doing
so, however, we first take our baseline results at face value and ask whether there are special reasons,
perhaps peculiar to our sample, that these schools did not practice triage. We consider two
possibilities. First, it may be that low-achieving students in our sample have a reasonable chance of
reaching proficiency within the current year. Schools therefore have no reason to write them off.
Second, low-achieving students who are a long way from the cutscore may still be important to
schools that need them in order to make AYP. In such cases, triage simply isn’t an option.
16
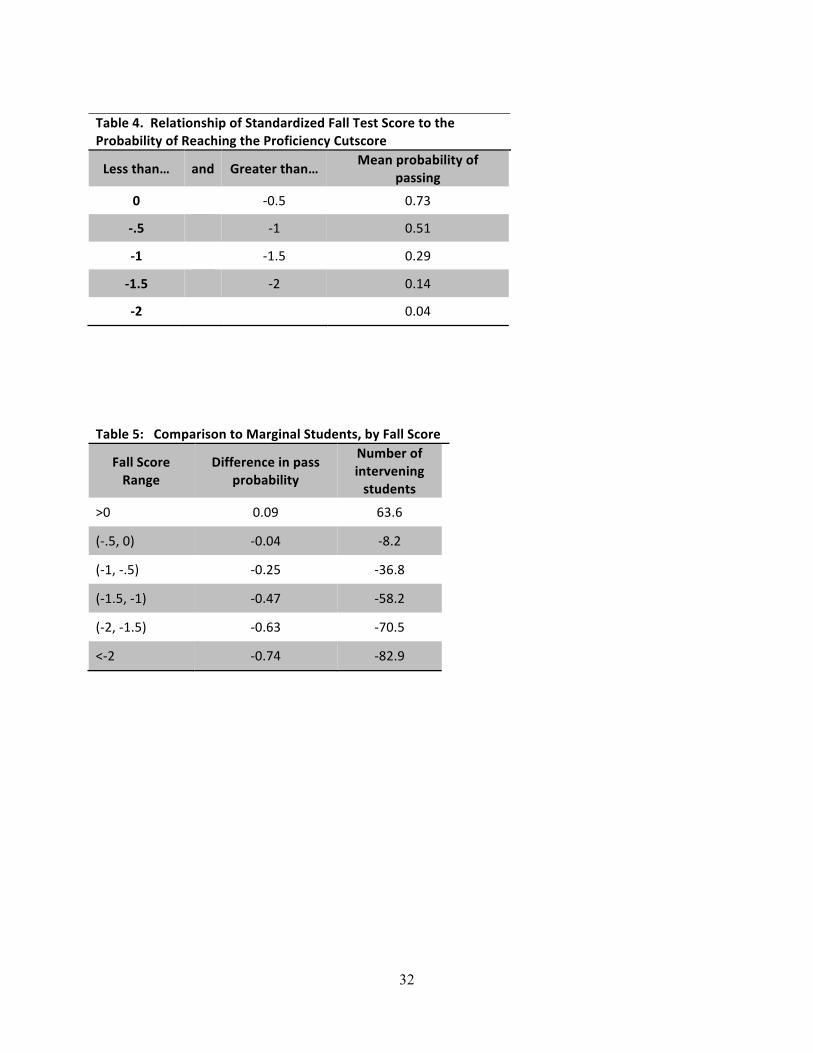
To explore these hypotheses, we begin by estimating the probability that students reach
proficiency when next tested, conditional on their fall performance.15 Our model includes indicators
for state, for grade, for the time that elapses between tests, and for fall scores in math and in reading
interacted with grade level. As one would expect, the fall performance is strongly predictive of
future performance. In our sample, students who are already scoring at the cutscore or higher have a
95 percent chance of reaching that level again when next tested. Depending on state and grade, this
drops to as low as 29 percent for students whose fall scores are half to a full standard deviation below
the cutscore. For students whose fall performance is still worse, the probability of reaching
proficiency when next tested can be quite low. It is therefore not the case that virtually all students in
our sample are “on the bubble”—i.e., have a reasonable chance of reaching proficiency within a year.
On the contrary, students whose performance in the fall is a standard deviation or more below the
cutscore are likely candidates for triage—if triage is being practiced.
What of the second explanation, that schools can’t afford to write these students off because
they can’t make AYP without them? To explore this hypothesis, we rank students in each school by
fall test scores. We identify a marginal student for each school as the Nth student in a school where
N students need to reach proficiency for the school to make AYP. (Only students in high-stakes
grades are ranked.) We then ask where our low-performing students fall relative to the marginal
student in their schools, to ascertain whether the school needs these students in order to make AYP.
Low-performing students who are far below the marginal student would appear to be candidates for
triage.16
15 In states that administer high-stakes tests in the spring, “next tested” means the spring administration of the NWEA math test. A student is deemed to have reached proficiency if they reach the score that NWEA has identified as the equivalent of the proficiency threshold on the state’s high-stakes assessment. In Indiana, where high-stakes tests are given in the fall, “next tested” means the administration of the NWEA test the following fall. 16 This is an oversimplification. As the marginal student is not assured of passing, schools practicing triage will presumably focus instructional effort on some students who are below the marginal student, as insurance.
17
In Table 5 we report two indicators. The first is the difference between a student’s own
probability of reaching proficiency when next tested and the same probability for the school’s
marginal student. A negative value indicates that a student is less likely than the marginal student
reach this level (and therefore represents a candidate for triage). We give the mean values of this
indicator for various ranges of the fall score. As one would expect, this indicator becomes
increasingly negative the further a student’s fall score is from the proficiency threshold. Students
whose scores are 1 to 1.5 standard deviations below the cutscore in the fall are 50 percentage points
less likely to reach proficiency than the marginal student in their schools—a very substantial
difference, indicating that such students are unlikely to be considered on the same bubble as the
marginal student.
We also report a second indicator of the distance between a student and the school’s marginal
student—the number of intervening students in the ranking described above. Once again, the gap
widens as fall performance falls. Students in the same category (1 to 1.5 standard deviations below
the cutscore in the fall) are on average 58 positions below the marginal student in their schools.
(Only students in high-stakes grades are counted.) That is, if the school wants a cushion in the event
the marginal student doesn’t pass, there are 58 other students who represent better bets. By neither
indicator is there much support for the hypothesis that there is little triage in our sample because
virtually all students have to reach proficiency if these schools are to make AYP.
5. Sensitivity tests.
In this section we report the results of a large number of sensitivity tests, looking for
evidence of triage in subsamples of our baseline data. This generates a very large number of
figures—far too many to include in the published version of this paper. Accordingly, we present
only selected results here. Our decision rule is to present those that offer the greatest support for
triage or (if there are no such results) that differ most from the baseline. Where there are no clear
choices by those criteria, we present results for Colorado, grade 4, and Indiana, grade 5, as
18
representative cases.17 Because our purpose is to compare these results with our baseline findings,
we continue to use the same bandwidth of .1 as above, although the sample sizes are often
considerably smaller than the baseline samples and many of the curves are seriously undersmoothed.
We have done this in the knowledge that readers can compensate for undersmoothing by picturing to
themselves a smoother curve; they cannot similarly compensate for oversmoothing.
Title I schools and low-performing schools. To this point our sample has included schools
that do not face sanctions if they fail to make AYP, or that simply have a low probability of failing
and are therefore under little pressure to alter instructional practices. NCLB sanctions generally
apply only to schools receiving Title I funds.18 We therefore limit the sample to Title I schools and
repeat the preceding analyses. Results for Colorado, Idaho, and Indiana are very similar to those
obtained above. This similarity is largely due to the fact that in these states students attending Title I
schools made up more than 70 percent of the baseline sample. This is not true of Minnesota, where
only 38 percent of our sixth grade sample and 15 percent of the eighth grade sample attended Title I
schools. We present results for Minnesota in Figures 4a-c. The estimates become rather noisy,
particularly for grade 8, but there is still no sign of triage in these figures. Even in Minnesota the
results are quite similar to those for our baseline sample.
We have conducted a similar analysis for low-performing schools, defined as schools that
failed to make AYP at some point in our sample period or that were already marked for school
improvement when NCLB began. About 45 percent of our student observations are from schools
that met this criterion. AYP status is, of course, an endogenous variable, and reverse causality is
17 The full set of figures is available in the on-line version of this paper at http://peabody.vanderbilt.edu/ballou_dale.xml. 18 States have the option of applying these sanctions to non-Title I schools. Most do not. Colorado, Indiana, and Minnesota do not hold non-Title I schools accountable under NCLB. Chronically low-performing non-Title I schools are held accountability under Public Law 221 in Indiana which preceded NCLB by two years, but does not carry sanctions like NCLB. Idaho holds non-Title I schools accountable under NCLB.
19
possible: a school might have failed to make AYP because it did not engage in triage.19 However,
anecdotal evidence strongly suggests that it is schools that are failing to make AYP where the
pressure on teachers to focus on “bubble” students is greatest. We suspect that most persons
convinced that schools are practicing triage would be surprised to find that evidence of that practice
is no stronger in these schools than in schools that have made AYP.
In fact, that is what we find.20 Achievement profiles in low-performing schools are
remarkably similar to those in our baseline sample. We present results for Indiana, grade 5, and
Minnesota, grades 6 and 8, to illustrate. In Indiana, grade 5, high-stakes accountability raised
outcomes for the lowest achieving students, but compared to the baseline there is less evidence that
students above the cutscore were affected negatively. In Minnesota, grade 8, the gap between low-
and high-stakes profiles has also diminished relative to the baseline estimates, though the latter still
lies below the former for students below the cutscore. There is still no evidence of triage. If
anything, these results suggest that low-performing schools may have concentrated on raising
achievement across-the-board with the advent of high-stakes accountability. On the whole, however,
the differences between low-performing schools and the baseline sample are subtle. These
differences are still smaller in the grades and states not shown here.
Terminal grade students. As noted above, the triage hypothesis rests on the assumption that
schools behave myopically, focusing their attention on students who can be brought to the
proficiency level within the current year. If instead schools take the long view, we ought not to be
surprised at finding few systematic differences between low-stakes and high-stakes grades.
19 Unfortunately, alternative classifications of at-risk schools failed to discriminate well between schools that failed to make AYP and those that did not. Using a school’s prior year status to circumvent endogeneity also proved impracticable, given our identification strategy: low-stakes years are concentrated at the beginning of our sample period, when few schools are labeled as “failing” based on prior performance. 20 Because fewer than five percent of our Colorado observations are in schools that meet this criterion, we have no estimates for that state.
20
There is, however, one case in which a short time-horizon is not particularly myopic:
students who are in their final year in a school. If the low achievers in this group cannot be brought
to the proficient level within the current year, the school has no long-term stake in raising their
achievement, at least from the standpoint of making AYP. Likewise, if students start the year
comparatively assured of reaching the proficiency threshold for that grade, the school has no long-
term stake in moving them forward, even though they will be tested again and held to higher
standards in the future. By that time, they will be someone else’s students. Thus terminal-grade
students would appear to offer the most favorable setting for triage: if NCLB has induced triage
anywhere, presumably it is there.
We have repeated the previous analyses, restricting our samples to students in the final grade
offered by a school. Due to the configuration of grade levels within schools, we lose several of our
state/grade samples. In the other cases, we retain only some of the students in the baseline samples.
(For example, only in some Idaho schools is grade 5 a terminal grade.) In Figures 6a-c we present
results for Idaho, grade 5, Indiana, grade 5, and Minnesota, grade 6. In all three cases our results are
the same as for the baseline samples: low-achieving students have benefitted from high-stakes
accountability, even when they begin the year a full standard deviation or more below the proficiency
cutscore. Idaho we find the same tilt in favor of low-achieving students that we have seen
previously. In Indiana the low-stakes profile is flatter than the high-stakes profile in the
neighborhood of the cutscore—the opposite of the pattern associated with focusing on the bubble
students. We also see the same gain at the low end of the distribution from the switch to high-stakes
accountability that we saw in our baseline results. Minnesota results are also quite similar to the
baseline estimates.
Triage masked by reassignment of effective teachers. Because NCLB did not require high-
stakes testing in all grades immediately, schools might have attempted to game the system by placing
their most effective teachers in high-stakes grades. If these teachers had the ability to reach students
21
at all levels of ability—if they didn’t need to practice triage because they were effective all around—
then their superior teaching might be the reason we fail to see a focus on “bubble” students. Had less
capable teachers been assigned to the high-stakes grades, triage (so the argument goes) would have
been more apparent.
We doubt that this explains our failure to find stronger evidence of triage. Unlike some state
accountability systems in which the same one or two grades were designated to administer high-
stakes tests year in and year out, under NCLB all grades from 3 to 8 would eventually count for
purposes of determining AYP. Given the personal inconvenience to teachers and the probable
impact on their effectiveness from frequent changes in assignment, it seems unlikely that school
administrators would have shifted their best teachers across grades for such uncertain and short-lived
gains. However, the hypothesis is tested easily enough. By 2005, grades 3-8 were all supposed to be
giving high stakes tests. Even allowing for the fact that this target was not met in some states, by
2006 all grades in our sample were designated high stakes, making it impossible for an administrator
to game the system by assigning the school’s best teachers to the high stakes grades.
Accordingly, we have re-estimated the achievement relationship using restricted samples in
which high-stakes data are drawn only from the final year, 2006. (For low-stakes grades we use all
the data.) In Minnesota, these estimates are identical to our baseline results, because 2006 was the
year in which grades 4, 6, and 8 became high-stakes grade. We show results for Colorado, grade 4,
and Indiana, grades 5 and 7, in Figures 7a-c. The Colorado results are very similar to the baseline
estimates. In both Indiana grades, students who started the year a standard deviation or more below
the cutscore do not appear to have gained quite as much from the switch to high-stakes accountability
as our baseline results indicated, but students nearer the cutscore, in the (-1,0) range, have done better
than in the baseline. Thus there may have been more of a focus over time on students near the
cutscore, but the 2006 data still do not show that the lowest-achieving students have gained less after
the switch to high-stakes accountability, as implied by triage.
22
Peculiarities of the NWEA sample. Finally, we consider the possibility that our findings are
heavily influenced by peculiar features of our sample, raising doubts about their stability and
generalizability. We consider four such features: (1) Compositional changes due to districts starting
or dropping contracts with NWEA; (2) Changes in familiarity with NWEA tests; (3) Variation in
testing dates and the time between fall and spring tests; (4) The limited number of states.
Our identification strategy relies on within-grade, within-state comparisons over time.
Because the NWEA sample also changes as new contracts are signed and old contracts are allowed to
lapse, the effect of switching from low-stakes to high-stakes status could be confounded with
changes in sample composition. Accordingly, we have redone all analyses using a sample restricted
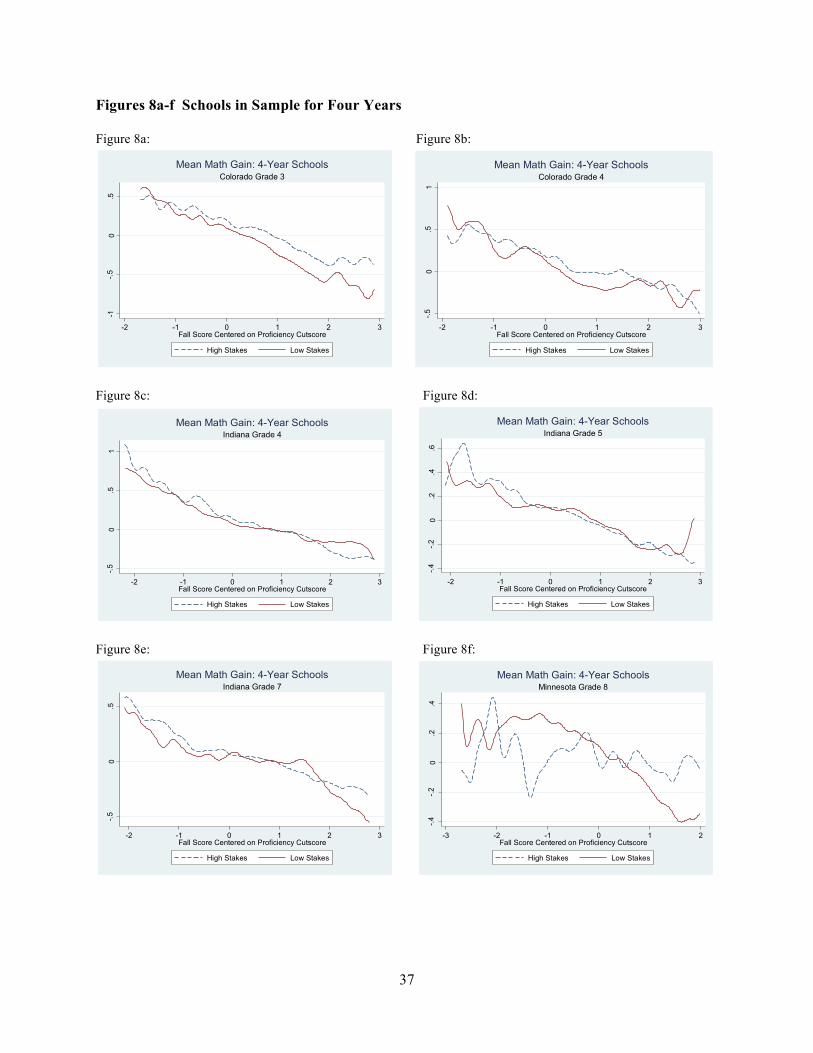
to schools for which we have four years of data.
In Figures 8a-h, we display results for all states except Idaho, where the baseline samples
already meet this restriction. Overall, they offer no more support for triage than the baseline results.
In Minnesota, grades 6 and 8, students below the cutscore fare considerably worse under high-stakes
accountability than in the baseline, but these samples are small (Nhigh-stakes = 1812 in grade 8) and
conventional confidence intervals around the lowest points in these profiles include zero. Students
nearer the cutscore are not doing significantly better or worse than in low-stakes years, so there is
little indication that triage was taking place (at least, it wasn't working). Students above the cutscore
fared better under high-stakes accountability, also inconsistent with triage.
In most locations, NWEA tests are administered on computers, a format that may be
unfamiliar and confusing to many students. One might expect scores to improve as students have
more opportunities to take the test, particularly among low-income students who have less exposure
to computers at home. If so, a negative impact of accountability on low achievers (i.e., triage) could
be masked by greater learning-by-doing in that part of the achievement distribution.
To remove this possible confounding factor, we have restricted our sample to students taking
NWEA tests for the first time. Due to high levels of student mobility, there are substantial numbers
23
of such students at all grade levels both before and after the switch to high-stakes accountability. It
will be old news by now that the results show no more support for triage than our baseline findings.
In Figures 9a and b we show again the estimated achievement profiles for Colorado, grade 4, and
Indiana, grade 5. For other grades and states the conclusion is the same.
Next, we investigate the possibility that our findings have been affected by changes in testing
dates. As noted above, there is variation between and even within schools in the dates on which
NWEA tests are taken. Within-school variation in a given year does not appear to be particularly
problematic. Most students at a particular grade-level take the test within a few days of one another.
Between schools and within a school over time, variation is greater. While we have controlled for
this by expressing fall-to-spring gains on a per day basis, it may be that this solution is too crude: the
effectiveness of instruction might depend on when within the school year it is given, and variation in
the latter could conceivably be correlated with the switch from a low-stakes to high-stakes regime.
Accordingly, we have identified a set of schools where testing dates varied little over the
sample period. Because there is no single test date within a school, we measured stability as follows.
First, we found the date (measured from July 1 for the fall and from January 1 for the spring) by
which 10 percent of a school’s students (at a particular grade level) had been tested. We then found
the date by which 90 percent of the students in that grade had been tested. We then required that
neither of these two dates vary by more than two weeks over the four years of our study period.
Schools meeting these criteria were deemed to have stable testing regimes. Depending on grade and
state, between a quarter and a half of the original student sample is found in these schools.
Estimates obtained using this sample are shown in Figures 10a and b for Colorado, grade 4,
and Indiana, grade 5. There is nothing here that resembles triage, nor is there in the results for states
and grades not shown.
Finally we turn to the possibility that our findings reflect outcomes in a small number of
states that may be atypical. Our ability to test this hypothesis is limited. Although there are other
24
states in which NWEA tests are widely used (e.g., California, South Carolina), these states
designated all grades 3-8 as high-stakes at the start of NCLB and therefore do not lend themselves to
our identification strategy. There are other states that phased in high-stakes accountability, though
NWEA testing in those states during our sample period was much less extensive than in the four
states we have examined in this paper. We have conducted analyses identical to those reported here
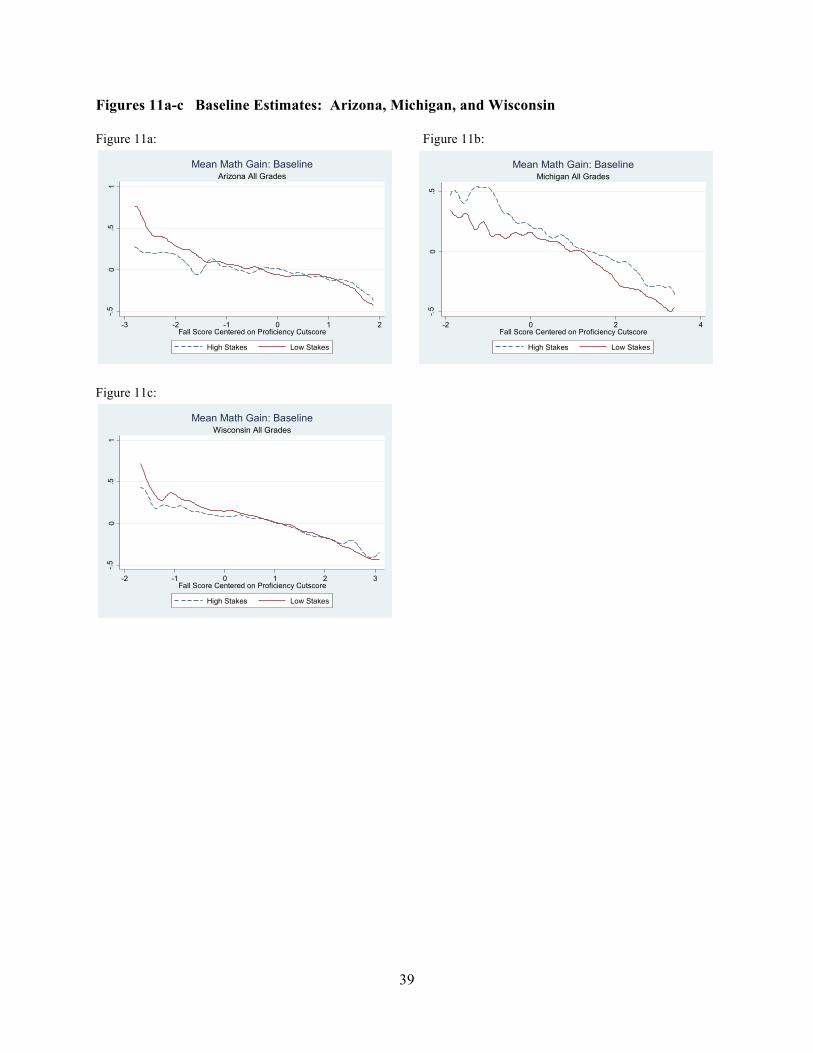
on three of these states in which our samples are largest: Arizona, Michigan, and Wisconsin. Given
the smaller number of observations available in these states, we pool data across grades. Results for
the baseline samples are depicted in Figures 11a-c. In Arizona, the onset of high-stakes
accountability has been accompanied by a drop in fall-to-spring gains among the lowest achieving
students (a standard deviation or more below the fall mean), but without offsetting gains elsewhere.
The same is true to a lesser degree of Wisconsin. In Michigan high-stakes accountability has been
accompanied by an outward shift of achievement at all levels. None of these cases resembles triage.
6. Conclusion
This study has investigated whether NCLB has led schools to practice a form of educational
triage, wherein the instructional focus is on students near the proficiency threshold, to the detriment
of those well above and below it. We find very little support for this hypothesis. While there are
isolated grades within states where the switch from low- to high-stakes testing was accompanied by
an improvement in outcomes restricted to the part of the achievement distribution implied by triage,
there were not many such cases compared to those in which the majority of students below the
cutscore saw gains, with estimated gains greatest among the lowest performing students.
Given the widespread view that schools are focusing their efforts on "bubble" students, it is
worth considering some reasons why our findings are not consistent with this belief. First, it may
well be that administrators are directing teachers to focus on the students who can be brought to
proficiency within the year, but that teachers are not complying. It is difficult to write off children.
To the extent that teachers must make decisions involving instructional trade-offs, many teachers
25
have traditionally focused their instruction primarily on students in the middle. It is likely that they
find it difficult to deviate from this practice. It is also possible that for many teachers, focusing on
bubble students is not that different from focusing on students in the middle, particularly if tracking
and other forms of ability grouping draw off the students at the top end.
It is also possible that teachers are trying to focus on students on the "bubble," but that the
practices they have adopted have had the unintended consequence of benefiting the lowest-
performing students. That is, teachers are trying to practice triage, but they miscalculate. If the
lowest-performing students benefit most from having the instructional level brought down and the
pace slowed somewhat, but not to the degree that would occur if their teachers expressly focused on
their needs, then an attempt to pursue triage has the results we have seen.
Although we do not find much evidence of triage, we do find trade-offs wherein achievement
profiles tilt in favor of low-performing students at the expense of students at the upper end of the
distribution (Idaho, grades 6 and 7; Indiana, all grades). It is not obvious that this has to happen. It
may be possible to reconfigure classes to protect above-average students from these effects. But it
appears that it does happen.
The pronounced gains for low-performing students in Idaho require special explanation. We
think it unlikely that Idaho teachers are philosophically more averse to triage than teachers
elsewhere, or that they share a greater dedication to raising the achievement of the weakest students.
The most likely explanation for the difference between Idaho and other states is that the NWEA tests
were used as Idaho's high-stakes examination during our sample years. These were the tests that
mattered for determining whether a school had made AYP. If triage were the dominant response to
high-stakes accountability, particularly with respect to performance on the high-stakes assessment,
we should have seen evidence to that effect in Idaho. Instead, we find indications of a change in
instructional practices that benefited all low-performing students, with substantial gains for those
furthest behind.
26
This paper has focused on the early years of NCLB. It is possible, of course, that the
pressure to practice triage has increased in recent years—though we note that the triage hypothesis
was applied to state and district accountability systems even before NCLB was launched. While in
principle it would be possible to extend the analysis here to include data from beyond the 2005-06
school year, given the identification strategy employed here, we have not done so. By 2005-06, all
grades from 3 to 8 were high stakes. Thus, additional data on the high stakes regime would
necessarily have been drawn from years increasingly remote from the period when testing was low
stakes. Moreover, alternative and arguably superior identification strategies are available for later
years, notably the use of the Annual Measurable Objective (the percentage of students who must
score proficient for a school to make AYP, which has been ratcheted up over time) as an instrument
for past failures to make AYP and the level of sanctions to which schools will be subject if
performance does not improve.
The results here are certainly not the last word on triage or the distributional effects of
NCLB. However, we do believe they cast considerable doubt on the conventional wisdom—that
schools are focusing on bubble students to the detriment of both higher and lower achievers. We
simply have not found evidence in these states that the inception of high stakes accountability
worsened outcomes for low-achieving students. On the contrary, the evidence indicates that they
benefitted. Gains were not always very great. Progress has been slow. But the claim that these
students are being left behind appears to have no empirical foundation in these states during the
period of this study.
27
References
Bernstein, B. (2010). The Effects of NCLB on High-Achieving Students: A Cross-State Analysis. Accessed from http://websv03a.colgate.edu/portaldata/imagegallerywww/21c0d002-4098-4995-941f-9ae8013632ee/ImageGallery/Bernstein%202010.pdf. Booher-Jennings, J. (2005). Below the bubble: “Educational triage” and the Texas accountability system. American Educational Research Journal, 42(2), 231-268. Dee, T. and Jacob, B. (2011). The Impact of No Child Left Behind on Student Achievement. Journal of Policy Analysis and Management. Deere, D., and Strayer, W. (2001). Putting schools to the test: School accountability, incentives, and behavior. Unpublished manuscript, Texas A&M University. Grissmer, D. and Flanagan, A. (1998). Exploring the rapid achievement gains in North Carolina and Texas. A report from the National Education Goals Panel. Hardle, Wolfgang, et al. (2004) Nonparametric and semiparametric models. Berlin: Springer-Verlag. Li, Danielle. (2010). Unintended Consequences. No Child Left Behind and the Allocation of School Leaders. MIT Department of Economics Working Paper. Jacob, B. (2005). Accountability, incentives, and behavior: The impact of high-stakes testing in the Chicago Public Schools. Journal of Public Economics, 89, 761-796. Jacob, B. and Levitt, S. (2007). Rotten apples: An investigation of the prevalence and predictors of teacher cheating. Quarterly Journal of Economics, 118(3), 761-796. Koretz, D. (2002). Limitations in the use of achievement tests as measures of educators’ productivity. Journal of Human Resources, 37(4), 752-777. Krieg, J.M. (2008). Are students left behind? The distributional effects of the No Child Left Behind Act. Education Finance and Policy, 3(3), 250-281. Krieg, J.M. (2008). Are students left behind? The distributional effects of the No Child Left Behind Act. Economics of Education Review, 3(3), 250-281. Loveless, T. (2008). High-Achievement Students in the Era of NCLB. Fordham Foundation. Neal, D. and Schanzenback, D.W. (forthcoming). Left behind by design: Proficiency counts and test-based accountability. Review of Economics and Statistics. Reback, R., Rockoff, J. and Schwartz, H.L. (2011). Under Pressure: Job Security, Resource Allocation, and Productivity Under NCLB. NBER Working Paper 16745. Cambridge, MA.

28
Rothstein, Richard. 2009. ""No Child Left Behind" Has Failed and Should Be Abandoned." Opposing Viewpoints: Education. David M. Haugen. Detroit: Greenhaven Press, 2009. Retrieved 5/27/2011 at http://dhs.wikispaces.com/file/view/No+Child+Left+Behind-failed.pdf Springer, M.G. (2008). The influence of an NCLB accountability plan on the distribution of student test score gains. Economics of Education Review, 27(5), 556-563. Wood, Simon N. 2006. Generalized Additive Models. An Introduction with R. London: Chapman and Hall.
29
Table 1. Number of Observations by State, Grade, and Year State Grade Year
2003 2004 2005 2006 All Years
Colorado 3 10,633 8,450 9,577 10,128 38,788 4 10,848 8,292 9,135 10,020 38,295 Idaho 3 14,943 17,943 18,857 19,038 70,781 5 15,663 18,558 18,636 18,896 71,753 6 15,506 18,898 18,950 19,062 72,416 7 16,020 19,098 19,517 19,576 74,211 Indiana 4 25,931 23,830 22,914 24,257 96,932 5 26,249 24,455 23,212 24,548 98,464 7 25,795 23,066 21,684 23,497 94,042 Minnesota 4 4,260 13,121 20,824 23,719 61,924 6 4,251 13,664 22,405 25,831 66,151 8 1,801 10,190 17,531 20,262 49,784 Entries in boldface and italics are high-stakes grades and years.
30
Table 2. Summary Statistics on District, School, and Student Characteristics by NWEA and Non-‐NWEA Schools, 2005-‐06
Colorado Idaho Indiana Minnesota
NWEA Other NWEA Other NWEA Other NWEA Other
District Characteristics
Large City (%) 5.26 3.89 0.00 0.00 5.34 5.43 5.17 7.25
Mid-‐Size City (%) 2.63 2.22 5.93 12.00 6.87 6.59 1.72 2.85
Fringe of Large City (%) 9.21 8.33 0.00 0.00 17.56 16.28 12.50 15.03
Fringe of Mid-‐Size City (%) 2.63 3.89 11.02 18.00 10.69 7.75 4.31 4.92
Large Town (%) 0.00 0.00 0.85 2.00 0.76 1.16 0.43 1.04
Small Town (%) 19.74 14.44 19.49 24.00 12.98 12.02 16.81 13.47
Rural, Outside CBSA/MSA (%) 46.05 47.78 42.37 20.00 24.43 22.87 46.12 32.38
Rural, Inside CBSA/MSA (%) 14.47 18.89 20.34 18.00 21.37 20.54 12.93 12.69
School Characteristics
Number of Schools 189 1246 497 95 516 1231 552 1681
Charter Schools 18 80 19 5 15 14 33 84
Magnet Schools 1 9 0 0 15 12 5 61
Title I Eligible Schools 133 719 413 21 480 1042 334 530
Pupil-‐Teacher Ratio 16.13 23.01 17.38 6.39 17.35 15.70 15.45 10.57
Total Enrollment 62820 501016 187536 6025 232020 533005 223633 386737
Average Enrollment 332.38 402.10 377.34 63.42 449.65 432.99 405.13 230.06
Student Characteristics
Free and Red. Price Lunch Eligible (%) 0.42 0.36 0.41 0.29 0.38 0.40 0.29 0.34
Black (%) 0.02 0.06 0.01 0.08 0.13 0.13 0.04 0.15
White (%) 0.64 0.62 0.82 0.57 0.81 0.74 0.84 0.56
Hispanic (%) 0.31 0.28 0.13 0.17 0.04 0.08 0.05 0.11
Source: US Department of Education, Common Core of Data, 2005-06.
31
Table 3: Mean Testing Dates, Sample States and Grades State Grade High Stakes Fall Spring Calendar
Days Elapsed
Colorado 3 no 43.4 69.9 210.1 yes 50.4 90.0 223.6 4 no 43.5 70.2 210.3 yes 49.8 90.5 224.6 Idaho 3 no 56.2 87.8 214.6 yes 63.0 90.6 211.6 5 no 59.6 89.4 213.4 yes 61.8 88.2 210.4 6 no 61.2 89.5 211.8 yes 60.9 87.5 210.6 7 no 56.9 86.5 212.6 yes 61.8 86.8 209.0 Indiana 4 no 48.1 80.8 216.2 yes 47.5 81.9 218.4 5 no 48.0 80.4 215.9 yes 47.7 80.8 217.1 7 no 46.4 78.7 215.8 yes 47.9 80.6 216.8 Minnesota 4 no 60.2 91.7 215.4 yes 59.9 94.3 218.4 6 no 59.6 91.4 215.7 yes 59.4 94.5 219.2 8 no 60.3 91.3 214.9 yes 59.3 93.0 217.7 Fall test dates are measured from July 1. Spring test dates are measured from January 1
32
Table 4. Relationship of Standardized Fall Test Score to the Probability of Reaching the Proficiency Cutscore
Less than… and Greater than… Mean probability of passing
0 -‐0.5 0.73
-‐.5 -‐1 0.51
-‐1 -‐1.5 0.29
-‐1.5 -‐2 0.14
-‐2 0.04
Table 5: Comparison to Marginal Students, by Fall Score
Fall Score Range
Difference in pass probability
Number of intervening students
>0 0.09 63.6
(-‐.5, 0) -‐0.04 -‐8.2
(-‐1, -‐.5) -‐0.25 -‐36.8
(-‐1.5, -‐1) -‐0.47 -‐58.2
(-‐2, -‐1.5) -‐0.63 -‐70.5
<-‐2 -‐0.74 -‐82.9
33
34
Figures 2a-l: Mean of Math Achievement Growth, Baseline Estimates Figure 2a: Figure 2b:
-.50
.51
-2 -1 0 1 2 3Fall Score Centered on Proficiency Cutscore
High Stakes Low Stakes
Colorado Grade 3Mean Math Gain: Baseline
-.4-.2
0.2
.4.6
-2 -1 0 1 2 3Fall Score Centered on Proficiency Cutscore
High Stakes Low Stakes
Colorado Grade 4Mean Math Gain: Baseline
Figure 2c: Figure 2d:
-1-.5
0.5
1
-3 -2 -1 0 1 2Fall Score Centered on Proficiency Cutscore
High Stakes Low Stakes
Idaho Grade 3Mean Math Gain: Baseline
-.50
.51
-3 -2 -1 0 1 2Fall Score Centered on Proficiency Cutscore
High Stakes Low Stakes
Idaho Grade 5Mean Math Gain: Baseline
Figure 2e: Figure 2f:
-.50
.51
1.5
-3 -2 -1 0 1 2Fall Score Centered on Proficiency Cutscore
High Stakes Low Stakes
Idaho Grade 6Mean Math Gain: Baseline
-1-.5
0.5
11.
5
-3 -2 -1 0 1 2Fall Score Centered on Proficiency Cutscore
High Stakes Low Stakes
Idaho Grade 7Mean Math Gain: Baseline

35
Figure 2g: Figure 2h: -.5
0.5
1
-2 -1 0 1 2 3Fall Score Centered on Proficiency Cutscore
High Stakes Low Stakes
Indiana Grade 4Mean Math Gain: Baseline
-.4
-.2
0.2
.4.6
-2 -1 0 1 2 3Fall Score Centered on Proficiency Cutscore
High Stakes Low Stakes
Indiana Grade 5Mean Math Gain: Baseline
Figure 2i: Figure 2j:
-.50
.5
-2 -1 0 1 2 3Fall Score Centered on Proficiency Cutscore
High Stakes Low Stakes
Indiana Grade 7Mean Math Gain: Baseline
-.50
.51
-3 -2 -1 0 1 2Fall Score Centered on Proficiency Cutscore
High Stakes Low Stakes
Minnesota Grade 4Mean Math Gain: Baseline
Figure 2k: Figure 2l:
-.4-.2
0.2
-2 -1 0 1 2Fall Score Centered on Proficiency Cutscore
High Stakes Low Stakes
Minnesota Grade 6Mean Math Gain: Baseline
-.4-.2
0.2
.4
-3 -2 -1 0 1 2Fall Score Centered on Proficiency Cutscore
High Stakes Low Stakes
Minnesota Grade 8Mean Math Gain: Baseline
\
36
Figures 3a&b Baseline Results Showing Confidence Intervals
Figure 3a: Figure 3b:
-1-.5
0.5
1
-2 -1 0 1 2 3Fall Score Centered on Proficiency Cutscore
Mean Gain Upper bound CILower bound CI
Colorado Grade 3 LowMean Math Gain with CI: Baseline
-.50
.51
-2 -1 0 1 2 3Fall Score Centered on Proficiency Cutscore
Mean Gain Upper bound CILower bound CI
Colorado Grade 3 HighMean Math Gain with CI: Baseline
Figure 4 Title I Schools Click on the following link for all results by state and grade: http://peabody.vanderbilt.edu/documents/pdf/faculty/research/Ballou/Title_I_by_grade_ASD_edits.pdf Figure 5 “Failing Schools” Click on the following link for all results by state and grade: http://peabody.vanderbilt.edu/documents/pdf/faculty/research/Ballou/Failing Schools_by_grade_ASD edits.pdf Figure 6 Students in Their School’s Terminal Grade Click on the following link for all results by state and grade: http://peabody.vanderbilt.edu/documents/pdf/faculty/research/Ballou/ Terminal Grades_by_grade_ASD_edits.pdf Figure 7 High Stakes Schools in 2006 Only Click on the following link for all results by state and grade: http://peabody.vanderbilt.edu/documents/pdf/faculty/research/Ballou/2006_HS_by_grade_ASD_edits.pdf
37
Figures 8a-f Schools in Sample for Four Years Figure 8a: Figure 8b:
-1-.5
0.5
-2 -1 0 1 2 3Fall Score Centered on Proficiency Cutscore
High Stakes Low Stakes
Colorado Grade 3Mean Math Gain: 4-Year Schools
-.50
.51
-2 -1 0 1 2 3Fall Score Centered on Proficiency Cutscore
High Stakes Low Stakes
Colorado Grade 4Mean Math Gain: 4-Year Schools
Figure 8c: Figure 8d:
-.50
.51
-2 -1 0 1 2 3Fall Score Centered on Proficiency Cutscore
High Stakes Low Stakes
Indiana Grade 4Mean Math Gain: 4-Year Schools
-.4-.2
0.2
.4.6
-2 -1 0 1 2 3Fall Score Centered on Proficiency Cutscore
High Stakes Low Stakes
Indiana Grade 5Mean Math Gain: 4-Year Schools
Figure 8e: Figure 8f:
-.50
.5
-2 -1 0 1 2 3Fall Score Centered on Proficiency Cutscore
High Stakes Low Stakes
Indiana Grade 7Mean Math Gain: 4-Year Schools
-.4-.2
0.2
.4
-3 -2 -1 0 1 2Fall Score Centered on Proficiency Cutscore
High Stakes Low Stakes
Minnesota Grade 8Mean Math Gain: 4-Year Schools
38
Figure 9 Schools New To NWEA Testing Click on the following link for all results by state and grade: http://peabody.vanderbilt.edu/documents/pdf/faculty/research/Ballou/New_to_NWEA_by_grade_ASD_edits.pdf Figure 10 Schools with Stable Testing Dates Click on the following link for all results by state and grade: http://peabody.vanderbilt.edu/documents/pdf/faculty/research/Ballou/Stable_Test_Dates_by grade_ASD_edits.pdf
39
Figures 11a-c Baseline Estimates: Arizona, Michigan, and Wisconsin Figure 11a: Figure 11b:
-.50
.51
-3 -2 -1 0 1 2Fall Score Centered on Proficiency Cutscore
High Stakes Low Stakes
Arizona All GradesMean Math Gain: Baseline
-.50
.5
-2 0 2 4Fall Score Centered on Proficiency Cutscore
High Stakes Low Stakes
Michigan All GradesMean Math Gain: Baseline
Figure 11c:
-.50
.51
-2 -1 0 1 2 3Fall Score Centered on Proficiency Cutscore
High Stakes Low Stakes
Wisconsin All GradesMean Math Gain: Baseline
40
Appendix A: NWEA Score Alignment Studies
Arizona Cronin, J. (2003). Aligning the NWEA RIT Scale with Arizona’s Instrument to Measure Standards (AIMS). Lake Oswego, OR: Northwest Evaluation Association Research Report 2003.3. http://www.nwea.org/assets/research/state/Arizona%20complete%20report.pdf Cronin, J. and Bowe, B. (2003). A Study of the Ongoing Alignment of the NWEA RIT Scale with the Arizona Instrument to Measure Standards (AIMS). Lake Oswego, OR: Northwest Evaluation Association Research Report. http://www.nwea.org/assets/research/state/Arizona%20Final%20Draft.pdf Cronin, J. and Dahlin, M. (2007). A Study of the Alignment of the NWEA RIT Scale with the Arizona Assessment System. Lake Oswego, OR: Northwest Evaluation Association Research Report. http://www.nwea.org/assets/research/state/Arizona%20Alignment%20Report%204.18.07.pdf Colorado Cronin, J. (2003). Aligning the NWEA RIT Scale with the Colorado Student Assessment Program (CSAP) Tests. Lake Oswego, OR: Northwest Evaluation Association Research Report 2003.2. http://www.nwea.org/assets/research/state/Colorado%20complete%20report.pdf Bowe, B. and Cronin, J. (2006). A Study of the Ongoing Alignment of the NWEA RIT Scale with the Colorado Student Assessment Program (CSAP). Lake Oswego, OR: Northwest Evaluation Association Research Report. http://www.nwea.org/assets/research/state/Colorado%20study%20document%20revised.pdf Cronin, J. (2007). A Study of the Alignment of the NWEA RIT Scale with the Colorado Assessment System. Lake Oswego, OR: Northwest Evaluation Association Research Report. http://www.nwea.org/assets/research/state/Colorado%20Alignment%20Report%204.18.07.pdf Idaho NWEA test is the high-stakes assessment during the period under study. Indiana Cronin, J. (2003). Aligning the NWEA RIT Scale with the Indiana Statewide Testing for Educational Progress Plus (ISTEP+). Lake Oswego, OR: Northwest Evaluation Association Research Report 2003.3. http://www.nwea.org/assets/research/state/Indiana%20complete%20report.pdf Cronin, J. and Bowe, B. (2005). A Study of the Ongoing Alignment of the NWEA RIT Scale with the Indiana Statewide Testing for Educational Progress Plus (ISTEP+). Lake Oswego, OR: Northwest Evaluation Association Research Report. http://www.nwea.org/assets/research/state/Indiana%202005.pdf
41
Cronin, J. (2007). A Study of the Alignment of the NWEA RIT Scale with the Indiana Assessment System. Lake Oswego, OR: Northwest Evaluation Association Research Report. http://www.nwea.org/assets/research/state/Indiana%20Alignment%20Report%205.21.07.pdf Michigan Bowe, B. (2006). Aligning the NWEA RIT Scale with the Michigan Educational Assessment Program. Lake Oswego, OR: Northwest Evaluation Association Research Report. http://www.nwea.org/assets/research/state/Michigan%20Study%20documentv5.pdf Cronin, J. (2007). A Study of the Alignment of the NWEA RIT Scale with the Michigan Assessment System. Lake Oswego, OR: Northwest Evaluation Association Research Report. http://www.nwea.org/assets/research/state/Michigan%20Alignment%20Report%205.22.07.pdf Minnesota Cronin, J. (2004). Adjustments made to the Results of the NWEA RIT Scale Minnesota Comprehensive Assessment Alignment Study. Lake Oswego, OR: Northwest Evaluation Association Research Report. http://www.nwea.org/assets/research/state/Michigan%20Study%20documentv5.pdf Cronin, J. (2007). A Study of the Alignment of the NWEA RIT Scale with the Minnesota Assessment System. Lake Oswego, OR: Northwest Evaluation Association Research Report. http://www.nwea.org/assets/research/state/Minnesota%20Alignment%20Report%204.18.07.pdf Wisconsin Cronin, J. (2004). Aligning the NWEA RIT Scale with the Wisconsin Knowledge and Concepts Exams. Lake Oswego, OR: Northwest Evaluation Association Research Report. http://www.nwea.org/assets/research/state/Wisconsin%20executive%20summary.pdf Adkins, D. (2007). A Study of the Alignment of the NWEA RIT Scale with the Wisconsin Assessment System. Lake Oswego, OR: Northwest Evaluation Association Research Report. http://www.nwea.org/assets/research/state/Wisconsin%20Alignment%20Report%205.22.07.pdf
42
Appendix B: Nadaraya-Watson Estimates of the Conditional Mean, with Confidence Intervals
To view these statistics for all results by state and grade, click on the following link:
http://peabody.vanderbilt.edu/documents/pdf/faculty/research/Ballou/ci_limits_new.pdf