Embed Size (px)
Citation preview
Title: NVT Harvest Report – Eyre Peninsula
ISSN: 2652-5747 (online)
Published: April 2021
Authors: Katherine Hollaway, Astute Ag and Dr Sue Knights, SE Knights Consulting
Acknowledgements: We would like to thank all those who provided information and assistance with the development of this Harvest Report.
© Grains Research and Development Corporation 2021
This book is copyright. Except as permitted under the Copyright Act 1968 (Commonwealth) and subsequent amendments, no part of this publication may be reproduced, stored or transmitted in any form or by any means, electronic or otherwise, without the specific written permission of the copyright owner.
GRDC contact details: Ms Maureen Cribb Integrated Publications Manager PO Box 5367 KINGSTON ACT 2604
Email: [email protected]
Design and production: Coretext, www.coretext.com.au
COVER: NVT site at Dalby, Queensland. PHOTO: Dan Smith, University of QueenslandDISCLAIMER: Any recommendations, suggestions or opinions contained in this publication do not necessarily represent the policy or views of the Grains Research and Development Corporation. No person should act on the basis of the contents of this publication without first obtaining specific, independent professional advice.The Grains Research and Development Corporation will not be liable for any loss, damage, cost or expense incurred or arising by reason of any person using or relying on the information in this publication.
3HARVEST REPORTEYRE PENINSULA
TABLE OF CONTENTS
INTRODUCTION 4
WHEAT 6
BARLEY 13
OAT 19
CANOLA 21
FABA BEAN 26
FIELD PEA 28
LENTIL 31
LUPIN 34
USEFUL NVT TOOLS 36
This guide can be downloaded to your computer or tablet at: grdc.com.au/harvestreports
LOW HIGH
LEGEND: MEAN VARIETY YIELD PERFORMANCE
Long-term mean yield illustrated by colour gradient from low (red) to high (green)
DISEASE RATING COLOUR RANGEVS SVS S MSS MS MRMS MR RMR R
Disease severity scale from very susceptible (VS) to resistant (R)
Refer to the latest South Australian Crop Sowing Guide for further information at grdc.com.au/NVT-south-australian-crop-sowing-guide
4HARVEST REPORTEYRE PENINSULA
INTRODUCTION
This NVT Harvest Report provides information to support growers and advisers with decisions on variety selection for Eyre Peninsula. The information has been generated from the Grains Research and Development Corporation’s (GRDC) National Variety Trials (NVT) database. This publication provides a summary of the 2020 and long-term yield performance of varieties of crop species suitable for production in Eyre Peninsula together with their quality and disease responses.The NVT program provides growers and advisers with comparative data on yield performance, quality and disease resistance ratings of commercially available grain varieties that is independent, consistent, timely and robust.Conducted to a set of predetermined protocols, trials are sown and managed to reflect local best practice such as sowing time, fertiliser application, weed management, pest/disease control and fungicide application. The NVT is not designed to grow varieties to their maximum yield potential.GRDC acknowledges that an ongoing project of this type would not be possible without the cooperation of growers prepared to contribute sites and who often assist with the management of trials on their property.
INTERPRETING LONG-TERM YIELD DATA A factor analytic (FA) mixed model approach is used in the multi-environment trial (MET) analysis conducted by GRDC, supported by the Statistics for the Australian Grains Industry (SAGI) program. This approach generates long-term MET values for varieties at an individual trial level.This format provides more detailed data to better understand a variety’s performance over several years at the individual trial/environment level, rather than just a single averaged value.In this Eyre Peninsula Harvest Report, results are presented for yield and quality in year groupings for the past five years. Further detailed interrogation of the NVT Online dataset using the NVT Long Term Yield Reporting Tool will provide more specific performance data on all varieties of each crop species in each NVT location throughout Eyre Peninsula.The results presented in this Harvest Report are based on the default filters in the NVT Long Term Yield Reporting Tool. In some cases, trial results are excluded because they do not meet the default standards for statistical validity. These are listed in the tables as ‘Trial results below standard’. Trials below standard can be viewed by reducing the default VAF settings within the Long Term Reporting Tool.
DISEASE INFORMATIONThe disease ratings in the report are current at the time of publication. Regularly visit www.nvtonline.com.au/crop-disease to find the latest NVT disease ratings.
Refer to the latest South Australian Crop Sowing Guide for further information at grdc.com.au/NVT-south-australian-crop-sowing-guide
5HARVEST REPORTEYRE PENINSULA
INTRODUCTION
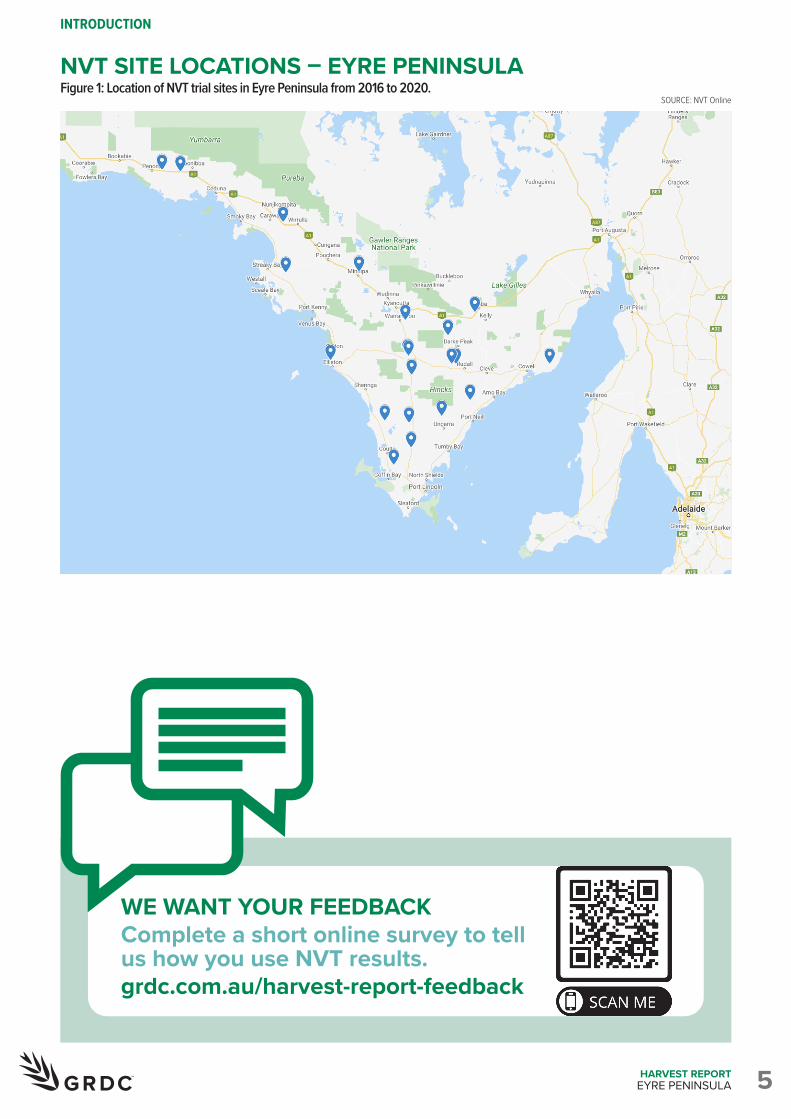
NVT SITE LOCATIONS – EYRE PENINSULA Figure 1: Location of NVT trial sites in Eyre Peninsula from 2016 to 2020.
SOURCE: NVT Online
WE WANT YOUR FEEDBACK Complete a short online survey to tell us how you use NVT results.grdc.com.au/harvest-report-feedback
6HARVEST REPORTEYRE PENINSULA
WHE
ATBA
RLEY
OAT
CANO
LAFI
ELD
PEA
LENT
ILLU
PIN
FABA
BEA
N
WHEAT
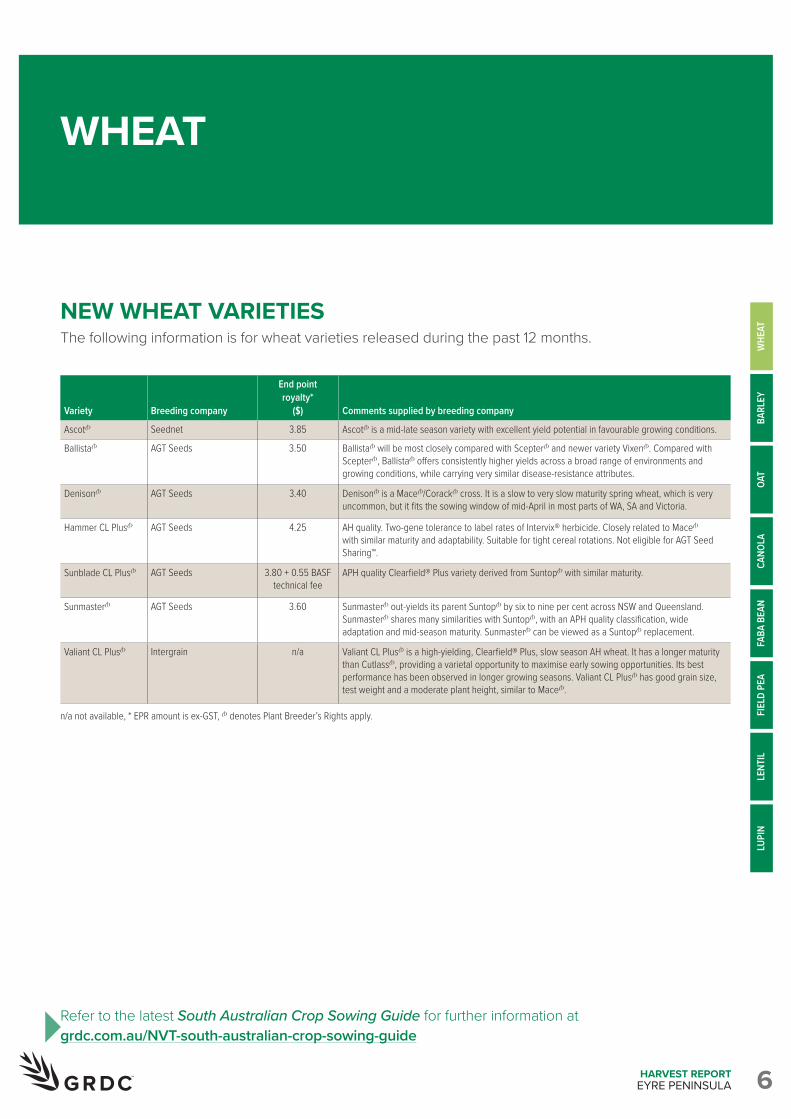
NEW WHEAT VARIETIESThe following information is for wheat varieties released during the past 12 months.
Variety
Breeding company
End point royalty*
($)
Comments supplied by breeding company
AscotA Seednet 3.85 AscotA is a mid-late season variety with excellent yield potential in favourable growing conditions.
BallistaA AGT Seeds 3.50 BallistaA will be most closely compared with ScepterA and newer variety VixenA. Compared with ScepterA, BallistaA offers consistently higher yields across a broad range of environments and growing conditions, while carrying very similar disease-resistance attributes.
DenisonA AGT Seeds 3.40 DenisonA is a MaceA/CorackA cross. It is a slow to very slow maturity spring wheat, which is very uncommon, but it fits the sowing window of mid-April in most parts of WA, SA and Victoria.
Hammer CL PlusA AGT Seeds 4.25 AH quality. Two-gene tolerance to label rates of Intervix® herbicide. Closely related to MaceA with similar maturity and adaptability. Suitable for tight cereal rotations. Not eligible for AGT Seed Sharing™.
Sunblade CL PlusA AGT Seeds 3.80 + 0.55 BASF technical fee
APH quality Clearfield® Plus variety derived from SuntopA with similar maturity.
SunmasterA AGT Seeds 3.60 SunmasterA out-yields its parent SuntopA by six to nine per cent across NSW and Queensland. SunmasterA shares many similarities with SuntopA, with an APH quality classification, wide adaptation and mid-season maturity. SunmasterA can be viewed as a SuntopA replacement.
Valiant CL PlusA Intergrain n/a Valiant CL PlusA is a high-yielding, Clearfield® Plus, slow season AH wheat. It has a longer maturity than CutlassA, providing a varietal opportunity to maximise early sowing opportunities. Its best performance has been observed in longer growing seasons. Valiant CL PlusA has good grain size, test weight and a moderate plant height, similar to MaceA.
n/a not available, * EPR amount is ex-GST, A denotes Plant Breeder’s Rights apply.
Refer to the latest South Australian Crop Sowing Guide for further information at grdc.com.au/NVT-south-australian-crop-sowing-guide
7HARVEST REPORTEYRE PENINSULA
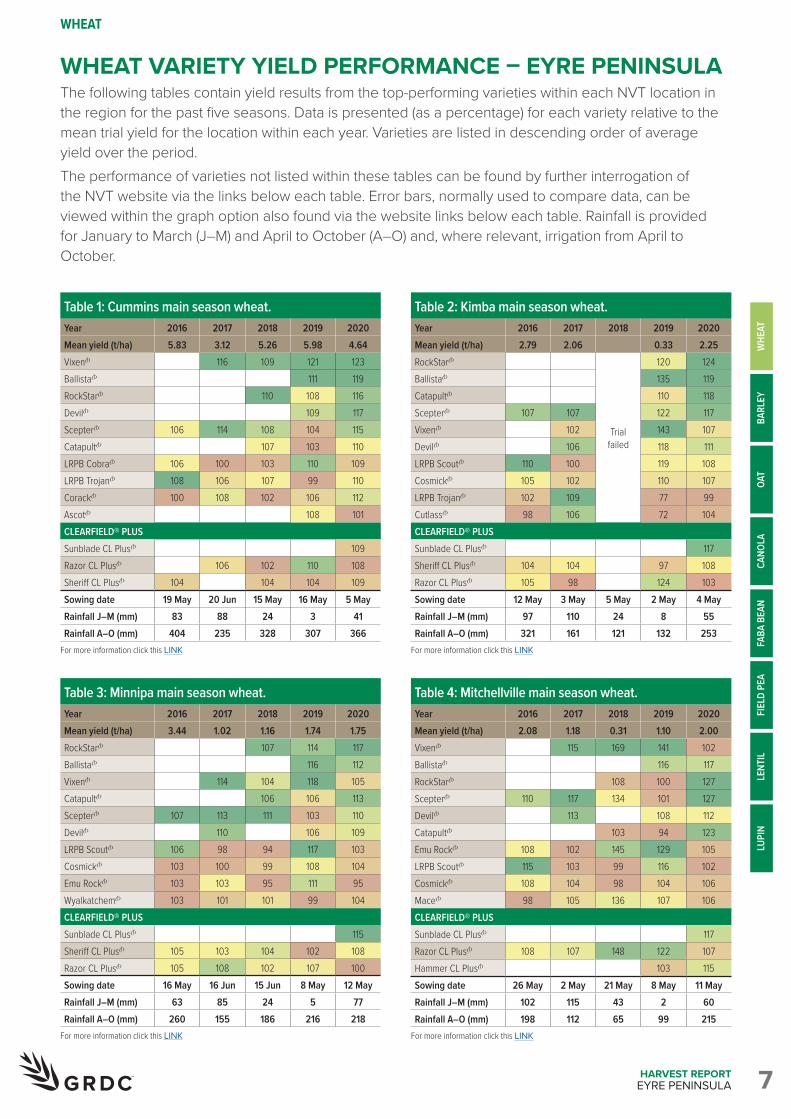
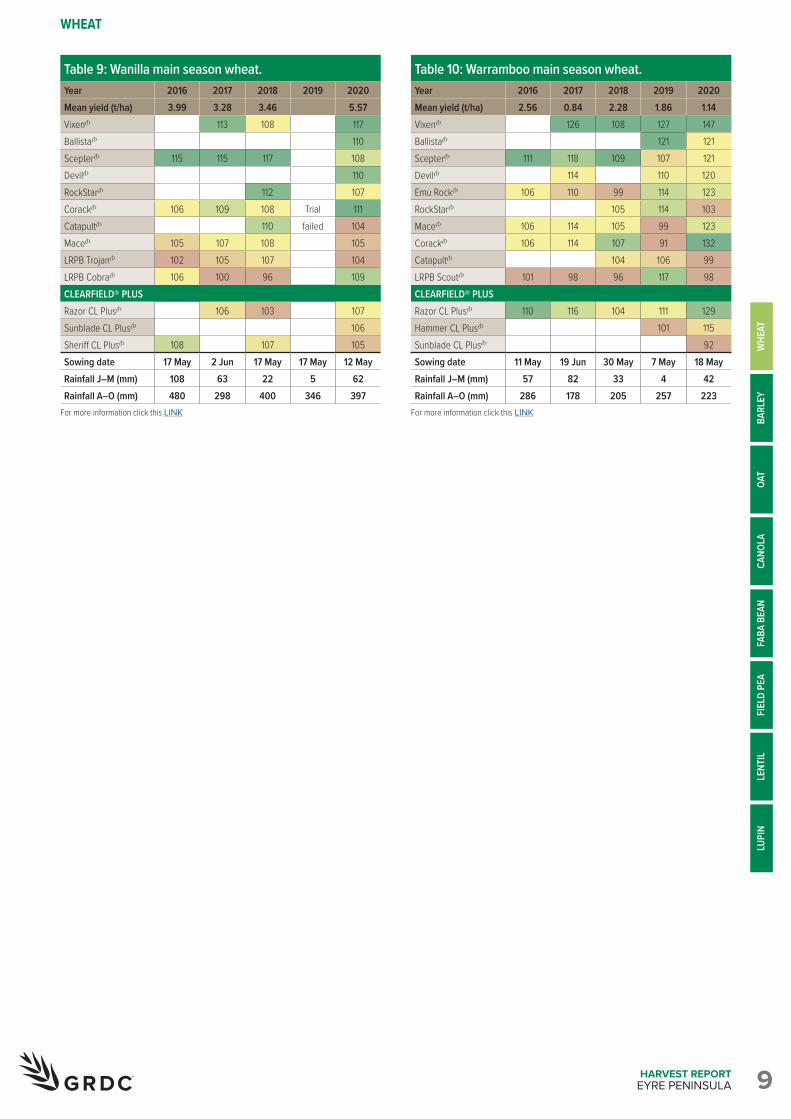
WHEAT VARIETY YIELD PERFORMANCE – EYRE PENINSULAThe following tables contain yield results from the top-performing varieties within each NVT location in the region for the past five seasons. Data is presented (as a percentage) for each variety relative to the mean trial yield for the location within each year. Varieties are listed in descending order of average yield over the period. The performance of varieties not listed within these tables can be found by further interrogation of the NVT website via the links below each table. Error bars, normally used to compare data, can be viewed within the graph option also found via the website links below each table. Rainfall is provided for January to March (J–M) and April to October (A–O) and, where relevant, irrigation from April to October.
Table 1: Cummins main season wheat.Year 2016 2017 2018 2019 2020Mean yield (t/ha) 5.83 3.12 5.26 5.98 4.64VixenA 116 109 121 123BallistaA 111 119RockStarA 110 108 116DevilA 109 117ScepterA 106 114 108 104 115CatapultA 107 103 110LRPB CobraA 106 100 103 110 109LRPB TrojanA 108 106 107 99 110CorackA 100 108 102 106 112AscotA 108 101CLEARFIELD® PLUSSunblade CL PlusA 109Razor CL PlusA 106 102 110 108Sheriff CL PlusA 104 104 104 109Sowing date 19 May 20 Jun 15 May 16 May 5 MayRainfall J–M (mm) 83 88 24 3 41Rainfall A–O (mm) 404 235 328 307 366
For more information click this LINK
Table 3: Minnipa main season wheat.Year 2016 2017 2018 2019 2020Mean yield (t/ha) 3.44 1.02 1.16 1.74 1.75RockStarA 107 114 117BallistaA 116 112VixenA 114 104 118 105CatapultA 106 106 113ScepterA 107 113 111 103 110DevilA 110 106 109LRPB ScoutA 106 98 94 117 103CosmickA 103 100 99 108 104Emu RockA 103 103 95 111 95WyalkatchemA 103 101 101 99 104CLEARFIELD® PLUSSunblade CL PlusA 115Sheriff CL PlusA 105 103 104 102 108Razor CL PlusA 105 108 102 107 100Sowing date 16 May 16 Jun 15 Jun 8 May 12 MayRainfall J–M (mm) 63 85 24 5 77Rainfall A–O (mm) 260 155 186 216 218
For more information click this LINK
Table 2: Kimba main season wheat.Year 2016 2017 2018 2019 2020Mean yield (t/ha) 2.79 2.06 0.33 2.25RockStarA
Trial failed
120 124BallistaA 135 119CatapultA 110 118ScepterA 107 107 122 117VixenA 102 143 107DevilA 106 118 111LRPB ScoutA 110 100 119 108CosmickA 105 102 110 107LRPB TrojanA 102 109 77 99CutlassA 98 106 72 104CLEARFIELD® PLUSSunblade CL PlusA 117Sheriff CL PlusA 104 104 97 108Razor CL PlusA 105 98 124 103Sowing date 12 May 3 May 5 May 2 May 4 MayRainfall J–M (mm) 97 110 24 8 55Rainfall A–O (mm) 321 161 121 132 253
For more information click this LINK
Table 4: Mitchellville main season wheat.Year 2016 2017 2018 2019 2020Mean yield (t/ha) 2.08 1.18 0.31 1.10 2.00VixenA 115 169 141 102BallistaA 116 117RockStarA 108 100 127ScepterA 110 117 134 101 127DevilA 113 108 112CatapultA 103 94 123Emu RockA 108 102 145 129 105LRPB ScoutA 115 103 99 116 102CosmickA 108 104 98 104 106MaceA 98 105 136 107 106CLEARFIELD® PLUSSunblade CL PlusA 117Razor CL PlusA 108 107 148 122 107Hammer CL PlusA 103 115Sowing date 26 May 2 May 21 May 8 May 11 MayRainfall J–M (mm) 102 115 43 2 60Rainfall A–O (mm) 198 112 65 99 215
For more information click this LINK
WHEAT
WHE
ATBA
RLEY
OAT
CANO
LAFI
ELD
PEA
LUPI
NFA
BA B
EAN
LENT
IL
8HARVEST REPORTEYRE PENINSULA
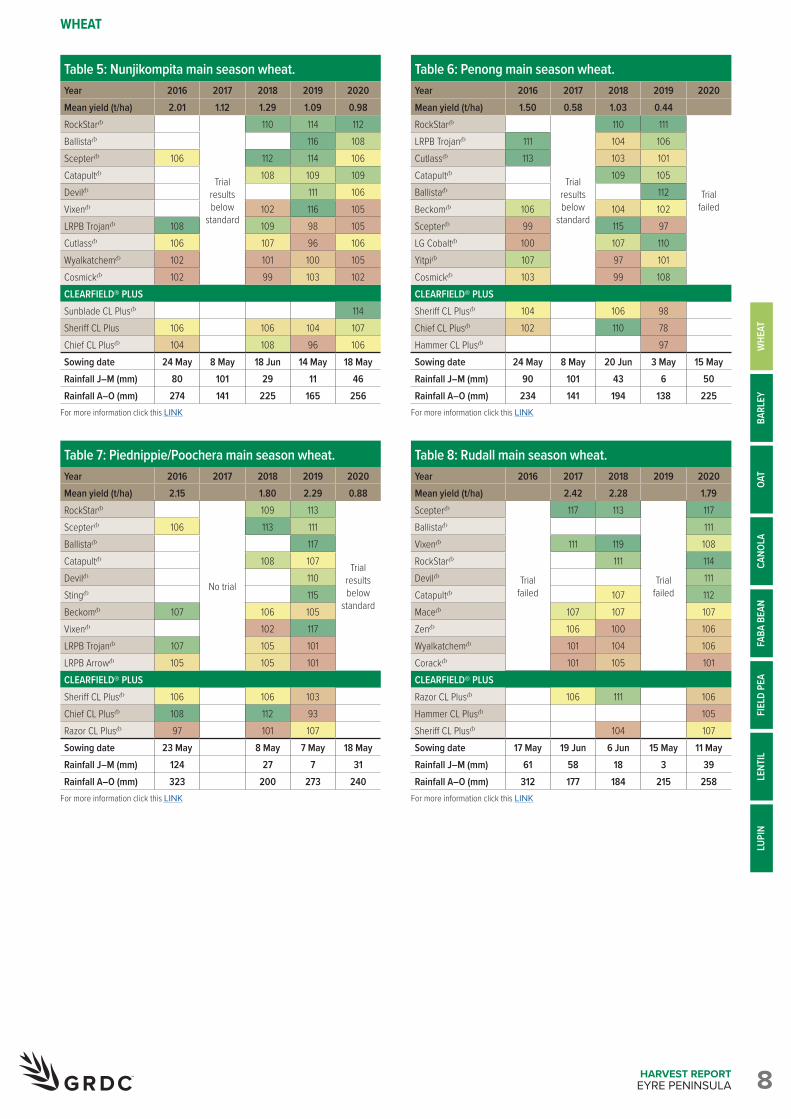
Table 5: Nunjikompita main season wheat.Year 2016 2017 2018 2019 2020Mean yield (t/ha) 2.01 1.12 1.29 1.09 0.98RockStarA
Trial results below
standard
110 114 112BallistaA 116 108ScepterA 106 112 114 106CatapultA 108 109 109DevilA 111 106VixenA 102 116 105LRPB TrojanA 108 109 98 105CutlassA 106 107 96 106WyalkatchemA 102 101 100 105CosmickA 102 99 103 102CLEARFIELD® PLUSSunblade CL PlusA 114Sheriff CL Plus 106 106 104 107Chief CL PlusA 104 108 96 106Sowing date 24 May 8 May 18 Jun 14 May 18 MayRainfall J–M (mm) 80 101 29 11 46Rainfall A–O (mm) 274 141 225 165 256
For more information click this LINK
Table 7: Piednippie/Poochera main season wheat.Year 2016 2017 2018 2019 2020Mean yield (t/ha) 2.15 1.80 2.29 0.88RockStarA
No trial
109 113
Trial results below
standard
ScepterA 106 113 111BallistaA 117CatapultA 108 107DevilA 110StingA 115BeckomA 107 106 105VixenA 102 117LRPB TrojanA 107 105 101LRPB ArrowA 105 105 101CLEARFIELD® PLUSSheriff CL PlusA 106 106 103Chief CL PlusA 108 112 93Razor CL PlusA 97 101 107Sowing date 23 May 8 May 7 May 18 MayRainfall J–M (mm) 124 27 7 31Rainfall A–O (mm) 323 200 273 240
For more information click this LINK
Table 6: Penong main season wheat.Year 2016 2017 2018 2019 2020Mean yield (t/ha) 1.50 0.58 1.03 0.44RockStarA
Trial results below
standard
110 111
Trial failed
LRPB TrojanA 111 104 106CutlassA 113 103 101CatapultA 109 105BallistaA 112BeckomA 106 104 102ScepterA 99 115 97LG CobaltA 100 107 110YitpiA 107 97 101CosmickA 103 99 108CLEARFIELD® PLUSSheriff CL PlusA 104 106 98Chief CL PlusA 102 110 78Hammer CL PlusA 97Sowing date 24 May 8 May 20 Jun 3 May 15 MayRainfall J–M (mm) 90 101 43 6 50Rainfall A–O (mm) 234 141 194 138 225
For more information click this LINK
Table 8: Rudall main season wheat.Year 2016 2017 2018 2019 2020Mean yield (t/ha) 2.42 2.28 1.79ScepterA
Trial failed
117 113
Trial failed
117BallistaA 111VixenA 111 119 108RockStarA 111 114DevilA 111CatapultA 107 112MaceA 107 107 107ZenA 106 100 106WyalkatchemA 101 104 106CorackA 101 105 101CLEARFIELD® PLUSRazor CL PlusA 106 111 106Hammer CL PlusA 105Sheriff CL PlusA 104 107Sowing date 17 May 19 Jun 6 Jun 15 May 11 MayRainfall J–M (mm) 61 58 18 3 39Rainfall A–O (mm) 312 177 184 215 258
For more information click this LINK
WHEAT
WHE
ATBA
RLEY
OAT
CANO
LAFI
ELD
PEA
LUPI
NFA
BA B
EAN
LENT
IL
9HARVEST REPORTEYRE PENINSULA
Table 9: Wanilla main season wheat.Year 2016 2017 2018 2019 2020Mean yield (t/ha) 3.99 3.28 3.46 5.57VixenA 113 108 117BallistaA 110ScepterA 115 115 117 108DevilA 110RockStarA 112 107CorackA 106 109 108 Trial 111CatapultA 110 failed 104MaceA 105 107 108 105LRPB TrojanA 102 105 107 104LRPB CobraA 106 100 96 109CLEARFIELD® PLUSRazor CL PlusA 106 103 107Sunblade CL PlusA 106Sheriff CL PlusA 108 107 105Sowing date 17 May 2 Jun 17 May 17 May 12 MayRainfall J–M (mm) 108 63 22 5 62Rainfall A–O (mm) 480 298 400 346 397
For more information click this LINK
Table 10: Warramboo main season wheat. Year 2016 2017 2018 2019 2020Mean yield (t/ha) 2.56 0.84 2.28 1.86 1.14VixenA 126 108 127 147BallistaA 121 121ScepterA 111 118 109 107 121DevilA 114 110 120Emu RockA 106 110 99 114 123RockStarA 105 114 103MaceA 106 114 105 99 123CorackA 106 114 107 91 132CatapultA 104 106 99LRPB ScoutA 101 98 96 117 98CLEARFIELD® PLUSRazor CL PlusA 110 116 104 111 129Hammer CL PlusA 101 115Sunblade CL PlusA 92Sowing date 11 May 19 Jun 30 May 7 May 18 MayRainfall J–M (mm) 57 82 33 4 42Rainfall A–O (mm) 286 178 205 257 223
For more information click this LINK
WHEAT
WHE
ATBA
RLEY
OAT
CANO
LAFI
ELD
PEA
LUPI
NFA
BA B
EAN
LENT
IL
10HARVEST REPORTEYRE PENINSULA
WHEAT
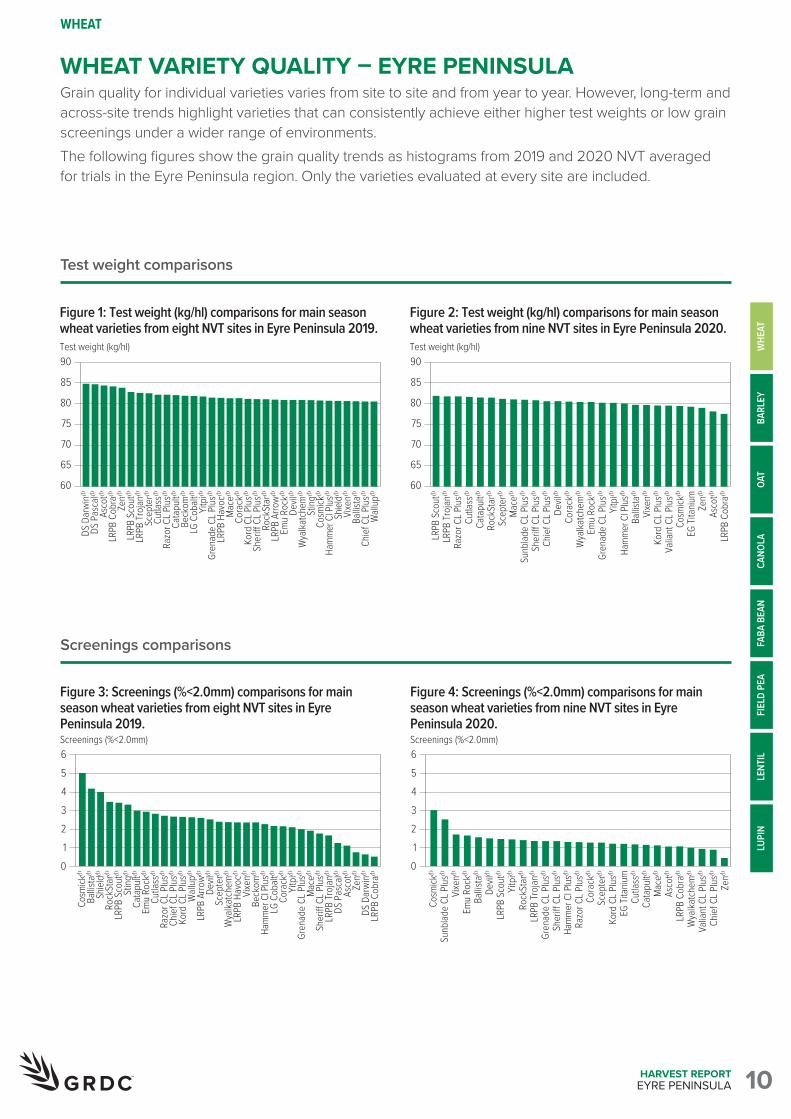
WHEAT VARIETY QUALITY – EYRE PENINSULAGrain quality for individual varieties varies from site to site and from year to year. However, long-term and across-site trends highlight varieties that can consistently achieve either higher test weights or low grain screenings under a wider range of environments. The following figures show the grain quality trends as histograms from 2019 and 2020 NVT averaged for trials in the Eyre Peninsula region. Only the varieties evaluated at every site are included.
Cata
pultA
LG C
obalt
A
Rock
Star
A
DS P
asca
lADS
Dar
winA
Yitp
iA
LRPB
Arro
wA
Sting
A
Emu R
ockA
Scep
terA
Devil
A
Hamm
er C
l Plus
A
Shiel
dA
LRPB
Troja
nA
Vixe
nA
Beck
omA
LRPB
Cob
raA
Wall
upA
Asco
tA
Sher
i C
L Plus
A
LRPB
Sco
utA
Razo
r CL P
lusA
Cosm
ickA
Kord
CL P
lusA
Cora
ckA
Gren
ade
CL P
lusA
Chief
CL P
lusA
LRPB
Hav
ocA
Mace
A
Ballis
taA
Wya
lkatch
emA
ZenA
Cutla
ssA
90
85
80
75
70
65
60
Test weight (kg/hl)
Figure 1: Test weight (kg/hl) comparisons for main season wheat varieties from eight NVT sites in Eyre Peninsula 2019.
Cata
pultA
EG Ti
taniu
m
Rock
Star
A
Sunb
lade
CL P
lusA
Yitp
iA
Valia
nt C
L Plus
A
Emu R
ockA
Scep
terA
Devil
A
Hamm
er C
l Plus
A
LRPB
Troja
nA
Vixe
nA
LRPB
Cob
raA
Asco
tA
Sher
i� C
L Plus
A
LRPB
Sco
utA
Razo
r CL P
lusA
Cosm
ickA
Kord
CL P
lusA
Cora
ckA
Gren
ade
CL P
lusA
Chief
CL P
lusA
Mace
A
Ballis
taA
Wya
lkatch
emA
ZenA
Cutla
ssA
90
85
80
75
70
65
60
Test weight (kg/hl)
Figure 2: Test weight (kg/hl) comparisons for main season wheat varieties from nine NVT sites in Eyre Peninsula 2020.
Test weight comparisons
WHE
ATBA
RLEY
OAT
CANO
LAFI
ELD
PEA
LUPI
NFA
BA B
EAN
LENT
IL
Screenings comparisonsCa
tapu
ltA
EG Ti
taniu
m
Rock
Star
A
Sunb
lade
CL P
lusA
Yitp
iA
Valia
nt C
L Plus
A
Emu R
ockA
Scep
terA
Devil
A
Hamm
er C
l Plus
A
LRPB
Troja
nA
Vixe
nA
LRPB
Cob
raA
Asco
tA
Sher
i� C
L Plus
A
LRPB
Sco
utA
Razo
r CL P
lusA
Cosm
ickA
Kord
CL P
lusA
Cora
ckA
Gren
ade
CL P
lusA
Chief
CL P
lusA
Mace
A
Ballis
taA
Wya
lkatch
emA
ZenA
Cutla
ssA
6543210
Screenings (%<2.0mm)
Figure 4: Screenings (%<2.0mm) comparisons for main season wheat varieties from nine NVT sites in Eyre Peninsula 2020.
Cata
pultA
LG C
obalt
A
Rock
Star
A
DS P
asca
lA
DS D
arwi
nA
Yitp
iA
LRPB
Arro
wA
Sting
A
Emu R
ockA
Scep
terA
Devil
A
Hamm
er C
l Plus
A
Shiel
dA
LRPB
Troja
nA
Vixe
nABe
ckom
A
LRPB
Cob
raA
Wall
upA
Asco
tA
Sher
i C
L Plus
A
LRPB
Sco
utA
Razo
r CL P
lusA
Cosm
ickA
Kord
CL P
lusA
Cora
ckA
Gren
ade
CL P
lusA
Chief
CL P
lusA
LRPB
Hav
ocA
Mace
A
Ballis
taA
Wya
lkatch
emA
ZenA
Cutla
ssA
6543210
Screenings (%<2.0mm)
Figure 3: Screenings (%<2.0mm) comparisons for main season wheat varieties from eight NVT sites in Eyre Peninsula 2019.
11HARVEST REPORTEYRE PENINSULA
WHEAT
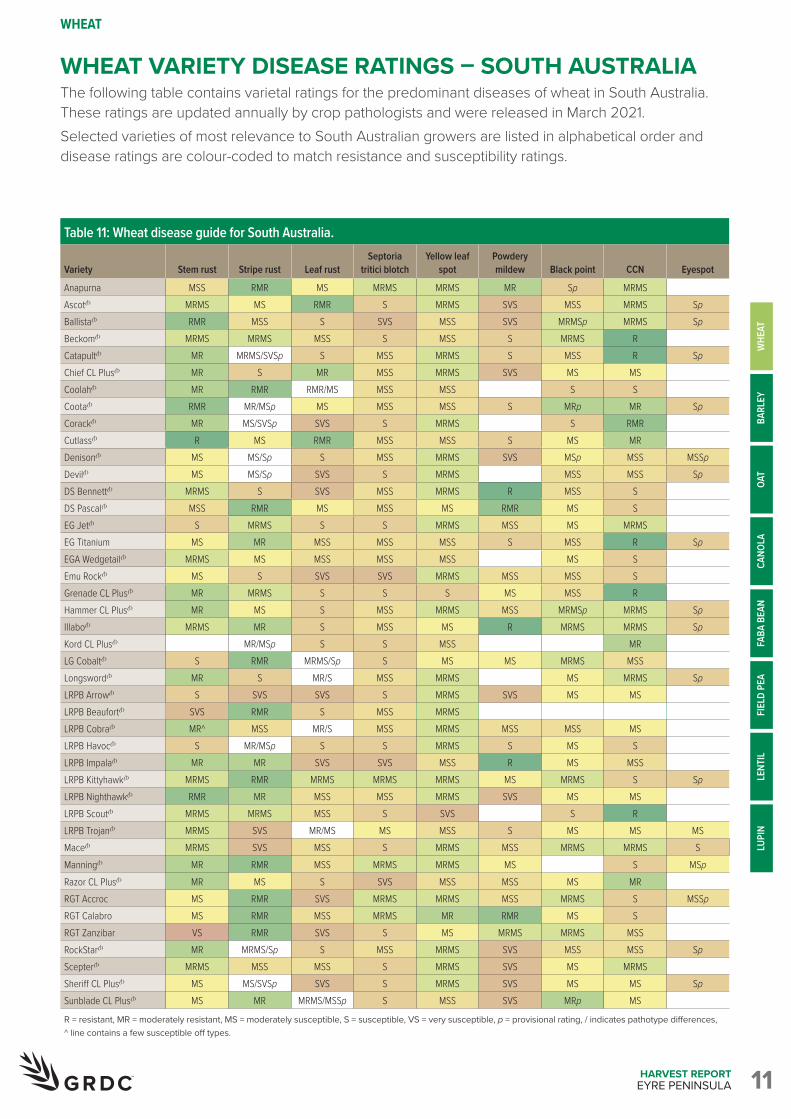
WHEAT VARIETY DISEASE RATINGS – SOUTH AUSTRALIAThe following table contains varietal ratings for the predominant diseases of wheat in South Australia. These ratings are updated annually by crop pathologists and were released in March 2021. Selected varieties of most relevance to South Australian growers are listed in alphabetical order and disease ratings are colour-coded to match resistance and susceptibility ratings.
Table 11: Wheat disease guide for South Australia. Variety Stem rust Stripe rust Leaf rust
Septoria tritici blotch
Yellow leaf spot
Powdery mildew Black point CCN Eyespot
Anapurna MSS RMR MS MRMS MRMS MR Sp MRMSAscotA MRMS MS RMR S MRMS SVS MSS MRMS SpBallistaA RMR MSS S SVS MSS SVS MRMSp MRMS SpBeckomA MRMS MRMS MSS S MSS S MRMS RCatapultA MR MRMS/SVSp S MSS MRMS S MSS R SpChief CL PlusA MR S MR MSS MRMS SVS MS MSCoolahA MR RMR RMR/MS MSS MSS S SCootaA RMR MR/MSp MS MSS MSS S MRp MR SpCorackA MR MS/SVSp SVS S MRMS S RMRCutlassA R MS RMR MSS MSS S MS MRDenisonA MS MS/Sp S MSS MRMS SVS MSp MSS MSSpDevilA MS MS/Sp SVS S MRMS MSS MSS SpDS BennettA MRMS S SVS MSS MRMS R MSS SDS PascalA MSS RMR MS MSS MS RMR MS SEG JetA S MRMS S S MRMS MSS MS MRMSEG Titanium MS MR MSS MSS MSS S MSS R SpEGA WedgetailA MRMS MS MSS MSS MSS MS SEmu RockA MS S SVS SVS MRMS MSS MSS SGrenade CL PlusA MR MRMS S S S MS MSS RHammer CL PlusA MR MS S MSS MRMS MSS MRMSp MRMS SpIllaboA MRMS MR S MSS MS R MRMS MRMS SpKord CL PlusA MR/MSp S S MSS MRLG CobaltA S RMR MRMS/Sp S MS MS MRMS MSSLongswordA MR S MR/S MSS MRMS MS MRMS SpLRPB ArrowA S SVS SVS S MRMS SVS MS MSLRPB BeaufortA SVS RMR S MSS MRMSLRPB CobraA MR^ MSS MR/S MSS MRMS MSS MSS MSLRPB HavocA S MR/MSp S S MRMS S MS SLRPB ImpalaA MR MR SVS SVS MSS R MS MSSLRPB KittyhawkA MRMS RMR MRMS MRMS MRMS MS MRMS S SpLRPB NighthawkA RMR MR MSS MSS MRMS SVS MS MSLRPB ScoutA MRMS MRMS MSS S SVS S RLRPB TrojanA MRMS SVS MR/MS MS MSS S MS MS MSMaceA MRMS SVS MSS S MRMS MSS MRMS MRMS SManningA MR RMR MSS MRMS MRMS MS S MSpRazor CL PlusA MR MS S SVS MSS MSS MS MRRGT Accroc MS RMR SVS MRMS MRMS MSS MRMS S MSSpRGT Calabro MS RMR MSS MRMS MR RMR MS SRGT Zanzibar VS RMR SVS S MS MRMS MRMS MSSRockStarA MR MRMS/Sp S MSS MRMS SVS MSS MSS SpScepterA MRMS MSS MSS S MRMS SVS MS MRMSSheriff CL PlusA MS MS/SVSp SVS S MRMS SVS MS MS SpSunblade CL PlusA MS MR MRMS/MSSp S MSS SVS MRp MS
R = resistant, MR = moderately resistant, MS = moderately susceptible, S = susceptible, VS = very susceptible, p = provisional rating, / indicates pathotype differences, ^ line contains a few susceptible off types.
WHE
ATBA
RLEY
OAT
CANO
LAFI
ELD
PEA
LUPI
NFA
BA B
EAN
LENT
IL
12HARVEST REPORTEYRE PENINSULA
WHEAT
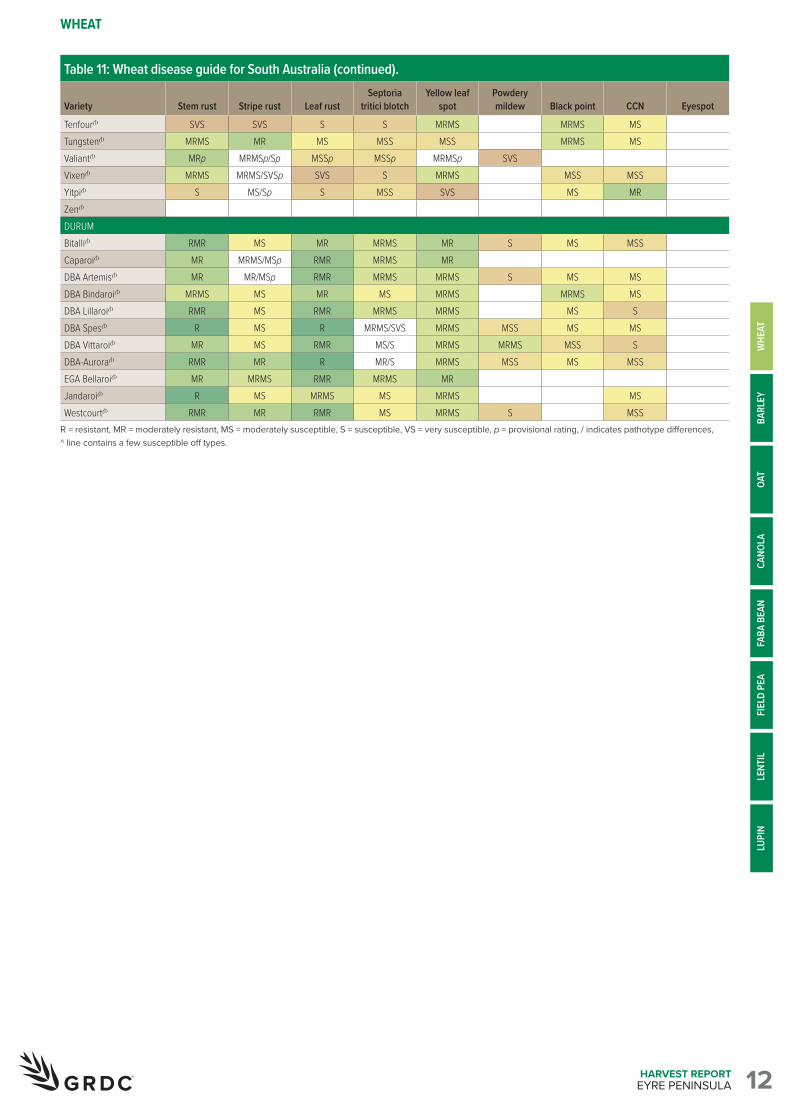
Table 11: Wheat disease guide for South Australia (continued). Variety Stem rust Stripe rust Leaf rust
Septoria tritici blotch
Yellow leaf spot
Powdery mildew Black point CCN Eyespot
TenfourA SVS SVS S S MRMS MRMS MSTungstenA MRMS MR MS MSS MSS MRMS MSValiantA MRp MRMSp/Sp MSSp MSSp MRMSp SVSVixenA MRMS MRMS/SVSp SVS S MRMS MSS MSSYitpiA S MS/Sp S MSS SVS MS MRZenA
DURUMBitalliA RMR MS MR MRMS MR S MS MSSCaparoiA MR MRMS/MSp RMR MRMS MRDBA ArtemisA MR MR/MSp RMR MRMS MRMS S MS MSDBA BindaroiA MRMS MS MR MS MRMS MRMS MSDBA LillaroiA RMR MS RMR MRMS MRMS MS SDBA SpesA R MS R MRMS/SVS MRMS MSS MS MSDBA VittaroiA MR MS RMR MS/S MRMS MRMS MSS SDBA-AuroraA RMR MR R MR/S MRMS MSS MS MSSEGA BellaroiA MR MRMS RMR MRMS MRJandaroiA R MS MRMS MS MRMS MSWestcourtA RMR MR RMR MS MRMS S MSS
R = resistant, MR = moderately resistant, MS = moderately susceptible, S = susceptible, VS = very susceptible, p = provisional rating, / indicates pathotype differences, ^ line contains a few susceptible off types.
WHE
ATBA
RLEY
OAT
CANO
LAFI
ELD
PEA
LUPI
NFA
BA B
EAN
LENT
IL
13HARVEST REPORTEYRE PENINSULA
BARLEY
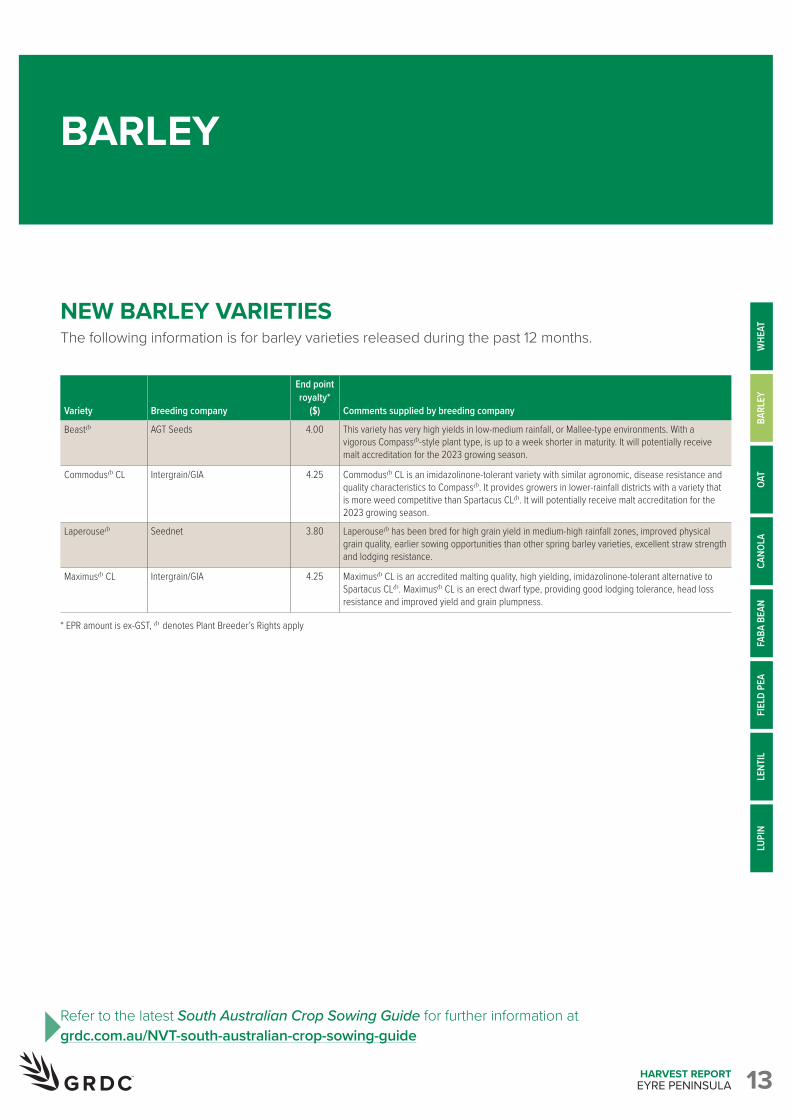
NEW BARLEY VARIETIESThe following information is for barley varieties released during the past 12 months.
Refer to the latest South Australian Crop Sowing Guide for further information at grdc.com.au/NVT-south-australian-crop-sowing-guide
Variety
Breeding company
End point royalty*
($)
Comments supplied by breeding company
BeastA AGT Seeds 4.00 This variety has very high yields in low-medium rainfall, or Mallee-type environments. With a vigorous CompassA-style plant type, is up to a week shorter in maturity. It will potentially receive malt accreditation for the 2023 growing season.
CommodusA CL Intergrain/GIA 4.25 CommodusA CL is an imidazolinone-tolerant variety with similar agronomic, disease resistance and quality characteristics to CompassA. It provides growers in lower-rainfall districts with a variety that is more weed competitive than Spartacus CLA. It will potentially receive malt accreditation for the 2023 growing season.
LaperouseA Seednet 3.80 LaperouseA has been bred for high grain yield in medium-high rainfall zones, improved physical grain quality, earlier sowing opportunities than other spring barley varieties, excellent straw strength and lodging resistance.
MaximusA CL Intergrain/GIA 4.25 MaximusA CL is an accredited malting quality, high yielding, imidazolinone-tolerant alternative to Spartacus CLA. MaximusA CL is an erect dwarf type, providing good lodging tolerance, head loss resistance and improved yield and grain plumpness.
* EPR amount is ex-GST, A denotes Plant Breeder’s Rights apply
WHE
ATBA
RLEY
OAT
CANO
LAFI
ELD
PEA
LUPI
NFA
BA B
EAN
LENT
IL
14HARVEST REPORTEYRE PENINSULA
BARLEY
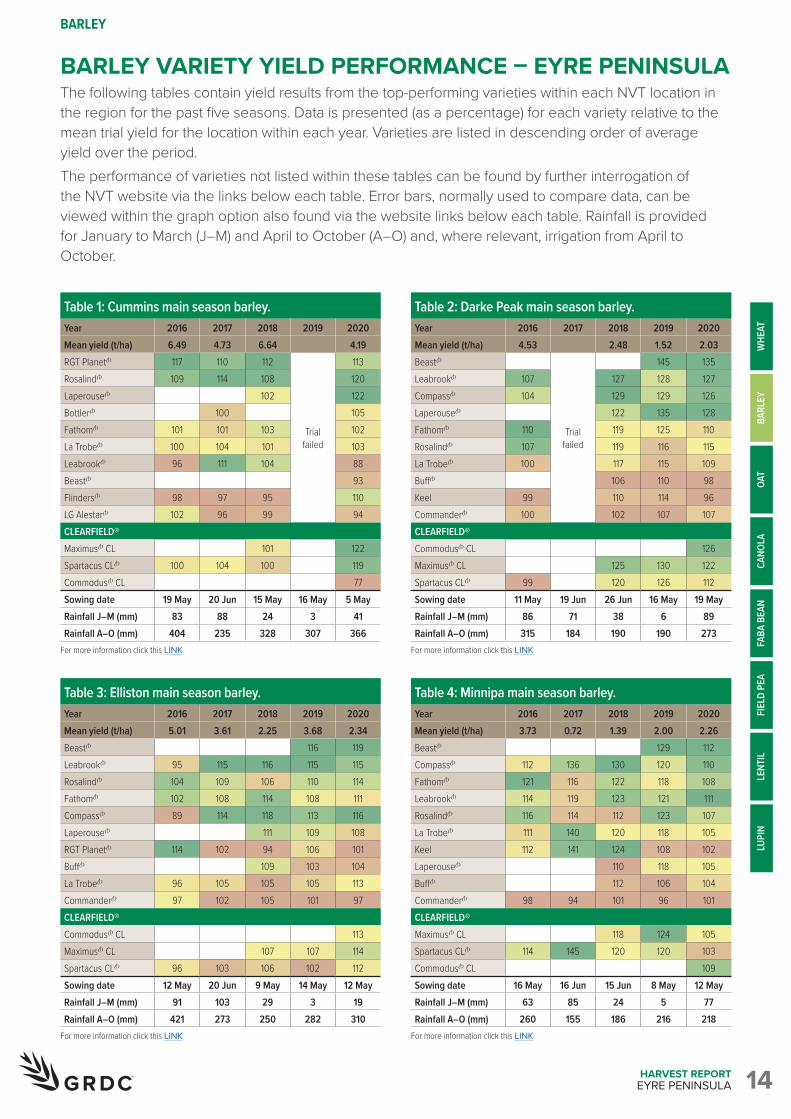
BARLEY VARIETY YIELD PERFORMANCE – EYRE PENINSULAThe following tables contain yield results from the top-performing varieties within each NVT location in the region for the past five seasons. Data is presented (as a percentage) for each variety relative to the mean trial yield for the location within each year. Varieties are listed in descending order of average yield over the period. The performance of varieties not listed within these tables can be found by further interrogation of the NVT website via the links below each table. Error bars, normally used to compare data, can be viewed within the graph option also found via the website links below each table. Rainfall is provided for January to March (J–M) and April to October (A–O) and, where relevant, irrigation from April to October.
Table 1: Cummins main season barley.Year 2016 2017 2018 2019 2020Mean yield (t/ha) 6.49 4.73 6.64 4.19RGT PlanetA 117 110 112
Trial failed
113RosalindA 109 114 108 120LaperouseA 102 122BottlerA 100 105FathomA 101 101 103 102La TrobeA 100 104 101 103LeabrookA 96 111 104 88BeastA 93FlindersA 98 97 95 110LG AlestarA 102 96 99 94CLEARFIELD®MaximusA CL 101 122Spartacus CLA 100 104 100 119CommodusA CL 77Sowing date 19 May 20 Jun 15 May 16 May 5 MayRainfall J–M (mm) 83 88 24 3 41Rainfall A–O (mm) 404 235 328 307 366
For more information click this LINK
Table 3: Elliston main season barley.Year 2016 2017 2018 2019 2020Mean yield (t/ha) 5.01 3.61 2.25 3.68 2.34BeastA 116 119LeabrookA 95 115 116 115 115RosalindA 104 109 106 110 114FathomA 102 108 114 108 111CompassA 89 114 118 113 116LaperouseA 111 109 108RGT PlanetA 114 102 94 106 101BuffA 109 103 104La TrobeA 96 105 105 105 113CommanderA 97 102 105 101 97CLEARFIELD®CommodusA CL 113MaximusA CL 107 107 114Spartacus CLA 96 103 106 102 112Sowing date 12 May 20 Jun 9 May 14 May 12 MayRainfall J–M (mm) 91 103 29 3 19Rainfall A–O (mm) 421 273 250 282 310
For more information click this LINK
Table 2: Darke Peak main season barley.Year 2016 2017 2018 2019 2020Mean yield (t/ha) 4.53 2.48 1.52 2.03BeastA
Trial failed
145 135LeabrookA 107 127 128 127CompassA 104 129 129 126LaperouseA 122 135 128FathomA 110 119 125 110RosalindA 107 119 116 115La TrobeA 100 117 115 109BuffA 106 110 98Keel 99 110 114 96CommanderA 100 102 107 107CLEARFIELD®CommodusA CL 126MaximusA CL 125 130 122Spartacus CLA 99 120 126 112Sowing date 11 May 19 Jun 26 Jun 16 May 19 MayRainfall J–M (mm) 86 71 38 6 89Rainfall A–O (mm) 315 184 190 190 273
For more information click this LINK
Table 4: Minnipa main season barley.Year 2016 2017 2018 2019 2020Mean yield (t/ha) 3.73 0.72 1.39 2.00 2.26BeastA 129 112CompassA 112 136 130 120 110FathomA 121 116 122 118 108LeabrookA 114 119 123 121 111RosalindA 116 114 112 123 107La TrobeA 111 140 120 118 105Keel 112 141 124 108 102LaperouseA 110 118 105BuffA 112 106 104CommanderA 98 94 101 96 101CLEARFIELD®MaximusA CL 118 124 105Spartacus CLA 114 145 120 120 103CommodusA CL 109Sowing date 16 May 16 Jun 15 Jun 8 May 12 MayRainfall J–M (mm) 63 85 24 5 77Rainfall A–O (mm) 260 155 186 216 218
For more information click this LINK
WHE
ATBA
RLEY
OAT
CANO
LAFI
ELD
PEA
LUPI
NFA
BA B
EAN
LENT
IL
15HARVEST REPORTEYRE PENINSULA
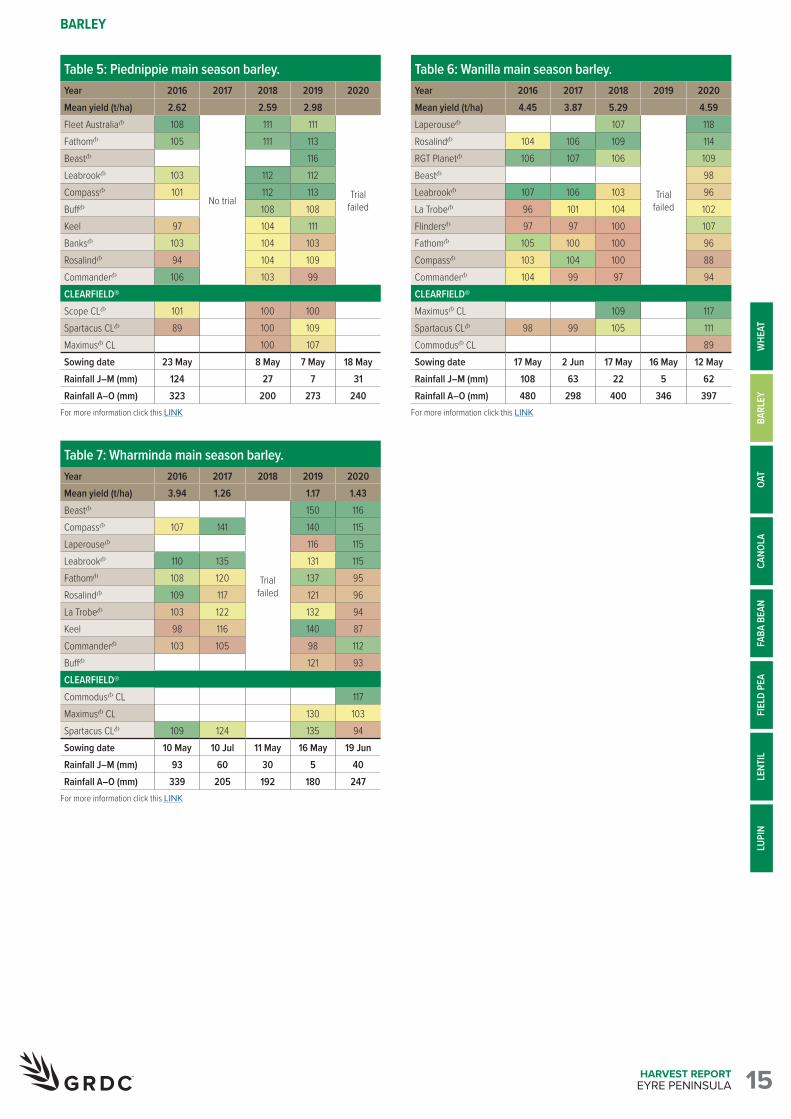
BARLEY
Table 5: Piednippie main season barley.Year 2016 2017 2018 2019 2020Mean yield (t/ha) 2.62 2.59 2.98Fleet AustraliaA 108
No trial
111 111
Trial failed
FathomA 105 111 113BeastA 116LeabrookA 103 112 112CompassA 101 112 113BuffA 108 108Keel 97 104 111BanksA 103 104 103RosalindA 94 104 109CommanderA 106 103 99CLEARFIELD®Scope CLA 101 100 100Spartacus CLA 89 100 109MaximusA CL 100 107Sowing date 23 May 8 May 7 May 18 MayRainfall J–M (mm) 124 27 7 31Rainfall A–O (mm) 323 200 273 240
For more information click this LINK
Table 7: Wharminda main season barley.Year 2016 2017 2018 2019 2020Mean yield (t/ha) 3.94 1.26 1.17 1.43BeastA
Trial failed
150 116CompassA 107 141 140 115LaperouseA 116 115LeabrookA 110 135 131 115FathomA 108 120 137 95RosalindA 109 117 121 96La TrobeA 103 122 132 94Keel 98 116 140 87CommanderA 103 105 98 112BuffA 121 93CLEARFIELD®CommodusA CL 117MaximusA CL 130 103Spartacus CLA 109 124 135 94Sowing date 10 May 10 Jul 11 May 16 May 19 JunRainfall J–M (mm) 93 60 30 5 40Rainfall A–O (mm) 339 205 192 180 247
For more information click this LINK
Table 6: Wanilla main season barley.Year 2016 2017 2018 2019 2020Mean yield (t/ha) 4.45 3.87 5.29 4.59LaperouseA 107
Trial failed
118RosalindA 104 106 109 114RGT PlanetA 106 107 106 109BeastA 98LeabrookA 107 106 103 96La TrobeA 96 101 104 102FlindersA 97 97 100 107FathomA 105 100 100 96CompassA 103 104 100 88CommanderA 104 99 97 94CLEARFIELD®MaximusA CL 109 117Spartacus CLA 98 99 105 111CommodusA CL 89Sowing date 17 May 2 Jun 17 May 16 May 12 MayRainfall J–M (mm) 108 63 22 5 62Rainfall A–O (mm) 480 298 400 346 397
For more information click this LINK
WHE
ATBA
RLEY
OAT
CANO
LAFI
ELD
PEA
LUPI
NFA
BA B
EAN
LENT
IL
16HARVEST REPORTEYRE PENINSULA
BARLEY
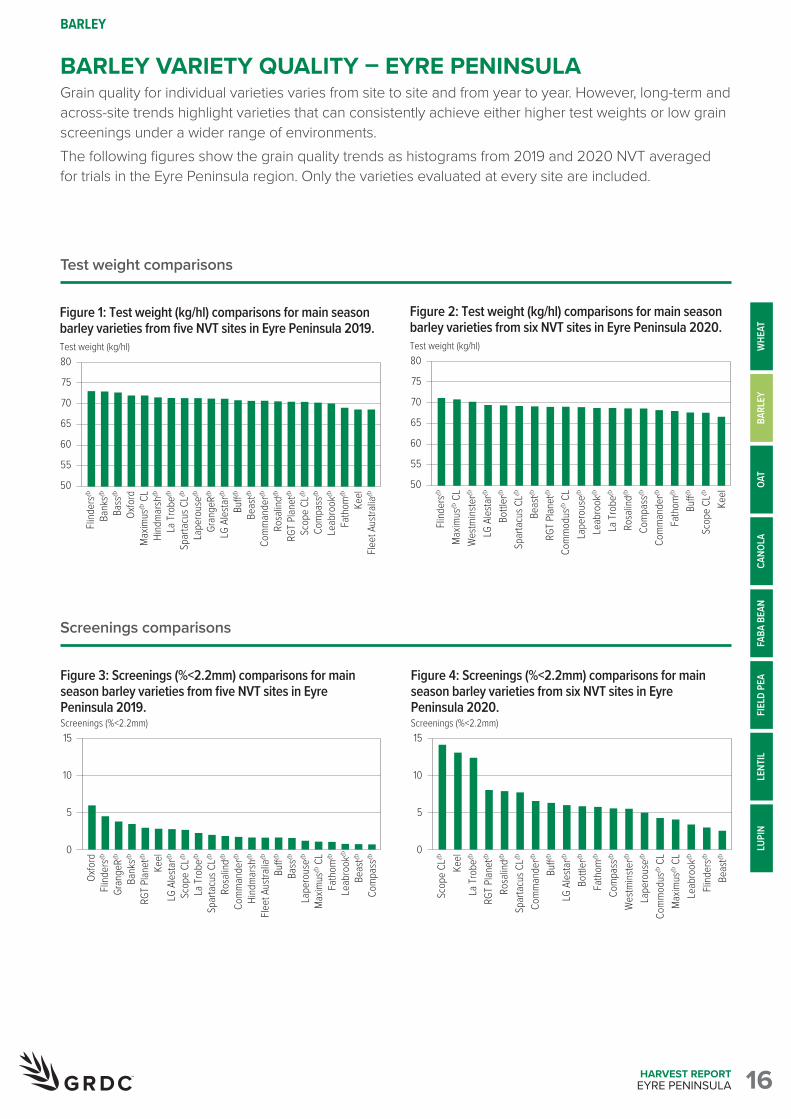
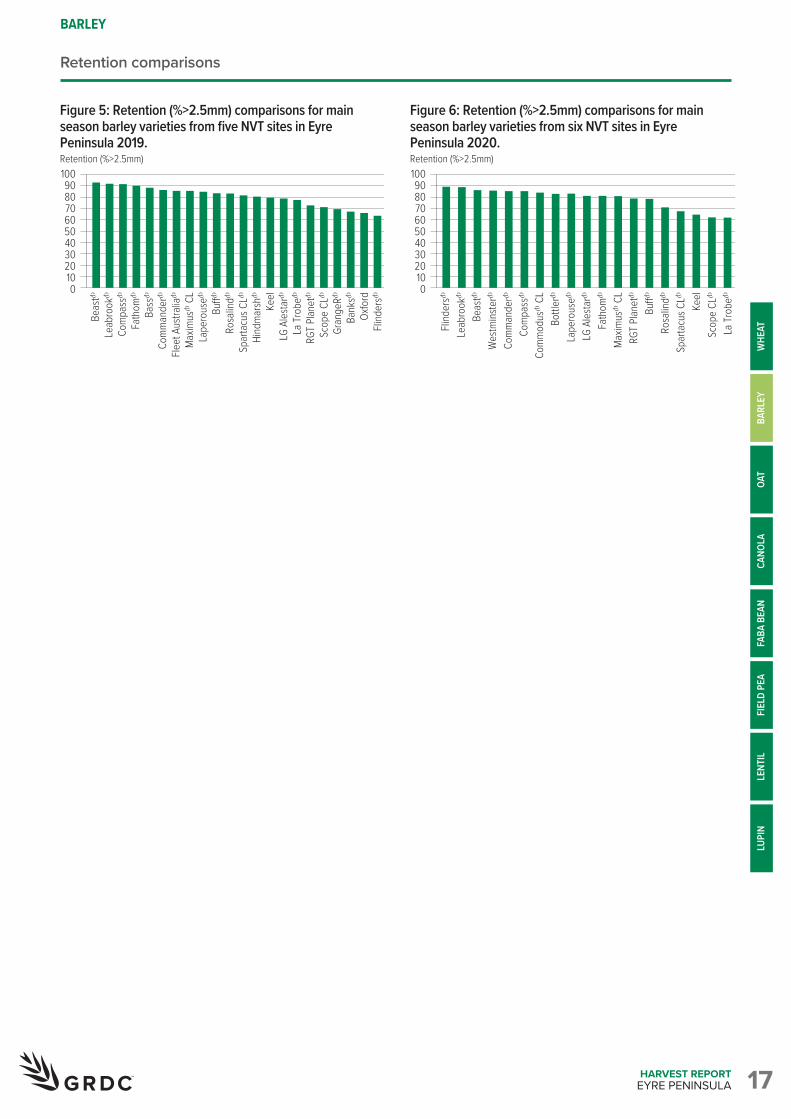
BARLEY VARIETY QUALITY – EYRE PENINSULAGrain quality for individual varieties varies from site to site and from year to year. However, long-term and across-site trends highlight varieties that can consistently achieve either higher test weights or low grain screenings under a wider range of environments. The following figures show the grain quality trends as histograms from 2019 and 2020 NVT averaged for trials in the Eyre Peninsula region. Only the varieties evaluated at every site are included.
Spar
tacu
s CLA
RGT P
lanet
A
Com
man
derA
Oxfo
rd
Gran
geRA Keel
Scop
e CL
A
LG A
lesta
rA
Fath
omA
Com
pass
A
La Tr
obeA
Leab
rook
A
Bank
sA
Rosa
lindA
Lape
rous
eA
Beas
tA
Bass
A
Bu�A
Hind
mar
shA
Flind
ersA
Maxim
usA
CL
Fleet
Aus
tralia
A80
75
70
65
60
55
50
Test weight (kg/hl)
Figure 1: Test weight (kg/hl) comparisons for main season barley varieties from five NVT sites in Eyre Peninsula 2019.
Spar
tacu
s CLA
RGT P
lanet
A
Com
man
derA
Oxfo
rd
Gran
geRA Keel
Scop
e CL
A
LG A
lesta
rA
Fath
omA
Com
pass
A
La Tr
obeA
Leab
rook
A
Bank
sA
Rosa
lindA
Lape
rous
eA
Beas
tA
Bass
A
Bu�A
Hind
mar
shA
Flind
ersA
Maxim
usA
CL
Fleet
Aus
tralia
A
15
10
5
0
Screenings (%<2.2mm)
Figure 3: Screenings (%<2.2mm) comparisons for main season barley varieties from five NVT sites in Eyre Peninsula 2019.
Spar
tacu
s CLA
RGT P
lanet
A
Com
man
derA
Keel
Scop
e CL
A
LG A
lesta
rA
Fath
omA
Com
pass
A
La Tr
obeA
Leab
rook
A
Rosa
lindA
Lape
rous
eA
Beas
tA
Wes
tmins
terA
Bu�A
Bottl
erA
Flind
ersA
Maxim
usA
CL
Com
mod
usA
CL
80
75
70
65
60
55
50
Test weight (kg/hl)
Figure 2: Test weight (kg/hl) comparisons for main season barley varieties from six NVT sites in Eyre Peninsula 2020.
Spar
tacu
s CLA
RGT P
lanet
A
Com
man
derA
Keel
Scop
e CL
A
LG A
lesta
rA
Fath
omA
Com
pass
A
La Tr
obeA
Leab
rook
A
Rosa
lindA
Lape
rous
eA
Beas
tA
Wes
tmins
terA
Bu�A
Bottl
erA
Flind
ersA
Maxim
usA
CL
Com
mod
usA
CL
15
10
5
0
Screenings (%<2.2mm)
Figure 4: Screenings (%<2.2mm) comparisons for main season barley varieties from six NVT sites in Eyre Peninsula 2020.
Test weight comparisons
Screenings comparisons
WHE
ATBA
RLEY
OAT
CANO
LAFI
ELD
PEA
LUPI
NFA
BA B
EAN
LENT
IL
17HARVEST REPORTEYRE PENINSULA
BARLEY
Retention comparisons
Spar
tacu
s CLA
RGT P
lanet
A
Com
man
derA
Oxfo
rd
Gran
geRAKeel
Scop
e CL
A
LG A
lesta
rA
Fath
omA
Com
pass
A
La Tr
obeA
Leab
rook
A
Bank
sA
Rosa
lindA
Lape
rous
eA
Beas
tA
Bass
A
Bu�A
Hind
mar
shA
Flind
ersA
Maxim
usA
CL
Fleet
Aus
tralia
A1009080706050403020100
Retention (%>2.5mm)
Figure 5: Retention (%>2.5mm) comparisons for main season barley varieties from five NVT sites in Eyre Peninsula 2019.
Spar
tacu
s CLA
RGT P
lanet
A
Com
man
derA
Keel
Scop
e CL
A
LG A
lesta
rA
Fath
omA
Com
pass
A
La Tr
obeA
Leab
rook
A
Rosa
lindA
Lape
rous
eA
Beas
tA
Wes
tmins
terA
Bu�A
Bottl
erA
Flind
ersA
Maxim
usA
CL
Com
mod
usA
CL
1009080706050403020100
Retention (%>2.5mm)
Figure 6: Retention (%>2.5mm) comparisons for main season barley varieties from six NVT sites in Eyre Peninsula 2020.
WHE
ATBA
RLEY
OAT
CANO
LAFI
ELD
PEA
LUPI
NFA
BA B
EAN
LENT
IL
18HARVEST REPORTEYRE PENINSULA
BARLEY
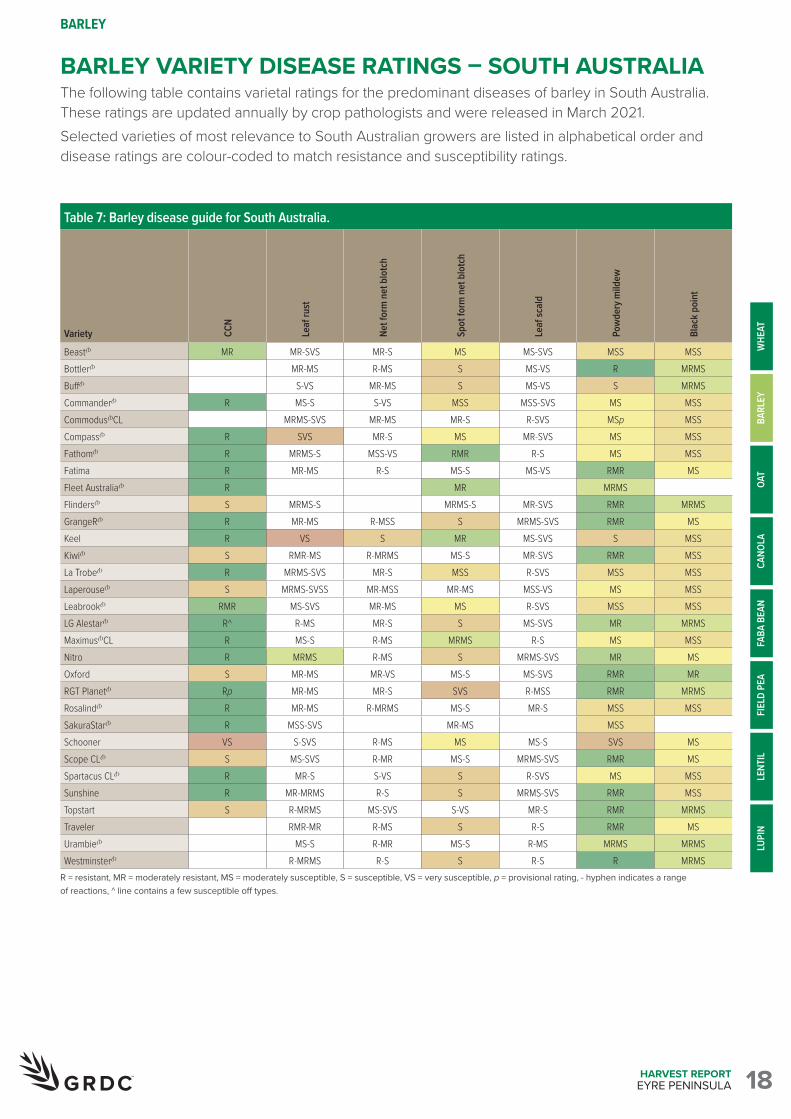
Table 7: Barley disease guide for South Australia.
Variety CCN
Leaf
rust
Net f
orm
net
blo
tch
Spot
form
net
blo
tch
Leaf
scal
d
Powd
ery m
ildew
Blac
k po
int
BeastA MR MR-SVS MR-S MS MS-SVS MSS MSSBottlerA MR-MS R-MS S MS-VS R MRMSBuffA S-VS MR-MS S MS-VS S MRMSCommanderA R MS-S S-VS MSS MSS-SVS MS MSSCommodusACL MRMS-SVS MR-MS MR-S R-SVS MSp MSSCompassA R SVS MR-S MS MR-SVS MS MSSFathomA R MRMS-S MSS-VS RMR R-S MS MSSFatima R MR-MS R-S MS-S MS-VS RMR MSFleet AustraliaA R MR MRMSFlindersA S MRMS-S MRMS-S MR-SVS RMR MRMSGrangeRA R MR-MS R-MSS S MRMS-SVS RMR MSKeel R VS S MR MS-SVS S MSSKiwiA S RMR-MS R-MRMS MS-S MR-SVS RMR MSSLa TrobeA R MRMS-SVS MR-S MSS R-SVS MSS MSSLaperouseA S MRMS-SVSS MR-MSS MR-MS MSS-VS MS MSSLeabrookA RMR MS-SVS MR-MS MS R-SVS MSS MSSLG AlestarA R^ R-MS MR-S S MS-SVS MR MRMSMaximusACL R MS-S R-MS MRMS R-S MS MSSNitro R MRMS R-MS S MRMS-SVS MR MSOxford S MR-MS MR-VS MS-S MS-SVS RMR MRRGT PlanetA Rp MR-MS MR-S SVS R-MSS RMR MRMSRosalindA R MR-MS R-MRMS MS-S MR-S MSS MSSSakuraStarA R MSS-SVS MR-MS MSSSchooner VS S-SVS R-MS MS MS-S SVS MSScope CLA S MS-SVS R-MR MS-S MRMS-SVS RMR MSSpartacus CLA R MR-S S-VS S R-SVS MS MSSSunshine R MR-MRMS R-S S MRMS-SVS RMR MSSTopstart S R-MRMS MS-SVS S-VS MR-S RMR MRMSTraveler RMR-MR R-MS S R-S RMR MSUrambieA MS-S R-MR MS-S R-MS MRMS MRMSWestminsterA R-MRMS R-S S R-S R MRMS
R = resistant, MR = moderately resistant, MS = moderately susceptible, S = susceptible, VS = very susceptible, p = provisional rating, - hyphen indicates a range of reactions, ^ line contains a few susceptible off types.
BARLEY VARIETY DISEASE RATINGS – SOUTH AUSTRALIAThe following table contains varietal ratings for the predominant diseases of barley in South Australia. These ratings are updated annually by crop pathologists and were released in March 2021. Selected varieties of most relevance to South Australian growers are listed in alphabetical order and disease ratings are colour-coded to match resistance and susceptibility ratings.
WHE
ATBA
RLEY
OAT
CANO
LAFI
ELD
PEA
LUPI
NFA
BA B
EAN
LENT
IL
19HARVEST REPORTEYRE PENINSULA
OAT
Refer to the latest South Australian Crop Sowing Guide for further information at grdc.com.au/NVT-south-australian-crop-sowing-guide
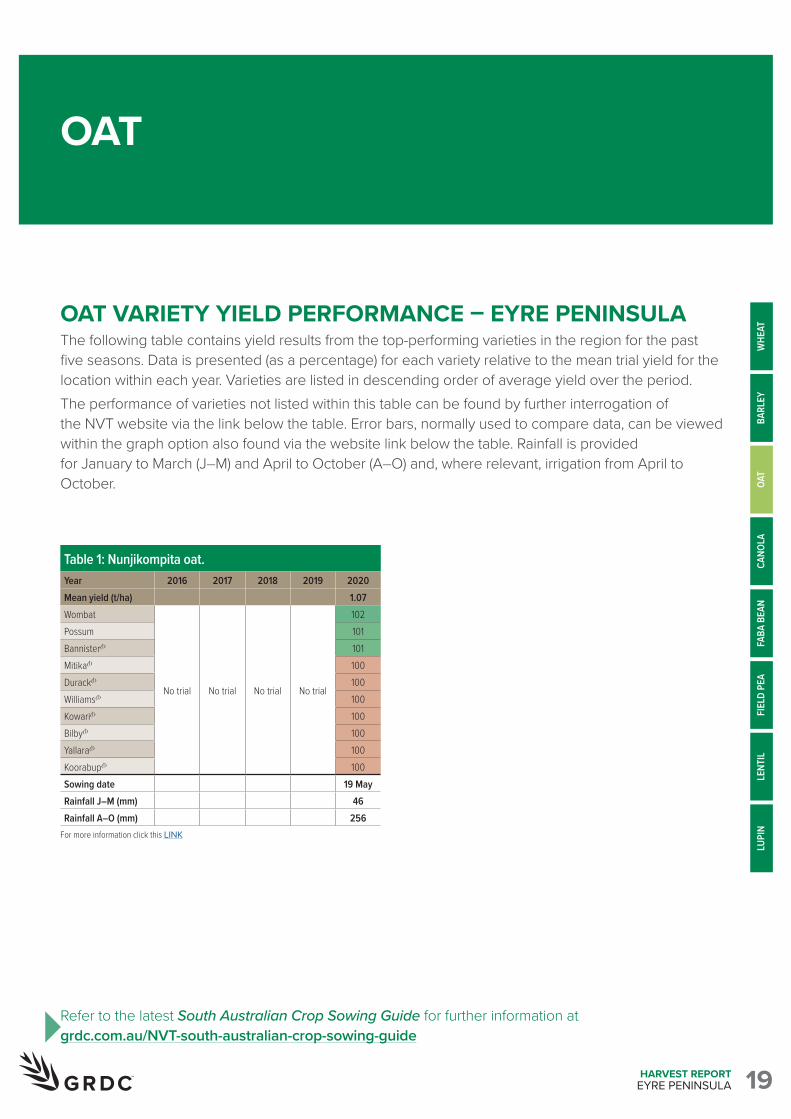
OAT VARIETY YIELD PERFORMANCE – EYRE PENINSULAThe following table contains yield results from the top-performing varieties in the region for the past five seasons. Data is presented (as a percentage) for each variety relative to the mean trial yield for the location within each year. Varieties are listed in descending order of average yield over the period. The performance of varieties not listed within this table can be found by further interrogation of the NVT website via the link below the table. Error bars, normally used to compare data, can be viewed within the graph option also found via the website link below the table. Rainfall is provided for January to March (J–M) and April to October (A–O) and, where relevant, irrigation from April to October.
Table 1: Nunjikompita oat.Year 2016 2017 2018 2019 2020Mean yield (t/ha) 1.07Wombat
No trial No trial No trial No trial
102Possum 101BannisterA 101MitikaA 100DurackA 100WilliamsA 100KowariA 100BilbyA 100YallaraA 100KoorabupA 100Sowing date 19 MayRainfall J–M (mm) 46Rainfall A–O (mm) 256
For more information click this LINK
WHE
ATBA
RLEY
OAT
CANO
LAFI
ELD
PEA
LUPI
NFA
BA B
EAN
LENT
IL
20HARVEST REPORTEYRE PENINSULA
OAT
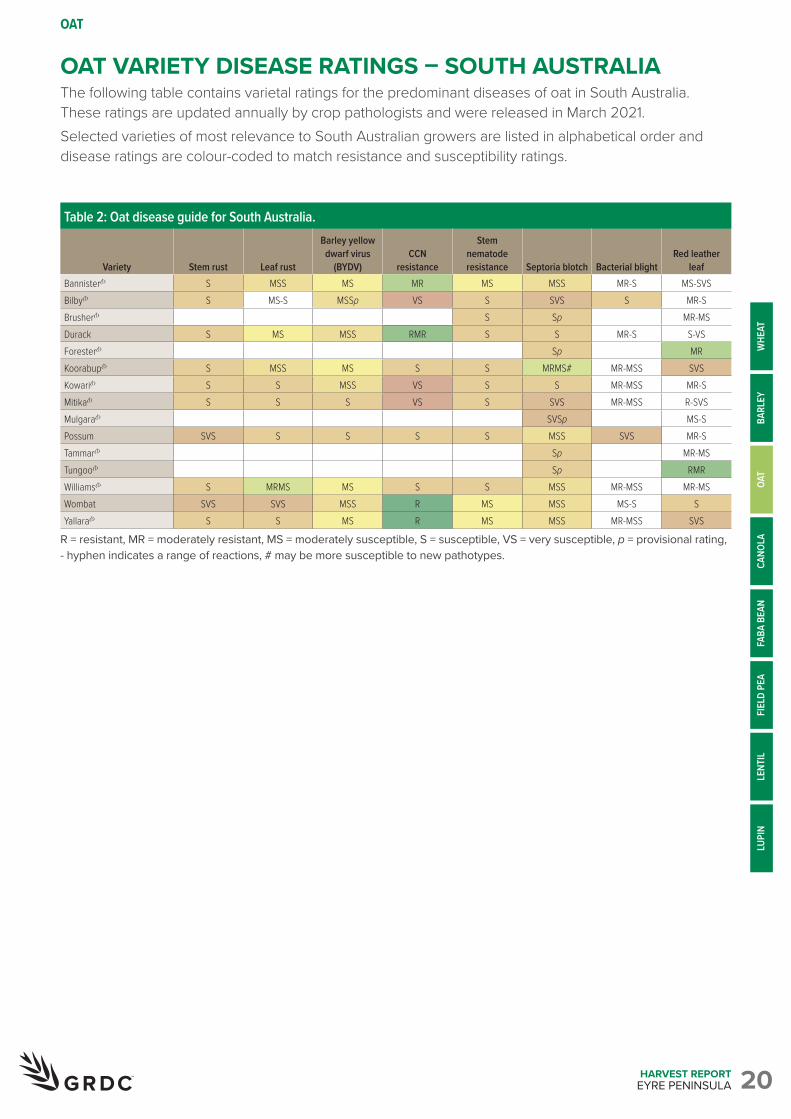
OAT VARIETY DISEASE RATINGS – SOUTH AUSTRALIAThe following table contains varietal ratings for the predominant diseases of oat in South Australia. These ratings are updated annually by crop pathologists and were released in March 2021. Selected varieties of most relevance to South Australian growers are listed in alphabetical order and disease ratings are colour-coded to match resistance and susceptibility ratings.
Table 2: Oat disease guide for South Australia.
Variety Stem rust Leaf rust
Barley yellow dwarf virus
(BYDV)CCN
resistance
Stem nematode resistance Septoria blotch Bacterial blight
Red leather leaf
BannisterA S MSS MS MR MS MSS MR-S MS-SVSBilbyA S MS-S MSSp VS S SVS S MR-SBrusherA S Sp MR-MSDurack S MS MSS RMR S S MR-S S-VSForesterA Sp MRKoorabupA S MSS MS S S MRMS# MR-MSS SVSKowariA S S MSS VS S S MR-MSS MR-SMitikaA S S S VS S SVS MR-MSS R-SVSMulgaraA SVSp MS-SPossum SVS S S S S MSS SVS MR-STammarA Sp MR-MSTungooA Sp RMRWilliamsA S MRMS MS S S MSS MR-MSS MR-MSWombat SVS SVS MSS R MS MSS MS-S SYallaraA S S MS R MS MSS MR-MSS SVS
R = resistant, MR = moderately resistant, MS = moderately susceptible, S = susceptible, VS = very susceptible, p = provisional rating, - hyphen indicates a range of reactions, # may be more susceptible to new pathotypes.
WHE
ATBA
RLEY
OAT
CANO
LAFI
ELD
PEA
LUPI
NFA
BA B
EAN
LENT
IL
21HARVEST REPORTEYRE PENINSULA
CANOLA
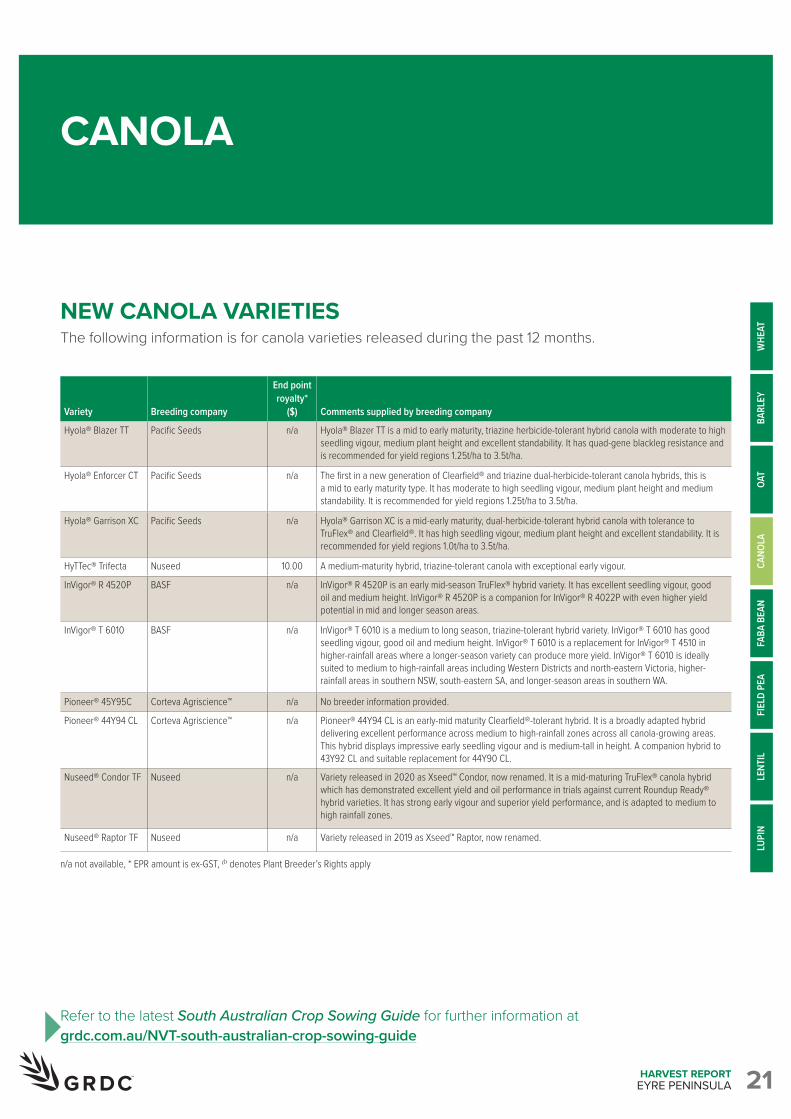
NEW CANOLA VARIETIESThe following information is for canola varieties released during the past 12 months.
Refer to the latest South Australian Crop Sowing Guide for further information at grdc.com.au/NVT-south-australian-crop-sowing-guide
Variety
Breeding company
End point royalty*
($)
Comments supplied by breeding company
Hyola® Blazer TT Pacific Seeds n/a Hyola® Blazer TT is a mid to early maturity, triazine herbicide-tolerant hybrid canola with moderate to high seedling vigour, medium plant height and excellent standability. It has quad-gene blackleg resistance and is recommended for yield regions 1.25t/ha to 3.5t/ha.
Hyola® Enforcer CT Pacific Seeds n/a The first in a new generation of Clearfield® and triazine dual-herbicide-tolerant canola hybrids, this is a mid to early maturity type. It has moderate to high seedling vigour, medium plant height and medium standability. It is recommended for yield regions 1.25t/ha to 3.5t/ha.
Hyola® Garrison XC Pacific Seeds n/a Hyola® Garrison XC is a mid-early maturity, dual-herbicide-tolerant hybrid canola with tolerance to TruFlex® and Clearfield®. It has high seedling vigour, medium plant height and excellent standability. It is recommended for yield regions 1.0t/ha to 3.5t/ha.
HyTTec® Trifecta Nuseed 10.00 A medium-maturity hybrid, triazine-tolerant canola with exceptional early vigour.
InVigor® R 4520P BASF n/a InVigor® R 4520P is an early mid-season TruFlex® hybrid variety. It has excellent seedling vigour, good oil and medium height. InVigor® R 4520P is a companion for InVigor® R 4022P with even higher yield potential in mid and longer season areas.
InVigor® T 6010 BASF n/a InVigor® T 6010 is a medium to long season, triazine-tolerant hybrid variety. InVigor® T 6010 has good seedling vigour, good oil and medium height. InVigor® T 6010 is a replacement for InVigor® T 4510 in higher-rainfall areas where a longer-season variety can produce more yield. InVigor® T 6010 is ideally suited to medium to high-rainfall areas including Western Districts and north-eastern Victoria, higher-rainfall areas in southern NSW, south-eastern SA, and longer-season areas in southern WA.
Pioneer® 45Y95C Corteva Agriscience™ n/a No breeder information provided.
Pioneer® 44Y94 CL Corteva Agriscience™ n/a Pioneer® 44Y94 CL is an early-mid maturity Clearfield®-tolerant hybrid. It is a broadly adapted hybrid delivering excellent performance across medium to high-rainfall zones across all canola-growing areas. This hybrid displays impressive early seedling vigour and is medium-tall in height. A companion hybrid to 43Y92 CL and suitable replacement for 44Y90 CL.
Nuseed® Condor TF Nuseed n/a Variety released in 2020 as Xseed™ Condor, now renamed. It is a mid-maturing TruFlex® canola hybrid which has demonstrated excellent yield and oil performance in trials against current Roundup Ready® hybrid varieties. It has strong early vigour and superior yield performance, and is adapted to medium to high rainfall zones.
Nuseed® Raptor TF Nuseed n/a Variety released in 2019 as Xseed™ Raptor, now renamed.
n/a not available, * EPR amount is ex-GST, A denotes Plant Breeder’s Rights apply
WHE
ATBA
RLEY
OAT
CANO
LAFI
ELD
PEA
LUPI
NFA
BA B
EAN
LENT
IL
22HARVEST REPORTEYRE PENINSULA
CANOLA
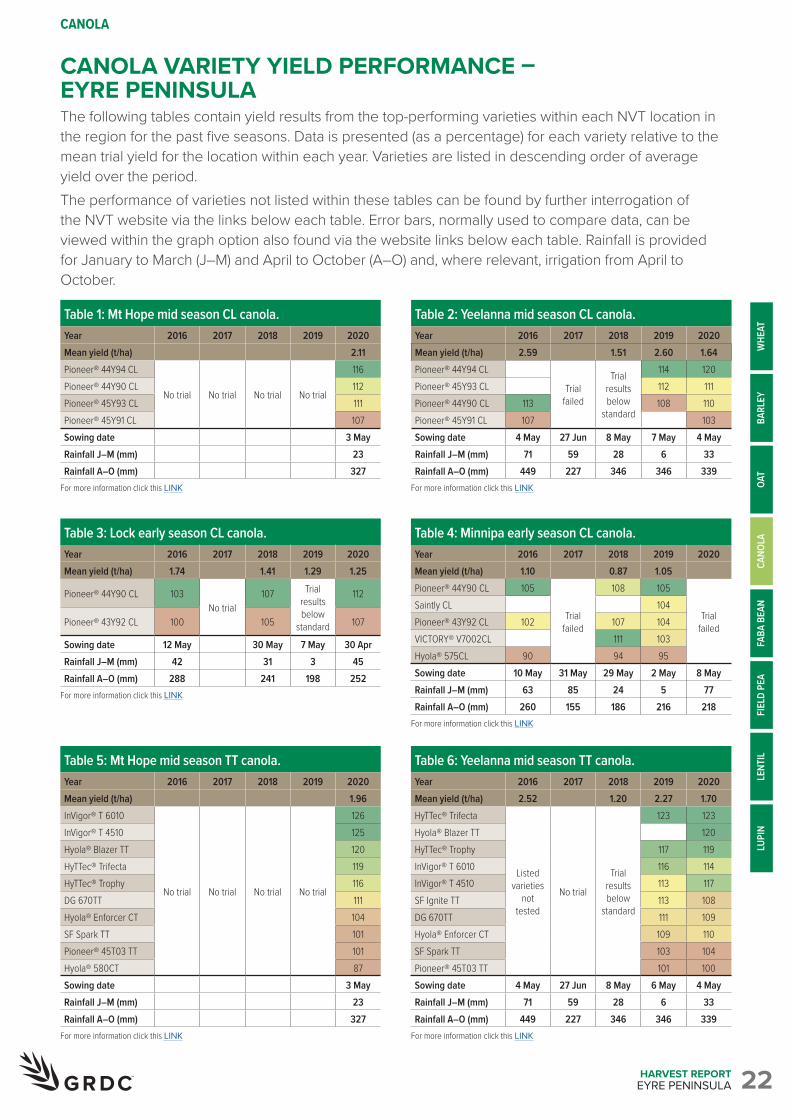
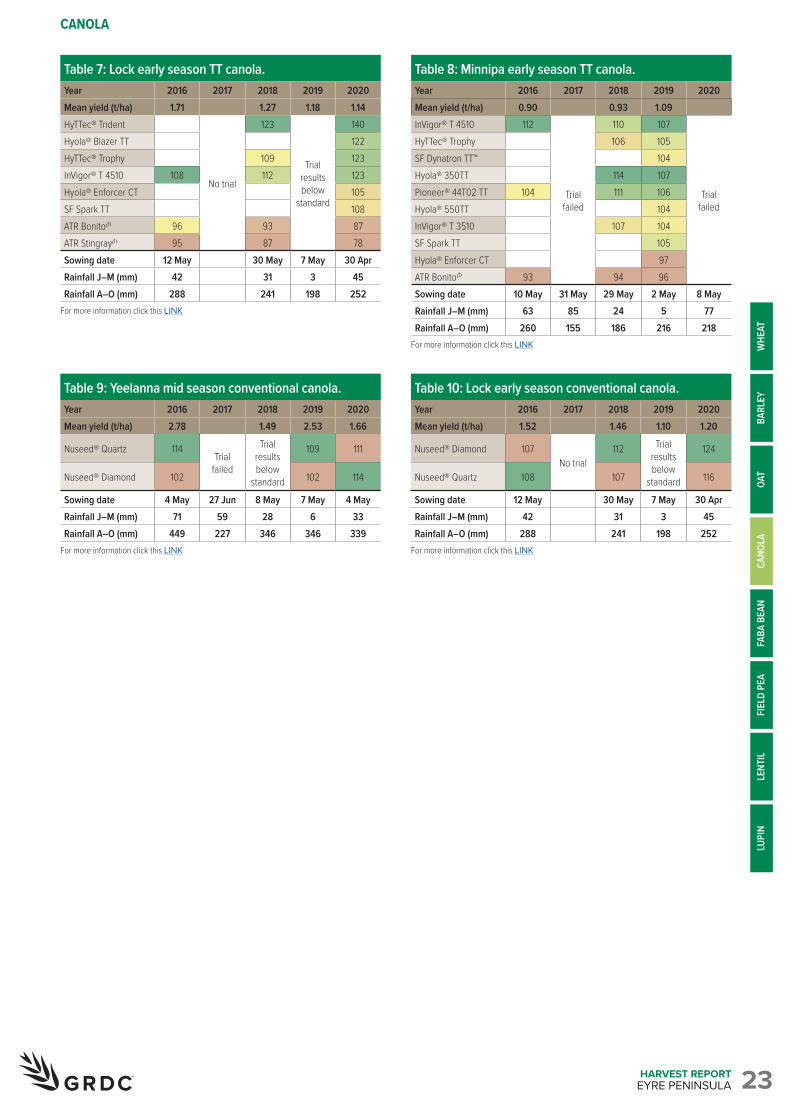
CANOLA VARIETY YIELD PERFORMANCE – EYRE PENINSULAThe following tables contain yield results from the top-performing varieties within each NVT location in the region for the past five seasons. Data is presented (as a percentage) for each variety relative to the mean trial yield for the location within each year. Varieties are listed in descending order of average yield over the period. The performance of varieties not listed within these tables can be found by further interrogation of the NVT website via the links below each table. Error bars, normally used to compare data, can be viewed within the graph option also found via the website links below each table. Rainfall is provided for January to March (J–M) and April to October (A–O) and, where relevant, irrigation from April to October.
Table 1: Mt Hope mid season CL canola.Year 2016 2017 2018 2019 2020Mean yield (t/ha) 2.11Pioneer® 44Y94 CL
No trial No trial No trial No trial
116Pioneer® 44Y90 CL 112Pioneer® 45Y93 CL 111Pioneer® 45Y91 CL 107Sowing date 3 MayRainfall J–M (mm) 23Rainfall A–O (mm) 327
For more information click this LINK
Table 3: Lock early season CL canola.Year 2016 2017 2018 2019 2020Mean yield (t/ha) 1.74 1.41 1.29 1.25
Pioneer® 44Y90 CL 103No trial
107 Trial results below
standard
112
Pioneer® 43Y92 CL 100 105 107
Sowing date 12 May 30 May 7 May 30 AprRainfall J–M (mm) 42 31 3 45Rainfall A–O (mm) 288 241 198 252
For more information click this LINK
Table 5: Mt Hope mid season TT canola.Year 2016 2017 2018 2019 2020Mean yield (t/ha) 1.96InVigor® T 6010
No trial No trial No trial No trial
126InVigor® T 4510 125Hyola® Blazer TT 120HyTTec® Trifecta 119HyTTec® Trophy 116DG 670TT 111Hyola® Enforcer CT 104SF Spark TT 101Pioneer® 45T03 TT 101Hyola® 580CT 87Sowing date 3 MayRainfall J–M (mm) 23Rainfall A–O (mm) 327
For more information click this LINK
Table 2: Yeelanna mid season CL canola.Year 2016 2017 2018 2019 2020Mean yield (t/ha) 2.59 1.51 2.60 1.64Pioneer® 44Y94 CL
Trial failed
Trial results below
standard
114 120Pioneer® 45Y93 CL 112 111Pioneer® 44Y90 CL 113 108 110Pioneer® 45Y91 CL 107 103Sowing date 4 May 27 Jun 8 May 7 May 4 MayRainfall J–M (mm) 71 59 28 6 33Rainfall A–O (mm) 449 227 346 346 339
For more information click this LINK
Table 4: Minnipa early season CL canola.Year 2016 2017 2018 2019 2020Mean yield (t/ha) 1.10 0.87 1.05Pioneer® 44Y90 CL 105
Trial failed
108 105
Trial failed
Saintly CL 104Pioneer® 43Y92 CL 102 107 104VICTORY® V7002CL 111 103Hyola® 575CL 90 94 95Sowing date 10 May 31 May 29 May 2 May 8 MayRainfall J–M (mm) 63 85 24 5 77Rainfall A–O (mm) 260 155 186 216 218
For more information click this LINK
Table 6: Yeelanna mid season TT canola.Year 2016 2017 2018 2019 2020Mean yield (t/ha) 2.52 1.20 2.27 1.70HyTTec® Trifecta
Listed varieties
not tested
No trial
Trial results below
standard
123 123Hyola® Blazer TT 120HyTTec® Trophy 117 119InVigor® T 6010 116 114InVigor® T 4510 113 117SF Ignite TT 113 108DG 670TT 111 109Hyola® Enforcer CT 109 110SF Spark TT 103 104Pioneer® 45T03 TT 101 100Sowing date 4 May 27 Jun 8 May 6 May 4 MayRainfall J–M (mm) 71 59 28 6 33Rainfall A–O (mm) 449 227 346 346 339
For more information click this LINK
WHE
ATBA
RLEY
OAT
CANO
LAFI
ELD
PEA
LUPI
NFA
BA B
EAN
LENT
IL
23HARVEST REPORTEYRE PENINSULA
CANOLA
Table 7: Lock early season TT canola.Year 2016 2017 2018 2019 2020Mean yield (t/ha) 1.71 1.27 1.18 1.14HyTTec® Trident
No trial
123
Trial results below
standard
140Hyola® Blazer TT 122HyTTec® Trophy 109 123InVigor® T 4510 108 112 123Hyola® Enforcer CT 105SF Spark TT 108ATR BonitoA 96 93 87ATR StingrayA 95 87 78Sowing date 12 May 30 May 7 May 30 AprRainfall J–M (mm) 42 31 3 45Rainfall A–O (mm) 288 241 198 252
For more information click this LINK
Table 9: Yeelanna mid season conventional canola.Year 2016 2017 2018 2019 2020Mean yield (t/ha) 2.78 1.49 2.53 1.66
Nuseed® Quartz 114Trial
failed
Trial results below
standard
109 111
Nuseed® Diamond 102 102 114
Sowing date 4 May 27 Jun 8 May 7 May 4 MayRainfall J–M (mm) 71 59 28 6 33Rainfall A–O (mm) 449 227 346 346 339
For more information click this LINK
Table 8: Minnipa early season TT canola.Year 2016 2017 2018 2019 2020Mean yield (t/ha) 0.90 0.93 1.09InVigor® T 4510 112
Trial failed
110 107
Trial failed
HyTTec® Trophy 106 105SF Dynatron TT™ 104Hyola® 350TT 114 107Pioneer® 44T02 TT 104 111 106Hyola® 550TT 104InVigor® T 3510 107 104SF Spark TT 105Hyola® Enforcer CT 97ATR BonitoA 93 94 96Sowing date 10 May 31 May 29 May 2 May 8 MayRainfall J–M (mm) 63 85 24 5 77Rainfall A–O (mm) 260 155 186 216 218
For more information click this LINK
Table 10: Lock early season conventional canola.Year 2016 2017 2018 2019 2020Mean yield (t/ha) 1.52 1.46 1.10 1.20
Nuseed® Diamond 107No trial
112 Trial results below
standard
124
Nuseed® Quartz 108 107 116
Sowing date 12 May 30 May 7 May 30 AprRainfall J–M (mm) 42 31 3 45Rainfall A–O (mm) 288 241 198 252
For more information click this LINK
WHE
ATBA
RLEY
OAT
CANO
LAFI
ELD
PEA
LUPI
NFA
BA B
EAN
LENT
IL
HARVEST REPORTEYRE PENINSULA
CANOLA
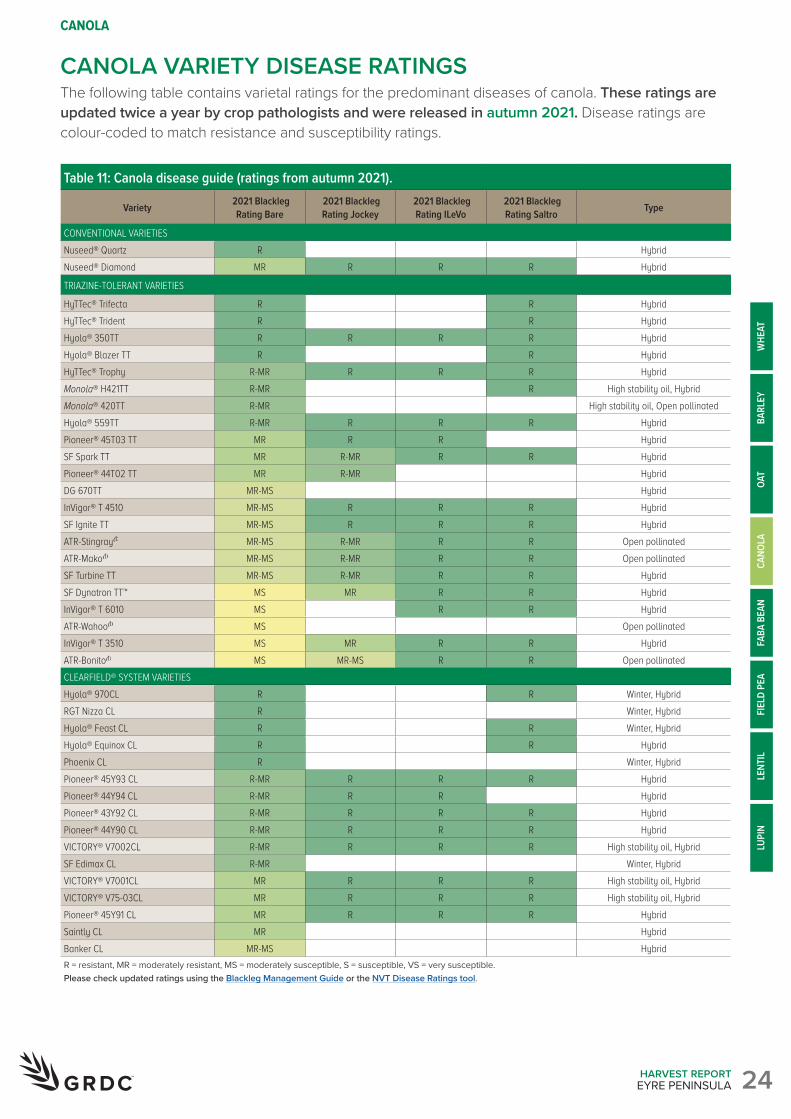
Table 11: Canola disease guide (ratings from autumn 2021).
Variety 2021 Blackleg Rating Bare
2021 Blackleg Rating Jockey
2021 Blackleg Rating ILeVo
2021 Blackleg Rating Saltro Type
CONVENTIONAL VARIETIESNuseed® Quartz R HybridNuseed® Diamond MR R R R Hybrid
TRIAZINE-TOLERANT VARIETIES
HyTTec® Trifecta R R HybridHyTTec® Trident R R HybridHyola® 350TT R R R R HybridHyola® Blazer TT R R HybridHyTTec® Trophy R-MR R R R HybridMonola® H421TT R-MR R High stability oil, HybridMonola® 420TT R-MR High stability oil, Open pollinatedHyola® 559TT R-MR R R R HybridPioneer® 45T03 TT MR R R HybridSF Spark TT MR R-MR R R HybridPioneer® 44T02 TT MR R-MR HybridDG 670TT MR-MS HybridInVigor® T 4510 MR-MS R R R HybridSF Ignite TT MR-MS R R R HybridATR-Stingray MR-MS R-MR R R Open pollinatedATR-Mako MR-MS R-MR R R Open pollinatedSF Turbine TT MR-MS R-MR R R HybridSF Dynatron TT™ MS MR R R HybridInVigor® T 6010 MS R R HybridATR-Wahoo MS Open pollinatedInVigor® T 3510 MS MR R R HybridATR-Bonito MS MR-MS R R Open pollinatedCLEARFIELD® SYSTEM VARIETIESHyola® 970CL R R Winter, HybridRGT Nizza CL R Winter, HybridHyola® Feast CL R R Winter, HybridHyola® Equinox CL R R HybridPhoenix CL R Winter, HybridPioneer® 45Y93 CL R-MR R R R HybridPioneer® 44Y94 CL R-MR R R HybridPioneer® 43Y92 CL R-MR R R R HybridPioneer® 44Y90 CL R-MR R R R HybridVICTORY® V7002CL R-MR R R R High stability oil, HybridSF Edimax CL R-MR Winter, HybridVICTORY® V7001CL MR R R R High stability oil, HybridVICTORY® V75-03CL MR R R R High stability oil, HybridPioneer® 45Y91 CL MR R R R HybridSaintly CL MR HybridBanker CL MR-MS HybridR = resistant, MR = moderately resistant, MS = moderately susceptible, S = susceptible, VS = very susceptible. Please check updated ratings using the Blackleg Management Guide or the NVT Disease Ratings tool.
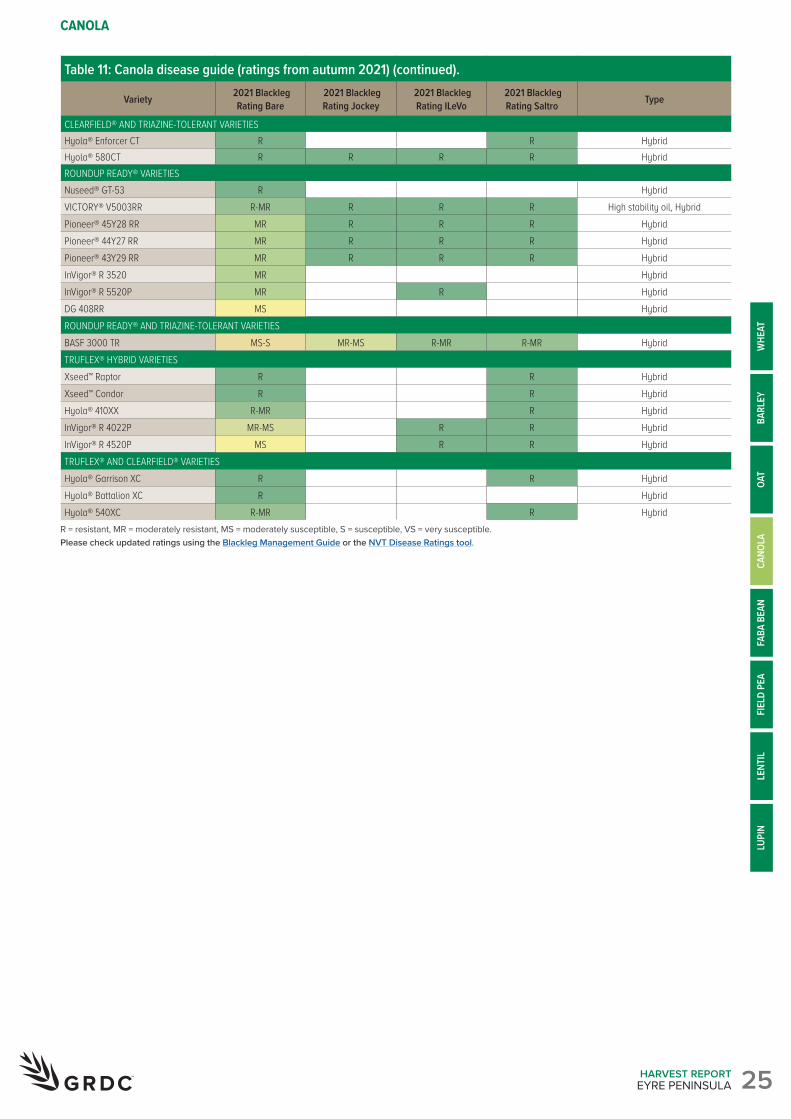
CANOLA VARIETY DISEASE RATINGSThe following table contains varietal ratings for the predominant diseases of canola. These ratings are updated twice a year by crop pathologists and were released in autumn 2021. Disease ratings are colour-coded to match resistance and susceptibility ratings.
WHE
ATBA
RLEY
OAT
CANO
LAFI
ELD
PEA
LENT
ILLU
PIN
FABA
BEA
N
24
HARVEST REPORTEYRE PENINSULA
CANOLA
Table 11: Canola disease guide (ratings from autumn 2021) (continued).
Variety 2021 Blackleg Rating Bare
2021 Blackleg Rating Jockey
2021 Blackleg Rating ILeVo
2021 Blackleg Rating Saltro Type
CLEARFIELD® AND TRIAZINE-TOLERANT VARIETIES Hyola® Enforcer CT R R HybridHyola® 580CT R R R R HybridROUNDUP READY® VARIETIES Nuseed® GT-53 R HybridVICTORY® V5003RR R-MR R R R High stability oil, HybridPioneer® 45Y28 RR MR R R R HybridPioneer® 44Y27 RR MR R R R HybridPioneer® 43Y29 RR MR R R R HybridInVigor® R 3520 MR HybridInVigor® R 5520P MR R HybridDG 408RR MS HybridROUNDUP READY® AND TRIAZINE-TOLERANT VARIETIESBASF 3000 TR MS-S MR-MS R-MR R-MR HybridTRUFLEX® HYBRID VARIETIESXseed™ Raptor R R HybridXseed™ Condor R R HybridHyola® 410XX R-MR R HybridInVigor® R 4022P MR-MS R R HybridInVigor® R 4520P MS R R HybridTRUFLEX® AND CLEARFIELD® VARIETIESHyola® Garrison XC R R HybridHyola® Battalion XC R HybridHyola® 540XC R-MR R Hybrid
R = resistant, MR = moderately resistant, MS = moderately susceptible, S = susceptible, VS = very susceptible. Please check updated ratings using the Blackleg Management Guide or the NVT Disease Ratings tool.
25
WHE
ATBA
RLEY
OAT
CANO
LAFI
ELD
PEA
LENT
ILLU
PIN
FABA
BEA
N
26HARVEST REPORTEYRE PENINSULA
FABA BEAN
Refer to the latest South Australian Crop Sowing Guide for further information at grdc.com.au/NVT-south-australian-crop-sowing-guide
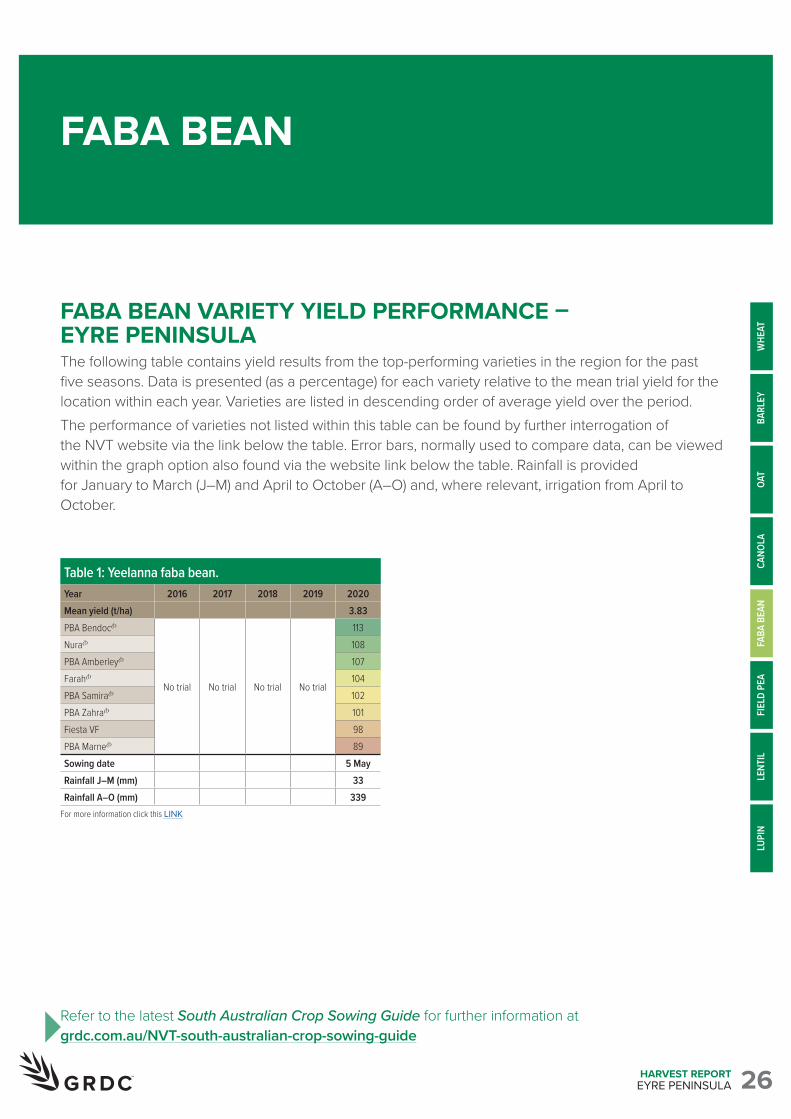
FABA BEAN VARIETY YIELD PERFORMANCE – EYRE PENINSULAThe following table contains yield results from the top-performing varieties in the region for the past five seasons. Data is presented (as a percentage) for each variety relative to the mean trial yield for the location within each year. Varieties are listed in descending order of average yield over the period. The performance of varieties not listed within this table can be found by further interrogation of the NVT website via the link below the table. Error bars, normally used to compare data, can be viewed within the graph option also found via the website link below the table. Rainfall is provided for January to March (J–M) and April to October (A–O) and, where relevant, irrigation from April to October.
Table 1: Yeelanna faba bean.Year 2016 2017 2018 2019 2020Mean yield (t/ha) 3.83PBA BendocA
No trial No trial No trial No trial
113NuraA 108PBA AmberleyA 107FarahA 104PBA SamiraA 102PBA ZahraA 101Fiesta VF 98PBA MarneA 89Sowing date 5 MayRainfall J–M (mm) 33Rainfall A–O (mm) 339
For more information click this LINK
WHE
ATBA
RLEY
OAT
CANO
LAFI
ELD
PEA
LUPI
NFA
BA B
EAN
LENT
IL
27HARVEST REPORTEYRE PENINSULA
FABA BEAN
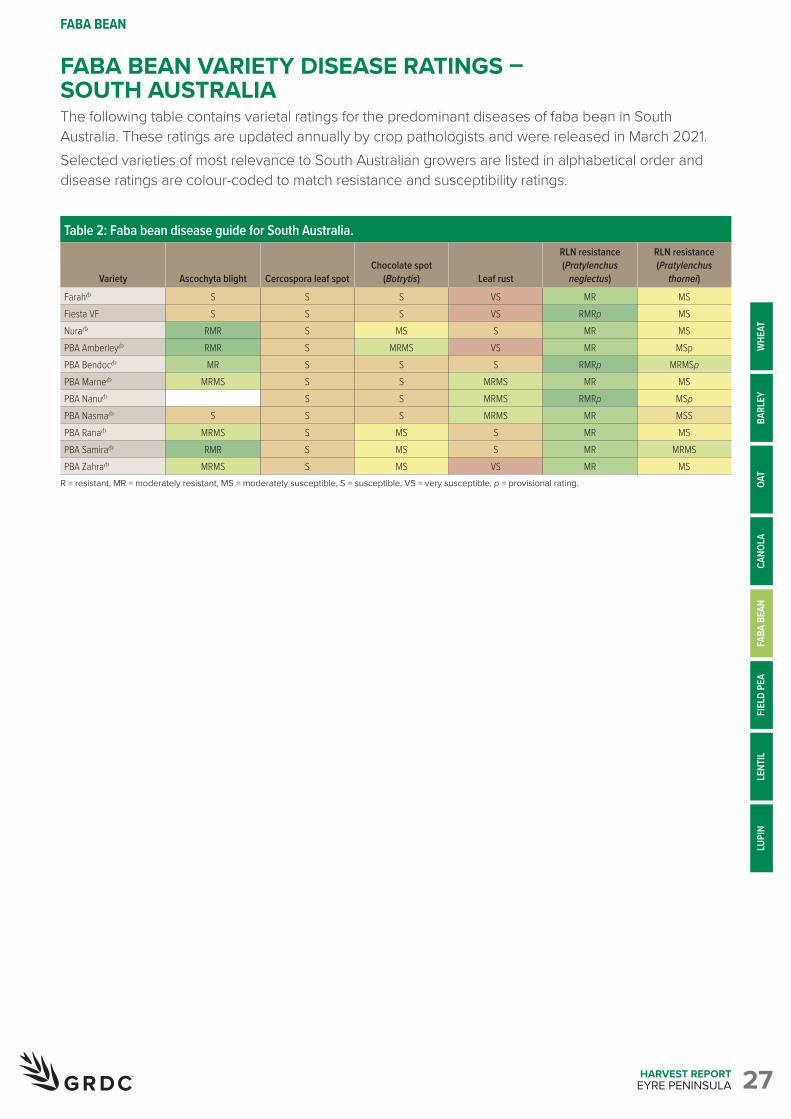
FABA BEAN VARIETY DISEASE RATINGS – SOUTH AUSTRALIAThe following table contains varietal ratings for the predominant diseases of faba bean in South Australia. These ratings are updated annually by crop pathologists and were released in March 2021. Selected varieties of most relevance to South Australian growers are listed in alphabetical order and disease ratings are colour-coded to match resistance and susceptibility ratings.
Table 2: Faba bean disease guide for South Australia.
Variety Ascochyta blight Cercospora leaf spotChocolate spot
(Botrytis) Leaf rust
RLN resistance (Pratylenchus
neglectus)
RLN resistance (Pratylenchus
thornei)
FarahA S S S VS MR MSFiesta VF S S S VS RMRp MSNuraA RMR S MS S MR MSPBA AmberleyA RMR S MRMS VS MR MSpPBA BendocA MR S S S RMRp MRMSpPBA MarneA MRMS S S MRMS MR MSPBA NanuA S S MRMS RMRp MSpPBA NasmaA S S S MRMS MR MSSPBA RanaA MRMS S MS S MR MSPBA SamiraA RMR S MS S MR MRMSPBA ZahraA MRMS S MS VS MR MS
R = resistant, MR = moderately resistant, MS = moderately susceptible, S = susceptible, VS = very susceptible, p = provisional rating.
WHE
ATBA
RLEY
OAT
CANO
LAFI
ELD
PEA
LUPI
NFA
BA B
EAN
LENT
IL
28HARVEST REPORTEYRE PENINSULA
FIELD PEA
Refer to the latest South Australian Crop Sowing Guide for further information at grdc.com.au/NVT-south-australian-crop-sowing-guide
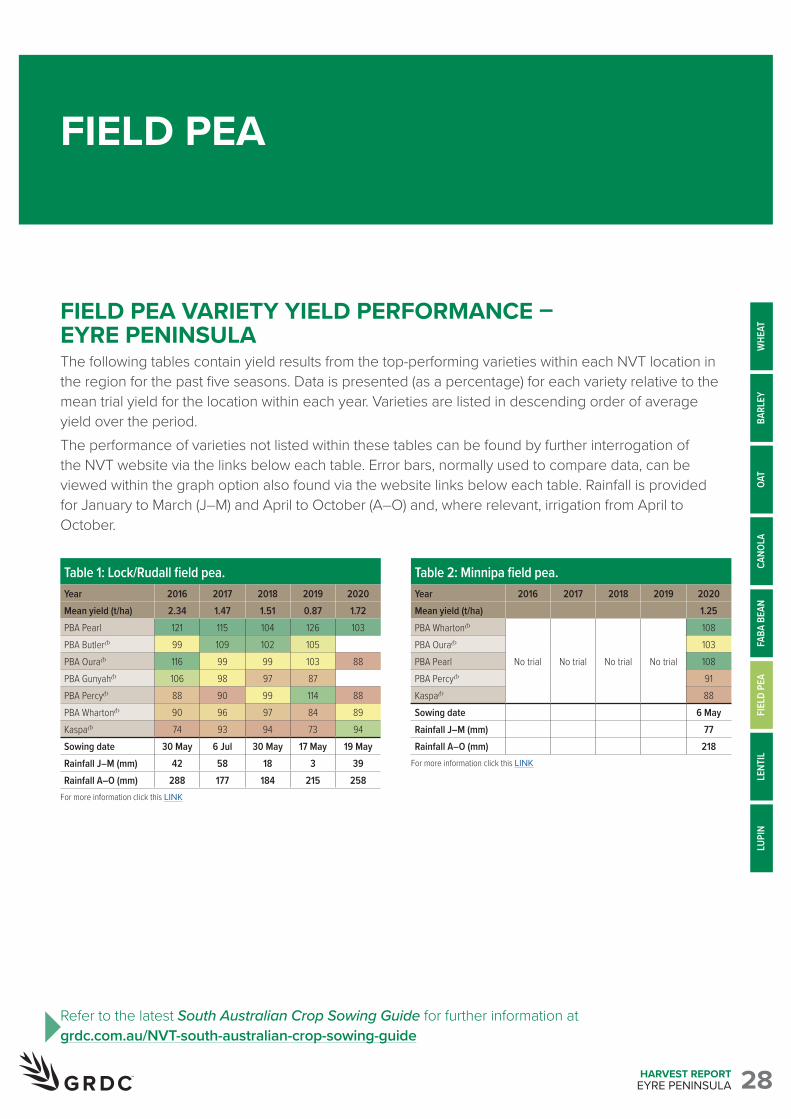
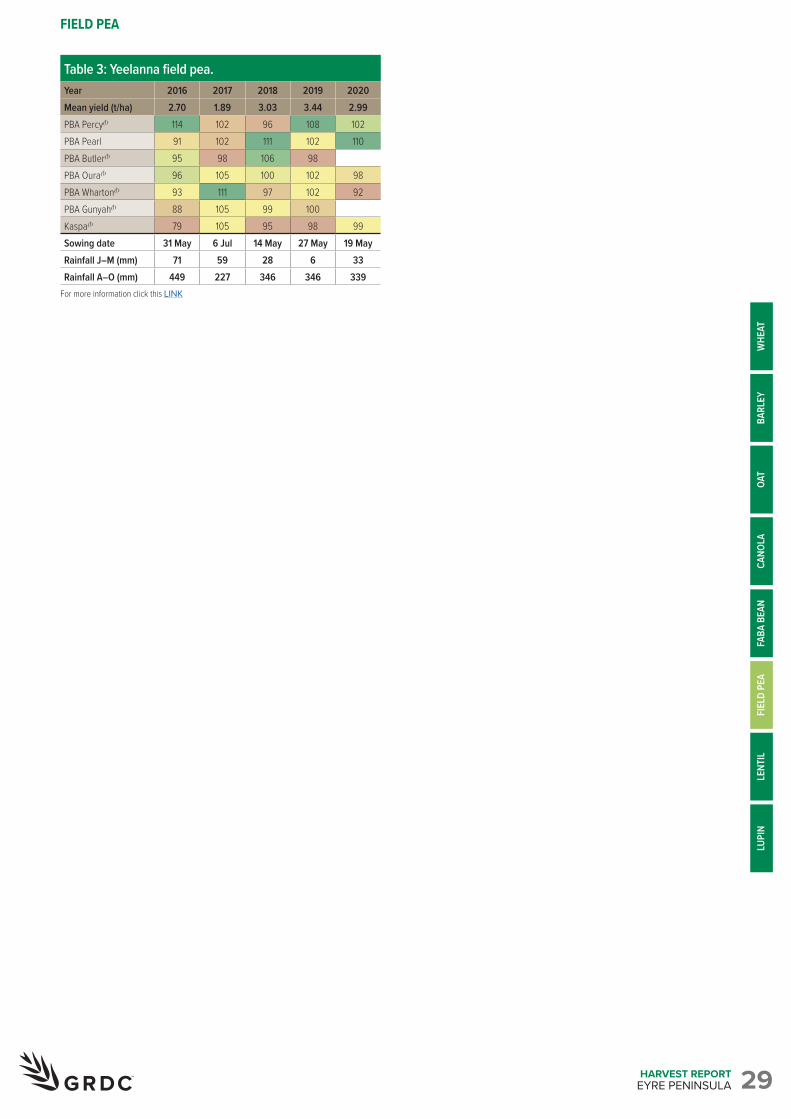
FIELD PEA VARIETY YIELD PERFORMANCE – EYRE PENINSULAThe following tables contain yield results from the top-performing varieties within each NVT location in the region for the past five seasons. Data is presented (as a percentage) for each variety relative to the mean trial yield for the location within each year. Varieties are listed in descending order of average yield over the period. The performance of varieties not listed within these tables can be found by further interrogation of the NVT website via the links below each table. Error bars, normally used to compare data, can be viewed within the graph option also found via the website links below each table. Rainfall is provided for January to March (J–M) and April to October (A–O) and, where relevant, irrigation from April to October.
Table 1: Lock/Rudall field pea.Year 2016 2017 2018 2019 2020Mean yield (t/ha) 2.34 1.47 1.51 0.87 1.72PBA Pearl 121 115 104 126 103PBA ButlerA 99 109 102 105PBA OuraA 116 99 99 103 88PBA GunyahA 106 98 97 87PBA PercyA 88 90 99 114 88PBA WhartonA 90 96 97 84 89KaspaA 74 93 94 73 94Sowing date 30 May 6 Jul 30 May 17 May 19 MayRainfall J–M (mm) 42 58 18 3 39Rainfall A–O (mm) 288 177 184 215 258
For more information click this LINK
Table 2: Minnipa field pea.Year 2016 2017 2018 2019 2020Mean yield (t/ha) 1.25PBA WhartonA
No trial No trial No trial No trial
108PBA OuraA 103PBA Pearl 108PBA PercyA 91KaspaA 88Sowing date 6 MayRainfall J–M (mm) 77Rainfall A–O (mm) 218
For more information click this LINKW
HEAT
BARL
EYOA
TCA
NOLA
FIEL
D PE
ALU
PIN
FABA
BEA
NLE
NTIL
29HARVEST REPORTEYRE PENINSULA
FIELD PEA
Table 3: Yeelanna field pea.Year 2016 2017 2018 2019 2020Mean yield (t/ha) 2.70 1.89 3.03 3.44 2.99PBA PercyA 114 102 96 108 102PBA Pearl 91 102 111 102 110PBA ButlerA 95 98 106 98PBA OuraA 96 105 100 102 98PBA WhartonA 93 111 97 102 92PBA GunyahA 88 105 99 100KaspaA 79 105 95 98 99Sowing date 31 May 6 Jul 14 May 27 May 19 MayRainfall J–M (mm) 71 59 28 6 33Rainfall A–O (mm) 449 227 346 346 339
For more information click this LINK
WHE
ATBA
RLEY
OAT
CANO
LAFI
ELD
PEA
LUPI
NFA
BA B
EAN
LENT
IL
30HARVEST REPORTEYRE PENINSULA
FIELD PEA
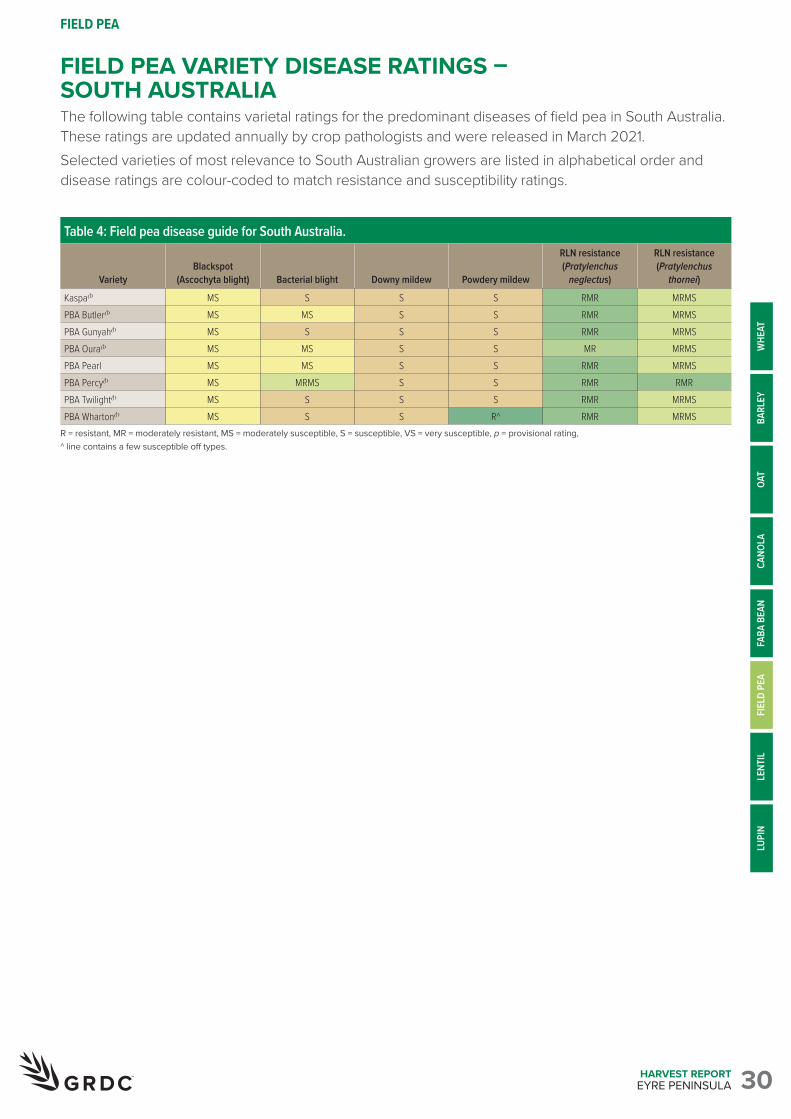
FIELD PEA VARIETY DISEASE RATINGS – SOUTH AUSTRALIAThe following table contains varietal ratings for the predominant diseases of field pea in South Australia. These ratings are updated annually by crop pathologists and were released in March 2021. Selected varieties of most relevance to South Australian growers are listed in alphabetical order and disease ratings are colour-coded to match resistance and susceptibility ratings.
Table 4: Field pea disease guide for South Australia.
VarietyBlackspot
(Ascochyta blight) Bacterial blight Downy mildew Powdery mildew
RLN resistance (Pratylenchus
neglectus)
RLN resistance (Pratylenchus
thornei)
KaspaA MS S S S RMR MRMSPBA ButlerA MS MS S S RMR MRMSPBA GunyahA MS S S S RMR MRMSPBA OuraA MS MS S S MR MRMSPBA Pearl MS MS S S RMR MRMSPBA PercyA MS MRMS S S RMR RMRPBA TwilightA MS S S S RMR MRMSPBA WhartonA MS S S R^ RMR MRMS
R = resistant, MR = moderately resistant, MS = moderately susceptible, S = susceptible, VS = very susceptible, p = provisional rating, ^ line contains a few susceptible off types.
WHE
ATBA
RLEY
OAT
CANO
LAFI
ELD
PEA
LUPI
NFA
BA B
EAN
LENT
IL
31HARVEST REPORTEYRE PENINSULA
LENTIL
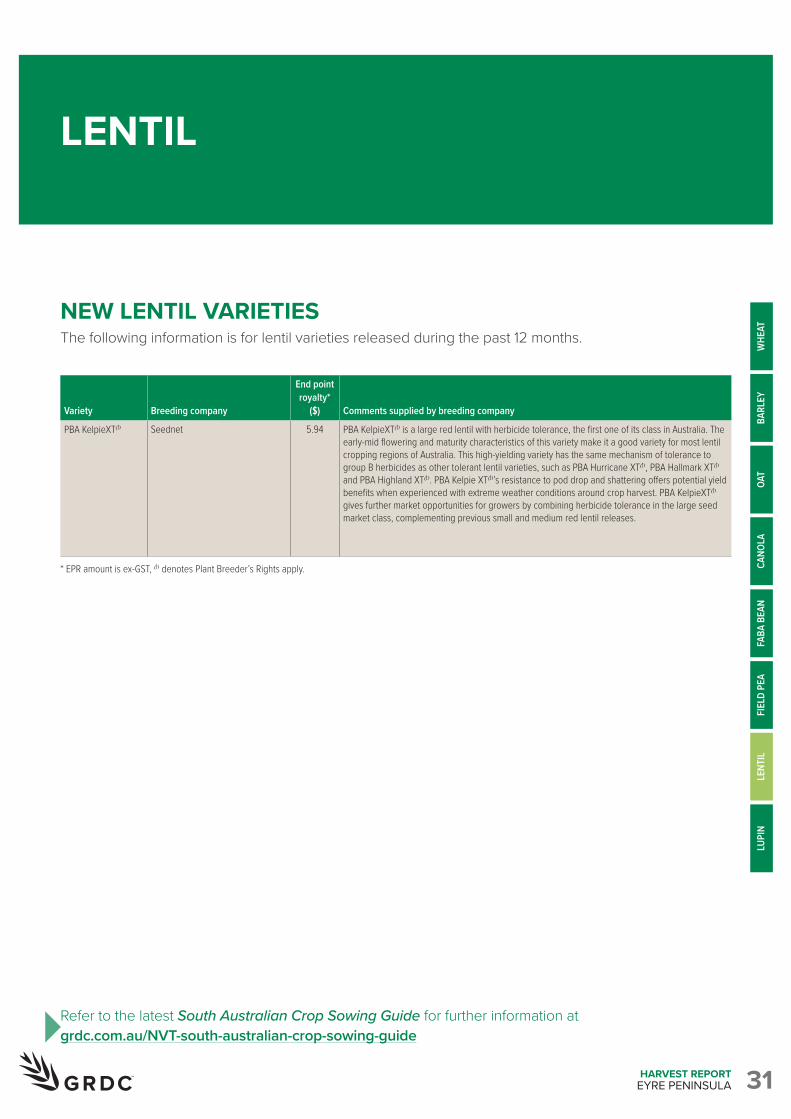
NEW LENTIL VARIETIESThe following information is for lentil varieties released during the past 12 months.
Variety
Breeding company
End point royalty*
($)
Comments supplied by breeding company
PBA KelpieXTA Seednet 5.94 PBA KelpieXTA is a large red lentil with herbicide tolerance, the first one of its class in Australia. The early-mid flowering and maturity characteristics of this variety make it a good variety for most lentil cropping regions of Australia. This high-yielding variety has the same mechanism of tolerance to group B herbicides as other tolerant lentil varieties, such as PBA Hurricane XTA, PBA Hallmark XTA and PBA Highland XTA. PBA Kelpie XTA’s resistance to pod drop and shattering offers potential yield benefits when experienced with extreme weather conditions around crop harvest. PBA KelpieXTA gives further market opportunities for growers by combining herbicide tolerance in the large seed market class, complementing previous small and medium red lentil releases.
* EPR amount is ex-GST, A denotes Plant Breeder’s Rights apply.
Refer to the latest South Australian Crop Sowing Guide for further information at grdc.com.au/NVT-south-australian-crop-sowing-guide
WHE
ATBA
RLEY
OAT
CANO
LAFI
ELD
PEA
LENT
ILLU
PIN
FABA
BEA
N
32HARVEST REPORTEYRE PENINSULA
LENTIL
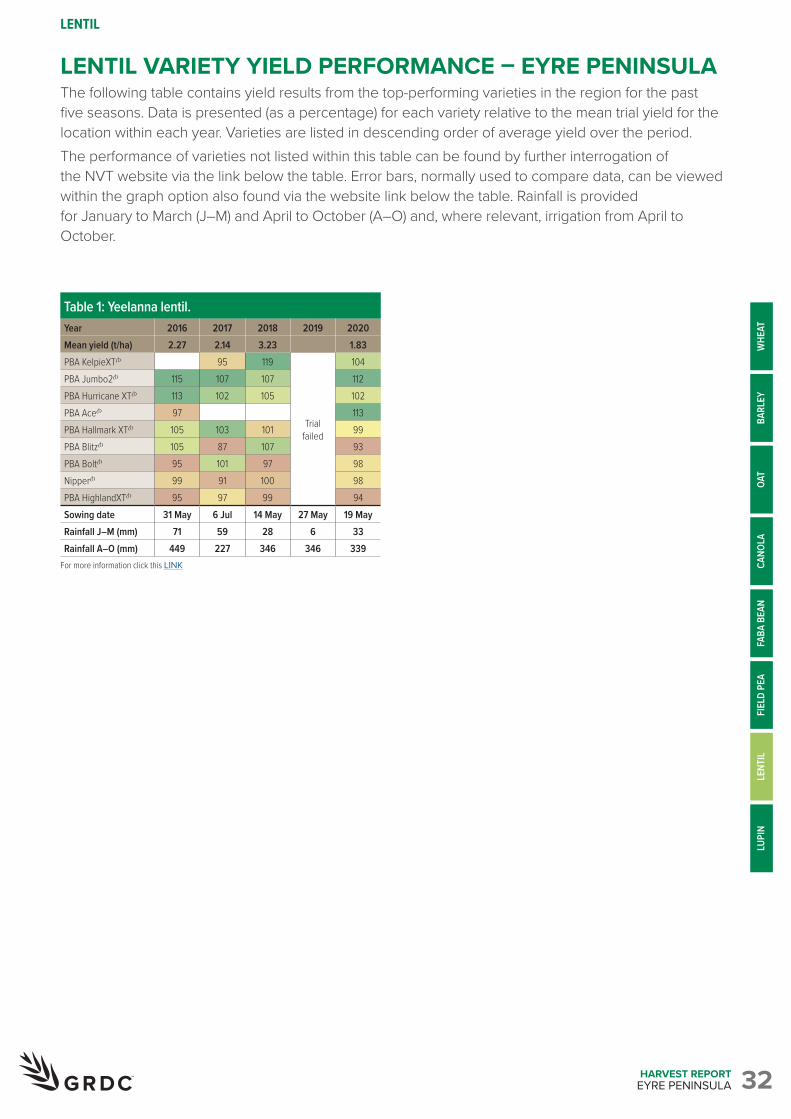
LENTIL VARIETY YIELD PERFORMANCE – EYRE PENINSULAThe following table contains yield results from the top-performing varieties in the region for the past five seasons. Data is presented (as a percentage) for each variety relative to the mean trial yield for the location within each year. Varieties are listed in descending order of average yield over the period. The performance of varieties not listed within this table can be found by further interrogation of the NVT website via the link below the table. Error bars, normally used to compare data, can be viewed within the graph option also found via the website link below the table. Rainfall is provided for January to March (J–M) and April to October (A–O) and, where relevant, irrigation from April to October.
Table 1: Yeelanna lentil.Year 2016 2017 2018 2019 2020Mean yield (t/ha) 2.27 2.14 3.23 1.83PBA KelpieXTA 95 119
Trial failed
104PBA Jumbo2A 115 107 107 112PBA Hurricane XTA 113 102 105 102PBA AceA 97 113PBA Hallmark XTA 105 103 101 99PBA BlitzA 105 87 107 93PBA BoltA 95 101 97 98NipperA 99 91 100 98PBA HighlandXTA 95 97 99 94Sowing date 31 May 6 Jul 14 May 27 May 19 MayRainfall J–M (mm) 71 59 28 6 33Rainfall A–O (mm) 449 227 346 346 339
For more information click this LINK
WHE
ATBA
RLEY
OAT
CANO
LAFI
ELD
PEA
LENT
ILLU
PIN
FABA
BEA
N
33HARVEST REPORTEYRE PENINSULA
LENTIL
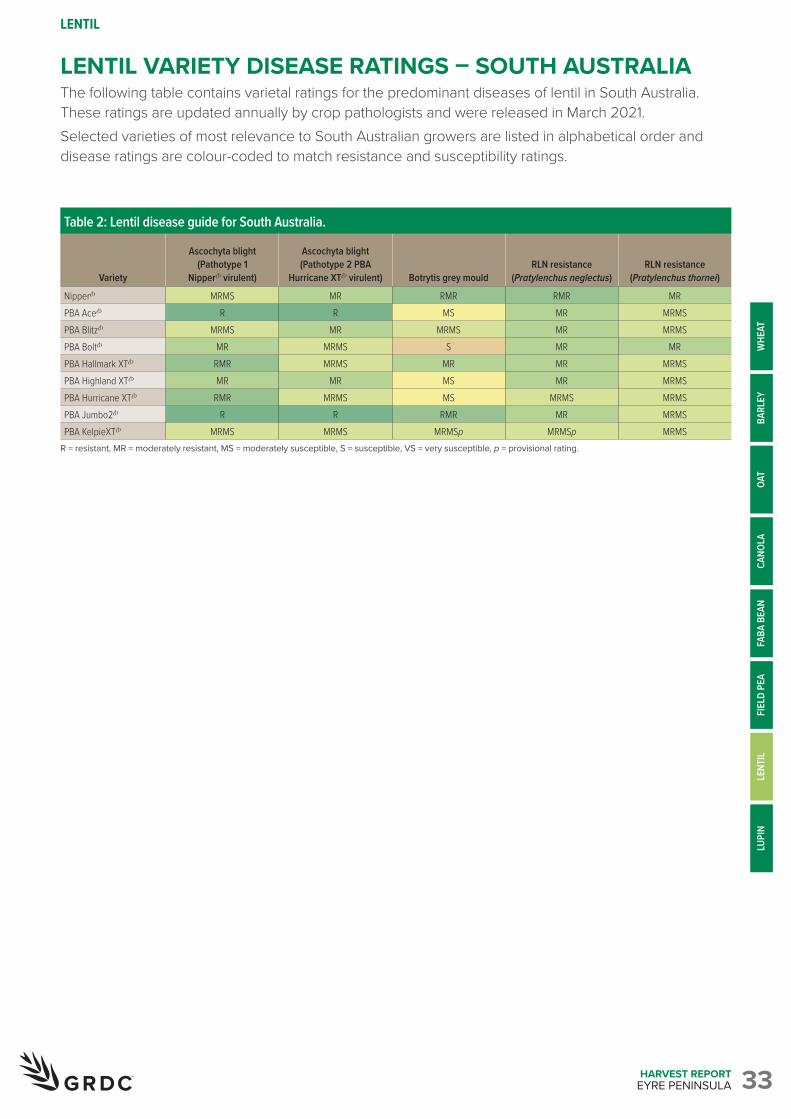
Table 2: Lentil disease guide for South Australia.
Variety
Ascochyta blight (Pathotype 1
NipperA virulent)
Ascochyta blight (Pathotype 2 PBA
Hurricane XTA virulent) Botrytis grey mouldRLN resistance
(Pratylenchus neglectus)RLN resistance
(Pratylenchus thornei)
NipperA MRMS MR RMR RMR MRPBA AceA R R MS MR MRMSPBA BlitzA MRMS MR MRMS MR MRMSPBA BoltA MR MRMS S MR MRPBA Hallmark XTA RMR MRMS MR MR MRMSPBA Highland XTA MR MR MS MR MRMSPBA Hurricane XTA RMR MRMS MS MRMS MRMSPBA Jumbo2A R R RMR MR MRMSPBA KelpieXTA MRMS MRMS MRMSp MRMSp MRMS
R = resistant, MR = moderately resistant, MS = moderately susceptible, S = susceptible, VS = very susceptible, p = provisional rating.
LENTIL VARIETY DISEASE RATINGS – SOUTH AUSTRALIAThe following table contains varietal ratings for the predominant diseases of lentil in South Australia. These ratings are updated annually by crop pathologists and were released in March 2021. Selected varieties of most relevance to South Australian growers are listed in alphabetical order and disease ratings are colour-coded to match resistance and susceptibility ratings.
WHE
ATBA
RLEY
OAT
CANO
LAFI
ELD
PEA
LENT
ILLU
PIN
FABA
BEA
N
34HARVEST REPORTEYRE PENINSULA
LUPIN
Refer to the latest South Australian Crop Sowing Guide for further information at grdc.com.au/NVT-south-australian-crop-sowing-guide
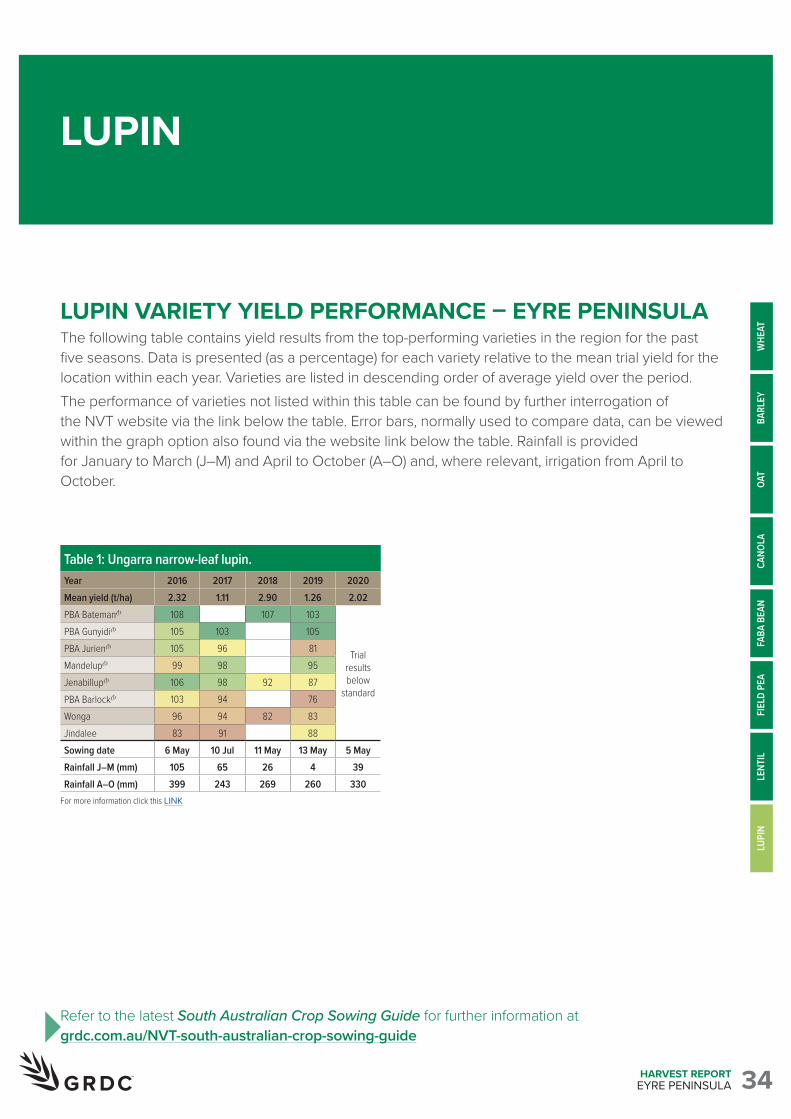
LUPIN VARIETY YIELD PERFORMANCE – EYRE PENINSULAThe following table contains yield results from the top-performing varieties in the region for the past five seasons. Data is presented (as a percentage) for each variety relative to the mean trial yield for the location within each year. Varieties are listed in descending order of average yield over the period. The performance of varieties not listed within this table can be found by further interrogation of the NVT website via the link below the table. Error bars, normally used to compare data, can be viewed within the graph option also found via the website link below the table. Rainfall is provided for January to March (J–M) and April to October (A–O) and, where relevant, irrigation from April to October.
Table 1: Ungarra narrow-leaf lupin.Year 2016 2017 2018 2019 2020Mean yield (t/ha) 2.32 1.11 2.90 1.26 2.02PBA BatemanA 108 107 103
Trial results below
standard
PBA GunyidiA 105 103 105PBA JurienA 105 96 81MandelupA 99 98 95JenabillupA 106 98 92 87PBA BarlockA 103 94 76Wonga 96 94 82 83Jindalee 83 91 88Sowing date 6 May 10 Jul 11 May 13 May 5 MayRainfall J–M (mm) 105 65 26 4 39Rainfall A–O (mm) 399 243 269 260 330
For more information click this LINK
WHE
ATBA
RLEY
OAT
CANO
LAFI
ELD
PEA
LUPI
NFA
BA B
EAN
LENT
IL
35HARVEST REPORTEYRE PENINSULA
LUPIN
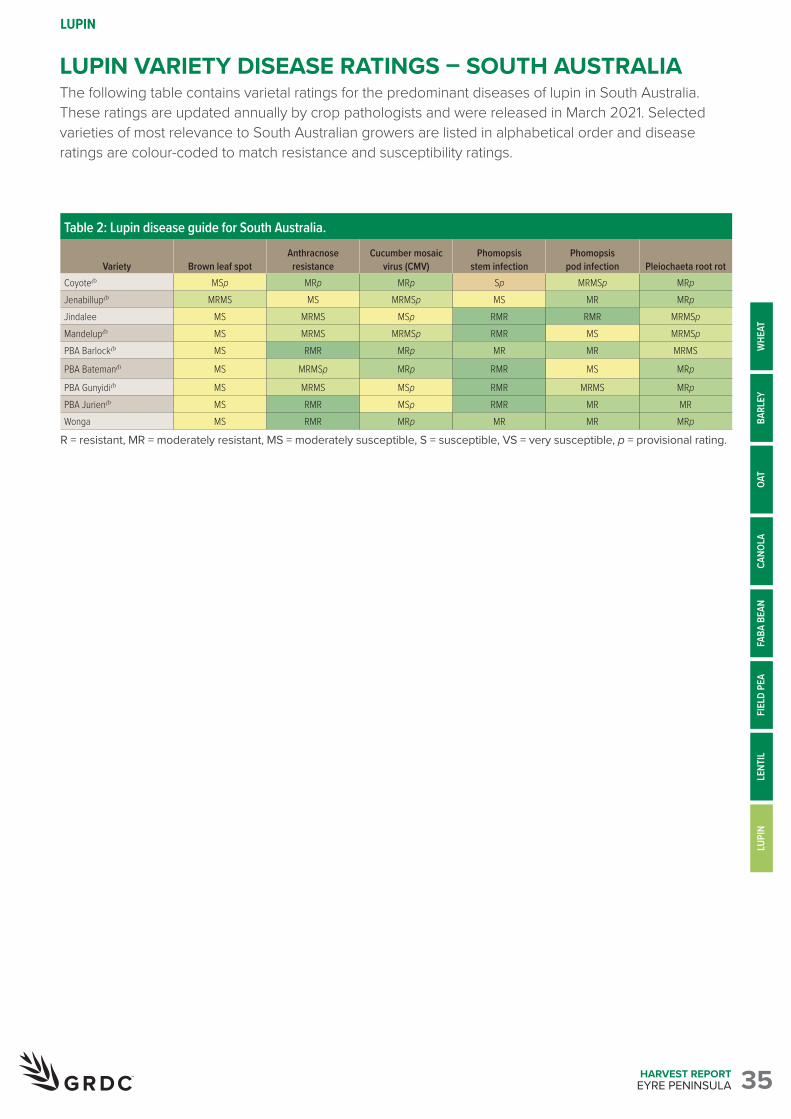
LUPIN VARIETY DISEASE RATINGS – SOUTH AUSTRALIAThe following table contains varietal ratings for the predominant diseases of lupin in South Australia. These ratings are updated annually by crop pathologists and were released in March 2021. Selected varieties of most relevance to South Australian growers are listed in alphabetical order and disease ratings are colour-coded to match resistance and susceptibility ratings.
Table 2: Lupin disease guide for South Australia.
Variety Brown leaf spotAnthracnose
resistanceCucumber mosaic
virus (CMV)Phomopsis
stem infectionPhomopsis
pod infection Pleiochaeta root rotCoyoteA MSp MRp MRp Sp MRMSp MRpJenabillupA MRMS MS MRMSp MS MR MRpJindalee MS MRMS MSp RMR RMR MRMSpMandelupA MS MRMS MRMSp RMR MS MRMSpPBA BarlockA MS RMR MRp MR MR MRMS
PBA BatemanA MS MRMSp MRp RMR MS MRp
PBA GunyidiA MS MRMS MSp RMR MRMS MRpPBA JurienA MS RMR MSp RMR MR MRWonga MS RMR MRp MR MR MRp
R = resistant, MR = moderately resistant, MS = moderately susceptible, S = susceptible, VS = very susceptible, p = provisional rating.
WHE
ATBA
RLEY
OAT
CANO
LAFI
ELD
PEA
LUPI
NFA
BA B
EAN
LENT
IL
P Level 4, 4 National Circuit, Barton ACT 2600 | PO Box 5367, Kingston ACT 2604T 02 6166 4500 F 02 6166 4599 E [email protected]
Disease reporting tool
Long term yield reporter
Trial results
Subscribe to NVT communications to receive Harvest Reports as soon as they are released.
Subscribe nowFollow us on Twitter @NVT_Online
Useful NVT toolsVisit the NVT website @ nvtonline.com.au
Harvest Reports Sowing Guides