Embed Size (px)
Citation preview
1Ho, A. D., Chuang, I., Reich, J., Coleman, C., Whitehill, J., Northcutt, C., Williams, J. J., Hansen, J., Lopez, G., & Petersen, R. (2015). HarvardX and MITx: Two years of open online courses (HarvardX Working Paper No. 10). doi:10.2139/ssrn.2586847
Inside Executive Summary
Trends and patterns in demographics and outcomes
Replicating and extending survey research on intention; teachers-as-learners
Visualizing the HarvardX and MITx course network
Differences across curricular content areas
“Top 5s”: Different ways of looking at open online courses
Preliminary results for those who pay for verified certificates
Conclusions
Appendices
References
HarvardX and MITx: Two Years of
Open Online Courses Fall 2012-Summer 2014
March 30, 2015
This report is the result of a collaboration between the HarvardX Research Committee
at Harvard University and the Office of Digital Learning at MIT.1
2
Abstract
What happens when well-known universities offer online courses, assessments, and certificates of completion for free? Early descriptions of Massive Open Online Courses (MOOCs) have emphasized large enrollments, low certification rates, and highly educated registrants. We use data from two years and 68 open online courses offered on edX by Harvard University (via HarvardX) and MIT (via MITx) to broaden the scope of answers to this question. We describe trends over this two-year span, depict participant intent using comprehensive survey instruments, and chart course participation pathways using network analysis. We find that overall participation in our MOOCs remains substantial and that the average growth has been steady. We explore how diverse audiences—including explorers, teachers-as-learners, and residential students—provide opportunities to advance the principles on which HarvardX and MITx were founded: access, research, and residential education.
Executive Summary
On January 21, 2014, a joint research team from Harvard University and MIT released a series of reports describing the first year of open online courses launched on edX, a non-profit learning platform founded by the two institutions in 2012. These reports (e.g., Ho et al., 2014; Reich et al., 2014; Seaton et al., 2014) documented the backgrounds and behaviors of course registrants and highlighted pedagogical and technological innovations that serve as resources for online, residential, and blended teaching. In this “Year 2” report, we revisit these earlier findings with the benefit of an additional year of data, resulting in one of the largest surveys of massive open online courses (MOOCs) to date: 68 courses, 1.7 million participants, 10 million participant-hours, and 1.1 billion logged events. In this introduction, we review findings, highlight opportunities, and then introduce a six-part structure for the full report.
Key Findings Finding 1: Growth is steady in overall and multiple-course participation in HarvardX and MITx
Participation in HarvardX and MITx courses has grown at a steady rate through the first two years. From the first registrations on July 24, 2012, through the close of our analytic window on September 21, 2014—a total of 790 days—an average of 1,300 unique participants entered a HarvardX or MITx course every day, for a total of 1.03 million unique participants. We distinguish between unique participants and course entries, where a unique participant may enter into multiple courses. The 1.03 million unique participants account for 1.71 million course entries. On average, a unique participant has entered into 1.7 HarvardX and MITx courses. Across all courses, cumulative enrollment has grown at a steady rate of 2,200 participants a day.
3
Key Terms and Definitions Seemingly familiar concepts like “course” and “student” must be clarified in discussions
about Massive Open Online Courses. Here are the definitions that we use in this report.
Course – Any listing that allows for registration on the edX platform. Version – An administration or re-administration of a particular course. Chapter – An organizing heading within edX courses. Clicking on a chapter leads to a particular section of course content. Registrant – Any account registration for any course. Participant or Entry – Any registrant that has accessed course content in any chapter. We do not count registrants who do not access course content, excluding 1.3 million registrations. Enrollment – The number of participants who have ever entered a course, up through the analytic end date of September 21, 2014. Unique Participant – Course entries from a unique user account—a unique participant may have participated in multiple courses. Explorer – A participant who accesses half or more of the chapters in a course. Logged Event – A participant “click” that is recorded in the edX servers and associated with a particular resource (forums, assessments, videos, etc.). ID Verified Certificate/Honor Code Certificate – An ID verified certificate shows that a participant has successfully completed an edX course and verifies his/her identity through a photo ID. Verified certificates are available for a fee that varies by course. An Honor Code Certificate of Achievement certifies that the participant has successfully completed a course, but it does not verify the participant’s identity. Honor Code certificates are currently offered at no charge.
4
Finding 2: Participation initially declines in repeated courses, then stabilizes
Across 11 courses with repeated versions, participation declined by an average of 43% from the first to the second version. For the five courses that had a third version, participation was essentially unchanged from the second to the third version. However, there is no universal law of declining enrollment. One computer science course, CS50x, doubled in size from the first to the second version, in part because the course administration window doubled in length and supported asynchronous participation and certification.
Finding 3: Surveys suggest that a slight majority intends to certify. Many are teachers.
We extend past results from Reich et al. (2014) and Seaton et al. (2015) about the intentions and teaching backgrounds of participants. Among the one-third of participants who responded to a comprehensive survey about intention, 57% stated their intent to earn a certificate, and 24% of these respondents earned certificates. Among the remaining 43% who were unsure or did not intend to earn a certificate, 8% ultimately did. Stated intentions, however, are varied and an imperfect predictor of ultimate outcomes. Among the one-fifth of participants who responded to survey questions about their professional experience as teachers or instructors, 39% identified as a past or present teacher, and 21% of these teachers reported teaching in the topic area of the course in which they were participating. These survey results reflect the diversity of possible, desired uses of open online courses beyond certification.
Finding 4: Participation and certification differ by curricular area.
HarvardX and MITx courses cover a wide range of curricular areas. To summarize curricular differences, we divide courses roughly into four categories, (1) Computer Science (CS); (2) Science, Technology, Engineering, and Mathematics (STEM); (3) Humanities, History, Religion, Design, and Education (HHRDE); and (4) Government, and Health and Social Sciences (GHSS). The CS courses had average participation numbers almost four times higher than that of other course categories, near 68,000 vs. 19,000 for other curricular areas. The CS and STEM courses had average certification rates that were about half that of HHRDE and GHSS courses, 7% and 6% vs. 14% and 11%, respectively.
Finding 5: Course networks reveal the centrality of large CS courses and the potential of sequenced modules.
Over 300,000 unique participants have participated in more than one HarvardX and/or MITx course, representing almost a million course entries. We create a course network using patterns of sequential registrations by unique participants. The CS courses are predictably central and serve as hubs to and from not only other CS courses but courses in other curricular areas. The network raises the possibility of more intentional routings of students along course pathways. A sequence of Chinese History courses (ChinaX) is particularly salient and well explained by the intentional modularization of the year-long course into a progressive sequence.
5
Finding 6: Certification rates are high among those who pay $25-$250 to “ID-verify” their certificates.
We review preliminary demographic and outcome data for participants who pay to “ID-verify” their certificates. They are slightly older, more educated, more domestic, and less often female than non-verifying participants in the same course. They certify at a substantially higher rate, 59% for verified students compared to 5% for non-verified students, on average, across 12 courses.
Opportunities and Next Steps
1: Identify course-level and institutional priorities for increased access.
A founding principle of HarvardX and MITx is the desire to increase access to a high-quality education. Releasing open online content is only one step toward fulfilling that promise. The demographic counts and distributions that we offer here can inform goal-setting and offer a baseline for progress. From this baseline, there is an opportunity to increase the number of participants and certificate-earners from underrepresented and underserved groups. These groups and goals may differ by the subject matter area and the level of difficulty of the course; for example, there is no over-representation of college graduates in a graduate-level statistics course. However, there is an opportunity for common themes among course objectives: not only increasing access but increasing equitable access to high-quality online learning opportunities.
2: Increase and formalize the flow of pedagogical innovations to and from residential courses.
The flow of resources and innovations between residential and online courses has been considerable at HarvardX and MITx. Instant-feedback assessment scoring, video annotation tools, online office hours, and high-quality videos have served both online and residential students (e.g., Malan, 2013; Rayyan & Belcher, 2014). Many examples of these feedback loops were reviewed in the HarvardX and MITx Year 1 reports (e.g., Reich et al., 2014; Seaton et al., 2014). We describe others at the conclusion of this report.
Beyond Cambridge, Massachusetts, we also have evidence of the potential and desire of instructors to incorporate HarvardX and MITx content into their own teaching. Yale is adopting a Harvard computer science course, CS50, for its own students. The evidence of large numbers of teacher participants in our data is consistent with many anecdotes passed on from HarvardX and MITx instructors of individual teachers using pieces of HarvardX and MITx content in their own classrooms. There is an opportunity to make the “secondary” use of open online course resources by teachers a primary goal. The goal of certification of individuals may eventually seem short-sighted compared to the goal of disseminating course tools, pedagogical innovations, and teaching modules for the enhancement of residential courses at Harvard, at MIT, and beyond.
6
3: Focus research on target populations.
Another founding principle of HarvardX and MITx is a commitment to advance research on learning. Through an ongoing collaboration, the two institutions have developed a common research infrastructure, including a robust survey architecture, course dashboards for researcher and instructor teams, and well-documented participant-level and logged-event-level datasets. This infrastructure has enabled reports like these, a growing number of studies and experiments from researchers across the schools and departments of Harvard and MIT, as well many of the references that we include in this report. HarvardX and MITx research units are also following the recipe for advancing MOOC research recommended by Reich (2015): improving assessments, conducting experiments, and sharing data.
Much research to date has consisted of descriptive reports of participants in open online environments, with the goal of understanding and improving these environments. The considerable heterogeneity that we find in participant intentions and backgrounds raises a challenge for evaluation. Certification may be consequential and desired for some but unnecessary and irrelevant for others. An online course that certifies few participants may bring considerable benefits to teachers or residential students. Our findings suggest opportunities to prioritize particular goals for particular populations, for example, teacher usage of modules, or certificate acquisition by underrepresented students. With open access comes a disparate audience with disparate goals. Our existing research has now described this well. From this baseline, advancing research on learning can proceed by focusing research strategically, to better understand the most promising mechanisms through which open online courses can advance learning.
Structure of the Report
This report contains six sections that build upon the growing research base on open online courses. The first two sections are direct replications and extensions of recent research findings. The first section reviews participant trends in demographics and usage, referencing our “Year 1” report (Ho et al., 2014). The second section presents data from a systematic survey effort that we began in our second year. We extend results from two papers, one which describes diversity in stated reasons for course enrollment and what these motivations can predict for ultimate actions (Reich, 2014), and one which describes substantial proportional representation by teachers (Seaton et al. 2015).
The remaining four sections introduce new findings. In the third section, we use data from the growing proportion of users who enroll in multiple courses. We show emergent course pathways through the curriculum represented by the joint courses of HarvardX and MITx. Repeated administrations of courses reveal that second runs of courses tend to halve in enrollment before stabilizing in their third run. In the fourth section, we describe differences in enrollments, demographics, and certification across four broad curricular content areas. In the fifth section,
7
we highlight the diversity of courses by displaying the “Top 5” courses along various relevant metrics. Finally, in the sixth section, we review preliminary outcomes for participants who invest in “ID Verified” certificates and discuss the implications for the interpretation of certification rates for participants with no financial commitment.
Section 1: Trends and Patterns in MOOC Demographics and Outcomes
A major contribution of this report is results from extensive surveys of open online course participants. In the first years of MOOC research, findings were often reported from surveys with low response rates: Breslow et al. (2013) reported data from 7,161 survey responders out of 154,763 registered in the first edX MOOC, capturing a snapshot comprised mostly of certificate earners of a single course at the dawn of the MOOC era. Christensen et al. (2013) described results from 34,779 survey respondents from University of Pennsylvania MOOCs, a sample that comprised 8.5% of their target sample of video watchers and 4.3% of all registrants.
We use a required edX survey that results in a 95% response rate, supplemented with a series of individual course surveys with response rates between 20% and 50%. We use these findings to refine our understanding of the demographics, intentions, motivations, and backgrounds of HarvardX and MITx participants. In particular, we extend the argument from Ho et al. (2014) that the characterization of MOOC participants as a group of college-educated men in their late 20s misrepresents substantial variation, especially across different kinds of courses.
Methods and Definitions
Our retrospective statistics for Year 1 differ from the Year 1 statistics reported by Ho et al. (2014) for two reasons, both of which highlight the special considerations required when interpreting data from open online courses. First, we exclude non-entrants, those registrants who never “click into” the course. There have been 1.3 million non-entrants over the first two years of HarvardX and MITx, and the percentage has risen from 37% to 47% of total registrations from Year 1 to Year 2. This increase is explained in part by lengthening registration periods prior to course launch, which correlate strongly with proportions of non-entrants. Many non-entrants also seem to use registration to “bookmark” courses for possible future use, without which they may lose access to course materials after the courses close registration. We elect to focus on demographics and outcomes for registrants who are actually exposed to the course content, thus we exclude these 1.3 million non-entrants from our dataset. We call registrants who click into courses, “participants,” and we focus on them for the remainder of this report.
Second, many courses, including those from our Year 1 report, remained open even after they had technically ended. Registrants had access to the course, but certification was not possible. Participants continued to enter courses, decreasing certification rates by definition but increasing the possible impact of courses through open access. DeBoer et al. (2014) have argued
8
that open enrollment and asynchronous access forces researchers to be clear about their definitions of “enrollment” and “completion.” We choose to include the demographics and activity of these students to capture the multiple mechanisms through which these courses may have an effect. We reanalyze both Year 1 and Year 2 courses using these definitions, and we estimate trends along these common metrics.
A final sampling consideration is our decision to exclude two courses from our Year 2 dataset, and, for certain analyses, four additional courses. The two excluded courses run on a separate platform that allows direct registration, bypassing edX data collection and surveys. Of the four courses that we exclude for selected analyses, three do not offer certificates, and one does not offer certificates completely within the data collection window that we chose to close on September 21, 2014. We exclude these four courses whenever we describe certification-based outcomes.
Following the definitions established in the Year 1 Report (Ho et al., 2014), a registrant can be a participant in multiple courses, and a unique participant who enters into two courses counts as two participants. This weights participant demographics by the courses in which they participate, to better describe trends in usage and activity over time. The number of unique participants is 1.03 million. Our final sample contains 1.71 million participants across the 68 courses from the fall of 2012 through the summer of 2014. In this section, we focus on the 1.47 million course participants from the 64 certificate-granting courses.
We gather education, gender, and age data from required self-reported surveys at the time of registration in edX. Although some participants leave these blank, response rates are high at around 95%. Age is based on reported year of birth and referenced to participant age in 2014, our second year of data. We estimate participant location through geolocation of the modal IP address, and we distinguish between US-based and international participants.
Courses grant certificates when average weighted course grades exceed a percentage-based cutoff. We call these participants “certified.” Following Ho et al. (2014), participants have “explored” a course when they have accessed half or more of course “chapters.” Course exploration is almost always required for certification (98% of certificate-earners have explored the course). In contrast, many students explore the course without earning certificates (44% of explorers have earned certificates). Many alternate definitions of exploration are certainly reasonable (e.g., Kizilcec et al., 2013), including those based on time and clicks, however DeBoer et al. (2014) show these tend to variables tend to correlate strongly, and we find that alternate definitions do not change substantive conclusions.
Results
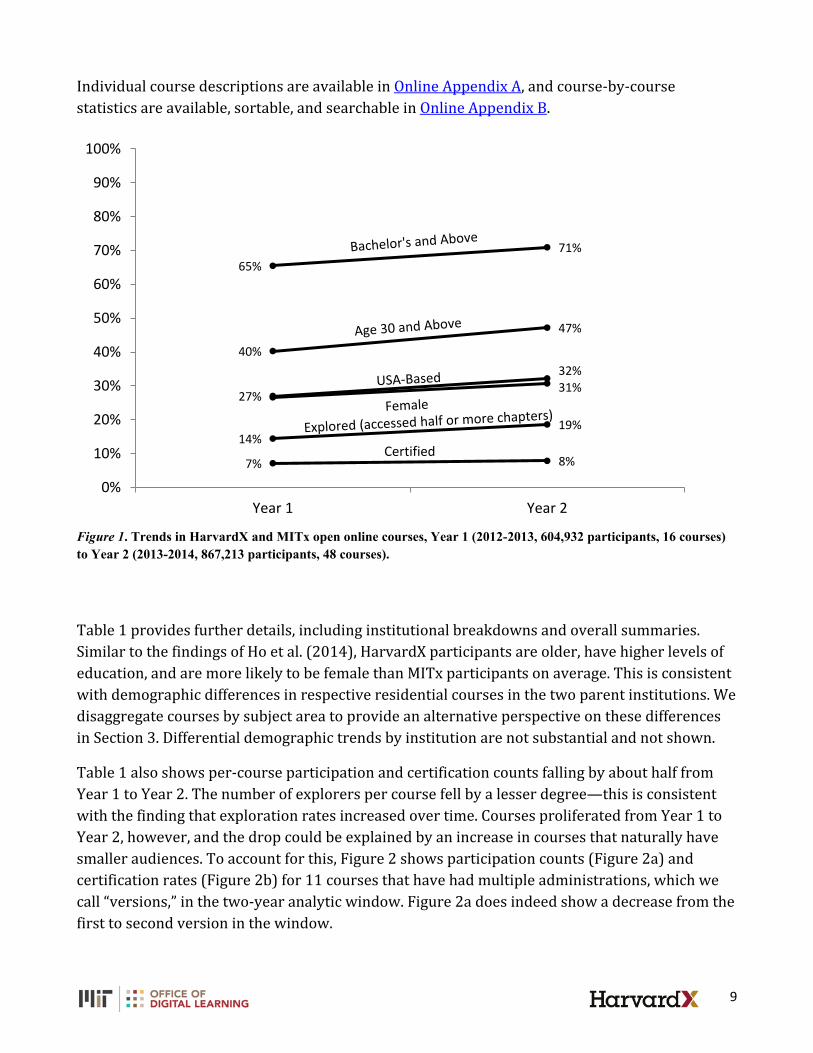
Figure 1 shows overall trends from year one to year two across 64 certificate-granting courses. There are moderate increases in education, age, US-based participation, and female participation. There is also a moderate increase in the percentage of explorers who access half or more of course chapters, from 14% to 19%. The certification rate increases slightly from 7% to 8%.
9
Individual course descriptions are available in Online Appendix A, and course-by-course statistics are available, sortable, and searchable in Online Appendix B.
Figure 1. Trends in HarvardX and MITx open online courses, Year 1 (2012-2013, 604,932 participants, 16 courses) to Year 2 (2013-2014, 867,213 participants, 48 courses).
Table 1 provides further details, including institutional breakdowns and overall summaries. Similar to the findings of Ho et al. (2014), HarvardX participants are older, have higher levels of education, and are more likely to be female than MITx participants on average. This is consistent with demographic differences in respective residential courses in the two parent institutions. We disaggregate courses by subject area to provide an alternative perspective on these differences in Section 3. Differential demographic trends by institution are not substantial and not shown.
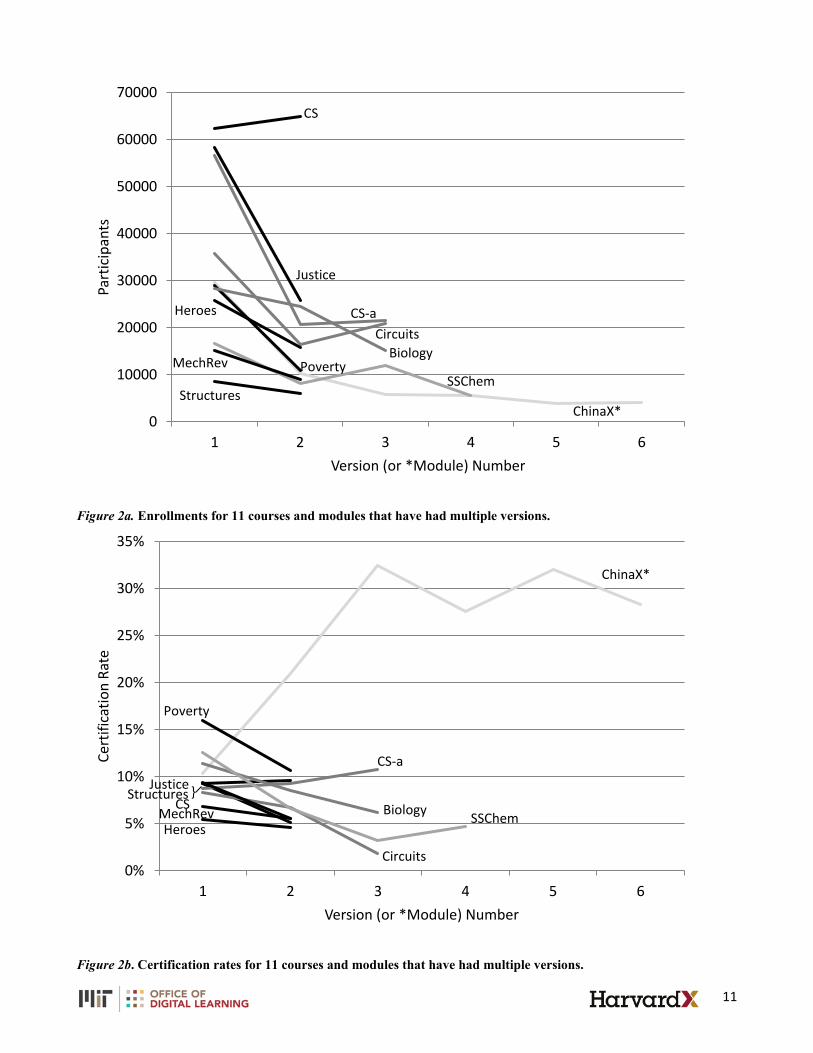
Table 1 also shows per-course participation and certification counts falling by about half from Year 1 to Year 2. The number of explorers per course fell by a lesser degree—this is consistent with the finding that exploration rates increased over time. Courses proliferated from Year 1 to Year 2, however, and the drop could be explained by an increase in courses that naturally have smaller audiences. To account for this, Figure 2 shows participation counts (Figure 2a) and certification rates (Figure 2b) for 11 courses that have had multiple administrations, which we call “versions,” in the two-year analytic window. Figure 2a does indeed show a decrease from the first to second version in the window.
65% 71%
40%
47%
27%
32% 31%
14% 19%
7% 8%
0%
10%
20%
30%
40%
50%
60%
70%
80%
90%
100%
Year 1 Year 2
Certified
10
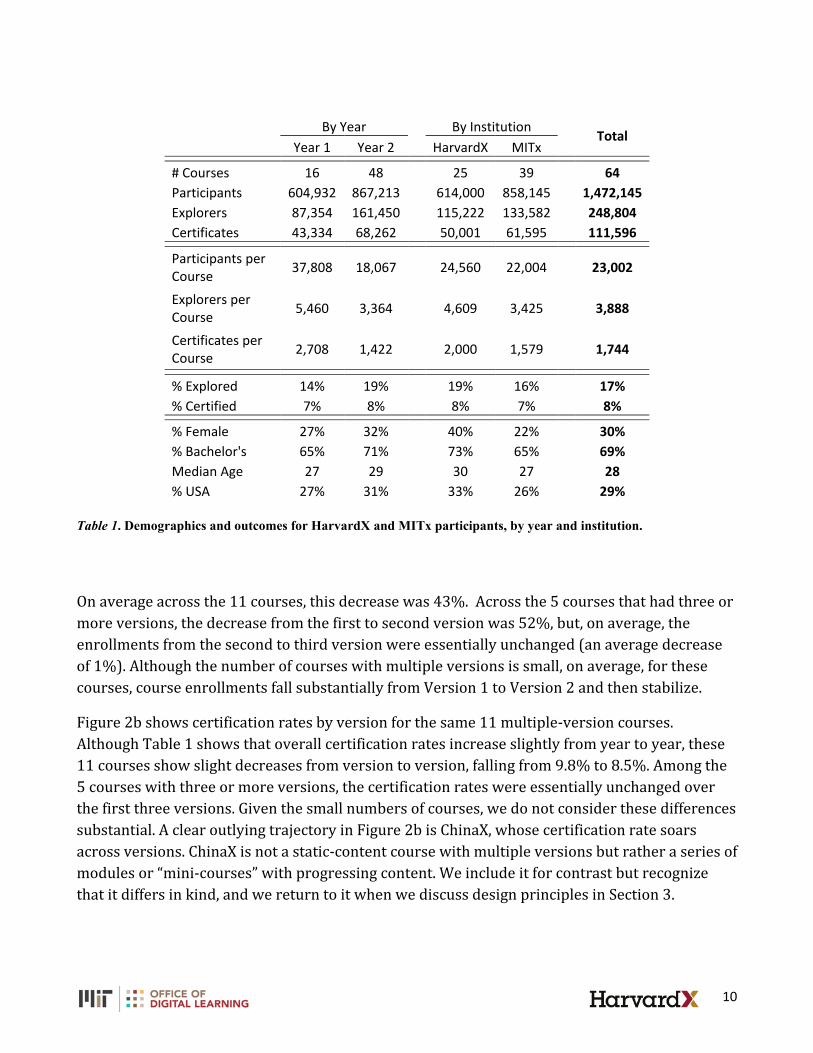
By Year By Institution Total Year 1 Year 2 HarvardX MITx # Courses 16 48 25 39 64 Participants 604,932 867,213 614,000 858,145 1,472,145 Explorers 87,354 161,450 115,222 133,582 248,804 Certificates 43,334 68,262 50,001 61,595 111,596 Participants per Course 37,808 18,067 24,560 22,004 23,002
Explorers per Course 5,460 3,364 4,609 3,425 3,888
Certificates per Course 2,708 1,422 2,000 1,579 1,744
% Explored 14% 19% 19% 16% 17% % Certified 7% 8% 8% 7% 8% % Female 27% 32% 40% 22% 30% % Bachelor's 65% 71% 73% 65% 69% Median Age 27 29 30 27 28 % USA 27% 31% 33% 26% 29%
Table 1. Demographics and outcomes for HarvardX and MITx participants, by year and institution.
On average across the 11 courses, this decrease was 43%. Across the 5 courses that had three or more versions, the decrease from the first to second version was 52%, but, on average, the enrollments from the second to third version were essentially unchanged (an average decrease of 1%). Although the number of courses with multiple versions is small, on average, for these courses, course enrollments fall substantially from Version 1 to Version 2 and then stabilize.
Figure 2b shows certification rates by version for the same 11 multiple-version courses. Although Table 1 shows that overall certification rates increase slightly from year to year, these 11 courses show slight decreases from version to version, falling from 9.8% to 8.5%. Among the 5 courses with three or more versions, the certification rates were essentially unchanged over the first three versions. Given the small numbers of courses, we do not consider these differences substantial. A clear outlying trajectory in Figure 2b is ChinaX, whose certification rate soars across versions. ChinaX is not a static-content course with multiple versions but rather a series of modules or “mini-courses” with progressing content. We include it for contrast but recognize that it differs in kind, and we return to it when we discuss design principles in Section 3.
11
Figure 2a. Enrollments for 11 courses and modules that have had multiple versions.
Figure 2b. Certification rates for 11 courses and modules that have had multiple versions.
0
10000
20000
30000
40000
50000
60000
70000
1 2 3 4 5 6
Part
icip
ants
Version (or *Module) Number
CS
Justice
CS-a Circuits
Biology
SSChem
ChinaX* Structures
MechRev
Heroes
Poverty
0%
5%
10%
15%
20%
25%
30%
35%
1 2 3 4 5 6
Cert
ifica
tion
Rate
Version (or *Module) Number
CS Structures
Justice CS-a
Circuits
Biology SSChem
ChinaX*
MechRev Heroes
Poverty
}
12
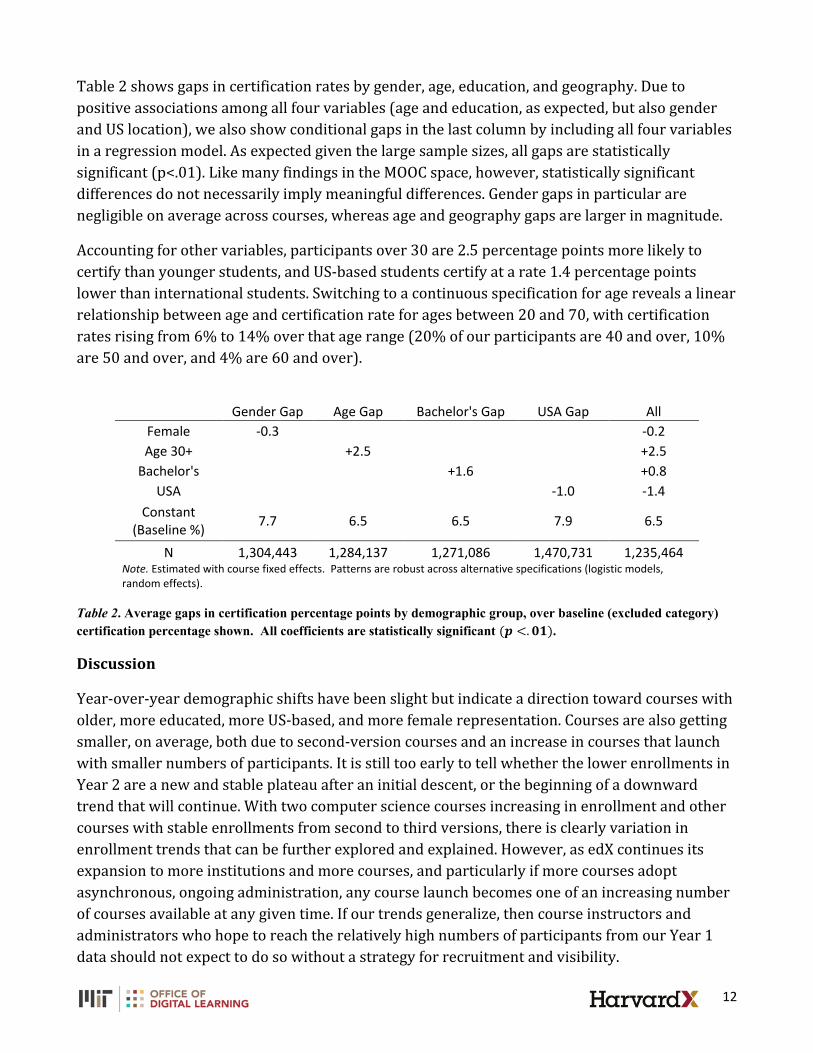
Table 2 shows gaps in certification rates by gender, age, education, and geography. Due to positive associations among all four variables (age and education, as expected, but also gender and US location), we also show conditional gaps in the last column by including all four variables in a regression model. As expected given the large sample sizes, all gaps are statistically significant (p<.01). Like many findings in the MOOC space, however, statistically significant differences do not necessarily imply meaningful differences. Gender gaps in particular are negligible on average across courses, whereas age and geography gaps are larger in magnitude.
Accounting for other variables, participants over 30 are 2.5 percentage points more likely to certify than younger students, and US-based students certify at a rate 1.4 percentage points lower than international students. Switching to a continuous specification for age reveals a linear relationship between age and certification rate for ages between 20 and 70, with certification rates rising from 6% to 14% over that age range (20% of our participants are 40 and over, 10% are 50 and over, and 4% are 60 and over).
Gender Gap Age Gap Bachelor's Gap USA Gap All
Female -0.3 -0.2 Age 30+ +2.5 +2.5
Bachelor's +1.6 +0.8 USA -1.0 -1.4
Constant (Baseline %) 7.7 6.5 6.5 7.9 6.5
N 1,304,443 1,284,137 1,271,086 1,470,731 1,235,464 Note. Estimated with course fixed effects. Patterns are robust across alternative specifications (logistic models, random effects).
Table 2. Average gaps in certification percentage points by demographic group, over baseline (excluded category) certification percentage shown. All coefficients are statistically significant ( <.).
Discussion
Year-over-year demographic shifts have been slight but indicate a direction toward courses with older, more educated, more US-based, and more female representation. Courses are also getting smaller, on average, both due to second-version courses and an increase in courses that launch with smaller numbers of participants. It is still too early to tell whether the lower enrollments in Year 2 are a new and stable plateau after an initial descent, or the beginning of a downward trend that will continue. With two computer science courses increasing in enrollment and other courses with stable enrollments from second to third versions, there is clearly variation in enrollment trends that can be further explored and explained. However, as edX continues its expansion to more institutions and more courses, and particularly if more courses adopt asynchronous, ongoing administration, any course launch becomes one of an increasing number of courses available at any given time. If our trends generalize, then course instructors and administrators who hope to reach the relatively high numbers of participants from our Year 1 data should not expect to do so without a strategy for recruitment and visibility.
13
Section 2: Replicating and Extending Emerging Survey Research
In Section 1, we described trends in the demographics and activity of participants in HarvardX and MITx courses. These descriptions are far richer and more robust, in the sense of high response rates, than other descriptions of MOOC participants that we know. However, we know strikingly little about other variables of interest, particularly one variable that we expect to vary in open-access courses more than in conventional postsecondary courses: intention. As many have argued (DeBoer et al., 2014; Ho et al., 2014; Koller et al., 2013; Reich & Ho, 2014), it makes little sense to evaluate MOOCs on a criterion like a certification rate if MOOC participants are uninterested in certification.
Unfortunately, standardized surveys of certification intention are rare across MOOCs, leaving previous studies (DeBoer et al., 2014; Ho et al., 2014; Koller et al., 2013) to infer intention from action. This dabbles in circular reasoning: every participant did what they did because they intended to. To improve understanding of participant intention, HarvardX and MITx developed a survey with common questions across courses. Responses were solicited from registrants via email and embedded prompts in the courseware, beginning in the second year of courses. Response rates for the two questions we discuss in this section are 33% and 21%, substantially lower than the 95% response rates for demographic questions in the previous section but substantially higher than the response rates of other previous studies (e.g., Breslow et al., 2013; Christensen et al., 2014).
In a key paper, Reich (2014) used responses from this standardized survey of intention to describe outcomes from nine HarvardX courses. He finds that the majority (56%) of respondents expresses intention to earn a certificate, and 20% of these respondents ultimately end up earning a certificate, versus 8% of all participants. He also observes that smaller but substantial percentages of those who state that they are unsure, browsing, or auditing the course nonetheless earn certificates (7%, 4%, and 5%, respectively). Here, we replicate and extend his study across 35 courses, 20 from HarvardX and 15 from MITx. We describe the strength of stated intention in the prediction of certification, and we discuss the implications of using outcomes conditional on stated intention as an evaluative metric for MOOCs.
In another key paper, Seaton et al. (2015) described a surprising result from MITx surveys, where 28% of survey responders from 11 MITx courses identified as past or current teachers, and 6% identified as teachers of the topic of the course itself. Self-identifying teachers also contributed a disproportionate percentage of forum comments. They argue that this evidence suggests mechanisms for MOOC impact that are underappreciated. Instructors of MOOCs may, by accident or by design, provide teachers with course materials and learning opportunities that in turn have a positive impact on these teachers’ students. And MOOCs may give teachers an online forum to congregate and teach both each other and other participants through forum discussions. As with the Reich (2014) paper, we replicate and extend this study across 21 courses, six from HarvardX and 15 from MITx, and discuss implications.
14
Intention
The survey design was described in depth by Reich (2014) and Seaton et al. (2015). We review the results for the intent and teacher items in turn. The survey item for intent follows:
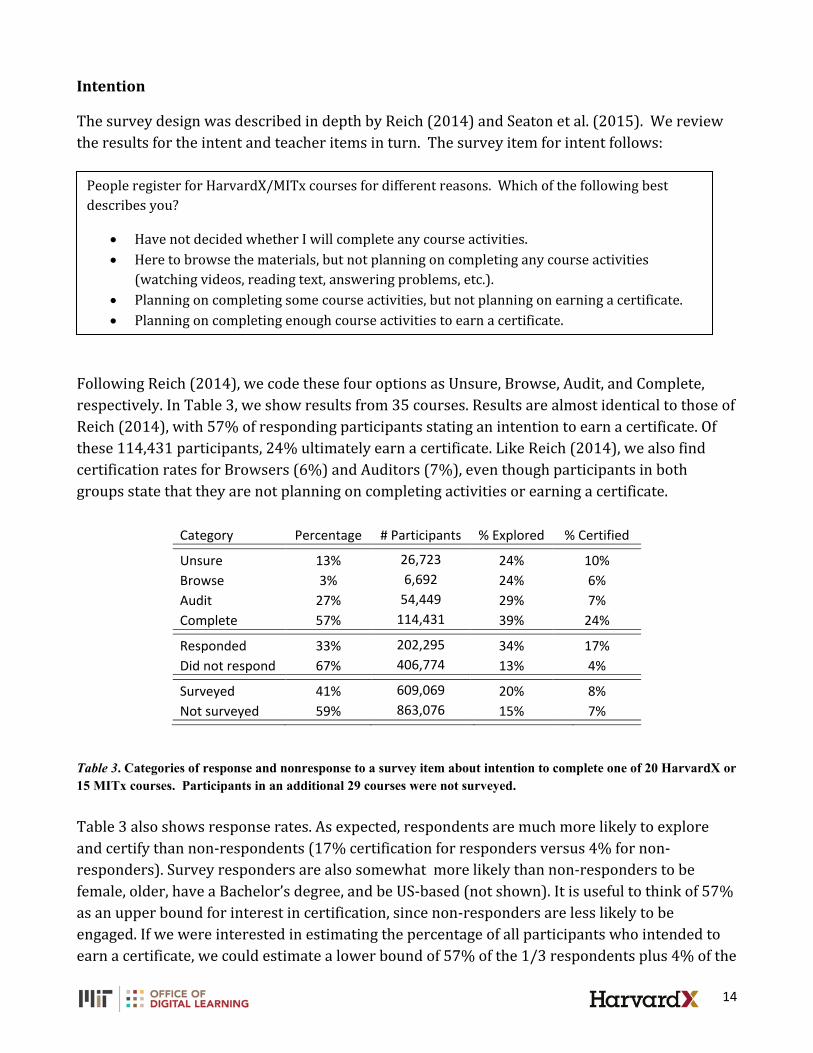
Following Reich (2014), we code these four options as Unsure, Browse, Audit, and Complete, respectively. In Table 3, we show results from 35 courses. Results are almost identical to those of Reich (2014), with 57% of responding participants stating an intention to earn a certificate. Of these 114,431 participants, 24% ultimately earn a certificate. Like Reich (2014), we also find certification rates for Browsers (6%) and Auditors (7%), even though participants in both groups state that they are not planning on completing activities or earning a certificate.
Category Percentage # Participants % Explored % Certified Unsure 13% 26,723 24% 10% Browse 3% 6,692 24% 6% Audit 27% 54,449 29% 7% Complete 57% 114,431 39% 24% Responded 33% 202,295 34% 17% Did not respond 67% 406,774 13% 4% Surveyed 41% 609,069 20% 8% Not surveyed 59% 863,076 15% 7%
Table 3. Categories of response and nonresponse to a survey item about intention to complete one of 20 HarvardX or 15 MITx courses. Participants in an additional 29 courses were not surveyed. Table 3 also shows response rates. As expected, respondents are much more likely to explore and certify than non-respondents (17% certification for responders versus 4% for non-responders). Survey responders are also somewhat more likely than non-responders to be female, older, have a Bachelor’s degree, and be US-based (not shown). It is useful to think of 57% as an upper bound for interest in certification, since non-responders are less likely to be engaged. If we were interested in estimating the percentage of all participants who intended to earn a certificate, we could estimate a lower bound of 57% of the 1/3 respondents plus 4% of the
People register for HarvardX/MITx courses for different reasons. Which of the following best describes you?
x Have not decided whether I will complete any course activities. x Here to browse the materials, but not planning on completing any course activities
(watching videos, reading text, answering problems, etc.). x Planning on completing some course activities, but not planning on earning a certificate. x Planning on completing enough course activities to earn a certificate.
15
2/3 non-respondents who actually earned a certificate, resulting in 19%. Taking 57% as an upper bound, assuming perfect generalization from respondents to non-respondents, we can approximate that 19%-57% of participants plan on earning a certificate.
Teaching Teachers
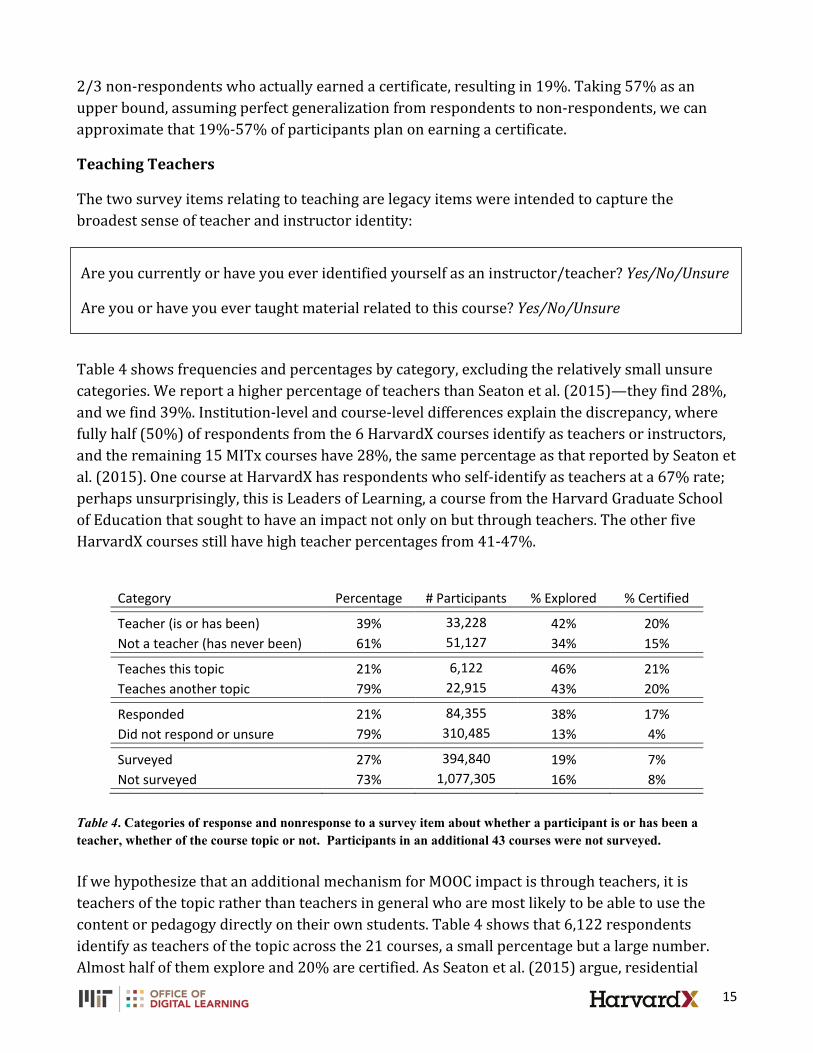
The two survey items relating to teaching are legacy items were intended to capture the broadest sense of teacher and instructor identity:
Table 4 shows frequencies and percentages by category, excluding the relatively small unsure categories. We report a higher percentage of teachers than Seaton et al. (2015)—they find 28%, and we find 39%. Institution-level and course-level differences explain the discrepancy, where fully half (50%) of respondents from the 6 HarvardX courses identify as teachers or instructors, and the remaining 15 MITx courses have 28%, the same percentage as that reported by Seaton et al. (2015). One course at HarvardX has respondents who self-identify as teachers at a 67% rate; perhaps unsurprisingly, this is Leaders of Learning, a course from the Harvard Graduate School of Education that sought to have an impact not only on but through teachers. The other five HarvardX courses still have high teacher percentages from 41-47%.
Category Percentage # Participants % Explored % Certified Teacher (is or has been) 39% 33,228 42% 20% Not a teacher (has never been) 61% 51,127 34% 15% Teaches this topic 21% 6,122 46% 21% Teaches another topic 79% 22,915 43% 20% Responded 21% 84,355 38% 17% Did not respond or unsure 79% 310,485 13% 4% Surveyed 27% 394,840 19% 7% Not surveyed 73% 1,077,305 16% 8%
Table 4. Categories of response and nonresponse to a survey item about whether a participant is or has been a teacher, whether of the course topic or not. Participants in an additional 43 courses were not surveyed. If we hypothesize that an additional mechanism for MOOC impact is through teachers, it is teachers of the topic rather than teachers in general who are most likely to be able to use the content or pedagogy directly on their own students. Table 4 shows that 6,122 respondents identify as teachers of the topic across the 21 courses, a small percentage but a large number. Almost half of them explore and 20% are certified. As Seaton et al. (2015) argue, residential
Are you currently or have you ever identified yourself as an instructor/teacher? Yes/No/Unsure
Are you or have you ever taught material related to this course? Yes/No/Unsure
16
college courses are less likely than MOOCs to attract teachers of the topic, as the cost, time commitments, and geographical and temporal constraints are likely to be burdensome. In contrast, most MOOCs offer nonbinding exploration and use of content that may be repurposed for a teacher’s own classroom. Section 3: The HarvardX and MITx Course Network
In this section, we shift from participation within courses to the “flow” of participation across courses. We first describe overall course participation over time, which increases steadily in both unique participants and total course participation, as participants increasingly participating in multiple courses. We then display course networks across the two institutions, highlighting emergent course trajectories as well as “bridge” courses that link different institutions or seemingly different subjects.
Methods and Definitions
As we described in Section 1, we only count “participants,” the registrants who actually enter the course. We exclude non-entrants on the grounds that they are never exposed to course content. Given the relative focus of this section on participation and not certification, we expand our scope from the 64 certificate-granting courses in the previous sections to another 4 courses, 3 of which do not grant certificates and the last of which granted certificates over a time window that included but also stretched beyond our Year 2 cutoff of September 21, 2014.
We create network diagrams to describe the “flow” of participants through courses. The sizes of the nodes are proportional to the “flow” into and out of each course, defined as the sum of the number of participants in the course who “arrive” from another course and the number who “leave” into another course. The arrow sizes and thickness are proportional to the directional flow between any pair of courses. The centrality of the course in the graph is proportional to its number and strength of connections.
For parsimony, we only count direct flow between two courses—if a participant participates in Course A, then B, then C, we give Course C an in-flow of 1 and do not count the A-to-C indirect path. We are also able to filter out nodes and edges based on their flow to ease interpretation of the diagram. We designate filtering cutoffs where applicable. Finally, we do not count any flow between courses when registrations occur within a week of each other, to avoid counting casual participation in a number of courses over a short amount of time.
Results
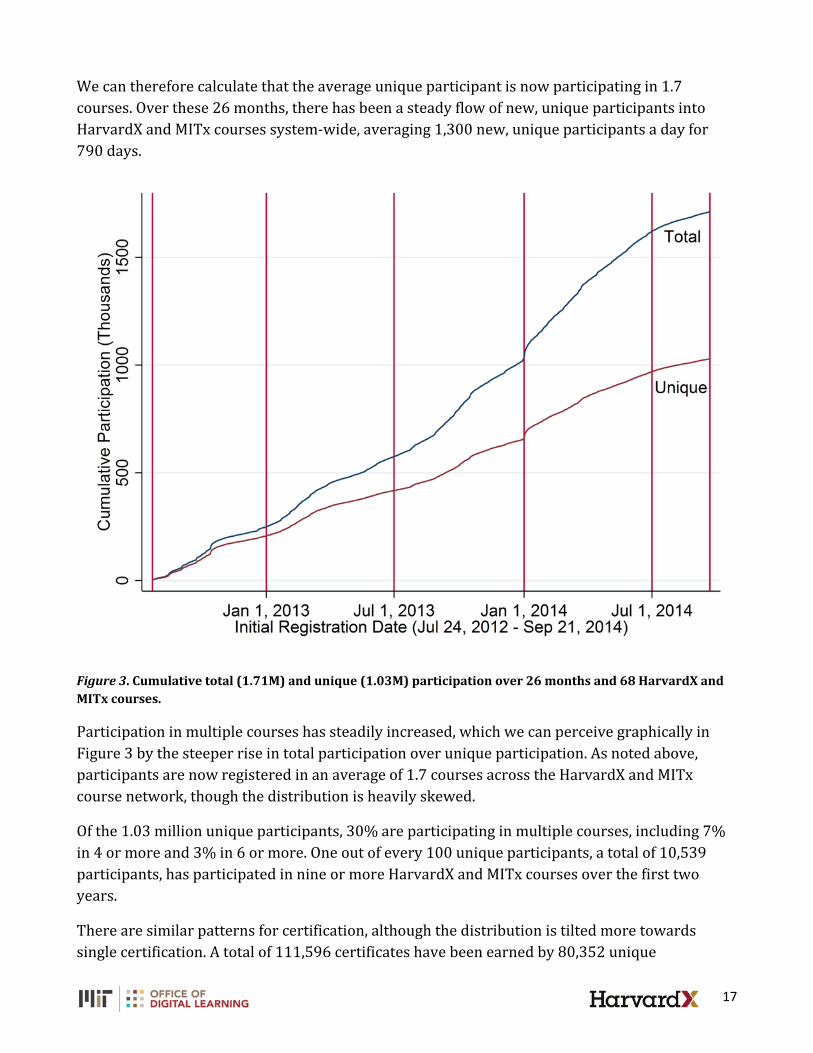
Figure 3 shows that trends have been remarkably stable from the opening of HarvardX and MITx on July 24, 2012, through the close of our analytic window on September 21, 2014. The two lines show total and unique cumulative participation through these first two years of courses. Total participants number 1,710,341, and unique participants number 1,028,467.
17
We can therefore calculate that the average unique participant is now participating in 1.7 courses. Over these 26 months, there has been a steady flow of new, unique participants into HarvardX and MITx courses system-wide, averaging 1,300 new, unique participants a day for 790 days.
Figure 3. Cumulative total (1.71M) and unique (1.03M) participation over 26 months and 68 HarvardX and MITx courses.
Participation in multiple courses has steadily increased, which we can perceive graphically in Figure 3 by the steeper rise in total participation over unique participation. As noted above, participants are now registered in an average of 1.7 courses across the HarvardX and MITx course network, though the distribution is heavily skewed.
Of the 1.03 million unique participants, 30% are participating in multiple courses, including 7% in 4 or more and 3% in 6 or more. One out of every 100 unique participants, a total of 10,539 participants, has participated in nine or more HarvardX and MITx courses over the first two years.
There are similar patterns for certification, although the distribution is tilted more towards single certification. A total of 111,596 certificates have been earned by 80,352 unique
18
participants. Of these certificate-earning participants, 20% certify in multiple courses, with 4% earning four or more and 2% earning six or more. One out of every 100 unique certificate earners, a total of 759 participants, earned seven or more certificates across the 64 certificate-offering courses in the first two years of HarvardX and MITx.
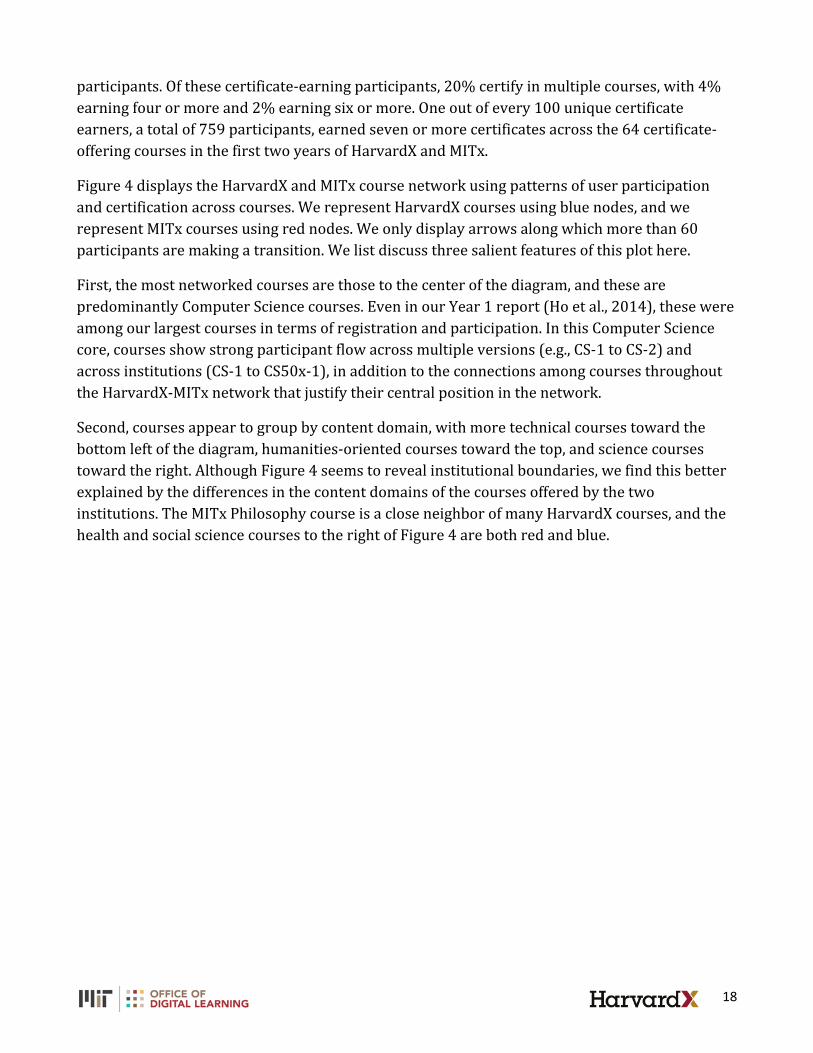
Figure 4 displays the HarvardX and MITx course network using patterns of user participation and certification across courses. We represent HarvardX courses using blue nodes, and we represent MITx courses using red nodes. We only display arrows along which more than 60 participants are making a transition. We list discuss three salient features of this plot here.
First, the most networked courses are those to the center of the diagram, and these are predominantly Computer Science courses. Even in our Year 1 report (Ho et al., 2014), these were among our largest courses in terms of registration and participation. In this Computer Science core, courses show strong participant flow across multiple versions (e.g., CS-1 to CS-2) and across institutions (CS-1 to CS50x-1), in addition to the connections among courses throughout the HarvardX-MITx network that justify their central position in the network.
Second, courses appear to group by content domain, with more technical courses toward the bottom left of the diagram, humanities-oriented courses toward the top, and science courses toward the right. Although Figure 4 seems to reveal institutional boundaries, we find this better explained by the differences in the content domains of the courses offered by the two institutions. The MITx Philosophy course is a close neighbor of many HarvardX courses, and the health and social science courses to the right of Figure 4 are both red and blue.
19
Figure 4. Full participation network for HarvardX (blue) and MITx (red) courses determined by registrants who participate in multiple courses in sequence. All 68 courses in the two-year sample are included. Node size is proportional to the sum of in-flow and out-flow. Central courses have more differentiated pathways. Only paths with more than 60 participants are shown.
20
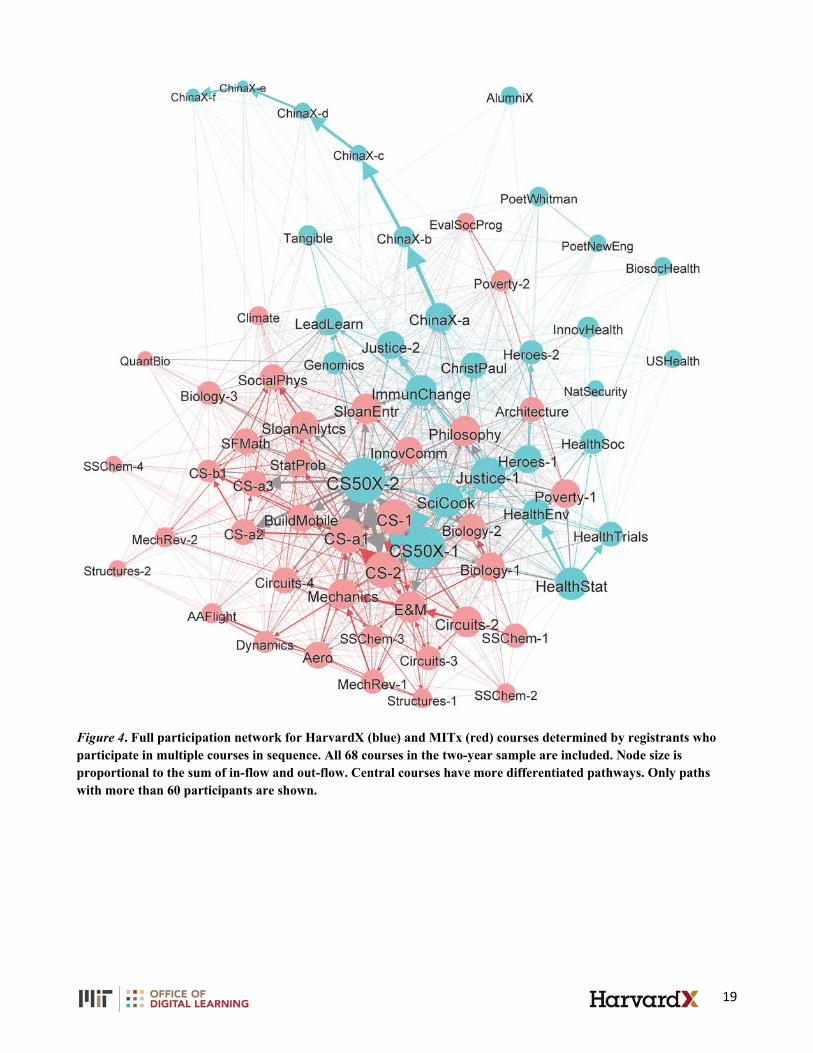
Figure 5. Certification network for HarvardX (blue) and MITx (red) courses determined by participants who earn certificates in multiple courses in sequence. All 64 regular, certificate-offering courses in the two-year sample are included. Node size is proportional to the sum of in-flow and out-flow. Central courses have more differentiated pathways. All sequential paths shown.
21
Third, the arc of ChinaX mini-course modules through the upper left of the plot is a striking illustration of the potential of well-sequenced, modular content. These six modules are the first of a total of 10 that are planned over a year’s time, and the thickness of the arrows through these modules shows that this designed pathway is among the strongest in the entire network.
Notably, ChinaX registrants are, by design, auto-registered in subsequent modules. Nonetheless, our decision to count participants and exclude non-entrants prevents auto-registration from inflating the ChinaX pathway in Figure 3. Although it appears that progression down the ChinaX pathway leads to a more isolated part of the network, this is confounded with the date that the courses are offered. Late-launching courses may send participants to other courses, but we do not observe them in our two-year analytic window. We discuss this ChinaX case study below, including its implications for sequenced modules more broadly.
In contrast, in Figure 5, we focus on the certification network. We include all 64 regular, certificate-offering courses and do not filter paths. The center of the network is now a tight cluster of courses related to the Health Sciences, although Computer Science remains proximal. The ChinaX pathway is more central, and it is stronger for certification than it is for participation, relative to other courses. This complements our finding in Figure 2b in Section 1, which showed that participants in subsequent ChinaX modules certified at noticeably higher rates. Figure 5 confirms that, as expected, many of these certificate earners had earned certificates in the previous module.
Discussion
The substantial certification rate of later ChinaX modules and the strong course pathways in both participation and certification represent a case study with implications for the design and implementation of MOOCs. The first ChinaX module attracted 29,706 participants, 10% of whom earned a certificate. Participation dropped by 2/3 in the second module, but the certification rate more than doubled, to 21%. By the third module, participation halved yet again, but the certification rate was higher still, at 32.5%. One interpretation of these data is that shorter, thoughtfully sequenced MOOC modules end up filtering out noncommittal browsers and focusing the remaining community to their relative benefit.
Another interpretation is that the pattern of falling enrollment and rising engagement through ChinaX modules is no different than that within any longer MOOC, where we consistently see a pattern of significant initial attrition followed by higher certification rates of those who remain. DeBoer et al. (2014) plot average grade on the number of days attended in the MITx pilot course, and, as expected, the average grade of a participant rises with days attended, and those who visit 40 days or more have average grades above the level required for certification. Similarly, Ho et al. (2014) show that the certification rate for all explorers (those who view half or more chapters of content) is 54%, far higher than the baseline certification rate of 8%.
22
As certificates for series of MOOCs proliferate, convergent evidence from more examples of sequenced courses will grow, and we may be able to make a stronger case for the independent added value of modular sequencing for learning. In the meantime, Figures 2, 4, and 5 reveal what we might expect: a sequence of mini-courses will stand out empirically in a less organized network of courses, in participation pathways, certification pathways, and certification rates.
Section 4: Differences across Curricular Content Areas
With 68 courses across two institutions, we investigate whether differences among courses can be summarized by differences among their curricular content areas. Analogous reports are common for postsecondary degrees, for example, a National Center for Education Statistics report by Chen (2013) finds that Science, Technology, Engineering, and Mathematics (STEM) degrees are the most common among beginning Bachelor’s degree students, over Business, Social/Behavioral Sciences, and Humanities degrees in that order. Chen also finds that STEM degree attrition and degree-switching does not differ substantially in magnitude from other subjects. We ask similar questions of our open online courses. How do enrollments, certification rates, and demographics differ across curricular content areas in open online courses?
Methods and Definitions
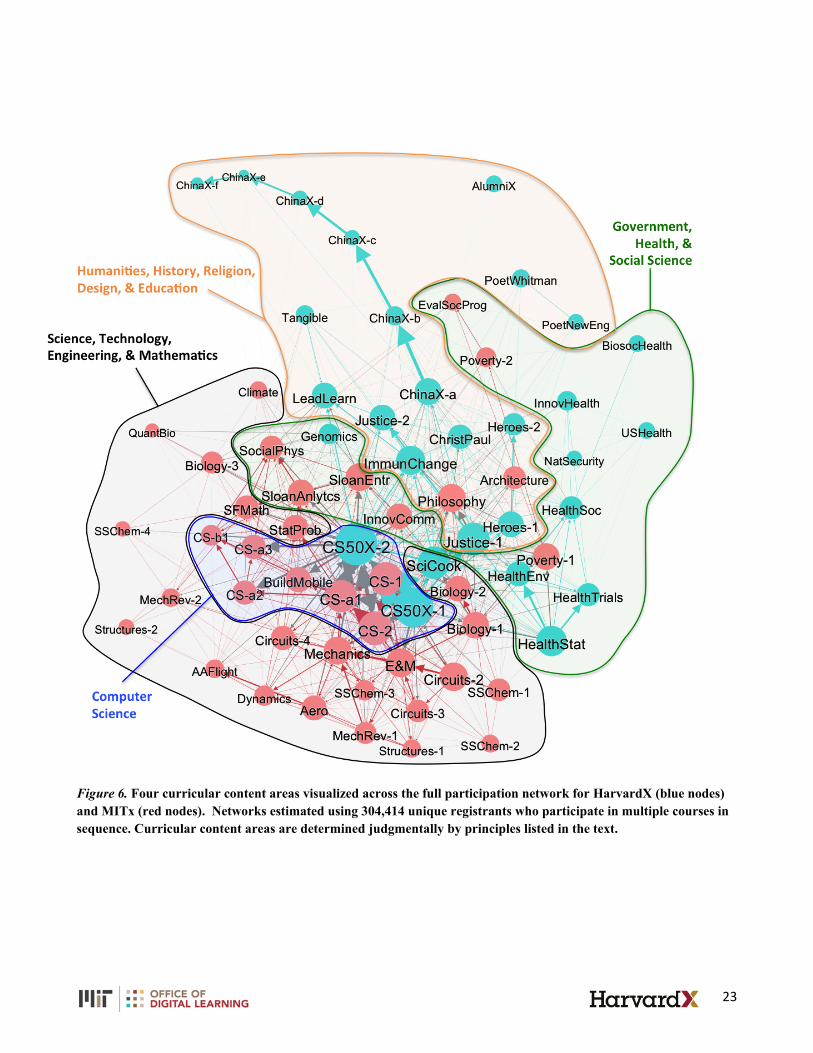
To summarize differences among curricular areas, we classified each course by one of four broad curricular content categories: (1) Computer Science (CS); (2) Science, Technology, Engineering, and Mathematics (STEM); (3) Humanities, History, Religion, Design, and Education (HHRDE); and (4) Government, and Health and Social Sciences (GHSS). These are super-categories that result from a collapsing of a 13-category classification scheme from the Harvard Online Learning Portal.
When courses did not fall cleanly into any single category or category boundaries were ambiguous, we followed two additional principles. First, we considered not only course titles and descriptions but the departmental and school affiliations of the instructors and their courses. Second, in borderline cases, we used the empirical participation network shown in Figure 4 to guide classification. These principles helped to inform the inclusion of business, leadership, and innovation courses in the GHSS category and education courses in the HHRDE category. We conducted sensitivity checks for borderline courses by switching their categories and recalculating results, and primary substantive conclusions do not change.
The resulting classifications are shown in Figure 7. There are a total of nine CS courses, 24 STEM courses, 19 HHRDE courses, and 16 GHSS courses. As expected given the relative foci of the two institutions, MITx accounted for 23 of 24 STEM courses and seven of nine CS courses, whereas HarvardX accounted for 17 of 19 HHRDE courses. The GHSS category was more balanced, with HarvardX accounting for nine of 16 courses.
23
Figure 6. Four curricular content areas visualized across the full participation network for HarvardX (blue nodes) and MITx (red nodes). Networks estimated using 304,414 unique registrants who participate in multiple courses in sequence. Curricular content areas are determined judgmentally by principles listed in the text.
24
Results and Discussion
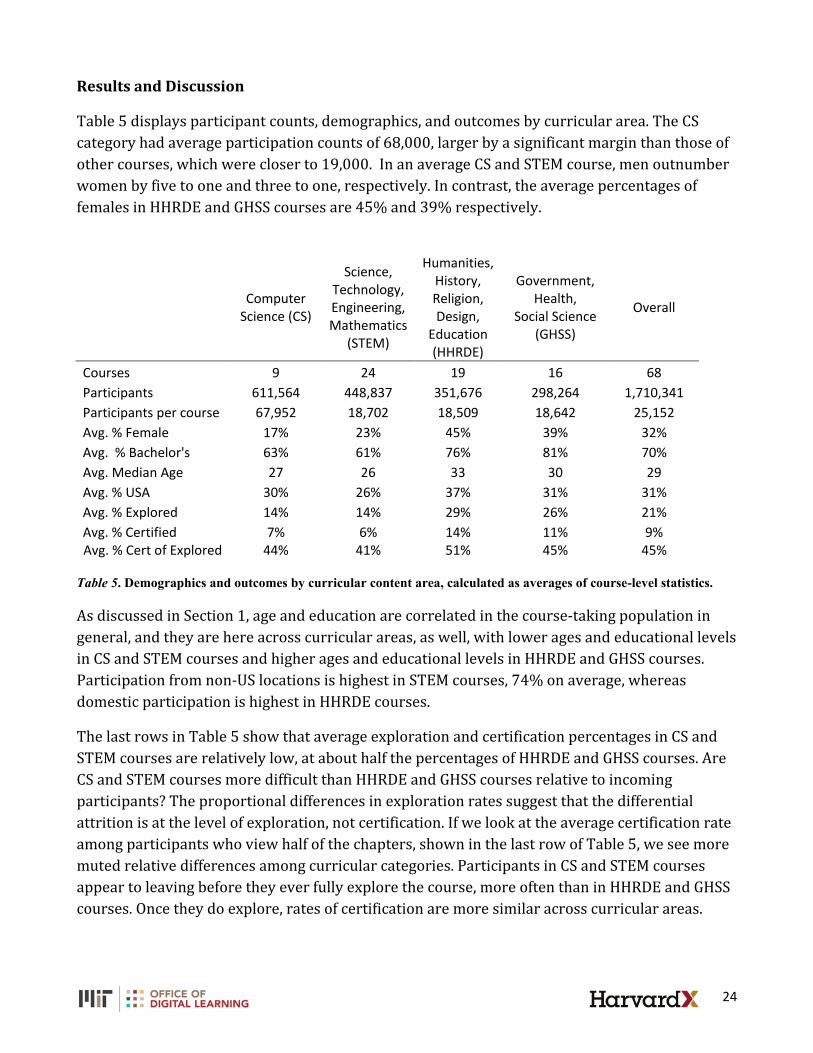
Table 5 displays participant counts, demographics, and outcomes by curricular area. The CS category had average participation counts of 68,000, larger by a significant margin than those of other courses, which were closer to 19,000. In an average CS and STEM course, men outnumber women by five to one and three to one, respectively. In contrast, the average percentages of females in HHRDE and GHSS courses are 45% and 39% respectively.
Computer Science (CS)
Science, Technology, Engineering, Mathematics
(STEM)
Humanities, History, Religion, Design,
Education (HHRDE)
Government, Health,
Social Science (GHSS)
Overall
Courses 9 24 19 16 68 Participants 611,564 448,837 351,676 298,264 1,710,341 Participants per course 67,952 18,702 18,509 18,642 25,152 Avg. % Female 17% 23% 45% 39% 32% Avg. % Bachelor's 63% 61% 76% 81% 70% Avg. Median Age 27 26 33 30 29 Avg. % USA 30% 26% 37% 31% 31% Avg. % Explored 14% 14% 29% 26% 21% Avg. % Certified 7% 6% 14% 11% 9% Avg. % Cert of Explored 44% 41% 51% 45% 45%
Table 5. Demographics and outcomes by curricular content area, calculated as averages of course-level statistics.
As discussed in Section 1, age and education are correlated in the course-taking population in general, and they are here across curricular areas, as well, with lower ages and educational levels in CS and STEM courses and higher ages and educational levels in HHRDE and GHSS courses. Participation from non-US locations is highest in STEM courses, 74% on average, whereas domestic participation is highest in HHRDE courses.
The last rows in Table 5 show that average exploration and certification percentages in CS and STEM courses are relatively low, at about half the percentages of HHRDE and GHSS courses. Are CS and STEM courses more difficult than HHRDE and GHSS courses relative to incoming participants? The proportional differences in exploration rates suggest that the differential attrition is at the level of exploration, not certification. If we look at the average certification rate among participants who view half of the chapters, shown in the last row of Table 5, we see more muted relative differences among curricular categories. Participants in CS and STEM courses appear to leaving before they ever fully explore the course, more often than in HHRDE and GHSS courses. Once they do explore, rates of certification are more similar across curricular areas.
25
The most striking curricular finding is the standout enrollments of CS courses, which continue to put the Massive in MOOCs more than other curricular areas. Beyond that, there is a rough tale of two curricular domains, CS/STEM on the one hand, serving a disproportionately younger, male, less educated, and international audience, and HHRDE/GHSS on the other hand, serving an older, more gender-balanced, more educated, and slightly more US-based audience. The participants among this latter audience access more chapters and certify at higher rates. However, among certificate earners, median time spent in CS/STEM courses is approximately twice that of median spent in HHRDE/GHSS courses (Appendix B).
The GHSS area stands out further given the professional orientation of its courses, as indicated in part by the extremely high percentages of participants with Bachelor’s degrees. As Reich et al. (2014) noted of the courses from the Harvard T.H. Chan School of Public Health, there is particular intentionality to the recruitment and design for professional school courses, born in part of their relatively focused missions in comparison to those of undergraduate liberal arts and sciences courses.
Section 5: “Top 5”: Fifteen Different Ways of Looking at Open Online Courses
In the first year of HarvardX and MITx, 17 courses from the two institutions launched on the edX platform. Each was described in detail by a series of 17 reports (e.g., Fisher, 2014; Reich et al., 2014; Seaton et al., 2014) to highlight the diversity of course topics, course designs, and instructor intentions. In the second year, the total number of HarvardX and MITx courses quadrupled to 68. In lieu of separate reports to describe differences among courses, this section reviews contrasts along selected dimensions, including the scale of the audience, participant demographics, and participant interactions. We list “Top 5” courses along selected metrics to emphasize how different facets of courses and their use by participants can make different courses stand out.
Methods and definitions
The calculation of our metrics for displaying “Top 5” courses is straightforward and follows from previous sections with one exception: the calculation of time spent. For this measure, we follow the definition provided by Mullaney (2014, Appendix B) for session duration. Participant time is counted from the first logged event, or “session start,” until the “session end,” defined as the next logged event following which 30 minutes passes with no logged activity. Three events interspersed by 10 minutes will count as a 20-minute session. A single event isolated temporally by more than 30 minutes is not counted.
As Mullaney (2014) notes, the resulting measure is an approximation. It will underestimate time spent by participants engaged by videos and assessments longer than 30 minutes, and it will overestimate time spent by folks who click within 30-minute intervals while distracted by other tasks. The 30-minute cutoff is ultimately a judgment call, but it is consistent with norms established by the Interactive Advertising Bureau (2009) and Google (2013). We estimate time spent on particular course resources by attributing any session time to the resource associated
26
with the logged event. For example, if there are three logged events separated by 10 minutes, in a forum, a video, and an assessment respectively, then we assume 10 minutes are spent in the forum, and then 10 minutes are spent on a video. The assessment event is counted as the end of the session, and we attribute no time to assessments in this example.
Results
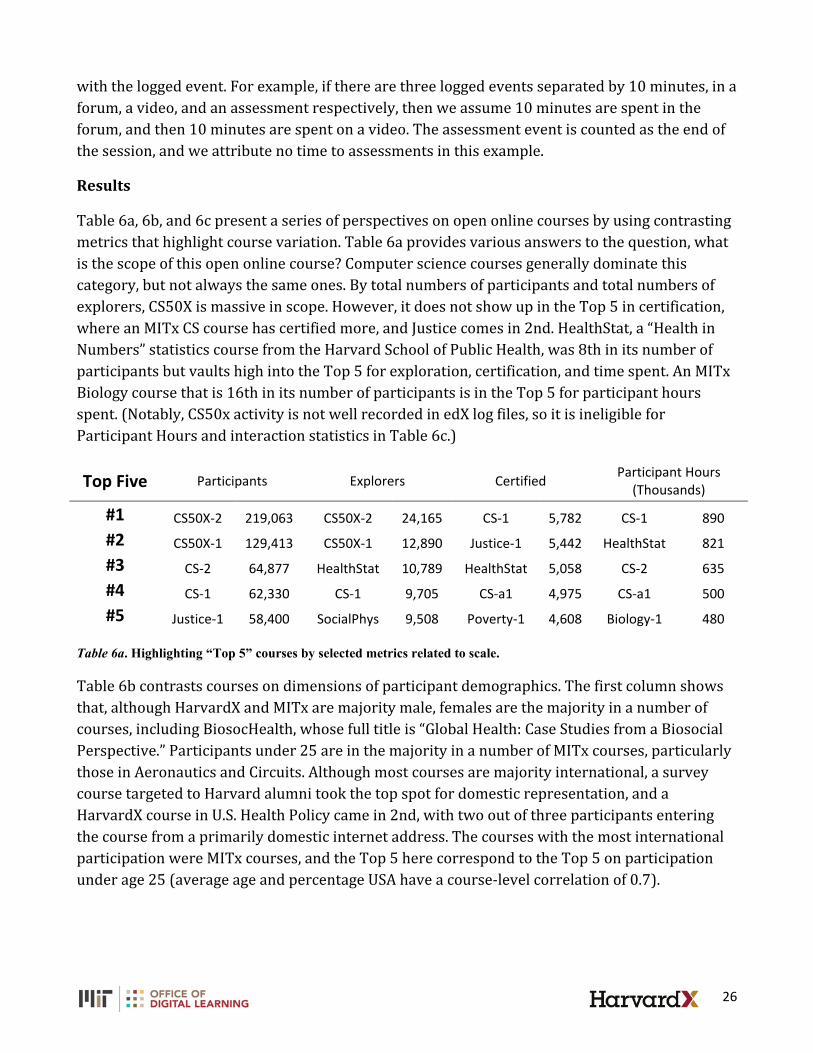
Table 6a, 6b, and 6c present a series of perspectives on open online courses by using contrasting metrics that highlight course variation. Table 6a provides various answers to the question, what is the scope of this open online course? Computer science courses generally dominate this category, but not always the same ones. By total numbers of participants and total numbers of explorers, CS50X is massive in scope. However, it does not show up in the Top 5 in certification, where an MITx CS course has certified more, and Justice comes in 2nd. HealthStat, a “Health in Numbers” statistics course from the Harvard School of Public Health, was 8th in its number of participants but vaults high into the Top 5 for exploration, certification, and time spent. An MITx Biology course that is 16th in its number of participants is in the Top 5 for participant hours spent. (Notably, CS50x activity is not well recorded in edX log files, so it is ineligible for Participant Hours and interaction statistics in Table 6c.)
Top Five Participants Explorers Certified Participant Hours (Thousands)
#1 CS50X-2 219,063 CS50X-2 24,165 CS-1 5,782 CS-1 890 #2 CS50X-1 129,413 CS50X-1 12,890 Justice-1 5,442 HealthStat 821 #3 CS-2 64,877 HealthStat 10,789 HealthStat 5,058 CS-2 635 #4 CS-1 62,330 CS-1 9,705 CS-a1 4,975 CS-a1 500 #5 Justice-1 58,400 SocialPhys 9,508 Poverty-1 4,608 Biology-1 480
Table 6a. Highlighting “Top 5” courses by selected metrics related to scale.
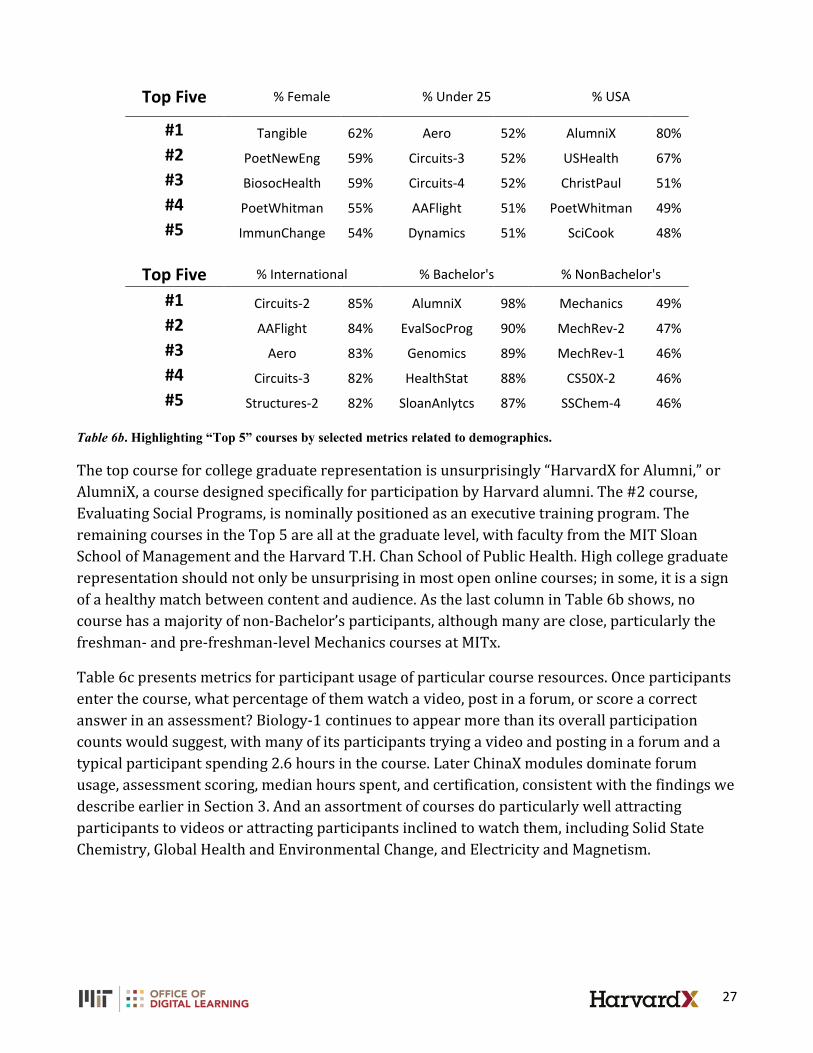
Table 6b contrasts courses on dimensions of participant demographics. The first column shows that, although HarvardX and MITx are majority male, females are the majority in a number of courses, including BiosocHealth, whose full title is “Global Health: Case Studies from a Biosocial Perspective.” Participants under 25 are in the majority in a number of MITx courses, particularly those in Aeronautics and Circuits. Although most courses are majority international, a survey course targeted to Harvard alumni took the top spot for domestic representation, and a HarvardX course in U.S. Health Policy came in 2nd, with two out of three participants entering the course from a primarily domestic internet address. The courses with the most international participation were MITx courses, and the Top 5 here correspond to the Top 5 on participation under age 25 (average age and percentage USA have a course-level correlation of 0.7).
27
Top Five % Female % Under 25 % USA
#1 Tangible 62% Aero 52% AlumniX 80% #2 PoetNewEng 59% Circuits-3 52% USHealth 67% #3 BiosocHealth 59% Circuits-4 52% ChristPaul 51% #4 PoetWhitman 55% AAFlight 51% PoetWhitman 49% #5 ImmunChange 54% Dynamics 51% SciCook 48%
Top Five % International % Bachelor's % NonBachelor's
#1 Circuits-2 85% AlumniX 98% Mechanics 49% #2 AAFlight 84% EvalSocProg 90% MechRev-2 47% #3 Aero 83% Genomics 89% MechRev-1 46% #4 Circuits-3 82% HealthStat 88% CS50X-2 46% #5 Structures-2 82% SloanAnlytcs 87% SSChem-4 46%
Table 6b. Highlighting “Top 5” courses by selected metrics related to demographics.
The top course for college graduate representation is unsurprisingly “HarvardX for Alumni,” or AlumniX, a course designed specifically for participation by Harvard alumni. The #2 course, Evaluating Social Programs, is nominally positioned as an executive training program. The remaining courses in the Top 5 are all at the graduate level, with faculty from the MIT Sloan School of Management and the Harvard T.H. Chan School of Public Health. High college graduate representation should not only be unsurprising in most open online courses; in some, it is a sign of a healthy match between content and audience. As the last column in Table 6b shows, no course has a majority of non-Bachelor’s participants, although many are close, particularly the freshman- and pre-freshman-level Mechanics courses at MITx.
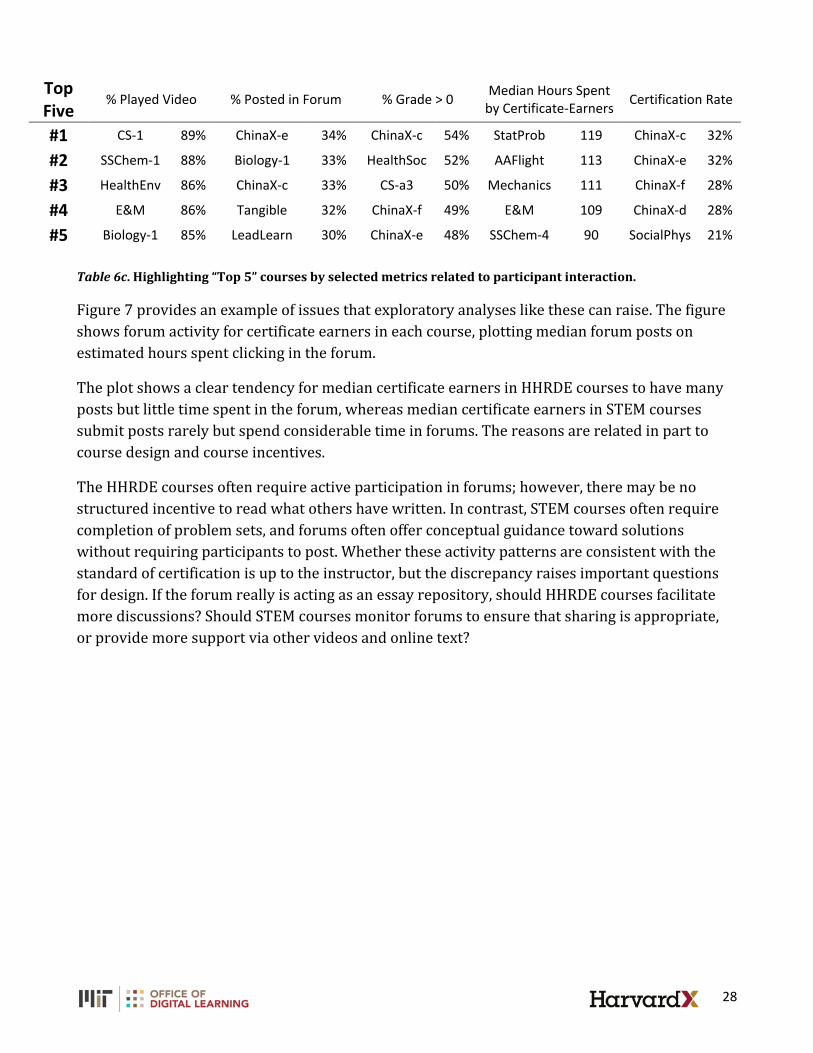
Table 6c presents metrics for participant usage of particular course resources. Once participants enter the course, what percentage of them watch a video, post in a forum, or score a correct answer in an assessment? Biology-1 continues to appear more than its overall participation counts would suggest, with many of its participants trying a video and posting in a forum and a typical participant spending 2.6 hours in the course. Later ChinaX modules dominate forum usage, assessment scoring, median hours spent, and certification, consistent with the findings we describe earlier in Section 3. And an assortment of courses do particularly well attracting participants to videos or attracting participants inclined to watch them, including Solid State Chemistry, Global Health and Environmental Change, and Electricity and Magnetism.
28
Top Five
% Played Video % Posted in Forum % Grade > 0 Median Hours Spent by Certificate-Earners Certification Rate
#1 CS-1 89% ChinaX-e 34% ChinaX-c 54% StatProb 119 ChinaX-c 32%
#2 SSChem-1 88% Biology-1 33% HealthSoc 52% AAFlight 113 ChinaX-e 32%
#3 HealthEnv 86% ChinaX-c 33% CS-a3 50% Mechanics 111 ChinaX-f 28%
#4 E&M 86% Tangible 32% ChinaX-f 49% E&M 109 ChinaX-d 28%
#5 Biology-1 85% LeadLearn 30% ChinaX-e 48% SSChem-4 90 SocialPhys 21% Table 6c. Highlighting “Top 5” courses by selected metrics related to participant interaction.
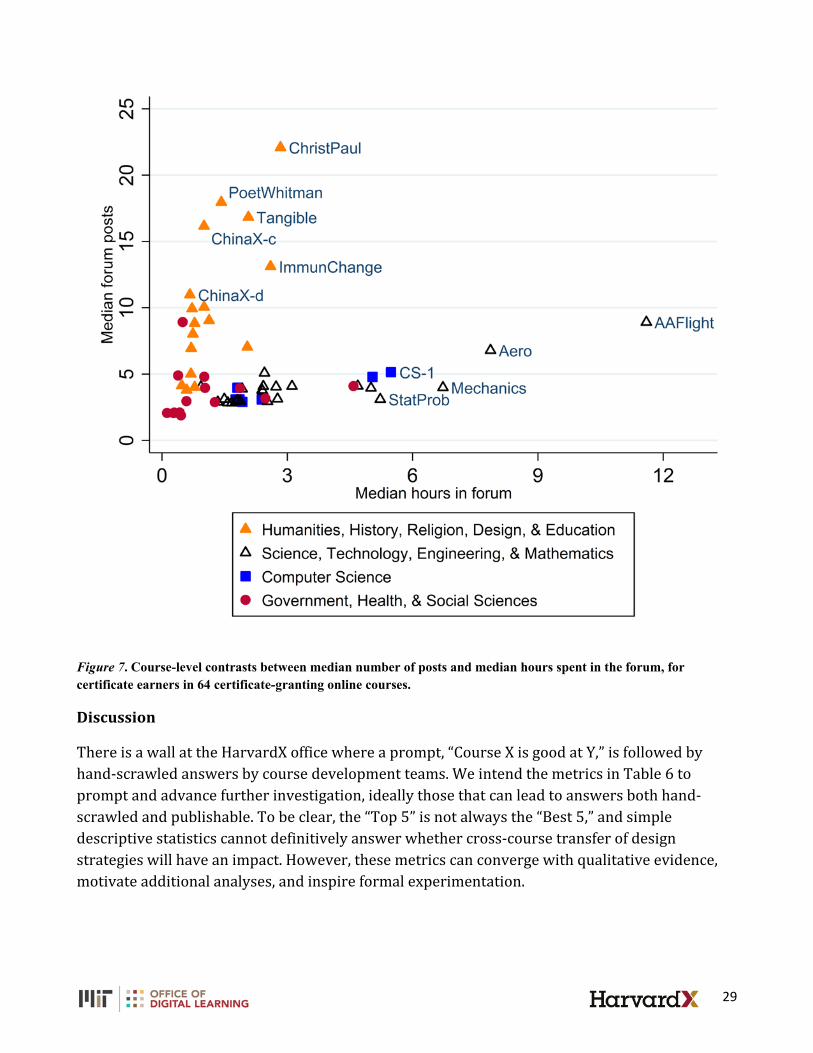
Figure 7 provides an example of issues that exploratory analyses like these can raise. The figure shows forum activity for certificate earners in each course, plotting median forum posts on estimated hours spent clicking in the forum.
The plot shows a clear tendency for median certificate earners in HHRDE courses to have many posts but little time spent in the forum, whereas median certificate earners in STEM courses submit posts rarely but spend considerable time in forums. The reasons are related in part to course design and course incentives.
The HHRDE courses often require active participation in forums; however, there may be no structured incentive to read what others have written. In contrast, STEM courses often require completion of problem sets, and forums often offer conceptual guidance toward solutions without requiring participants to post. Whether these activity patterns are consistent with the standard of certification is up to the instructor, but the discrepancy raises important questions for design. If the forum really is acting as an essay repository, should HHRDE courses facilitate more discussions? Should STEM courses monitor forums to ensure that sharing is appropriate, or provide more support via other videos and online text?
29
Figure 7. Course-level contrasts between median number of posts and median hours spent in the forum, for certificate earners in 64 certificate-granting online courses.
Discussion
There is a wall at the HarvardX office where a prompt, “Course X is good at Y,” is followed by hand-scrawled answers by course development teams. We intend the metrics in Table 6 to prompt and advance further investigation, ideally those that can lead to answers both hand-scrawled and publishable. To be clear, the “Top 5” is not always the “Best 5,” and simple descriptive statistics cannot definitively answer whether cross-course transfer of design strategies will have an impact. However, these metrics can converge with qualitative evidence, motivate additional analyses, and inspire formal experimentation.
30
These metrics can also help to set realistic goals. If an open online course hopes to, for example, attract more participants under 25 without Bachelor’s degrees, there is a continuum along which percentages may increase. However, as long as courses remain open and non-selective, no one should expect that subgroup to suddenly become a majority. With both averages (Table 1) and the extremes of ranges (Table 6), course teams and researchers not only learn who participants are and what they do, but they can also think strategically about how much they can influence participant demographics and activity.
Section 6. Preliminary Data from Verified Certificates
In the fall of 2013, edX piloted an option where participants could pay a fee to verify their identity, using photographs of the participant with his or her official identification. If the participant completed the course successfully, he or she would receive a “verified certificate.” The service launched officially in 2014 and continues to expand. In our dataset, a total of 13 courses offered verified certificates, 10 from MITx and three from HarvardX. In early 2015, the cumulative number is now 73 courses, 43 from MITx and 30 from HarvardX. Data collection and outcomes for more recent courses are not finalized, thus, we offer a preliminary report on the 13 courses for which we do have data in this section.
Who would pay for a verified certificate and why? Verification prices are described as minimum fees and differ by course. Most fees are $100 or less, and they have ranged from $25 to $250 to date. Users are welcomed to contribute more than the minimum fee to advance the not-for-profit edX mission, and we have found that a small percentage of participants do indeed take this opportunity. Although some may see this as an opportunity to donate or express appreciation, the perceived value for most is a more official and shareable certification of knowledge, skills, and abilities. Notably, edX also describes an investment in a verified certificate as an incentive for successful course completion. We offer preliminary evidence that addresses this theory here.
Table 7 shows demographic backgrounds of verified participants across the 13 courses offering verification. There are five STEM courses, four CS courses, and four GHSS courses, and overall demographic and outcome variables follow those we would predict from patterns that we described in Section 4. Beyond those baselines, on average, and consistently across courses, participants who opt for verification are older, more likely to have a Bachelor’s degree, and more likely to be US-based. They are slightly less likely to be female, although the difference is not substantial. The age and education differences are the reverse of the direction one would expect if one were using verified certificates to supplement or substitute for a college degree.
Table 7 shows that the difference between exploration and certification for verified vs. non-verified users is substantial. It should not be surprising that those who consider and then ultimately invest in a verified certificate would be those who would hope to get what they paid for. Course certification rates of 59% are identical in magnitude to the 2012 six-year graduation rate for four-year U.S. institutions (U.S. Department of Education, National Center for Education

31
Statistics, 2014). This is an apples-to-oranges comparison; however, it is far more reasonable than comparing unadjusted MOOC certification rates to graduation rates of parent postsecondary institutions.
Not Verified Verified Count 402,504 7,469 % Bachelor's 69% 73% Median Age 27 31 % USA 32% 43% % Female 24% 21% % Explored* 17% 74% % Certified* 5% 59% % Certified of Explored* 34% 79%
Note. CS50x-2 is excluded from these course-level averages, because certification opportunities had not yet ended by the analytic end date for this report. Table 7. Differences in demographics and outcomes between ID-verified and non-ID-verified participants. Statistics are expressed as course-level averages over 13 courses that offer verification.
All it takes is a small financial commitment to bring open online course certification rates to percentages that seem more familiar in magnitude. Should payment be mandatory? Such a policy would conflict with the commitment to open access that has been the hallmark of MOOCs and their providers. The tradeoff between maximizing access and maximizing commitment to certification (and presumably, thereby, learning) can be informed by further research. It is not currently clear whether paying to verify increases the likelihood of commitment or merely allows those who already would have certified to identify themselves. If the former is true, verification or similar strategies for increasing commitment should be more strongly encouraged. If the latter is true, then there is less of a basis for encouraging financial investment as a means to increase learning.
Conclusions
These findings build on those from the previous year (Ho et al., 2014), painting an increasingly detailed portrait of this open online space, its participants, and their activity. Our survey instruments and emerging paid verification options allow for improving documentation of the immense variation in participant intentions and backgrounds. These help to set baseline expectations, both in general and for particular curricular areas, that can inform realistic and ambitious goals for access, residential impact, and research.
Residential Enhancement
We conclude this report by broadening our viewpoint beyond online data, to describe a few of the ways in which MITx and HarvardX have been enhancing residential education on MIT and Harvard physical campuses. Many examples have been documented previously in reports on
32
first-year HarvardX and MITx courses (e.g., Reich et al., 2014; Seaton et al., 2014). We extend this narrative with five examples below. These examples help to communicate the breadth of the impact that the HarvardX and MITx initiatives have had on the development, visibility, and usage of pedagogical resources and innovations on campus. At this writing, over 83% of MIT undergraduates have used the residential MITx system (run separately from edX, but using the same underlying open-source software) for a substantial portion of coursework in one or more classes. At Harvard, adoption is also proceeding, and many residential courses that have HarvardX counterparts are using HarvardX resources to support residential instruction (Bergeron, 2014).
x E&M (8.02x): Electricity and Magnetism. Under the guidance of Professor John Belcher and Dr. Saif Rayyan, the MIT Physics department employed online content from the E&M MITx course to supplement MIT's on-campus, 800-student, first-year E&M course. This "Technology-Enabled Active Learning" (TEAL) course has long been "flipped," where traditional lectures have been replaced by peer-instruction, group problem solving, and student-staff interactions. Enabled by the MITx resources, instructors could design automated, instant feedback for student activities done outside of class. Student response was positive, with 95% of respondents in favor of using MITx in future physics courses (Rayyan & Belcher, 2014).
x SSChem (3.091x): Introduction to Solid State Chemistry. Professor Michael Cima deployed a "treasure chest" of hundreds of problems developed for his MITx course for a mastery-based learning and assessment system in his large, on-campus, SSChem course. Instead of traditional midterm and final exams, and instead of paper-based homework assignments, students were given online assessments in a proctored environment. A minimum number of passed assessments were required to pass the course, however, students were allowed to repeat each assessment as often as needed, within a 14-day period. Research has suggested positive outcomes compared to students in previous years of the course (Cima, 2014).
x ChinaX (SW12x): China. Professors Peter Bol and William Kirby implemented a flipped classroom model at Harvard University in SW12 (Societies of the World 12) in the fall of 2013 and again in the fall of 2014. For both iterations of the undergraduate course students watched ChinaX content as their lecture and discussed the content and readings in class. This transition continues to be studied using survey and quasiexperimental methods, taking advantage of common assessments given from year to year (e.g., Zhao & Ho, 2014).
x CS50x: Introduction to Computer Science. Professor David Malan designed the “CS50 Appliance,” a virtual environment for students to develop code and receive feedback (Malan, 2013). Professor Malan has used data from the appliance to understand and improve how students code and use feedback. Innovations like online office hours have
33
increased both the timeliness and use of feedback by residential students (MacWilliam et al., 2013).
x VJx (VJx) Visualizing Japan (1850's - 1930's): Westernization, Protest, Modernity. This first-time MITx-HarvardX collaboration was jointly produced by faculty at both institutions and launched on edX in the fall of 2014. It was simultaneously employed in an on-campus course at MIT, taught by Professor Shigeru Miyagawa, who noted in a correspondence:
"For me, teaching the residential Visualizing Japan class (9 students, as opposed to 9,000!) simultaneously with the MOOC has been one of the most exciting teaching experiences of my career. It has fundamentally transformed the way I teach. The students are more engaged with the course than any other course I have ever taught” (S. Miyagawa, personal communication, October 24, 2014).
These examples place the analysis of MOOC participant data in a broader context. Online course development creates opportunities for online participants, and feedback loops can create opportunities for residential students, residential instructors, and residential institutions. We enumerate these multiple stakeholders for discussion below.
Seven Categories of MOOC Stakeholders
This report has used survey instruments and logged event data to identify and distinguish among categories of MOOC participants, by demographics, activity, stated intentions, and teaching background. For discussion, consider four broad categories of MOOC participants: online browsers, online explorers, online certifiers, and teachers-as-learners (described in Section 2 and Seaton et al., 2015). In this conclusion, we have also highlighted three additional MOOC stakeholders: our residential students, our course instructor(s), and our institutions. Here, we discuss possible tradeoffs and possible synergies that arise when prioritizing among these seven diverse stakeholder categories.
Ignoring completion rates, lauding completers
A narrow theory of MOOCs holds that certification indicates learning, and every participant that has not earned a certificate has not learned. This is the implicit reasoning behind the use of a certification rate as an evaluative metric for MOOCs. We have shown that certification rates are higher for those who state intentions to certify (24%) and for those who have invested money in identity verification for certificates (59%). If we wished only to increase overall certification rates, one solution is simple: restrict access. Online browsers, online explorers, and teachers-as-learners would not benefit from such a policy. And MOOCs would lose their first two letters and much of their claim to innovation, instead becoming familiar, smaller, online courses. Overall certification rates are not useful as target metrics for MOOCs.
34
On the other hand, certification is a desirable outcome for many participants, and it is one consistent with the educational missions of institutions producing MOOCs. In an open online context, it is entirely reasonable for an instructor to adopt a “laissez-faire” approach to online course participation, encouraging participants to use MOOCs for whatever purposes they see fit. Such an ethos resonates with the practices and philosophies that emerged around, for example, MIT’s OpenCourseware. For other instructors, however, the deeply held norm of commitment to completion—well established in residential settings—is one that deserves to be upheld. There is an opportunity for instructors and institutions to hold MOOC participants, or some subset of these participants who opt-in, to the same high standard for online course completion that we hold for residential course completion. The MOOC certification rate is a poor measure of course efficacy, but any backlash against the metric should not extend to the commendable goal of certification.
In this report and recent studies (DeBoer et al., 2014; Ho et al., 2014; Reich, 2014), several new summary statistics have emerged that capture useful, contrasting dimensions of course completion. The certification rates of participants who state their intention to earn certificates or those who invest monetarily are two baselines from which strategic improvements can be made. The percentage of those who reverse their intentions from non-certification to certification may be another measure of the impact of a course. We encourage the development and adoption of similar approaches to defining and quantifying course efficacy.
Mechanisms for feedback loops
How can MOOC development enhance residential education, and thereby advance the interests of other stakeholders, including teachers-as-learners our residential students, our course instructors, and our institutions? One direct mechanism is residential student use of MOOC resources, such as assessments, videos, joint forums, and feedback technologies, as we described through examples earlier in this concluding section. A second mechanism is through effects on our course instructors, where design, development, and delivery of online materials can lead to deeper understanding of the content and new proficiency with technology-mediated teaching. There are multiple pathways by which our investments in online learning can benefit instruction on our residential campuses.
A third mechanism for residential enhancement is through residential faculty and students who are not directly involved with the MOOC effort at all. Through a critical mass of converging conversations about innovations in teaching and learning, supported and guided by the Office of Digital Learning at MIT and the Office of the Vice Provost for Advances in Learning at Harvard, MOOCs have become one of many alternative perspectives that offer everyone on campus new opportunities to see teaching and learning with new eyes.
35
Year 3 and Beyond
The HarvardX and MITx MOOCs have called many longstanding features of residential courses into question: the rigidity of the semester schedule, the lengthy periods between assignment submission and feedback, and the rarity of sharing syllabi, lecture notes, lesson plans, assessments, and rubrics across faculty teaching common courses, to name only a few examples. Even if MOOCs are not a flawless answer to these questions, they deserve credit for helping to clarify issues worth addressing and inspiring campus-wide conversations about the future of learning at our institutions.
The diverse contributions of MOOCs have been obscured by a common expectation that MOOC certification would grow exponentially in number and value, especially among those without access to conventional higher education. That they have not yet delivered on this promise should not blind us to their other benefits. As we progress through the third year of HarvardX and MITx, with courses, experiments, participation, and residential innovations continuing to proliferate, the diverse audiences and stakeholders are increasingly well-defined. The opportunity we face is one of prioritization, not in terms of choosing some audiences and stakeholders over others, but in terms of choosing strategies that capitalize on synergies among these audiences and stakeholders.
Participation, exploration, certification, teacher enrollment, and residential enhancement are less independent dials to turn up and down but interacting ingredients in a recipe for online and residential advances in learning. From the baseline data we have shown in this report, we hope to continue to facilitate good cooking.
Appendices Online Appendix A: Course Listings http://harvardx-mitx-year2.odl.mit.edu/appendix.html
Online Appendix B: Course-Level Statistics http://harvardx-mitx-year2.odl.mit.edu/appendix.html
36
References Bergeron, J. (2014). Blended learning in Harvard College: A pilot study of four courses. Cambridge,
MA: Bok Center for Teaching and Learning. Retrieved from
http://bokcenter.harvard.edu/files/bokcenter/files/blended_learning_report_web_version_
new_0.pdf
Breslow, L., Pritchard, D. E., DeBoer, J., Stump, G. S., Ho, A. D., & Seaton, D. T. (2013). Studying
learning in the worldwide classroom: Research into edX’s first MOOC. Research & Practice in
Assessment, 8, 13–25. Retrieved from http://www.rpajournal.com/dev/wp-
content/uploads/2013/05/SF2.pdf
Chen, X. (2013). STEM Attrition: College Students’ Paths Into and Out of STEM Fields (NCES 2014-
001). National Center for Education Statistics, Institute of Education Sciences, U.S.
Department of Education. Washington, DC.
Christensen, G., Steinmetz, A., Alcorn, B., Bennett, A., Woods, D., & Emanuel, E. (2013). The MOOC
phenomenon: Who takes massive open online courses and why? Retrieved from
http://papers.ssrn.com/sol3/papers.cfm?abstract_id=2350964
Cima, M. (2014). Mastery based learning report. Retrieved from
http://web.mit.edu/3.091/www/mastery-based-learning-report.html
DeBoer, J., Ho, a. D., Stump, G. S., & Breslow, L. (2014). Changing “Course”: Reconceptualizing
Educational Variables for Massive Open Online Courses. Educational Researcher, 43(2), 74–
84. doi:10.3102/0013189X14523038
Fisher, W. W. (2014). HLS1X: CopyrightX Course Report. SSRN Electronic Journal.
doi:10.2139/ssrn.2382332
Google, (2013). Google Analytics Cookie Usage on Websites. Retrieved from
https://developers.google.com/analytics/devguides/collection/analyticsjs/cookie-usage.
Ho, A. D., Reich, J., Nesterko, S. O., Seaton, D. T., Mullaney, T., Waldo, J., & Chuang, I. (2014).
HarvardX and MITx: The first year of open online courses (HarvardX and MITx Working Paper
No. 1). doi:10.2139/ssrn.2381263
Kizilcec, R. F., Piech, C., & Schneider, E. (2013). Deconstructing disengagement: Analyzing learner
subpopulations in Massive Open Online Courses. Third International Conference on Learning
Analytics and Knowledge, LAK’13, Leuven, Belgium
37
Koller, D., Ng, A., Do, C., & Chen, Z. (2013). Retention and intention in massive open online
courses. Educause Review, 62-63. Retrieved from
https://net.educause.edu/ir/library/pdf/ERM1337.pdf
MacWilliam, T., Aquino, R. J., & Malan, D. J. (2013). Engaging students through video: Integrating
assessment and instrumentation. 18th Annual Conference of the Northeast Region of the
Consortium for Computing Sciences in Colleges, Loudonville, New York.
Malan, David J. (2013). From cluster to cloud to appliance. 18th Annual ACM Conference on
Innovation and Technology in Computer Science Education, Canterbury, England, UK.
Rayyan, S., & Belcher, J. (2014). 8.02 TEAL x: Students Say “Yes” to MITx in 8.02 TEAL. MIT
Faculty Newsletter, pp. 12-14. Retrieved March 24, 2015, from
http://web.mit.edu/fnl/volume/272/fnl272.pdf
Reich, J., Nesterko, S., Seaton, D. T., Mullaney, T., Waldo, J., Chuang, I., & Ho, A. D. (2014) Health in
Numbers and Human Health and Global Environmental Change: 2012-2013. Harvard School
of Public Health Course Reports (HarvardX Working Paper No. 2).
Reich, J. (2014). MOOC Completion and Retention in the Context of Student Intent. Retrieved
December 12, 2014, from http://www.educause.edu/ero/article/mooc-completion-and-
retention-context-student-intent
Reich, J. (2015). Rebooting MOOC research. Science, 347 (6217), 34–5.
doi:10.1126/science.1261627
Seaton, D. T., Reich, J., Nesterko, S, Mullaney, T., Waldo, J., Ho, A., & Chuang, I. (2014). 3.091x
Introduction to Solid-State Chemistry. Fall 2012 MITx Course Report (MITx Working Paper
#2).
Seaton, D.T., Coleman, C., Daries, J., and Chuang, I. (2015) Enrollment in MITx MOOCs: Are We
Educating Educators? Retrieved from http://www.educause.edu/ero/article/enrollment-
mitx-moocs-are-we-educating-educators
Zhao, Y., & Ho, A. D. (2014). Evaluating the flipped classroom in an undergraduate history course
(HarvardX Research Memo).