Embed Size (px)
Citation preview


Harmonized World Soil Database (version 1.0) i
Harmonized World Soil Database
Version 1.0
Coordination Freddy Nachtergaele 1, Harrij van Velthuizen 2, Luc Verelst 2,
Contributors
Niels Batjes 3, Koos Dijkshoorn 3, Vincent van Engelen 3, Guenther Fischer 2, Arwyn Jones 5, Luca Montanarella 5, Monica Petri 1, Sylvia Prieler 2, Edmar Teixeira 2, David Wiberg 2
,Xuezheng Shi4
1 Food and Agriculture Organization of the United Nations (FAO), 2 International Institute for Applied Systems Analysis (IIASA), 3 ISRIC-World Soil Information ‘4 Institute of Soil Science – Chinese Academy of Sciences (ISSCAS), 5 Joint Research Centre of the European Commission (JRC)
DISCLAIMER
The designations employed and the presentation of materials in Harmonized World Soil Database do not imply the expression of any opinion whatsoever on the part of the Food and Agriculture Organization of the United Nations (FAO) the International Institute for Applied Systems Analysis (IIASA), ISRIC-World Soil Information, Institute of Soil Science – Chinese Academy of Sciences (ISSCAS) or Joint Research Centre of the European Commission (JRC) concerning the legal status of any country, territory, city or area or its authorities, or concerning the delimitation of its frontiers or boundaries.
© 2008 COPYRIGHT FAO, IIASA, ISRIC, ISSCAS, JRC
All rights reserved. No part of this Harmonized World Soil Database may be reproduced, stored in a retrieval system or transmitted by any means for resale or other commercial purposes without written permission of the copyright holders. Reproduction and dissemination of material in this information product for educational or other non-commercial purposes are authorized without any prior written permission from the copyright holders provided the source is fully acknowledged. Full acknowledgement and referencing of all sources must be included in any documentation using any of the material contained in the Harmonized World Soil Database, as follows:
FAO/IIASA/ISRIC/ISS-CAS/JRC, 2008. Harmonized World Soil Database (version 1.0). FAO, Rome, Italy and IIASA, Laxenburg, Austria.

Harmonized World Soil Database (version 1.0) ii
Foreword Soil information, from the global to the local scale, has often been the one missing biophysical information layer, the absence of which has added to the uncertainties of predicting potentials and constraints for food and fiber production. The lack of reliable and harmonized soil data has considerably hampered land degradation assessments, environmental impact studies and adapted sustainable land management interventions. Recognizing the urgent need for improved soil information worldwide, particularly in the context of the Climate Change Convention and the Kyoto Protocol for soil carbon measurements and the immediate requirement for the FAO/IIASA Global Agro-ecological Assessment study (GAEZ 2008), the Food and Agriculture Organization of the United Nations (FAO) and the International Institute for Applied Systems Analysis (IIASA) took the initiative of combining the recently collected vast volumes of regional and national updates of soil information with the information already contained within the 1:5,000,000 scale FAO-UNESCO Digital Soil Map of the World, into a new comprehensive Harmonized World Soil Database (HWSD).
This state-of-the-art database was achieved in partnership with:
• ISRIC-World Soil Information together with FAO, which were responsible for the development of regional soil and terrain databases and the WISE soil profile database;
• the European Soil Bureau Network, which had recently completed a major update of soil information for Europe and northern Eurasia, and
• the Institute of Soil Science, Chinese Academy of Sciences which provided the recent 1:1,000,000 scale Soil Map of China.
The completion of this comprehensive harmonized soil information database will improve estimation of current and future land potential productivity, help identify land and water limitations, and enhance assessing risks of land degradation, particularly soil erosion. The HWSD contributes sound scientific knowledge for planning sustainable expansion of agricultural production and for guiding policies to address emerging land competition issues concerning food production, bio-energy demand and threats to biodiversity. This is of critical importance for rational natural resource management and in making progress towards achieving Millennium Development goals of eradicating hunger and poverty and addressing the food security and sustainable agricultural development, especially with regard to the threats of global climate change and the needs for adaptation and mitigation. This digitized and online accessible soil information system will allow policy makers, planners and experts to overcome some of the shortfalls of data availability to address the old challenges of food production and food security and plan for new challenges of climate change and accelerated natural resources degradation. Alexander Julius Müller Sten Nilsson. Assistant Director General Acting Director Natural Resources Management and Environment Department
International Institute for Applied Systems Analysis
Food and Agriculture Organization of the United Nations FAO, Rome, June, 2008 IIASA, Laxenburg, June, 2008

Harmonized World Soil Database (version 1.0) iii
Harmonized World Soil Database
1. INTRODUCTION 1 2. THE HARMONIZED WORLD SOIL DATABASE 2 2.1 Source databases 2 2.2 Database Contents 3 2.3 Field descriptions 5 2.3.1 Soil Mapping Unit Identifiers 6 2.3.2 Soil unit naming 7 2.3.3 Soil Phases 8 2.3.4 Soil properties 11 3. HARMONIZATION OF THE DATABASES 16 3.1 The Attribute databases 16 3.1.1 Range checks 16 3.1.2 Missing Data 16 3.1.3 Recoding 16 3.1.4 Data measurement units 17 3.1.5 The SHARE and SEQUENCE fields 17 3.1.6 Sum of soil components 17 3.1.7 Link between attribute database and spatial data 17 3.2 Spatial data 18 I. ANNEX 1 CONTRIBUTING MAJOR DATABASES 20 I.1 The Soil Map of the World and the Soil and Terrain (SOTER) database developments 20 I.2 The European Soil Bureau Network and the Soil Geographical Database for Europe 21 1.3 Soil Map of China 21 1.4 Soil parameter data based on the World Inventory of Soil Emission Potential (WISE) database 22 II. ANNEX 2 SOIL UNITS 23 II.1 Soil Units in the Revised Legend of the Soil Map of the World (FAO90) 23 II.2 Soil Units used for the unified vector map 25 II.3 Soil Units in the Legend of the Soil Map of the World (FAO74) 26 III. ANNEX 3 USE OF THE HWSD IN GIS SOFTWARE 27 III.1 Technical specifications 27 III.2 Loading the data in ArcView and ArcGIS 28 IV. ANNEX 4: THE HWSD VIEWER 29 IV.1 Introduction 29 IV.2 System Requirements 29 IV.3 Installation 29 IV.4 First use of the Viewer 30 IV.5 Operation of the HWSD-V 30 IV.5.1 Basic operations 30 IV.5.2 Manipulating the Legend 31 IV.5.3 Adding shape file overlays 31 IV.6 Accessing attribute data 31 IV.7 The HWSD query Tool 33 IV.8 Preferences 33 IV.9 Loading other database versions 34 References 35

Harmonized World Soil Database (version 1.0) 1
Harmonized World Soil Database
1. INTRODUCTION In the context of a complete update of the global agro-ecological zones study, FAO and IIASA recognized that there was an urgent need to combine existing regional and national updates of soil information worldwide and incorporate these with the information contained within the 1:5 000 000 scale FAO-UNESCO Soil Map of the World (FAO, 1971-1981), which was in large parts no longer reflecting the actual state of the soil resources. In order to do this, partnerships were sought with the ISRIC – World Soil Information who had been largely responsible for the development of regional Soil and Terrain databases (Sombroek, 1984) and with the European Soil Bureau Network (ESBN) who had undertaken a major update of soil information for Europe and northern Eurasia in recent years (ESB, 2004). The incorporation of the 1:1,000,000 scale Soil Map of China (Shi et al., 2004) was an essential addition obtained through the cooperation with the Institute of Soil Science, Chinese Academy of Sciences. In order to estimate soil properties in a harmonized way, the use of actual soil profile data and the development of pedotransfer rules was undertaken in cooperation with ISRIC and ESBN drawing on the WISE soil profile database and earlier work of Batjes et al. (1997; 2002) and Van Ranst et al.(1995)..
The harmonization and data entry in a GIS was assured at the International Institute for Applied System Analysis (IIASA) and verification of the database was undertaken by all partners. As the product has as its main aim to be of practical use to modelers and is to serve perspective studies in agro-ecological zoning, food security and climate change impacts (among others) a resolution of about 1 km (30 arc seconds by 30 arc seconds) was selected1. Over 15000 different soil mapping units are recognized in the Harmonized World Soil Database (HWSD).
The resulting raster database consists of 21600 rows and 43200 columns, which are linked to harmonized attribute data. Use of a standardized structure allows linkage of the attribute data with GIS to display or query the composition in terms of soil units and the characterization of selected soil parameters (organic Carbon, pH, water storage capacity, soil depth, cation exchange capacity of the soil and the clay fraction, total exchangeable nutrients, lime and gypsum contents, sodium exchange percentage, salinity, textural class and granulometry).
Reliability of the information presented here is variable: the parts of the database that still make use of the Soil Map of the World such as North America, Australia, West Africa and South Asia are considered less reliable, while most of the areas covered by SOTER databases are considered to have the highest reliability (Southern Africa, Latin America and the Caribbean, Central and Eastern Europe).
Further expansion and update of the HWSD is foreseen for the near future, notably with the excellent databases held in the USA: Natural Resources Conservation Service US General Soil Map (STATSGO) http://www.ncgc.nrcs.usda.gov/products/datasets/statsgo, Canada: Agriculture and Agri-Food Canada: The National Soil Database (NSDB) http://sis.agr.gc.ca/cansis/nsdb and Australia: CSIRO, aclep, natural Heritage Trust and National Land and Water Resources Audit: ASRIS http://www.asris.csiro.au/index_other.html, and with the recently released SOTER database for Central Africa (FAO/ISRIC/University Gent, 2007).
The database content is discussed in Chapter 2 and the harmonization process in Chapter 3. Annex 1 gives a historical overview of the development of the Soil Map of the World, the Soil and Terrain Databases (SOTER), the Geographic Database for Europe, the Soil Map of China, and ISRIC-WISE database, while Annex 2 to 4 give detailed instructions on how to use the GIS software and the viewer. 1 Note: Original data were mapped respectively at scales of 1:5,000,000 for the Soil Map of the World and between 1:1,000,000 and 1:5,000,000 for the various SOTER regional studies and 1:1,000,000 the European Soil Map and the Soil Map of China. The pixel size has been selected to ensure compatibility with important inventories such as the slope and aspect database (based on 90 m resolution SRTM data) and GLC 2000/2005 land cover data available at 30 arc seconds. The HWSD by necessity presents therefore multiple grid cells with identical attributes occurring in individual soil mapping units as provided on the original vector maps.

Harmonized World Soil Database (version 1.0) 2
2. THE HARMONIZED WORLD SOIL DATABASE This section provides information on the contents of the Harmonized World Soil Database, the sources of the individual datasets and a technical description.
2.1 Source databases
Four source databases were used to compile version 1.0 of the HWSD: the European Soil Database (ESDB), the 1:1 million soil map of China, various regional SOTER databases (SOTWIS Database), and the Soil Map of the World.
The complete list of maps/databases used is as follows:
Soil Map of the World: − FAO 1995, 2003. The Digitized Soil Map of the World Including Derived Soil Properties
(version 3.5). FAO Land and Water Digital Media Series # 1. FAO, Rome. − FAO 1971-1981. The FAO-UNESCO Soil Map of the World. Legend and 9 volumes.
UNESCO, Paris.
SOTER regional studies − FAO, IGADD/ Italian Cooperation 1998. Soil and terrain database for northeastern Africa and
Crop production zones. Land and Water Digital Media Series # 2. FAO, Rome. − FAO/IIASA/Dokuchaiev Institute/Academia Sinica 1999. Soil and Terrain database for north
and central Eurasia at 1:5 million scale. FAO Land and Water Digital Media series 7. FAO, Rome.
− FAO/UNEP/ISRIC/CIP 1998. Soil and terrain digital database for Latin America a and the Caribbean at 1:5 Million scale. FAO Land and Water Digital Media series # 5. FAO, Rome.
− FAO/ISRIC 2000: Soil and Terrain Database, Land Degradation Status and Soil Vulnerability Assessment for Central and Eastern Europe (1:2.500.000). Land and Water Digital Media Series # 10. FAO, Rome.
− FAO/ISRIC 2003: Soil and Terrain Database for Southern Africa. Land and Water Digital Media Series # 26. FAO, Rome.
The European Soil Database
− European Commission- JRC - Institute for Environment and Sustainability, European Soil Bureau European Soil Database (vs 2.0) (ESBN, 2004).
− Agriculture and Agri-food Canada, USDA-NRCS, Dokuchaev Institute: Northern Circumpolar Soil Map and database with dominant soil characteristics, at a scale of 1:10,000,000 (Tarnocai et al., 2002).
The Soil Map of China 1:1 Million scale − Chinese Academy of Sciences – The Soil Map of China is based on data of the office for the
Second National Soil Survey of China (1995) and distributed by the Institute of Soil Science in Nanjing (Shi et al., 2004).
Soil parameter estimates based on the World Inventory of Soil Emission Potential (WISE) database – Version 2.0 of the WISE database, comprising 9607 profiles, has been used to derive topsoil
and subsoil parameters using uniform taxonomy-based pedotransfer (taxotransfer) rules (Batjes et al, 1997; Batjes, 2002). Similarly, soil parameter estimates for all secondary SOTER databases (SOTWIS) were derived using consistent procedures as detailed in Batjes et al. (2007) and Van Engelen et al. (2005).
The derived soil properties presented with the HWSD have been derived from analyzed profile data obtained from a wide range of countries and sources. The global distribution of these profiles is uneven and there are often gaps in the measured data. Similarly, differences in landform, parent

Harmonized World Soil Database (version 1.0) 3
material, land use history, natural vegetation, and time of sampling were often not described explicitly in the source materials.
Generalization of measured soil attribute data by soil unit, textural class and depth zone — to permit linkage with the map units shown on the HWSD — involves the transformation of variables that show a marked spatial and temporal variability. These variables have been determined in many laboratories according to various methods and these methods are not necessarily comparable (e.g. Breuning-Madsen and Jones 1998; FAO-Unesco 1981; Pleijsier 1989; van Reeuwijk 1983; Vogel 1994). This lack of compatibility between the analytical data collected for the various soil units of the world can be overcome in various ways. For this study, this has been done using pragmatic approaches that are considered commensurate with the global scale of the HWSD (e.g. Batjes et al. 2007; Batjes et al., 1997; FAO 1995; Van Ranst 1995). Differences in detail and quality of primary soil information available for the various regions of the World, as described elsewhere in this report, resulted in a variable resolution of the products presented here. More detailed comparability studies will be needed when more detailed scientific work is considered.
2.2 Database Contents The HWSD is composed of a GIS raster image file linked to an attribute database in Microsoft Access format. While these two components are separate data files, they can be linked through a commercial GIS system. A viewer provided with the database creates this link automatically and provides direct access to the two data sources; details are given in Annex 4.
The HWSD attribute database provides information on the soil unit composition for each of the 15773 soil mapping units. The database shows the composition of each soil mapping unit, and standardized soil parameters for top- and subsoil. A soil mapping unit can have up to 9 soil unit/topsoil texture combination records in the database.
The core fields for identifying a soil mapping unit are:
− MU_GLOBAL - the harmonized soil mapping unit identifier of HWSD providing the link to the GIS layer;
− MU_SOURCE1 and MU_SOURCE2- the mapping unit identifiers in the source database; − SEQ – the sequence of the soil unit in the soil mapping unit composition; − SHARE - % of the soil unit/topsoil texture combination in the soil mapping unit; and the − Soil unit symbol using the FAO-74 classification system or the FAO-90 classification system
(SU_SYM74 resp. SU_SYM90) or FAO-85 interim system (SU_SYM85).
The tables below illustrate the full contents of the database, and the Section 2.3 provides full details on each of these database fields.
There are three blocks of data:
− General information on the soil mapping unit composition; − Information related to phases; − Physical and chemical characteristics of topsoil (0-30 cm) and subsoil (30-100 cm).
Field Description UNITS DSMW SOTWIS China ESDB ID Database ID code √ √ √ √ MU_GLOBAL Soil Unit Identifier (global) code √ √ √ √ MU_SOURCE1 Soil Unit Identifier 1 (source database) code √ √ √ √ MU_SOURCE2 Soil Unit Identifier 2 (source database) code √ COVERAGE Coverage code √ √ √ √ ISSOIL Soil or non-soil unit number √ √ √ √ SEQ Sequence number √ √ √ √ SHARE Share in Soil Mapping Unit % √ √ √ √ SU_SYMBOL Soil Mapping Unit Symbol symbol √ √ √ √ SU_SYM74 Soil Unit Symbol (FAO-74) symbol √
Gen
eral
SU_SYM85 Soil Unit Symbol (FAO-85) symbol √

Harmonized World Soil Database (version 1.0) 4
SU_SYM90 Soil Unit Symbol (FAO-90) symbol √ √ √ SU_CODE Soil Mapping Unit Code code √ √ √ √ SU_CODE74 Soil Unit Name (FAO-74) code √ SU_CODE85 Soil Unit Symbol (FAO-85) code √ SU_CODE90 Soil Unit Symbol (FAO-90) code √ √ √ T_TEXTURE Topsoil Texture code √ √ REF_DEPTH Reference Soil Depth code √ √ √ √ DRAINAGE Drainage class code √ √ √ √
AWC_CLASS AWC Range code √ √ √ √ PHASE1 PHASE1 code √ √ √ √ PHASE2 PHASE2 code √ √ √ √ ROOTS Obstacles to Roots (ESDB) code √ IL Impermeable Layer (ESDB) code √ SWR Soil Water Regime (ESDB) code √ Ph
ases
and
ad
ditio
nal
prop
ertie
s
ADD_PROP Other properties (gelic, vertic, petric) code √ √ √ √
Field Description UNITS DSMW SOTWIS CHINA ESDB T_GRAVEL Topsoil Gravel Content %vol. √ √ √ √ T_SAND Topsoil Sand Fraction % wt. √ √ √ √ T_SILT Topsoil Silt Fraction % wt. √ √ √ √ T_CLAY Topsoil Clay Fraction % wt. √ √ √ √
T_USDA_TEX_CLASS Topsoil USDA Texture Classification name √ √ √ √
T_REF_BULK_DENSITY Topsoil Reference Bulk Density kg/dm3 √ √ √ √
T_OC Topsoil Organic Carbon % weight √ √ √ √ T_PH_H2O Topsoil pH (H2O) -log(H+) √ √ √ √ T_CEC_CLAY Topsoil CEC (clay) cmol/kg √ √ √ √ T_CEC_SOIL Topsoil CEC (soil) cmol/kg √ √ √ √ T_BS Topsoil Base Saturation % √ √ √ √ T_TEB Topsoil TEB cmol/kg √ √ √ √ T_CACO3 Topsoil Calcium Carbonate % weight √ √ √ √ T_CASO4 Topsoil Gypsum % weight √ √ √ √ T_ESP Topsoil Sodicity (ESP) % √ √ √ √
Top
Soi
l inf
orm
atio
n
T_ECE Topsoil Salinity (ECe) dS/m √ √ √ √ S_GRAVEL Subsoil Gravel Content %vol. √ √ √ √ S_SAND Subsoil Sand Fraction % wt. √ √ √ √ S_SILT Subsoil Silt Fraction % wt. √ √ √ √ S_CLAY Subsoil Clay Fraction % wt. √ √ √ √
S_USDA_TEX_CLASS Subsoil USDA Texture Classification Name √ √ √ √
S_REF_BULK_DENSITY Subsoil Reference Bulk Density kg/dm3 √ √ √ √
S_OC Subsoil Organic Carbon % weight √ √ √ √ S_PH_H2O Subsoil pH (H2O) -log(H+) √ √ √ √ S_CEC_CLAY Subsoil CEC (clay) cmol/kg √ √ √ √ S_CEC_SOIL Subsoil CEC (soil) cmol/kg √ √ √ √ S_BS Subsoil Base Saturation % √ √ √ √ S_TEB Subsoil TEB cmol/kg √ √ √ √ S_CACO3 Subsoil Calcium Carbonate % weight √ √ √ √ S_CASO4 Subsoil Gypsum % weight √ √ √ √ S_ESP Subsoil Sodicity (ESP) % √ √ √ √
Phys
ico-
chem
ical
pro
pert
ies
Sub
Soil
Info
rmat
ion
S_ECE Subsoil Salinity (ECe) dS/m √ √ √ √

Harmonized World Soil Database (version 1.0) 5
2.3 Field descriptions
This section explains the content of the fields in the database. It describes the procedures used to correlate the various source data in order to obtain the harmonized database.
The DSMW, China and ESDB mapping unit information has been linked to respectively topsoil and subsoil parameters derived from the World Inventory of Soil Emissions (WISE) soil profile database (Batjes et al., 1997 and Batjes, 2002). The linkage was established through either the FAO-74 (DSMW) or the FAO-90 (China and ESDB) soil unit symbol by three topsoil texture classes (i.e., coarse, medium and fine) as provided in the mapping unit information in each of the three original databases. The SOTER-derived part of the database, referred to here as SOTWIS databases includes, soil parameter estimates for five standard depths (0–20 cm, 20–40cm, 40–60 cm, 60–80 cm and 80– 100cm) and five soil textural classes (coarse, medium, medium fine, fine and very fine (see Finke et al. pg. 79 CEC, (1985)) (Batjes 2003, Van Engelen et al, 2005); these values were later converted to standard depths of 0–30 cm and 30–100 cm at IIASA2
The WISE database has been used to prepare two separate sets of parameter estimates, i.e. based on the FAO-74 and FAO-90 soil classification respectively. For a large part of the ESBD map, soil unit correlations with FAO-90 were available. Where correlations with FAO-90 were missing or not available, FAO and IIASA staff, on the basis of soil characteristics and other available classifications (FAO-85 and WRB) have completed correlations with FAO-903. For the soil map of China (1:1 million) systematic soil correlations with both FAO-74 and FAO-90 classifications were unavailable. On the basis of available soil profile data (in Chinese language), Prof. Lin Pei and his colleagues of the China Agricultural University and the Ministry of Natural Resources have produced a tentative correlation of the 935 soil units and soil phases used on the soil map of China to the FAO-90 classification4 Topsoil textural class, as required for linkage with the WISE-derived data, was also provided.
(i) In view of the existence of a detailed China soil profile database, containing 7292 individual soil profile datasets produced by Institute of Soil Science, CAS, it is recommended to convert the China soil profile database, annex soil map, in a SOTER-compatible format for use in HWSD once the database is made available for such use.
(ii) ESDB itself contains most of the parameters considered in HWSD. It is recommended to generate a HWSD-compatible database of soil parameters on the basis of available soil profile information. Or better to compile a SOTWIS-like database with individual sets of soil parameters by soil typological unit in each soil mapping unit.
2.3.1 Soil Mapping Unit Identifiers
ID (Identifier)
(i) 2 In the applications for the FAO/IIASA AEZ model, the original five depth classes (0–20cm, 20–
40 cm, 40–60 cm, 60–80 cm and 80–100 cm) and five textural classes in SOTWIS (Batjes, 2003) have been simplified to two depth classes (0–30cm and 30–100cm) and three textural classes by calculating depth-weighted averages. This simplification was required to enable the harmonization with the less precise information contained in the other databases used.
In soil evaluation for agricultural purposes at country, regional or global scales as applied in the FAO/IIASA AEZ model, preference is given to the two depth classes system as was used for WISE (Batjes et al, 1997 and Batjes, 2002). For other applications the use of more precise depth and textural classes as provided in SOTWIS are considered preferable. 3 The correlations of the FAO-85 classification with FAO-90 are subject to review by JRC; updates to be considered for a next version of HWSD. 4 The correlations of the GSCC: genetic soil classification of China with FAO-90 are subject to review by Institute of Soil Science, Chinese Academy of Sciences (ISSCAS); updates to be considered for a next version of HWSD.

Harmonized World Soil Database (version 1.0) 6
Internal unique indexed database identifier (4-byte integer)
MU_GLOBAL (Global Mapping Unit Identifier)
The Global Mapping Unit identifier (4-byte integer) provides the link between the GIS layer and the attribute database.
MU_SOURCE1 (Source Database Mapping Unit Identifier)
This alphanumerical field stores the main mapping unit identifier from the source database, as shown below:
Source MU_SOURCE1 ESDB Soil Mapping Unit (SMU) China Mapping Unit Code SOTWIS NEWSUID (ISO code + SUID) DSMW Mapping Unit Code
MU_SOURCE2 (Source Database Mapping Unit Identifier)
This second (4-byte numerical) identifier may be used to accommodate a second unit identifier in the source database; it has been populated with the STU from ESDB only.
Source MU_SOURCE2 ESDB Soil Typological Unit (STU) China <null> SOTWIS <null> DSMW <null>
COVERAGE (Source database)
This field stores the source of the record. CODE COVERAGE 1 ESDB 2 CHINA 3 SOTWIS 4 DSMW 0 None
The value 0 is used for land units which are currently not covered by any of the soil databases (mainly very small islands).
ISSOIL (Flag for non-soil units)
Field indicating if the soil mapping unit is a soil or a non-soil. CODE ISSOIL 0 Non-soil unit 1 Soil
SEQ (Sequence within the mapping unit)
The sequence in which soil units within the soil mapping unit are presented follow the rule that the dominant soil always has sequence 1. The sequence can range between 1 and 9.

Harmonized World Soil Database (version 1.0) 7
SHARE (Share of the soil unit)
Share of the soil unit within the mapping unit in %. Shares of component soil units5 of a mapping unit always sum up to 100%.
2.3.2 Soil unit naming SU_SYMBOL
This symbol stands for the spatially dominant major soil group. It is used here for thematic mapping purposes to show the ‘main’ HWSD soil groups in the viewer. FAO-74 soil units have been correlated with FAO-90 units in order to have a unique coding system for the main soil unit for each mapping unit in the database; the soil unit codes are given in Annex 2.
SU_SYM74
This is the soil unit symbol according to the FAO-74 soil classification, as used for the DSMW coverage; see annex 2 and for further details, http://www.fao.org/landandwater/agll/key2soil.stm and the legend of the Soil Map of the World (FAO/Unesco, 1974)
SU_SYM85
This is the soil unit symbol according to the FAO-85 interim soil classification which is used for the ESDB coverage; see http://eusoils.jrc.it/ESDB_Archive/ESDBv3/legend/LegendData.cfm. . This system was intermediate between the FAO-74 Legend (see above) and the FAO-90 Revised Legend (see below). The parts of the ESDB where correlations with FAO 90 are lacking, the SU-SYM85 has tentatively been correlated to SU_SYM90.
SU_SYM90
This is the soil unit symbol according to the FAO-90 soil classification, which was used here for the ESDB, China and SOTWIS coverage.; see Annex 2 and for further details the Revised Legend of the FAO/Unesco Soil Map of the World in FAO World Soil Resources Report 60 (FAO/Unesco/ISRIC, 1990) SU_CODE
The numerical code for the major soil group (FAO-90), used for the HWSD.
SU_CODE74
The numerical code for the FAO-74 soil classification system.
SU_CODE85
The numerical code for the FAO-85 soil classification system.
SU_CODE90
The numerical code for the FAO-90 soil classification system.
T_TEXTURE (Topsoil texture class)
Topsoil textural class refers to the simplified textural classes for 0–30cm used in the Soil Map of the World (FAO/Unesco, 1970-1980). Because of the scale of the map (1:5 million) only three simplified textural classes were used.
Coarse textured: sands, loamy sands and sandy loams with less than 18 percent clay and more than 65 percent sand.
5 Shares of component soil units within a soil mapping unit may occupy less than 5%. Such “false accuracy” occurs in less than 0.5% of the HWSD mapping units (228 out of 47094 records of which 217 records occur in the Soil Map of Europe, 8 records in the Soil Map of the World and 3 records in SOTWIS. Subject to revision of the mapping unit compositions of these individual component databases of HWSD, an update will be considered in a next version of HWSD.

Harmonized World Soil Database (version 1.0) 8
Medium textured: sandy loams, loams, sandy clay loams, silt loams, silt, silty clay loams and clay loams with less than 35 % clay and less than 65 % sand; the sand fraction may be as high as 82 percent if a minimum of 18 percent of clay is present.
Fine textured: clays, silty clays, sandy clays, clay loams and silty clay loams with more than 35 percent clay.
CODE T_TEXTURE 0 None 1 Coarse 2 Medium 3 Fine
REF_DEPTH Reference depth of the soil unit. Reference soil depth of all soil units are set at 100 cm, except for Rendzinas and Rankers of FAO-74 and Leptosols of FAO-90, where the reference soil depth is set at 30 cm, and for Lithosols of FAO-74 and Lithic Leptosols of FAO-90, where it is set at 10 cm6. An approximation of actual soil depth can be derived through accounting for relevant depth limiting soil phases, obstacles to roots and occurrence of impermeable layers (the latter two refer to ESDB only).
AWC
Available water storage capacity in mm/m of the soil unit
For the soil units of the Soil Map of the World (FAO-74) and for the revised legend (FAO-90), FAO has developed procedures for the estimation of Available Water Capacity in mm/m (AWC) (FAO,1995). The AWC classes have been estimated for all soil units of both FAO classifications accounting for topsoil textural class and depth/volume limiting soil phases.
The following AWC classes are used Class AWC 1 150 mm/m 2 125 mm/m 3 100 mm/m 4 75 mm/m 5 50 mm/m 6 15 mm/m 7 0 mm/m
2.3.3. Soil Phases PHASE1 – PHASE2
Phases are subdivisions of soil units based on characteristics which are significant for the use or management of the land but are not diagnostic for the separation of the soil units themselves. Phases numbered 1 to 12 were used in the Soil Map of the World (FAO-74), phases 13 to 22 were used in association with the Revised Legend of the Soil Map of the World (FAO-90), while phases 23 to 30 are specific for the European Soil Database.
Stony phase: Marks areas where the presence of gravel, stones, boulders or rock outcrops in the surface layers or at the surface makes the use of mechanized agricultural equipment impracticable. Hand tools can normally be used and also simple mechanical equipment if other conditions are particularly favorable. Fragments up to 7.5 cm are considered as gravel; larger fragments are called stones and boulders.
Lithic phase: This phase is used when continuous coherent and hard rock occurs within 50cm of the soil surface. For Leptosols the lithic phase is not shown as it is implied in the soil unit name.
6 For all soils with restricted reference soil depth in the HWSD, the soil parameters are provided for topsoil (0–30 cm) only, except for Lithosols and Lithic Leptosols (0–10 cm).

Harmonized World Soil Database (version 1.0) 9
Petric phase: The petric phase marks soils with a layer consisting of 40 percent or more, by volume, of oxidic concretions or of hardened plinthite, or ironstone or other coarse fragments with a thickness of at least 25 cm, the upper part of which occurs within 100 cm of the surface. The petric phase differs from the petroferric phase in that the concretionary layer of the petric phase is not cemented.
Petrocalcic phase: Marks soils in which the upper part of a petrocalcic horizon (> 40% lime, cemented, usually thicker than 10cm) occurs within 100 cm of the surface.
Petrogypsic phase: Used for soils in which the upper part of a petrogypsic horizon (> 60% gypsum, cemented, usually thicker than 10cm) occurs within 100 cm of the surface.
Petroferric phase: The petroferric phase [etc., avoid repetition] marks soils in which the upper part of the petroferric horizon occurs within 100 cm from the soil surface. A petroferric horizon is a continuous layer of indurated material in which iron is an important cement and organic matter is absent.
Phreatic phase: The phreatic phase marks soils which have a groundwater table between 3 and 5 meters from the surface.
Fragipan phase: The fragipan phase marks soils which have the upper level of the fragipan occurring within 100 cm of the surface. The fragipan is a loamy subsurface horizon with a high bulk density relatively to the horizon above it. It is hard or very hard and seemingly cemented when dry. Dry fragments slake or fracture in water. A fragipan is low in organic matter and is only slowly permeable.
Duripan phase: The duripan phase marks soils in which the upper level of a duripan occurs within 100 cm of the soil surface. A duripan is a subsurface horizon that is cemented by silica and contains often accessory cements mainly iron oxides or calcium carbonate.
Saline phase: The saline phase marks soils in which in some horizons within 100 cm of the soil surface show electric conductivity values higher than 4 dS m-1. The saline phase is not shown for Solonchaks because their definition implies a high salt content.
Sodic phase: The sodic phase marks soils which have more than 6 percent saturation with exchangeable sodium in some horizons within 100 cm of the soil surface. The sodic phase is not shown for Solonetz because their definition implies a high ESP.
Cerrado phase: Cerrado is the Brazilian name for level open country of tropical savannas composed of tall grasses and low contorted trees. This type of vegetation is closely related to the occurrence of strongly depleted soils on old land surfaces.
Anthraquic phase: The anthraquic phase marks soils showing stagnic properties within 50 cm of the surface due to surface water logging associated with long continued irrigation, particularly of rice.
Gelundic phase: The gelundic phase marks soils showing formation of polygons on their surface due to frost heaving.
Gilgai phase: Gilgai is a microrelief typical of clayey soils, mainly Vertisols. The microrelief consists of either a succession of enclosed micro-basins and micro-knolls in nearly level areas, or of micro-valleys and micro-ridges that run up and down the slope.
Inundic phase: The inundic phase is used when standing or flowing water is present on the soil surface for more than 10 days during the growing period.
Placic phase: The placic phase refers to the presence of a thin iron pan, a black to dark reddish layer cemented by iron with manganese or organic matter. Its thickness varies from 2 to 10 mm.
Rudic phase: The rudic phase marks areas where the presence of gravel, stones, boulders or rock outcrops in the surface layers or at the surface makes the use of mechanized agricultural equipment impracticable.
Skeletic phase: The skeletic phase refers to soil material which contains more than 40 percent coarse fragments or oxidic concretions.

Harmonized World Soil Database (version 1.0) 10
Takyric phase: The takyric phase applies to heavy textured soils with cracks into plolygonal elements that form a platy or massive surface crust.
Yermic phase: The yermic phase applies to soils which are low in organic carbon and have features associated with deserts or very arid conditions (desert varnish, presence of palygorskyte, cracks filled with sand, presence of blown sands on a stable surface.
Gravelly: The gravelly phase is used in ESDB and indicates over 35% gravels with diameter < 7.5 cm.
Concretionary: The concretionary phase is used in ESDB and indicates over 35% concretions, diameter < 7.5 cm near the surface.
Glaciers: Permanent snow covered areas and glaciers.
Soils disturbed by man: Areas filled artificially with earth, trash, or both, occur most commonly in and around urban areas.
Two phases can be listed for each soil unit, in order or importance: Code Phase Code Phase 0 No phase (only in ESDB) 16 Inundic 1 Stony 17 Placic 2 Lithic 18 Rudic 3 Petric 19 Salic 4 Petrocalcic 20 Skeletic 5 Petrogypsic 21 Takyric 6 Petroferric 22 Yermic 7 Phreatic 23 Erosion 8 Fragipan 24 No limitation to agricultural use 9 Duripan 25 Gravelly 10 Saline 26 Concretionary 11 Sodic 27 Glaciers 12 Cerrado 28 Soils disturbed by man 13 Anthraquic 29 Excessively drained (set to 0) 14 Gelundic 30 Flooded 15 Gigai
ROOTS (Obstacle to Roots): Provides the depth class of an obstacle to roots within the STU. Code Obstacle to roots (ROO) 0 No information 1 No obstacle to roots between 0 and 80 cm 2 Obstacle to roots between 60 and 80 cm depth 3 Obstacle to roots between 40 and 60 cm depth 4 Obstacle to roots between 20 and 40 cm depth 5 Obstacle to roots between 0 and 80 cm depth 6 Obstacle to roots between 0 and 20 cm depth
IL (Impermeable Layer): Indicates the presence of an impermeable layer within the soil profile of the STU. The code is only available in ESDB.
Code Impermeable Layer (IL) 0 No information 1 No impermeable within 150 cm 2 Impermeable between 80 and 150 cm 3 Impermeable between 40 and 80 cm 4 Impermeable within 40 cm
SWR (Soil Water regime): Indicates the dominant annual average soil water regime class of the soil profile of the STU. The code is only available in ESDB.
Code Soil Water regime (WR) 0 No information 1 Not wet within 80 cm for over 3 months, nor wet within 40 cm for over 1 month 2 Wet within 80 cm for 3 to 6 months, but not wet within 40 cm for over 1 month 3 Wet within 80 cm over 6 months, but not wet within 40 cm for over 11 month 4 Wet within 40 cm depth for over 11 month
Harmonized World Soil Database (version 1.0) 11
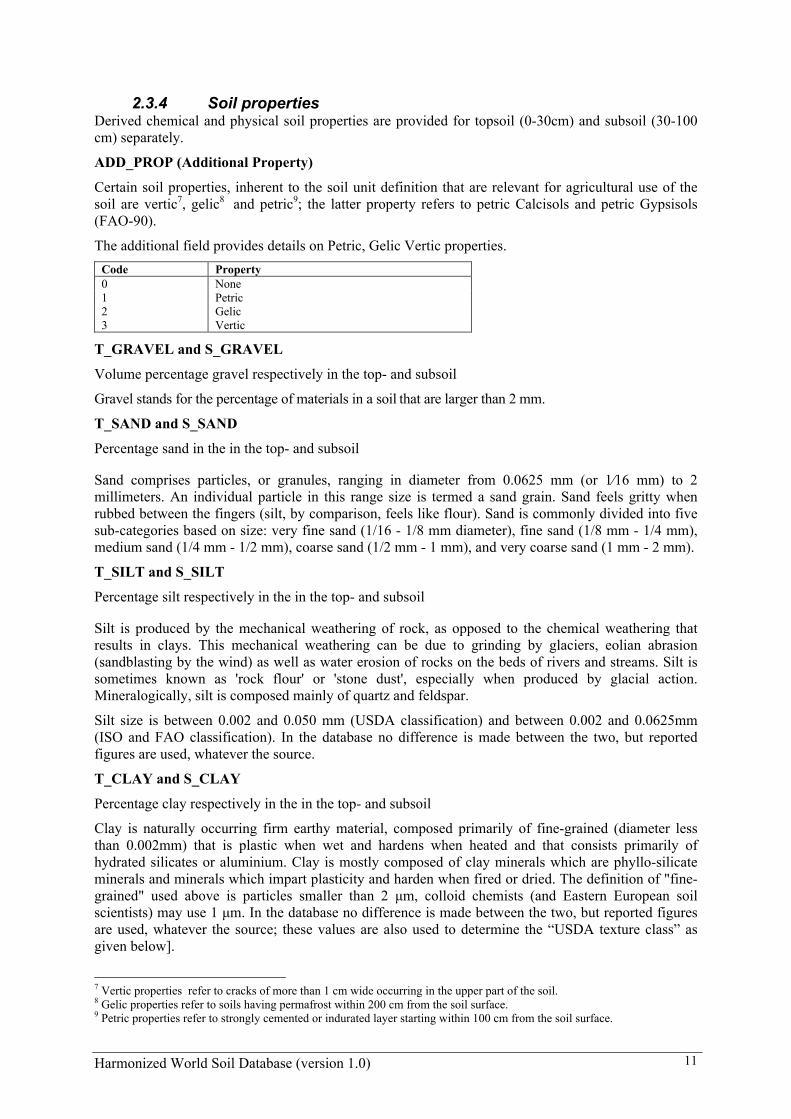
2.3.4 Soil properties Derived chemical and physical soil properties are provided for topsoil (0-30cm) and subsoil (30-100 cm) separately.
ADD_PROP (Additional Property)
Certain soil properties, inherent to the soil unit definition that are relevant for agricultural use of the soil are vertic7, gelic8 and petric9; the latter property refers to petric Calcisols and petric Gypsisols (FAO-90).
The additional field provides details on Petric, Gelic Vertic properties. Code Property 0 None 1 Petric 2 Gelic 3 Vertic
T_GRAVEL and S_GRAVEL
Volume percentage gravel respectively in the top- and subsoil
Gravel stands for the percentage of materials in a soil that are larger than 2 mm.
T_SAND and S_SAND
Percentage sand in the in the top- and subsoil
Sand comprises particles, or granules, ranging in diameter from 0.0625 mm (or 1⁄16 mm) to 2 millimeters. An individual particle in this range size is termed a sand grain. Sand feels gritty when rubbed between the fingers (silt, by comparison, feels like flour). Sand is commonly divided into five sub-categories based on size: very fine sand (1/16 - 1/8 mm diameter), fine sand (1/8 mm - 1/4 mm), medium sand (1/4 mm - 1/2 mm), coarse sand (1/2 mm - 1 mm), and very coarse sand (1 mm - 2 mm).
T_SILT and S_SILT
Percentage silt respectively in the in the top- and subsoil
Silt is produced by the mechanical weathering of rock, as opposed to the chemical weathering that results in clays. This mechanical weathering can be due to grinding by glaciers, eolian abrasion (sandblasting by the wind) as well as water erosion of rocks on the beds of rivers and streams. Silt is sometimes known as 'rock flour' or 'stone dust', especially when produced by glacial action. Mineralogically, silt is composed mainly of quartz and feldspar.
Silt size is between 0.002 and 0.050 mm (USDA classification) and between 0.002 and 0.0625mm (ISO and FAO classification). In the database no difference is made between the two, but reported figures are used, whatever the source.
T_CLAY and S_CLAY
Percentage clay respectively in the in the top- and subsoil
Clay is naturally occurring firm earthy material, composed primarily of fine-grained (diameter less than 0.002mm) that is plastic when wet and hardens when heated and that consists primarily of hydrated silicates or aluminium. Clay is mostly composed of clay minerals which are phyllo-silicate minerals and minerals which impart plasticity and harden when fired or dried. The definition of "fine-grained" used above is particles smaller than 2 µm, colloid chemists (and Eastern European soil scientists) may use 1 µm. In the database no difference is made between the two, but reported figures are used, whatever the source; these values are also used to determine the “USDA texture class” as given below].
7 Vertic properties refer to cracks of more than 1 cm wide occurring in the upper part of the soil. 8 Gelic properties refer to soils having permafrost within 200 cm from the soil surface. 9 Petric properties refer to strongly cemented or indurated layer starting within 100 cm from the soil surface.
Harmonized World Soil Database (version 1.0) 12
T_USDA_TEX_ CLASS and S_USDA_TEX_CLASS
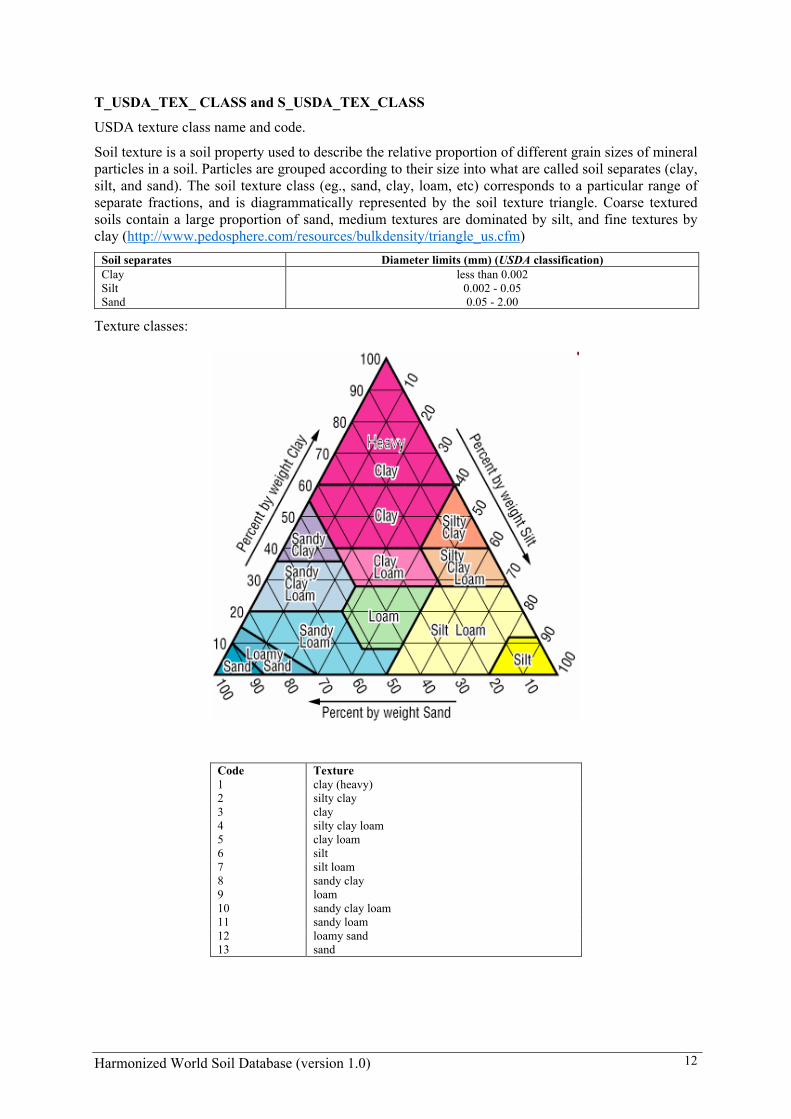
USDA texture class name and code.
Soil texture is a soil property used to describe the relative proportion of different grain sizes of mineral particles in a soil. Particles are grouped according to their size into what are called soil separates (clay, silt, and sand). The soil texture class (eg., sand, clay, loam, etc) corresponds to a particular range of separate fractions, and is diagrammatically represented by the soil texture triangle. Coarse textured soils contain a large proportion of sand, medium textures are dominated by silt, and fine textures by clay (http://www.pedosphere.com/resources/bulkdensity/triangle_us.cfm)
Soil separates Diameter limits (mm) (USDA classification) Clay less than 0.002 Silt 0.002 - 0.05 Sand 0.05 - 2.00
Texture classes:
Code Texture 1 clay (heavy) 2 silty clay 3 clay 4 silty clay loam 5 clay loam 6 silt 7 silt loam 8 sandy clay 9 loam 10 sandy clay loam 11 sandy loam 12 loamy sand 13 sand

Harmonized World Soil Database (version 1.0) 13
T_REF_BULK_DENSITY and S_REF_BULK_DENSITY
Reference Bulk Density of top- and subsoil10.
Reference bulk density is a property of particulate materials. It is the mass of many particles of the material divided by the volume they occupy. The volume includes the space between particles as well as the space inside the pores of individual particles. The calculation procedures for reference bulk density can be found at http://www.pedosphere.com/resources/bulkdensity/index.html.
T_OC and S_OC
This field gives the percentage of organic carbon in top- and subsoil.
Organic Carbon is together with pH, the best simple indicator of the health status of the soil. Moderate to high amounts of organic carbon are associated with fertile soils with a good structure.
Soils that are very poor in organic carbon (<0.2%), invariable need organic or inorganic fertilizer application to be productive. Soils with an organic matter content of less than 0.6% are considered poor in organic matter. The following classes are suggested to prepare maps of organic carbon status for mineral soils:
Code Percentage organic carbon 1 < 0.2 2 0.2 – 0.6 3 0.6 – 1.2 4 1.2 – 2.0 5 > 2.0
T_PH_H2O and S_PH_H2O
This field gives the soil reaction of top- and subsoil.
pH, measured in a soil-water solution, is a measure for the acidity and alkalinity of the soil. Five major pH classes are considered here that have specific agronomic significance:
pH < 4.5 Extremely acid soils include Acid Sulfate Soils (Mangrove soils, cat clays). Do not drain because by oxidation sulfuric acid will be produced and pH will drop lower still.
pH 4.5 – 5.5 Very acid soils suffering often from Al toxicity. Some crops are tolerant for these conditions (Tea, Pineapple).
pH 5.5 –7.2 Acid to neutral soils: these are the best pH conditions for nutrient availability and suitable for most crops.
pH 7.2 – 8.5 These pH values are indicative of carbonate rich soils. Depending on the form and concentration of calcium carbonate they may result in well structured soils which may however have depth limitations when the calcium carbonate hardens in an impermeable layer and chemically forms less available carbonates affecting nutrient availability (Phosphorus, Iron).
pH > 8.5 Indicates alkaline soils often highly sodic (Na reaching toxic levels), badly structured (columnar structure) and easily dispersed surface clays.
T_CEC_CLAY and S_CEC_CLAY
This field gives the cation exchange capacity of the clay fraction in top- and subsoil.
The type of clay mineral dominantly present in the soil is often characterizes a specific set of pedogenetic factors in which the soil has developed. Tropical, leaching climates produce the clay mineral kaolinite, while confined conditions rich in Ca and Mg in climates with a pronounced dry season encourage the formation of the clay mineral smectite (montmorillonite).
10 Bulk density, as a soil characteristic, is a function rather than a single value (USDA-NRCS, 2004 #3078, p. 73) as it is highly dependent on soil conditions at the time of sampling: changes in (field) water content will alter bulk density. The SOTWIS database provides estimates of bulk density values derived from available analyzed data, and thus consider differences in soil texture, organic matter content and porosity. Careful review of these values also by comparison with calculated reference bulk densities has revealed substantial differences. For reasons of data quality and consistency of the HWSD, reference bulk density values – calculated using equations developed by Saxton et al. (1986), have been used here: these equations represent a statistical estimate and reflect only the textural influence.
Harmonized World Soil Database (version 1.0) 14
Clay minerals have typical exchange capacities, with kaolinites generally having the lowest at less than 16 cmol kg-1, while smectites have one of the highest with a CEC per 100g clay being 80 cmol kg-1, or more. The classes generally used are.
1 <20 cmol kg-1 clay (kaolinite dominant) 2 20-50 cmol kg-1 clay (mixed with kaolinite present) 3 >50-100 cmol kg-1 clay (mixed, illite) 4 >100 cmol kg-1 clay (montmorillonite)*
* Soils developed on volcanic materials rich in amorphous sesquioxides may have very higher values (over 150 cmol kg-1)
T_CEC_SOIL and S_CEC_SOIL
This field gives the cation exchange capacity in top- and subsoil.
The total nutrient fixing capacity of a soil is well expressed by its Cation Exchange Capacity. Soils with low CEC have little resilience and can not build up stores of nutrients. Many sandy soils have CEC less than 4 cmol kg-1. The clay content, the clay type and the organic matter content all determine the total nutrient storage capacity. Values in excess of 10 cmol kg-1 are considered satisfactory for most crops. This is reflected by the following classes:
Code Cation Exchange Capacity 1 < 4 cmol kg-1 2 4-10 cmol kg-1 3 >10-20 cmol kg-1 4 >20-40 cmol kg-1 5 >40 cmo kg-1
T_BS and S_BS
This field gives the base saturation in top- and subsoil.
The base saturation measures the sum of exchangeable cations (nutrients) Na, Ca, Mg and K as a percentage of the overall exchange capacity of the soil (including the same cations plus H and Al). The value often shows a near linear correlation with pH. Critical values as follows:
Base Saturation Soil conditions < 20 % desaturated soils, similar interpretation as extremely acid pH 20 – 50 % corresponds with acid conditions. 50 – 80 % neutral to slightly alkaline which are ideal conditions for most crops > 80 % indicates saturated conditions often calcareous, sometimes sodic or saline
T_TEB and S_TEB
This field gives the total exchangeable bases in the top- and subsoil.
Total exchangeable bases stand for the sum of exchangeable cations in a soil: sodium (Na), calcium (Ca), magnesium (Mg) and Potassium (K).
T_CACO3 and S_CACO3
This field gives the calcium carbonate (lime) content in top- and subsoil.
Calcium carbonate is a chemical compound (a salt), with the chemical formula CaCO3. It is a common substance found as rock in all parts of the world, and is the main component of shells of marine organisms, snails, and eggshells. Calcium carbonate is the active ingredient in agricultural lime, and is usually the principal cause of hard water. It is quite common in soils particularly in drier areas and it may occur in different forms as mycelium-like threads, as soft powdery lime, as harder concretions or cemented in petrocalcic horizons. Low levels of calcium carbonate enhance soil structure and are generally beneficial for crop production but at higher concentrations they may induce iron deficiency and when cemented limit the water storage capacity of soils. In agronomic sense relevant limits are:

Harmonized World Soil Database (version 1.0) 15
CaCO3 content Percentage
None to very low < 2 Low 2- 5 Moderate 5- 15 High 15 -40 Very High > 40
T_CASO4 and S_CASO4
Calcium sulphate (gypsum) content in top- and subsoil
Gypsum is a chemical compound (a salt) which occurs occasionally in soils particularly in the driest areas of the globe where it can occur in a flower-like form typically opaque with embedded sand grains called desert rose. In soils it may occur in fibers, crystals or soft. Research indicates that up to 2 percent gypsum in the soil favours plant growth, between 2 and 25 percent has little or no adverse effect if in powdery form, but more than 25 percent can cause substantial reduction in yields. It is suggested that reductions are due in part to imbalanced ion ratios, particularly K:Ca and Mg:Ca. Relevant limits are considered the following:
CaSO4 content Percentage None to very low < 2 Low 2- 5 Moderate 5- 25 High 25 -40 Very High > 40
T_ESP and S_ESP
This field gives the exchangeable sodium percentage in the top and subsoil.
The exchangeable sodium percentage has been used to indicate levels of sodium in soils it is calculated as the ratio of Na in the CEC (or sum of cations) ESP= Na*100/CECsoil
Alternatively SAR (Sodium Adsorption Ratio) has been used (SAR= Na/Square root ((Ca+Mg)/2)) to indicate levels of sodium hazards for crops. Agronomic relevant limits are:
ESP Percentage Low < 6 Moderate 6 -15 High 15 – 25 Very High > 25
T_ECE and S_ECE
This field gives the electrical conductivity of top and sub-soil.
Coastal and desert soils in particular can be enriched with water-soluble salts or salts more soluble than gypsum. The salt content of a soil can be roughly estimated from the Electrical Conductivity of the soil (EC, expressed in dS m-1) measured in a saturated soil paste or a more diluted suspension of soil in water. Crops vary considerably in their resistance and response to salt in soils. Some crops will suffer at values as little as 2 dS m-1 (Spinach) others can stand up to 16 dS m-1 (Date palm). Agronomic relevant limits are:
ECe dS m-1 Very low < 2 Low 2 – 4 Moderate 4 – 8 High 8 – 16 Very High > 16

Harmonized World Soil Database (version 1.0) 16
3. HARMONIZATION OF THE DATABASES This section describes the harmonization process which has been applied to bring the four soil database components into the uniform HWSD format. Attribute database and spatial data merging procedures are described separately.
3.1 The attribute databases The previous chapter describes the unified the coding system of the HWSD which required numerical recoding of data fields. This section discusses recoding, conversions and handling of missing data.
3.1.1 Range checks All fields in the database were checked for minimum, maximum, average and standard deviation values in order to find outliers, data entry errors etc. Very few errors were found, and these were corrected from neighboring units consisting of the same soil type.
3.1.2 Missing Data Very few missing data values exist in the source databases. Missing values were replaced with data extracted from the most appropriate neighboring units having the same soil type.
The HWSD therefore does not contain any missing data. All empty fields refer to data either relevant or not applicable to the soil mapping unit.
3.1.3 Recoding Recoding is the process of harmonizing different coding systems to a unique system. This was required for the coding of non-soil units and phases, which were different in the various source databases. For instance the table below illustrates the harmonized coding systems for non-soil units in the different soil classifications (FAO-74, FAO-85 and FAO-90). All non-soil units represented in the four source databases are listed and a new unique coding is applied in the harmonized database.
Codes NAME SYMBOL
HWSD FAO74 FAO85 FAO90 DS 30 141 194 Dunes & shifting sands ST 33 135 195 Salt flats RK 29 142 226 196 Rock debris WRs 197 Inland water, salt WR 31 138 230 198 Inland water GG 35 137 231 199 Glaciers & permanent snow NI 34 140 233 200 No data NS 232 Not surveyed UR 32 228 201 Urban HD 227 202 Humanly disturbed MA 229 203 Marsh FP 204 Fishpond IS 36 205 Island PS 225 Plaggensol
Phases have also been recoded as illustrated in the table below. Codes of FAO-74 were retained and codes for FAO-90 and ESDB adjusted for the same phases. New codes (13 to 30) were added for the specific phases in FAO-90 and ESDB. This harmonized recoded system contains then 30 types of phases (+ phase 0 for ESDB).

Harmonized World Soil Database (version 1.0) 17
HWSD FAO-74 FAO-90/China ESDB
Code Phase Code Phase Code AGLIM I and II 0 0 No information 1 1 Stony 203 Stony 2 2 Lithic 107 Lithic 204 Lithic 3 3 Petric 4 4 Petrocalcic 206 Petrocalcic 5 5 Petrogypsic 6 6 Petroferric 108 Petroferric 217 Petroferric 7 7 Phreatic 109 Phreatic 215 Phreatic 8 8 Fragipan 103 Fragipan 211 Fragipan 9 9 Duripan 102 Duripan 216 Duripan 10 10 Saline 207 Saline 11 11 Sodic 114 Sodic 208 Sodic 12 12 Cerrado 13 101 Anthraquic 14 104 Gelundic 15 105 Gigai 16 106 Inundic 17 110 Placic 18 111 Rudic 19 112 Salic 20 113 Skeletic 21 115 Takyric 22 116 Yermic 23 120 Erosion 214 Eroded phase, erosion 24 201 No limitation to agricultural use 25 202 Gravelly 26 205 Concretionary 27 209 Glaciers 28 210 Soils disturbed by man 29 212 Excessively drained 30 213 Flooded
3.1.4 Data measurement units Measurement units of most data fields in the source databases were the same except for CaCO3, CaSO4, OC. These fields were multiplied with a standard factor in order to covert to wt % .
3.1.5 The SHARE and SEQUENCE fields Data inconsistencies with the sum of SHARES in a soil mapping unit not corresponding to 100% have been corrected. When the SHARE was not equal to 100, the shares were adjusted to sum up to 100. In all cases, the sum was close to 100 and the largest share in the soil mapping unit was modified to obtain a sum of 100.
3.1.6 Sum of soil components The sum of sand, silt and clay fractions in top- and subsoil was corrected to 100% in the cases where necessary to rounding errors. In general when the sum was less 100, the largest percentage was increased to obtain 100. When the sum exceeded 100, the highest value was reduced to obtain a sum of 100.
3.1.7 Link between attribute database and spatial data The link between the HWSD attribute database and the raster GIS layer is provided by the MU_GLOBAL field, representing a relation between the attributes and the soil mapping unit (SMU) polygons. The original coding system of the source databases were modified as indicated in the table below. The table lists minimum and maximum value in the source databases (MU_SOURCE) and the

Harmonized World Soil Database (version 1.0) 18
corresponding numbering system (MU_GLOBAL) in the HWSD. Codes for DSMW remained unmodified.
MU_SOURCE MU_GLOBAL Coverage
Min Max Min Max Not covered (0) -999 -999 -999 -999 ESDB (1) 1 4420577 7001 10855 China (2) 10100 99902 11000 11935 SOTWIS (3) AG22 ZWns1 12000 31257 DSMW (4) 2 6998 2 6998
3.2 Spatial data The spatial data layers of the four original source databases were used as input for the GIS coverage of the HWSD. They include European Soil Database (ESDB), the China soil map (CHINA), the regional SOTER databases (SOTWIS) and the DSMW. All original data layers were available as polygon coverages.
Harmonization and merging was performed in an ESRI ArcGIS environment and included the following processing steps:
1) If necessary the original GIS databases were first converted to geographic coordinates (longitude, latitude).
2) The soil mapping units (SMU) of the projected polygon coverages were converted to a 30 arc-second grid cell-size.
3) One of the four source maps was assigned to represent each country as defined in the Global Administrative Units Layer (GAUL) (FAO, 2007). The priority of assignment was as follows: ESDB, China, SOTWIS and DSMW. In the case of France, Spain, and Portugal certain overseas territories were not covered by ESDB and thus soil units from FAO-74 were included in HWSD. They include the following islands: Madeira and Azores (Portugal); Canary islands (Spain). Svalbord and Jan Mayen are not covered by any soil database and a missing data value was assigned. The territory of Antarctica is not included in HWSD. The figure below presents the regional distribution of the data sources for HWSD.
Data sources for the Harmonized World Soil Database (HWSD)

Harmonized World Soil Database (version 1.0) 19
4) The original 30 arc-sec grids were expanded11 to match with the GAUL country boundaries12. In particular DSMW was expanded (1.1% of the area, mainly in Canada) as well as ESDB (1% change as compared to the original coverage). This is explained by different precision of coastlines and islands. The original China and SOTWIS coverage were expanded less than 0.05% of their original coverage.
5) The (expanded) grids of the four soil source layers were merged into a single global grid covering the globe with a total of 220.96 million 30 arc-sec grid-cells; these correspond with 15773 soil mapping units (SMU), which are linked to the HWSD attribute data base13. This has resulted in the following coverage of soil mapping units over the four source soil databases.
Original projection
No. of SMU in original map
No. of SMU in HWSD
Percentage of 30 arc-second grid-cells covered in HWSD
ESDB Lambert 9 48 3856 3855 24% China Albers 936 936 6% SOTWIS Lon/Lat 19258 8101 23% DSMW Lon/Lat 4909 2884 47%
The spatial resolution of the SMUs varies by region depending on the source data. The best resolution represents approximately a 1:1 million map scale and can be found in China, the territory covered by ESDB (Europe and Russia), and Eastern and Southern Africa, which is included in the SOTWIS database. The DSMW (FAO-74) represents a 1:5 million map scale.14
11 The expansion was performed in a stepwise procedure using the ArcGIS command “focalmajority–rectangle” applying an area of 8 pixels in the surrounding of each empty cell for adding a new cell value. 12 The authors of this database do not imply any opinion on the delimitation of frontiers and boundaries as contained in GAUL 13 The item MU_GLOBAL in the Access database represents the SMUs mapped in the 30 arc-second GIS raster layer. 14 The GAUL country file combined with HWSD provides the basis for analyzing individual countries. A spatial link of the country boundaries with the HWSD shows all the soil mapping units occurring in a country including its area coverage.

Harmonized World Soil Database (version 1.0) 20
I. ANNEX 1 MAJOR DATABASES USED TO COMPILE HWSD I.1 The Soil Map of the World and the Soil and Terrain (SOTER) database
developments At the global level the 1:5 M scale FAO-UNESCO Soil Map of the World (FAO 1971-1981) is still, over 25 years after its finalization, the only world-wide, consistent, harmonized soil inventory that is readily available in digital format. It is widely used and has provided the soil geographical data for a wide range of derived global soil data products (e.g. Zobler 1986; FAO 1995; IGBP-DIS 2000; Batjes 2006).
The project of the compilation of the FAO/Unesco Soil Map of the World originated by a motion of the International Society of Soil Sciences (ISSS) at the Wisconsin Congress in 1960, started in 1961 and was completed over a span of twenty years. The first draft of the Soil Map of the World was presented to the Ninth Congress of the ISSS, in Adelaide, Australia, in 1968. The first map sheets covering South America were issued in 1971 and the final sheet for Europe in 1981 (FAO 1971 – 1981).
With the rapidly advancing computer technology and the expansion of geographical information systems during the 1980’s, the Soil Map of the World was first digitized by ESRI (1984) in vector format. In 1984 a first rasterized version of the soil map was prepared by Zöbler using the ESRI map as a base and using 1o x 1o grid cells. Only the dominant FAO soil unit in each cell was indicated. Although this digital product gained popularity because of its simplicity and ease of use, particularly in the United States, it should no longer be used.
FAO (1995) produced its own raster version with a 5' x 5' cell size (9 km x 9 km at the equator) and contained a full database corresponding with the information in the paper map in terms of composition of the soil units, topsoil texture, slope class and soil phase in each of the more than 5000 mapping units. In addition to the vector and raster maps discussed above, the DSMW CD-ROM published in 1995 contains a large number of databases and digital maps based on statistically derived soil properties (pH, OC, C/N, soil moisture storage capacity, soil depth, etc.). The CD-ROM also contains interpretations by country on the extent of specific problem soils, the fertility capability classification results by country and corresponding maps (see: http://www.fao.org/WAICENT/FAOINFO/AGRICULT/AGL/ lwdms.htm).
In the early 1990s, FAO recognized that a rapid update of the Soil Map of the World would be a feasible option only if the original map scale of 1:5 M was retained, and started, together with UNEP, to fund national updates at 1:5 M scale of soil maps in Latin America and Northern Asia. At the same time, FAO tested the physiographic SOTER approach in Asia (van Lynden 1994), Africa (Eschweiler, 1993), Latin America (Wen, 1993), and the CIS, the Baltic States and Mongolia (Stolbovoy,1996), based on ideas developed at ISRIC by Sombroek (1984) who supported an original approach based on land systems to re-inventory global land resources (the SOTER – SOil and TERrain database – approach).
These complementary programmes of ISRIC, UNEP and FAO merged together in mid-1995, when at a meeting in Rome the three major partners agreed to join the concerned resources and work towards a common world SOTER product covering the globe.. Since then, other international organizations have shown support and collaborated to develop SOTER databases for specific regions. This is for instance the case for Northern and Central Eurasia where the International Institute for Applied System Analysis (IIASA) joined FAO and the national institutes involved, and for the European Soil Bureau (ESB) in the countries of the European Union.
With respect to SOTER, it should be noted that although the information is collected according to the same SOTER methodology, the specific level of information in each region results in a variable scale of the end products presented. The soils and terrain database for northeastern Africa, for instance, contains information at equivalent scales between 1:1 M and 1:2 M, but the soil profile information is not fully georeferenced. For north and central Eurasia, profile information contained in the CD-ROM is very limited (FAO/IIASA/DOKUCHAIEV/ACADEMIA SINICA 1999). Fully comprehensive SOTER information is available for South and Central America and the Caribbean (FAO et al. 1998) and includes more than eighteen hundred geo-referenced soil profiles (see: http://www.isric.nl/SOTER/LACData.zip). The SOTER database for Central and Eastern Europe (1:2.5 M scale) contains more than 600 geo-referenced soil profiles, as well as files of derived soil properties

Harmonized World Soil Database (version 1.0) 21
(see: http://www.isric.org/UK/About+ISRIC/Projects/Track+Record/SOTER+CE+Europe.htm). The SOTER database of Southern Africa (FAO et al. 2003) contains more than 900 geo-referenced soil profiles (see: http://www.isric.org/UK/About+ISRIC/Projects/Track+Record/SOTERSAF.htm).
I.2 The European Soil Bureau Network and the Soil Geographical Database for Europe
Soil Geographical Database of Europe at scale 1:1 million. Version 1 of this database (SGDBE) was digitized by Platou et al. (1989) for inclusion in the CORINE project (Co-ordination of Information on the Environment). To answer the needs of the MARS Project (see above), the database was enriched in 1990-1991 from the archive documents of the original EC Soil Map and the resulting database became version 2. The work of the Soil and GIS Support Group of the MARS Project lead to version 3 of the database. A slightly updated version (3.2.8) of the Soil Geographical Database at scale 1:1 million, covering central and eastern European and Scandinavian countries, forms the core of version 1.0 of the European Soil Database.
The aim of the database is to provide a harmonized set of soil parameters, covering Europe (the enlarged EU) and bordering Mediterranean countries, to be used in agro-meteorological and environmental modeling at regional, national, and/or continental levels.
Recently the Soil Geographical Database of Europe (SGDBE) has been extended in version 4.0, to cover Albania, Austria, Belgium, Bosnia and Herzegovina, Bulgaria, Croatia, Cyprus, Czech Republic, Denmark, Estonia, Finland, France, FYROM (Former Yugoslav Republic of Macedonia), Germany, Greece, Hungary, Ireland, Italy, Latvia, Lithuania, Malta, The Netherlands, Norway, Poland, Portugal, Romania, Serbia, Slovakia, Slovenia, Spain, Sweden, Switzerland and the United Kingdom.
The most recent extension covers Iceland and the New Independent States (NIS) of Belarus, Moldova, the Russian Federation and Ukraine. Work is ongoing to incorporate soil data for other Mediterranean countries: Algeria, Egypt, Jordan, Lebanon, Morocco, Palestine, Syria, Tunisia and Turkey.
In addition to these geographical extensions, the database has also experienced important changes during its lifetime. The latest major changes include the introduction of a new extended list of parent materials and for coding major soil types, the use of the new World Reference Base (WRB) for Soil Resources (FAO/IUSS/ISRIC, 2006). The database is currently managed using the ArcGIS® Geographical Information System (GIS) software system and associated relational databases.
The database contains a list of Soil Typological Units (STU), characterizing distinct soil types that have been identified and described. The STU are described by attributes (variables) specifying the nature and properties of the soils, for example the texture, the moisture regime, the stoniness, etc. It is not appropriate to delineate each STU separately. Thus STUs are grouped into Soil Mapping Units (SMU) to form soil associations. The criteria for soil associations and SMU delineation have taken into account the functioning of pedological relationships within the landscape15. A detailed instruction manual for the compilation of data for the Soil Geographical Database of Europe version 4.0 has been published by Lambert et al. (2003).
I.3 Soil Map of China Soil maps of China have been compiled at different scales from information obtained from ground surveys and laboratory analyses. A comprehensive effort coordinated by the Office for the Second National Soil Survey of China resulted in a series of soil maps covering the extent of the country at a scale of 1:1 million. These map series have been transformed to a digital format by Institute of Soil Science, Chinese Academy of Sciences, Nanjing, China. The 1:1 million digital Soil Map of China is
15 On the advice of the European Soil Bureau of JRC and in consultation with FAO, an adjustment was made to the European Soil Data Base concerning the occurrence of Gleysols and Greyzems. In the HWSD database the Soil Typological Unit 70048, a Humic Gleysol, has been replaced by an Orthic Greyzem (FAO, 1985) and a Haplic Greyzem (FAO, 1990). Gleysol attributes have been replaced by appropriate Greyzem attributes as provided by the WISE-2 soil attribute database.

Harmonized World Soil Database (version 1.0) 22
based on GSCC (the genetic soil classification of China), consisting of 12 orders, 61 great groups, 235 subgroups, and 909 families. The soil map units are delineated based on the soil family definitions. The 909 soil families, referred to as soil units in the Harmonized World Soil Database (HWSD), have been translated to Soil Taxonomy of USDA, WRB (World Reference Base for Soil Resources of 1998’s version)( Shi X. Z. et al, 2006a and Shi X. Z. et al, 2006b) and Chinese Soil Taxonomy systems and have been correlated to the FAO-90 Revised Soil Classification system to facilitate linkage with the soil attribute database.For the soil physical, chemical, and fertility properties, in part use was made of data available from the attributes available with the soil units of the Soil Map of China based on data from 7292 profiles in China, and partly on WISE based on 9607 soil profiles worldwide.
From the digital Soil Map of China (at scale 1:1,000,000) a raster format at 30 arc-second resolution was spatially integrated at IIASA with the other three HWSD component databases (DSMW, ESDB and SOTER).
I.4 Soil parameter data based on the World Inventory of Soil Emission Potential (WISE) database
The WISE project was carried out between 1991 and 1996 by ISRIC for the Dutch National Research Programme on Global Air Pollution and Climate Change (NRP Project 851039) in collaboration with a wide range of institutions and individuals (see: http://www.isric.org/UK/About+ISRIC/Projects/ Track+Record/WISE.htm). The WISE project developed a homogenized set of soil data relevant for a wide range of environmental studies at global scale – agro-ecological zoning, assessments of crop production, soil vulnerability to pollution, and soil gaseous emission potentials (Batjes et al. 1995). In 1997, IIASA, FAO and ISRIC identified the need for refinement of the agro-edaphic module in the FAO/IIASA AEZ methodology (Batjes et al., 1997). The resulting activity was based on 4353 soil profiles held in version 1.0 of ISRIC’s WISE database..This initial activity identified several geographic, taxonomic and soil physico-chemical gaps, showing the persisting need for expanding the set of soil profile data. For this study, we used soil parameter estimates derived from some 9600 profiles held in WISE version 2, which includes profiles derived from soil and terrain databases (SOTER) and new data compiled from the literature (Batjes 2002). For SOTER-related applications, more detailed procedures are now in use (Batjes et al., 2007, Van Engelen et al., 2005)
Two FAO classification systems, the Legend (FAO-74) and the Revised Legend of the Soil Map of the World (FAO-90), are used in WISE; these have been used for data extraction and analysis. The Table below shows the geographic distribution of the available soil profiles by major regions. Profiles of over 135 countries are represented in the data set.
Number of profiles Region WISE-1 WISE-2
Africa 1799 3998 Australia and Pacific Islands 122 147 China, India, Indonesia & Philippines% 553 628 Europe 492 1204 North America 266 326 South America and the caribbean 599 2115 South west and Northern Asia (incl Siberia) 522 1113 Total 4353 9607
From the WISE-2 database the representative topsoil and subsoil parameters have been derived ( Batjes, 2002). The relative number of soil profiles, available for each major soil group of the Legend and the Revised Legend of the Soil Map of the World and to a certain extent, the distribution of profiles is a reflection of the fact that soil surveys, not surprisingly, have been focused on agricultural areas.
The WISE database is now mainly being used to fill gaps in measured soil chemical and physical data in primary SOTER databases, resulting in so-called SOTWIS databases, using consistent taxotransfer procedures (see: Batjes 2003; Van Engelen et al. 2005, Batjes et al. 2007).

Harmonized World Soil Database (version 1.0) 23
II. ANNEX 2 SOIL UNITS II.1 Soil Units in the Revised Legend of the Soil Map of the World (FAO90) FL FLUVISOLS AR ARENOSOLS CM CAMBISOLS CL CALCISOLS FLe Eutric Fluvisols ARh Haplic Arenosols CMe Eutric Cambisols CLh Haplic Calcisols FLc Calcaric Fluvisols ARb Cambic Arenosols CMd Dystric Cambisols CLl Luvic Calcisols FLd Dystric Fluvisols ARl Luvic Arenosols CMu Humic Cambisols Clp Petric Calcisols FLm Mollic Fluvisols ARo Ferralic Arenosols CMc Calcaric Cambisols FLu Umbric Fluvisols ARa Albic Arenosols CMx Chromic Cambisols FLt Thionic Fluvisols ARc Calcaric Arenosols CMv Vertic Cambisols FLs Salic Fluvisols ARg Gleyic Arenosols CMo Ferralic Cambisols GY GYPSISOLS CMg Gleyic Cambisols CMi Gelic Cambisols GYh Haplic Gypsisols GYk Calcic Gypsisols GL GLEYSOLS AN ANDOSOLS GYl Luvic Gypsisols GYp Petric Gypsisols GLe Eutric Gleysols ANh Haplic Andosols GLk Calcic Gleysols ANm Mollic Andosols GLd Dystric Gleysols ANu Umbric Andosols GLa Andic Gleysols ANz Vitric Andosols SN SOLONETZ GLm Mollic Gleysols ANg Gleyic Andosols GLu Umbric Gleysols ANi Gelic Andosols SNh Haplic Solonetz GLt Thionic Gleysols SNm Mollic Solonetz GLi Gelic Gleysols SNk Calcic Solonetz SNy Gypsic Solonetz SNj Stagnic Solonetz VR VERTISOLS SNg Gleyic Solonetz RG REGOSOLS VRe Eutric Vertisols VRd Dystric Vertisols RGe Eutric Regosols VRk Calcic Vertisols SC SOLONCHAKS RGc Calcaric Regosols VRy Gypsic Vertisols RGy Gypsic Regosols SCh Haplic Solonchaks RGd Dystric Regosols SCm Mollic Solonchaks RGu Umbric Regosols SCk Calcic Solonchaks RGi Gelic Regosols SCy Gypsic Solonchaks SCn Sodic Solonchaks SCg Gleyic Solonchaks SCi Gelic Solonchaks LP LEPTOSOLS LPe Eutric Leptosols LPd Dystric Leptosols LPk Rendzic Leptosols LPm Mollic Leptosols LPu Umbric Leptosols LPq Lithic Leptosols LPi Gelic Leptosols

Harmonized World Soil Database (version 1.0) 24
KS KASTANOZEMS LV LUVISOLS LX LIXISOLS HS HISTOSOLS KSh Haplic Kastanozems LVh Haplic Luvisols LXh Haplic Lixisols HSl Folic Histosols KSl Luvic Kastanozems LVf Ferric Luvisols LXf Ferric Lixisols HSs Terric Histosols KSk Calcic Kastanozems LVx Chromic Luvisols LXp Plinthic Lixisols HSf Fibric Histosols KSy Gypsic Kastanozems LVk Calcic Luvisols LXa Albic Lixisols HSt Thionic Histosols LVv Vertic Luvisols LXj Stagnic Lixisols HSi Gelic Histosols LVa Albic Luvisols LXg Gleyic Lixisols LVj Stagnic Luvisols CH CHERNOZEMS LVg Gleyic Luvisols AT ANTHROSOLS CHh Haplic Chernozems AC ACRISOLS CHk Calcic Chernozems ATa Aric Anthrosols CHl Luvic Chernozems PL PLANOSOLS ACh Haplic Acrisols ATc Cumulic Anthrosols CHw Glossic Chernozems ACf Ferric Acrisols ATf Fimic Anthrosols CHg Gleyic Chernozems PLe Eutric Planosols ACu Humic Acrisols ATu Urbic Anthrosols PLd Dystric Planosols ACp Plinthic Acrisols PLm Mollic Planosols ACg Gleyic Acrisols PLu Umbric Planosols PH PHAEOZEMS PLi Gelic Planosols PHh Haplic Phaeozems AL ALISOLS PHc Calcaric Phaeozems PHl Luvic Phaeozems PD PODZOLUVISOLS ALh Haplic Alisols PHj Stagnic Phaeozems ALf Ferric Alisols PHg Gleyic Phaeozems PDe Eutric Podzoluvisols ALu Humic Alisols PDd Dystric
Podzoluvisols ALp Plinthic Alisols
PDj Stagnic Podzoluvisols
ALj Stagnic Alisols
PDg Gleyic Podzoluvisols ALg Gleyic Alisols GR GREYZEMS PDi Gelic Podzoluvisols GRh Haplic Greyzems GRg Gleyic Greyzems NT NITISOLS PZ PODZOLS NTh Haplic Nitisols PZh Haplic Podzols NTr Rhodic Nitisols PZb Cambic Podzols NTu Humic Nitisols PZf Ferric Podzols PZc Carbic Podzols PZg Gleyic Podzols PZi Gelic Podzols FR FERRALSOLS FRh Haplic Ferralsols FRx Xanthic Ferralsols FRr Rhodic Ferralsols FRu Humic Ferralsols FRg Geric Ferralsols FRp Plinthic Ferralsols PT PLINTHOSOLS PTe Eutric Plinthosols PTd Dystric Plinthosols PTu Humic Plinthosols PTa Albic Plinthosols

Harmonized World Soil Database (version 1.0) 25
II.2 Major Soil Groupings used for the HWSD map The following soil groupings are used to display main soil types using the HWSD-viewer: ACRISOLS (AC): Soils with subsurface accumulation of low activity clays and low base saturation ALISOLS (AL): Soils with sub-surface accumulation of high activity clays, rich in exchangeable aluminum ANDOSOLS (AN): Young soils formed from volcanic deposits ANTHROSOLS (AT): Soils in which human activities have resulted in profound modification of their properties ARENOSOLS (AR): Sandy soils featuring very weak or no soil development CALCISOLS (CL): Soils with accumulation of secondary calcium carbonates CAMBISOLS (CM): Weakly to moderately developed soils CHERNOZEMS CH): Soils with a thick, dark topsoil, rich in organic matter with a calcareous subsoil FERRALSOLS (FR): Deep, strongly weathered soils with a chemically poor, but physically stable subsoil FLUVISOLS (FL): Young soils in alluvial deposits GLEYSOLS (GL): Soils with permanent or temporary wetness near the surface GREYZEMS (GR): Acid soils with a thick, dark topsoil rich in organic matter GYPSISOLS (GY): Soils with accumulation of secondary gypsum HISTOSOLS (HS): Soils which are composed of organic materials KASTANOZEMS (KS): Soils with a thick, dark brown topsoil, rich in organic matter and a calcareous or gypsum-rich subsoil LEPTOSOLS (LP): Very shallow soils over hard rock or in unconsolidated very gravelly material LIXISOLS (LX): Soils with subsurface accumulation of low activity clays and high base saturation LUVISOLS (LV): Soils with subsurface accumulation of high activity clays and high base saturation NITISOLS (NT): Deep, dark red, brown or yellow clayey soils having a pronounced shiny, nut-shaped structure PHAEOZEMS (PH): Soils with a thick, dark topsoil rich in organic matter and evidence of removal of carbonates PLANOSOLS PL): Soils with a bleached, temporarily water-saturated topsoil on a slowly permeable subsoil PLINTHOSOLS (PT): Wet soils with an irreversibly hardening mixture of iron, clay and quartz in the subsoil PODZOLS (PZ): Acid soils with a subsurface accumulation of iron-aluminum-organic compounds PODZOLUVISOLS (PD): Acid soils with a bleached horizon penetrating into a clay-rich subsurface horizon REGOSOLS (RG): Soils with very limited soil development SOLONCHAKS (SC): Strongly saline soils SOLONETZ (SN): Soils with subsurface clay accumulation, rich in sodium VERTISOLS (VR): Dark-coloured cracking and swelling clays

Harmonized World Soil Database (version 1.0) 26
II.3 Soil Units in the Legend of the Soil Map of the World (FAO74) G GLEYSOLS S SOLONETZ B CAMBISOLS A ACRISOLS Ge Eutric Gleysols So Orthic Solonetz Be Eutric Cambisols Ao Orthic Acrisols Gc Calcaric Gleysols Sm Mollic Solonetz Bd Dystric Cambisols Af Ferric Acrisols Gd Dystric Gleysols Sg Gleyic Solonetz Bh Humic Cambisols Ah Humic Acrisols Gm Mollic Gleysols Bx Gelic Cambisols Ap Plinthic Acrisols Gh Humic Gleysols Y YERMOSOLS Bk Calcic cambisols Ag Gleyic Acrisols Gp Plinthic Gleysols Bc Chromic Cambisols Gx Gelic Gleysols Yh Haplic Yermosols Bv Vertic Cambisols N NITOSOLS Yk Calcic Yermosols Bf Ferralic cambisols R REGOSOLS Yy Gypsic Yermosols Ne Eutric Nitosols Yl Luvic Yermosols L LUVISOLS Nd Dystric Nitosols Re Eutric Regosols Yt Takyric Yermosols Nh Humic Nitosols Rc Calcaric Regosols Lo Orthic Luvisols Rd Dystric Regosols X XEROSOLS Lc Chromic Luvisols F FERRALSOLS Rx Gelic Regosols Lk Calcic Luvisols Xh Haplic Xerosols Lv Vertic Luvisols Fo Orthic Ferralsols I LITHOSOLS Xk Calcic Xerosols Lf Ferric Luvisols Fx Xantic Ferralsols Xy Gypsic Xerosols La Albic Luvisols Fr Rhodic Ferrarlsols Q ARENOSOLS Xl Luvic Xerosols Lp Plinthic Luvisols Fh Humic Ferralsols Lg Gleyic Luvisols Fa Acric Ferralsols Qc Cambic Arenosols K KASTANOZEMS Fp Plinthic Acrisols Ql Luvic Arenosols D PODZOLUVISOLS Qf Ferralic Arenosols Kh Haplic Kastanozems O HISTOSOLS Qa Albic Arenosols Kk Calcic Kastanozems De Eutic Podzoluvisols Kl Luvic Kastanozems Dd Dystric Podzoluvisols Oe Eutric Histosols E RENDZINAS Dg Gleyic Podzoluvisols Od Dystric Histosols C CHERNOZEMS Ox Gelic Histosols U RANKERS P PODZOLS Ch Haplic Chernozems J FLUVISOLS T ANDOSOLS Ck Calcic Chernozems Po Orthic Podzols Cl Luvic Chernozems Pl Luvic Podzols Je Eutric Fluvisols To Ochric Andosols Cg Glossic Chernozems Pf Ferric Podzols Jc Calcaric Fluvisols Tm Mollic Andosols Ph Humic Podzols Jd Dystric Fluvisols Th Hunic Andolsols H PHAEOZEMS Pp Placic Podzols Jt Thionic Fluvisols Tv Vitric Andosols Pg Gleyic Podzols Hh Haplic Phaeozems V VERTISOLS Hc Calcaric Phaeozems W PLANOSOLS Hl Luvic Phaeozems Vp Pellic Vertisols Hg Gleyic Phaeozems We Eurtic Planosols Vc Chromic Vertisols Wd Dystric Planosols M GREYZEMS Wm Mollic Planosols Z SOLONCHAKS Wh Humic Planosols Mo Orthic Greyzems Ws Solodic Planosols Zo Orthic Solonchaks Mg Gleyic Greyzems Wx Gelic Planosols Zm Mollic Solonchaks Zt Takyric Solonchaks Zg Gleyic Solonchaks

Harmonized World Soil Database (version 1.0) 27
III. ANNEX 3 USE OF THE HWSD IN GIS SOFTWARE
III.1 Technical specifications This section describes the HWSD image raster file format, which is provided in “Band interleaved by line” (BIL) format and can be read or imported by most GIS software. Header files and specifications of the HWSD raster are provided for use with the ESRI ArcGIS and ArcView and for IDIRISI.
BIL is the standard method of organizing image data and is rather a scheme for storing the actual pixel values of an image in a file. The BIL format consists of several different files. Each file of an image will have the same name but a different file extension. The first is a binary file that actually holds the image data. This file will have a .BIL extension. The second file is an ASCII file that holds descriptive information that describes the image data. This file will have a .HDR file extension.
The world file *.BLW (in Ascii format) provides the image to world information including details on grid cell size and x and y map coordinates of the center of the upper-left pixel. Below is the format for the world file for HWSD raster.
0.00833333333333 0.00000000000000 0.00000000000000 -0.00833333333333 -179.99583333333334 89.99583333326137
The next two files are optional. They are both ASCII files. The color map file describes the image color map for single-band pseudo-color images and will have a .CLR file extension. The statistics file describes image statistics for each spectral band in a grayscale or multi-band image and has a .STX file extension. In an ArcGIS environment a minimum of three files (*.bil; *.blw; and *.hdr) are required as input for the IMAGEGRID command, which can be used to import the bil file into an ArcGIS Grid format.
The data in HWSD is stored in 1 image band as signed 16 bit integer. The image consists of 21600 rows and 43200 columns. This information is stored in the header file with extension *.HDR.
BYTEORDER I LAYOUT BIL NROWS 21600 NCOLS 43200 NBANDS 1 NBITS 16 BANDROWBYTES 86400 TOTALROWBYTES 86400 BANDGAPBYTES 0
IDRISI is a popular raster GIS developed by the Clark Labs at Clark University (http://www.clarklabs.org). In Idrisi 32, raster images have a *.RST extension with an accompanying documentation file with an *.RDC extension. The documentation file is provided in the raster ZIP archive of HWSD. Since the .bil and .rst files are identical, only the .bil file is included. You just need to change the extension of the *.BIL file into *.RST to use the HWSD raster image in IDRISI.

Harmonized World Soil Database (version 1.0) 28
Table 1 Documentation file for IDRISI HWSD image file format IDRISI Raster A.1 pos'n error unknown file title HWSD resolution unknown data type integer min. value 0 file type binary max. value 32000 columns 43200 display min 0 rows 21600 display max 32000 ref. system latlong value units Classes ref. units deg value error unknown unit dist. 1.0000000 flag value None min. X -180 flag def'n none max. X 180 legend cats 0 min. Y -90 max. Y 90
III.2 Loading the data in ArcView and ArcGIS The HWSD is composed of a raster image file and a linked attribute database. The raster image file is in ESRI BIL format and can be directly read by commercial ArcGis and ArcView. A documentation file (Table 1) is provided for loading in IDRISI as well.
The attribute data is stored in Microsoft Access 2003 format. Since there is a 1-n relation between the raster image and the attributes, it is often necessary to prepare a query in Microsoft Access in order to visualize the data using GIS software.
Using the HWSD database in a GIS is straightforward, but ideally, the full map unit composition should be considered and not only the main soil unit. One or more queries should be prepared in Access in order to implement a customized attribute table and to increase the GIS software performance. In many cases, however, the practical aim will be to obtain an attribute table that has a “one to one” relation between the GRID value and the database attribute MU_GLOBAL. This operation will thus simplify the soil map itself, and the user needs to assess the implications of such simplifications for derived applications.
At this stage, the MU_GLOBAL attribute can be joined to the GRID value. The basic steps to start using the database are:
- implement appropriate query in Access; - if necessary, realize the appropriate calculations (ex: after exporting from Access to Excel); - convert final attributes table to a compatible GIS format; - join the MU_GLOBAL attribute and the GRID value (dbf or txt formats); - convert the attribute to a new GRID (in the case it is needed).
The extraction from Access is straightforward when attributes are available only once for each MU_GLOBAL code value (ex. SU_SYMBOL attribute, that is present for SEQ 1 only). In case of numerical attributes, it is necessary to select the sequence to which the attribute refers to. Nevertheless, it is often necessary to calculate derived values for the entire profile (or either for topsoil or subsoil only) in case of attributes measured (or simulated) in each series, and convert it back to a univocal MU_GLOBAL code.
Here is a numerical example of calculation to extract Topsoil Total Exchangeable Bases (T_TEB) from the database (sum of T_TEB multiplied by the share of each soil unit in the mapping unit)16:
16 This kind of formula works fine when total content of a substance in an area is determined (total exchangeable bases, organic carbon pool), but it may lead to less useful results where average values for an area are determined. For example, a soil mapping unit comprising of 50% of soils with a topsoil OC content of 1.1%, 40% with a topsoil OC content of say 3.9%, and 10% with a topsoil OC content of 30% (e.g. Histosols) would be assigned a value of 5.1% if the above formula were used, which is misleading. Alternative ways of expressing include presenting estimates for the spatially dominant soil unit or the spatially dominant class value in the area.

Harmonized World Soil Database (version 1.0) 29
IV ANNEX 4: THE HWSD VIEWER IV.1 Introduction The purpose of the HWSD-Viewer17 is to provide a simple geographical tool to query and visualize the Harmonized World Soil Database. The HWSD consists of a 30 arc-second (or ~1 km) raster image and an attribute database in Microsoft Access 2003 format. The raster image file is stored in binary format (ESRI Band Interleaved by Line - BIL) that can directly be read or imported by most GIS and Remote Sensing software. For advanced use or data extraction of the HWSD, it is recommended to use a GIS software tool.
IV.2 System Requirements The HWSD-Viewer requires a Pentium III computer or better with a recommended minimum processor speed of 1 GHz. Windows version 98 or later is required as operating system.
A minimum of 2 GB of free hard disk space is required for running the software. You can install the software on a computer with less free disk space, but you will not be able to view the data layer. The HWSD raster image is stored in compressed format but needs to be decompressed by the viewer. You can request to delete this file every time when closing the application, and in this case, the software libraries and database only require 40 MB hard disk space.
IV.3 Installation The installation of HWSD is automated and includes both the viewer and databases. When Microsoft Access Data Components (MDAC, minimum required version is 2.7) is not available on the target computer, it will be installed automatically. These components are required to read the Microsoft Access files.
By default, the HWSD program and data files are installed in the program directory, but the user can chose to install the files in any another location. The raster image however will be decompressed in the installation directory.
17 Portions copyright: Alex Denisov and Contributors, 2000-2006 (Graphics32); Jan Goyvaerts, 2004 (HTMLHelpViewer); Microsoft 1998-2007 (MDAC 2.7); Frank Warmerdam, 1999 (ShapeLib); Jordan Russell, 1998-2006 (Toolbar 2000); Eric W. Engler, 1998-2001 (TZip); FAO/UN 1993-2003, (Windisp).

Harmonized World Soil Database (version 1.0) 30
IV.4 First use of the Viewer When launching the viewer, the soil map will open automatically. The first time, it will decompress the HWSD raster image, and this may take a few moments but is only required once (unless you select to delete the decompressed image after closing the viewer).
Use the File>New Window menu option or use the icon to load another window with the HWSD raster map and related attribute data.
IV.5 Operation of the HWSD-V The Windows-style graphical interface of the HWSD Viewer is simple and provides access to the raster map layer using the View functionality, and to the attributes of the soil database through the functions in the Data menu. Most of the functionality is also available from the View and Data toolbars.
IV.5.1 Basic operations
You can open a new map window from the icon in the toolbar of the File>New Window. The HWSD map will be loaded showing the soil classification groups. Simple map viewing operations are accessed from the View menu or the View toolbar, and include redrawing, zooming in, zooming out and moving the map.
The icons in the View toolbar have the following functionality: (1) reset the view operation, (2) redraw the map, (3) fit the complete map in the window, (4) zoom in on the map by drawing a rectangle, (5) zoom in on the map by a fixed zoom percentage, (6) zoom out with fixed zoom percentage, and (7) pan or move around the map.
You can interrupt the drawing by pressing the escape or pressing the right mouse button in the map window.
The Data Point tool shows the coordinates of the mouse cursor, the global soil mapping unit identifier (MU_GLOBAL) and the Soil Unit in a floating Window.

Harmonized World Soil Database (version 1.0) 31
IV.5.2 Manipulating the Legend The legend at the right side of the Viewer window lists the main soil groups of the HWSD, as well as source layers (e.g., country boundaries). Manipulating the legend allows showing or hiding entries, and changing their appearance.
The legend entries can be manipulated one by one using the and icons, to hide or display the entry on the map, or to change the
color of the entry. You can also hide the complete soil raster layer
from the checkbox. In that case, only the vector overlays will be shown.
You can also manipulate the legend from the three rightmost icons in the Data Toolbar. The first will activate (or display) all legend entries; the second will clear them all. The third will switch the selection. These tools allow to quickly select one or a few soil groups.
Colors can be changed from the entries in the legend. A dialog box gives a number of predefined colors or you can set the RGB numbers given access to all possible colors.
IV.5.3 Adding shape file overlays
A shape file with detailed country boundaries is included with the installation and is loaded as overlay on the HWSD image. Any additional Shape file (point, line, polygon) can be loaded as overlay, and its properties can be changed from the legend.
IV.6 Accessing attribute data Soil attribute data is linked to the raster map via the pixel value, and soil properties are loaded from the Microsoft Access database. Data are displayed in spreadsheet-like format and can be copied to the clipboard and directly copied into Microsoft Excel.
Use the left-most icon in the Data toolbar to display the HWSD Soil Mapping Unit Details of the selected SMU. The clicked area will be indicated with a small cross; if you want to highlight the clicked area, use the Highlight button explained below.

Harmonized World Soil Database (version 1.0) 32
The HWSD Soil Mapping Unit Details
The HWSD Soil Mapping Unit Details page lists the soil mapping unit properties for the selected soil unit in the HWSD. There are seven areas (A to G) in the form.
A The most important properties of the selected SMU: the coverage, the SMU identifier (MU_GLOBAL) and the Soil Mapping Unit code.
B The data area, listed by share, with the dominant soil in the first column. C Beginning of the soil physico-chemical properties (scroll down). D Display the domain values of data or the numerical entries from the database. E List of selected SMU's. You can return here to a previously selected unit and display its properties.
F Highlight the selected SMU on the map. In order to find the selected SMU's, you might need to use the
legend manipulation tools in the icons . The selection color can be changed from the HWSD Query Tool.
G Copy the contents of the table to the clipboard, to be directly pasted in Microsoft Excel. .

Harmonized World Soil Database (version 1.0) 33
IV.7 The HWSD query Tool The HWSD Query Tool can perform any (Microsoft Access) SQL-compatible query on the HWSD database. The figure below illustrates a database query of the main soil unit which are non-soils. The corresponding query is "select * from HWSD where SEQ 1 and ISSOIL = 0" and can be built from the Query interface.
Please consult the technical HWSD publication for more details on field names and coding systems.
IV.8 Preferences A few program preferences can be selected from the View Menu:
− Persistent View operation: this setting retains the ongoing operations (zooming in or panning etc...) without the need to re-select the operation. (By default this preference is on).
− Synchronize Views: when you have different windows open, zoom and pan operations will be synchronized over the different windows. (By default this setting is off).
− Open New Window: opens a new window when selecting a new soil map window. (By default this setting is on).
− If you want to delete the 2 GB raster image after closing the HWSD viewer, activate the “Delete raster image after closing the HWSD-Viewer”. This will however require the lengthy process of decompressing the raster image every time. (By default, this option is off - the option can be found in the Data > Data Location menu )

Harmonized World Soil Database (version 1.0) 34
IV.9 Loading other database versions From the Data > Data Location menu item, you can select other HWSD databases, if new versions become available. You can also select a different default shape file overlay. If you want to delete the 2GB raster image after closing the HWSD viewer, activate here the “Delete raw rater image after closing the HWSD-Viewer”. This will however require the lengthy process of decompressing the raster image every time.

Harmonized World Soil Database (version 1.0) 35
References: Batjes NH 2002. Soil parameter estimates for the soil types of the world for use in global and regional
modelling (Version 2.1). ISRIC Report 2002/02c, International Food Policy Research Institute (IFPRI) and International Soil Reference and Information Centre (ISRIC), Wageningen.
Batjes NH 2003. A taxotransfer rule-based approach for filling gaps in measured soil data in primary SOTER databases (GEFSOC Project). Report 2003/03, ISRIC - World Soil Information, Wageningen.
Batjes NH 2006. ISRIC-WISE derived soil properties on a 5 by 5 arc-minutes global grid (ver. 1.1). Report 2006/02, ISRIC - World Soil Information, Wageningen.
Batjes NH, Bridges EM and Nachtergaele FO 1995. World Inventory of Soil Emission Potentials: development of a global soil data base of process-controlling factors. In: Peng S, KT Ingram, HU Neue and LH Ziska (editors), Climate Change and Rice. Springer-Verlag, Heidelberg, pp 102-115.
Batjes NH, Fischer G, Nachtergaele FO, Stolbovoy VS and van Velthuizen HT 1997. Soil data derived from WISE for use in global and regional AEZ studies (ver. 1.0). Interim Report IR-97-025, FAO/ IIASA/ ISRIC, Laxenburg (http://www.iiasa.ac.at/Admin/PUB/Documents/IR-97-025.pdf).
Batjes NH, Al-Adamat R, Bhattacharyya T, Bernoux M, Cerri CEP, Gicheru P, Kamoni P, Milne E, Pal DK and Rawajfih Z 2007. Preparation of consistent soil data sets for SOC modelling purposes: secondary SOTER data sets for four case study areas. Agriculture, Ecosystems and Environment 112, 26-34.
Breuning-Madsen BH and Jones RJA 1998. Towards a European soil profile analytical database. In: Heineke HJ, W Eckelmann, AJ Thomasson, RJA Jones, L Montanarella and B Buckley (editors), Land Information Systems: Developments for planning the sustainable use of land resources. Office for Official Publications of the European Community, Luxembourg, pp 43-49.
Eastman, J. R., 2006. IDRISI Andes. Guide to GIS and Image Processing, Clark Labs. Clark University.
ESB, 2004. European Commission- JRC - Institute for Environment and Sustainability, European Soil Bureau. European Soil Database (vs 2.0). Ispra, Italy.
Eschweiler, H. 1993. Draft Physiographic Map of Latin America. AGLS Working Paper. FAO, Rome. ESRI Final Report UNEP/FAO World and Africa GIS Database 1984. Environmental Systems
Research, Institute, Redlands, California.
ESRI, 1999. “Extendable Image Formats for ArcView GIS 3.1 and 3.2” An ESRI White Paper, July 1999.
FAO 1995, 2003. The Digitized Soil Map of the World and Derived Soil Properties. (version 3.5) FAO Land and Water Digital Media Series 1. FAO, Rome.
FAO 2007, Global Administrative Unit Layers (GAUL), available at: http://www.fao.org/geonetwork/srv/en/metadata.show?id=12691&currTab=simple
FAO/Unesco 1971-1981. The FAO-Unesco Soil Map of the World. Legend and 9 volumes. UNESCO, Paris.
FAO/Unesco, 1974. Legend of the Soil Map of the World. FAO, Rome, Italy.
FAO/Unesco 1981. Soil Map of the World, 1:5,000,000. Vol. 5 - Europe. United Nations Educational, Scientific, and Cultural Organization, Paris.
FAO/Unesco/ISRIC, 1990. Revised Legend of the Soil Map of the World. World Soil Resources Report, FAO, Rome, Italy.

Harmonized World Soil Database (version 1.0) 36
FAO /IGADD/ Italian Cooperation 1998. Soil and terrain database for northeastern Africa and Crop production zones. Land and Water Digital Media Series # 2. FAO, Rome.
FAO/UNEP/ISRIC/CIP 1998. Soil and terrain digital database for Latin America a and the Caribbean at 1:5 Million scale. FAO Land and Water Digital Media series 5. FAO, Rome.
FAO/IIASA/Dokuchaiev Institute/Academia Sinica Soil and Terrain 1999. Database for north and 1999 central Eurasia at 1:5 million scale. FAO Land and Water Digital Media series 7. FAO, Rome.
FAO/ISRIC 2000: Soil and Terrain Database, Land Degradation Status and Soil Vulnerability Assessment for Central and Eastern Europe Version 1.0 (1:2.5 million scale) . Land and Water Digital Media Series # 10. FAO, Rome
FAO/ISRIC 2003: Soil and Terrain Database for Southern Africa. Land and Water Digital Media Series # 26. FAO, Rome.
FAO/IUSS/ISRIC, 2006. World Reference Base (WRB) for Soil Resources. A framework for international classification and communication. World Soil Resources Report 103. FAO, Rome.
FAO/ISRIC/University of Gent, 2007. Soil and Terrain Database of Central Africa – DR of Congo, Burundi and Rwanda (SOTERCAF 1.0).
Finke P, Hartwich R, Dudal R, Ibanez J, Jamagne M, King D, Montanarella L and Yassoglou N 1998. Georeferenced soil database for Europe. Manual of procedures (ver. 1.0). Report EUR 18092, European Soil Bureau, Joint Research Centre, Ispra.
IGBP-DIS 2000. Global Soil Data Products CD-ROM (IGBP-DIS). Available at: http://www-eosdis.ornl.gov/SOILS/igbp.html.
Lambert J.-J., Daroussin J., Eimberck M., Le Bas C., Jamagne M., King D., Montanarella L., 2003. Soil Geographical Database for Eurasia & The Mediterranean. Instructions Guide for Elaboration at scale 1:1,000,000 version 4.0. EUR 20422 EN. JRC, Ispra, Italy. 64 p.
Northern Circumpolar Soil Map. Agriculture and Agri-food Canada, USDA-NRCS, Dokuchaev Institute, 2000.
Platou S. W., Nørr A. H., Madsen H. B., 1989 Digitization of the EC Soil Map. In: Computerization of land use data. Jones R. J. A., Biagi B. (eds.). EUR 11151 EN. CEC, Office for Official Publications of the EC, Luxembourg, 156.
Pleijsier K 1989. Variability in soil data. In: Bouma J and AK Bregt (editors), Land Qualities in Space and Time. PUDOC, Wageningen, pp 89-98.
Saxton KE, Rawls WJ, Romberger JS and Papendick RI 1986. Estimating Generalized Soil-water Characteristics from Texture. Soil Sci. Soc. Am. J 50, 1031-1036.
Shi, X.Z., D.S. Yu, E.D. Warner, X.Z. Pan, G.W. Petersen, Z.G. Gong, and D.C. Weindorf. 2004. Soil Database of 1:1,000,000 Digital Soil Survey and Reference System of the Chinese Genetic Soil Classification System. Soil Survey Horizons 45:129-136.
Shi, X.Z., D.S. Yu, E.D. Warner, X.Z. Pan, X. Sun, G.W. Petersen, Z.G. Gong, and H. Lin 2006a. Cross Reference System for translating Between Genetic Soil Classification of China and Soil Taxonomy. Soil Science Society of America, Journal. 70: 78-83.
Shi X. Z., D. S. Yu, G. X. Yang, H. J. Wang, W. X. Sun, G. H. Du, Z. T. Gong,2006b,Cross-reference Benchmarks for Correlating the Genetic Soil Classification of China and Chinese Soil Taxonomy. Pedosphere 16(2):147-153.
Shi X. Z., H. J. Wang, E. D. Warner, D. S. Yu, W. X. Sun and Y. C. Zhao, 2007, Cross- Reference System for Interpreting Genetic Soil Classification of China to WRB. Geoderma (in reviewing).

Harmonized World Soil Database (version 1.0) 37
Sombroek, W.G., 1984: Towards a Global Soil Resources Inventory at Scale 1:1 Million. Discussion Paper. ISRIC, Wageningen, The Netherlands.
Stolbovoy, V. 1996, Draft Physiographic Map of the Former Soviet Union and Mongolia at Scale 1:5 Million. AGLS Working Paper. FAO, Rome.
Tarnocai, C., J.M Kimble, D. Swanson, S. Goryachkin, Ye.M. Naumov, V. Stolbovoi, B. Jakobsen, G. Broll, L. Montanarella, A. Arnoldussen, O. Arnalds, and M. Yli-Halla. 2002. Northern Circumpolar Soils. 1:10,000,000 scale map. Ottawa, Canada: Research Branch, Agriculture and Agri-Food Canada. Distributed by the National Snow and Ice Data Center/World Data Center for Glaciology, Boulder, CO.
The Office for the Second National Soil Survey of China. 1995, Soil map of People's Republic of China. Mapping Press, p. 1-60.
The Office for the Second National Soil Survey of China. 1993-1996. Soil Species of China. Volume I-VI. Chinese Agriculture Press, Beijing.
USDA-NRCS 2004. Soil Survey Laboratory Manual Soil Survey Investigations Report 42 (ver. 4.0) [Available at ftp://ftp-c.sc.egov.usda.gov/NSSC/Lab_Methods_Manual/ SSIR42_2004_ view.pdf ; verified 11 Jan 2007], USDA-National Resources Conservation Service, Washington.
van Engelen VWP, Batjes NH, Dijkshoorn K and Huting J 2005. Harmonized Global Soil Resources Database (Final Report). Report 2005/06, FAO and ISRIC – World Soil Information, Wageningen.
Van Lynden, G.W.J. 1994. Draft Physiographic Map of Asia. FAO/ISRIC Working Paper.
Van Ranst, E., Vanmechelen, L., Thomasson, A.J., Daroussin, J., Hollis, J.M., Jones, R.J.A., Jamagne, M. and King, D. (1995). Elaboration of an extended knowledge database to interpret the 1:1,000,000 EU Soil Map for environmental purposes. In: D. King, R.J.A. Jones & A.J. Thomasson (eds.). European Land Information Systems for Agro-environmental Monitoring. EUR 16232 EN, p. 71-84. Office for Official Publications of the European Communities, Luxembourg.
van Reeuwijk LP 1983. On the way to improve international soil classification and correlation: the variability of soil analytical data. Annual Report 1983, ISRIC, Wageningen (http://www.isric.org/isric/webdocs/Docs/annual_report_1983.pdf, p. 7-13).
Vogel AW 1994. Comparability of soil analytical data: determinations of cation exchange capacity, organic carbon, soil reaction, bulk density, and volume percentage of water at selected pF values by different methods. Work. Pap. 94/07, ISRIC, Wageningen.
Wen Ting-tiang. Draft Physiographic Map of Latin America. AGLS Working Paper. FAO, Rome, 1993.
Zobler L 1986. A world soil file for global climate modeling. Technical Memorandum 87802, NASA Goddard Institute for Space Studies (GISS), New York, NY.