Embed Size (px)
Citation preview

talk about tracing
improve tracing
using
hardware
1 Tracing2 Hardware3 Improvements

1
Tracing
“a technique used to understand what is going on in a system in
order to debug or monitor it”
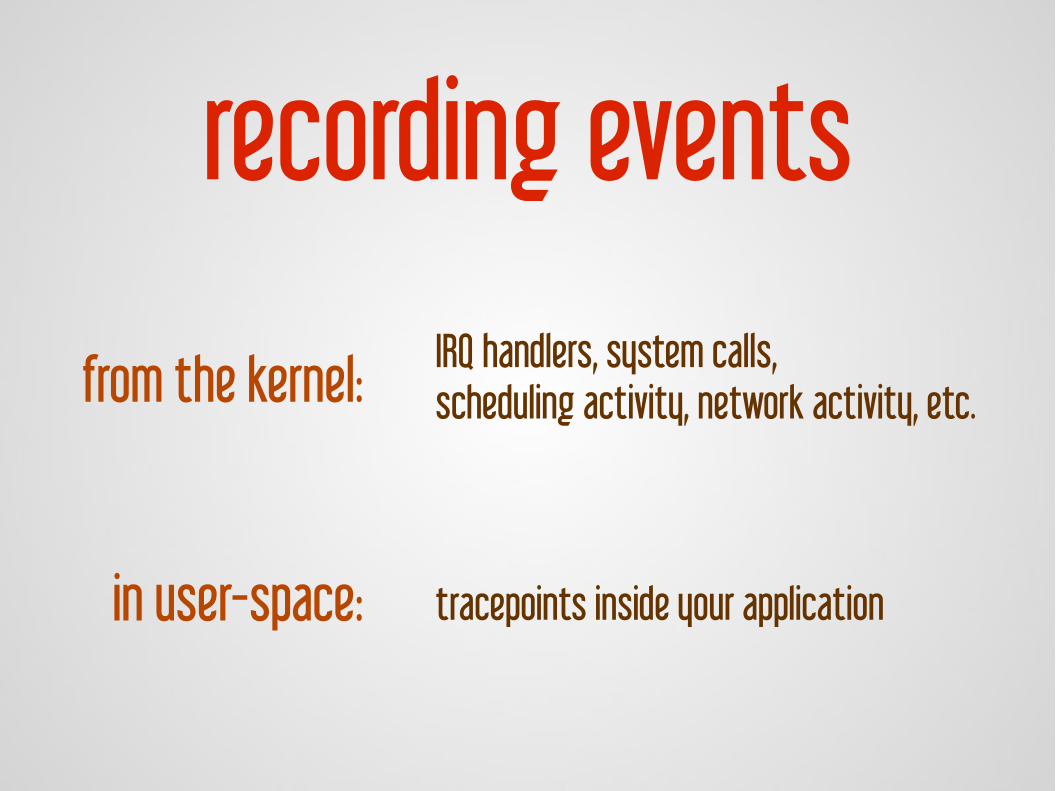
recording events
from the kernel:
in user-space: tracepoints inside your application
IRQ handlers, system calls,scheduling activity, network activity, etc.
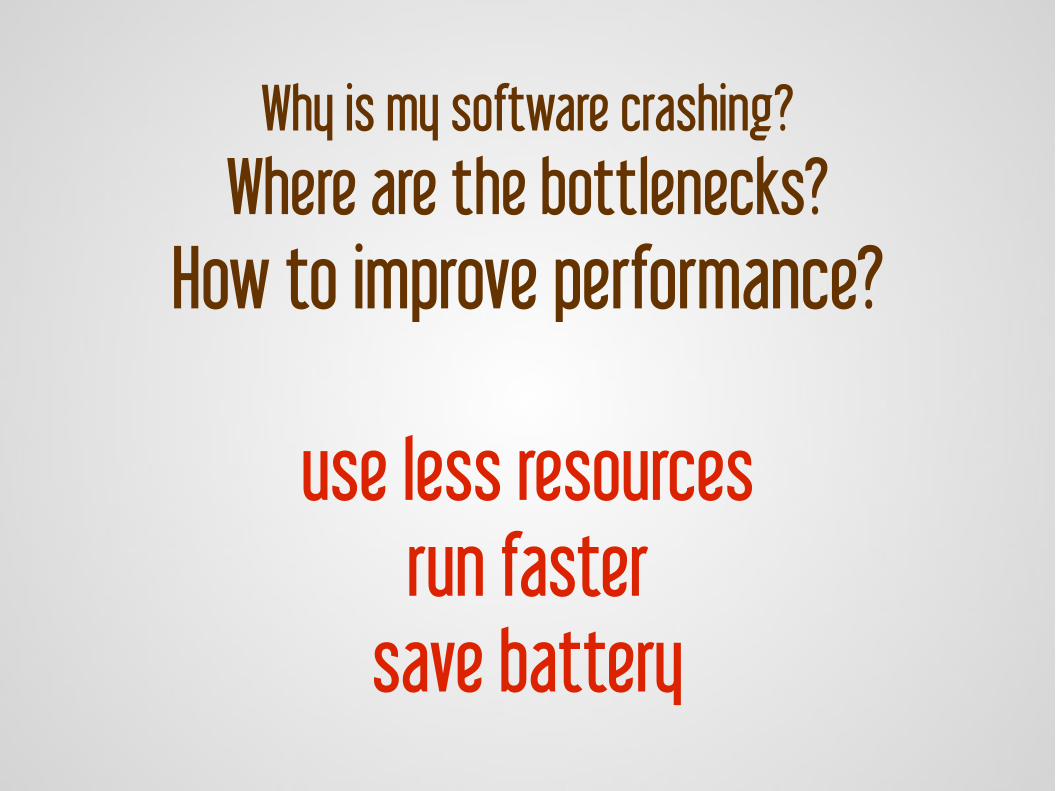
Why is my software crashing?Where are the bottlenecks?
How to improve performance?
use less resourcesrun faster
save battery
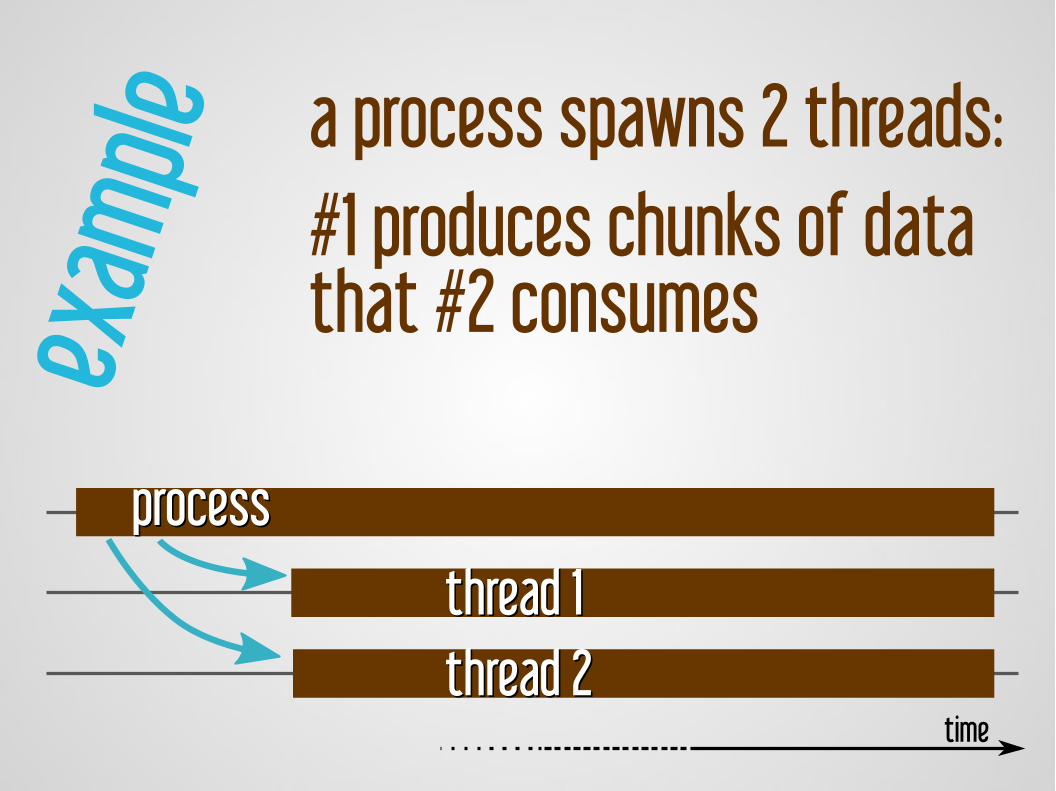
a process spawns 2 threads:#1 produces chunks of datathat #2 consumes
thread 1thread 1thread 2thread 2
processprocess
time
exam
ple
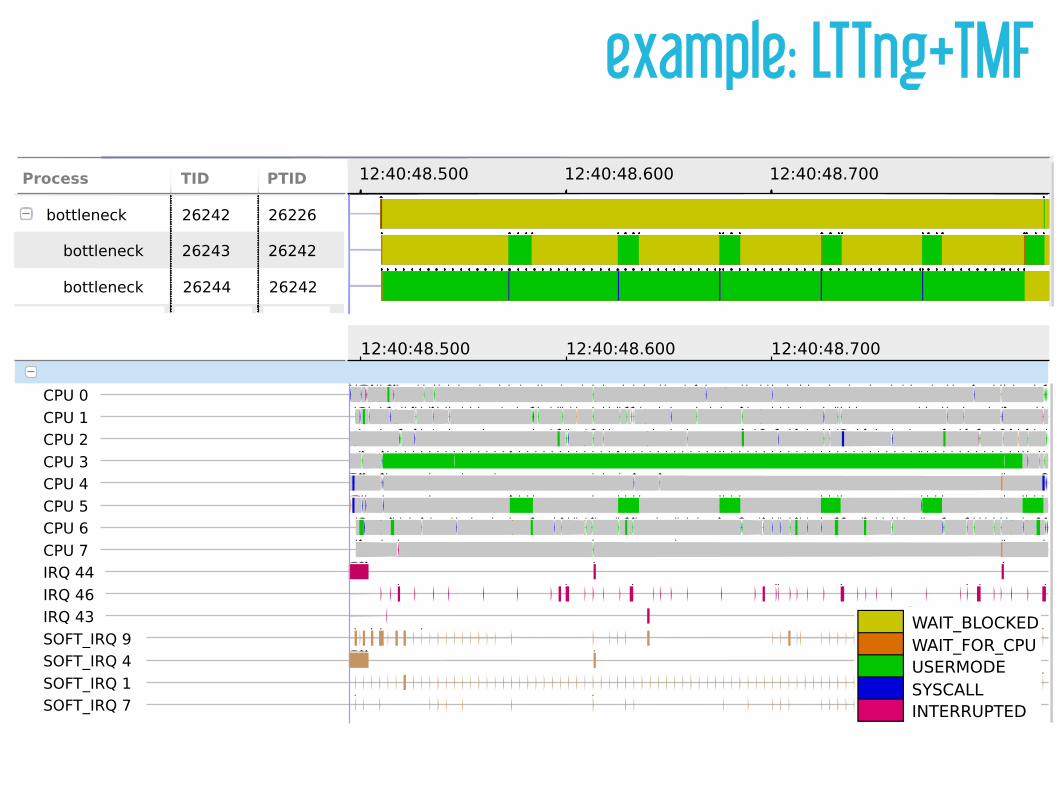
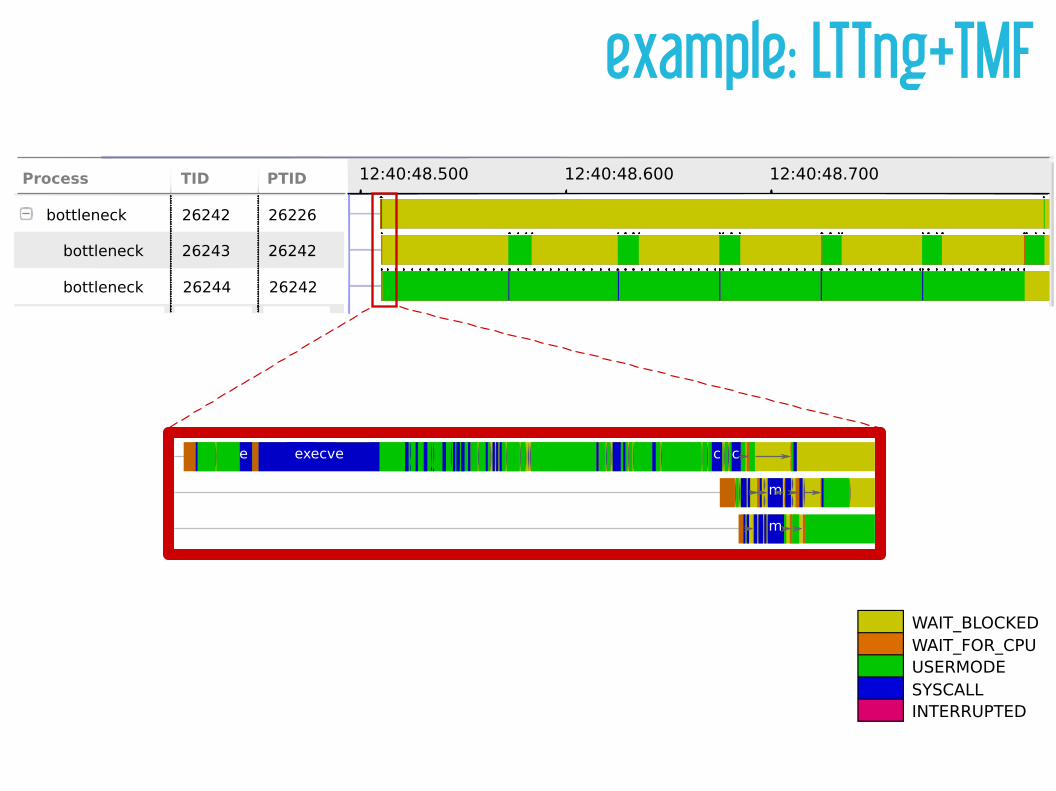
example: LTTng+TMF12:40:48.500 12:40:48.600 12:40:48.700Process TID PTID
bottleneck
bottleneck
bottleneck
26242
26243
26244
26226
26242
26242
12:40:48.500 12:40:48.600 12:40:48.700
CPU 0
CPU 1CPU 2
CPU 3CPU 4
CPU 5CPU 6
CPU 7IRQ 44
IRQ 46IRQ 43
SOFT_IRQ 9SOFT_IRQ 4
SOFT_IRQ 1SOFT_IRQ 7
WAIT_BLOCKEDWAIT_FOR_CPUUSERMODESYSCALLINTERRUPTED
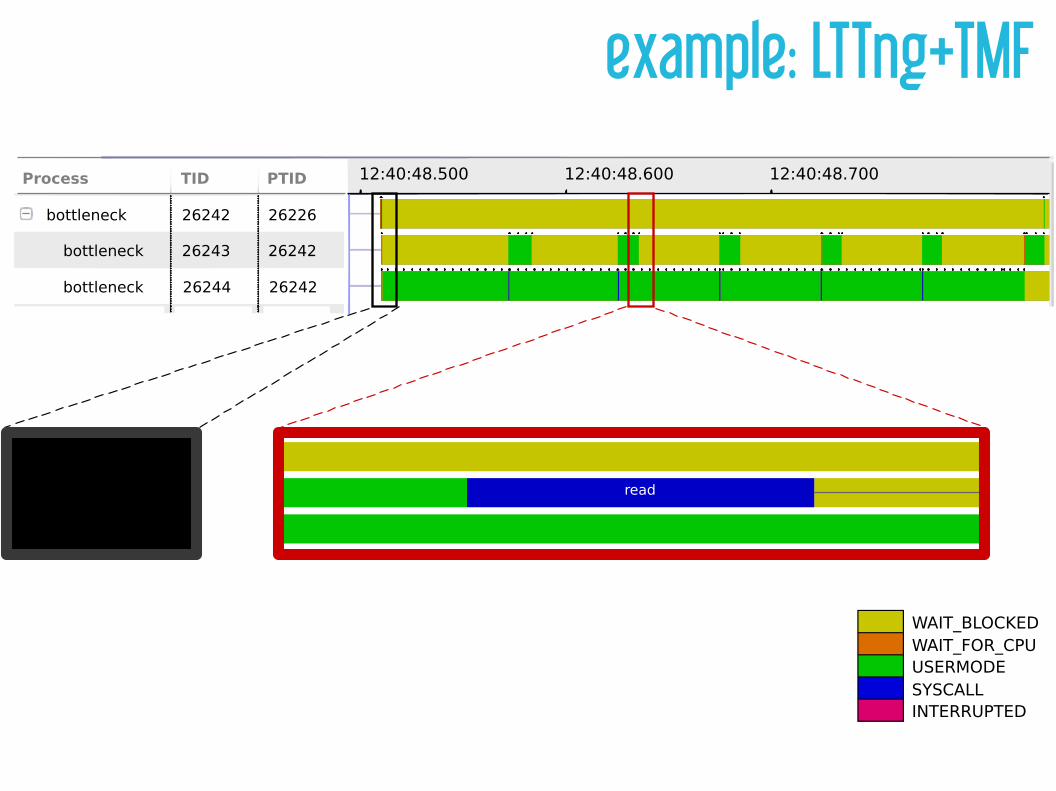
example: LTTng+TMF12:40:48.500 12:40:48.600 12:40:48.700Process TID PTID
bottleneck
bottleneck
bottleneck
26242
26243
26244
26226
26242
26242
WAIT_BLOCKEDWAIT_FOR_CPUUSERMODESYSCALLINTERRUPTED
execvee c c
m
m
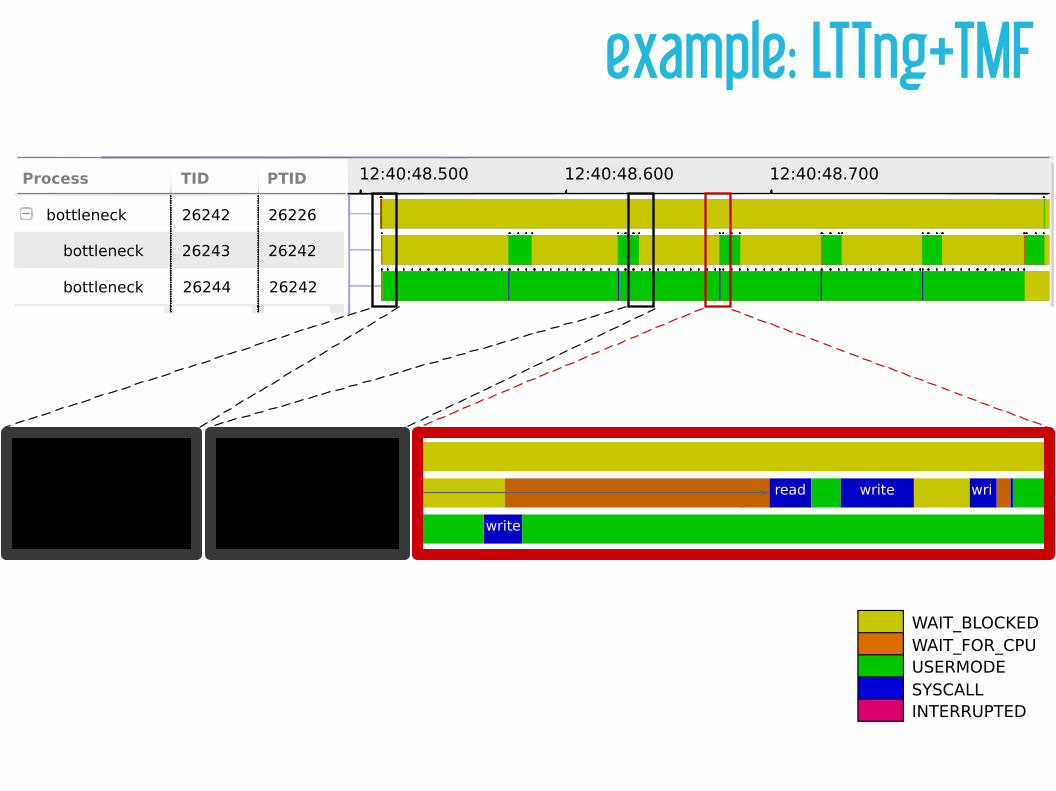
example: LTTng+TMF12:40:48.500 12:40:48.600 12:40:48.700Process TID PTID
bottleneck
bottleneck
bottleneck
26242
26243
26244
26226
26242
26242
WAIT_BLOCKEDWAIT_FOR_CPUUSERMODESYSCALLINTERRUPTED
read
exec
example: LTTng+TMF12:40:48.500 12:40:48.600 12:40:48.700Process TID PTID
bottleneck
bottleneck
bottleneck
26242
26243
26244
26226
26242
26242
WAIT_BLOCKEDWAIT_FOR_CPUUSERMODESYSCALLINTERRUPTED
read write wri
write
read
exec
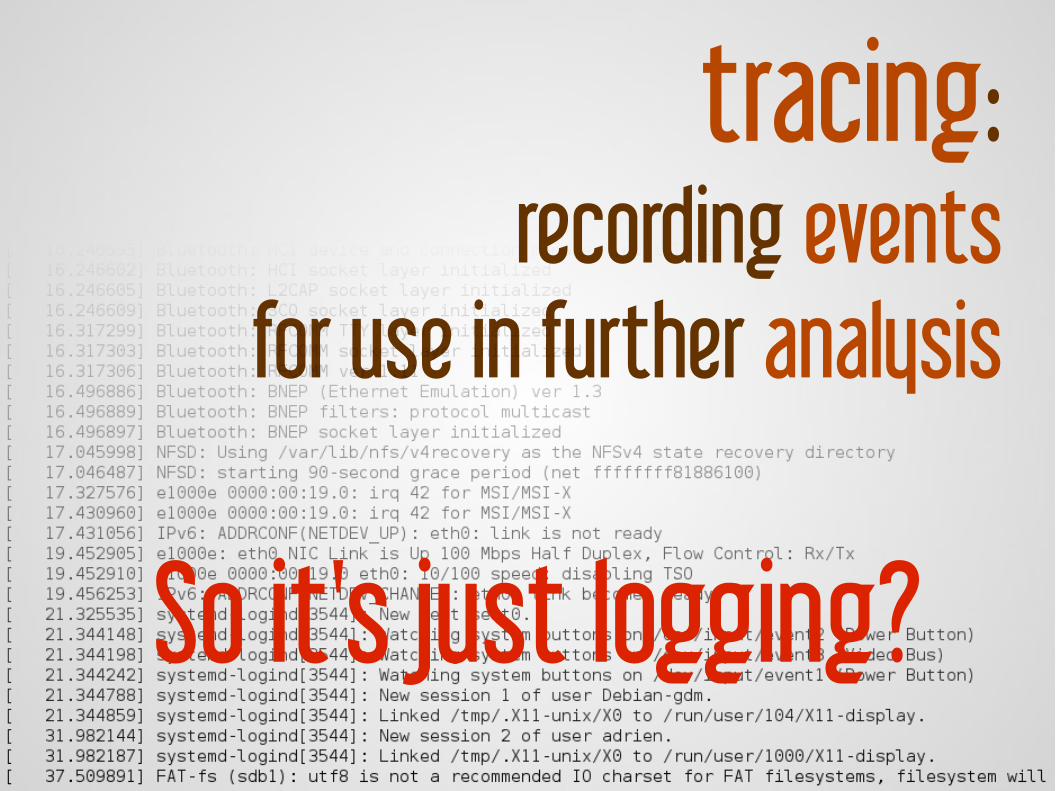
tracing:recording events
for use in further analysis
tracing:recording events
for use in further analysis
So it's just logging?
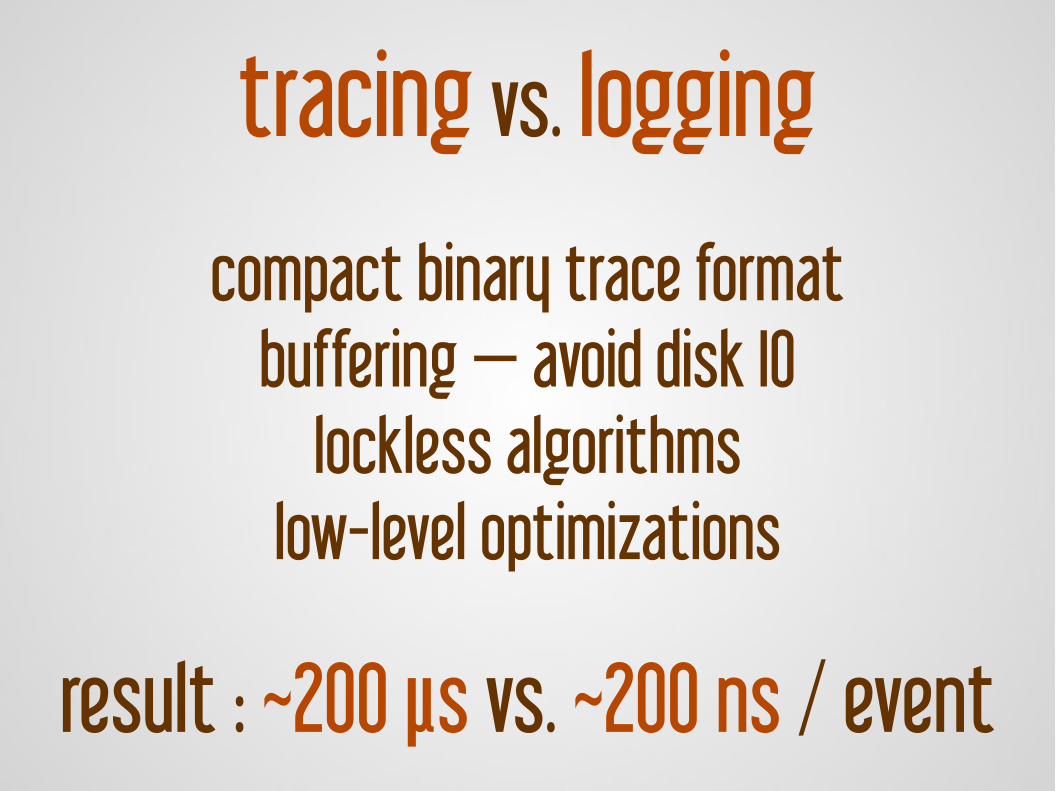
tracing vs. logging
compact binary trace formatbuffering — avoid disk IO
lockless algorithmslow-level optimizations
result : ~200 μs vs. ~200 ns / event
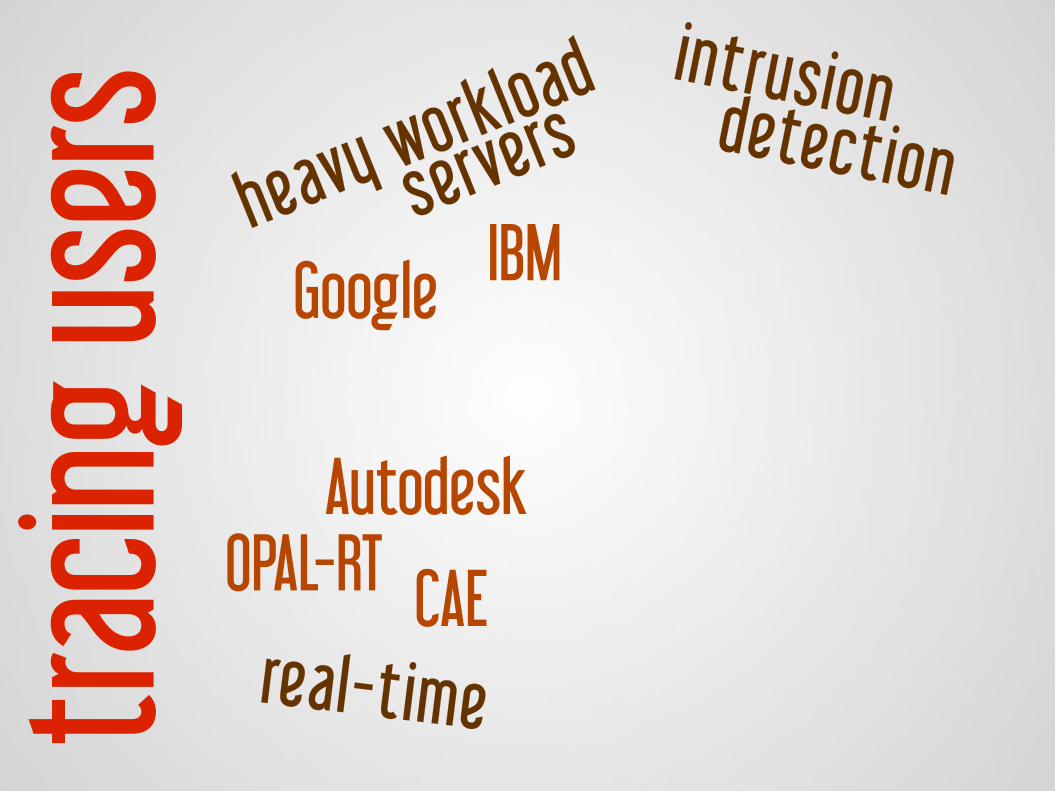
tracin
g us
ers heavy workload
servers
real-time
intrusion detection
Google IBM
Autodesk
CAEOPAL-RT
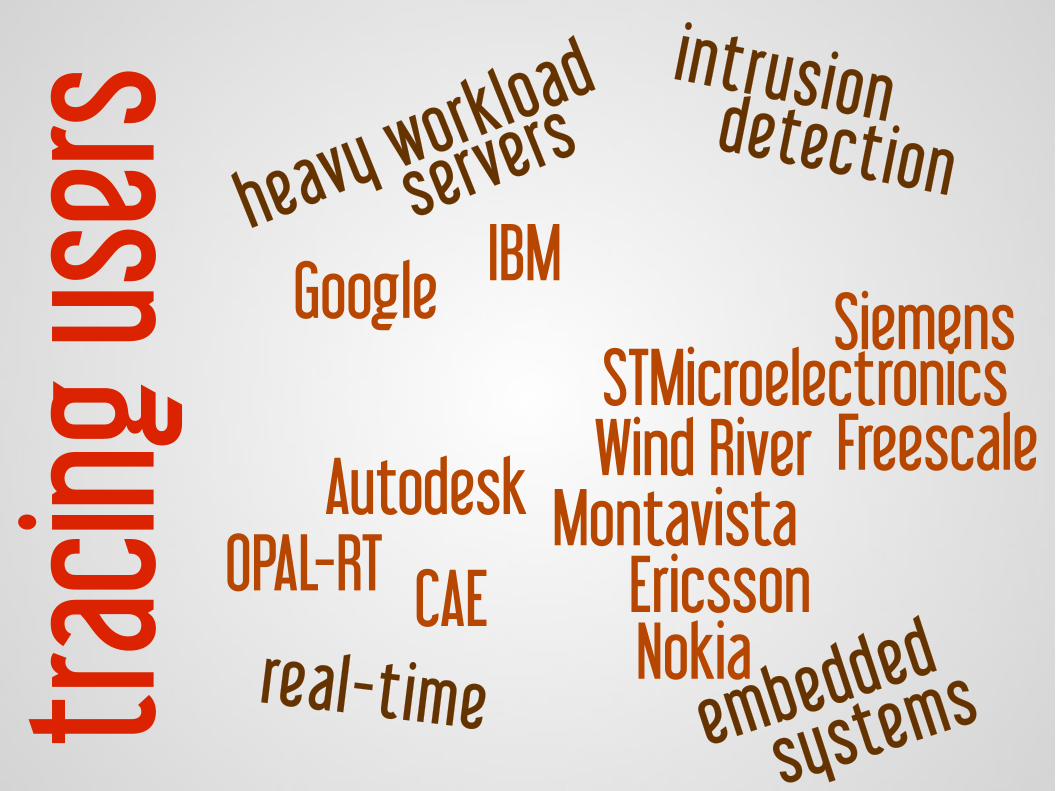
tracin
g us
ers heavy workload
servers
embedded
systemsreal-time
intrusion detection
Google IBM
Ericsson
FreescaleMontavista
Nokia
SiemensSTMicroelectronicsWind RiverAutodesk
CAEOPAL-RT
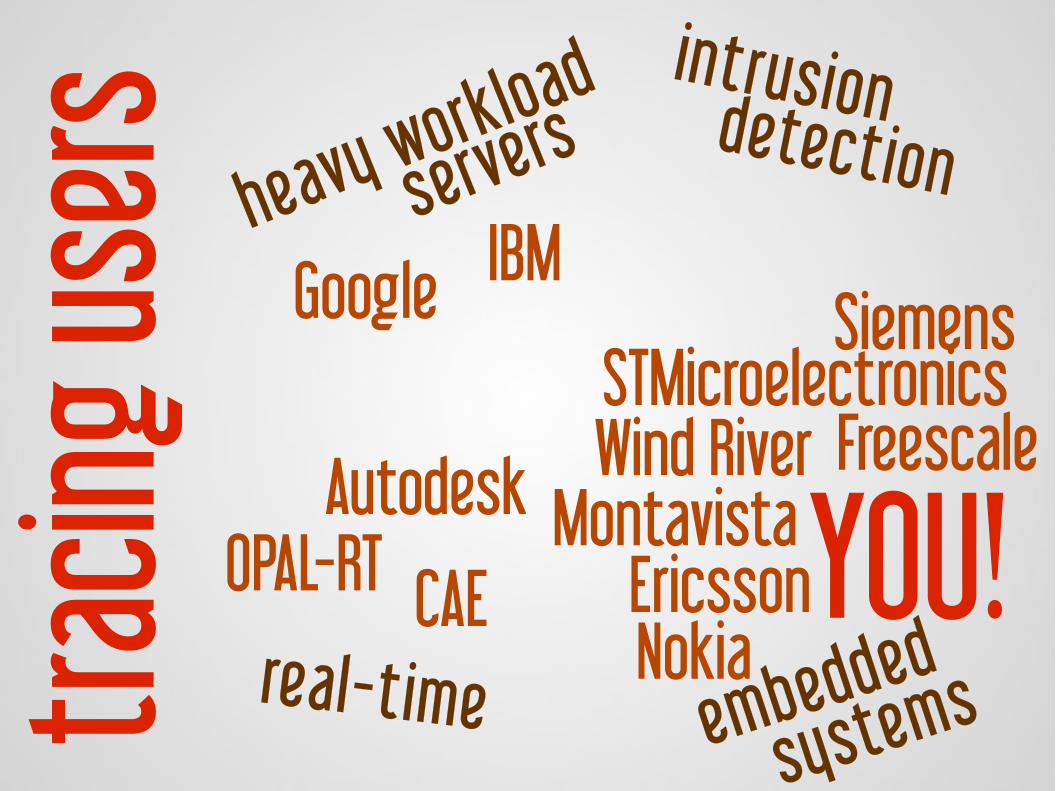
tracin
g us
ers heavy workload
servers
embedded
systemsreal-time
intrusion detection
YOU!
Google IBM
Ericsson
FreescaleMontavista
Nokia
SiemensSTMicroelectronicsWind RiverAutodesk
CAEOPAL-RT
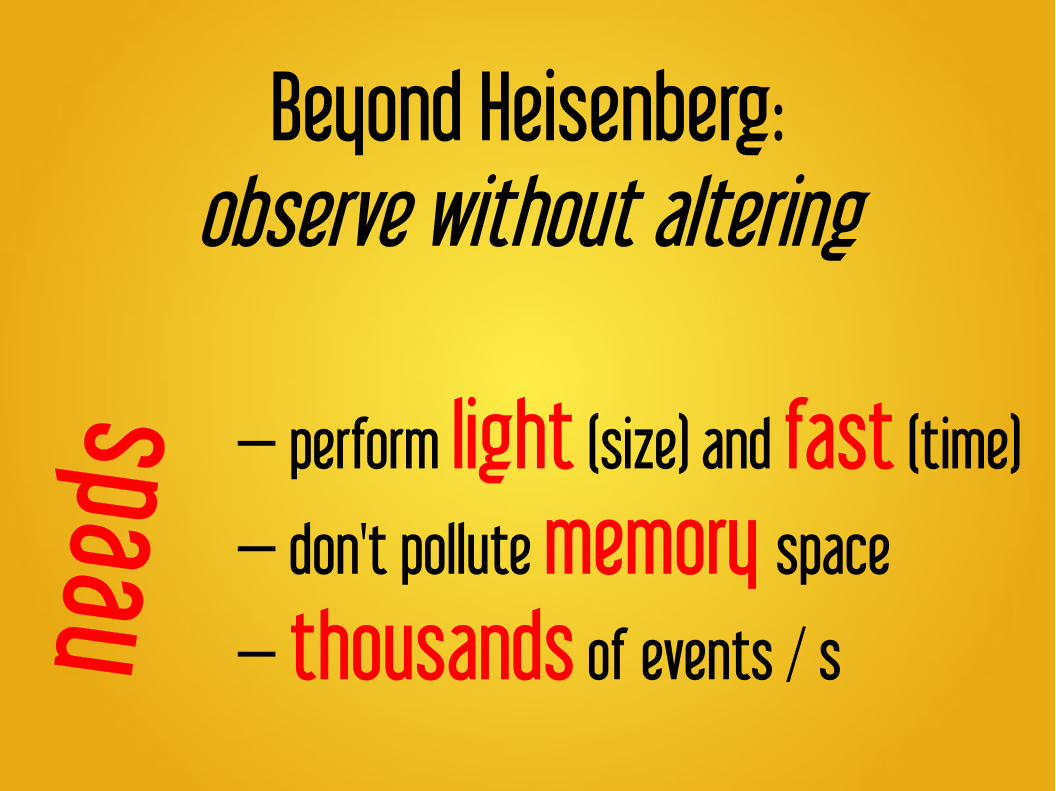
Beyond Heisenberg:observe without altering
— perform light (size) and fast (time)
— don't pollute memory space
— thousands of events / sneed
s
2
Hardware
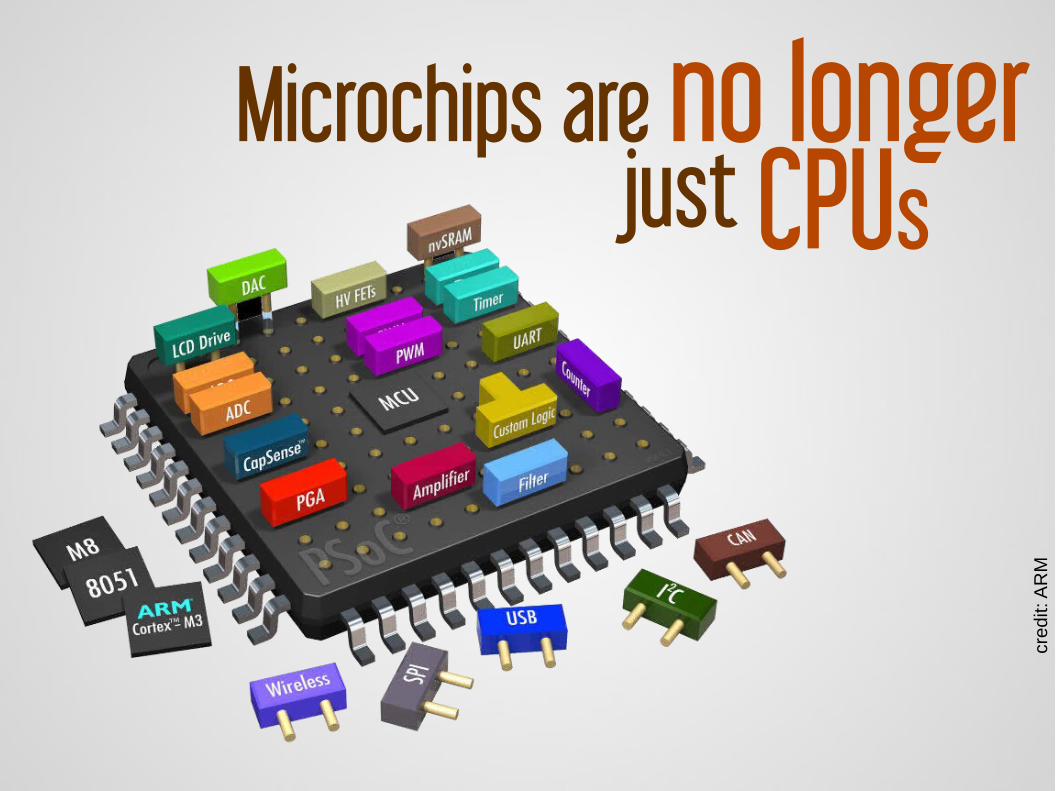
Microchips are no longer just CPUs
cred
it: A
RM
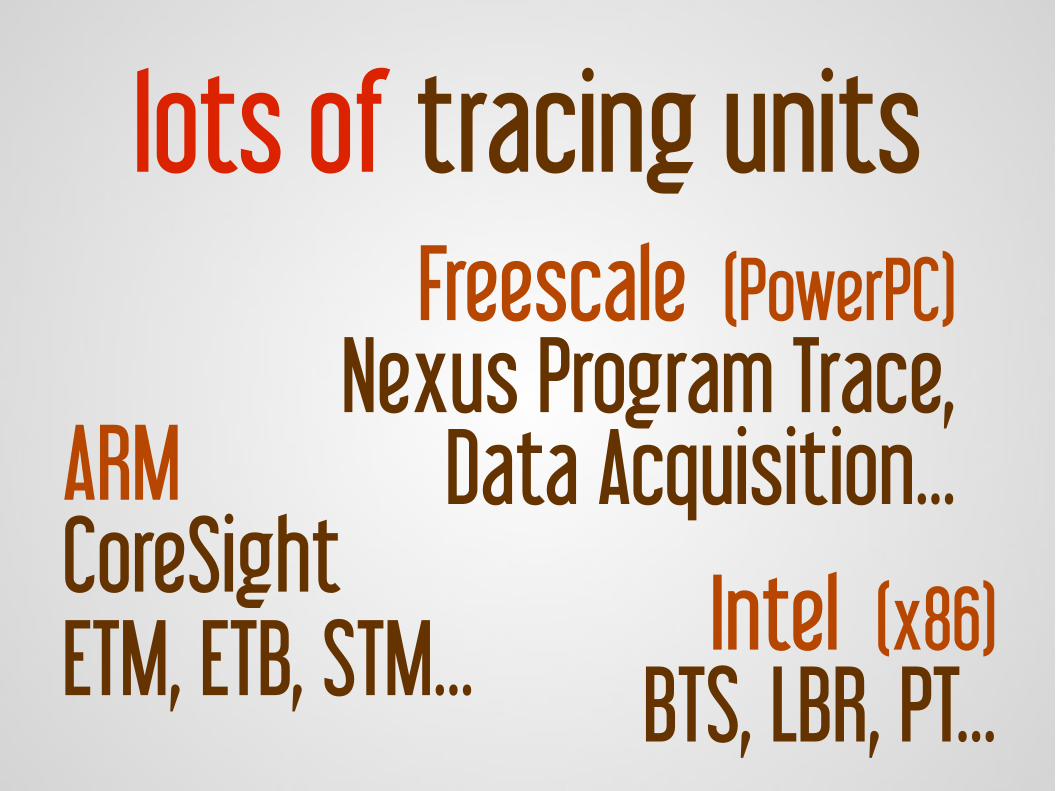
Intel (x86)BTS, LBR, PT...
Freescale (PowerPC)Nexus Program Trace,
Data Acquisition...ARMCoreSightETM, ETB, STM...
lots of tracing units
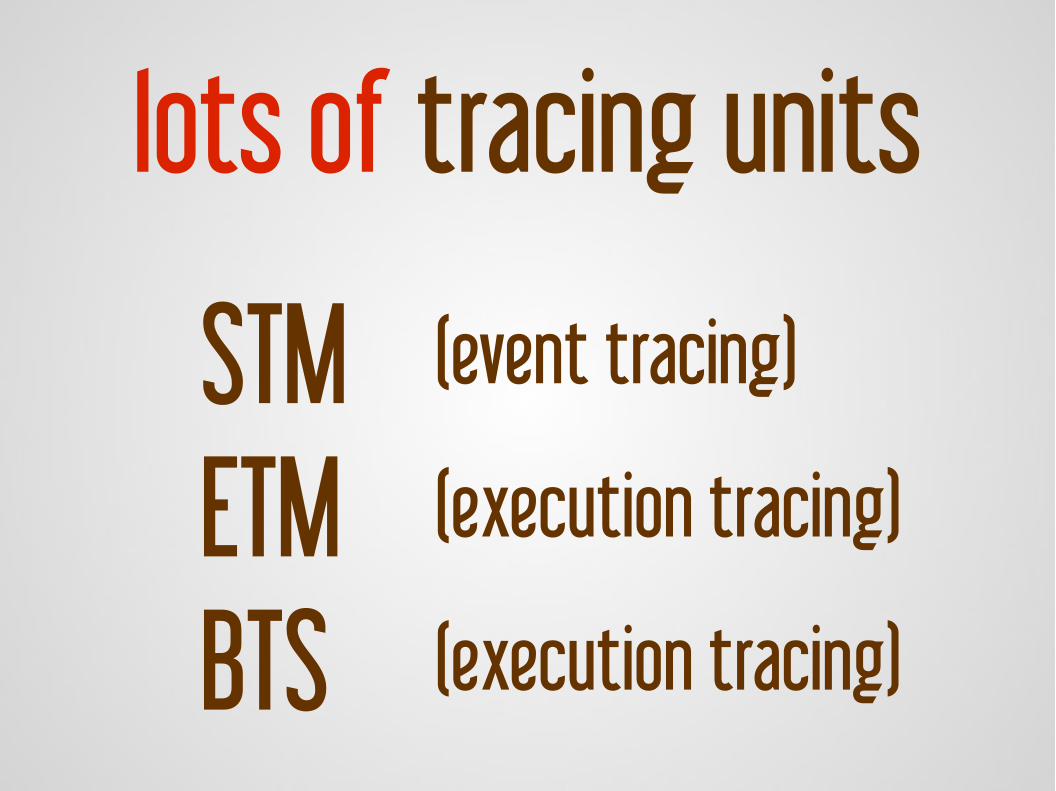
STM (event tracing)
ETM (execution tracing)
BTS (execution tracing)
lots of tracing units
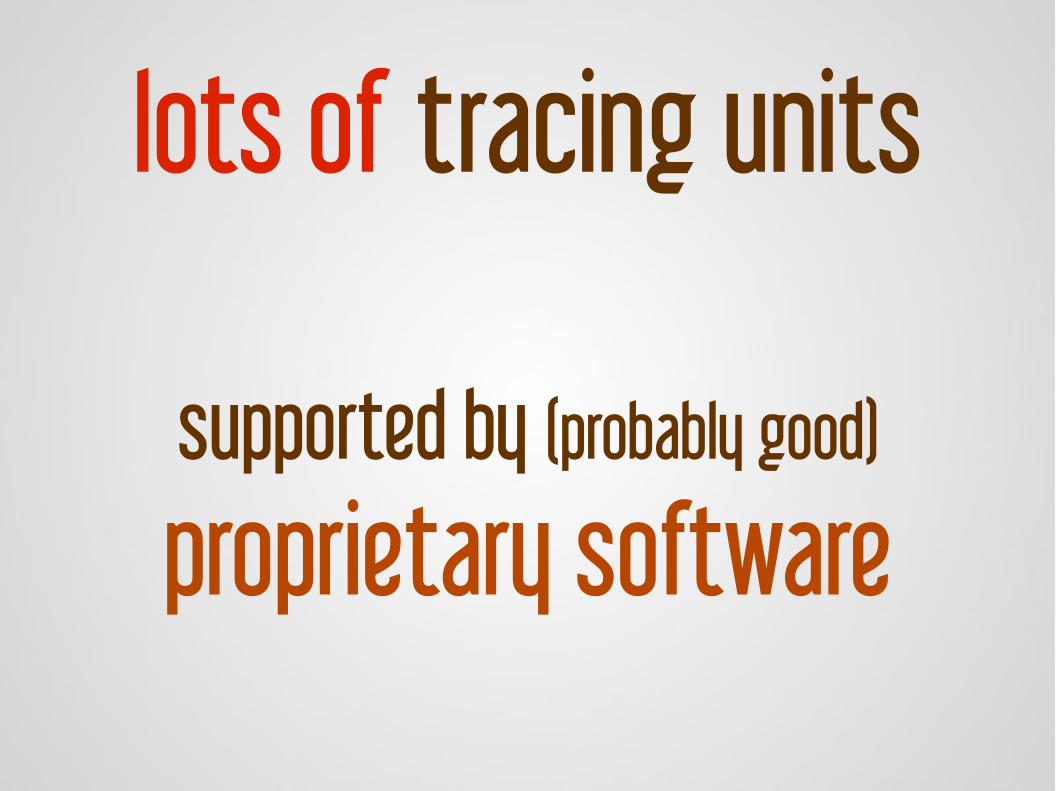
supported by (probably good) proprietary software
lots of tracing units

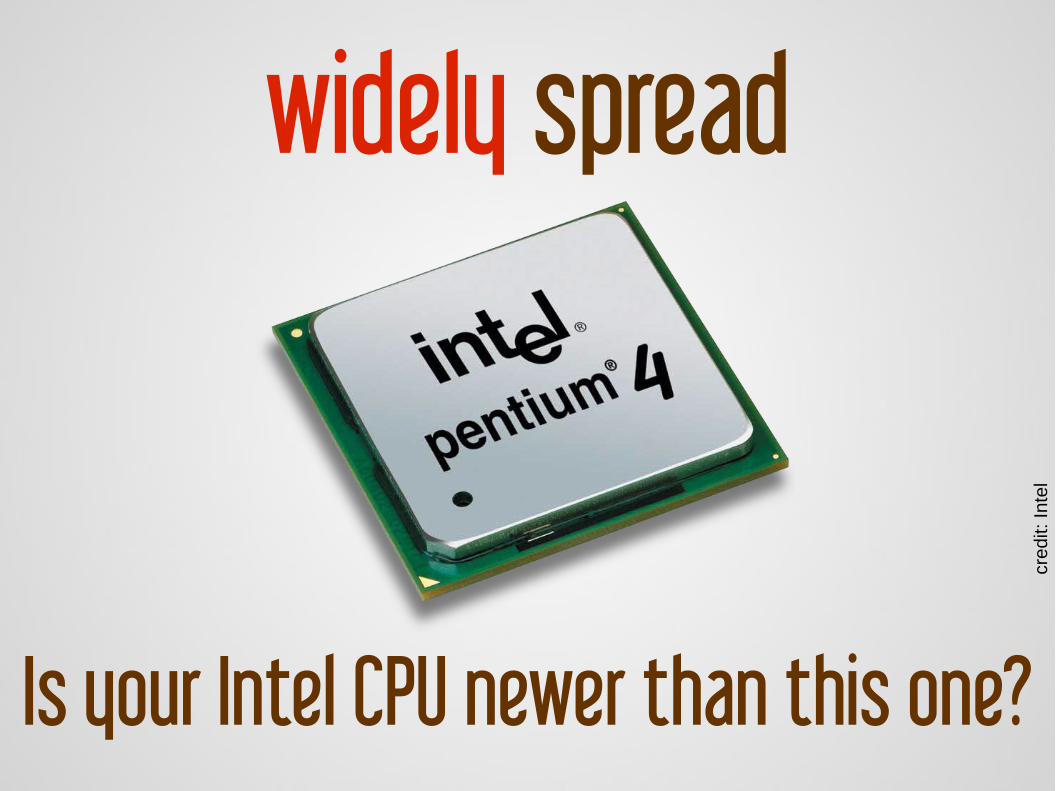
Do you have one of these?
widely spread
cred
it: S
amsu
ng,
tabl
eto
lic.c
om,
play
er.d
e, d
igita
ltren
ds.c
om
widely spread
Is your Intel CPU newer than this one?
cred
it: I
ntel

3
Improvements

3
Improvements1/3 STM on ARM
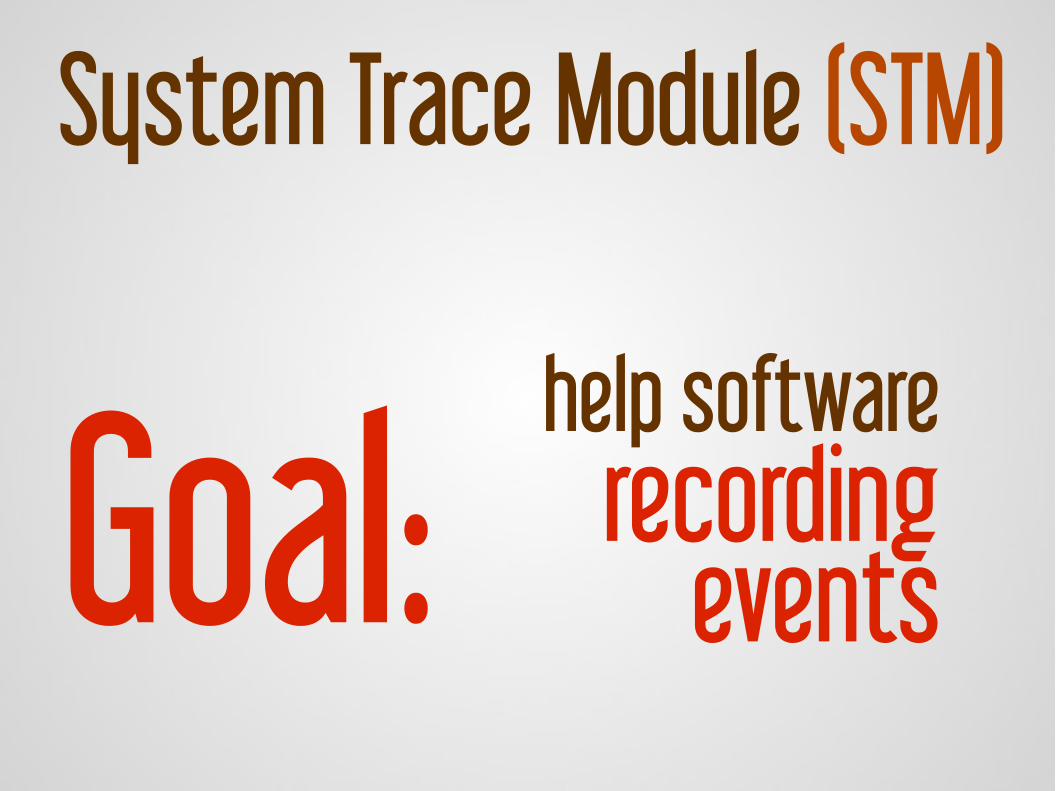
System Trace Module (STM)
help softwarerecording
eventsGoal:
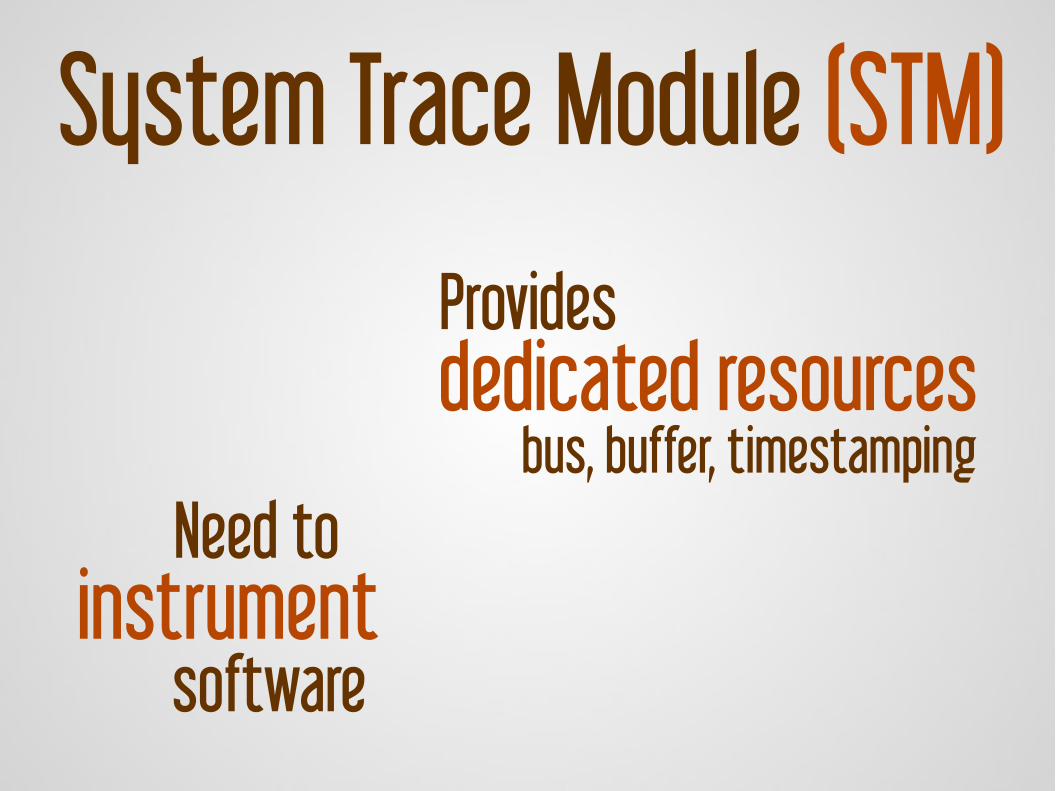
System Trace Module (STM)
Providesdedicated resources
bus, buffer, timestampingNeed to
instrumentsoftware
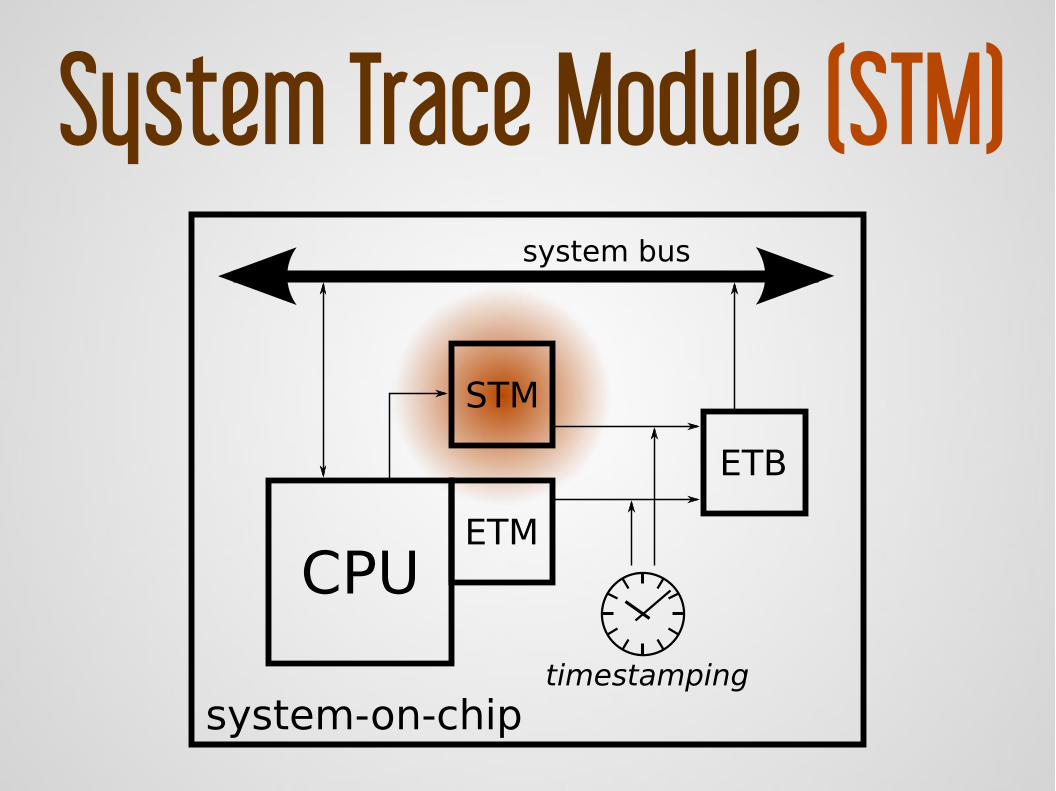
CPUETM
STM
ETB
system bus
timestamping
system-on-chip
System Trace Module (STM)
imple
ment
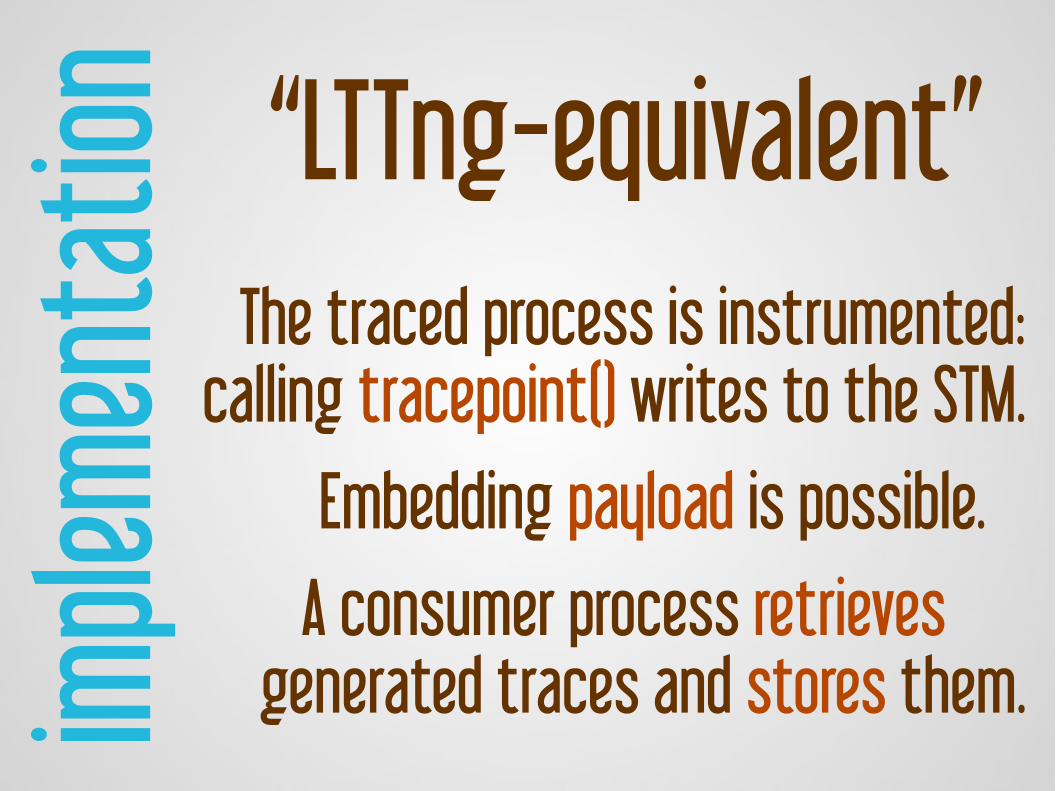
ation “LTTng-equivalent”
The traced process is instrumented:calling tracepoint() writes to the STM.
Embedding payload is possible. A consumer process retrieves
generated traces and stores them.
imple
ment
ation
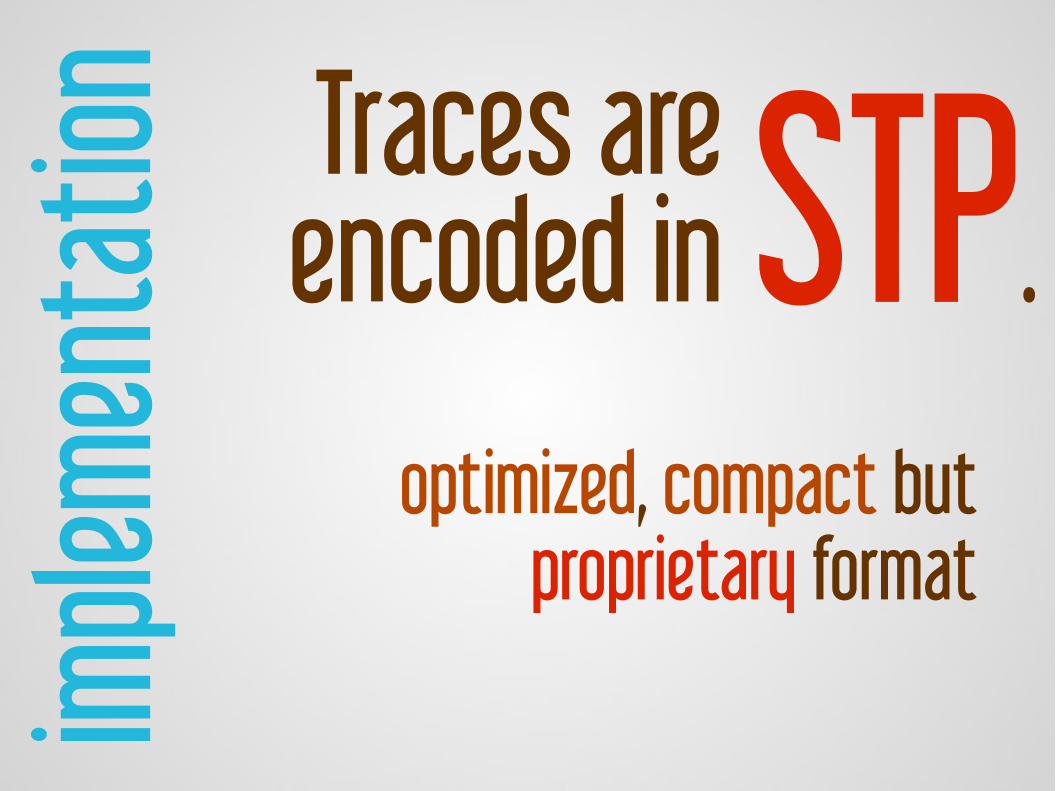
optimized, compact butproprietary format
Traces areencoded in STP.
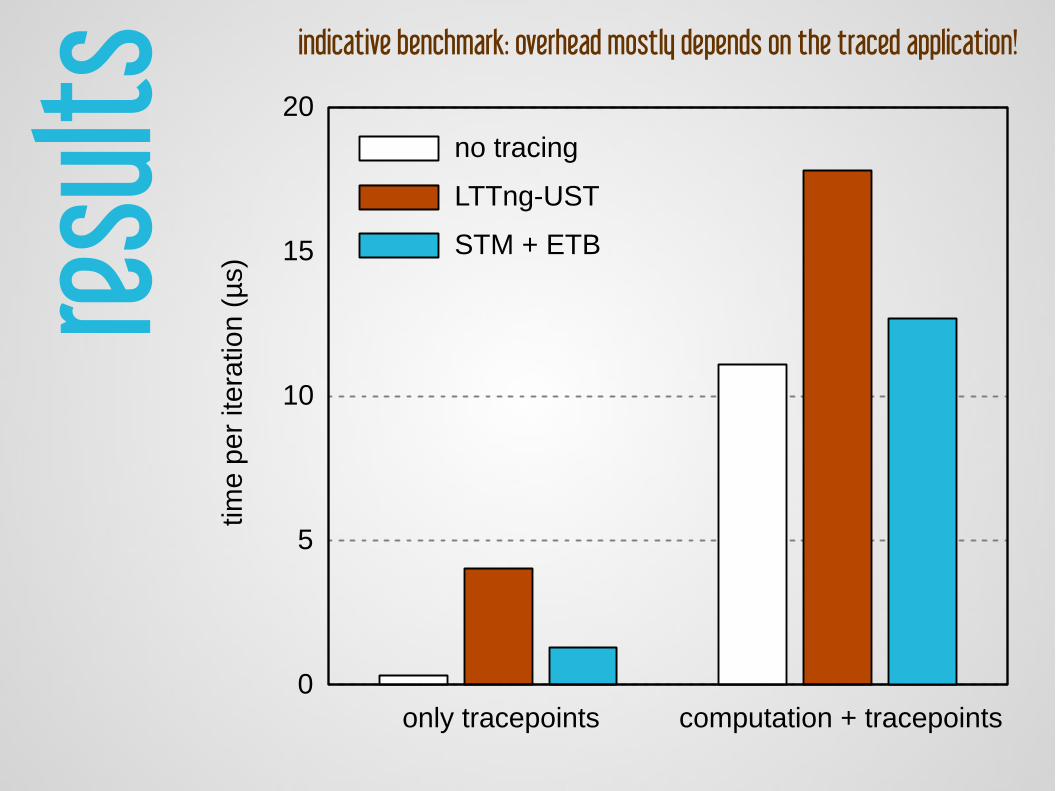
result
s
0
5
10
15
20
only tracepoints computation + tracepoints
time
per
itera
tion
(µs)
no tracing
LTTng-UST
STM + ETB
indicative benchmark: overhead mostly depends on the traced application!
result
s
0
5
10
15
20
only tracepoints computation + tracepoints
time
per
itera
tion
(µs)
no tracing
LTTng-UST
STM + ETB
3
Improvements2/3 ETM on ARM
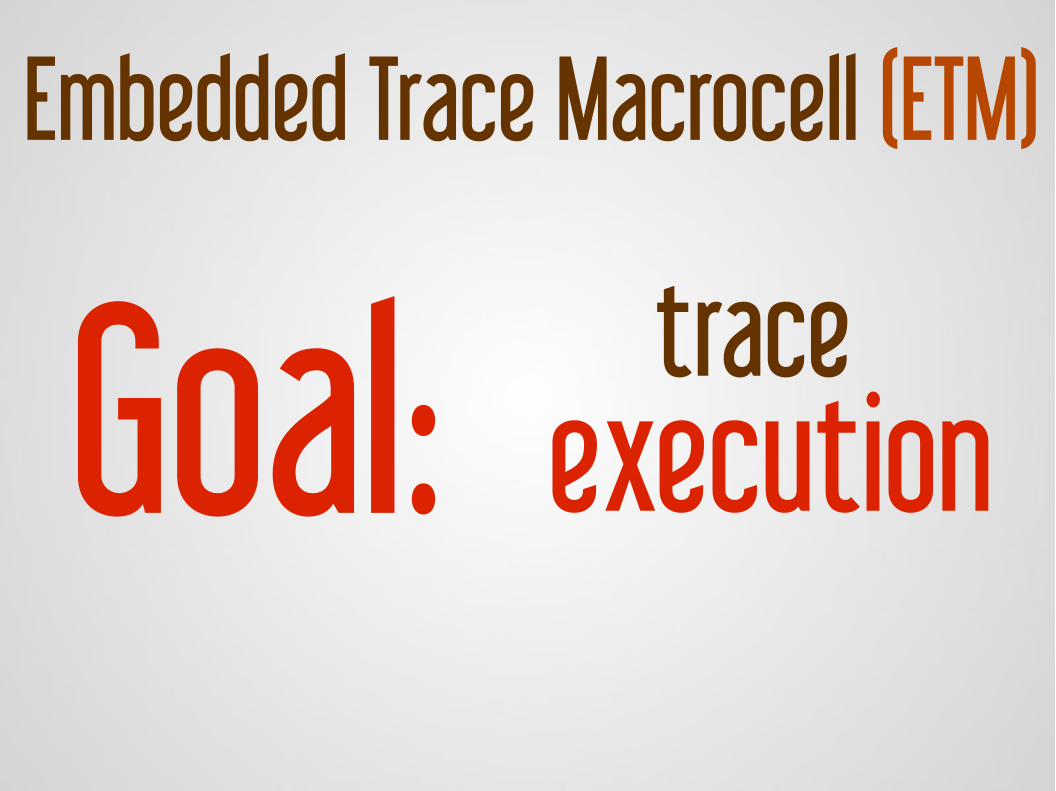
trace executionGoal:
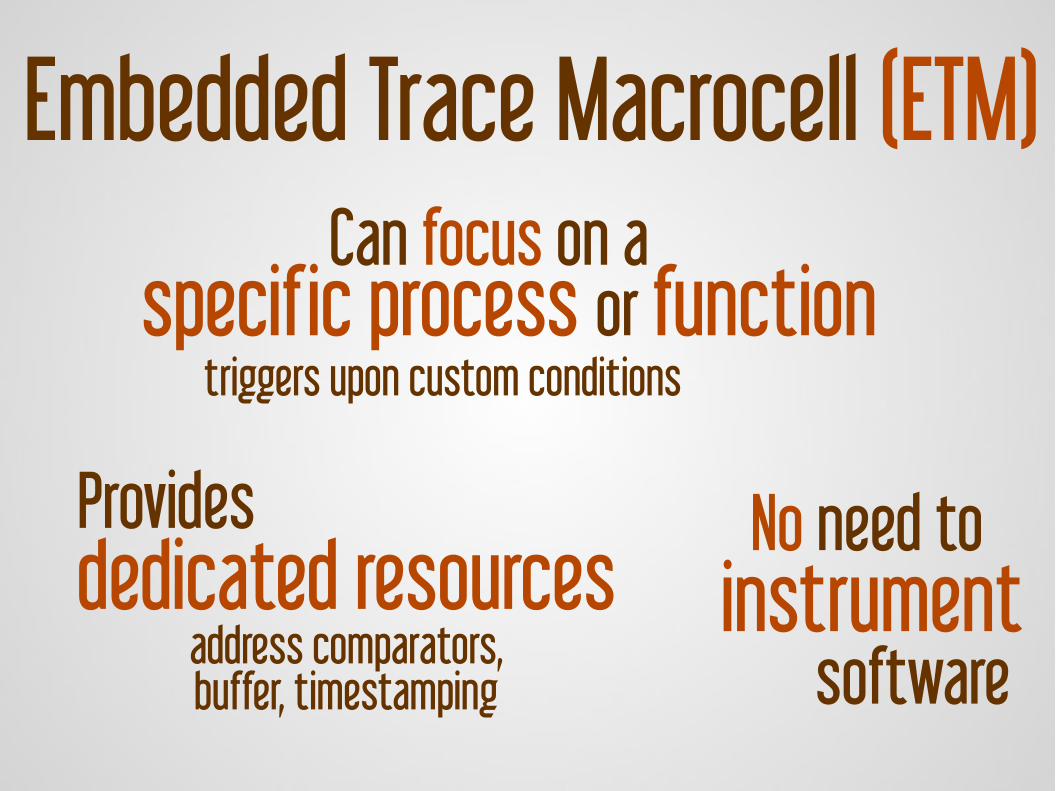
Embedded Trace Macrocell (ETM)
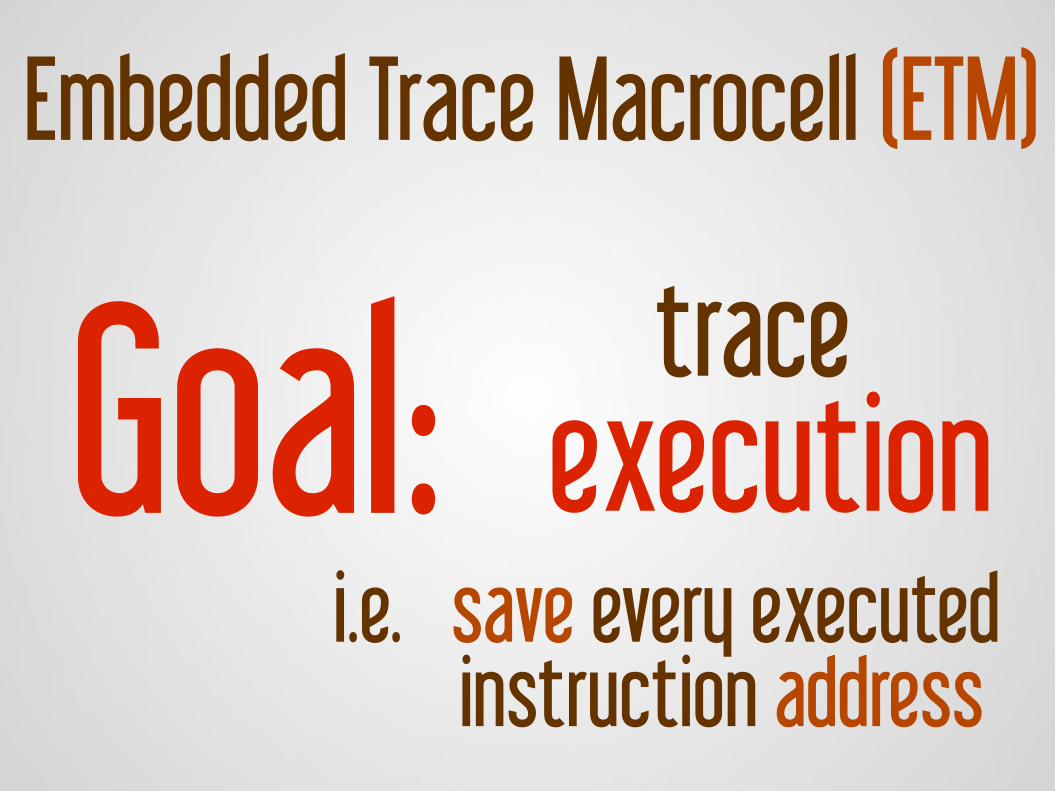
trace executionGoal:
Embedded Trace Macrocell (ETM)
i.e. save every executedinstruction address
Embedded Trace Macrocell (ETM)
Providesdedicated resources
address comparators,buffer, timestamping
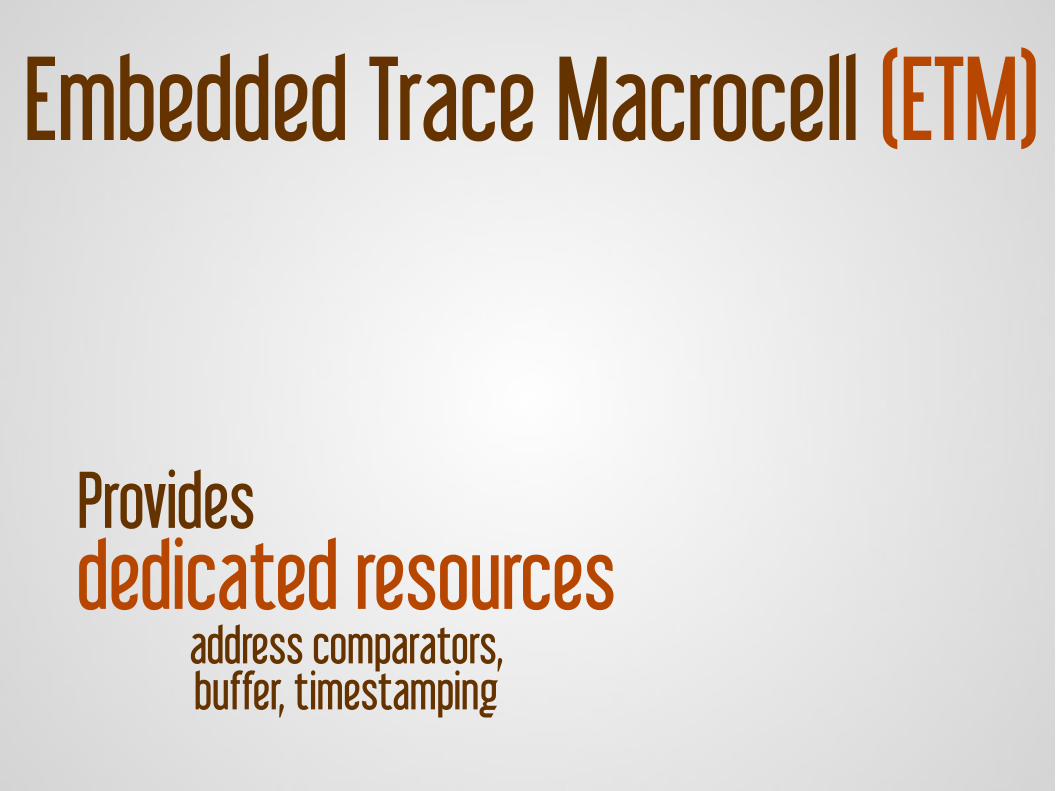
Embedded Trace Macrocell (ETM)
Providesdedicated resources
address comparators,buffer, timestamping
Can focus on aspecific process or function triggers upon custom conditions
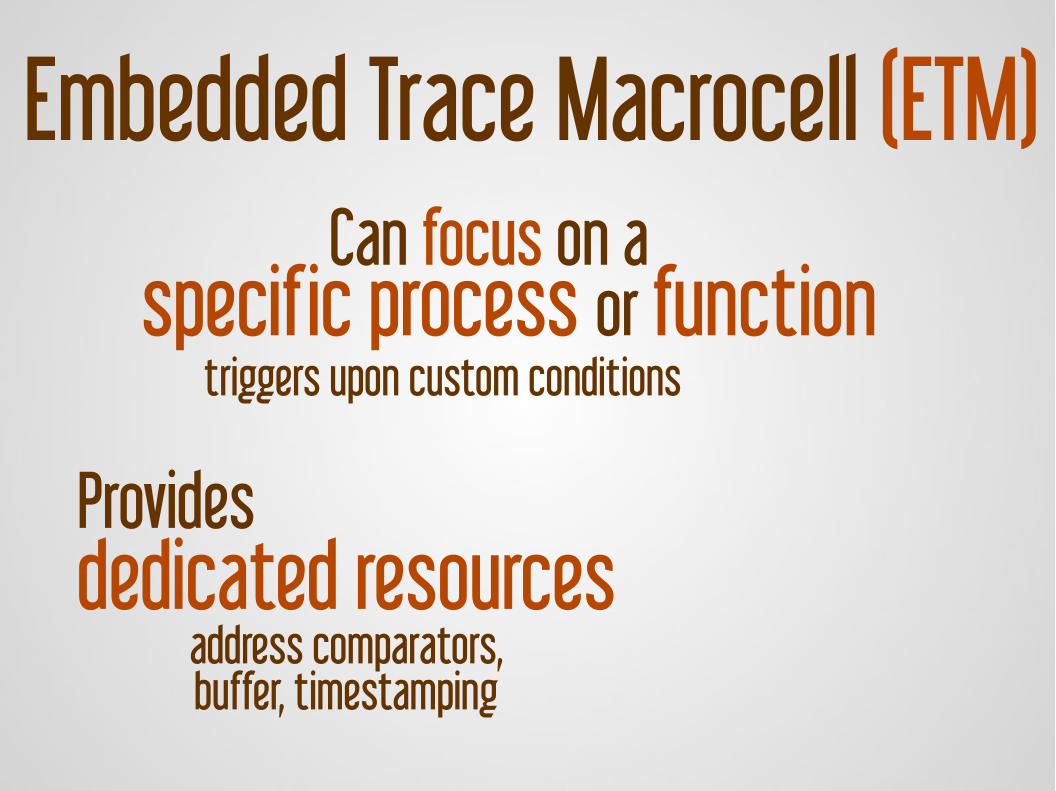
Embedded Trace Macrocell (ETM)
Providesdedicated resources
address comparators,buffer, timestamping
No need to instrument
software
Can focus on aspecific process or function triggers upon custom conditions
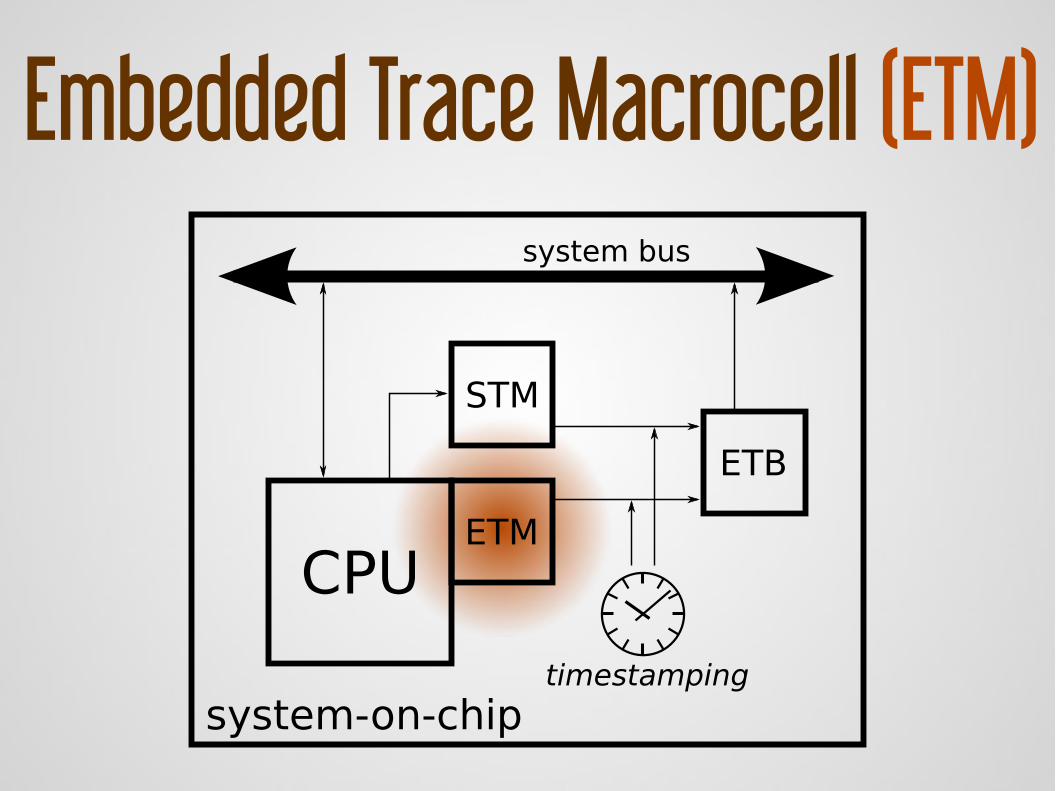
CPUETM
STM
ETB
system bus
timestamping
system-on-chip
Embedded Trace Macrocell (ETM)
imple
ment
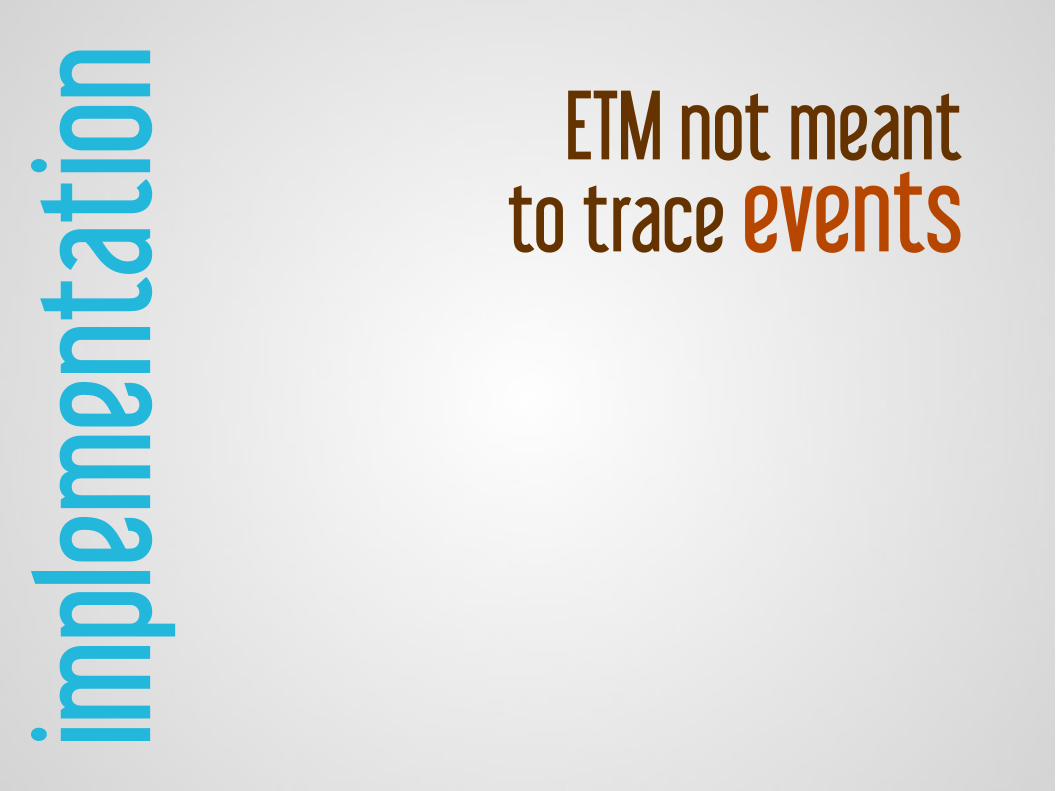
ation ETM not meant
to trace events
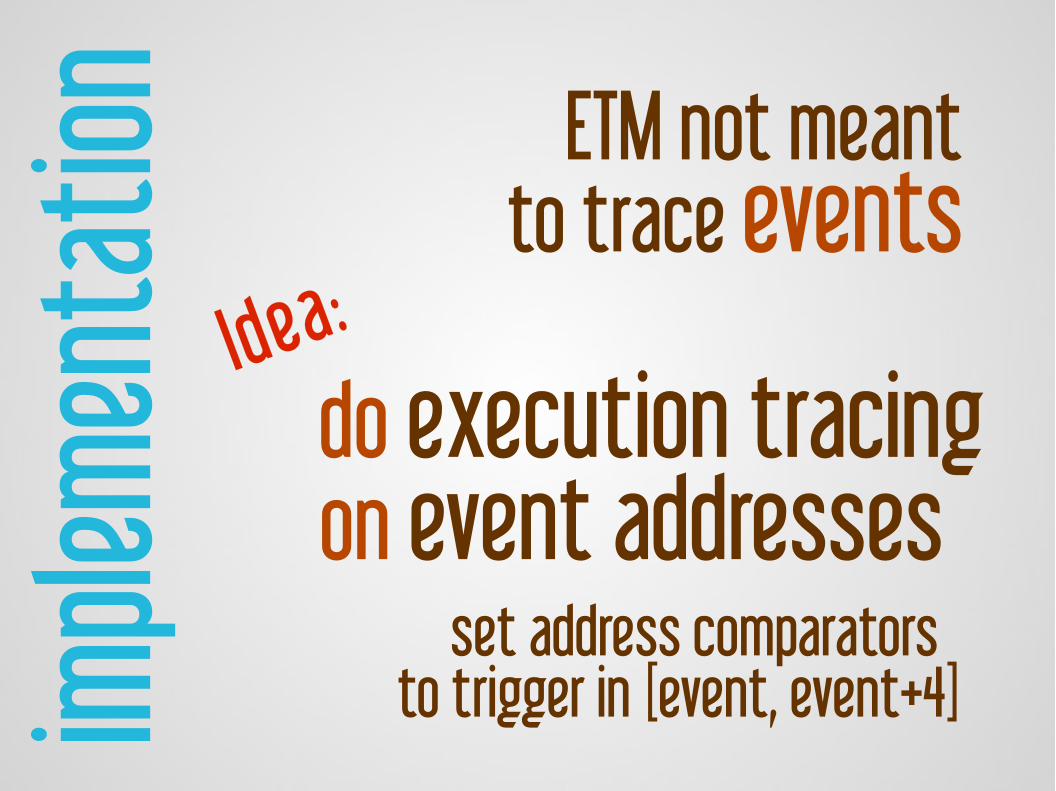
imple
ment
ation
do execution tracingon event addresses
set address comparators to trigger in [event, event+4]
ETM not meantto trace events
Idea:
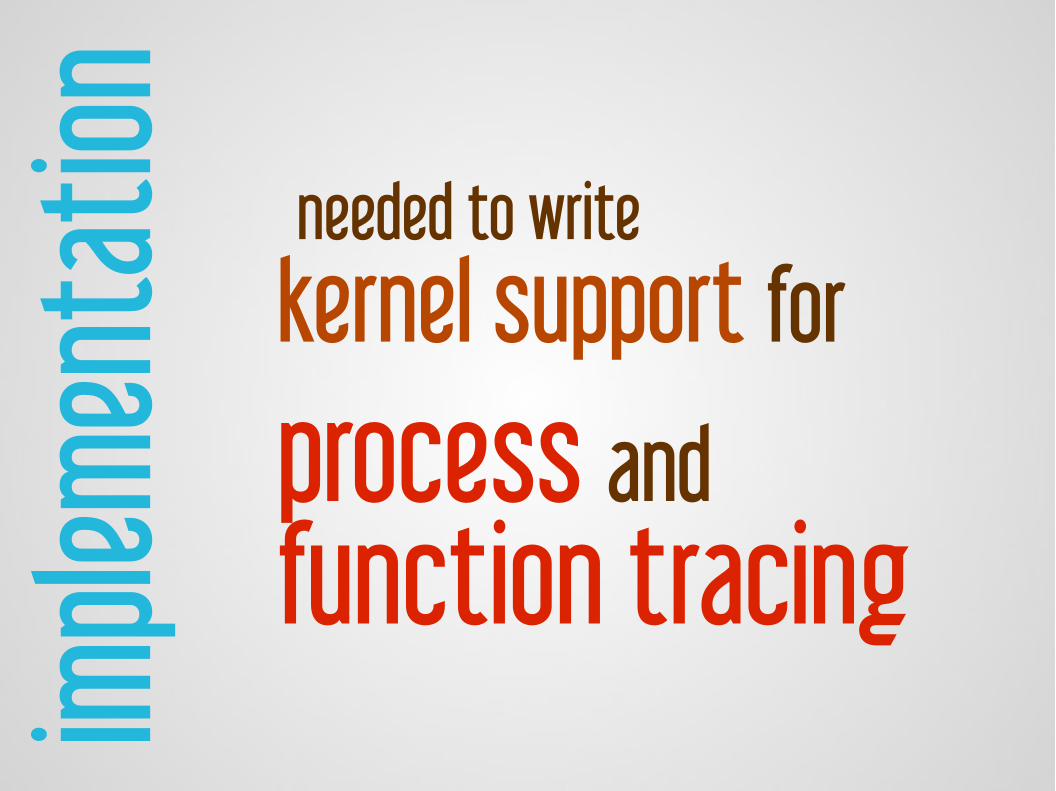
imple
ment
ation needed to write
kernel support for
process andfunction tracing
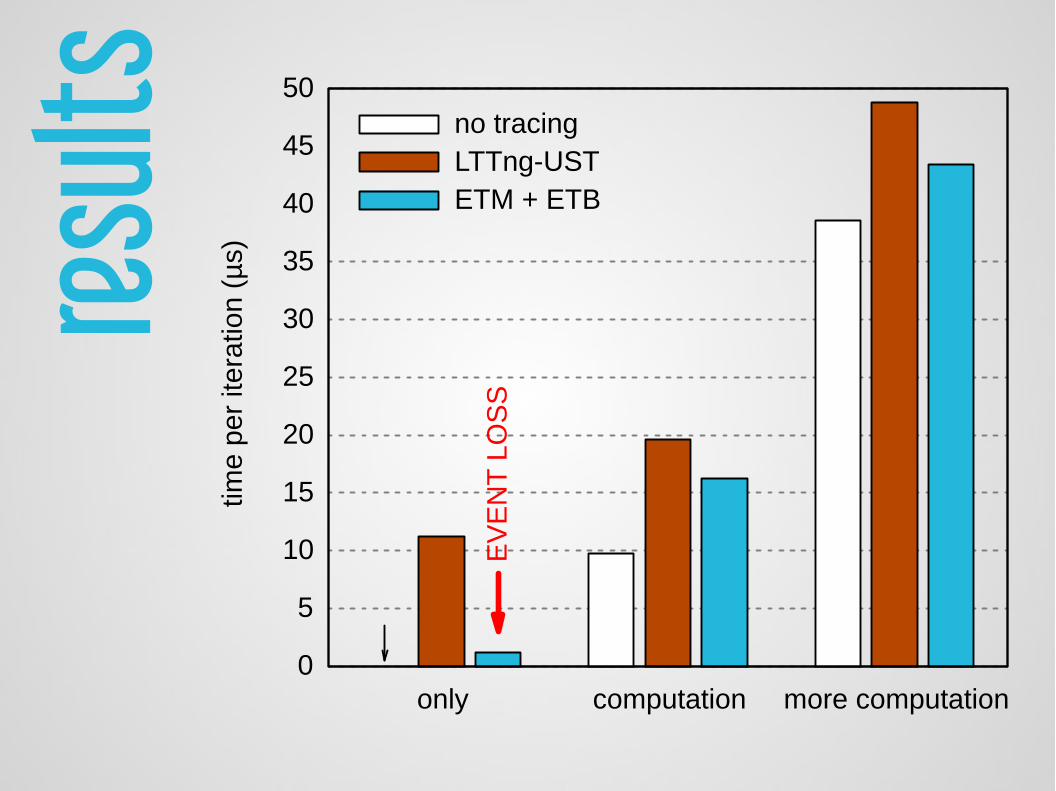
result
s
0
5
10
15
20
25
30
35
40
45
50
only computation more computation
time
per
itera
tion
(µs)
EV
EN
T L
OS
S
no tracingLTTng-USTETM + ETB
3
Improvements3/3 BTS on x86
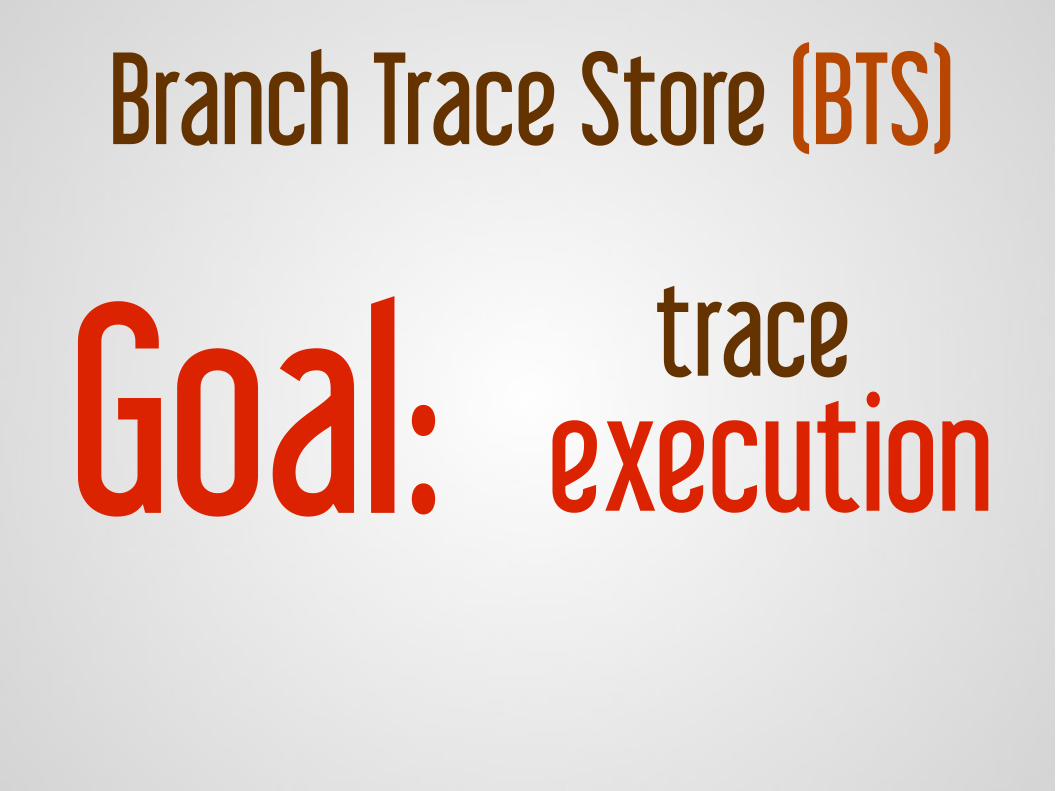
trace executionGoal:
Branch Trace Store (BTS)
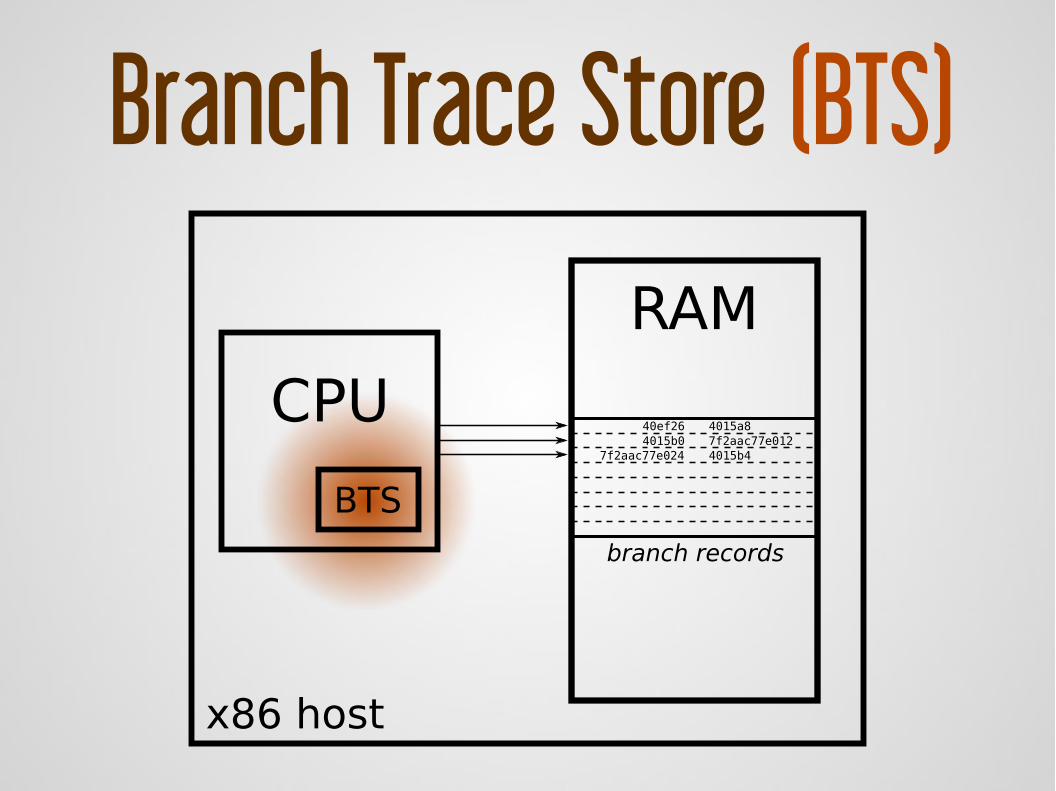
CPU
BTS
RAM
x86 host
branch records
4015a8
7f2aac77e0247f2aac77e012
40ef264015b0
4015b4
Branch Trace Store (BTS)
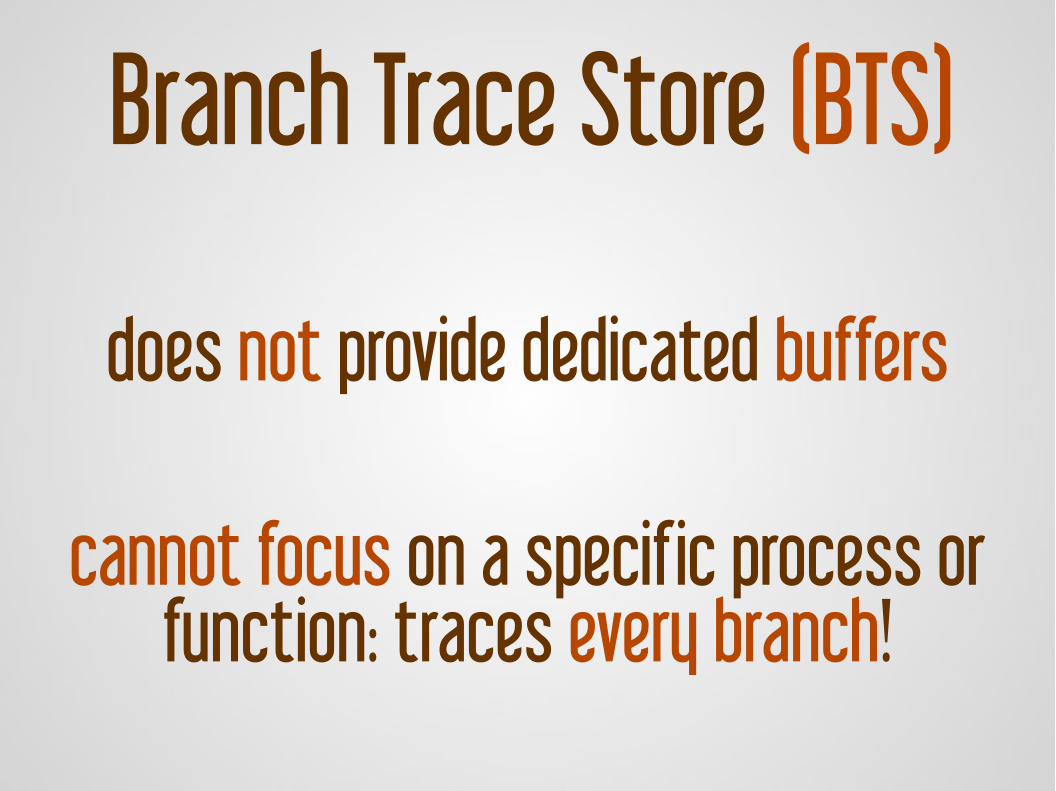
does not provide dedicated buffers
cannot focus on a specific process or function: traces every branch!
Branch Trace Store (BTS)
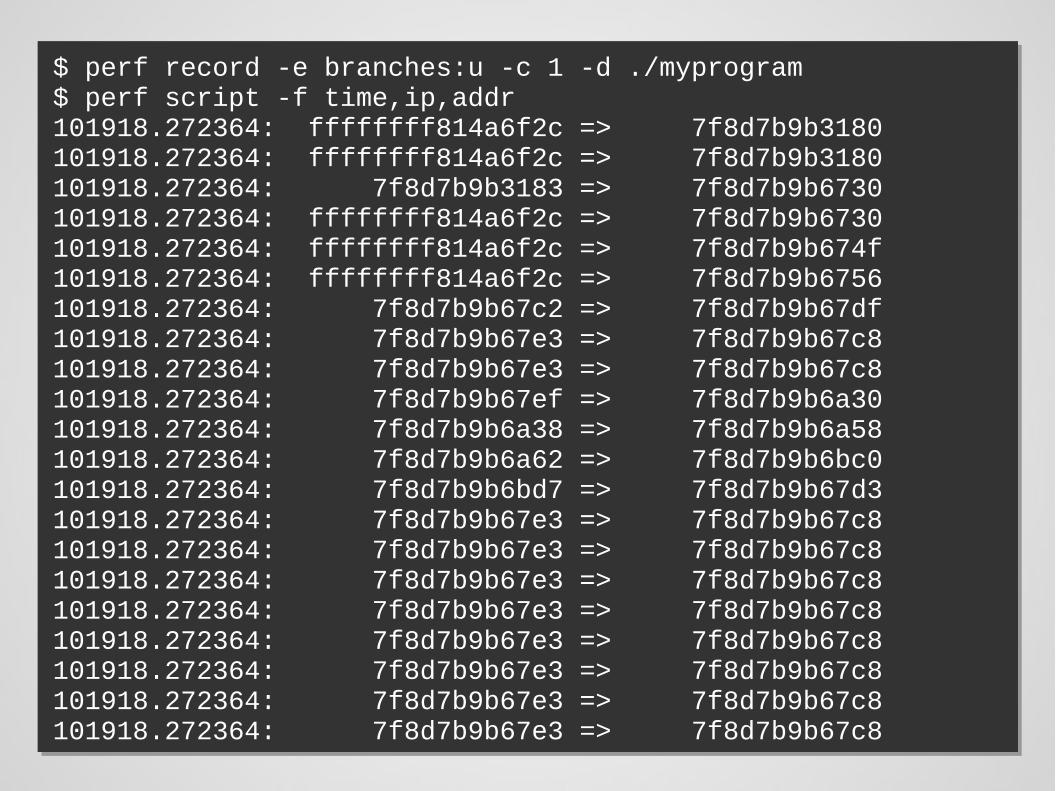
$ perf record -e branches:u -c 1 -d ./myprogram$ perf script -f time,ip,addr101918.272364: ffffffff814a6f2c => 7f8d7b9b3180101918.272364: ffffffff814a6f2c => 7f8d7b9b3180101918.272364: 7f8d7b9b3183 => 7f8d7b9b6730101918.272364: ffffffff814a6f2c => 7f8d7b9b6730101918.272364: ffffffff814a6f2c => 7f8d7b9b674f101918.272364: ffffffff814a6f2c => 7f8d7b9b6756101918.272364: 7f8d7b9b67c2 => 7f8d7b9b67df101918.272364: 7f8d7b9b67e3 => 7f8d7b9b67c8101918.272364: 7f8d7b9b67e3 => 7f8d7b9b67c8101918.272364: 7f8d7b9b67ef => 7f8d7b9b6a30101918.272364: 7f8d7b9b6a38 => 7f8d7b9b6a58101918.272364: 7f8d7b9b6a62 => 7f8d7b9b6bc0101918.272364: 7f8d7b9b6bd7 => 7f8d7b9b67d3101918.272364: 7f8d7b9b67e3 => 7f8d7b9b67c8101918.272364: 7f8d7b9b67e3 => 7f8d7b9b67c8101918.272364: 7f8d7b9b67e3 => 7f8d7b9b67c8101918.272364: 7f8d7b9b67e3 => 7f8d7b9b67c8101918.272364: 7f8d7b9b67e3 => 7f8d7b9b67c8101918.272364: 7f8d7b9b67e3 => 7f8d7b9b67c8101918.272364: 7f8d7b9b67e3 => 7f8d7b9b67c8101918.272364: 7f8d7b9b67e3 => 7f8d7b9b67c8
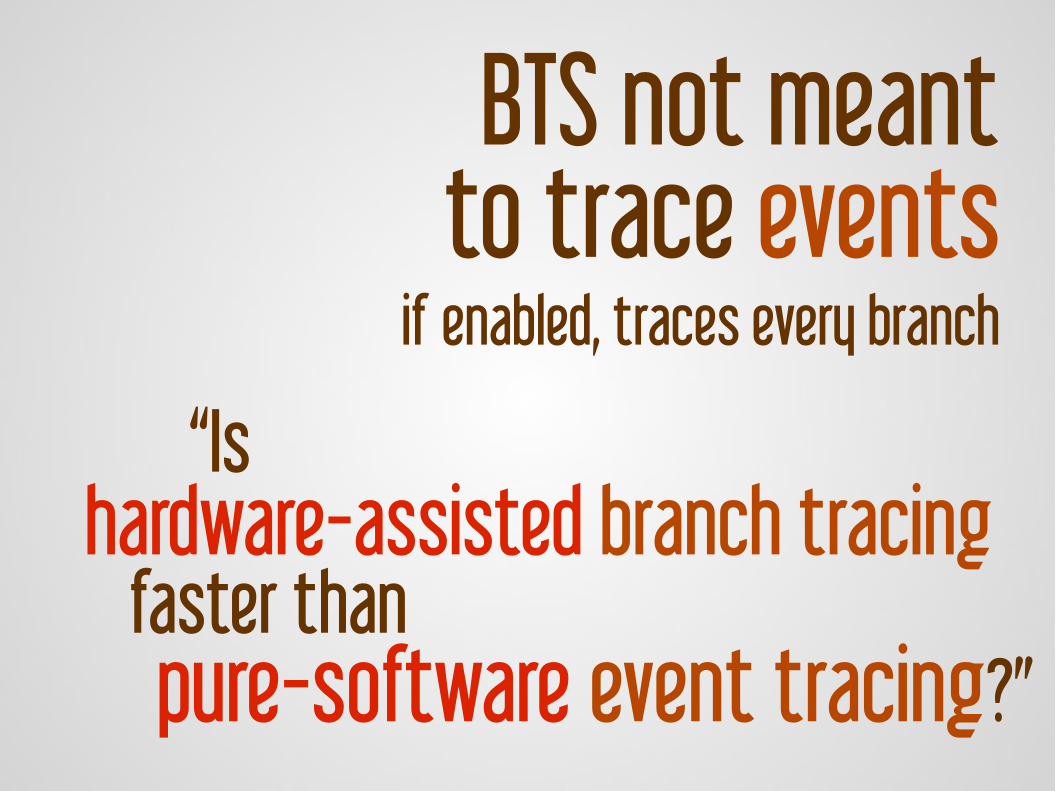
“Ishardware-assisted branch tracing faster than pure-software event tracing?”
BTS not meantto trace events
if enabled, traces every branch
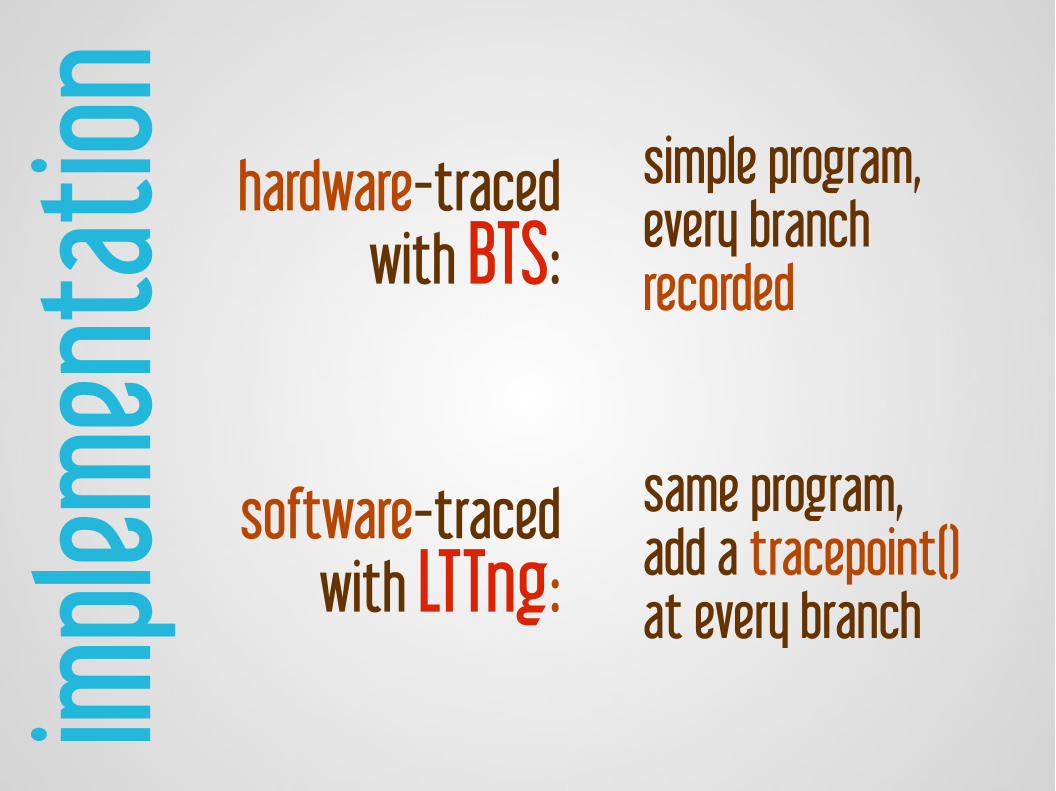
imple
ment
ation hardware-traced
with BTS:
software-tracedwith LTTng:
simple program,every branchrecorded
same program,add a tracepoint()at every branch
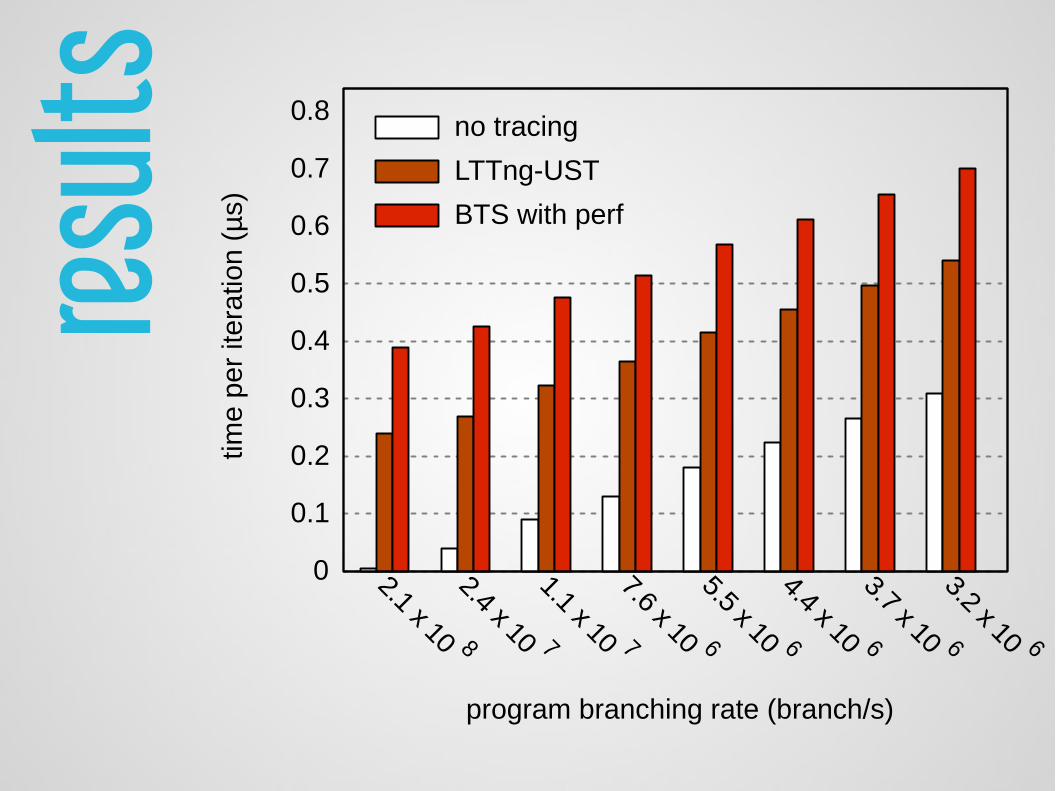
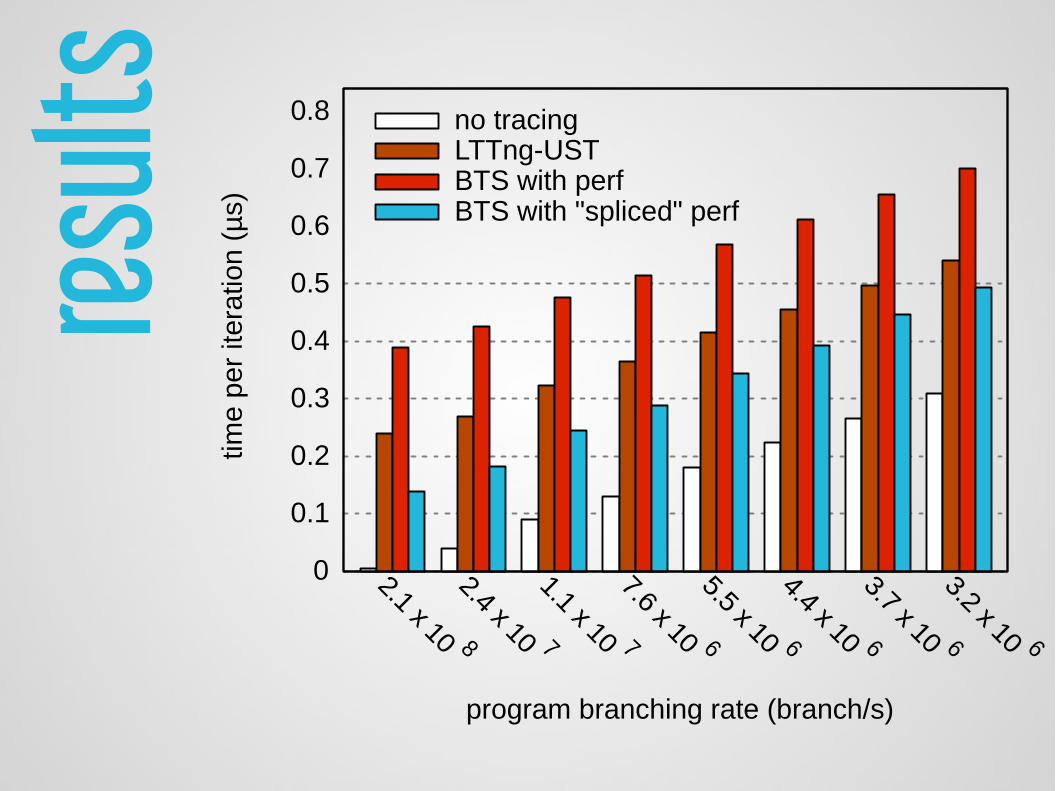
result
s
0
0.1
0.2
0.3
0.4
0.5
0.6
0.7
0.8
time
per
itera
tion
(µs)
program branching rate (branch/s)
no tracing
LTTng-UST
BTS with perf
core 0
64K
512K
core 1
64K
512K
core 6
64K
512K
core 7
64K
512K
disk
use
r-sp
ace
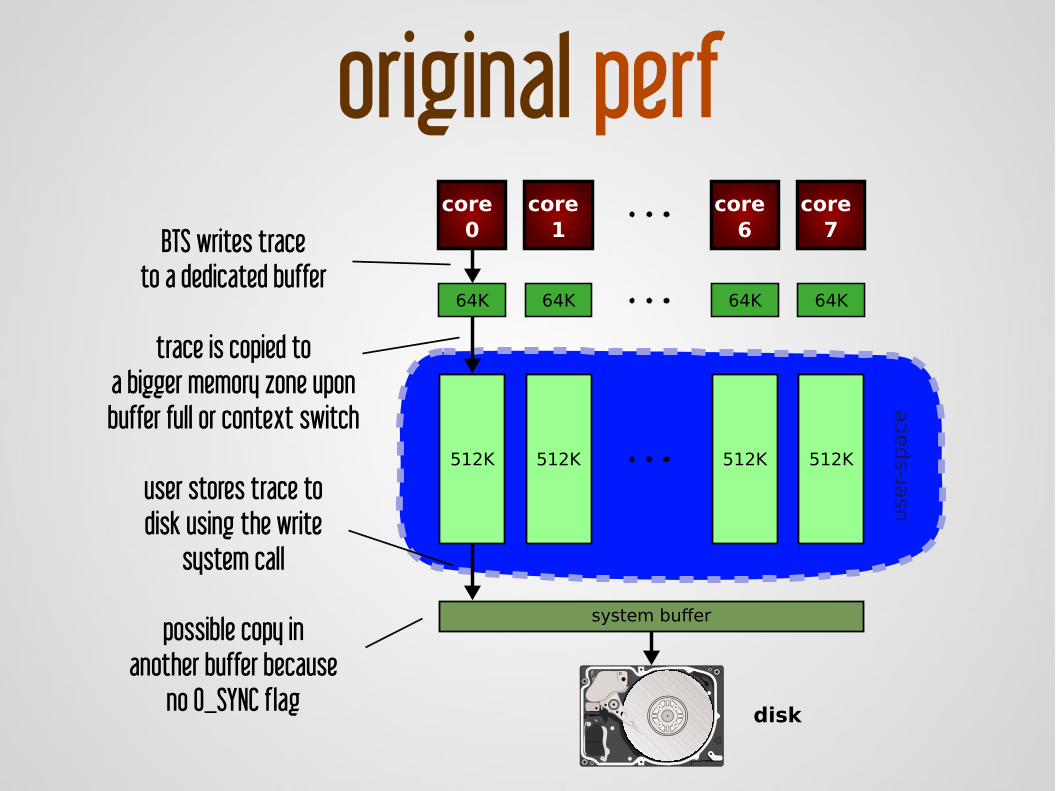
system buffer
original perfBTS writes trace
to a dedicated buffer
trace is copied toa bigger memory zone uponbuffer full or context switch
user stores trace todisk using the write
system call
possible copy inanother buffer because
no O_SYNC flag
core 0
core 1
core 6
core 7
disk
64K
512K ×
number of cores
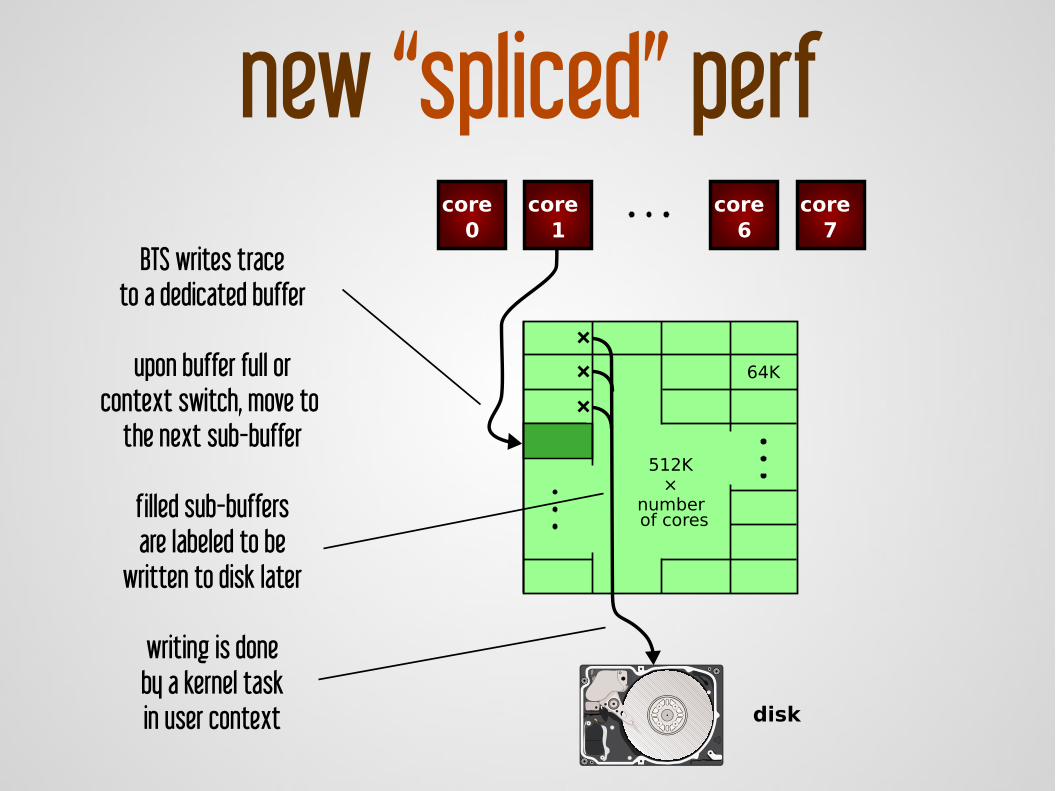
new “spliced” perfBTS writes trace
to a dedicated buffer
upon buffer full orcontext switch, move to
the next sub-buffer
filled sub-buffersare labeled to be
written to disk later
writing is doneby a kernel taskin user context
result
s
0
0.1
0.2
0.3
0.4
0.5
0.6
0.7
0.8
time
per
itera
tion
(µs)
program branching rate (branch/s)
no tracingLTTng-USTBTS with perfBTS with "spliced" perf
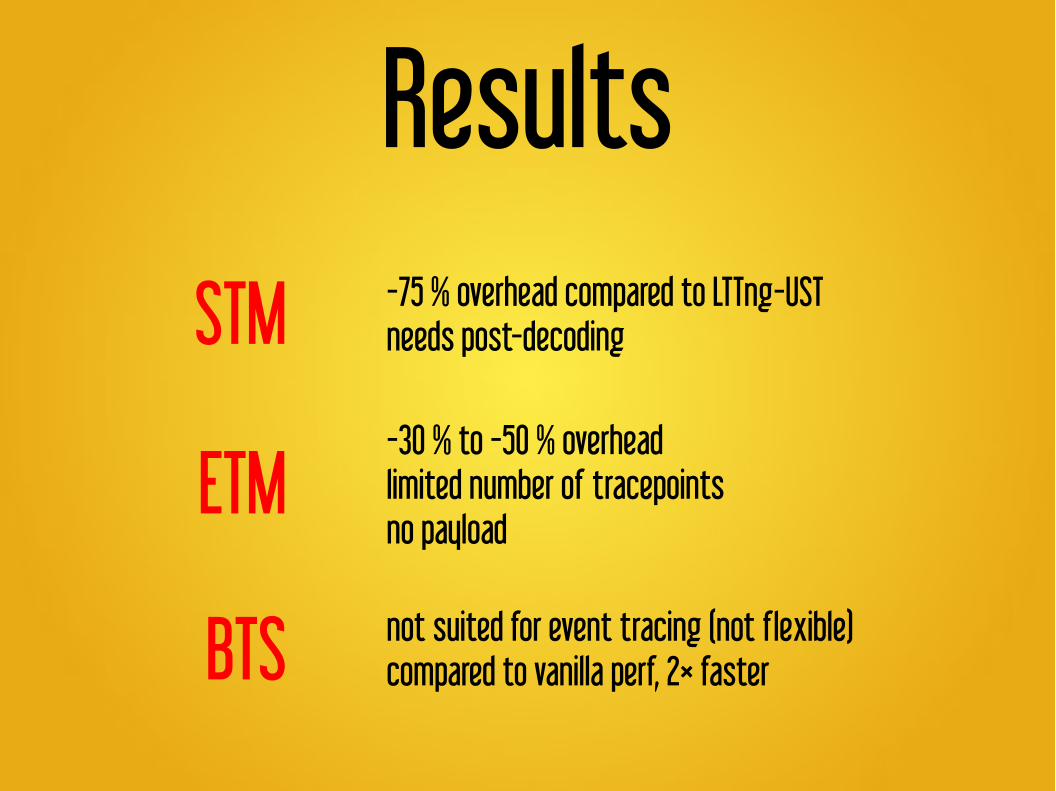
Results-75 % overhead compared to LTTng-USTneeds post-decodingSTM
ETM
BTS
-30 % to -50 % overheadlimited number of tracepointsno payload
not suited for event tracing (not flexible)compared to vanilla perf, 2× faster
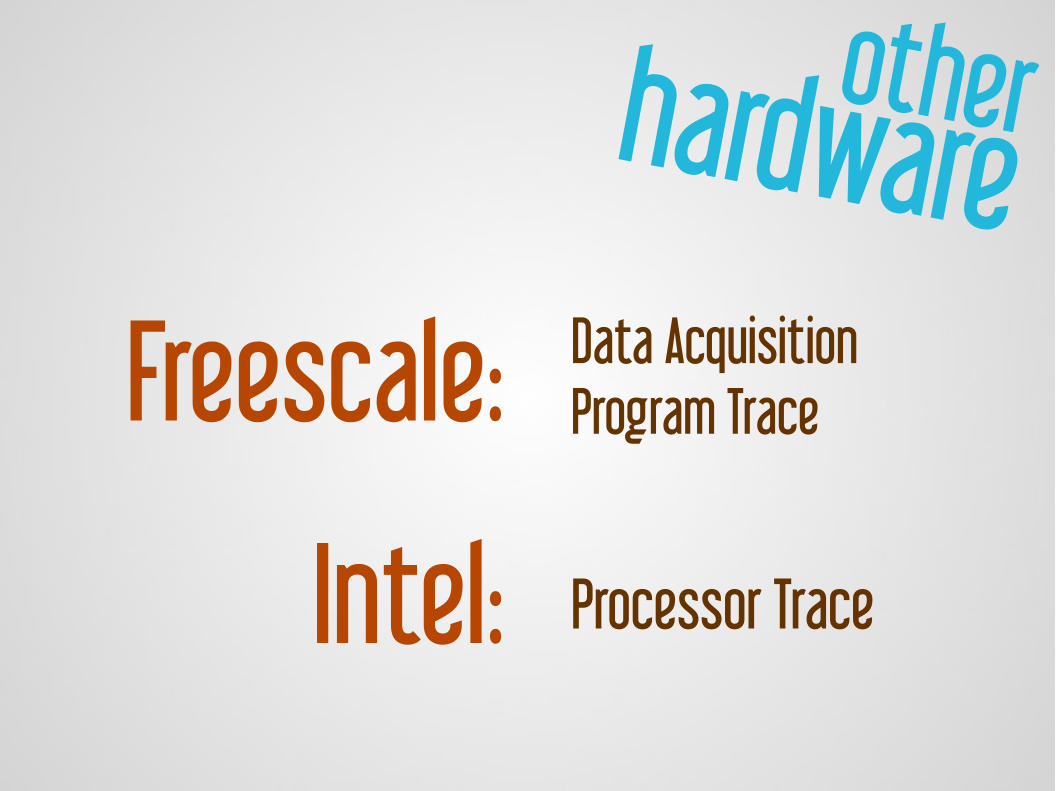
otherhardwareFreescale: Data Acquisition
Program Trace
Intel: Processor Trace

last words
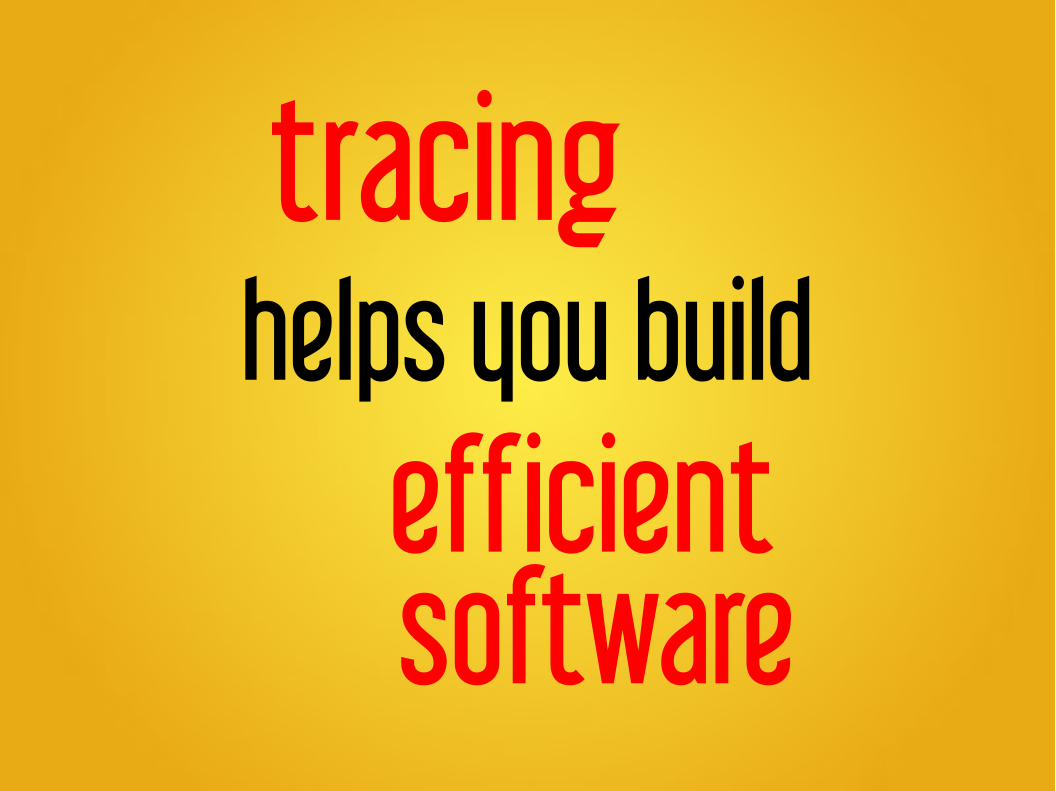
tracing helps you build efficient software
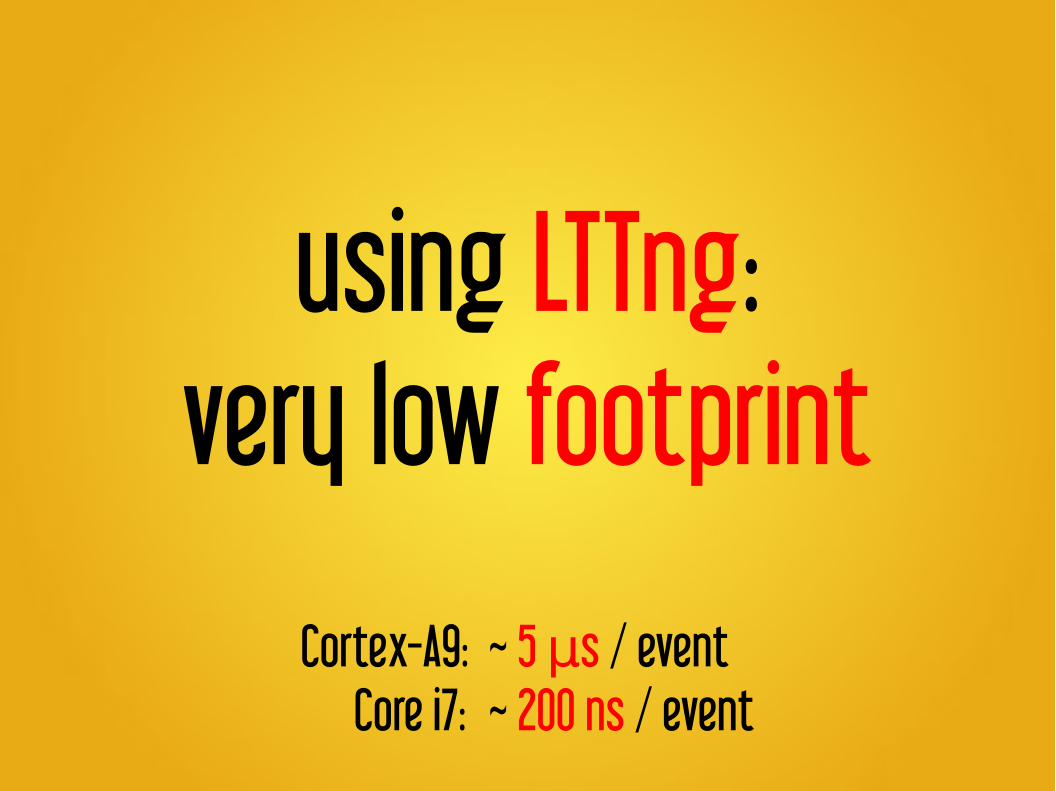
using LTTng:very low footprint
Cortex-A9: ~ 5 sµ / event Core i7: ~ 200 ns / event
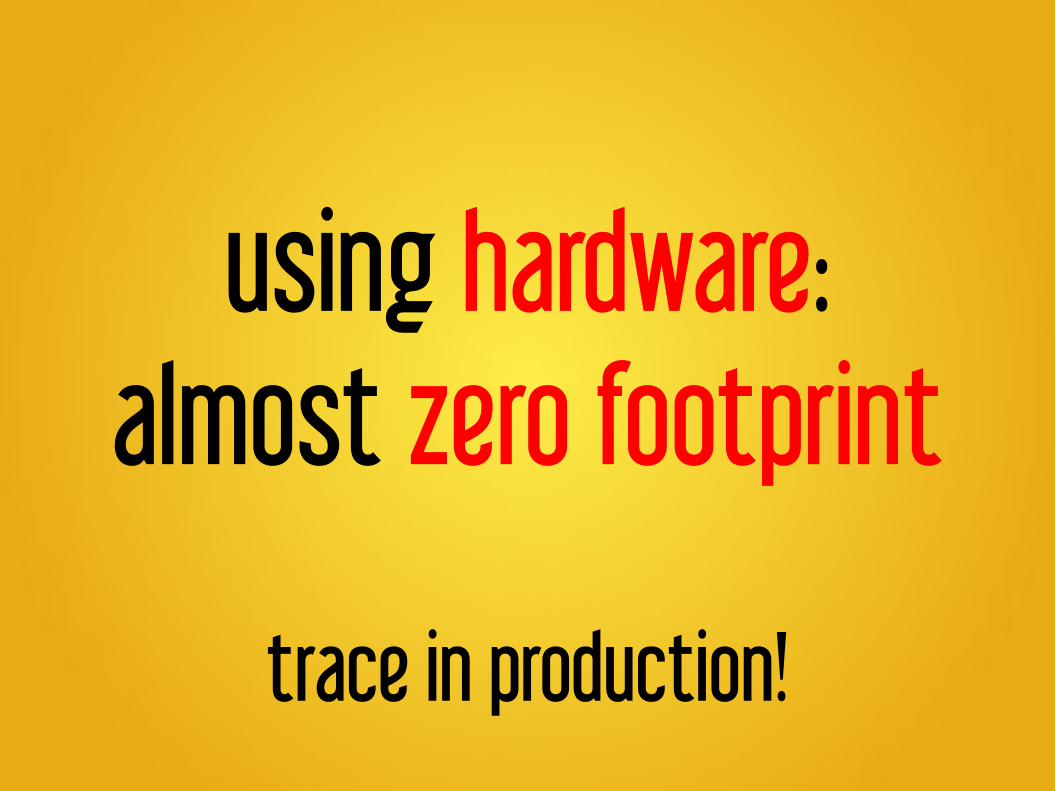
using hardware:almost zero footprint
trace in production!
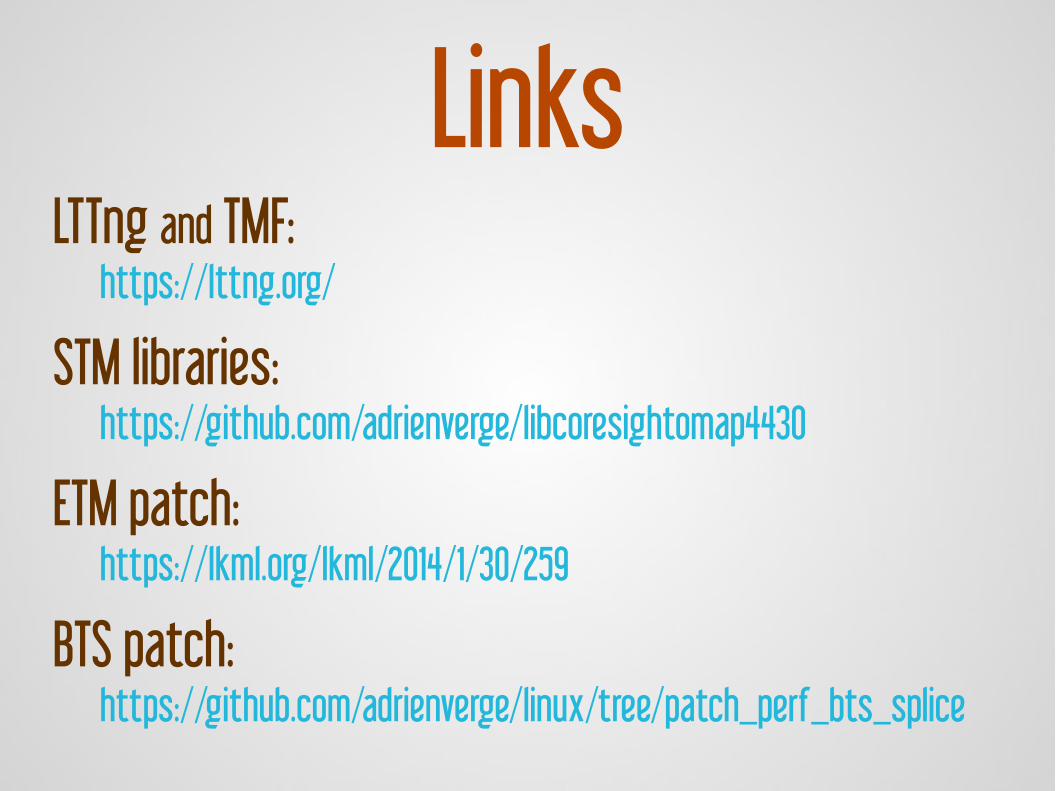
LinksLTTng and TMF:
https://lttng.org/
STM libraries:https://github.com/adrienverge/libcoresightomap4430
ETM patch:https://lkml.org/lkml/2014/1/30/259
BTS patch:https://github.com/adrienverge/linux/tree/patch_perf_bts_splice

Thank you
Questions?


![LAS16-TR08: Hardware Assisted Tracing on ARM with CoreSight and OpenCSD [Mandarin]](https://img.dokumen.tips/doc/110x75/587757ab1a28ab4e4f8b4615/las16-tr08-hardware-assisted-tracing-on-arm-with-coresight-and-opencsd-mandarin.jpg)