Embed Size (px)
Citation preview

Acta Psychologica 139 (2012) 261–271
Contents lists available at SciVerse ScienceDirect
Acta Psychologica
j ourna l homepage: www.e lsev ie r .com/ locate /actpsy
Haptic object matching by blind and sighted adults and children
Ans Withagen a,⁎, Astrid M.L. Kappers b, Mathijs P.J. Vervloed c, Harry Knoors c,d, Ludo Verhoeven c
a Royal Visio, National Foundation for the Visually Impaired and Blind, Huizen, The Netherlandsb Helmholtz Institute, Utrecht University, The Netherlandsc Behavioural Science Institute, School of Educational Science, Radboud University Nijmegen, The Netherlandsd Royal Kentalis, Sint Michielsgestel, The Netherlands
⁎ Corresponding author at: Royal Visio, National Founand Blind, Oud Bussummerweg 76, 1272 RX Huizen355773300.
E-mail address: [email protected] (A. Withagen
0001-6918/$ – see front matter © 2011 Elsevier B.V. Alldoi:10.1016/j.actpsy.2011.11.012
a b s t r a c t
a r t i c l e i n f oArticle history:Received 27 January 2011Received in revised form 10 November 2011Accepted 29 November 2011Available online 4 January 2012
PsycINFO classification:2320 Sensory Perception
Keywords:BlindTouchObject identificationChildAccuracyResponse times
The present study describes a tactual object matching task based on the study of Lederman and Klatzky(1987) for the dimensions Exact shape, Weight, Volume and Texture. Participants were congenitally blindchildren and their sighted classmates, congenitally blind adults and sighted adults. To study a possible effectof familiarity the task was performed four times. Based on Millar's CAPIN (Convergent Active Processes in In-terrelated Networks) model of spatial processing (Millar, 1994) it was thought that this manipulation wouldadd redundant information to the experiment from which the children and blind participants could benefit.The results showed that accuracy was affected more by age than visual status, especially for the dimensionExact Shape. With regard to response times, children were in most cases faster than adults, especially thesighted adults. Familiarization had a significant effect on response times for all dimensions. Extra exerciseonly increased accuracy for the dimension Texture. These results were generally in line with the CAPINmodel.
© 2011 Elsevier B.V. All rights reserved.
1. Introduction
For obvious reasons, blind people have to rely on other sensesthan vision. In case of blindness, touch is the most likely sense to re-place vision for the acquisition of spatial knowledge of the environ-ment and object properties (Hatwell, 2003a,b). However, as Heller(2000) has pointed out, studying touch in blind persons is subjectto several practical problems. First of all, we do not really knowwhat a “normal” blind person is due to heterogeneity in the popula-tion of blind people and the difficulty of finding a representative sam-ple. More importantly, it is hard to define what “normal” touch is. Wehave norms for several hearing and visual functions but not for touchskills, since reliable and valid tests are generally lacking. In previouswork, we have made an attempt to design an assessment instrumentto document touch skills in educational and everyday situations ofchildren with blindness (Withagen, Vervloed, Janssen, Knoors, &Verhoeven, 2010a) and looked at skills that were specifically difficultfor them (Withagen, Vervloed, Janssen, Knoors, & Verhoeven, 2010b).The blind children aged zero to 16 years of age mastered roughly 94%of the tactual tasks they could encounter in daily living situations.However, a direct comparison with sighted children was lacking.
dation for the Visually Impaired, The Netherlands. Tel.: +31
).
rights reserved.
From previous studies, it was also unclear how task performance dif-fered between sighted and blind children.
1.1. Object matching
Given its theoretical and clinical relevance, object matching was cho-sen as subject for this study. The present study builds on Lederman &Klatzky, 1987 on the distinctive role of ‘weight’, ‘exact shape’, ‘volume’and ‘texture’ in object matching in the absence of sight while takinginto account the participants' age and visual status. We compared theperformance of congenitally blind children, sighted classmates, congen-itally blind adults and sighted adults with regard to accuracy and speedin a tactual object matching task.
1.2. The CAPIN model
Thework ofMillar, who studied the twomodalities touch and visionas separate senses, but also in relation to each other in sighted aswell asvisually impaired children (seeMillar, 1994a,b, 1997, 2000, 2005, 2008)is very relevant to the current study. She introduced the CAPIN (Conver-gent Active Processes in Interrelated Networks) model to observe anddescribe spatial development. It is primarily a connectionist model tak-ing into account neuropsychological as well as behavioural findings(Millar, 1997). The assumption of active processing in interrelated net-works refers, firstly, to the constant changes during cerebral develop-ment, secondly to individual variation within this development, and

262 A. Withagen et al. / Acta Psychologica 139 (2012) 261–271
thirdly to the interplay of maturational processes with patterns of in-coming information, and interrelations between perceptual processes,spatial organisation and task demands. The sense modalities providespecialised and complementary inputs, hence the emphasis on ‘conver-gent’ active processing. A key element in the CAPIN model is that it as-sumes that the convergence and overlap of inputs provide theredundancy that is needed for their organisation as reference anchorsor frames. According to Millar (1997), visually impaired children needsubstantial redundancy in their information to come to the same con-clusions as sighted children. The absence of vision alters the balanceof internal and external inputs of information. Vision normally providesinformation about the relation between external cues. Totally blindpeople have to rely on body-centred and sequential movement informa-tion to get information about spatial cues and their positions towardseach other.
1.3. Exploratory procedures
For identifying functions and properties of small objects, such asform, weight or texture, people normally use specific haptic strategiescalled Exploratory Procedures (EP's). Lederman and Klatzky (1987)showed that people use EP's to discriminate different object dimen-sions. These purposive hand movements appear critical for hapticexperiencing specific material properties. Klatzky, Lederman, andMatula (1991, 1993) studied the haptic exploration of object proper-ties in the presence of vision. It seemed that vision and touch interactin haptic object exploration and manipulation. When difficult judge-ments about materials had to be made, touch was used more often,whereas for judgements about geometric forms, vision was the pre-ferred sense.
Most of what we know about EP's is based on experiments withsighted adults. What is unknown is whether children are as efficientas adults. It is also largely unknown whether children perform atadult level with regard to the pattern of manipulations, accuracyand speed.
1.4. The effects of blindness
Task demands and prior knowledge or experiencemay influence thehaptic strategies one chooses in object identification and manipulation(Millar, 2005). On the one hand, blind children and adults could bemore accurate, and possibly also faster, than sighted persons, due tothe fact that they are more trained and experienced in using touch toidentify and compare objects. On the other hand, sighted persons canrely on visual memory and imagery making them possibly better per-formers than blind people. During object identification congenitallyblind people cannot draw on visual experience. Recent studies showedbrain reorganization in blind people. The occipital lobe, the main loca-tion for processing visual information, is also used by blind persons dur-ing touching, which might compensate for their lack of visual memoryand visual processing in object identification (see e.g., Gizewski,Gasser, de Greiff, Boehm, & Forsting, 2003; Sadato, Okada, Honda, &Yonekura, 2002; Sathian, 2000, 2005; Sathian & Stilla, 2010).
Familiarity with the task might also benefit blind people since theyare used to identify objects by touch. It might also be a distinguishingcharacteristic between children and adults, simply because adultshave more years of experience. Davidson (1972) and Davidson andWhitson (1974) observed that blindfolded sighted persons had less ef-ficient modes of exploration than people blinded early in life. To evalu-ate the curvature of a stimulus (convex or concave), the blind favouredprocedures using the whole hand whereas sighted people used onlytwo fingers. The sighted adults thus decreased the size of their percep-tual field asmuch as possible; in contrast, the blind adults enlarged it byusing all their fingers. It turned out that the blind participants weremore accurate than the sighted. After familiarizing the sighted
participants by forcing them to use the same mode of exploration asthe blind the two groups produced similar results.
A familiarity effectwas also found byGrant, Thiagarajah, and Sathian(2000)who compared the discrimination performances of blindBraille-readers and sighted subjects on haptic tasks. Initially, the blind outper-formed the sighted on a hyperacuity task in which they had to judgeBraille-like dot patterns, but after training, the sighted performed atthe same level as the blind did. According to Craig (1988) blind personsdo not truly develop better tactile sensitivity, but rather learn to use thehaptic sense more proficiently. Grant, Thiagara and Sathian, as well asCraig conducted their studies while the participants could use activetouch, that is purposive exploration of the stimulus field. For passivetactile acuity, perception based solely upon stimulation of the cutane-ous sense of an immobile observer, a familiarity effect was also foundby Goldreich and Kanics (2003). Tactile acuity in the blind was signifi-cantly superior over that of sighted people. Unfortunately no trainingwas given to the sighted participants in this study, so it remains un-known whether familiarizing the sighted persons with the task wouldhave enhanced their performance. In order to study a possible familiar-ization effect our experiments will be performed four times.
1.5. Developmental aspects
According to Millar (1997), visually impaired children need moreredundancy in their information due to the fact that they are both vi-sually impaired and young. The effects of visual impairment were dis-cussed above, but what about the developmental aspect? Bushnelland Boudreau (1991, 1998) studied the sorts of hand movementschildren were capable of making at various ages, starting in infancy.The EP ‘Enclosure’, for instance, is already observed in four monthsold babies (clutching behaviour). Between four to nine months ofage the manual behaviours of the babies were considered to be simi-lar to the ones of adults for the EP's ‘Pressure’ and ‘Lateral motion’.However, the intention of using the EP was different in infants thanin adults. Babies were waving, banging and passing objects fromone hand to another. These behaviours were considered to be similarto the adult EP ‘Unsupported Holding’. A difference in performancebetween younger and older children was described by Alexander,Johnson, and Schreiber (2002). Participants were children betweenfour and nine years of age, with varying levels of knowledge of dino-saurs. The older children explored the models more exhaustively anddiscovered more differentiating tactile features than did the youngerchildren and they also made fewer errors. For task accuracy, the hap-tic strategies used by the older children proved to be more importantthan their a priori level of knowledge about the objects.
The abovementioned studies were all carried out with sighted chil-dren, but what about blind children? Simpkins (1979), Schellingerhout,Smitsman, and Van Galen (1997, 1998), Morrongiello, Humphrey, et al.(1994) and Bradley-Johnson, Johnson, Swanson, and Jackson (2004)found no differences between blind and sighted children in the numberand range of exploratory behaviours and in the way they adapted theiractions to object properties. In contrast to the previous studies, Millar(1974) didfinddifferences betweenblind and sighted children in severalexperiments with small nonsense shapes. During a comparison task,the children were distracted in different ways: unfilled delay, re-hearsal, exposure to a verbal distractor, and a movement distractor.Although the distracters had highly significant effects on differentexperiments, the influence was the same for blind and sighted chil-dren. However, in general, the blind children were less accuratebut also faster than the sighted children. Millar (1974) suggestedthat the speed-accuracy trade off probably indicated a difference instrategy rather than in retention. Also Hatwell (1978) found differ-ences between blind and sighted children. She compared the resultsof congenitally blind and blindfolded sighted children on a shaperecognition task. According to Hatwell haptic pattern perception inblind children develops slower than visual perception in sighted

263A. Withagen et al. / Acta Psychologica 139 (2012) 261–271
children, but does seem to follow the same line of development.D'Angiulli, Kennedy, and Heller (1998) observed the performancesof blind and sighted children in picture perception. Theywere specif-ically interested in the exploration skills of both groups. If the sightedchildren did not get any help or guidance in the exploration of pic-tures, the blind outperformed the sighted children. However, sightedchildren who were given passive guidance performed at the samelevel as the blind children.
An age effect was found by Simpkins (1979), who compared blindchildren with sighted and low vision children in a shape recognitiontask. Tactual recognition of shapes improved between 4 and 7 yearsof age and with age manual acts changed as well. Also Morrongielloet al. (1994) found an age effect in their study on object explorationand object recognition in sighted and blind children between 3 and8 years of age with common objects of different sizes. Their resultsshowed a distinct developmental pattern: older children were faster,recognized more objects and were more thorough in their exploratorystrategies than the younger children. According to Hatwell (2003a,b),children tend to use global strategies (for instance, lateral motion) ina shape discrimination task, which is not optimal for solving thetask efficiently. When children grow older, they shift to using adult-like patterns of exploration, such as contour following. Hatwell ob-served that in bimodal situations, where vision and touch can be usedsimultaneously, the haptic system is scarcely used in spatial tasks. Fordiscrimination of other object properties, such as texture or hardness,the haptic system is more likely to be activated and preferred above vi-sion. Hatwell's analyses showed also that perception and action are nar-rowly linked in haptic acts. Not only do exploratory actions determinewhat is perceived, but also how it is perceived.
1.6. Hypotheses
Based on the aforementioned literature, we expected that adultswould be more accurate and faster than children, because they willhave more experience with touching than children (familiarity aspect)and possess a fully developed neurological system. The need for moreredundancy in the information processing of children would reflectitself in longer response times and/or a speed — accuracy trade-off,that is short response times will result in reduced accuracy. Redun-dancy of information is reflected both in the density of cues on ob-jects and the possible ways of how to obtain this information. Mostof the literature showed that although blind people have to relymore often on touch and consequently have more practice in touch-ing objects than sighted people have, they normally do not performany better than sighted people. For the current study we expectedto replicate this finding. New in the current study was that experi-ence and familiarity is manipulated by performing the experimentfour times. We expected that children, as less proficient performers,would profit from repetition both with regard to speed as well as ac-curacy, whereas for adults we expected mainly speed of respondingto improve. Since sighted adults and children might be less familiarwith touching than blind people, the repetitions also familiarisedthem with the task. Individual variation was studied in two ways,namely by looking at correlations between dimensions and by look-ing at possible speed-accuracy trade-offs.
Given the varying degrees of involvement of vision, weexpected the groups of blind and sighted participants to vary inspeed and accuracy. For those tasks that normally rely on vision,we expected better performance of blind participants than thesighted ones, because they might be used to perform this task asa result of daily experiences and familiarisation. However, sincetasks that are solved primarily by touch offer less redundant infor-mation than visual tasks, both blind and sighted people might per-form equally well once vision is eliminated in the task. Sinceweight is normally more dependent on touch and haptics than vi-sion, we expected weight not to differ between the groups of blind
and sighted participants. However since young children need moreredundant information than adults we expect them to performworse in all tasks than adults.
2. Methods
2.1. Participants
Sixty-one participants took part in the experiment. The group con-sisted of thirty-one adults (age range 21–56) and thirty (age range7–13) children, all naïve to the aims of the experiment.
The participants were divided into four groups:
1. 16 congenitally blind adults (mean age=38.8 , SD=8.1; 8 females,8 males)
2. 15 sighted adults, matched on age, gender and level of educationwith the blind adults (mean age=39.4, SD=10.7; 8 females, 7males)
3. 15 congenitally blind children attending mainstream schools in theNetherlands and Flanders (mean age=9.3, SD=1.7; 7 girls, 8 boys)
4. 15 sighted classmates of the blind children, matched on age, gen-der and level of education (mean age=9.0, SD=1.5; 7 girls,8 boys) in the Netherlands and Flanders.
The blind children were recruited by itinerant teachers who visit-ed them at their mainstream schools. The sighted children werematched on age and sex and came from the same class as the bindchildren. Parents were asked permission to enrol their child in the ex-periment. They all agreed and signed a declaration of informed con-sent. The setting of the experiment was the child's own school andthe experiment was conducted during class hours. Considering thedifficulty level of the questions on exact shape, volume and weight,it was decided not to recruit children younger than 7 in order not toconfound the experiment with differences in cognitive level.
About one third of the blind adults worked as a volunteer in a mu-seum devoted to visual impairment (they had a regular job next tothis job). The other blind adults were recruited through a websitefor blind adults in the Netherlands and the social network of thefirst author. Many of the sighted adults worked at the administrationoffice of an institution for the blind. They were not familiar withhaptic strategies, nor with teaching or guiding the blind. The partic-ipants were not paid for their participation in the experiment, andthey all gave informed consent. The experiment was given to themunder standardized conditions either at their homes or at theirworkplace.
2.2. Material
The object sets for the dimensions texture, weight, volume andexact shape were selected out of the nine original object sets ofLederman and Klatzky (1987). The sets were reproduced with per-mission and help of these authors. All the objects were unfamiliar,meaningless and functionless objects and therefore difficult to label.For each object dimension there were 16 three dimensional-stimuli,divided into 4 sets. Each set comprised of one standard object andthree comparison objects, of which one was the best, but not identi-cal, match to the standard. There was one partial exception to thisrule. In the object sets ‘Exact Shape’ the comparison object was iden-tical in exact shape but still not completely identical because the ob-jects differed in height and size to the standard object. In the otherobject sets irrelevant dimensions were added to the task in order todeliberately introduce some degree of difficulty to the task. For in-stance in the object sets ‘Weight’ different materials were used. Intotal there were 64 objects (four sets of four for each of the four di-mensions). Fig. 1 shows the different object sets (A,B,C and D). All ob-jects could be enclosed in one or two hands. A more detailed

264 A. Withagen et al. / Acta Psychologica 139 (2012) 261–271
description of the object sets can be found in Lederman and Klatzky(1987, p. 350).
2.3. Procedure
The procedure was a partial replication of the study of Ledermanand Klatzky (1987). Since our study included children, we carriedout a pilot-study to evaluate the procedure on its aptitude for bothchildren and adults. The pilot study was executed with twenty partic-ipants, ten adults and ten children, none of whom participated in thefinal study. As a result of the outcomes of this pilot study it was decidednot to blindfold the subjects, because several children did not like towear a blindfold for an extended period of time. A second adaptationconcerned the verbal instruction to suit children. This was done by add-ing descriptions of the object dimensions in simple words. Lastly, inorder to signal the end of a trial the following instruction was added‘when ready stretch your hands, palms upward upon the table’. Thisway it was easier to observe and score the exact time of exploring.
Fig. 1. The object-set. The standard object is on the left side, followed by the comparison objedimensions: ‘Texture’ (A), ‘Weight’ (B), ‘Volume’ (C), ‘Exact Shape’ (D).
During the experiment, the participant sat opposite the experi-menter with a curtain blocking the subjects' view of the stimuli.This curtain hung over a stage, positioned just below eye level inthe middle of the table between the subject and the experimenter.The participants were asked to put their hands under the curtain atthe side of the experimenter. This way, the participants could notsee any of the stimuli nor their own hands and at the same timethey were not hindered by a blindfold. Behind the experimenter'sshoulder a tripod with a digital video camera was installed. The cam-era recorded all experimental trials, except practice trials.
Every experiment started with a practice session, in which theparticipants got clarification about the concepts of the dimensionsand could practice the procedure of matching one of the objectswith the standard. In accordance with the original study, participantswere asked to cup their hands. The experimenter first presented thestandard object, which they were asked to explore for one of four di-mensions: texture, weight, volume, or exact shape. Next, the threecomparison stimuli were given one after the other and the
cts in the same row; the second object in each row is the best match. Object sets for the
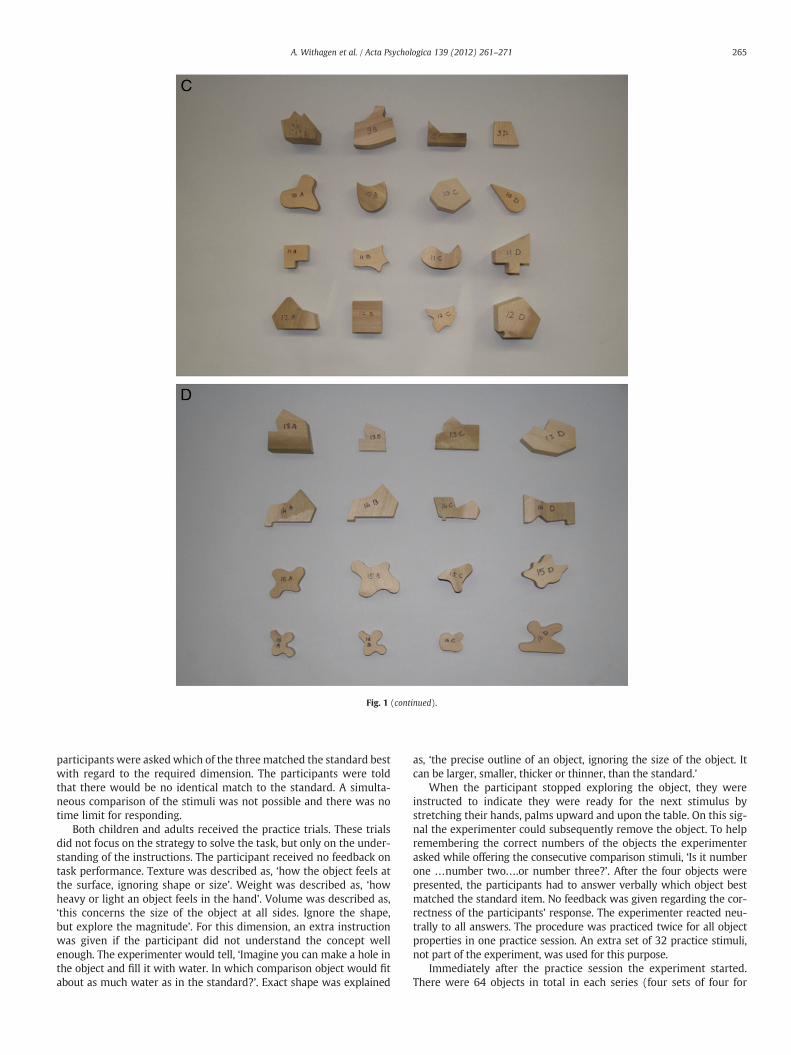
Fig. 1 (continued).
265A. Withagen et al. / Acta Psychologica 139 (2012) 261–271
participants were asked which of the three matched the standard bestwith regard to the required dimension. The participants were toldthat there would be no identical match to the standard. A simulta-neous comparison of the stimuli was not possible and there was notime limit for responding.
Both children and adults received the practice trials. These trialsdid not focus on the strategy to solve the task, but only on the under-standing of the instructions. The participant received no feedback ontask performance. Texture was described as, ‘how the object feels atthe surface, ignoring shape or size’. Weight was described as, ‘howheavy or light an object feels in the hand’. Volume was described as,‘this concerns the size of the object at all sides. Ignore the shape,but explore the magnitude’. For this dimension, an extra instructionwas given if the participant did not understand the concept wellenough. The experimenter would tell, ‘Imagine you can make a hole inthe object and fill it with water. In which comparison object would fitabout as much water as in the standard?’. Exact shape was explained
as, ‘the precise outline of an object, ignoring the size of the object. Itcan be larger, smaller, thicker or thinner, than the standard.’
When the participant stopped exploring the object, they wereinstructed to indicate they were ready for the next stimulus bystretching their hands, palms upward and upon the table. On this sig-nal the experimenter could subsequently remove the object. To helpremembering the correct numbers of the objects the experimenterasked while offering the consecutive comparison stimuli, ‘Is it numberone …number two….or number three?’. After the four objects werepresented, the participants had to answer verbally which object bestmatched the standard item. No feedback was given regarding the cor-rectness of the participants’ response. The experimenter reacted neu-trally to all answers. The procedure was practiced twice for all objectproperties in one practice session. An extra set of 32 practice stimuli,not part of the experiment, was used for this purpose.
Immediately after the practice session the experiment started.There were 64 objects in total in each series (four sets of four for

266 A. Withagen et al. / Acta Psychologica 139 (2012) 261–271
each of the four dimensions). Each participant performed four series.The dimensions were offered in a randomized order within each series.As a result of the four repeated series every participant got to touch 256objects during the experiment. Response time and exploration timestarted when the participant received the object in their hands andstopped when the participant stretched their hands. All four serieswere presented on the same day.
2.4. Analysis
Response times were only analysed for the correct answers andmeasured with the help of the Observer XT (Noldus InformationTechnology, 2008). The observer XT software can beused for the collec-tion, management and analysis of observational data. Five observers,naïve to the experiment, scored the videotapes after training them toa sufficient level of agreement (coefficient Kappa above .80). Videotapesof the experiments of ten participantswere selected to determine inter-rater reliability. Tapes were selected from the beginning, halfway andend of the study. The mean inter-rater reliability measured with coeffi-cient Kappa was .89 (range .84–.93).
Only significant results are described in this paper. An exception ismade for the age by group interaction, since this was a major hypoth-esis tested in this study.
Firstly, an age (adults-children)×visual status (blind-sighted)×series (4) General Linear Model (GLM) analysis was performed to an-alyse the accuracy and response times per dimension. Age and visualstatus were treated as between subjects and series as within subjectvariables. Since agewas found to be a significantmain effect onmost di-mensions, we also analysed both age groups separately. The relation be-tween response and accuracy was subsequently studied by correlatingboth variables. Secondly, to study individual variations in performanceover the four dimensions, a speed-accuracy trade off was determinedby calculating the correlations between response times and accuracybothwithin groups and over the total group of participants. Thirdly, cor-relations were calculated and analysed for accuracy and response times
50
55
60
65
70
75
80
85
90
95
100
105
1 2 3 4
Acc
urac
y (%
)
Exact Shape
Series
Adult and sighted
Child and sighted
A
Fig. 2. Accuracy (A) and response times (B) for exact shape over four repeated seri
between the scores on the four dimensions . Lastly, the data were com-pared with the data reported by Lederman and Klatzky.
3. Results
3.1. Exact shape
Accuracy for Exact Shape is depicted in Fig. 2A for the four groupsas a function of series. The data points reflect percentages correct re-sponses (accuracy) averaged over the four sets within one dimensionand one group. Likewise, the mean response times on correct answersare depicted in Fig. 2B, also as a function of series.
The accuracy for exact shape showed a main effect for age(F1,57=33.093, pb0.001, ηp2=.367). As can be seen in Fig. 2A, adultswere more accurate than children. No significant interaction was foundbetween age and visual status (F1,57=0.496, p=0.484, ηp2=.009).
For response times there was a main effect for age (F1,57=17.620,pb0.001, ηp
2=.236). Adults were in general slower than children. Thedata also showed a main effect for visual status (F1,57 =12.788,pb0.001, ηp
2=.183). Blind participants responded faster than thesighted ones. There was also a significant interaction between ageand visual status (F1,57=10.351, p=0.002, ηp
2=.154). As can be seenin Fig. 2B, this is mainly caused by the sighted adults who were slowerthan the three other groups. The data also showed a main effect for se-ries (F3,171=16.98, pb0.001, ηp
2=.230). Response times decreasedover the four sessions.
3.2. Weight
For the dimension weight age proved to be a significant maineffect for accuracy (see Fig. 3A), (F1,57=11.041, p=0.002, ηp
2=.162).Adults were in general more accurate than children. There was no sig-nificant interaction for age and visual status (F1,57=0.275, p=0.602,ηp2=.005).The response times for weight (see Fig. 3B) had a significant main
effect for series, (F3,171=6.594, pb0.001, ηp2=.104) indicating that
0
5
10
15
20
25
30
35
40
45
1 2 3 4
Res
pons
e tim
es (
s)
Exact Shape
Series
Adult and blind
Child and blind
B
es by age and visual Status. Error bars indicate standard error of measurement.

0
5
10
15
20
25
30
35
40
45
1 2 3 4
Res
pons
e tim
es (
s)
Weight
50
55
60
65
70
75
80
85
90
95
100
105
1 2 3 4
Acc
urac
y (%
)
Weight
Series Series
Adult and sighted Adult and blind
Child and sighted Child and blind
A B
Fig. 3. Accuracy (A) and response times (B) per trial for weight over four repeated series by age and visual status. Error bars indicate standard error of measurement.
267A. Withagen et al. / Acta Psychologica 139 (2012) 261–271
the average response times over all four groups decreased with repe-tition of the series. However, there was also a significant interactionbetween series and age (F3,171=7.523, pb0.001, ηp
2=.117). Fig. 3Bshows that children seem to become faster over the four sessions,whereas the response times of adults hardly changed. Finally, the di-mension weight also showed an interaction effect between age andvisual status (F1,57=7.856, p=0.007, ηp
2=.121). In blind participants
50
55
60
65
70
75
80
85
90
95
100
105
1 2 3 4
Acc
urac
y (%
)
Volume
Series
Adult and sighted
Child and sighted
A
Fig. 4. Accuracy (A) and response times (B) for volume over four repeated series
the children were slower than the adults, whereas in sighted partici-pants the adults were slower than the children.
3.3. Volume
Fig. 4A shows the accuracy for the dimension volume; there is asignificant main effect for age (F1,57=9.321, p=0.003, ηp
2=.141).
0
5
10
15
20
25
30
35
40
45
1 2 3 4
Res
pons
e tim
es (
s)
Volume
Series
Adult and blind
Child and blind
B
by age and visual status. Error bars indicate standard error of measurement.
0
5
10
15
20
25
30
35
40
45
1 2 3 4
Res
pons
e tim
es (
s)
Texture
50
55
60
65
70
75
80
85
90
95
100
105
1 2 3 4
Acc
urac
y (%
)
Texture
Series Series
Adult and sighted Adult and blind
Child and sighted Child and blind
A B
Fig. 5. Accuracy (A) and response times (B) for texture over four repeated series by age and visual status, error bars indicate standard error of measurement.
Table 1Correlations between four dimensions for accuracy and response times with age andvisual status partialled out.
Accuracy Response time
Exact shape Volume Weight Exact shape Volume Weight
Texture .37⁎ .30⁎ .13 .62⁎⁎ .72⁎⁎ .67⁎⁎
Weight .08 .11 .58⁎⁎ .53⁎⁎
Volume .47⁎⁎ .57⁎⁎
⁎ pb0.05.⁎⁎ pb0.001.
268 A. Withagen et al. / Acta Psychologica 139 (2012) 261–271
The adults were in general more accurate than the children. There wasno significant interaction between age and visual status (F1,57=1.801,p=0.185, ηp
2=.031).Response times, as depicted in Fig. 4B, showed a main effect
for series (F3, 171=17.995, pb0.001, ηp2= .240). Participants be-
came faster over the four sessions. No significant interactionwas found for age and visual status (F1,57=0.052, p=0.820,ηp2= .001).
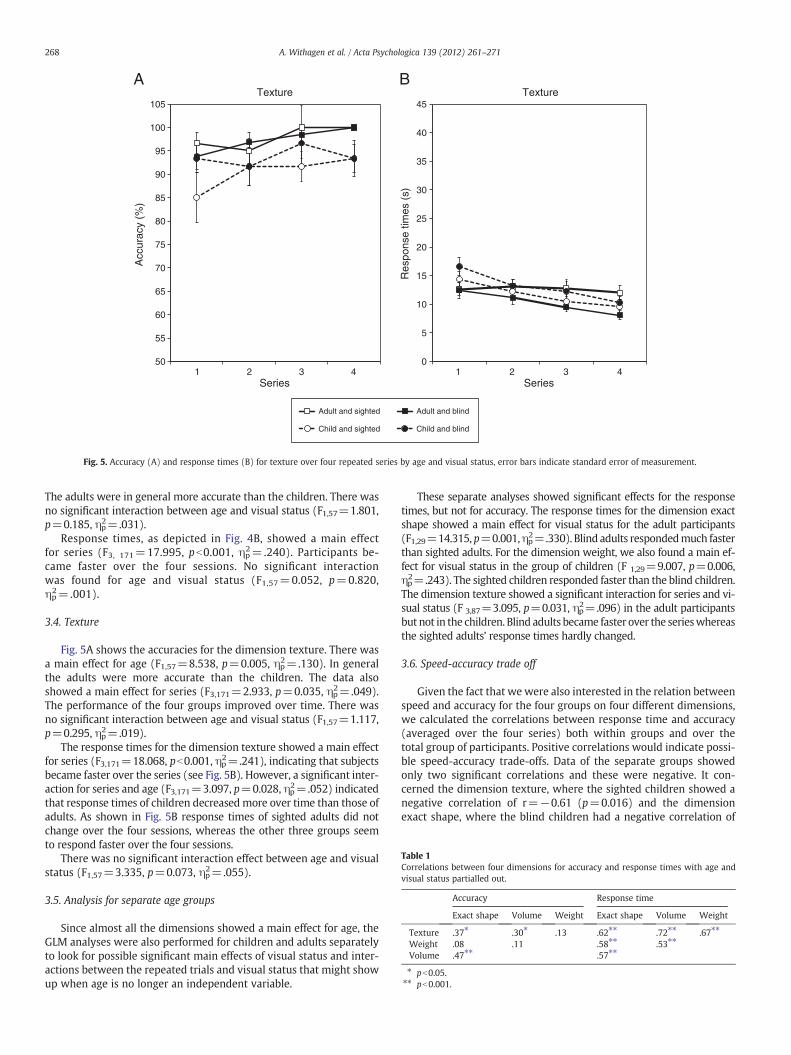
3.4. Texture
Fig. 5A shows the accuracies for the dimension texture. There wasa main effect for age (F1,57=8.538, p=0.005, ηp
2=.130). In generalthe adults were more accurate than the children. The data alsoshowed a main effect for series (F3,171=2.933, p=0.035, ηp
2=.049).The performance of the four groups improved over time. There wasno significant interaction between age and visual status (F1,57=1.117,p=0.295, ηp
2=.019).The response times for the dimension texture showed a main effect
for series (F3,171=18.068, pb0.001, ηp2=.241), indicating that subjects
became faster over the series (see Fig. 5B). However, a significant inter-action for series and age (F3,171=3.097, p=0.028, ηp
2=.052) indicatedthat response times of children decreasedmore over time than those ofadults. As shown in Fig. 5B response times of sighted adults did notchange over the four sessions, whereas the other three groups seemto respond faster over the four sessions.
There was no significant interaction effect between age and visualstatus (F1,57=3.335, p=0.073, ηp
2=.055).
3.5. Analysis for separate age groups
Since almost all the dimensions showed a main effect for age, theGLM analyses were also performed for children and adults separatelyto look for possible significant main effects of visual status and inter-actions between the repeated trials and visual status that might showup when age is no longer an independent variable.
These separate analyses showed significant effects for the responsetimes, but not for accuracy. The response times for the dimension exactshape showed a main effect for visual status for the adult participants(F1,29=14.315, p=0.001,ηp2=.330). Blind adults respondedmuch fasterthan sighted adults. For the dimension weight, we also found a main ef-fect for visual status in the group of children (F 1,29=9.007, p=0.006,ηp2=.243). The sighted children responded faster than the blind children.The dimension texture showed a significant interaction for series and vi-sual status (F 3,87=3.095, p=0.031, ηp2=.096) in the adult participantsbut not in the children. Blind adults became faster over the serieswhereasthe sighted adults’ response times hardly changed.
3.6. Speed-accuracy trade off
Given the fact that we were also interested in the relation betweenspeed and accuracy for the four groups on four different dimensions,we calculated the correlations between response time and accuracy(averaged over the four series) both within groups and over thetotal group of participants. Positive correlations would indicate possi-ble speed-accuracy trade-offs. Data of the separate groups showedonly two significant correlations and these were negative. It con-cerned the dimension texture, where the sighted children showed anegative correlation of r=−0.61 (p=0.016) and the dimensionexact shape, where the blind children had a negative correlation of

Table 2Comparison of the data of series 1 with the original study of Lederman and Klatzky (1987) for accuracy on the four dimensions in %. L&K=Lederman and Klatzky (1987), M=Mean,SD=Standard Deviation, CI=95% Confidence Interval.
L&Kn=18
Sighted adultsn=15
Blind adultsn=16
Sighted childrenn=15
Blind childrenn=15
M M (SD) CI M (SD) CI M (SD) CI M (SD) CI
Texture 93 97 (9) 92–100 94 (11) 88–100 85 (21) 73–96 93 (11) 87–100Volume 81 93 (11) 87–100 86 (18) 76–96 82 (27) 66–97 88 (16) 79–97Exact shape 76 87 (16) 78–96 86 (18) 76–96 63 (19) 53–74 70 (22) 58–82Weight 65 82 (18) 72–91 84 (22) 73–96 65 (26) 50–80 63 (21) 52–75
269A. Withagen et al. / Acta Psychologica 139 (2012) 261–271
r=−0.68 (p=0.006). In both cases the correlation was mainlycaused by just a few participants who were both slow and inaccurate.There was only one positive correlation over the total group of partic-ipants, namely for the dimension exact shape (r=0.31, p=0.016). Asubsequent partial correlation, controlling for age and visual status,found no significant correlation (p=0.31), indicating that the posi-tive correlation is probably due to group differences. Inspection ofFig. 2A and B suggests that the high performance but long responsetimes of the sighted adults in comparison with the other groups isthe major cause of this positive correlation.
3.7. Correlations between dimensions
Correlations between dimensions were calculated to study indi-vidual variation in accuracy and response times, that is whether sub-jects who were fast and/or accurate in one dimension were also fast/accurate in other dimensions. As age and visual status might affectthese correlations, they were partialled out. Table 1 shows the partialcorrelations for accuracy and response times between the four di-mensions. The correlations for accuracy were weakly positive (range.11 to .47). The intercorrelations for response times were strongerand in the medium to high range (.53 to .72).
3.8. Comparison with the Lederman and Klatzky data
Table 2 shows the accuracy of the participants in the original studyof Lederman and Klatzky on the four dimensions in the left column. Un-fortunately, only the mean scores are known and no standard devia-tions or standard errors of measurement. For ease of comparison anddue to the fact that Lederman and Klatzky did not repeat the trials,the mean scores on accuracy of the four different groups in the othercolumns are only shown for series 1. The order of the accuracy scoresis the same for the Lederman and Klatzky and our studies.
4. Discussion
4.1. Children versus adults
Adults were expected to be more accurate and faster than chil-dren, due to the assumption that children need more redundancy intheir information processing (Millar, 1994a,b, 1997). This assumptionwas partly confirmed by the data. The adults were indeed significant-ly more accurate on all four dimensions but they were not faster thanchildren. With the dimension ‘Exact Shape’, we saw the largest differ-ence in accuracy between children and adults. This might be causedby the complexity of the task and the spatial skills needed to solvethis task correctly. These spatial skills might not have been maturedenough in children (Gentaz & Hatwell, 2003; Millar, 1997; Warren,1994). The fact that children's hands are smaller than adult handsmight also have influenced performance on the different tasks. Someof the largest stimuli were difficult to enclose for the children forcingthem to use additional strategies.
According to Millar (1994a,b), children need more rehearsal andredundant information to interpret haptic and spatial information.
Following this statement, we expected children to be slower thanadults. However, our assumption proved to be wrong: adults didnot perform significantly faster than children. On the contrary, onsome tasks the children performed even faster than adults. We canonly speculate about an explanation. Maybe children underestimatedthe complexity of the task or by responding fast they could relieve ap-peals to short time memory. Another explanation might be that sight-ed adults try to visualize the shape they feel and that this processtakes extra time (Gibson, 1966; Révesz, 1950), while blind adultsand all children skip this strategy. Redundant information from visu-alizing the shape obviously did not improve speed of performance,but apparently they needed this extra time to reach the same levelof accuracy as blind adults. The faster performance of the blind adultsmay also be explained by the use of a more efficient haptic strategy(see also Davidson, 1972).
4.2. Sighted versus blind participants
Despite the haptic experience blind persons have in tasks whichsighted people execute visually, we posed that the performance ofblind and sighted participants would not differ once their performanceis corrected for familiarisation. In previous studies, blind participantsperformed better on the first occasion, but sighted participants im-proved after a training, when they became more familiar with the taskand learned which haptic strategy was efficient in solving the task(see e.g., Davidson, 1972; Davidson & Whitson, 1974; Grant et al.,2000). Since our experiment did not include a training session, itcould have been possible that the blind participants would outperformthe sighted. However, in our studywe did not find any difference on ac-curacy between the two groups. The practice trials we offered to theparticipants, may have served as a training, resulting in no differencein performance between blind and sighted participants. This resultwas also found when adults and children were analysed separately.For children, this result is in accordance with the results of a study ofMorrongiello et al. (1994).
4.3. Familiarity
We expected that performing the same task four times would onlyaffect speed in adults, whereas for children we thought it might affectaccuracy as well as speed of responding. However, the data showedthat repeating the experiment had only a positive effect on the responsetimes for the dimensions ‘Exact shape’ and ‘Volume’: all groups becamefaster over time. For the dimensions ‘Weight’ and ‘Texture’, only the re-sponse times of the children decreased over the series. Accuracy did notimprove after repeating the experiment. This lack of improvementmight have resulted from a ceiling effect or by the fact that no feedbackwas given.
4.4. Speed-accuracy trade-off
The relation between accuracy and speed was studied for the totalgroup and within the four groups. Only one positive correlation wasfound for the total group. For the dimension ‘Exact Shape’ the significant

270 A. Withagen et al. / Acta Psychologica 139 (2012) 261–271
correlation was caused by a few very slow performing sighted adults,whowere also very accurate. So differences between individuals withina group or differences between groups cannot be explained by a speed-accuracy trade-off.
4.5. Individual variation
Individual variation was studied by computing correlations for thefour dimensions for both accuracy and response times, with age andvisual status partialled out. Response times for all the dimensions corre-lated significantly. For accuracy, the correlations were weak and onlysignificant in half of the cases. Our preliminary conclusion is that,since the speed of performance is relatively stable across tasks andsince age and visual status were partialled out, the moderately strongcorrelations for response times can be thought of as individual responseand learning styles: respondents react in tests of all four dimensionswith rather the same speed, irrespective of their accuracy. In contrast,accuracy is much more dependent on the type of task, because therewas large variation in accuracy between the four tasks, and accuracyvaried largely within individuals, resulting in a lack of significant inter-correlations. Thismay indicate that tactual dimensions are picked up in-dependently and there is no underlying capacity of the haptic system topick up all dimensions with the same efficiency.
4.6. Comparison with the data of Lederman and Klatzky
The accuracy performance of the adults in the current study wascomparable with the participants in the study of Lederman andKlatzky (1987). ‘Texture’ was easiest to match and ‘Weight’ most dif-ficult. When we compare the 95% confidence interval of the data inthe current study with the original data of Lederman and Klatzky,the sighted adults included in our study performed slightly betteron all four dimensions. When we compare the Lederman and Klatzkydata with the blind adults, accuracy is within the 95% confidence inter-val for three of the four dimensions. The data of the children also show acomparable organization in difficulty level. However, ‘Exact shape’wasabout as difficult for the children as the dimension ‘Weight’. The indi-vidual variation was quite high, which might be explained by variationin developmental trajectories.Whenwe compare the scores of adults inthe study of Lederman and Klatzkywith the blind children all the scoresare within the 95% confidence interval. This is not the case for the sight-ed children: for the dimension ‘Exact Shape’ the adult score lies justabove the confidence interval.
5. Conclusion
When we compare the data of the blind children and adults withtheir sighted peers, the results showed that the blind children did notperform any better than their sighted classmateswith regard to accura-cy and response times. The blind adults, however, were faster than thesighted adults on ‘Exact Shape’. The blind adults were not significantlyfaster than the children in this task, but they were more accurate. Thisdifference may have been caused by the use of different strategies byblind and sighted adults. Until now this is unknown and a topic for fu-ture research.
Before the start of the study we expected the blind children to out-perform the sighted children, due to the fact that blind children receiveindividual tactual training and sighted children for obvious reasons donot. Yet, the results did not confirm this expectation. One explanationmight be that blind children are usually trained in skills other than theones assessed in the current study. The results also showed that inadulthood blind people become faster in solving haptic spatial tasks incomparison to sighted people. Since object identification and discrimi-nation is normally much faster accomplished by vision than touch, en-hancing the speed of haptic object identification and discriminationmust be useful for blind people. A clinical implication might therefore
be that it makes sense to train these haptic skills to blind children earlyin childhood.
Acknowledgements
The authors acknowledge the contribution of Dr. Lederman whogave her permission to reproduce the stimuli of the original objectset and cooperated in realizing this set. We thank dr. Lederman anddr. Klatzky for their comments on some preliminary results. We areindebted to all the participants, parents and teachers, for their contri-bution for this study. We also thank the students, who observed thetapes and scored the response times. The research was supportedby a grant from the Novum Foundation: a non-profit organizationproviding financial support to (research) projects that improve the qual-ity of life of individuals with a visual impairment. A.M.L. Kappers wassupported by a grant from theNetherlandsOrganisation for Scientific Re-search (NWO).
References
Alexander, J. M., Johnson, K. E., & Schreiber, B. E. (2002). Knowledge is not everything:Analysis of children's performance on a haptic comparison task. Journal of Experi-mental Child Psychology, 82(4), 341–366.
Bradley-Johnson, S., Johnson, C. M., Swanson, J., & Jackson, A. (2004). Exploratory be-haviour: A comparison of infants who are congenitally blind and infants who aresighted. Journal of Visual Impairment and Blindness, 98, 496–502.
Bushnell, E. W., & Boudreau, J. P. (1991). The development of haptic perception duringinfancy. In M. A. Heller & W. Schiff (Eds.), The psychology of touch (pp. 139–161).Hillsdale, New Jersey: Lawrence Erlbaum Associates.
Bushnell, E. W., & Boudreau, J. P. (1998). Exploring and exploiting objects with thehands during infancy. In K. Connolly (Ed.), The psychology of the hand(pp. 144–161). Cambridge, UK: Mac Keith Press.
Craig, J. C. (1988). The role of experience in tactual pattern perception: A preliminaryreport. International Journal of Rehabilitation Research, 11, 167–183.
D'Angiulli, A., Kennedy, J. M., & Heller, M. A. (1998). Blind children recognizing tactilepictures respond like sighted children given guidance in exploration. ScandinavianJournal of Psychology, 39, 187–190.
Davidson, P. W. (1972). Haptic judgements of curvature by blind and sighted humans.Journal of Experimental Psychology, 93, 43–55.
Davidson, P. W., & Whitson, T. T. (1974). Haptic equivalence matching of curvature byblind and sighted humans. Journal of Experimental Psychology, 102, 687–690.
Gentaz, E., & Hatwell, Y. (2003). Haptic processing of spatial and material object proper-ties. In Y. Hatwell, A. Streri, & E. Gentaz (Eds.), Touching for knowing (pp. 123–159).Amsterdam: John Benjamins Publishing Co.
Gibson, J. J. (1966). The senses considered as perceptual systems. Boston: Houghton-Miffin.Gizewski, E. R., Gasser, T., de Greiff, A., Boehm, A., & Forsting, M. (2003). Cross-modal
plasticity for sensory and motor activation patterns in blind subjects. NeuroImage,19, 968–975.
Grant, A. C., Thiagarajah, M. C., & Sathian, L. (2000). Tactile perception in blind Braillereaders: A psychophysical study of acuity and hyperacuity using gratings and dotpatterns. Perception & Psychophysics, 62, 301–312.
Goldreich, D., & Kanics, I. M. (2003). Tactile acuity is enhanced in blindness. Journal ofNeuroscience, 23, 3439–3445.
Hatwell, Y. (1978). Form perception and related issues in blind humans. In R. HeldHerschel, W. Leibowitz, & H. Teuber (Eds.), Perception (pp. 489–519). NewYork: Springer-Verlag.
Hatwell, Y. (2003). Introduction. In Y. Hatwell, A. Streri, & E. Gentaz (Eds.), Touching forknowing (pp. 67–83). Amsterdam: John Benjamins Publishing Co.
Hatwell, Y. (2003). Manual exploratory procedures in children and adults. In Y. Hatwell, A.Streri, &E. Gentaz (Eds.), Touching for knowing (pp. 67–83). Amsterdam: JohnBenjaminsPublishing Co.
Heller, M. A. (2000). Conclusions: The San Marino discussion. In M. A. Heller (Ed.), Touch,representation and blindness (pp. 183–217). New York: Oxford University Press.
Klatzky, R. L., Lederman, S. J., & Matula, D. E. (1991). Imagined haptic exploration injudgements of object properties. Journal of Experimental Psychology: Learning,Memory, and Cognition, 17(2), 314–322.
Klatzky, R. L., Lederman, S. J., & Matula, D. E. (1993). Haptic exploration in the presenceof vision. Journal of Experimental Psychology. Human Perception and Performance,19(4), 726–743.
Lederman, S. J., & Klatzky, R. L. (1987). Hand movements: A window into haptic objectrecognition. Cognitive Psychology, 19, 342–368.
Millar, S. (1974). Tactile short-termmemory by blind and sighted children. British Journalof Psychology, 65(2), 253–263.
Millar, S. (1994). Understanding and representing space. Oxford: Clarendon Press.Millar, S. (1994b). A theory of spatial understanding and development. In S. Millar Under-
standing and representing space. Oxford: Clarendon Press.Millar, S. (1997). Theory, experiment and practical application in research on visual
impairment. European Journal of Psychology of Education, 12(4), 415–430.

271A. Withagen et al. / Acta Psychologica 139 (2012) 261–271
Millar, S. (2000). Modality and mind: A convergent active processing in interrelated net-works as a model of development and perception by touch. In M. A. Heller (Ed.),Touch, representation and blindness (pp. 99–143). New York: Oxford University Press.
Millar, S. (2005). Network models for haptic perception. Infant Behavior & Development,28, 250–265.
Millar, S. (2008). Space and sense. New York: Psychology Press.Morrongiello, B. A., Humphrey, G. H., et al. (1994). Tactual object exploration and recogni-
tion in blind and sighted children. Perception, 23, 833–848.Noldus Information Technology (2008). The Observer XT Reference Manual Version 8.Révesz, G. (1950). Psychology and art of the blind. London: Longmans, Green & Co.Sadato, N., Okada, T., Honda, M., & Yonekura, Y. (2002). Critical period for cross-modal
plasticity in blind humans: A functional MRI study. NeuroImage, 16, 389–400.Sathian, K. (2000). Practicemakesperfect: Sharper tactile perception in the blind.Neurology,
54, 2203–2204.Sathian, K. (2005). Visual cortical activity during tactile perception in the sighted and
the visually deprived. Developmental Psychobiology, 46, 279–286.Sathian, K., & Stilla, R. (2010). Cross-modal plasticity of tactile perception in blindness.
Restorative Neurology and Neuroscience, 28, 271–281.
Schellingerhout, R., Smitsman, A. W., & Van Galen, G. P. (1997). Exploration of surface-textures in congenitally blind infants. Child: Care, Health and Development, 23(3),247–364.
Schellingerhout, R., Smitsman, A. W., & Van Galen, G. P. (1998). Haptic object explorationin congenitally blind infants. Journal of Visual Impairment & Blindness, 92, 674–678.
Simpkins, K. E. (1979). Tactual discrimination of shapes. Journal of Visual Impairment &Blindness, 73, 93–101.
Warren, D. (1994). Spatial understanding and spatial behaviour. In D. Warren (Ed.),Blindness and children. An individual differences approach. New York: CambridgeUniversity Press.
Withagen, A., Vervloed, P., Janssen, N., Knoors, H., & Verhoeven, L. (2010). The tactualprofile: Development of a procedure to assess the tactual functioning of childrenwho are blind. British Journal of Visual Impairment, 27(3), 221–238.
Withagen, A., Vervloed, P., Janssen, N., Knoors, H., & Verhoeven, L. (2010). Tactile func-tioning in children who are blind: A clinical perspective. Journal of Visual Impair-ment & Blindness, 104, 43–54.


![EBU presentation Barcelona [Modo de compatibilidad]€¦ · The European Blind Union (EBU): • represents the interests of blind and partially sighted people in 45 European countries](https://img.dokumen.tips/doc/110x75/6040083be2cf9609c06d95d3/ebu-presentation-barcelona-modo-de-compatibilidad-the-european-blind-union-ebu.jpg)


