Embed Size (px)
Citation preview
Handheld Time-domainElectromagnetic Identification
(TEMID)Sensor System
Carl V. Nelson
Johns Hopkins UniversityApplied Physics Laboratory
September 22, 1998
Sponsor:US Army CECOM/NVESD
9.98.48.Ol;PP
Executive Summary
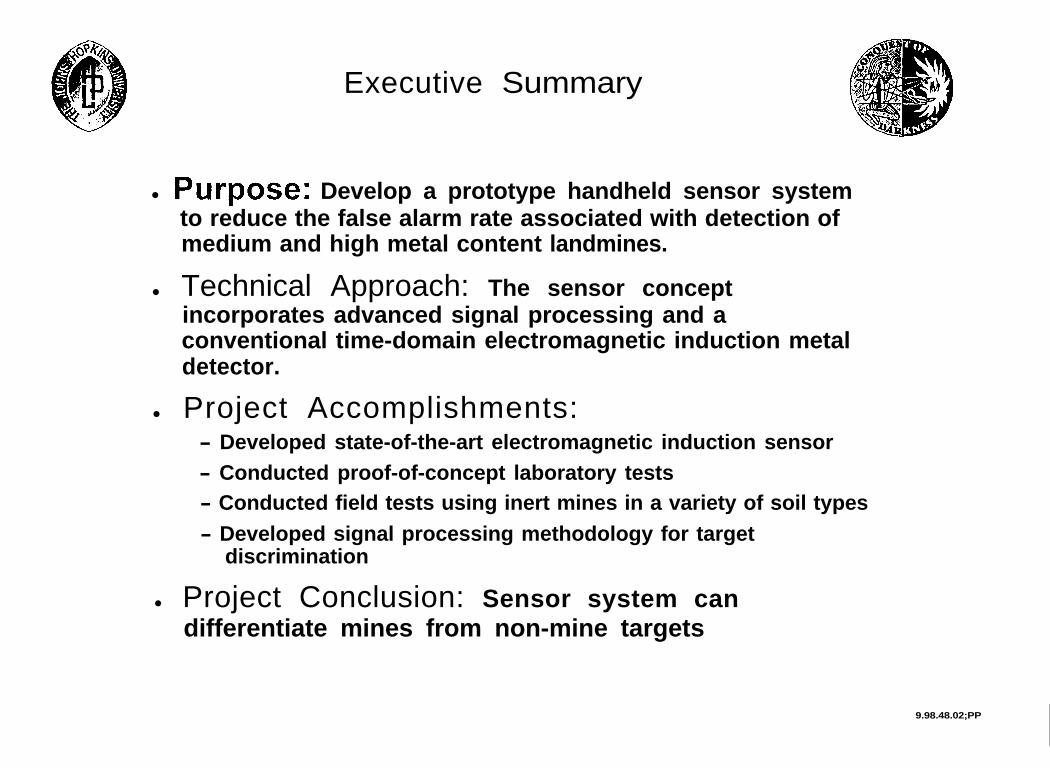
l PUrpOSC?: Develop a prototype handheld sensor systemto reduce the false alarm rate associated with detection ofmedium and high metal content landmines.
l Technical Approach: The sensor conceptincorporates advanced signal processing and aconventional time-domain electromagnetic induction metaldetector.
l Project Accomplishments:- Developed state-of-the-art electromagnetic induction sensor- Conducted proof-of-concept laboratory tests- Conducted field tests using inert mines in a variety of soil types- Developed signal processing methodology for target
discrimination
l Project Conclusion: Sensor system candifferentiate mines from non-mine targets
9.98.48.02;PP
Presentation Outline
l TEMID Project Objectives
l Time-domain Method
l Simulation Summary
l TEMID System Description
l Instrumentation Summary
l Signal Processing Summary
l Lab Test Data Summary
l Ft Belvoir Mine Lane Test Summary
l Ft AP Hill Field Test Summary
l Project Summary
9.98.48.03;PP
TEMID Project Objectives
l Research, development, fabrication and test of a prototypehandheld Time-domain Electromagnetic Identification (TEMID)sensor using Commercial Off-The-Shelf (COTS) technology.
l The overall objective is to improve the false alarm rateassociated with the detection and identification of high andmedium metal content mines, i.e., discriminate mines from themyriad of metallic clutter, such as nails, wire, and bullet shells.
l The TEMID sensor concept incorporates advanced signalprocessing to the basic time-domain handheld magneticinduction metal detector to improve its ability to discriminatespecific types of mines and clutter.
9.98.48.04;PP
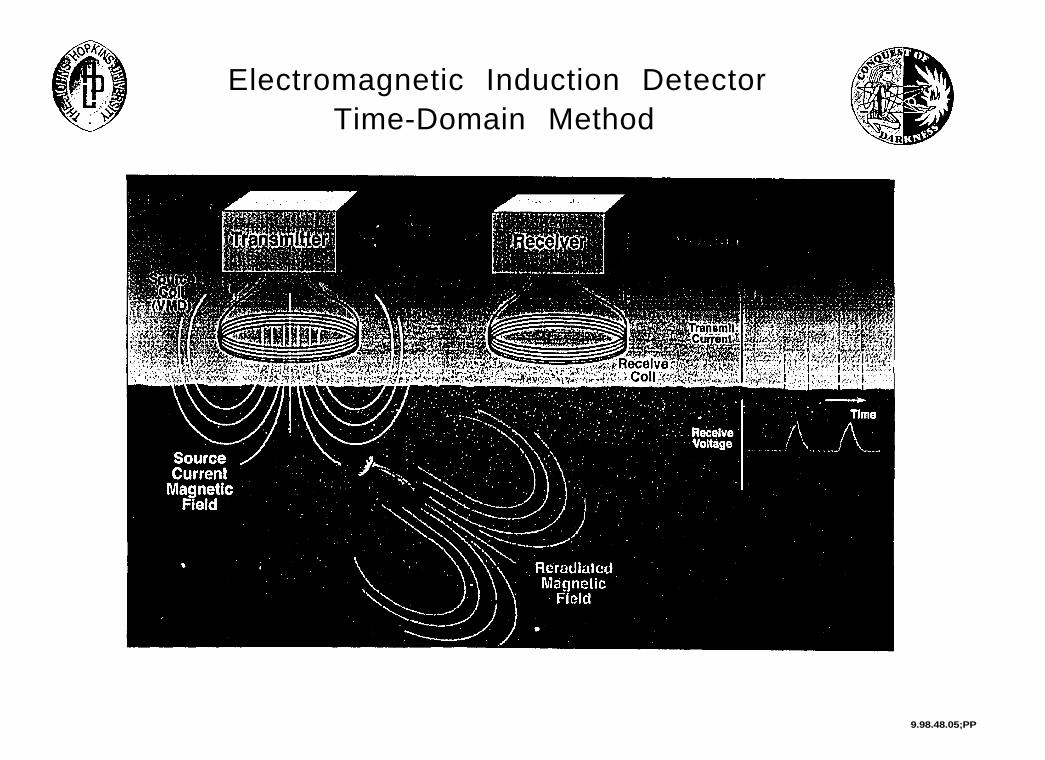
Electromagnetic Induction DetectorTime-Domain Method
9.98.48.05;PP
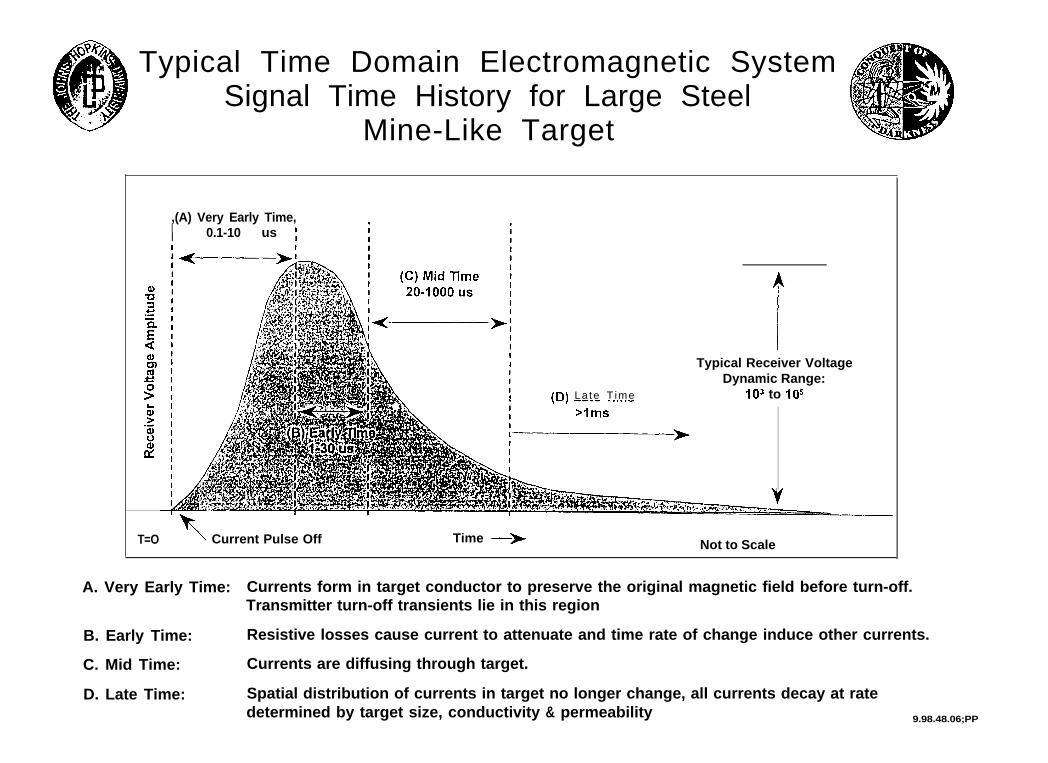
Typical Time Domain Electromagnetic SystemSignal Time History for Large Steel
Mine-Like Target
T=O
,(A) Very Early Time,I 0.1-10 us ;I
i
ITypical Receiver Voltage
I
I
Dynamic Range:I La te T ime IO3 to IO5
Current Pulse Off Time ---+ Not to Scale
A. Very Early Time: Currents form in target conductor to preserve the original magnetic field before turn-off.Transmitter turn-off transients lie in this region
B. Early Time: Resistive losses cause current to attenuate and time rate of change induce other currents.
C. Mid Time: Currents are diffusing through target.
D. Late Time: Spatial distribution of currents in target no longer change, all currents decay at ratedetermined by target size, conductivity & permeability 9.98.48.06;PP

0
0
0
Simulation Summary
Used Vector Fields “Opera 3-D” to model plates ofdifferent conductivities and permeabilitiesFEM simulation softwareProgram calculated current distribution in model as afunction of time.Simulation was beneficial for visualizing target responsesApplied step-up function magnetic field change to models- Step-down magnetic field not available in time for project- Step-up magnetic field complicated simulation result interpretation
B Encountered round-off errors
Experimented with different time steps- Found that a time step of 1 us was good compromise between
processing speed and simulation results
Simulation software had difficulty with shell modelsSimulation software helped to design transmitter andreceiver coil design- confirmed experimental results
9.98.48.07;PP
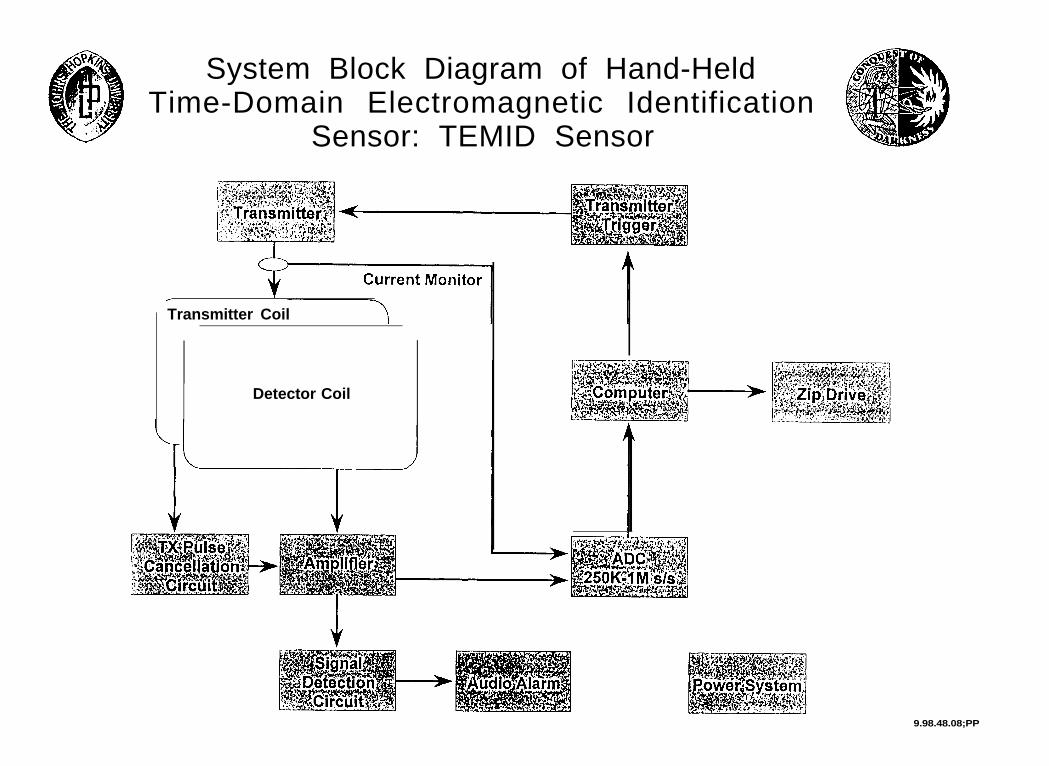
System Block Diagram of Hand-HeldTime-Domain Electromagnetic Identification
Sensor: TEMID Sensor
/Transmitter Coil
Detector Coil
9.98.48.08;PP
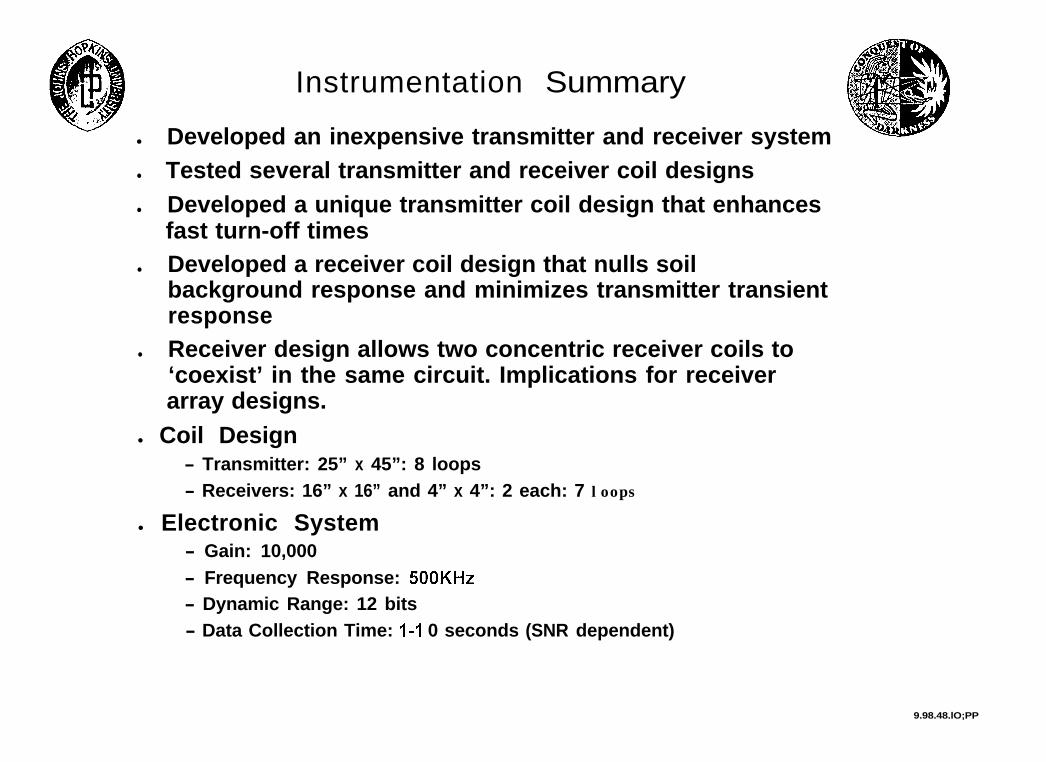
Instrumentation Summary
l Developed an inexpensive transmitter and receiver systeml Tested several transmitter and receiver coil designsl Developed a unique transmitter coil design that enhances
fast turn-off timesl Developed a receiver coil design that nulls soil
background response and minimizes transmitter transientresponse
l Receiver design allows two concentric receiver coils to‘coexist’ in the same circuit. Implications for receiverarray designs.
l Coil Design- Transmitter: 25” x 45”: 8 loops- Receivers: 16” x 16” and 4” x 4”: 2 each: 7 loops
l Electronic System- Gain: 10,000- Frequency Response: SOOKHz- Dynamic Range: 12 bits- Data Collection Time: l-l 0 seconds (SNR dependent)
9.98.48.lO;PP
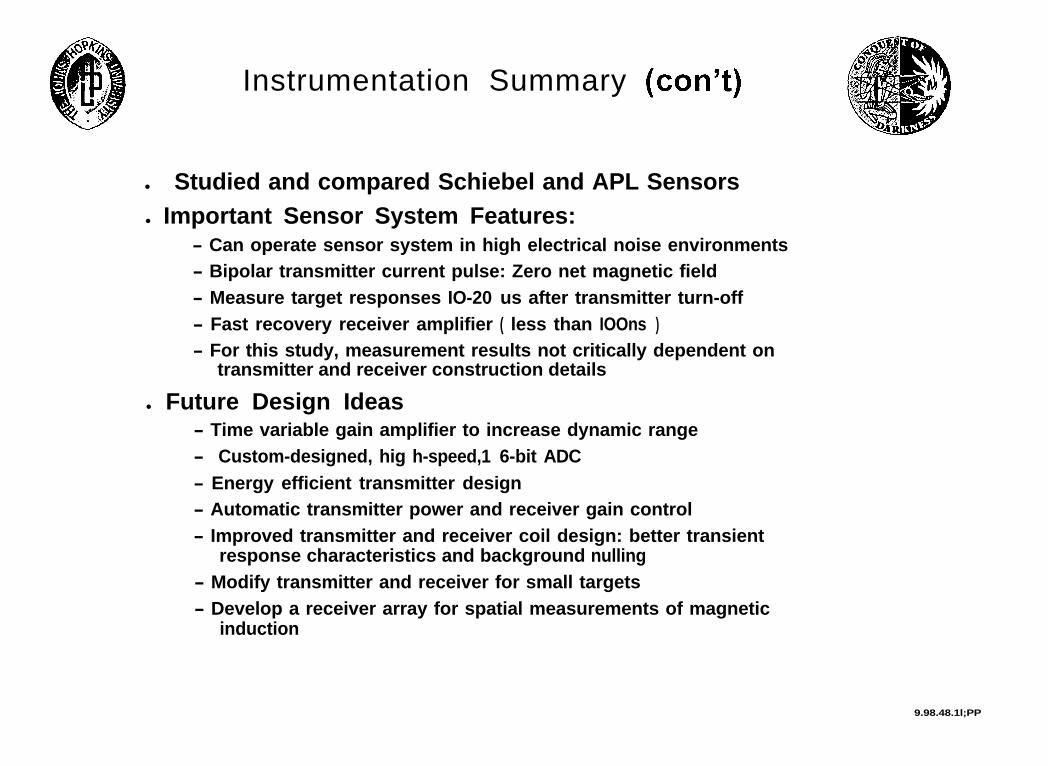
Instrumentation Summary (can’t)
l Studied and compared Schiebel and APL Sensorsl Important Sensor System Features:
- Can operate sensor system in high electrical noise environments- Bipolar transmitter current pulse: Zero net magnetic field- Measure target responses IO-20 us after transmitter turn-off- Fast recovery receiver amplifier ( less than IOOns )- For this study, measurement results not critically dependent on
transmitter and receiver construction details
l Future Design Ideas- Time variable gain amplifier to increase dynamic range- Custom-designed, hig h-speed,1 6-bit ADC- Energy efficient transmitter design- Automatic transmitter power and receiver gain control- Improved transmitter and receiver coil design: better transient
response characteristics and background nulling- Modify transmitter and receiver for small targets- Develop a receiver array for spatial measurements of magnetic
induction
9.98.48.1l;PP
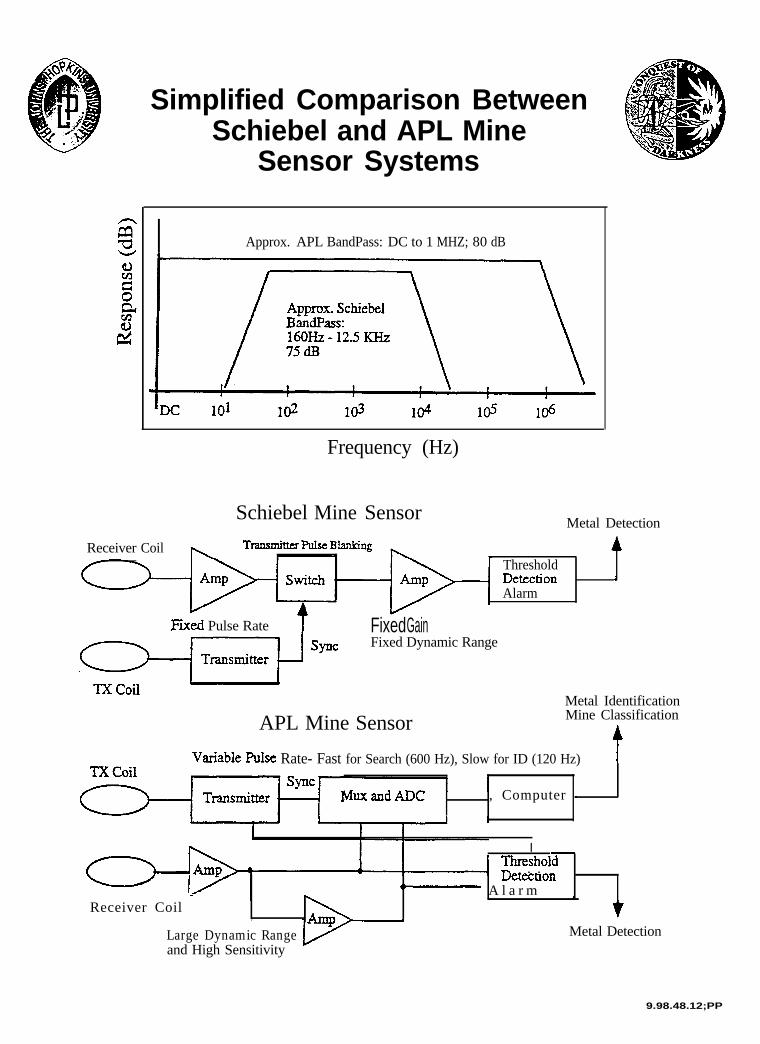
Simplified Comparison BetweenSchiebel and APL Mine
Sensor Systems
I Approx. APL BandPass: DC to 1 MHZ; 80 dB
Frequency (Hz)
Schiebel Mine SensorMetal Detection
Receiver Coil LThresholdDf%%tiOIl IAlarm
Fiied Pulse Rate 1 Fixed GainFixed Dynamic Range
Metal Identification
APL Mine Sensor Mine Classification
4
briable htlse Rate- Fast for Search (600 Hz), Slow for ID (120 Hz) I
ISkandADC 1 , Computer +
IThresholh, . . dlXltXtlOll
” - A l a r m bReceiver Coil * ,
Large Dynamic Rangeand High Sensitivity
Metal Detection
9.98.48.12;PP
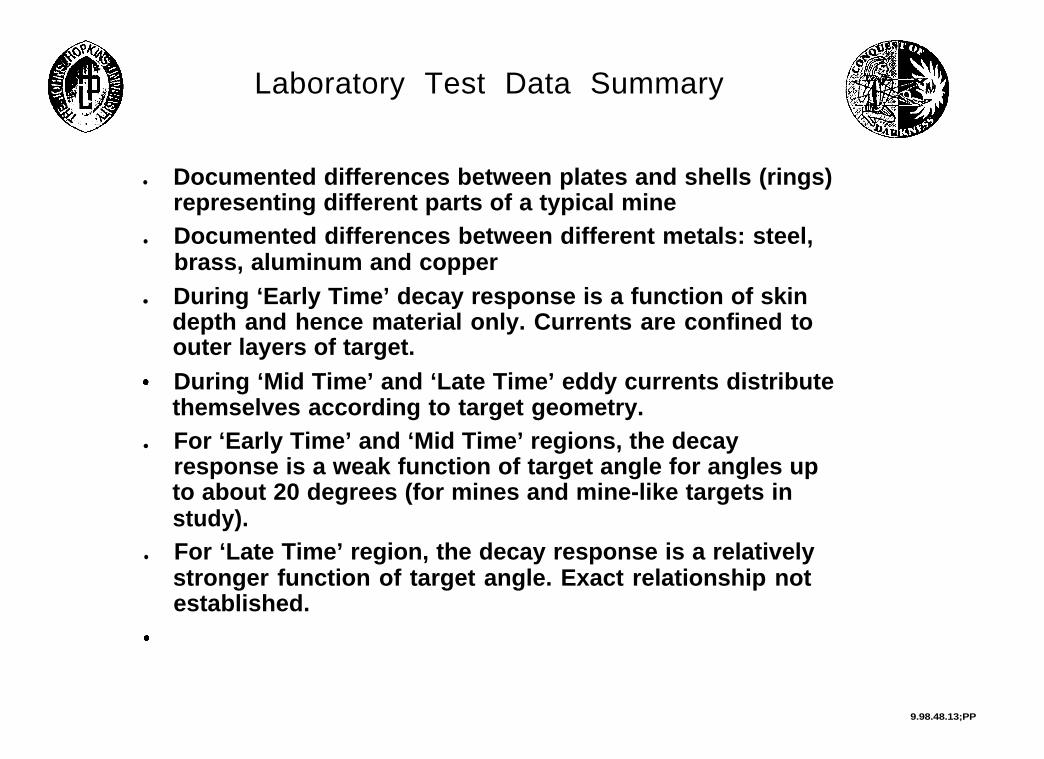
Laboratory Test Data Summary
l Documented differences between plates and shells (rings)representing different parts of a typical mine
l Documented differences between different metals: steel,brass, aluminum and copper
l During ‘Early Time’ decay response is a function of skindepth and hence material only. Currents are confined toouter layers of target.
0 During ‘Mid Time’ and ‘Late Time’ eddy currents distributethemselves according to target geometry.
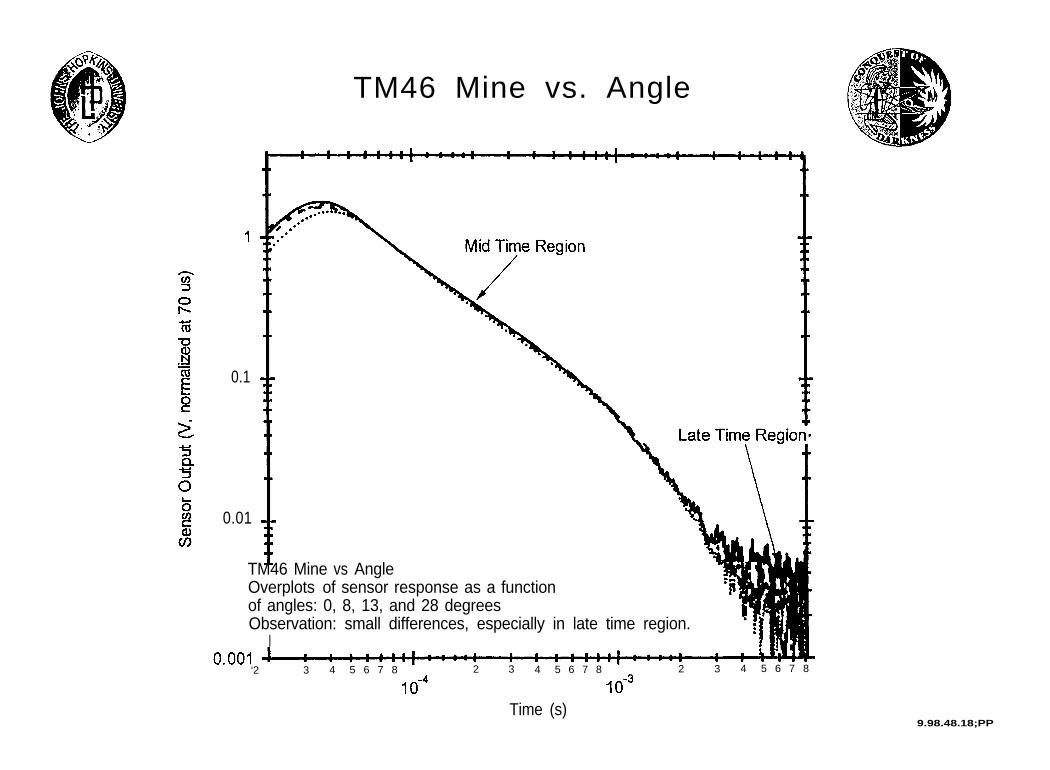
l For ‘Early Time’ and ‘Mid Time’ regions, the decayresponse is a weak function of target angle for angles upto about 20 degrees (for mines and mine-like targets instudy).
l For ‘Late Time’ region, the decay response is a relativelystronger function of target angle. Exact relationship notestablished.
9.98.48.13;PP
Q)IAm08-cnh_cn
\
aIs.-riizi
>
0Qv)Q)
In
t
IbID
ID. .
I.
l D
T\d
0’z
d0d
(Srl(J&P Je paZ!JE?LUJOu 'A) IndIng JO
Wa
S
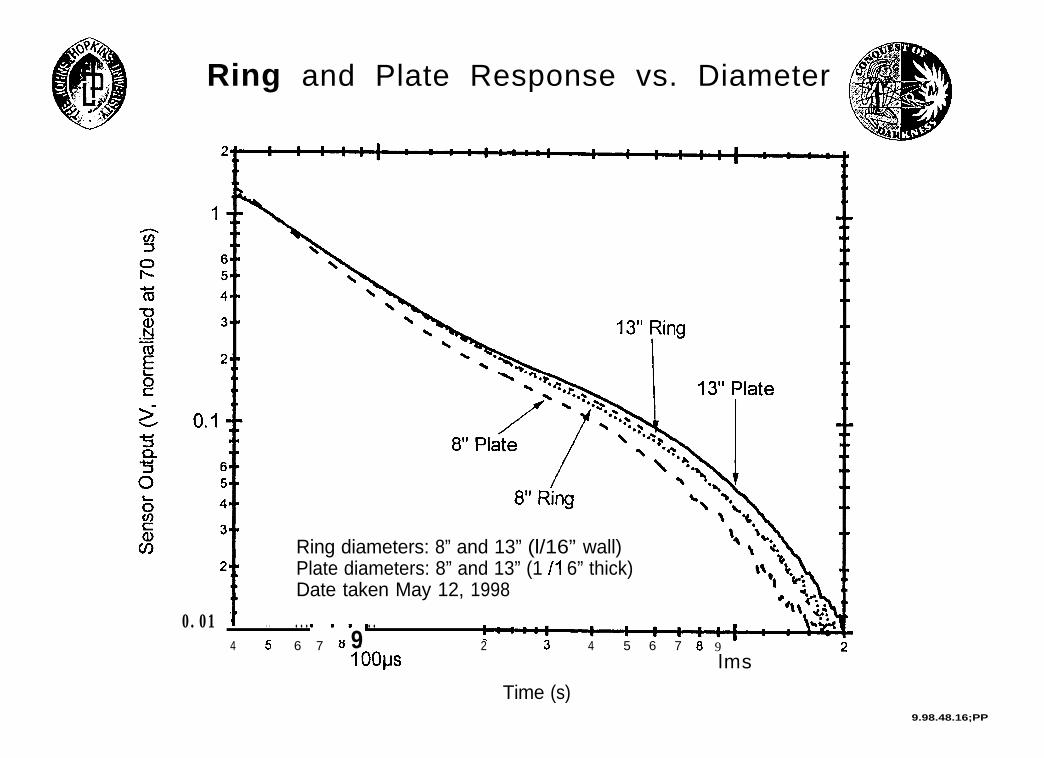
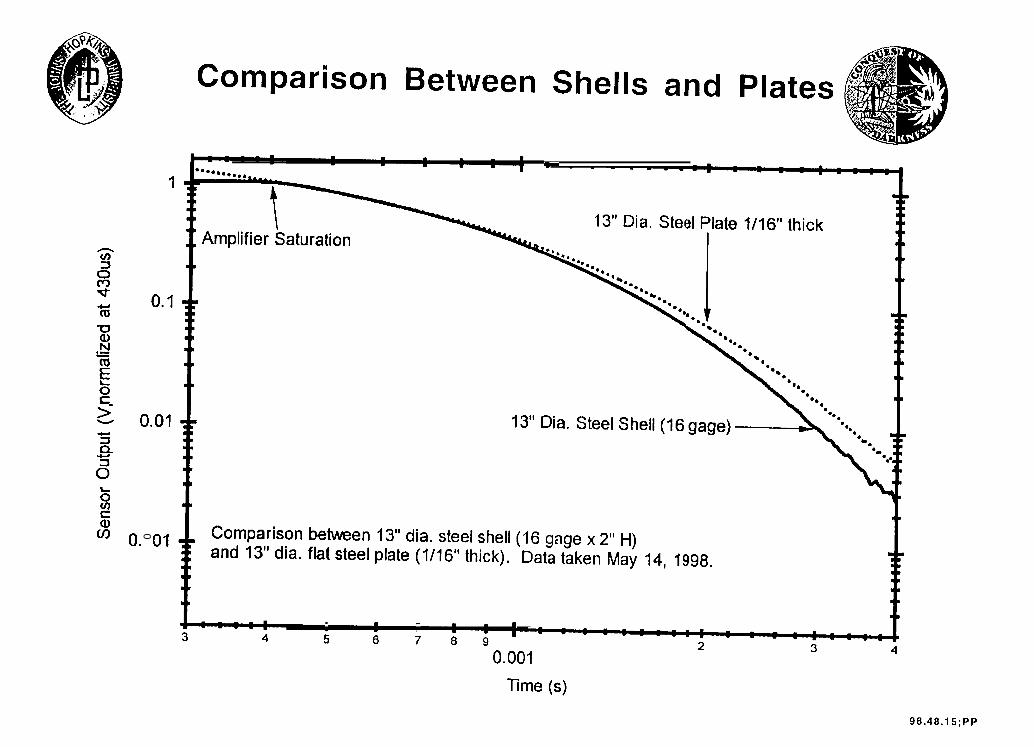
Ring and Plate Response vs. Diameter
Ring diameters: 8” and 13” (l/16” wall)Plate diameters: 8” and 13” (1 /I 6” thick)Date taken May 12, 1998
0.01 ! . .4 5
. . . ..m, . .6 7 - - 2 4 5 6 78 9
1 oopsTime (s)
0 9 -lms
9.98.48.16;PP
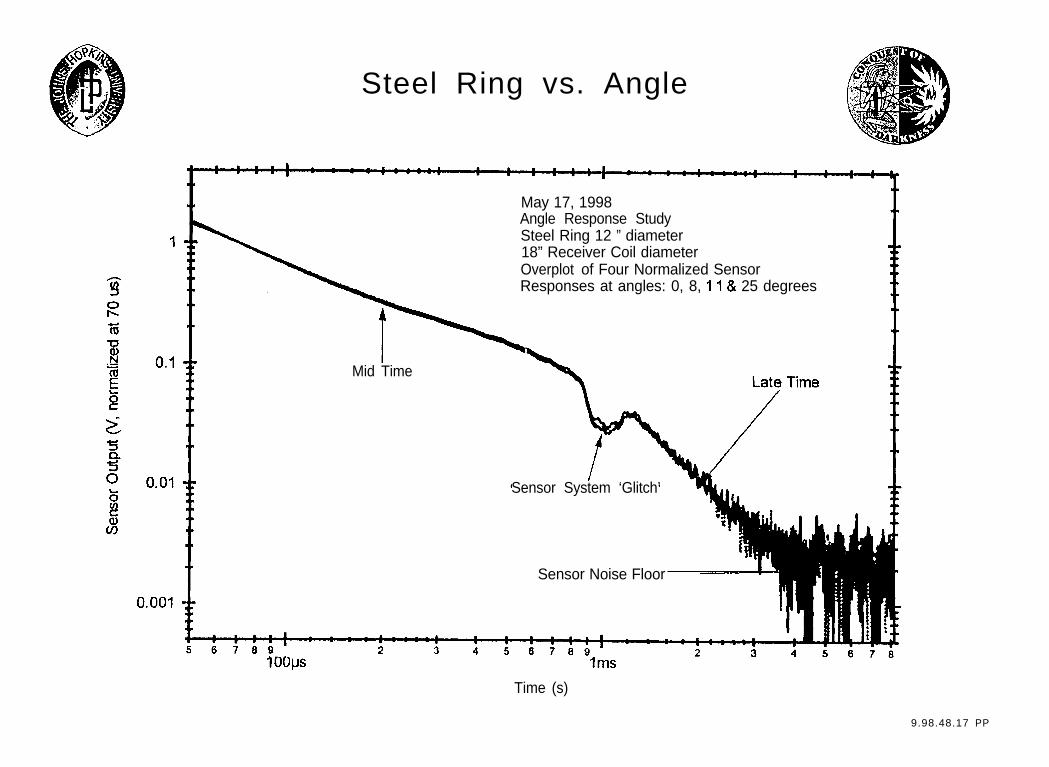
Steel Ring vs. Angle
May 17, 1998Angle Response StudySteel Ring 12 ” diameter18” Receiver Coil diameterOverplot of Four Normalized SensorResponses at angles: 0, 8, 1 I & 25 degrees
Mid Time
Sensor System ‘Glitch’
Sensor Noise Floor
loops lms
Time (s)
9.98.48.17 PP
1
0.1
0.01
TM46 Mine vs. Angle
TM46 Mine vs AngleOverplots of sensor response as a functionof angles: 0, 8, 13, and 28 degreesObservation: small differences, especially in late time region.
I
‘2 3 4 5 6 7 8 2 3 4 5 6 7 8 2 3 4 5 6 7 8
1o-4Time (s)
IO9
9.98.48.18;PP
1200
800
600
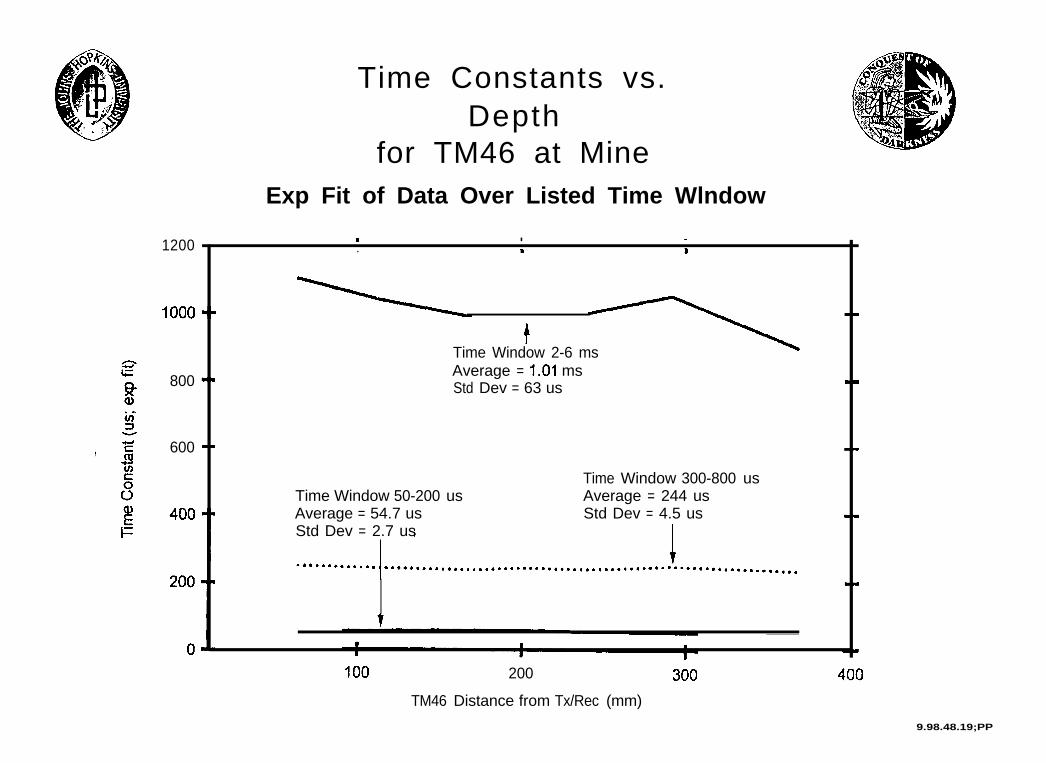
Time Constants vs.Depth
for TM46 at MineExp Fit of Data Over Listed Time Wlndow
I . -.
tTime Window 2-6 msAverage = 1.01 msStd Dev = 63 us
Time Window 50-200 usAverage = 54.7 usStd Dev = 2.7 us
Time Window 300-800 usAverage = 244 usStd Dev = 4.5 us
200
TM46 Distance from Tx/Rec (mm)
9.98.48.19;PP
0
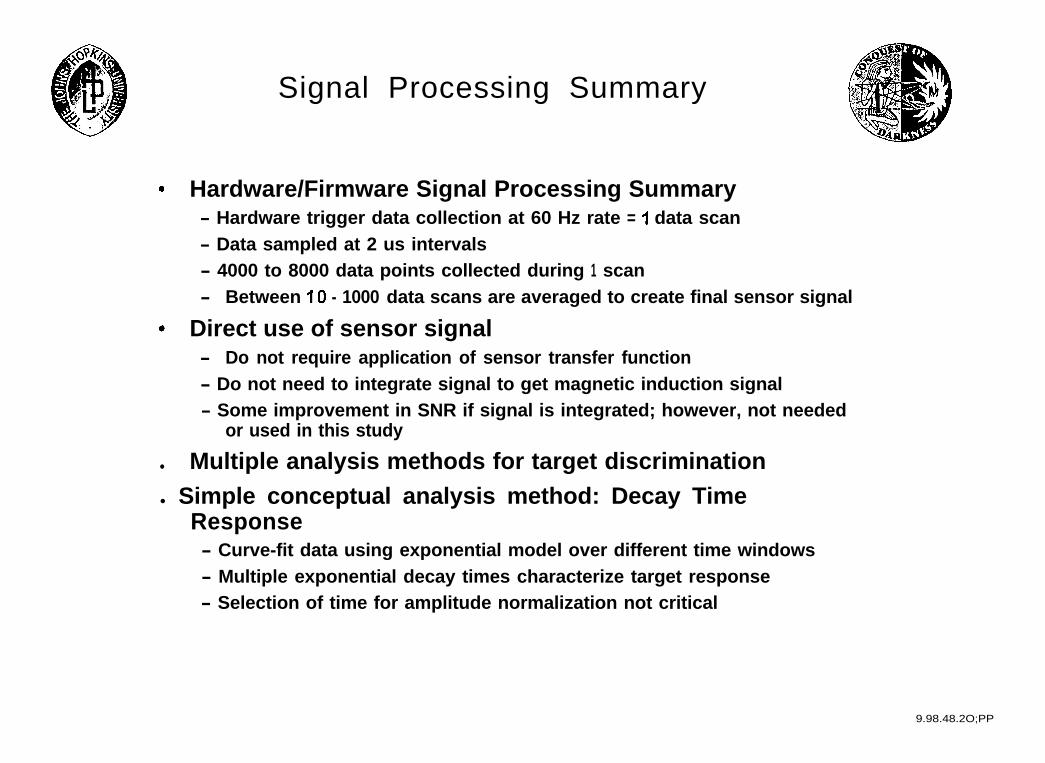
Signal Processing Summary
Hardware/Firmware Signal Processing Summary- Hardware trigger data collection at 60 Hz rate = I data scan- Data sampled at 2 us intervals- 4000 to 8000 data points collected during 1 scan- Between IO - 1000 data scans are averaged to create final sensor signal
Direct use of sensor signal- Do not require application of sensor transfer function- Do not need to integrate signal to get magnetic induction signal- Some improvement in SNR if signal is integrated; however, not needed
or used in this study
l Multiple analysis methods for target discriminationl Simple conceptual analysis method: Decay Time
Response- Curve-fit data using exponential model over different time windows- Multiple exponential decay times characterize target response- Selection of time for amplitude normalization not critical
9.98.48.2O;PP
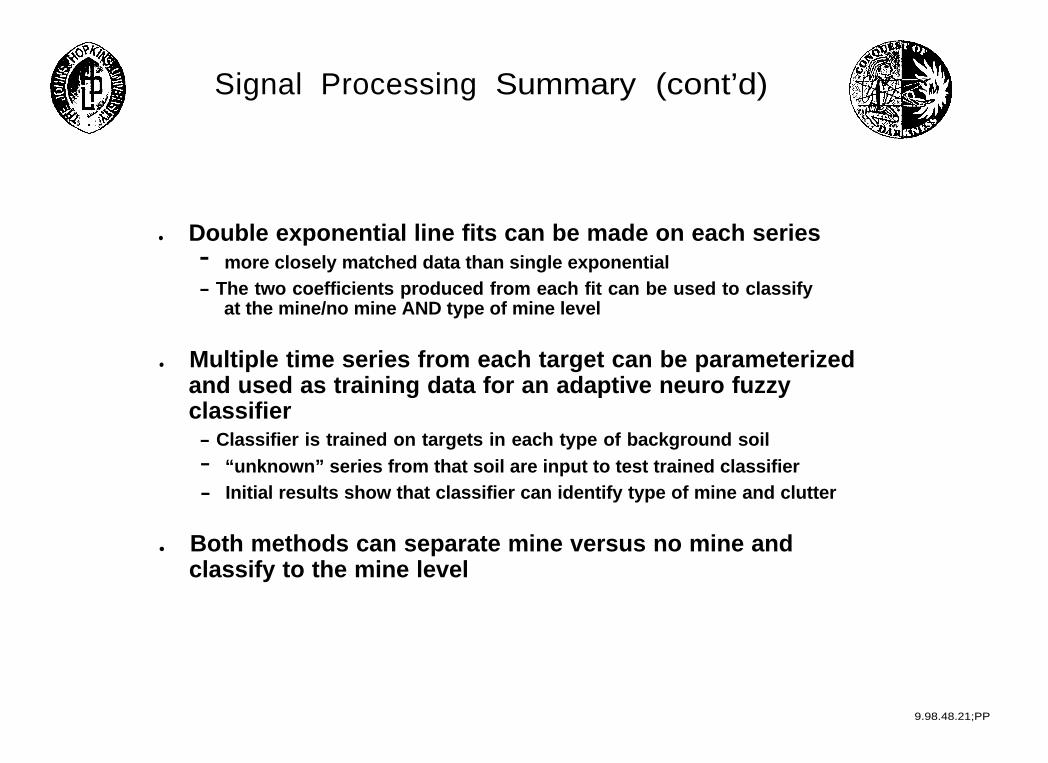
Signal Processing Summary (cont’d)
l Double exponential line fits can be made on each series- more closely matched data than single exponential- The two coefficients produced from each fit can be used to classify
at the mine/no mine AND type of mine level
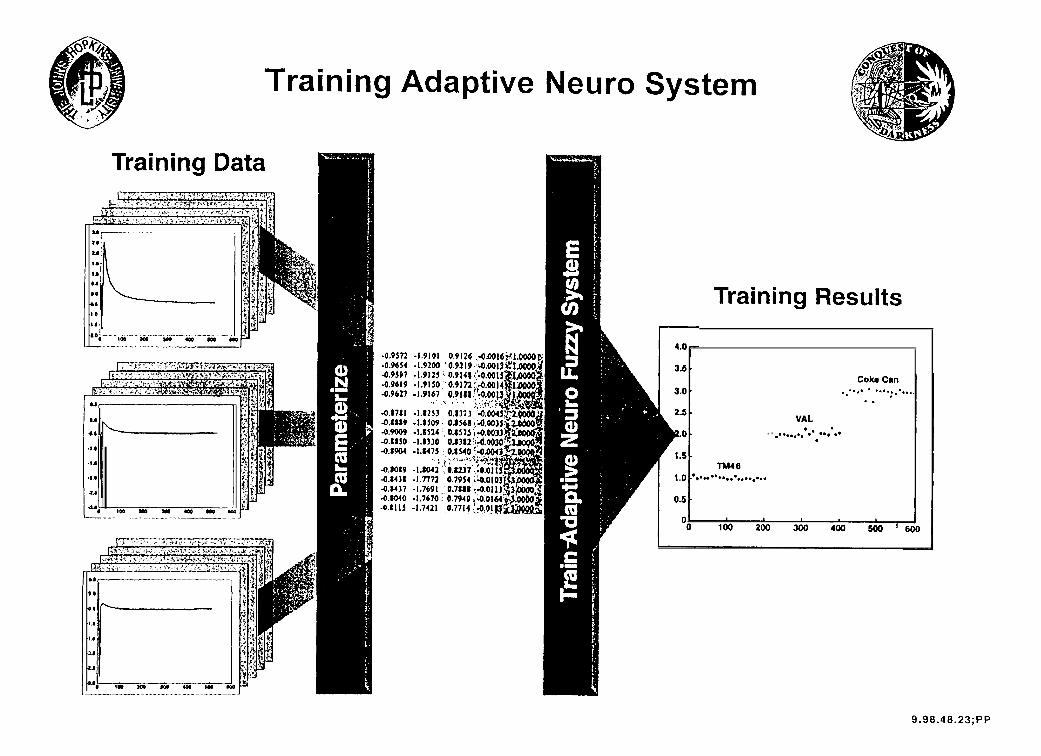
l Multiple time series from each target can be parameterizedand used as training data for an adaptive neuro fuzzyclassifier- Classifier is trained on targets in each type of background soil- “unknown” series from that soil are input to test trained classifier- Initial results show that classifier can identify type of mine and clutter
l Both methods can separate mine versus no mine andclassify to the mine level
9.98.48.21;PP
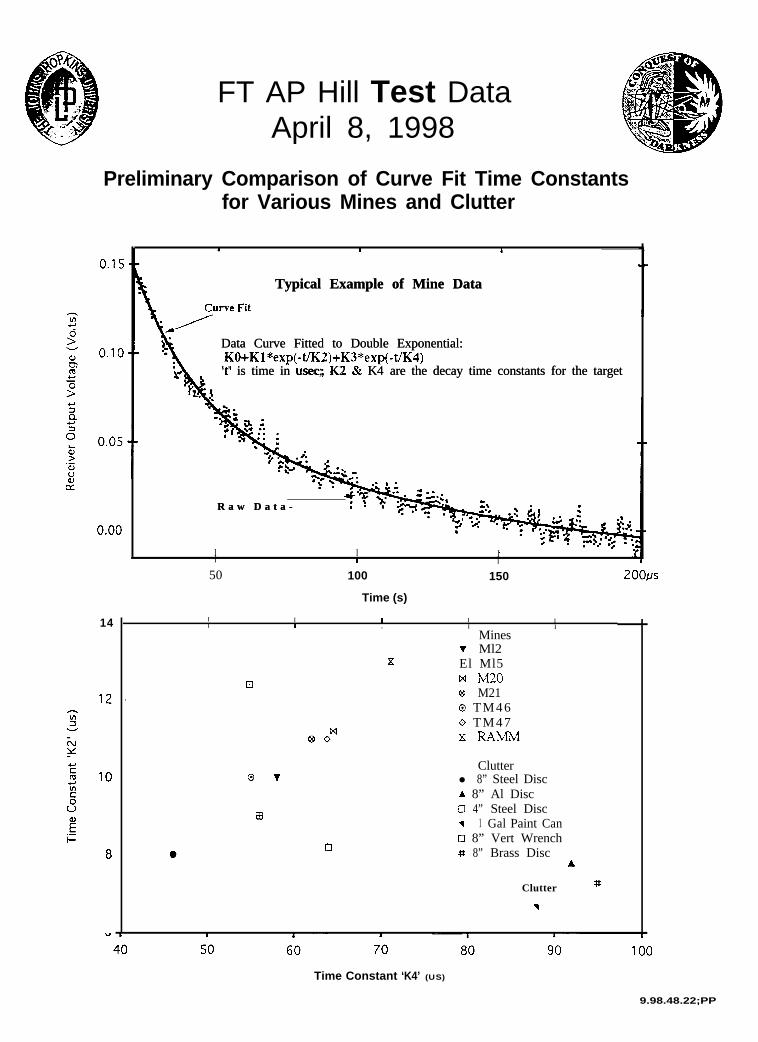
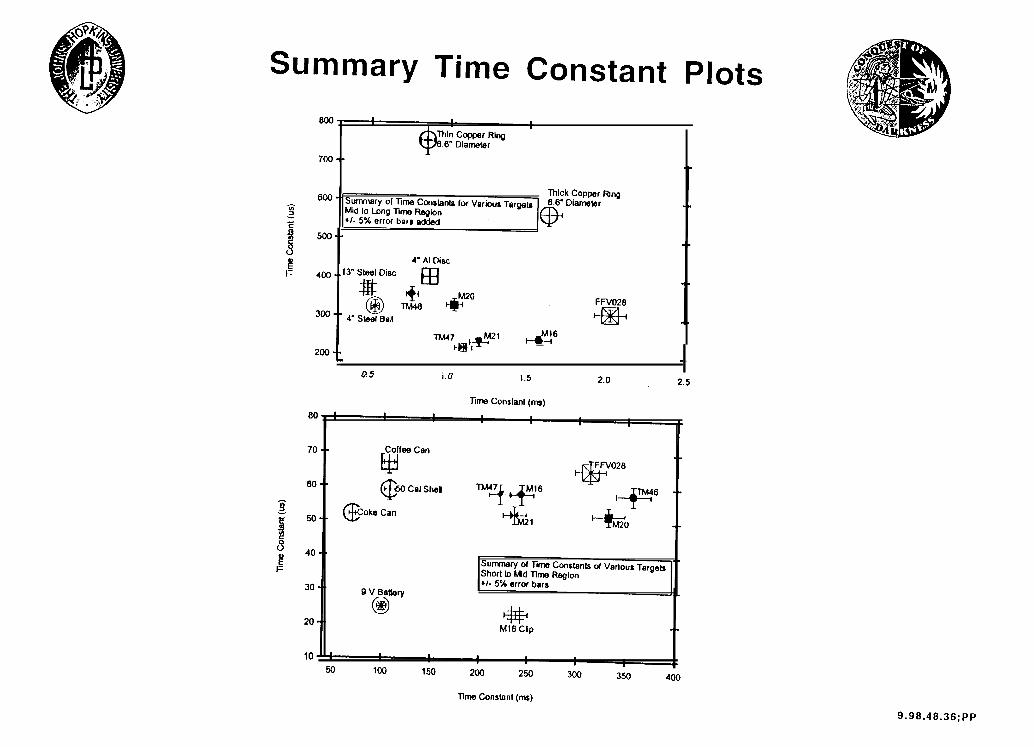
FT AP Hill Test DataApril 8, 1998
Preliminary Comparison of Curve Fit Time Constantsfor Various Mines and Clutter
14
II I
Typical Example of Mine DataTypical Example of Mine Data
Data Curve Fitted to Double Exponential:Data Curve Fitted to Double Exponential:KO+Kl*exp(-t/K2)+K3*exp(-t/K4)KO+Kl*exp(-t/K2)+K3*exp(-t/K4)
‘t’ is time in usec; K2 Sr K4 are the decay time constants for the target‘t’ is time in usec; K2 Sr K4 are the decay time constants for the target
R a w D a t a -R a w D a t a -
I I II I I
50 100
Time (s)
150
.
I I I I II I . I I
Minesv Ml2
x El Ml5
0 w Mm@ M21o TM46o TM47x FLofM
0 v
EB
0
Clutterl 8” Steel DiscA 8” Al Disco 4” Steel Disc7 1 Gal Paint Cano 8” Vert Wrench# 8” Brass Disc
A
Clutter #
Time Constant ‘K4’ (US)
9.98.48.22;PP
CD
c.-c.-
,=-...
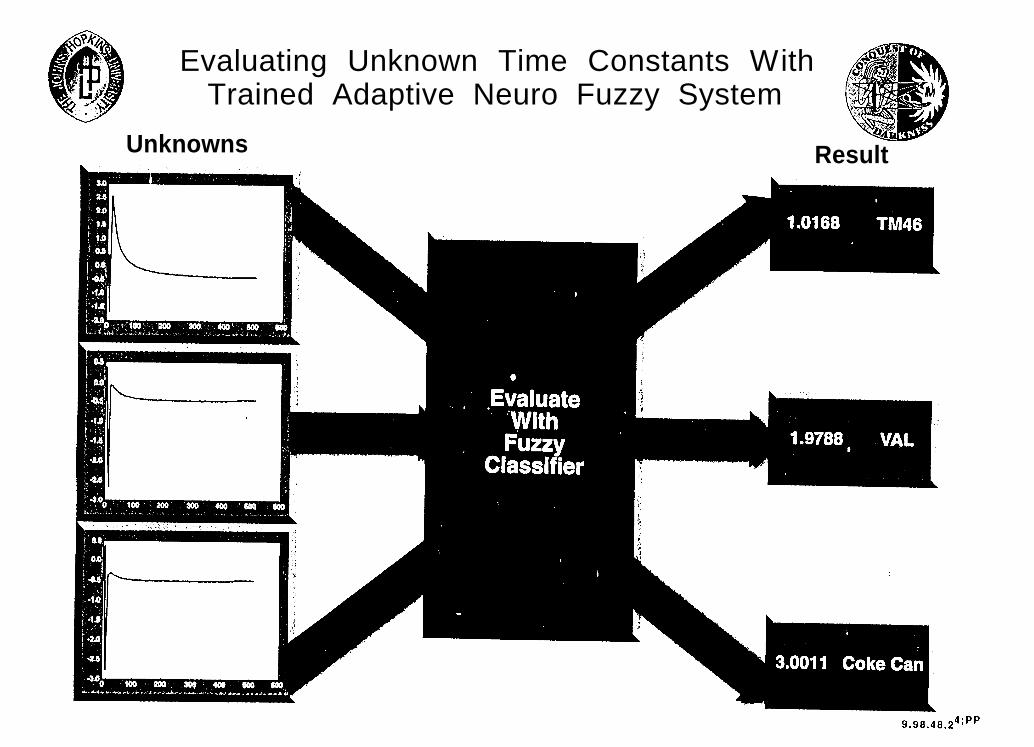
Evaluating Unknown Time Constants WithTrained Adaptive Neuro Fuzzy System
Unknowns Result
4;PP
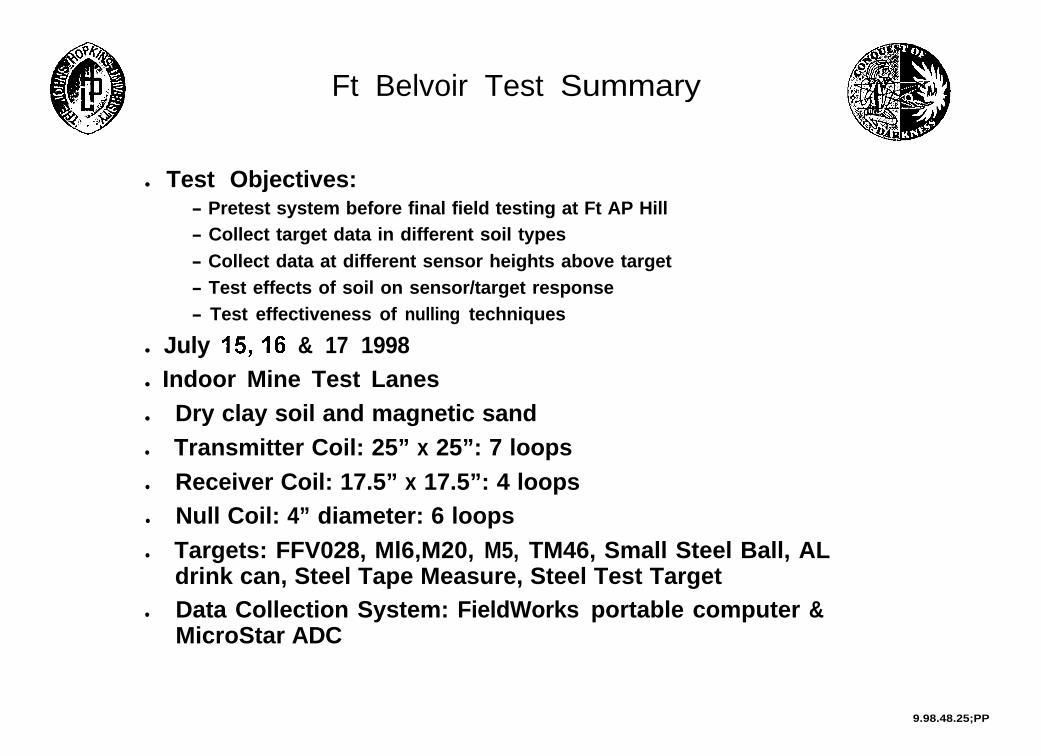
Ft Belvoir Test Summary
l Test Objectives:- Pretest system before final field testing at Ft AP Hill- Collect target data in different soil types- Collect data at different sensor heights above target- Test effects of soil on sensor/target response- Test effectiveness of nulling techniques
l July l&l6 & 17 1998l Indoor Mine Test Lanesl Dry clay soil and magnetic sandl Transmitter Coil: 25” x 25”: 7 loopsl Receiver Coil: 17.5” x 17.5”: 4 loopsl Null Coil: 4” diameter: 6 loopsl Targets: FFV028, Ml6,M20, M5, TM46, Small Steel Ball, AL
drink can, Steel Tape Measure, Steel Test Targetl Data Collection System: FieldWorks portable computer &
MicroStar ADC
9.98.48.25;PP
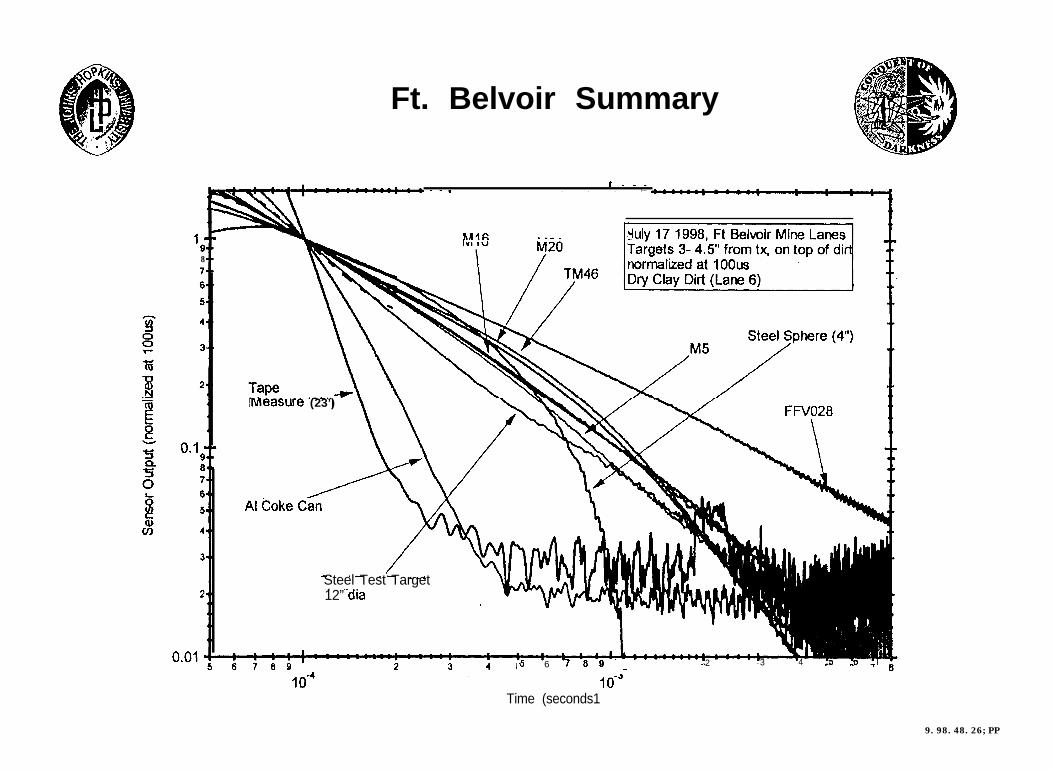
Ft. Belvoir Summary
I -_-
--I. . . I---
mc
‘9
LAIF: J_ _- - -
8
Measure (23’)
Steel Test Target. -._ ._12” dia
5 6 ?89-_ 2 3 4 P 0 I
Time (seconds1
9.98.48.26;PP
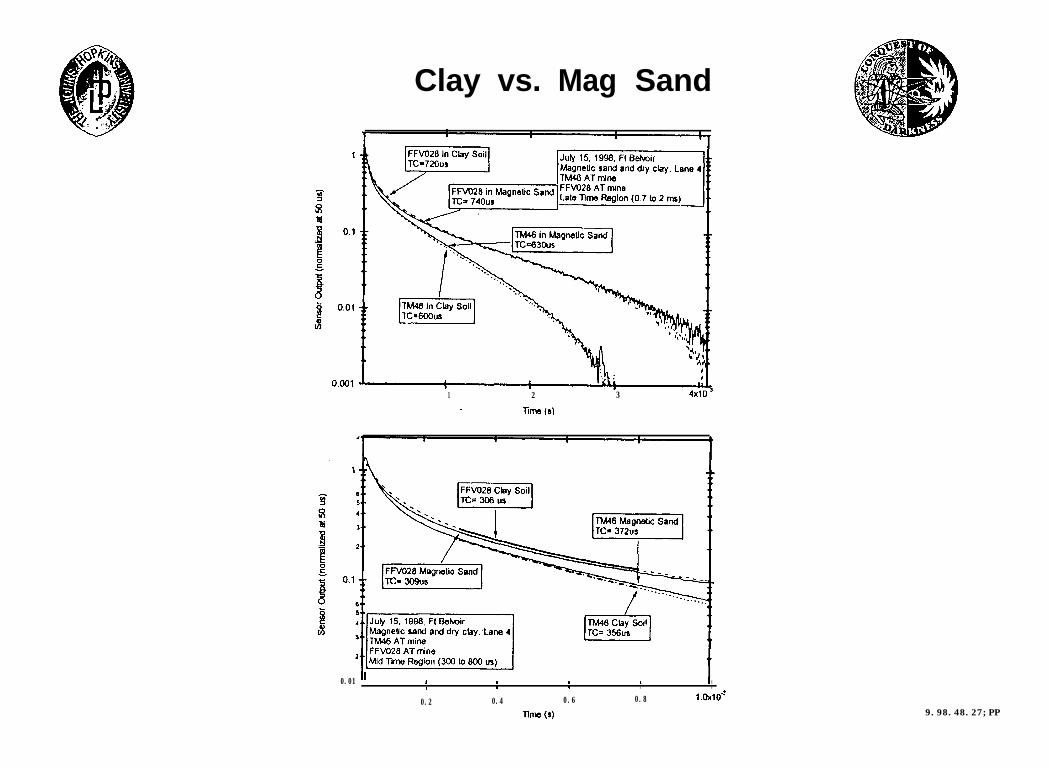
Clay vs. Mag Sand
1 2 3 4x1o-3
0.01 ' 1 1 II
IIII . .
0.2 0.4 0.6 0.8 1.0x10⁹
m’le 6) 9.98.48.27;PP
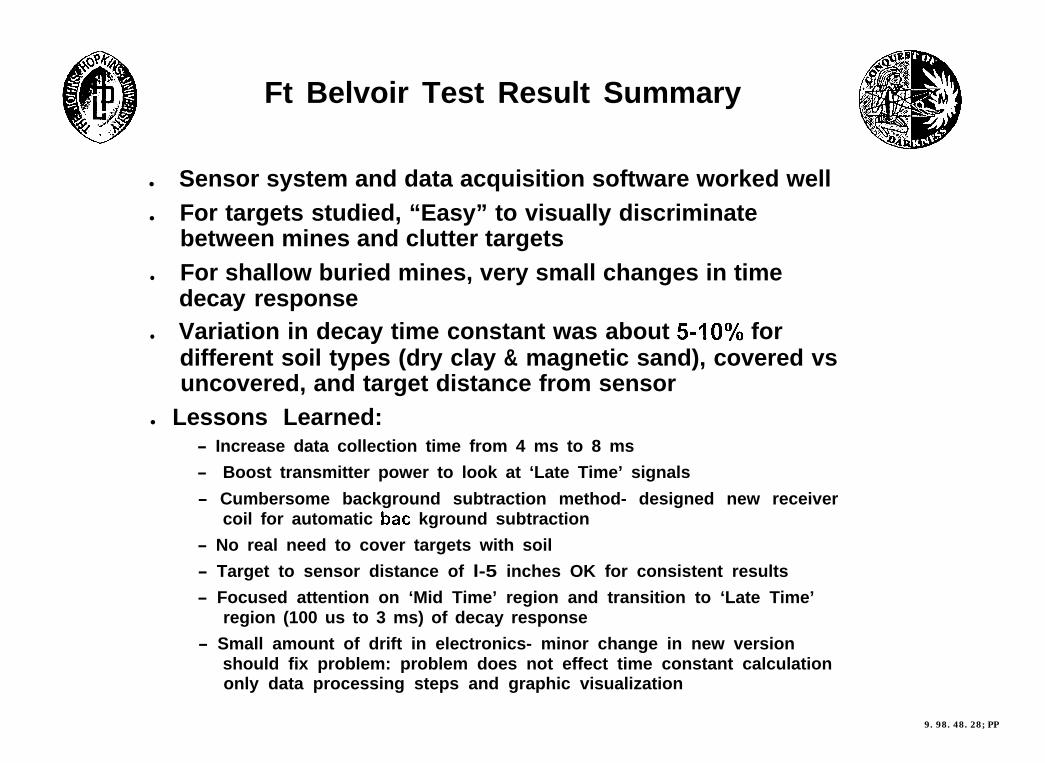
Ft Belvoir Test Result Summary
l Sensor system and data acquisition software worked welll For targets studied, “Easy” to visually discriminate
between mines and clutter targetsl For shallow buried mines, very small changes in time
decay responsel Variation in decay time constant was about 540% for
different soil types (dry clay & magnetic sand), covered vsuncovered, and target distance from sensor
l Lessons Learned:- Increase data collection time from 4 ms to 8 ms
- Boost transmitter power to look at ‘Late Time’ signals
- Cumbersome background subtraction method- designed new receivercoil for automatic bat kground subtraction
- No real need to cover targets with soil
- Target to sensor distance of l-5 inches OK for consistent results
- Focused attention on ‘Mid Time’ region and transition to ‘Late Time’region (100 us to 3 ms) of decay response
- Small amount of drift in electronics- minor change in new versionshould fix problem: problem does not effect time constant calculationonly data processing steps and graphic visualization
9.98.48.28;PP
5.5
5
4.5
4
3.5
1b
2.5
2
1.5
i-
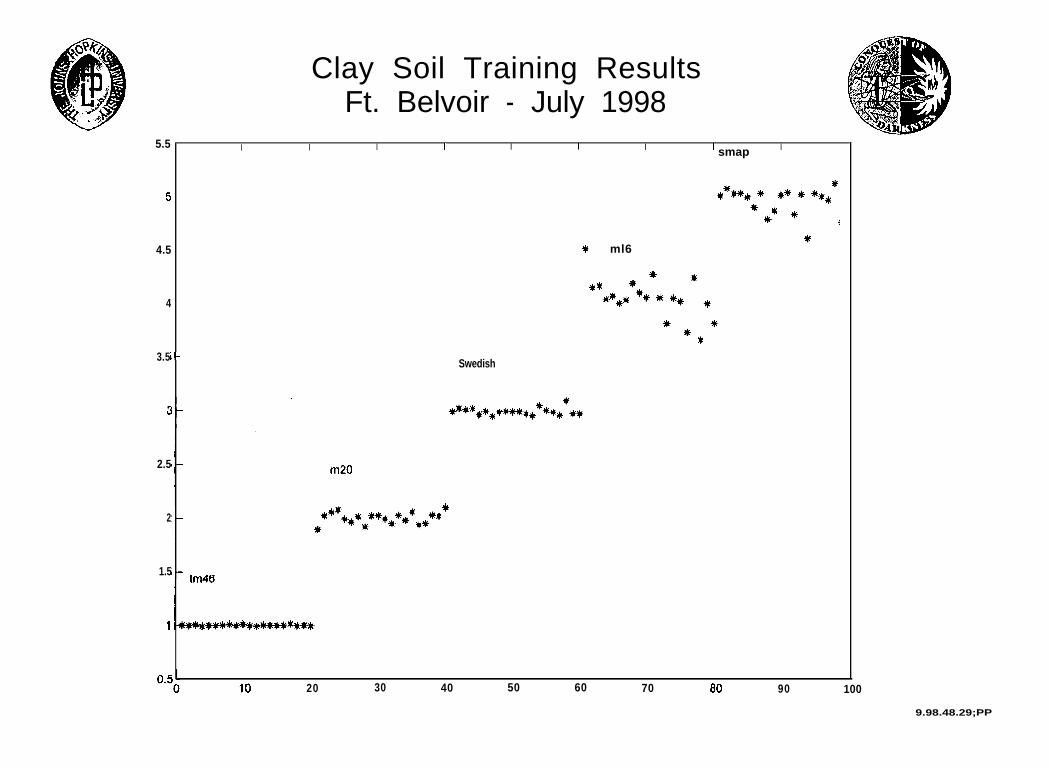
Clay Soil Training ResultsFt. Belvoir - July 1998
I I I 1 I I I I smap I
Y ml6
Swedish
IO 20 30 40 50 60 70 80 90 100
9.98.48.29;PP
4.5
4
3.5
3
2.5
2
1.5
1
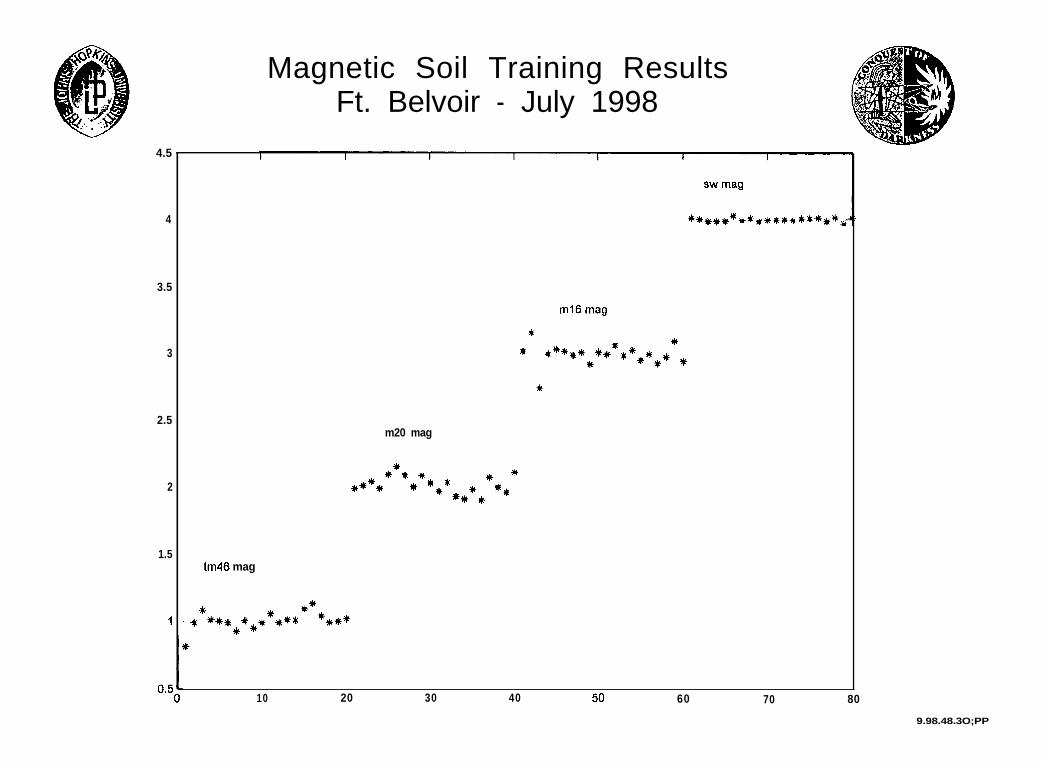
Magnetic Soil Training ResultsFt. Belvoir - July 1998
m20 mag
****3tf *
* Jr+* * ***+* **
tm46 mag
10 20 30 40 50 60 70 80
9.98.48.3O;PP
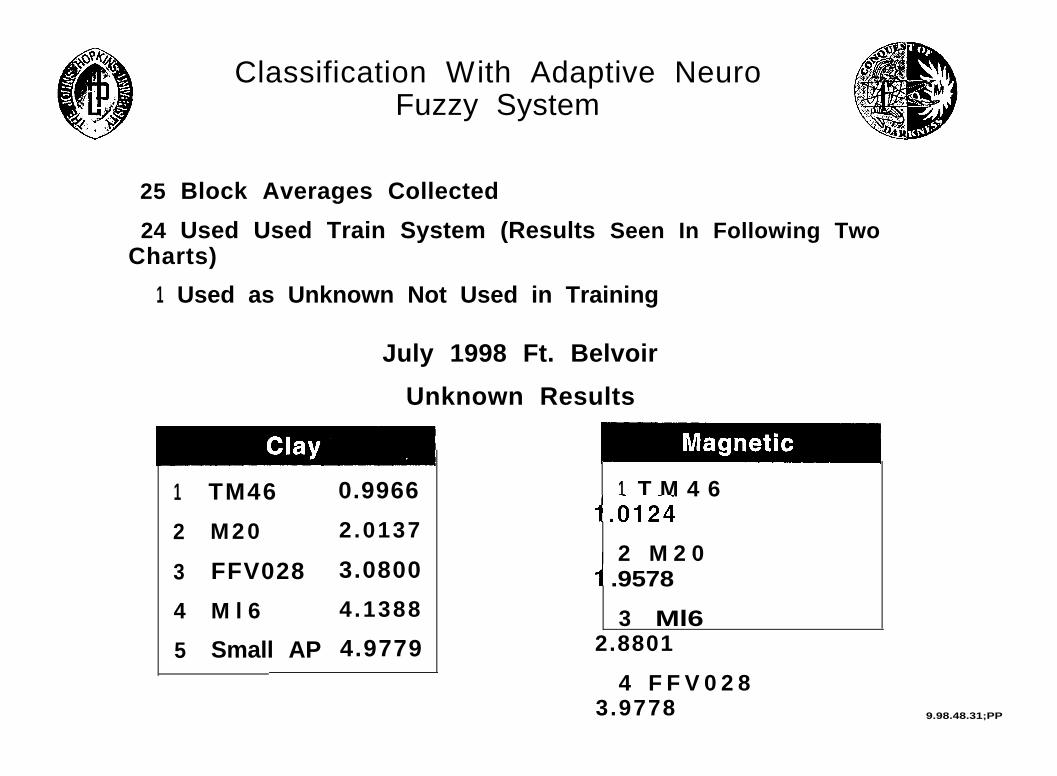
Classification With Adaptive NeuroFuzzy System
25 Block Averages Collected
24 Used Used Train System (Results Seen In Following TwoCharts)
1 Used as Unknown Not Used in Training
July 1998 Ft. Belvoir
Unknown Results
1 TM46 0.9966
2 M20 2.0137
3 FFV028 3.0800
4 M l 6 4.1388
5 Small AP 4.9779
1 T M 4 64.0124
2 M 2 0.9578
3 Ml62.8801
4 F F V 0 2 83.9778 9.98.48.31;PP
0
l
0
0
0
Ft AP Hill Test Summary
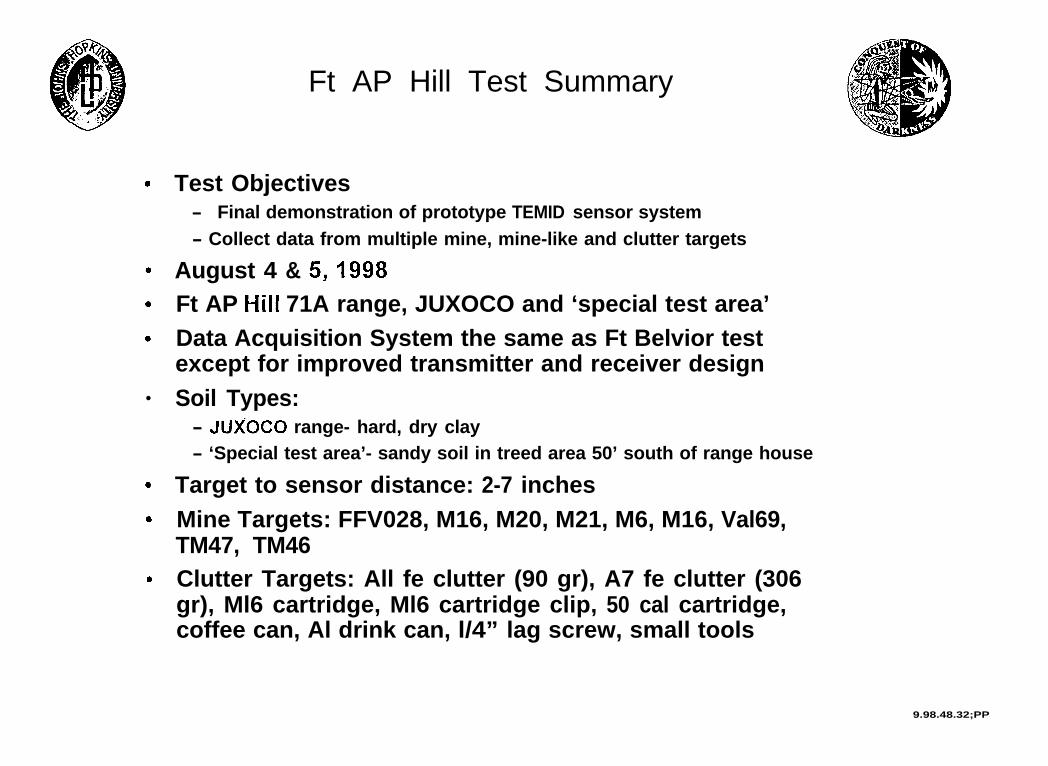
Test Objectives- Final demonstration of prototype TEMID sensor system- Collect data from multiple mine, mine-like and clutter targets
August 4 & !&I998Ft AP tiill 71A range, JUXOCO and ‘special test area’Data Acquisition System the same as Ft Belvior testexcept for improved transmitter and receiver designSoil Types:- JUX’OCO range- hard, dry clay- ‘Special test area’- sandy soil in treed area 50’ south of range house
Target to sensor distance: 2-7 inchesMine Targets: FFV028, M16, M20, M21, M6, M16, Val69,TM47, TM46Clutter Targets: All fe clutter (90 gr), A7 fe clutter (306gr), Ml6 cartridge, Ml6 cartridge clip, 50 cal cartridge,coffee can, Al drink can, l/4” lag screw, small tools
9.98.48.32;PP
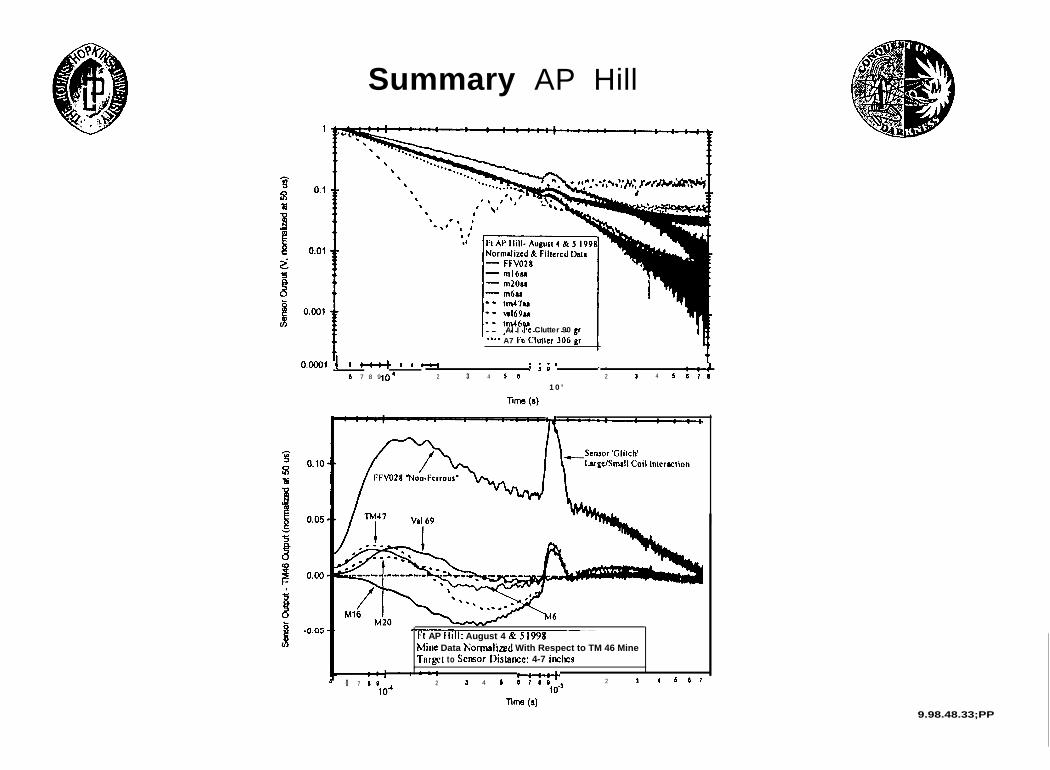
Summary AP Hill
Al I Fe Clutter 90 gr“** A7 t% Clullcr 306 ir
O.oool ! : :-4-t+ : : *:: 1.. . .5Q 7 8 9 2 3 4 s Q
739’ +:!21O4 3 4 5 Q 76
1 0 ’
Ft AP Hill: August 4 & 5 I’)98Mine Data Norrnalizd With Respect to TM 46 MineTwgct to Sensor Distance: 4-7 inches,
- : z::0 7
+::so 2 J 4 s Old+ 2 J
lOA4 s
10”07
Time (s)9.98.48.33;PP
(sn 0~ )e pazgeuuou ‘n) vdq.no
JOS
WS
lag screw
1
0.1
0.01
0.001
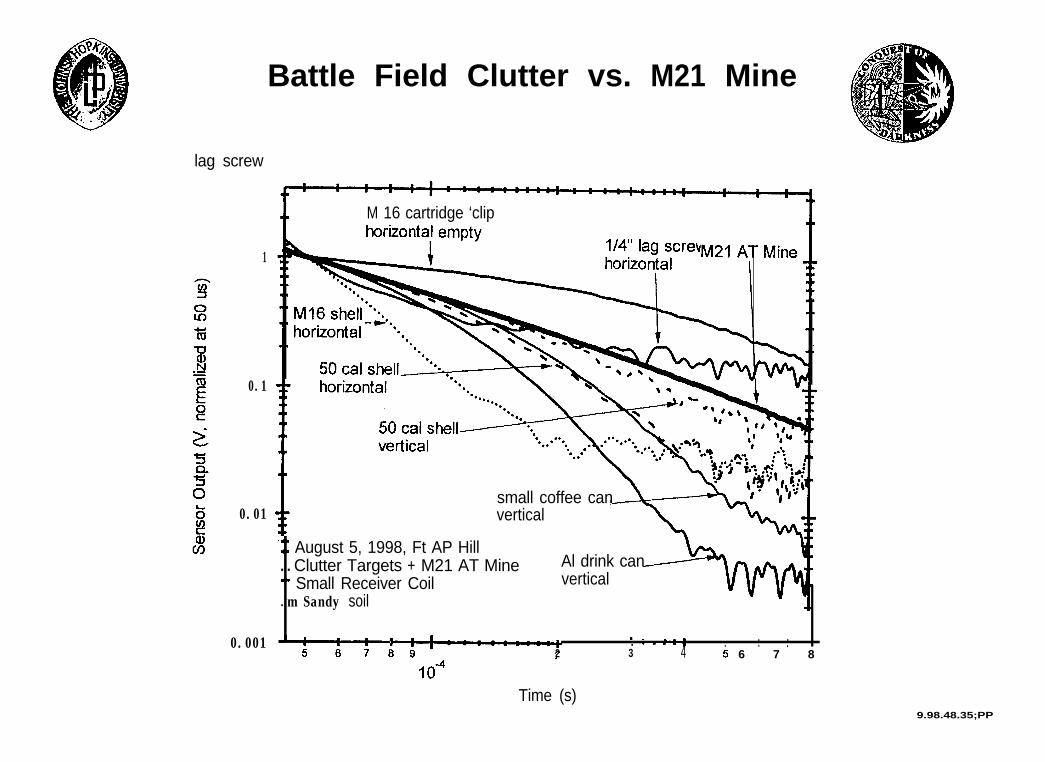
Battle Field Clutter vs. M21 Mine
M 16 cartridge ‘clip
small coffee canvertical
f August 5, 1998, Ft AP Hilln n Clutter Targets + M21 AT Mine,* Small Receiver Coill m Sandy soil
Al drink canvertical
.- --. . .. ----. . .2
.3 4 5 6 7 8
Time (s)9.98.48.35;PP
.8
I,
4
C.UC

Ft AP Hill Test Data Summary
l For AT and AP mines in test study, ‘easy’ to discriminatebetween mines and clutter: Mine vs No Mine
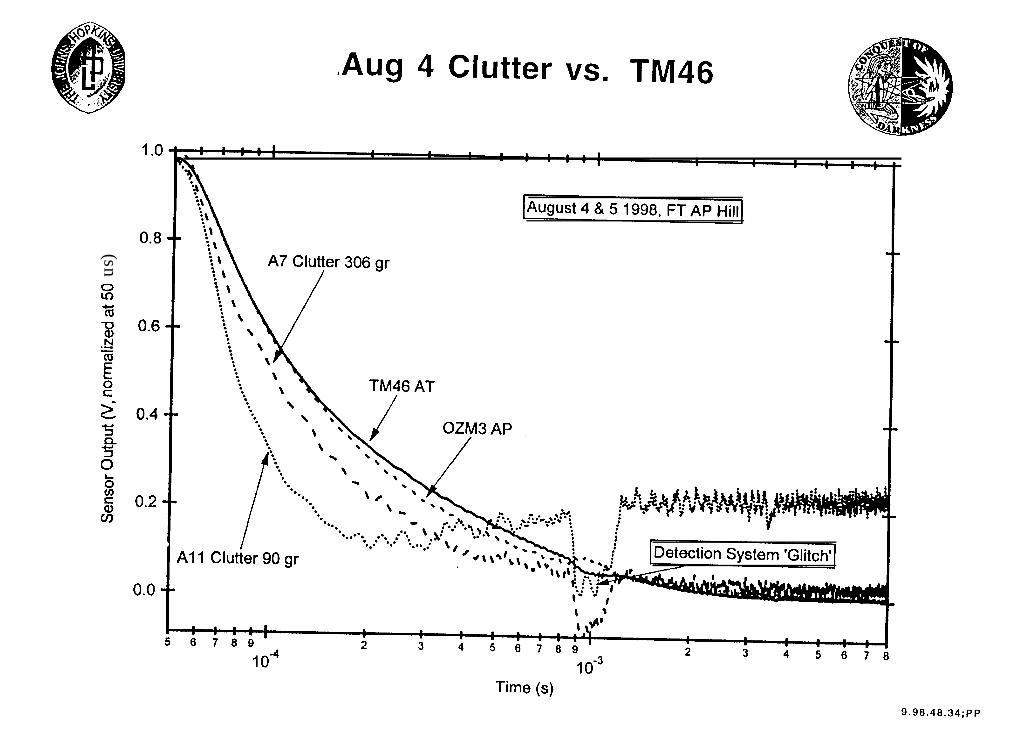
l Under these ‘ideal’ test conditions, we can discriminatebetween different mines, even mines that appear verysimilar, e.g., TM46 and TM47 or M20 and M21
l Classify mine types and clutter using time constant plots- Selected three time windows: 70 - 200 us; 300 - 700 us; and
800 us - 3 ms- Exponential curve fit data in selected time windows- Normalization of data not required for curve fitting- Normalization of data good for graphic comparison of data- Mine and clutter time constants substantially different
9.98.48.37;PP
Project Summary
l Investigated Medium/High Metal Content Mines and Mine-like Targets
l Developed instrumentation to measure target time-domaindecay responses over time range of 20 us to 16 ms
l Developed Two Classification Methods for DiscriminatingMines from Non-Mines
l Major Target Signal Characteristics- ‘Good’ starting time around 50-100 us- ‘Good’ stopping time around IO-20 ms
l Exponential curve fitting method works well for Mine vsNo Mine Discrimination- Related to mine physics- Three or more time windows for curve fitting- No need to normalize data
l Adaptive neuro-fuzzy classifier results very encouraging- Classify to the type of mine level in clay and magnetic soil
9.98.48.38;PP
Project Summary (cont’d)
l All program responsibilities met- technical meetings
I- status reviews (multiple)- Final report delayed due to low metal content detection task that was
added to contract
l Based on analyses performed on this contract, timedomain technology appears very promising for insertioninto vehicle and hand held systems
9.98.48.39;PP