Embed Size (px)
Citation preview
2 1 S e p t e m b e r 2 0 1 6
HANDELSBANKEN TRANSPORT
SEMINAR
2
SAFE HARBOR STATEMENT
Matters discussed in this release may constitute forward-looking statements. Forward-looking statements reflect our current views with respect to future events and financial performance and may include statements concerning plans, objectives, goals, strategies, future events or performance, and underlying assumptions and statements other than statements of historical facts. The words “believe,” “anticipate,” “intend,” “estimate,” “forecast,” “project,” “plan,” “potential,” “may,” “should,” “expect,” “pending” and similar expressions generally identify forward-looking statements.
The forward-looking statements in this release are based upon various assumptions, many of which are based, in turn, upon further assumptions, including without limitation, management’s examination of historical operating trends, data contained in our records and other data available from third parties. Although the Company believes that these assumptions were reasonable when made, because these assumptions are inherently subject to significant uncertainties and contingencies that are difficult or impossible to predict and are beyond our control, the Company cannot guarantee that it will achieve or accomplish these expectations, beliefs or projections.
Important factors that, in our view, could cause actual results to differ materially from those discussed in the forward- looking statements include the strength of the world economy and currencies, changes in charter hire rates and vessel values, changes in demand for “ton miles” of oil carried by oil tankers, the effect of changes in OPEC’s petroleum production levels and worldwide oil consumption and storage, changes in demand that may affect attitudes of time charterers to scheduled and unscheduled dry-docking, changes in TORM’s operating expenses, including bunker prices, dry-docking and insurance costs, changes in the regulation of shipping operations, including requirements for double hull tankers or actions taken by regulatory authorities, potential liability from pending or future litigation, domestic and international political conditions, potential disruption of shipping routes due to accidents, political events or acts by terrorists.
In light of these risks and uncertainties, you should not place undue reliance on forward-looking statements contained in this release because they are statements about events that are not certain to occur as described or at all. These forward-looking statements are not guarantees of our future performance, and actual results and future developments may vary materially from those projected in the forward-looking statements.
Except to the extent required by applicable law or regulation, the Company undertakes no obligation to release publicly any revisions to these forward-looking statements to reflect events or circumstances after the date of this release or to reflect the occurrence of unanticipated events.
3
Orion purchase price considerations
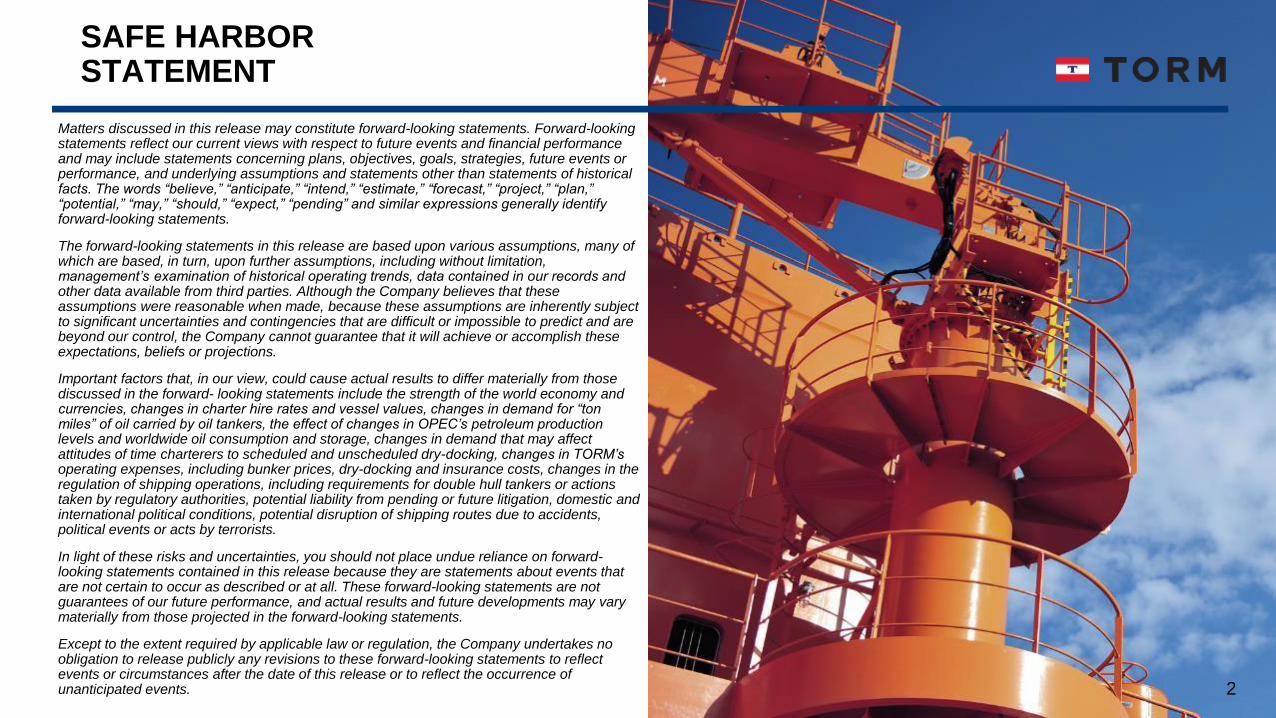
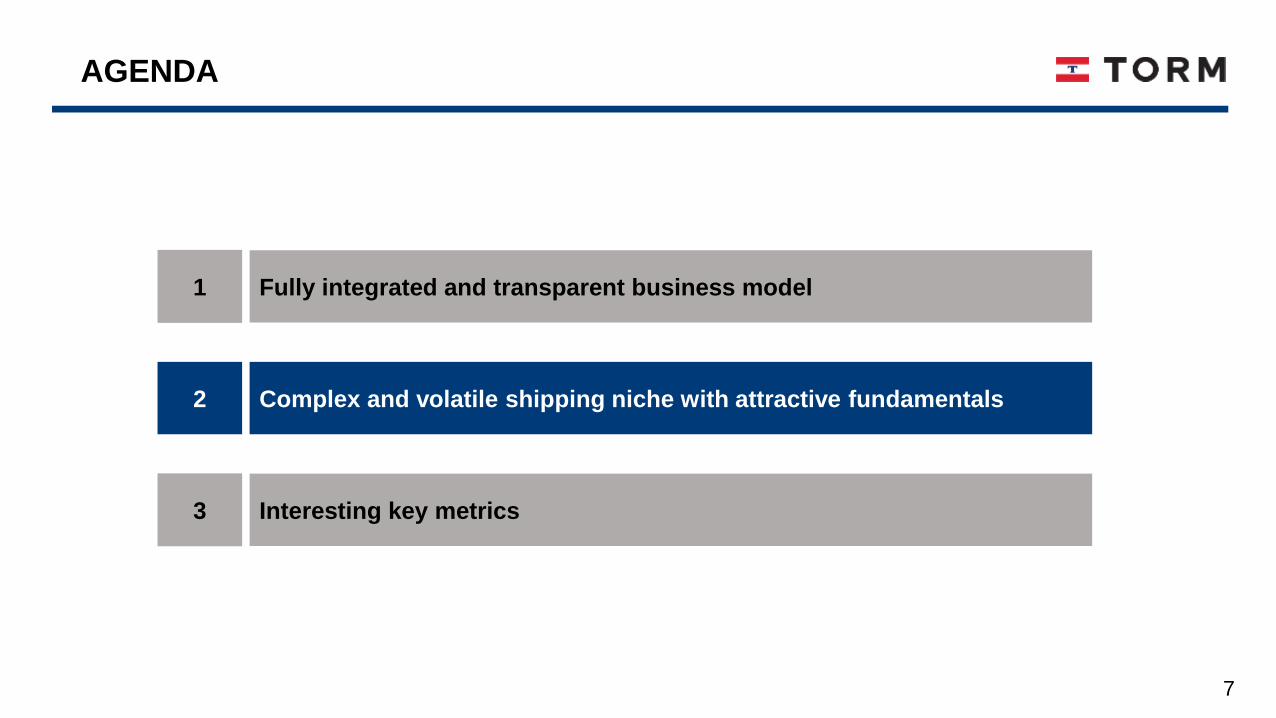
AGENDA
Fully integrated and transparent business model
Complex and volatile shipping niche with attractive fundamentals
Interesting key metrics
1
2
3
4
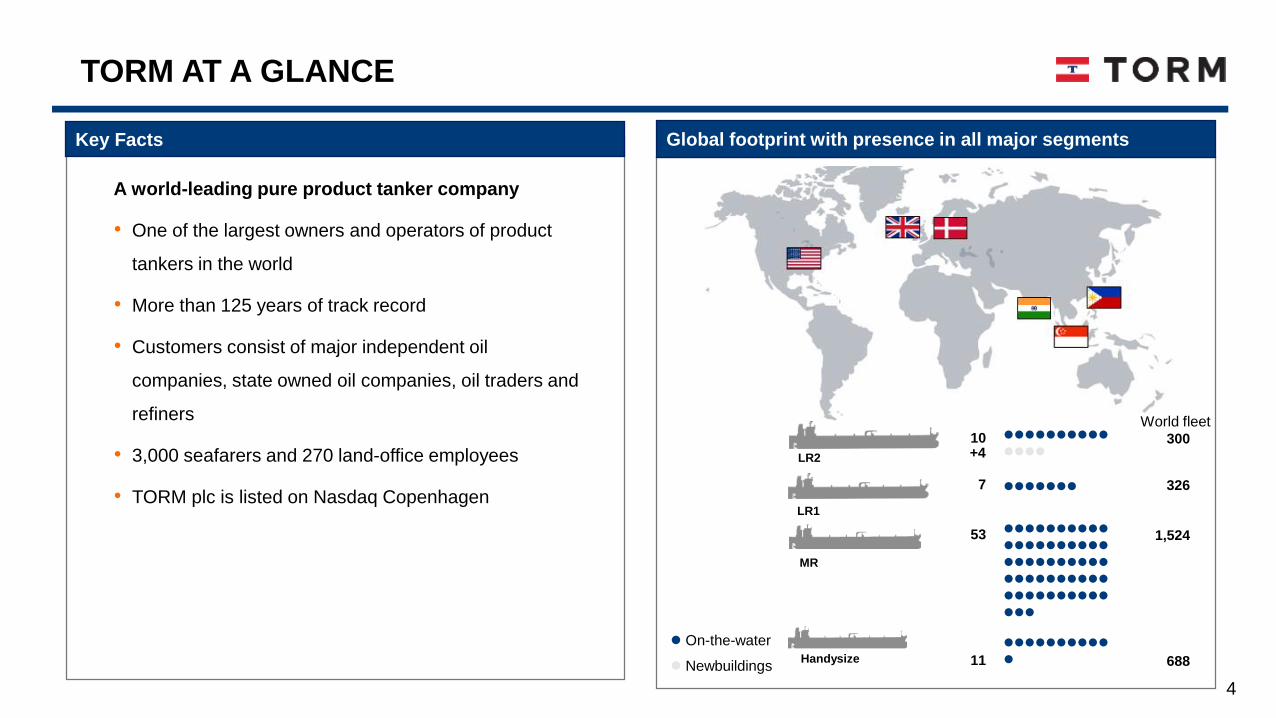
TORM AT A GLANCE
A world-leading pure product tanker company
• One of the largest owners and operators of product
tankers in the world
• More than 125 years of track record
• Customers consist of major independent oil
companies, state owned oil companies, oil traders and
refiners
• 3,000 seafarers and 270 land-office employees
• TORM plc is listed on Nasdaq Copenhagen
Global footprint with presence in all major segmentsKey Facts
On-the-water
Newbuildings
10
LR2
LR1
MR
Handysize
7
53
11
+4300
326
1,524
688
World fleet
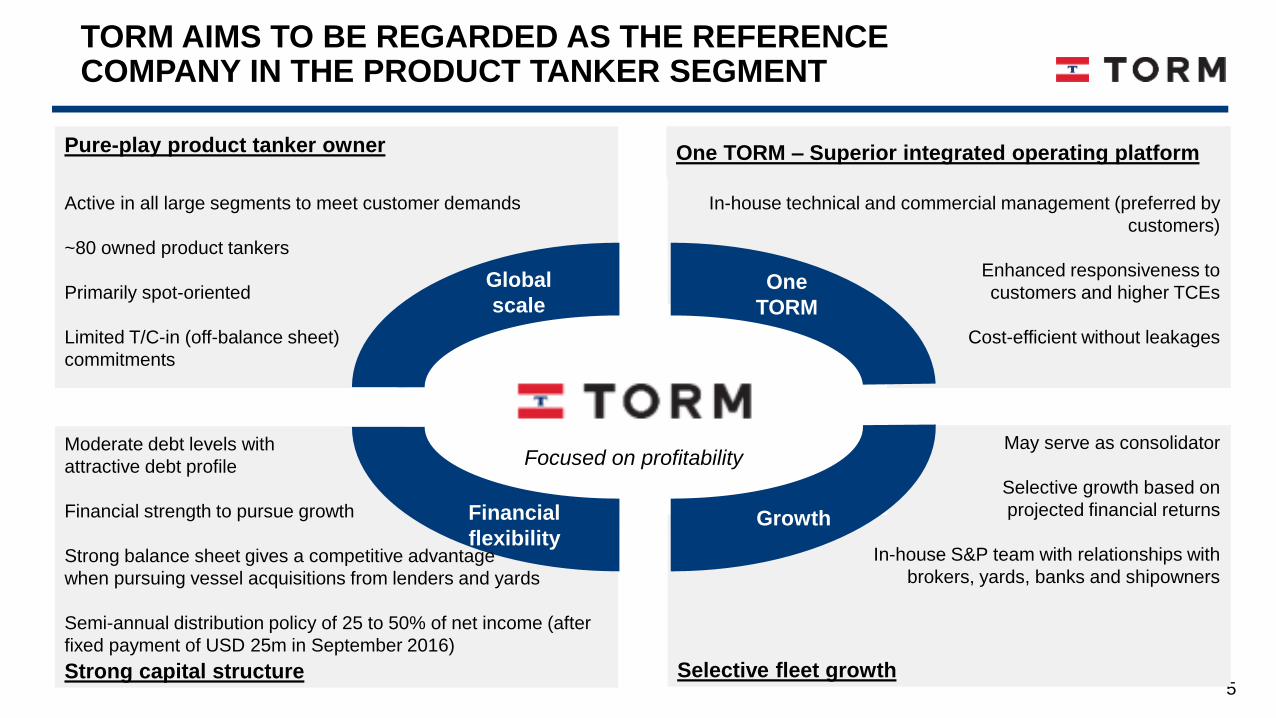
5Selective fleet growthStrong capital structure
One TORM – Superior integrated operating platformPure-play product tanker owner
TORM AIMS TO BE REGARDED AS THE REFERENCE COMPANY IN THE PRODUCT TANKER SEGMENT
One TORM – Superior integrated operating platform
Global
scaleOne
TORM
Financial
flexibilityGrowth
Active in all large segments to meet customer demands
~80 owned product tankers
Primarily spot-oriented
Limited T/C-in (off-balance sheet)
commitments
In-house technical and commercial management (preferred by
customers)
Enhanced responsiveness to
customers and higher TCEs
Cost-efficient without leakages
May serve as consolidator
Selective growth based on
projected financial returns
In-house S&P team with relationships with
brokers, yards, banks and shipowners
Focused on profitabilityModerate debt levels with
attractive debt profile
Financial strength to pursue growth
Strong balance sheet gives a competitive advantage
when pursuing vessel acquisitions from lenders and yards
Semi-annual distribution policy of 25 to 50% of net income (after
fixed payment of USD 25m in September 2016)
6
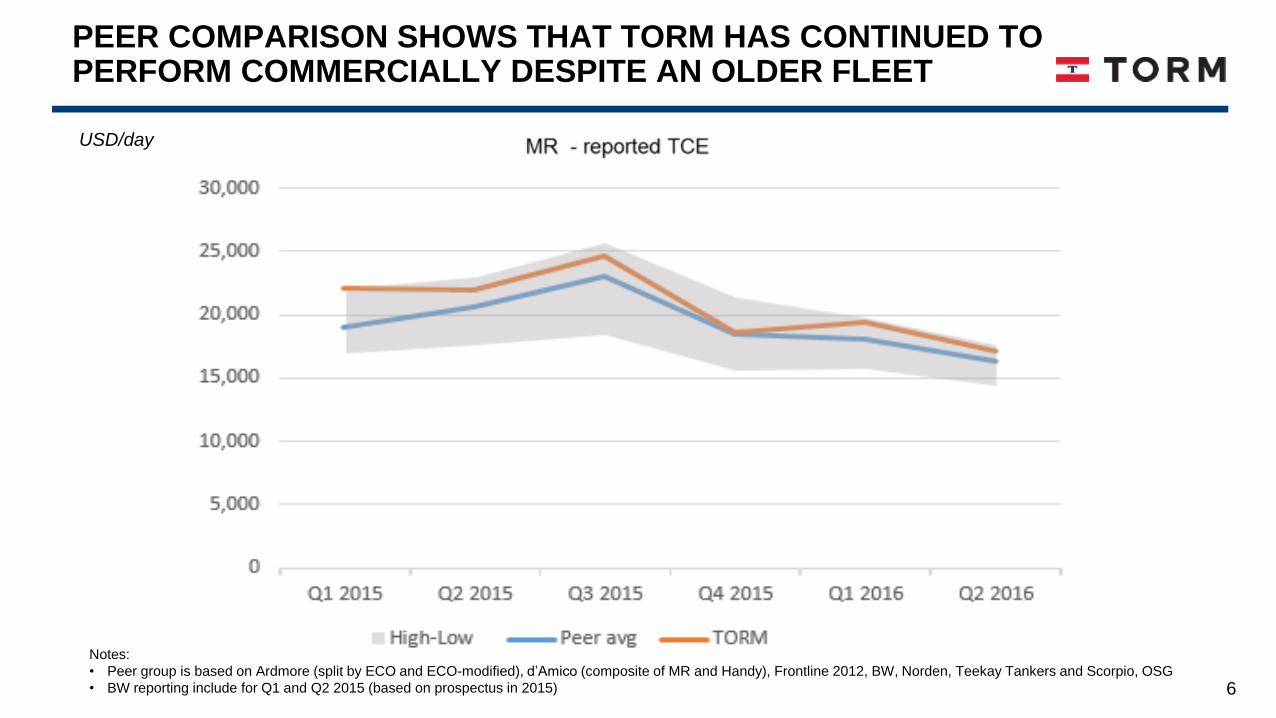
Notes:
• Peer group is based on Ardmore (split by ECO and ECO-modified), d’Amico (composite of MR and Handy), Frontline 2012, BW, Norden, Teekay Tankers and Scorpio, OSG
• BW reporting include for Q1 and Q2 2015 (based on prospectus in 2015)
USD/day
PEER COMPARISON SHOWS THAT TORM HAS CONTINUED TO PERFORM COMMERCIALLY DESPITE AN OLDER FLEET
7
Orion purchase price considerations
AGENDA
Fully integrated and transparent business model
Complex and volatile shipping niche with attractive fundamentals
Interesting key metrics
1
2
3
8
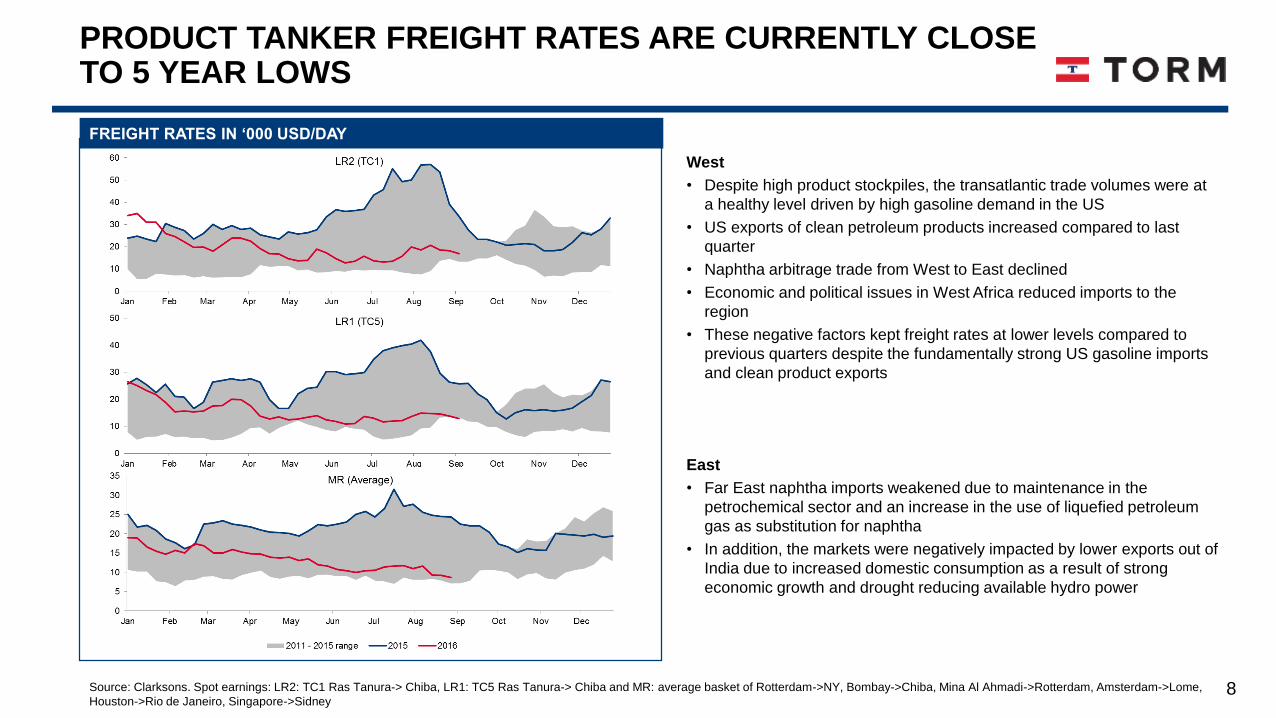
PRODUCT TANKER FREIGHT RATES ARE CURRENTLY CLOSE TO 5 YEAR LOWS
Source: Clarksons. Spot earnings: LR2: TC1 Ras Tanura-> Chiba, LR1: TC5 Ras Tanura-> Chiba and MR: average basket of Rotterdam->NY, Bombay->Chiba, Mina Al Ahmadi->Rotterdam, Amsterdam->Lome,
Houston->Rio de Janeiro, Singapore->Sidney
FREIGHT RATES IN ‘000 USD/DAY
West
• Despite high product stockpiles, the transatlantic trade volumes were at
a healthy level driven by high gasoline demand in the US
• US exports of clean petroleum products increased compared to last
quarter
• Naphtha arbitrage trade from West to East declined
• Economic and political issues in West Africa reduced imports to the
region
• These negative factors kept freight rates at lower levels compared to
previous quarters despite the fundamentally strong US gasoline imports
and clean product exports
East
• Far East naphtha imports weakened due to maintenance in the
petrochemical sector and an increase in the use of liquefied petroleum
gas as substitution for naphtha
• In addition, the markets were negatively impacted by lower exports out of
India due to increased domestic consumption as a result of strong
economic growth and drought reducing available hydro power
9
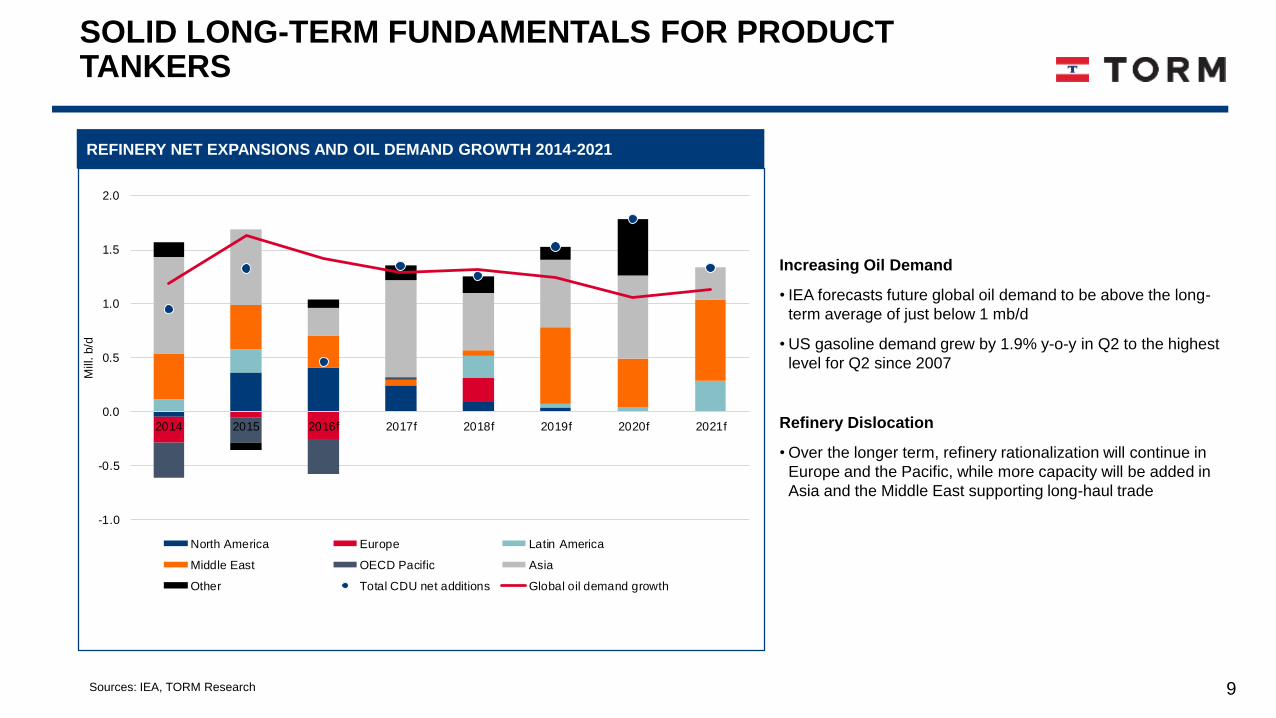
SOLID LONG-TERM FUNDAMENTALS FOR PRODUCT TANKERS
Increasing Oil Demand
• IEA forecasts future global oil demand to be above the long-
term average of just below 1 mb/d
• US gasoline demand grew by 1.9% y-o-y in Q2 to the highest
level for Q2 since 2007
Refinery Dislocation
• Over the longer term, refinery rationalization will continue in
Europe and the Pacific, while more capacity will be added in
Asia and the Middle East supporting long-haul trade
REFINERY NET EXPANSIONS AND OIL DEMAND GROWTH 2014-2021
-1.0
-0.5
0.0
0.5
1.0
1.5
2.0
2014 2015 2016f 2017f 2018f 2019f 2020f 2021f
Mill
. b/d
North America Europe Latin America
Middle East OECD Pacific Asia
Other Total CDU net additions Global oil demand growth
Sources: IEA, TORM Research

10
SUPPLY OUTLOOK FOR THE PRODUCT TANKER FLEET VARIES BY SEGMENT
Notes: * The number of vessels at the beginning of 2016 was: LR2 284, LR1 325, MR 1,488, Handy 680 (includes chemical vessels). Net fleet growth: gross order book adjusted for expected scrapping, delivery
slippage and TORM assumptions on additional ordering. Currently confirmed orders account on average for 48% of forecast deliveries in 2018. Source: TORM Research
NET FLEET GROWTH Y-O-Y (NO. OF VESSELS)*
MR ORDER BOOK AS PERCENTAGE OF THE FLEET (DWT)
• Ordering of product tanker newbuildings has
remained very limited, so far, this year
• Consequently, the product tanker order book to
fleet ratio has fallen to 15%, the lowest since mid-
2013
• For the MR segment, the order book to fleet ratio is
just below 12%, the lowest level for at least 20
years
• Product tanker deliveries totaled 2.8m dwt during
Q2 which combined with limited scrapping activity
resulted in a 1.6% net fleet growth in Q2
• In the first half of the year, the total product tanker
fleet grew by 3.6%, and for the total year, the fleet
is expected to grow by slightly more than 6%
• The LR2 and LR1 segments are set to lead the
growth, while the MR growth is expected to slow
down from the 2015 level
2005-2015 average fleet growth for
LR2, LR1, MR and Handysize%
m dwt
11
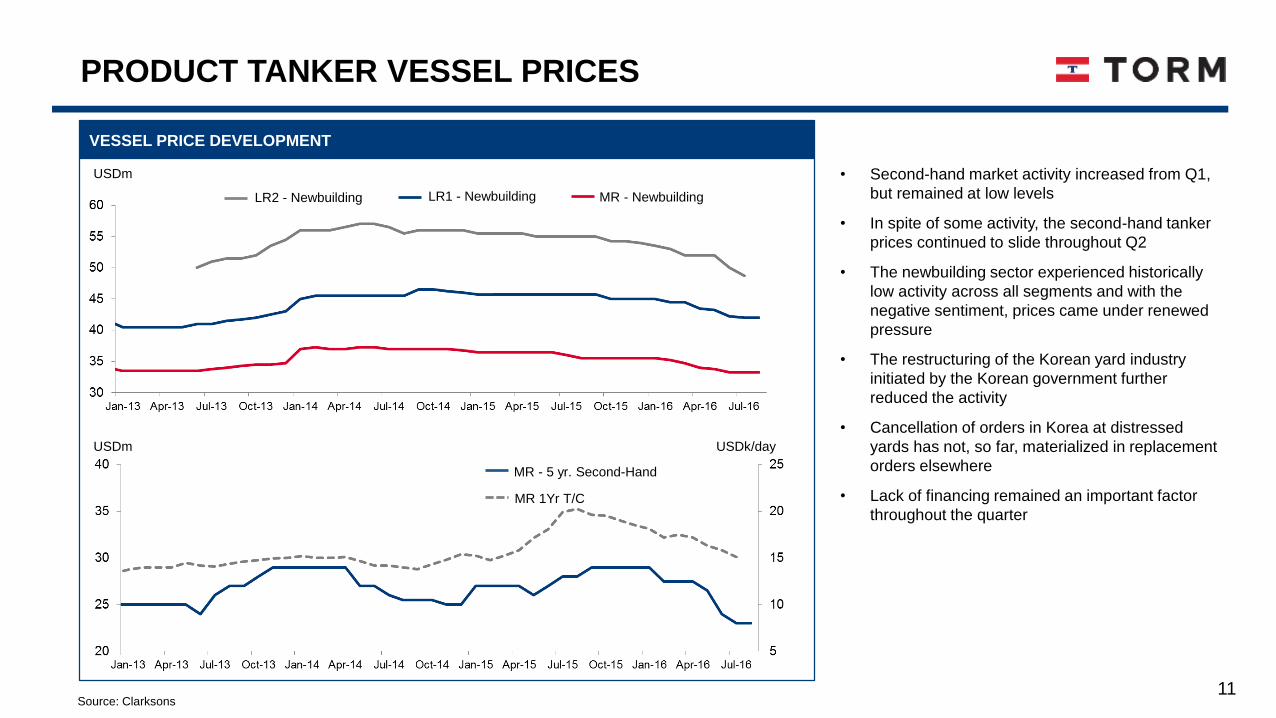
• Second-hand market activity increased from Q1,
but remained at low levels
• In spite of some activity, the second-hand tanker
prices continued to slide throughout Q2
• The newbuilding sector experienced historically
low activity across all segments and with the
negative sentiment, prices came under renewed
pressure
• The restructuring of the Korean yard industry
initiated by the Korean government further
reduced the activity
• Cancellation of orders in Korea at distressed
yards has not, so far, materialized in replacement
orders elsewhere
• Lack of financing remained an important factor
throughout the quarter
Source: Clarksons
USDm
LR1 - Newbuilding MR - Newbuilding
USDm
MR - 5 yr. Second-Hand
USDk/day
MR 1Yr T/C
VESSEL PRICE DEVELOPMENT
LR2 - Newbuilding
PRODUCT TANKER VESSEL PRICES
12
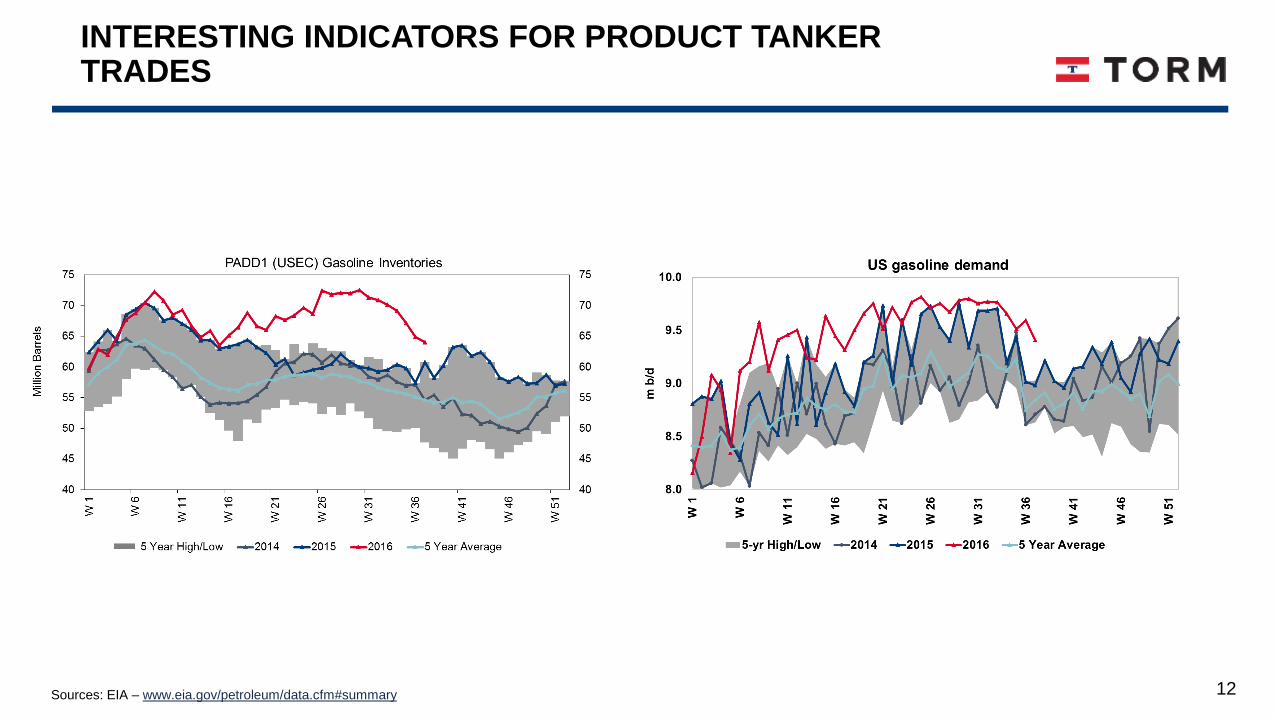
INTERESTING INDICATORS FOR PRODUCT TANKER TRADES
Sources: EIA – www.eia.gov/petroleum/data.cfm#summary
13
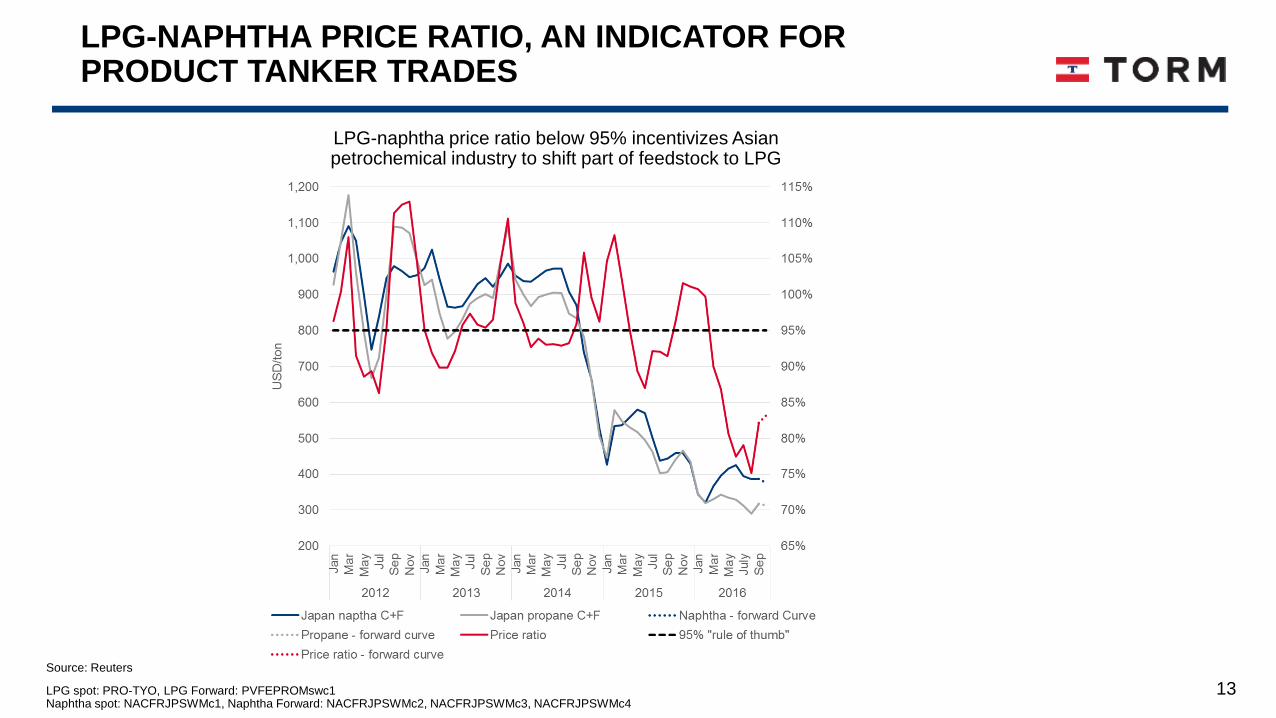
LPG-NAPHTHA PRICE RATIO, AN INDICATOR FOR PRODUCT TANKER TRADES
Source: Reuters
LPG spot: PRO-TYO, LPG Forward: PVFEPROMswc1Naphtha spot: NACFRJPSWMc1, Naphtha Forward: NACFRJPSWMc2, NACFRJPSWMc3, NACFRJPSWMc4
LPG-naphtha price ratio below 95% incentivizes Asian petrochemical industry to shift part of feedstock to LPG
14
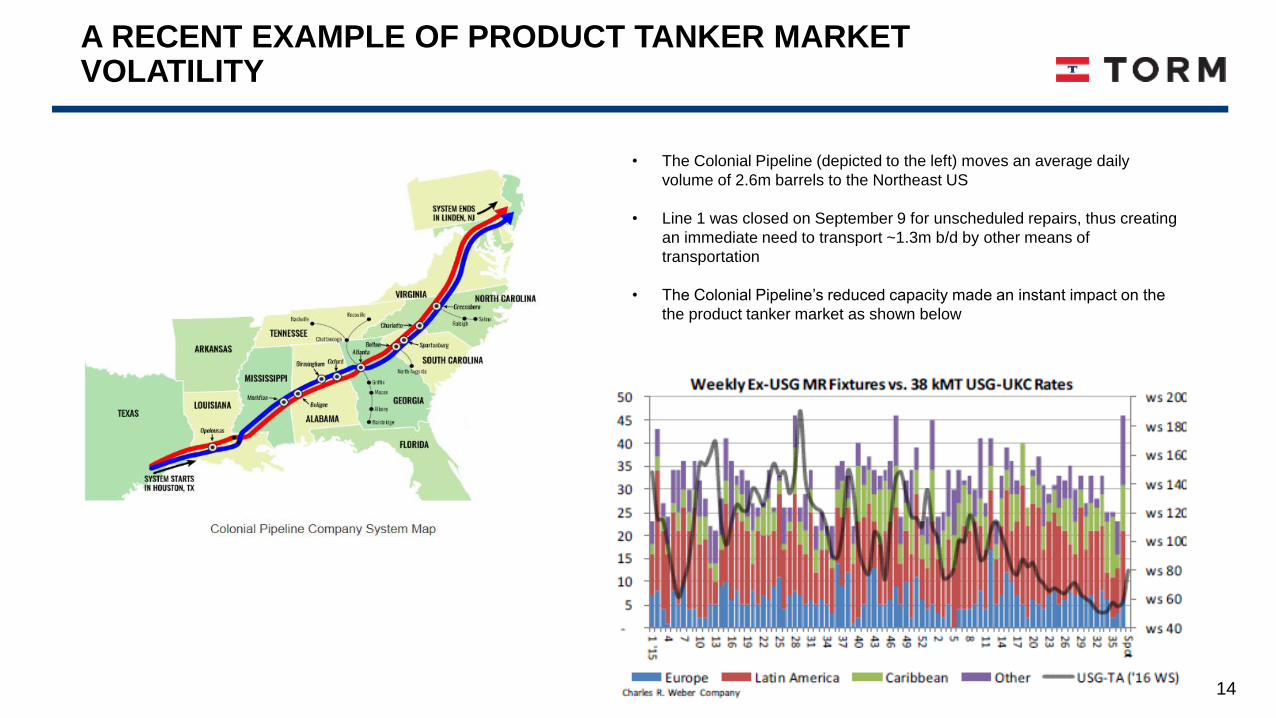
A RECENT EXAMPLE OF PRODUCT TANKER MARKET VOLATILITY
• The Colonial Pipeline (depicted to the left) moves an average daily
volume of 2.6m barrels to the Northeast US
• Line 1 was closed on September 9 for unscheduled repairs, thus creating
an immediate need to transport ~1.3m b/d by other means of
transportation
• The Colonial Pipeline’s reduced capacity made an instant impact on the
the product tanker market as shown below
15
Orion purchase price considerations
AGENDA
Fully integrated and transparent business model
Complex and volatile shipping niche with attractive fundamentals
Interesting key metrics
1
2
3
16
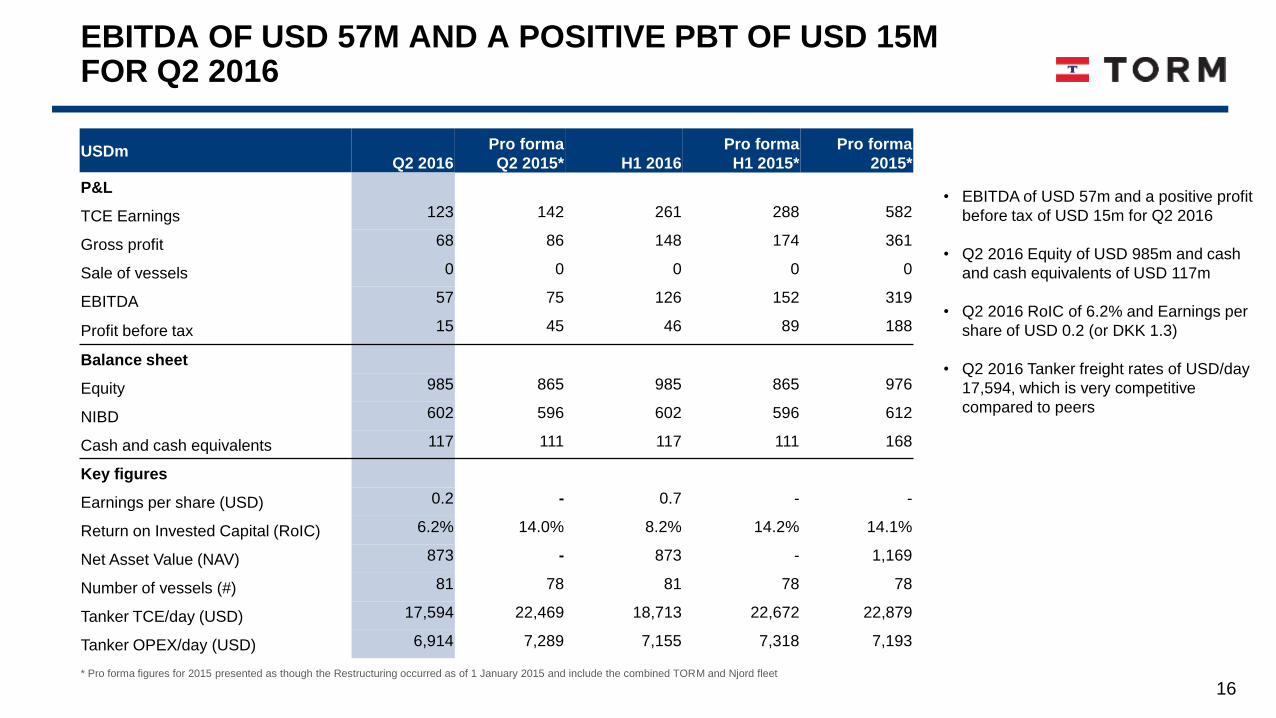
EBITDA OF USD 57M AND A POSITIVE PBT OF USD 15M FOR Q2 2016
• EBITDA of USD 57m and a positive profit
before tax of USD 15m for Q2 2016
• Q2 2016 Equity of USD 985m and cash
and cash equivalents of USD 117m
• Q2 2016 RoIC of 6.2% and Earnings per
share of USD 0.2 (or DKK 1.3)
• Q2 2016 Tanker freight rates of USD/day
17,594, which is very competitive
compared to peers
USDmQ2 2016
Pro forma
Q2 2015* H1 2016
Pro forma
H1 2015*
Pro forma
2015*
P&L
TCE Earnings 123 142 261 288 582
Gross profit 68 86 148 174 361
Sale of vessels 0 0 0 0 0
EBITDA 57 75 126 152 319
Profit before tax 15 45 46 89 188
Balance sheet
Equity 985 865 985 865 976
NIBD 602 596 602 596 612
Cash and cash equivalents 117 111 117 111 168
Key figures
Earnings per share (USD) 0.2 - 0.7 - -
Return on Invested Capital (RoIC) 6.2% 14.0% 8.2% 14.2% 14.1%
Net Asset Value (NAV) 873 - 873 - 1,169
Number of vessels (#) 81 78 81 78 78
Tanker TCE/day (USD) 17,594 22,469 18,713 22,672 22,879
Tanker OPEX/day (USD) 6,914 7,289 7,155 7,318 7,193
* Pro forma figures for 2015 presented as though the Restructuring occurred as of 1 January 2015 and include the combined TORM and Njord fleet
17
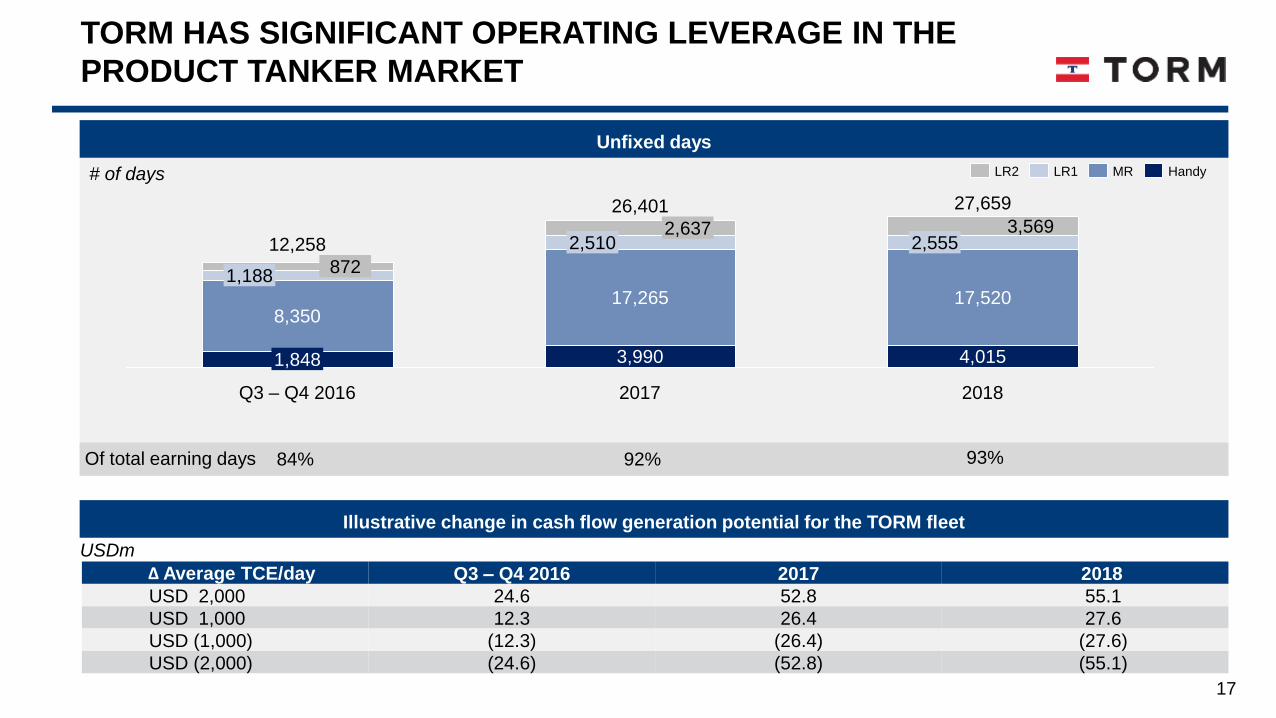
Unfixed days
2017 2018
27,659
4,015
17,520
2,5553,569
26,401
3,990
17,265
2,5102,637
Q3 – Q4 2016
12,258
1,848
8,350
1,188872
HandyMRLR1LR2
Illustrative change in cash flow generation potential for the TORM fleet
∆ Average TCE/day Q3 – Q4 2016 2017 2018
USD 2,000 24.6 52.8 55.1
USD 1,000 12.3 26.4 27.6
USD (1,000) (12.3) (26.4) (27.6)
USD (2,000) (24.6) (52.8) (55.1)
USDm
# of days
Of total earning days 84% 92%
TORM HAS SIGNIFICANT OPERATING LEVERAGE IN THE
PRODUCT TANKER MARKET
93%
18
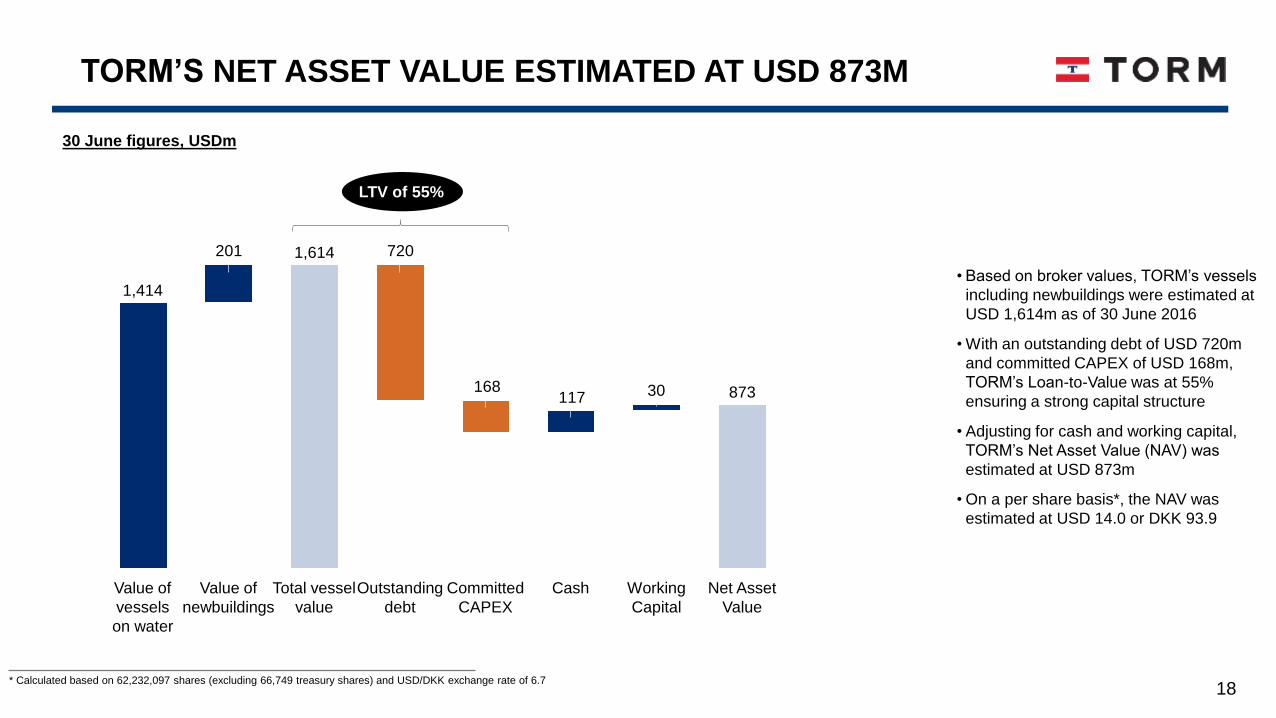
TORM’S NET ASSET VALUE ESTIMATED AT USD 873M
30117168
720201
Net Asset
Value
873
Working
Capital
CashCommitted
CAPEX
Outstanding
debt
Total vessel
value
1,614
Value of
newbuildings
Value of
vessels
on water
1,414
LTV of 55%
• Based on broker values, TORM’s vessels
including newbuildings were estimated at
USD 1,614m as of 30 June 2016
• With an outstanding debt of USD 720m
and committed CAPEX of USD 168m,
TORM’s Loan-to-Value was at 55%
ensuring a strong capital structure
• Adjusting for cash and working capital,
TORM’s Net Asset Value (NAV) was
estimated at USD 873m
• On a per share basis*, the NAV was
estimated at USD 14.0 or DKK 93.9
30 June figures, USDm
* Calculated based on 62,232,097 shares (excluding 66,749 treasury shares) and USD/DKK exchange rate of 6.7

19
TORM has, in order to allow for dividend
payments, terminated the cash sweep
mechanism under the term facility and will
start to pay fixed amortization from Q3
2016
Ample headroom under our attractive
covenant package:
Minimum liquidity: USD 75m*
Minimum book equity ratio: 25%
(adjusted for market value of vessels)
* Of which USD 20m must be cash or cash equivalent
57
15072
7363720
Hereafter
304
2020
repayment
2019
repayment
2018
repayment
2017
repayment
ROY 2016
repayment
Debt as of
30 Jun 2016
1688662
20
Total201820172016
75117
Available
debt facility
Cash position
CAPEX commitments Available liquidity
CAPEX and liquidity as of 30 June 2016 (USDm)
TORM is well-positioned to service future
CAPEX and debt commitments
On 8 July TORM finalized financing of the
LR2 newbuildings of up to USD 115m (up
to 60% financing) with 12 years maturity
at attractive terms
Strong operational cash flows expected in
2016
Scheduled debt repayments (USDm)
100% 9% 10% 10% 21% 8% 42%
TORM HAS A FAVOURABLE FINANCING PROFILE AND STRONG LIQUIDITY POSITION
Financing of LR2
newbuildings
Total available
liquidity
307
192
115
20
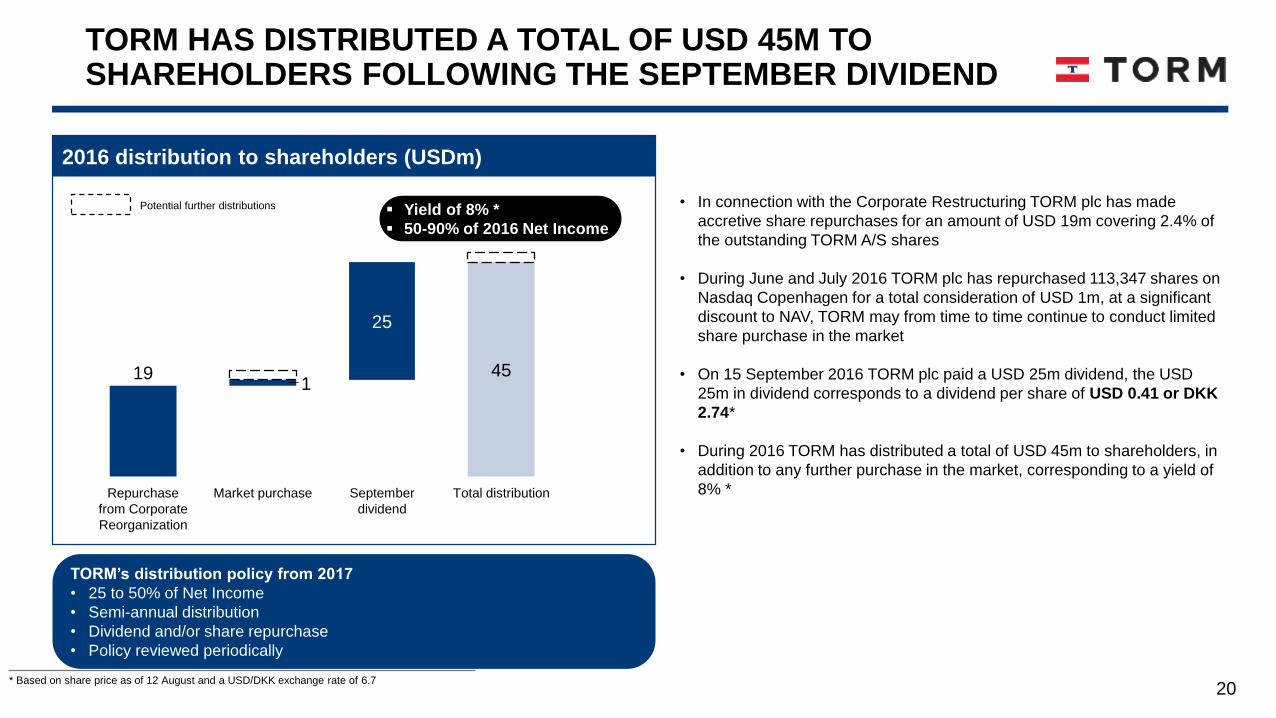
TORM HAS DISTRIBUTED A TOTAL OF USD 45M TO SHAREHOLDERS FOLLOWING THE SEPTEMBER DIVIDEND
2016 distribution to shareholders (USDm)
Yield of 8% *
50-90% of 2016 Net Income
• In connection with the Corporate Restructuring TORM plc has made
accretive share repurchases for an amount of USD 19m covering 2.4% of
the outstanding TORM A/S shares
• During June and July 2016 TORM plc has repurchased 113,347 shares on
Nasdaq Copenhagen for a total consideration of USD 1m, at a significant
discount to NAV, TORM may from time to time continue to conduct limited
share purchase in the market
• On 15 September 2016 TORM plc paid a USD 25m dividend, the USD
25m in dividend corresponds to a dividend per share of USD 0.41 or DKK
2.74*
• During 2016 TORM has distributed a total of USD 45m to shareholders, in
addition to any further purchase in the market, corresponding to a yield of
8% *Total distributionSeptember
dividend
119
Market purchaseRepurchase
from Corporate
Reorganization
25
45
Potential further distributions
TORM’s distribution policy from 2017
• 25 to 50% of Net Income
• Semi-annual distribution
• Dividend and/or share repurchase
• Policy reviewed periodically
* Based on share price as of 12 August and a USD/DKK exchange rate of 6.7
21
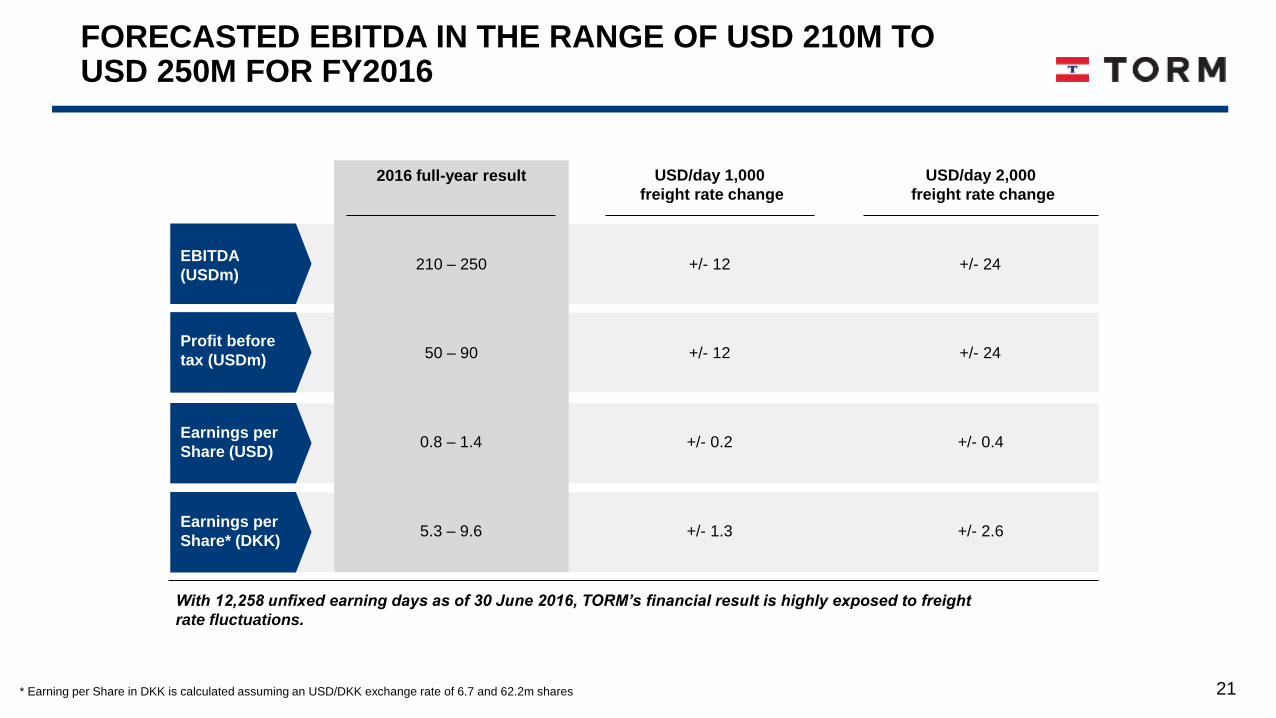
EBITDA
(USDm)
Profit before
tax (USDm)
Earnings per
Share (USD)
2016 full-year result USD/day 1,000
freight rate change
210 – 250 +/- 12
50 – 90 +/- 12
+/- 24
+/- 24
+/- 0.2
FORECASTED EBITDA IN THE RANGE OF USD 210M TO USD 250M FOR FY2016
With 12,258 unfixed earning days as of 30 June 2016, TORM’s financial result is highly exposed to freight
rate fluctuations.
USD/day 2,000
freight rate change
0.8 – 1.4
Earnings per
Share* (DKK)+/- 1.35.3 – 9.6
* Earning per Share in DKK is calculated assuming an USD/DKK exchange rate of 6.7 and 62.2m shares
+/- 0.4
+/- 2.6
22
Orion purchase price considerations
KEY TAKE-AWAYS
Fully integrated and transparent business model
Complex and volatile shipping niche with attractive fundamentals
Interesting key metrics
1
2
3