Embed Size (px)
Citation preview

HALF YEAR RESULTS – JUNE 2017
Westfield Chermside

2 2017 HALF YEAR RESULTS |
RESULTS OVERVIEW PETER ALLEN
CEO
Westfield Chermside
3 2017 HALF YEAR RESULTS |
2017 FULL YEAR FORECAST
The Group continues its strong operating performance and is on track to deliver its forecast full year growth in Funds From Operations of approximately 4.25%
4.25% FORECAST FFO GROWTH
5% underlying FFO growth
21.73c FORECAST DISTRIBUTION 2% growth in distribution per security
>$900M DEVELOPMENTS To commence during 2017 (SCG share: $625m)
2.75% to 3% FORECAST COMPARABLE NOI GROWTH
4 2017 HALF YEAR RESULTS |
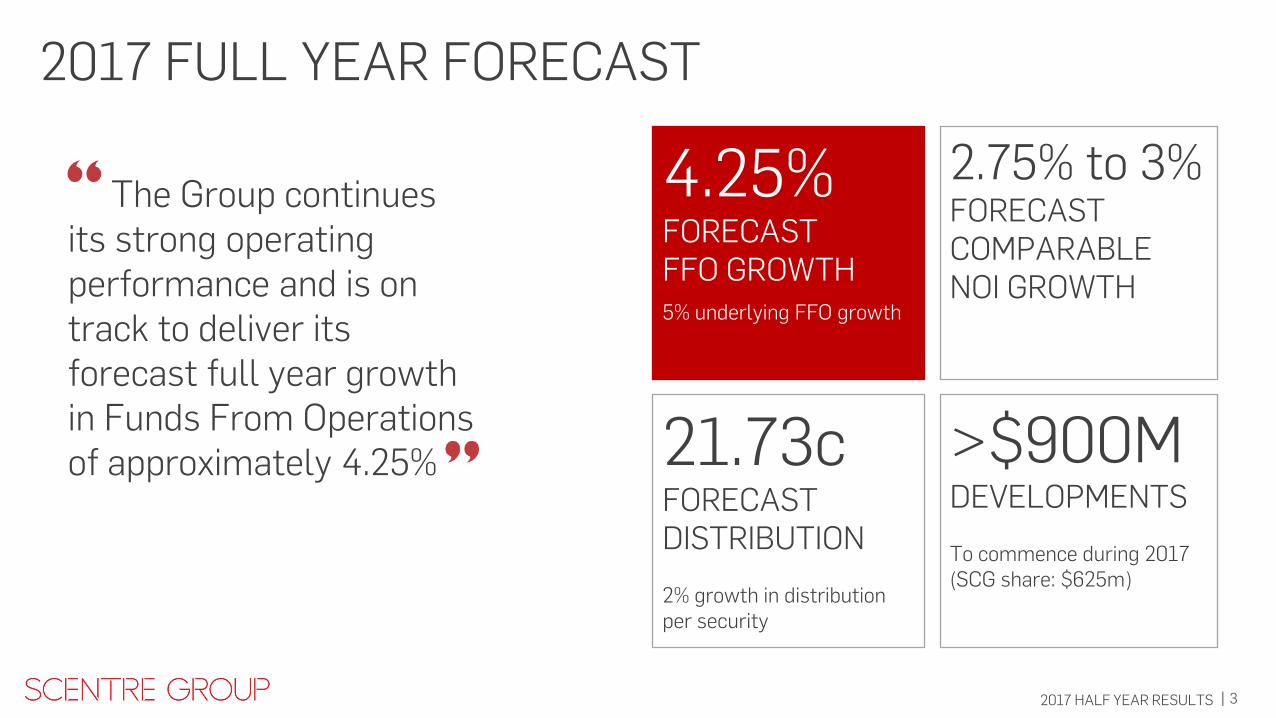
RESULTS OVERVIEW
FIRST HALF 2017 RESULTS
Funds From Operations (FFO) $638 million, 3.5% growth
FFO per security 12.01 cents, 3.5% growth
Distribution per security 10.86 cents, 2% growth
Comparable NOI 2.6% growth
Developments Commenced $900 million
Assets Under Management (AUM) $47.4 billion, 3.6% growth
SCG share of AUM $33.6 billion, 4.0% growth
Profit $1,412 million
Gearing 33.9%
5 2017 HALF YEAR RESULTS |
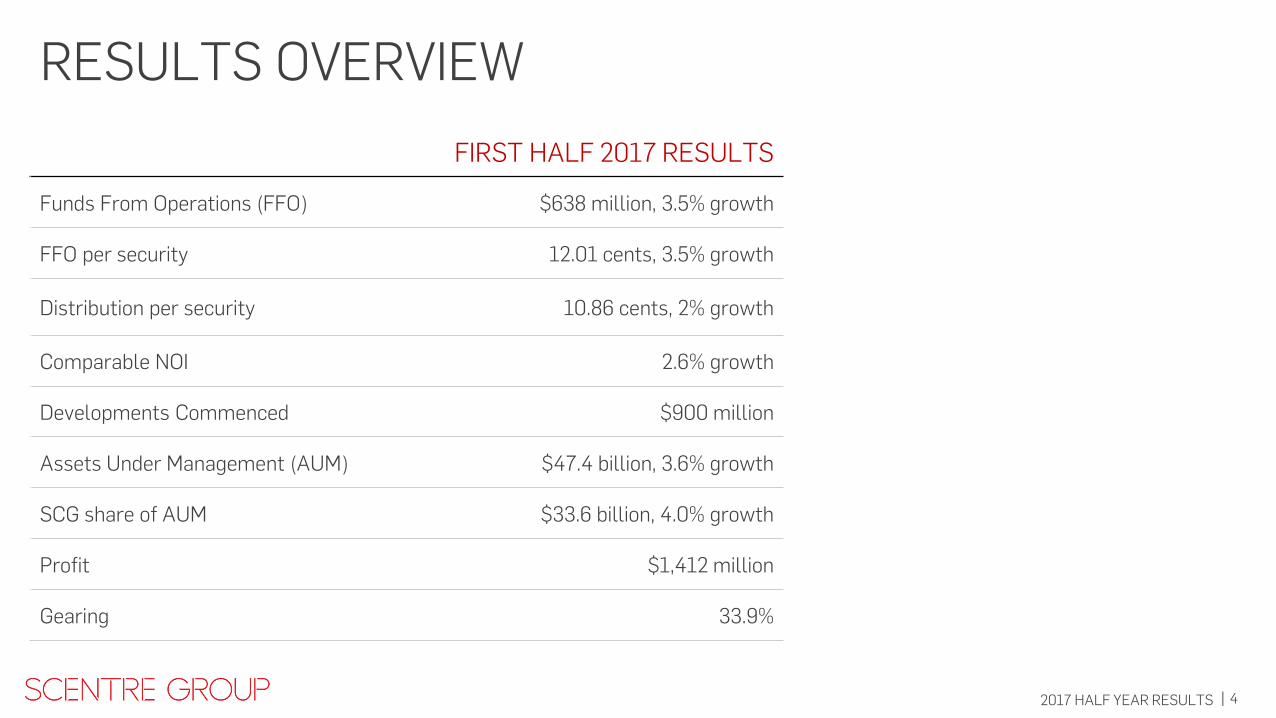
STRATEGIC PRIORITIES
PROGRESS
Delivering long-term sustainable growth by strategically investing in and proactively managing each individual shopping centre in the portfolio. Asset valuations up 4.0% Improvement in weighted average capitalisation rate to 5.25% (8bps) YTD comparable net operating income growth of 2.6% (full year forecast 2.75% – 3%)
Curating a diverse, engaging and constantly evolving product mix offering the best retail, dining, entertainment, lifestyle and services. ~500 different retail brands leased new sites, including ~100 that are new to the
Scentre Group portfolio Opened the largest entertainment, dining and leisure precinct in the southern
hemisphere at Westfield Chermside Expanded the smartscreen media business to the NZ portfolio Creating an excellent customer experience, making it easy for customers to visit, engage and be entertained, while offering a vibrant mix of products and services that customers want. Launched the customer experience net promoter system
Creating extraordinary places connecting and enriching communities Westfield North Lakes
ASSET MANAGEMENT
RETAIL PRODUCT & CUSTOMER EXPERIENCE
6 2017 HALF YEAR RESULTS |
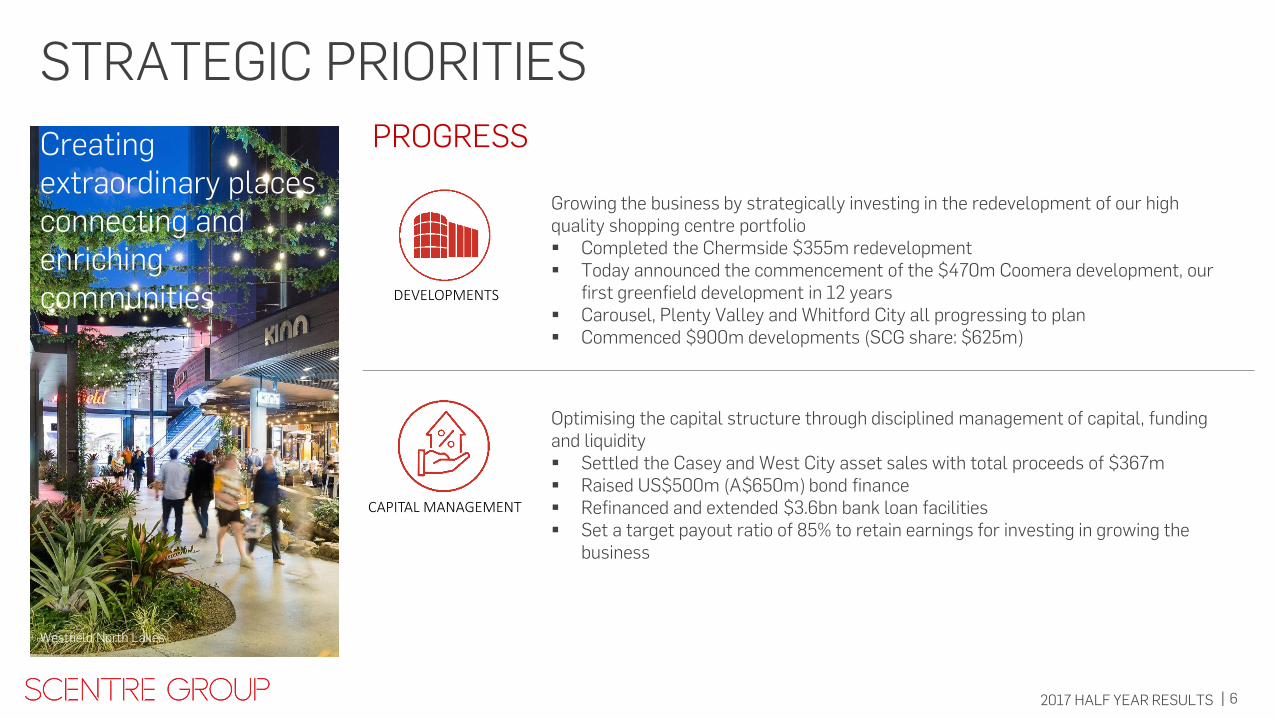
STRATEGIC PRIORITIES
PROGRESS Creating extraordinary places connecting and enriching communities Westfield North Lakes
DEVELOPMENTS
CAPITAL MANAGEMENT
Optimising the capital structure through disciplined management of capital, funding and liquidity Settled the Casey and West City asset sales with total proceeds of $367m Raised US$500m (A$650m) bond finance Refinanced and extended $3.6bn bank loan facilities Set a target payout ratio of 85% to retain earnings for investing in growing the
business
Growing the business by strategically investing in the redevelopment of our high quality shopping centre portfolio Completed the Chermside $355m redevelopment Today announced the commencement of the $470m Coomera development, our
first greenfield development in 12 years Carousel, Plenty Valley and Whitford City all progressing to plan Commenced $900m developments (SCG share: $625m)
7 2017 HALF YEAR RESULTS |
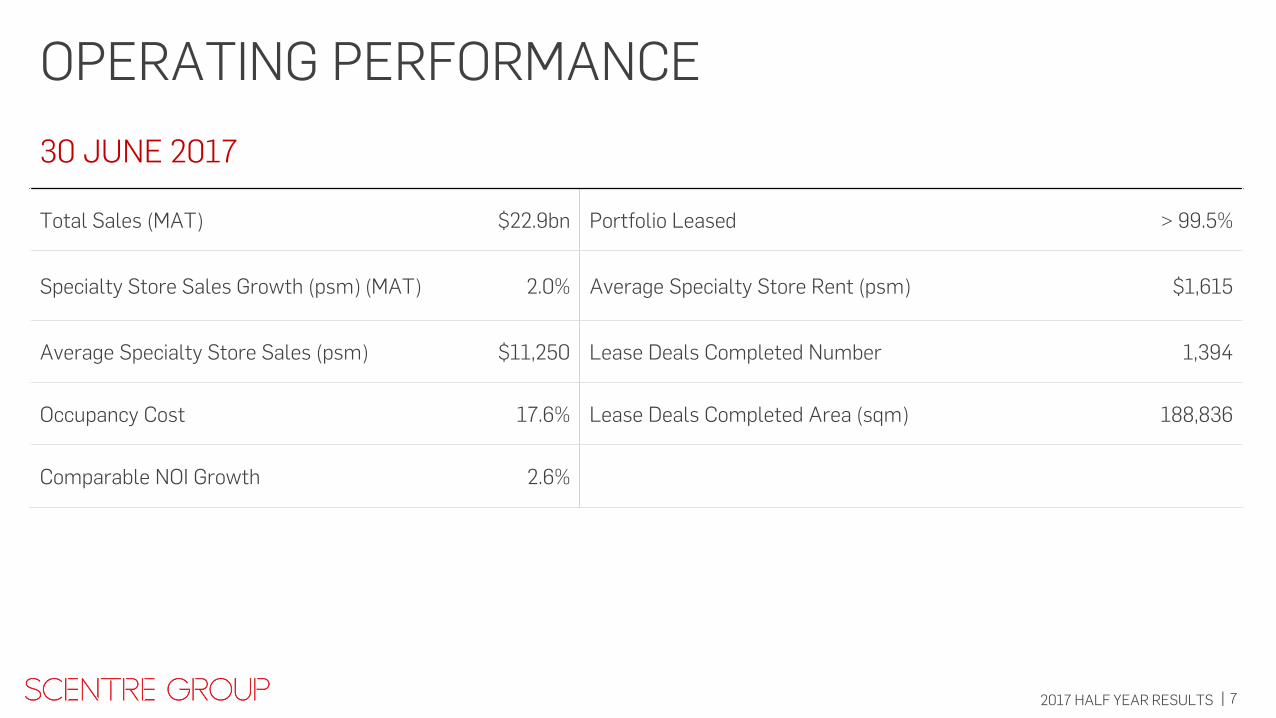
OPERATING PERFORMANCE
30 JUNE 2017
Total Sales (MAT) $22.9bn Portfolio Leased > 99.5%
Specialty Store Sales Growth (psm) (MAT) 2.0% Average Specialty Store Rent (psm) $1,615
Average Specialty Store Sales (psm) $11,250 Lease Deals Completed Number 1,394
Occupancy Cost 17.6% Lease Deals Completed Area (sqm) 188,836
Comparable NOI Growth 2.6%
8 2017 HALF YEAR RESULTS |
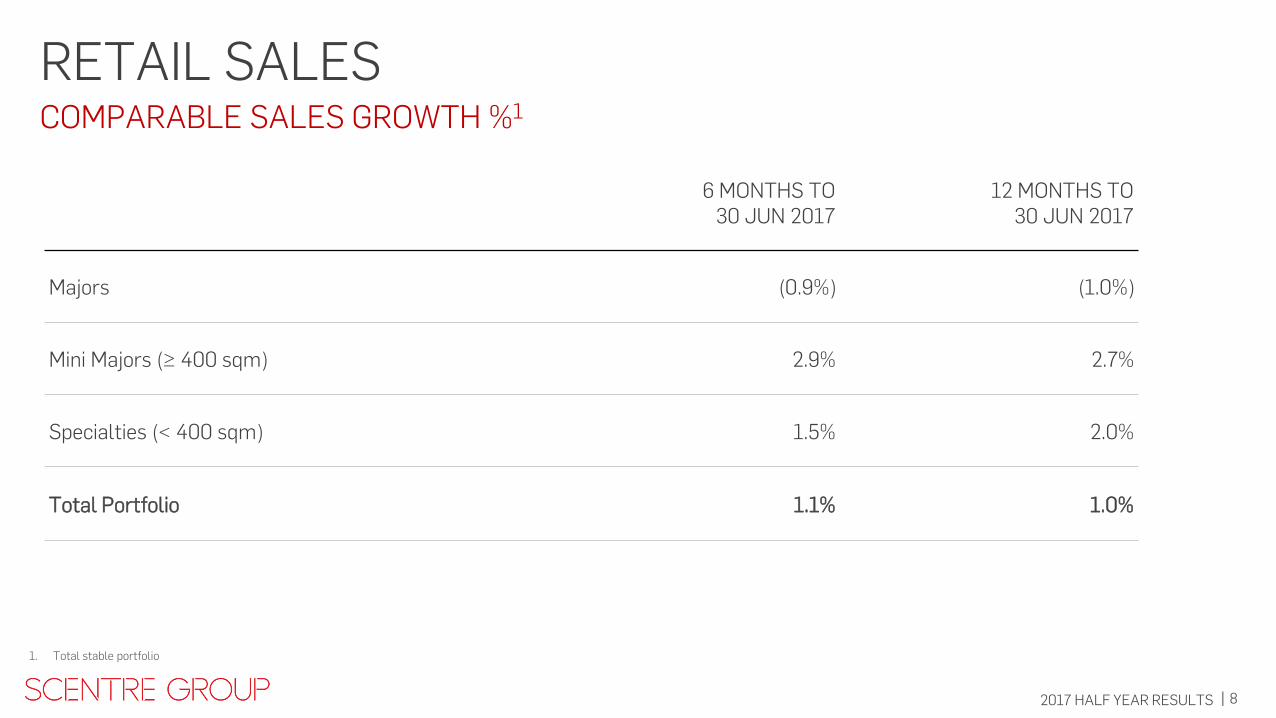
1. Total stable portfolio
RETAIL SALES
6 MONTHS TO 30 JUN 2017
12 MONTHS TO 30 JUN 2017
Majors (0.9%) (1.0%)
Mini Majors (≥ 400 sqm) 2.9% 2.7%
Specialties (< 400 sqm) 1.5% 2.0%
Total Portfolio 1.1% 1.0%
COMPARABLE SALES GROWTH %1
9 2017 HALF YEAR RESULTS |
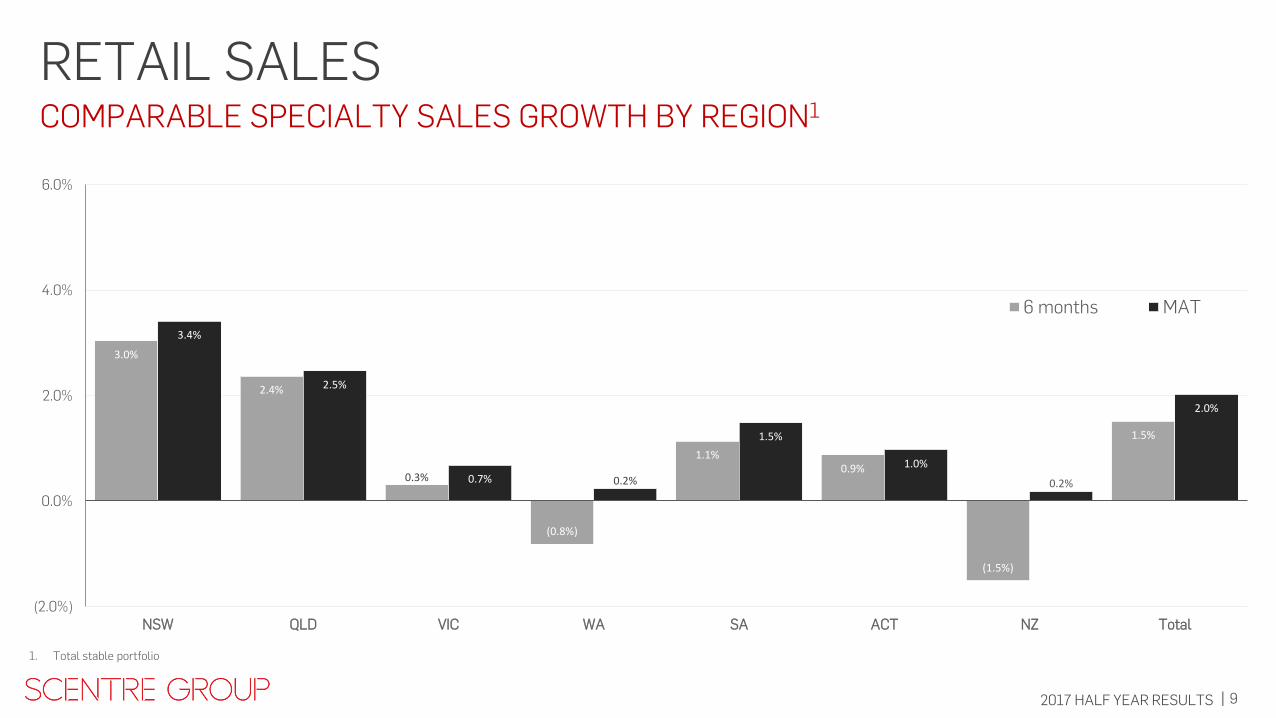
3.0%
2.4%
0.3%
(0.8%)
1.1% 0.9%
(1.5%)
1.5%
3.4%
2.5%
0.7% 0.2%
1.5%
1.0%
0.2%
2.0%
(2.0%)
0.0%
2.0%
4.0%
6.0%
NSW QLD VIC WA SA ACT NZ Total
6 months MAT
1. Total stable portfolio
RETAIL SALES COMPARABLE SPECIALTY SALES GROWTH BY REGION1
10 2017 HALF YEAR RESULTS |
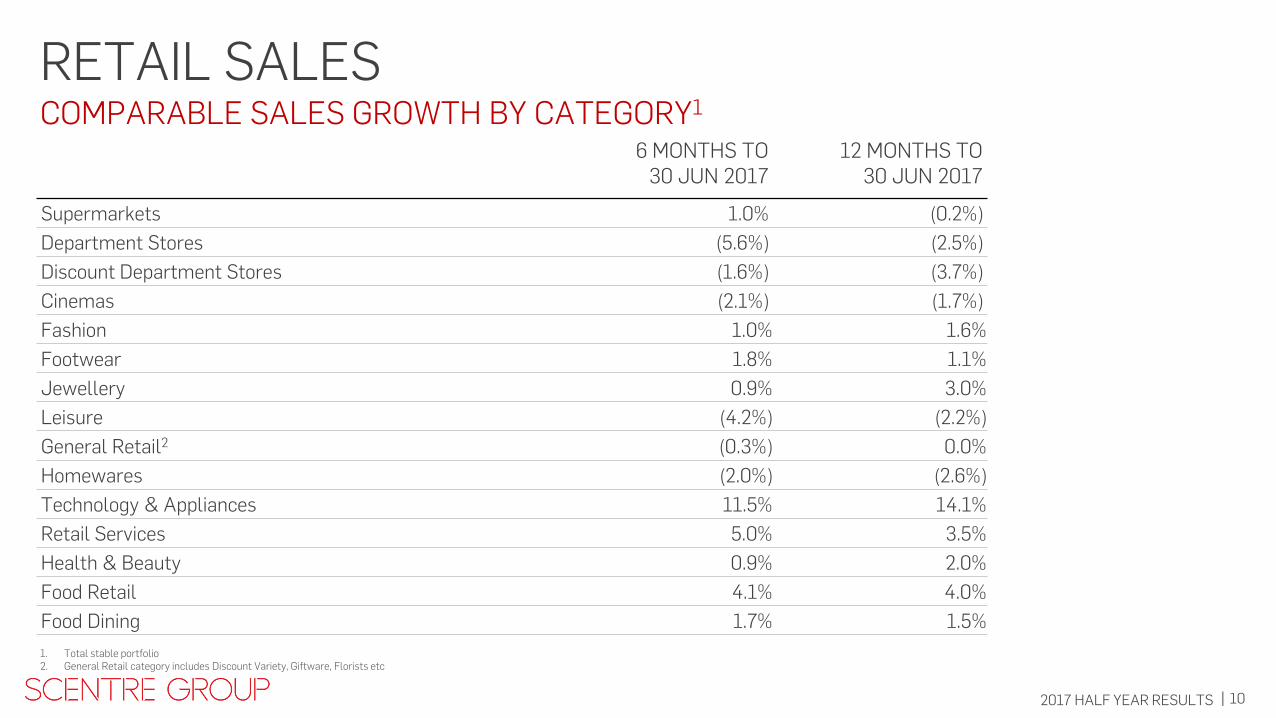
RETAIL SALES
6 MONTHS TO 30 JUN 2017
12 MONTHS TO 30 JUN 2017
Supermarkets 1.0% (0.2%)
Department Stores (5.6%) (2.5%)
Discount Department Stores (1.6%) (3.7%)
Cinemas (2.1%) (1.7%)
Fashion 1.0% 1.6%
Footwear 1.8% 1.1%
Jewellery 0.9% 3.0%
Leisure (4.2%) (2.2%)
General Retail2 (0.3%) 0.0%
Homewares (2.0%) (2.6%)
Technology & Appliances 11.5% 14.1%
Retail Services 5.0% 3.5%
Health & Beauty 0.9% 2.0%
Food Retail 4.1% 4.0%
Food Dining 1.7% 1.5%
1. Total stable portfolio 2. General Retail category includes Discount Variety, Giftware, Florists etc
COMPARABLE SALES GROWTH BY CATEGORY1
11 2017 HALF YEAR RESULTS |
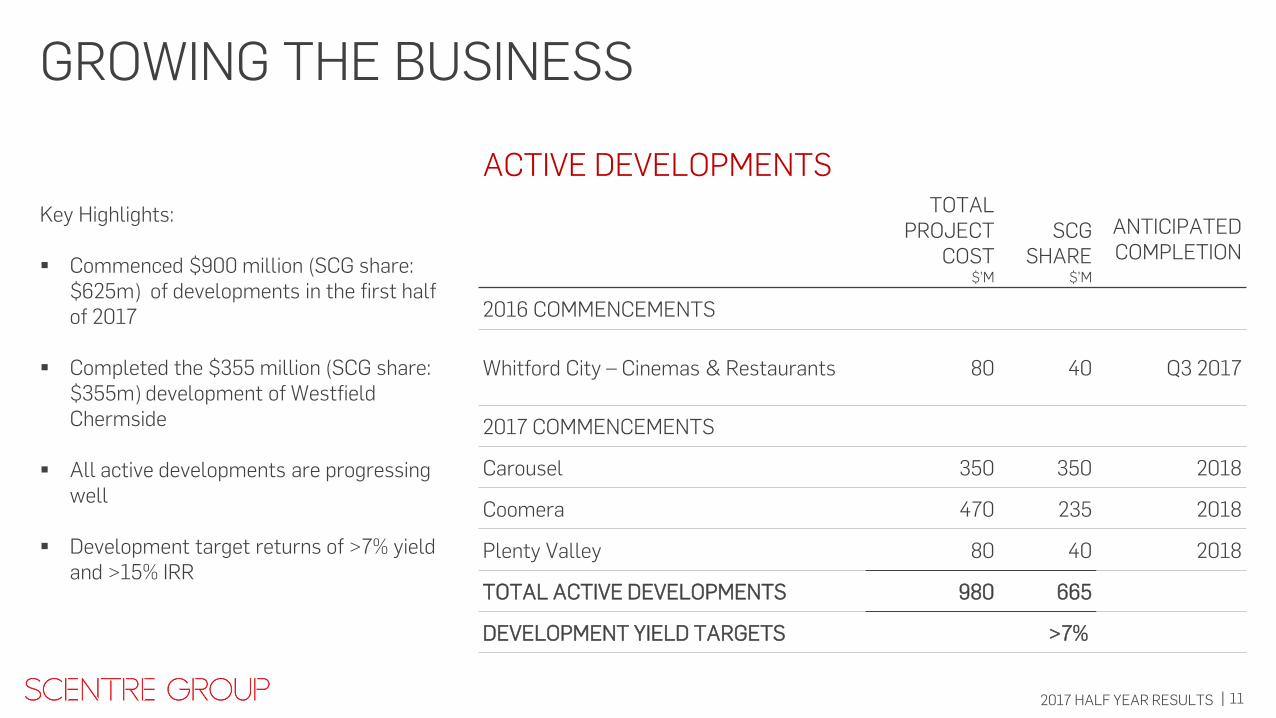
GROWING THE BUSINESS
ACTIVE DEVELOPMENTS TOTAL
PROJECT COST
$’M
SCG
SHARE $’M
ANTICIPATED COMPLETION
2016 COMMENCEMENTS
Whitford City – Cinemas & Restaurants 80 40 Q3 2017
2017 COMMENCEMENTS
Carousel 350 350 2018
Coomera 470 235 2018
Plenty Valley 80 40 2018
TOTAL ACTIVE DEVELOPMENTS 980 665
DEVELOPMENT YIELD TARGETS >7%
Key Highlights: Commenced $900 million (SCG share:
$625m) of developments in the first half of 2017
Completed the $355 million (SCG share: $355m) development of Westfield Chermside
All active developments are progressing well
Development target returns of >7% yield and >15% IRR
12 2017 HALF YEAR RESULTS |
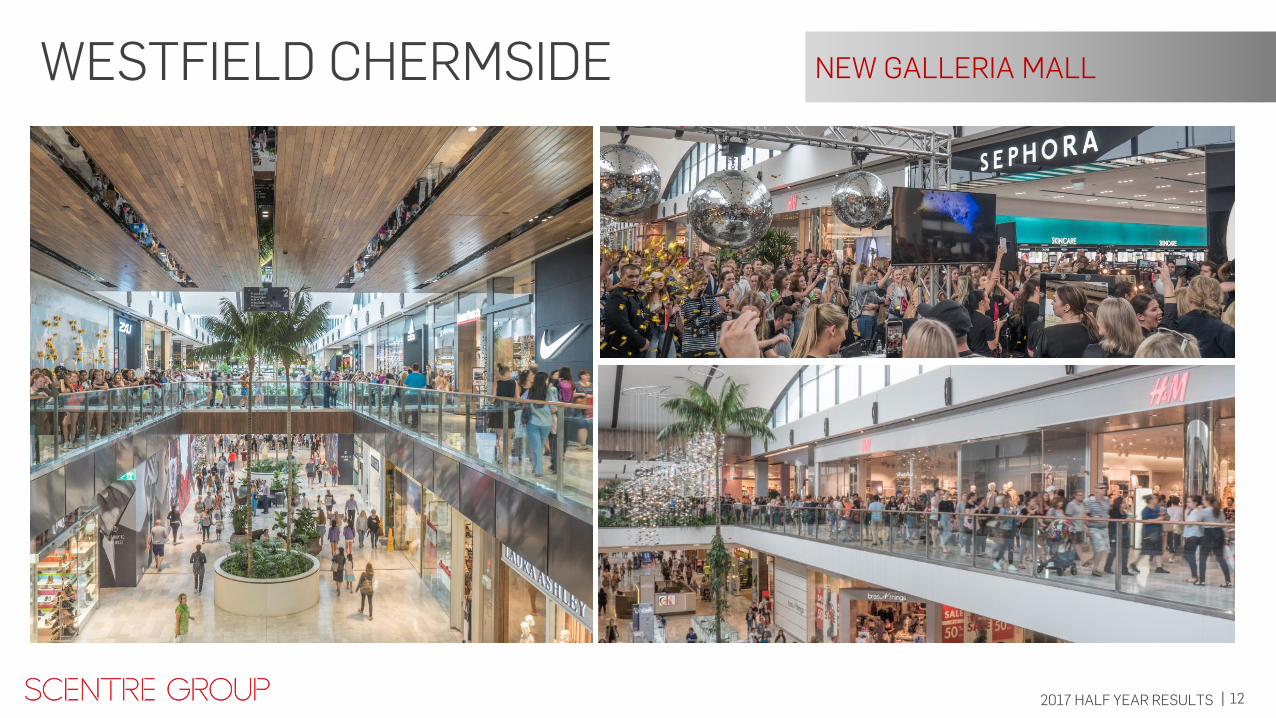
WESTFIELD CHERMSIDE NEW GALLERIA MALL
13 2017 HALF YEAR RESULTS |
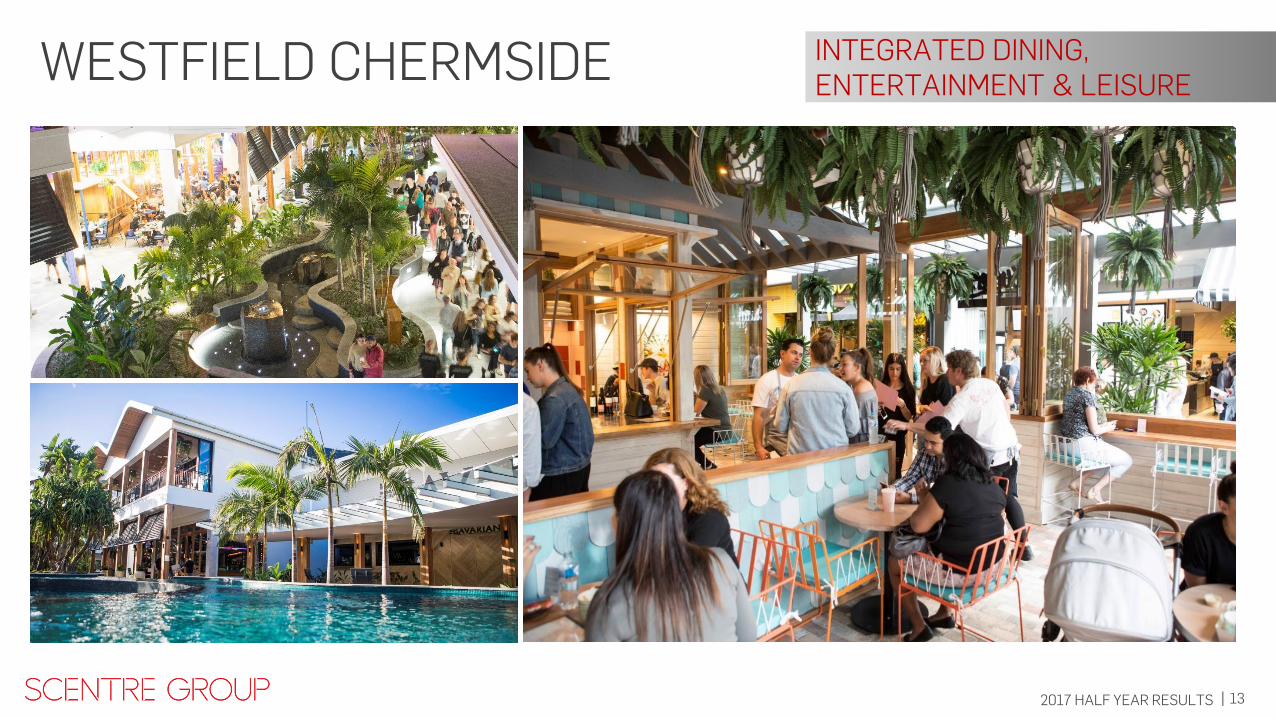
WESTFIELD CHERMSIDE INTEGRATED DINING, ENTERTAINMENT & LEISURE

14 2017 HALF YEAR RESULTS |
WESTFIELD CHERMSIDE
EXPANSIVE DINING MIX - 25 NEW RESTAURANTS AND CAFES
INTEGRATED DINING, ENTERTAINMENT & LEISURE
15 2017 HALF YEAR RESULTS |
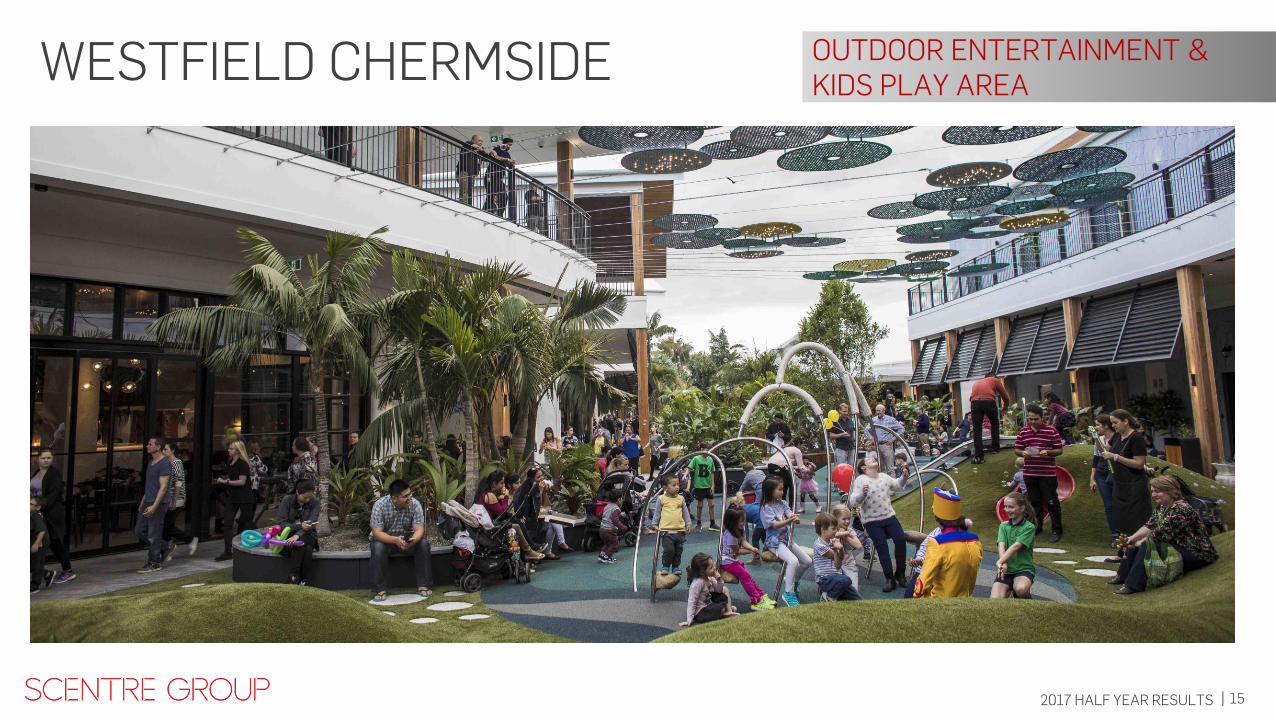
WESTFIELD CHERMSIDE OUTDOOR ENTERTAINMENT & KIDS PLAY AREA
16 2017 HALF YEAR RESULTS |
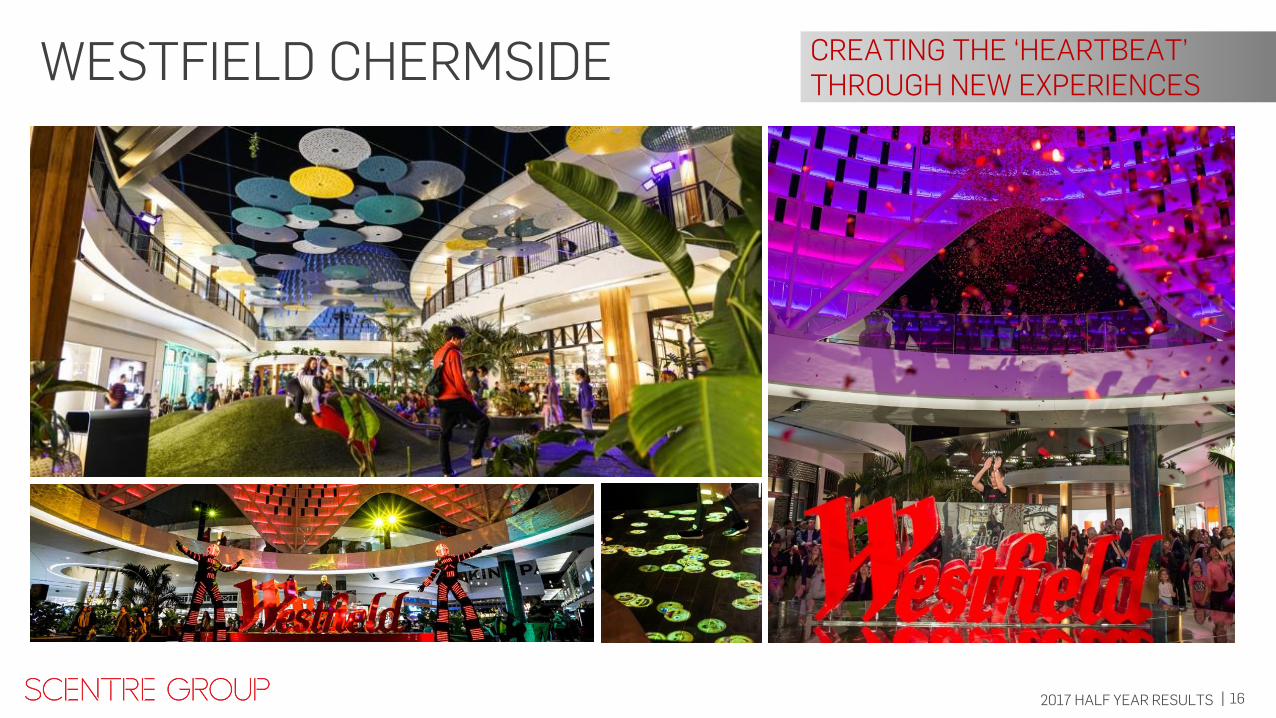
WESTFIELD CHERMSIDE CREATING THE ‘HEARTBEAT’ THROUGH NEW EXPERIENCES
17 2017 HALF YEAR RESULTS |
WESTFIELD CHERMSIDE
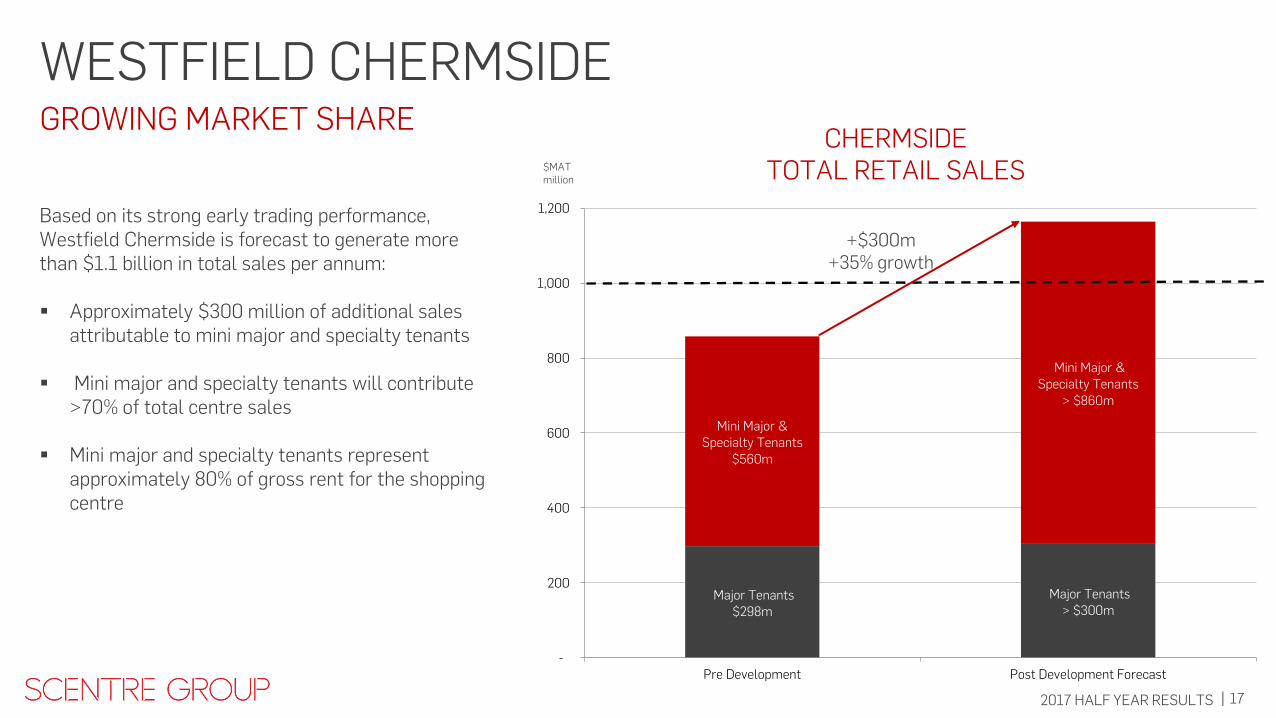
GROWING MARKET SHARE
Based on its strong early trading performance, Westfield Chermside is forecast to generate more than $1.1 billion in total sales per annum:
Approximately $300 million of additional sales
attributable to mini major and specialty tenants
Mini major and specialty tenants will contribute >70% of total centre sales
Mini major and specialty tenants represent approximately 80% of gross rent for the shopping centre
>70% of Total Sales
Major Tenants $298m
Major Tenants > $300m
Mini Major & Specialty Tenants
$560m
Mini Major & Specialty Tenants
> $860m
-
200
400
600
800
1,000
1,200
Pre Development Post Development Forecast
CHERMSIDE TOTAL RETAIL SALES $MAT
million
+$300m +35% growth
18 2017 HALF YEAR RESULTS |
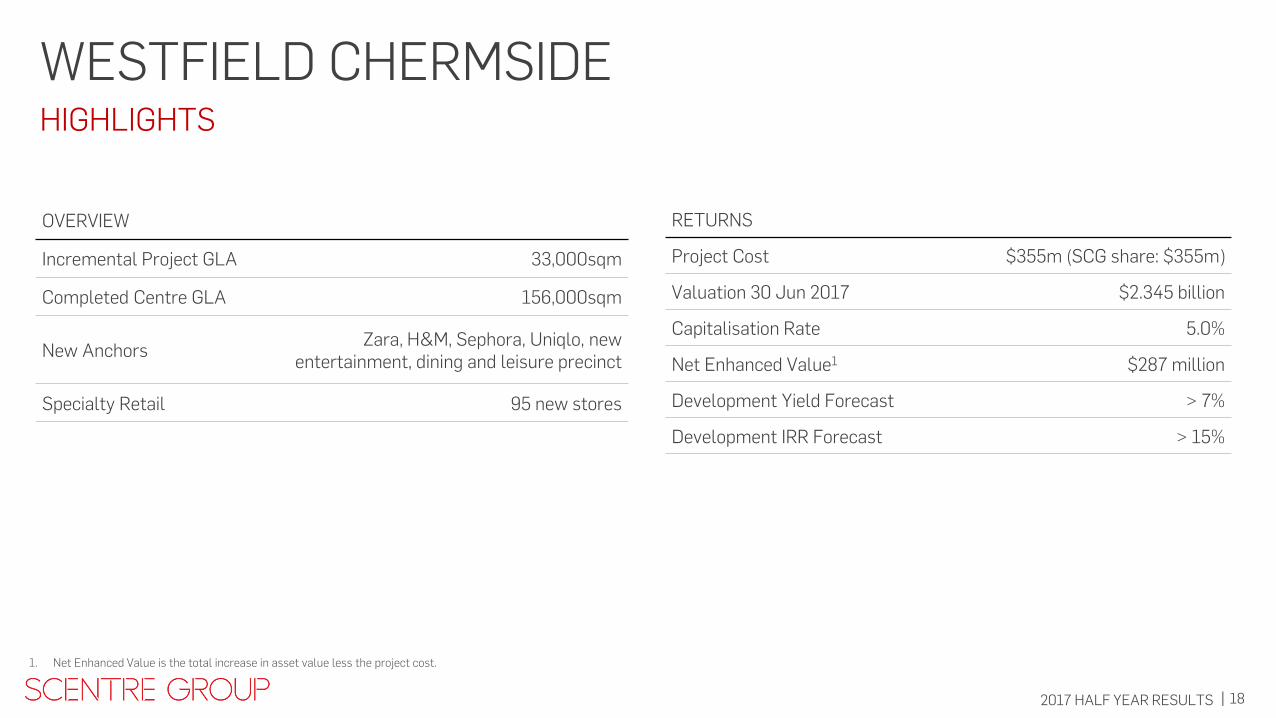
WESTFIELD CHERMSIDE
HIGHLIGHTS
>70% of Total Sales
RETURNS
Project Cost $355m (SCG share: $355m)
Valuation 30 Jun 2017 $2.345 billion
Capitalisation Rate 5.0%
Net Enhanced Value1 $287 million
Development Yield Forecast > 7%
Development IRR Forecast > 15%
OVERVIEW
Incremental Project GLA 33,000sqm
Completed Centre GLA 156,000sqm
New Anchors Zara, H&M, Sephora, Uniqlo, new
entertainment, dining and leisure precinct
Specialty Retail 95 new stores
1. Net Enhanced Value is the total increase in asset value less the project cost.
19 2017 HALF YEAR RESULTS |
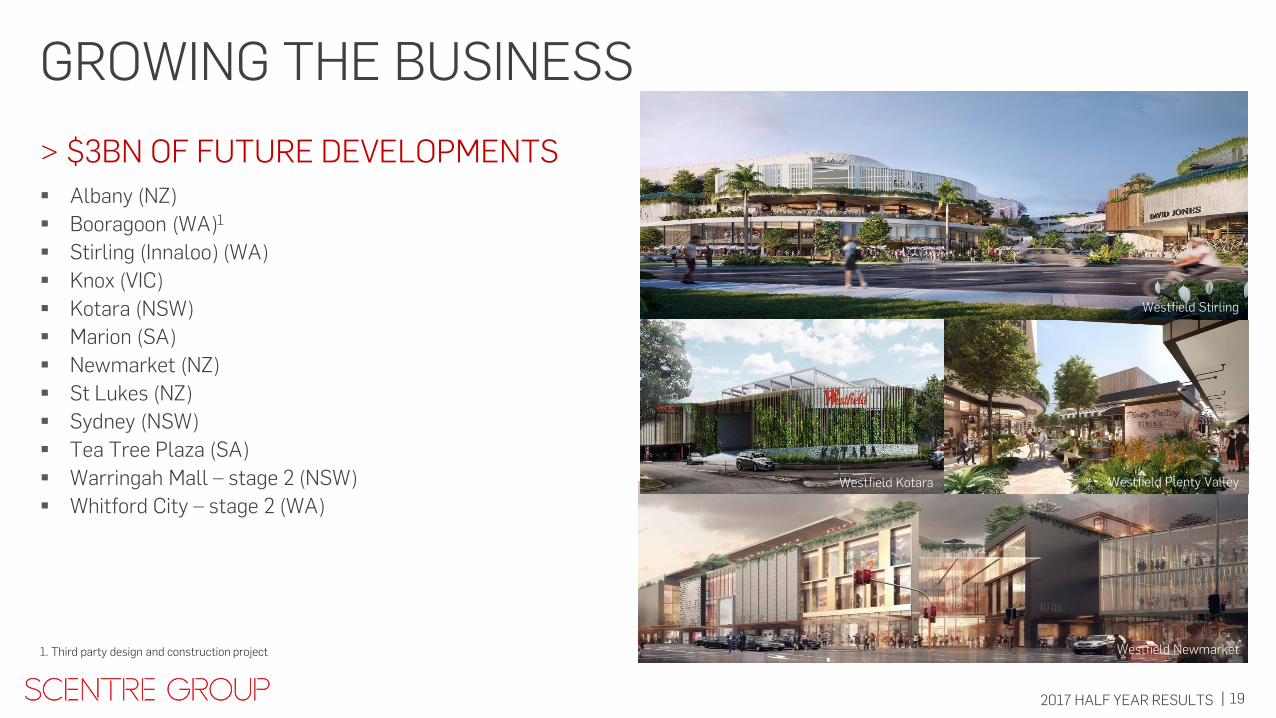
> $3BN OF FUTURE DEVELOPMENTS
Albany (NZ)
Booragoon (WA)1
Stirling (Innaloo) (WA)
Knox (VIC)
Kotara (NSW)
Marion (SA)
Newmarket (NZ)
St Lukes (NZ)
Sydney (NSW)
Tea Tree Plaza (SA)
Warringah Mall – stage 2 (NSW)
Whitford City – stage 2 (WA)
Westfield Newmarket
Westfield Kotara
1. Third party design and construction project
GROWING THE BUSINESS
Westfield Plenty Valley
Westfield Stirling
Westfield Newmarket
Westfield Kotara
20 2017 HALF YEAR RESULTS |
RETAIL THE EVER CHANGING OPPORTUNITY
Westfield Kotara

21 2017 HALF YEAR RESULTS |
THE EVER CHANGING RETAIL OPPORTUNITY
Consumer Scentre Group is embracing changes in what customers want: We are increasing opportunities for customers to discover
/ select / purchase / receive / return and rate retail products and services.
We are connecting opportunities from the ‘sharing economy’, to give customers new ways to access goods and services.
The ‘experience’ is as important as the ‘price’ – We are focused on continuing to enhance the customer experience.
Retailer Trends Scentre Group is keeping a close eye on international trends: Retailers more selective on physical store locations -
focused on space providing high productivity, high store sales and high customer foot traffic.
Digitally-native brands are discovering the importance of physical stores.
Physical stores continue to be the most efficient way for retailers to grow sales and profit.
Merging of physical and digital retail.
EMBRACING CHANGE
22 2017 HALF YEAR RESULTS |
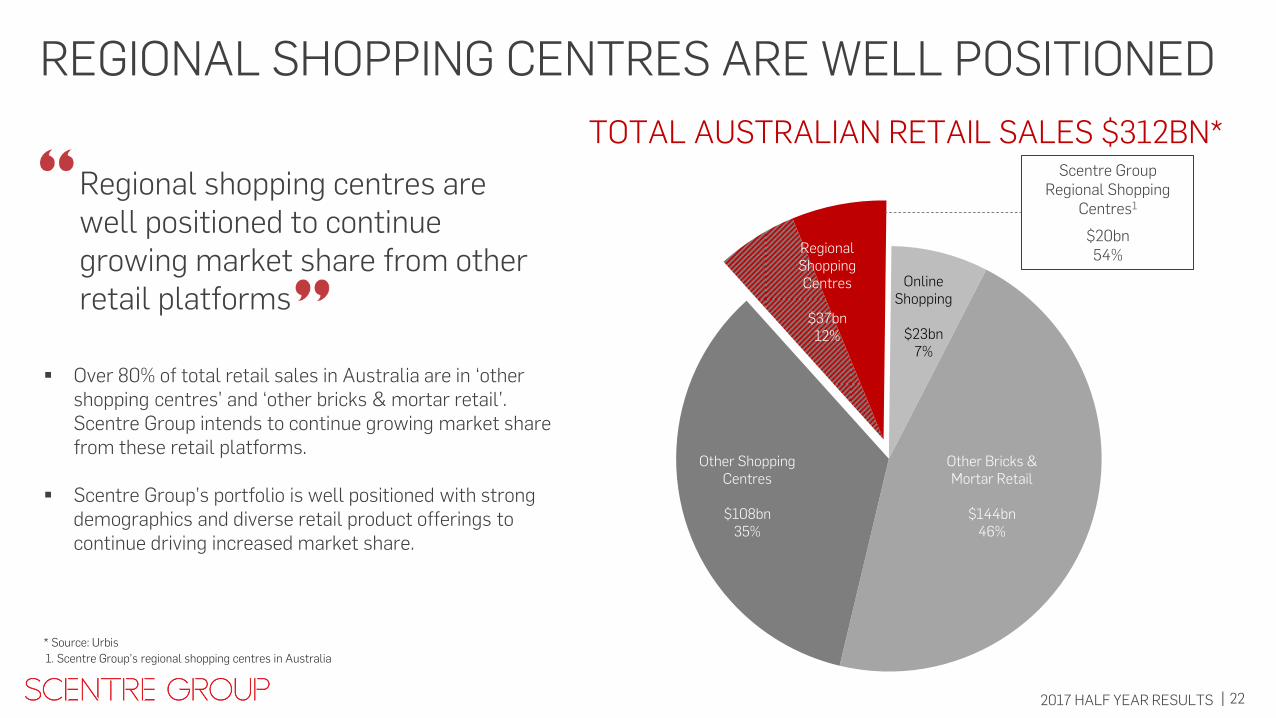
REGIONAL SHOPPING CENTRES ARE WELL POSITIONED
* Source: Urbis
Over 80% of total retail sales in Australia are in ‘other shopping centres’ and ‘other bricks & mortar retail’. Scentre Group intends to continue growing market share from these retail platforms.
Scentre Group’s portfolio is well positioned with strong demographics and diverse retail product offerings to continue driving increased market share.
Regional shopping centres are well positioned to continue growing market share from other retail platforms
TOTAL AUSTRALIAN RETAIL SALES $312BN*
Other Shopping Centres
$108bn
35%
Other Shopping Centres
$108bn
35%
Other Bricks & Mortar Retail
$144bn
46%
Online Shopping
$23bn
7%
Regional Shopping Centres
$37bn
12%
Scentre Group Regional Shopping
Centres1
$20bn 54%
1. Scentre Group’s regional shopping centres in Australia
23 2017 HALF YEAR RESULTS |
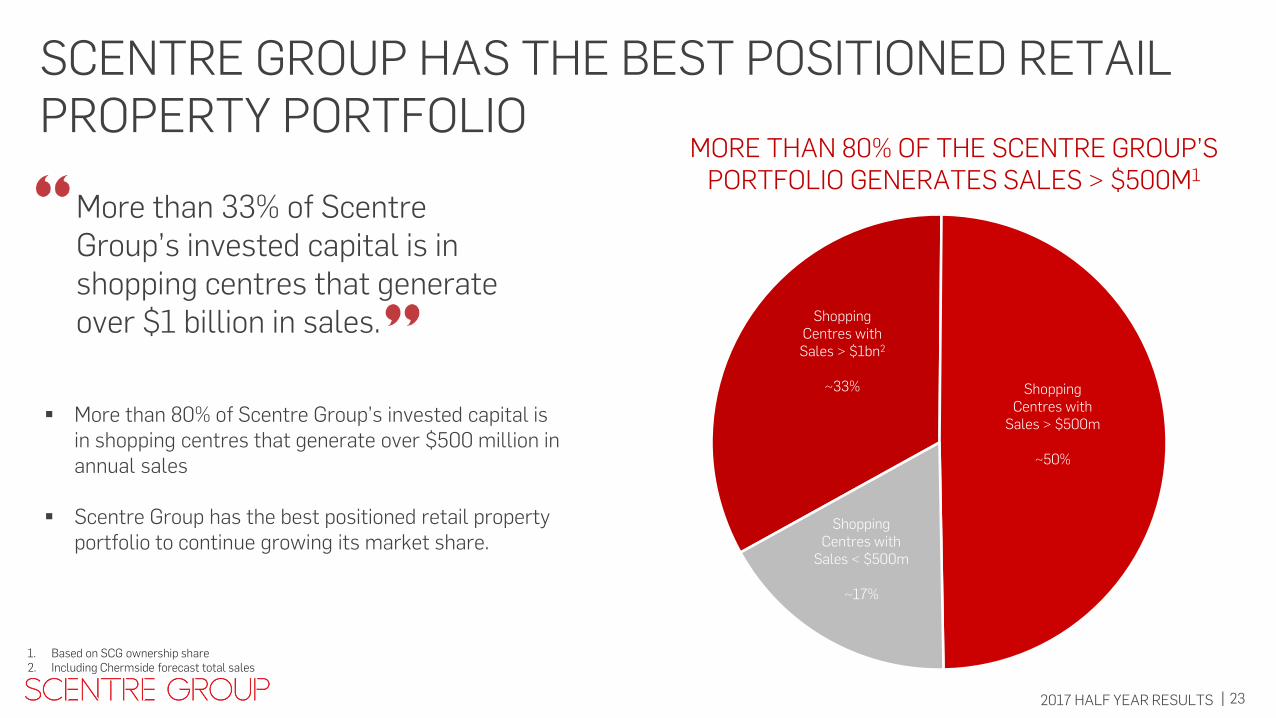
SCENTRE GROUP HAS THE BEST POSITIONED RETAIL PROPERTY PORTFOLIO
More than 80% of Scentre Group’s invested capital is in shopping centres that generate over $500 million in annual sales
Scentre Group has the best positioned retail property portfolio to continue growing its market share.
More than 33% of Scentre Group’s invested capital is in shopping centres that generate over $1 billion in sales.
1. Based on SCG ownership share 2. Including Chermside forecast total sales
Shopping Centres with Sales > $1bn2
~33% Shopping
Centres with Sales > $500m
~50%
Shopping Centres with
Sales < $500m
~17%
MORE THAN 80% OF THE SCENTRE GROUP’S PORTFOLIO GENERATES SALES > $500M1
24 2017 HALF YEAR RESULTS |
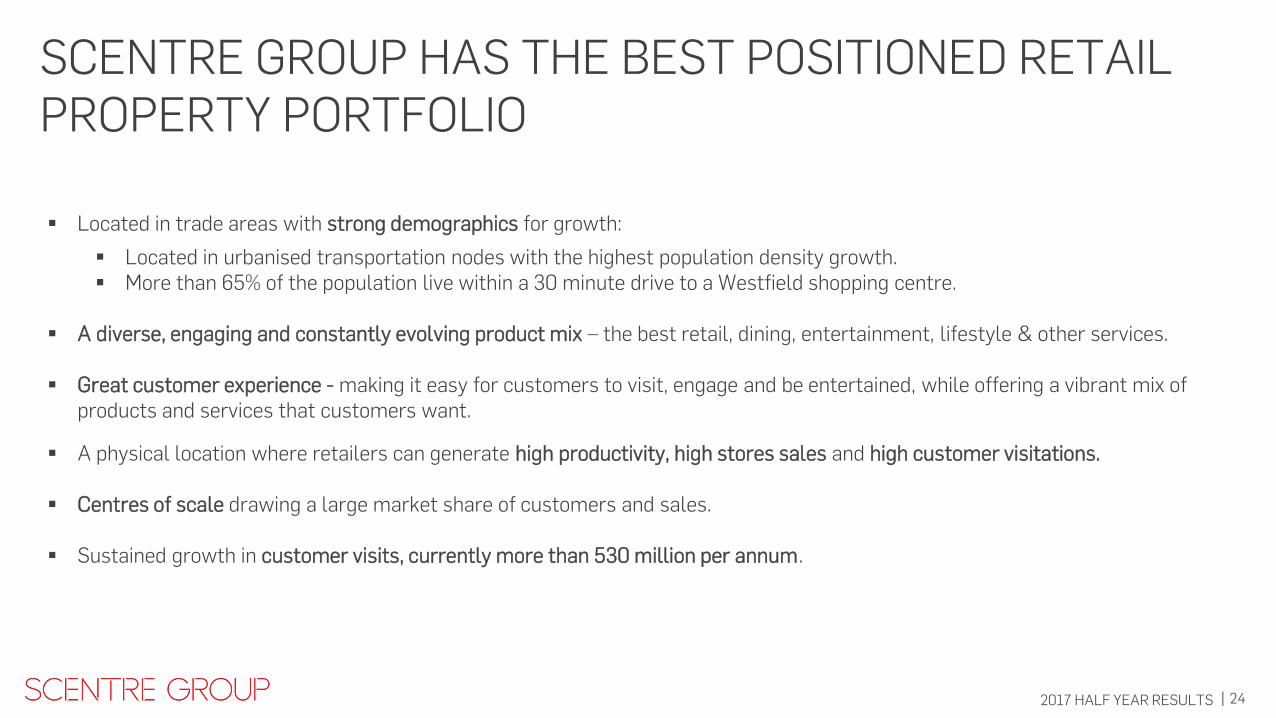
SCENTRE GROUP HAS THE BEST POSITIONED RETAIL PROPERTY PORTFOLIO
Located in trade areas with strong demographics for growth:
Located in urbanised transportation nodes with the highest population density growth. More than 65% of the population live within a 30 minute drive to a Westfield shopping centre.
A diverse, engaging and constantly evolving product mix – the best retail, dining, entertainment, lifestyle & other services.
Great customer experience - making it easy for customers to visit, engage and be entertained, while offering a vibrant mix of products and services that customers want.
A physical location where retailers can generate high productivity, high stores sales and high customer visitations.
Centres of scale drawing a large market share of customers and sales.
Sustained growth in customer visits, currently more than 530 million per annum.
25 2017 HALF YEAR RESULTS |
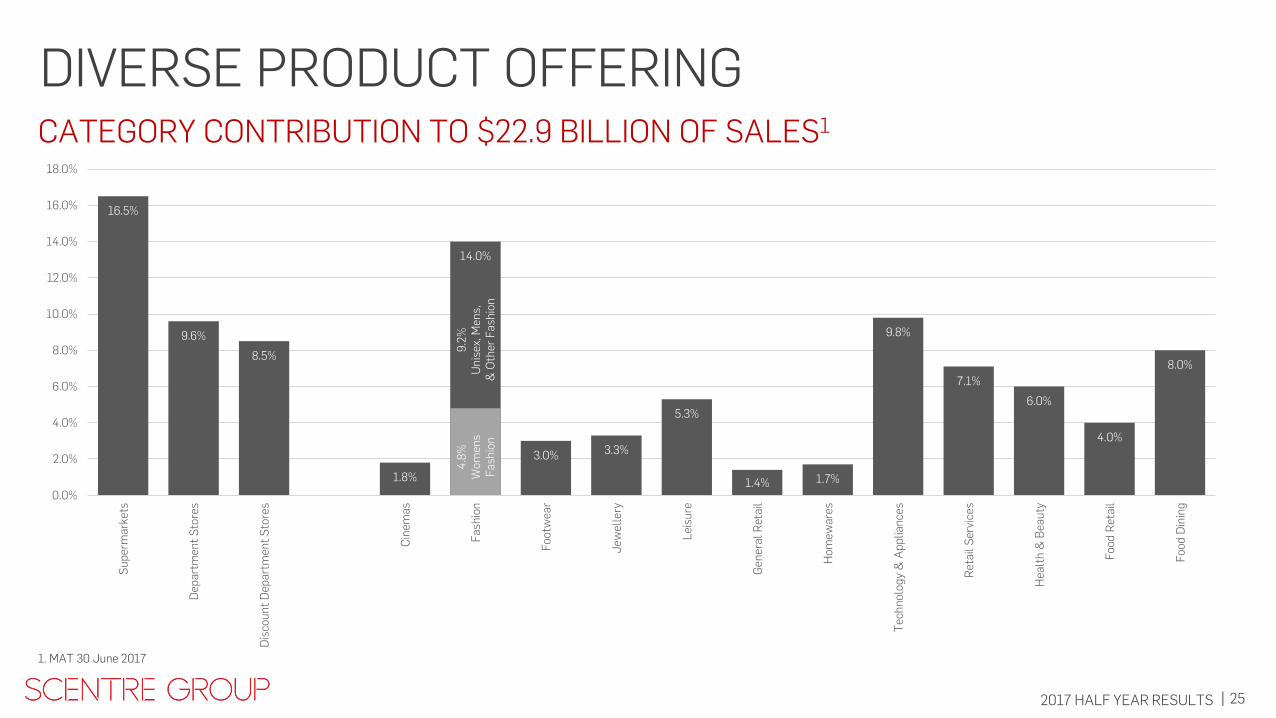
DIVERSE PRODUCT OFFERING CATEGORY CONTRIBUTION TO $22.9 BILLION OF SALES1
16.5%
9.6%
8.5%
1.8%
14.0%
3.0% 3.3%
5.3%
1.4% 1.7%
9.8%
7.1%
6.0%
4.0%
8.0%
0.0%
2.0%
4.0%
6.0%
8.0%
10.0%
12.0%
14.0%
16.0%
18.0%
Su
per
ma
rke
ts
Dep
artm
ent
Sto
res
Dis
cou
nt
Dep
art
men
t S
tore
s
Cin
ema
s
Fa
shio
n
Fo
otw
ear
Je
we
lle
ry
Lei
sure
Ge
ner
al
Ret
ail
Ho
me
war
es
Tec
hn
olo
gy
& A
pp
lian
ces
Re
tail
Ser
vice
s
Hea
lth
& B
eau
ty
Fo
od
Ret
ail
Fo
od
Din
ing
4.8
%
Wo
men
s F
ash
ion
9.2
%
Un
isex
, Men
s,
& O
ther
Fa
shio
n
1. MAT 30 June 2017
26 2017 HALF YEAR RESULTS |
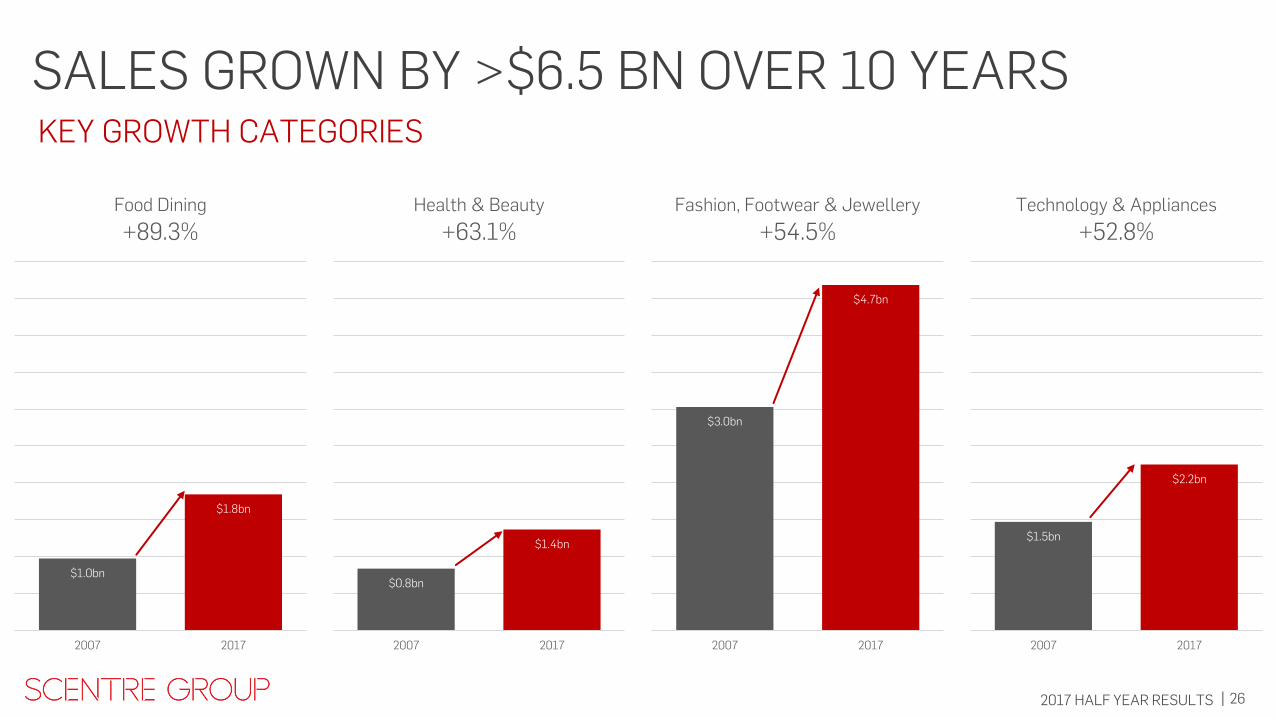
$1.0bn
$1.8bn
$0.8bn
$1.4bn
$3.0bn
$4.7bn
$1.5bn
$2.2bn
$3.0bn
$4.7bn
2007 2017
Fashion, Footwear & Jewellery
+54.5%
$1.5bn
$2.2bn
2007 2017
Technology & Appliances
+52.8%
$0.8bn
$1.4bn
2007 2017
Health & Beauty
+63.1%
$1.0bn
$1.8bn
2007 2017
Food Dining
+89.3%
SALES GROWN BY >$6.5 BN OVER 10 YEARS KEY GROWTH CATEGORIES
27 2017 HALF YEAR RESULTS |
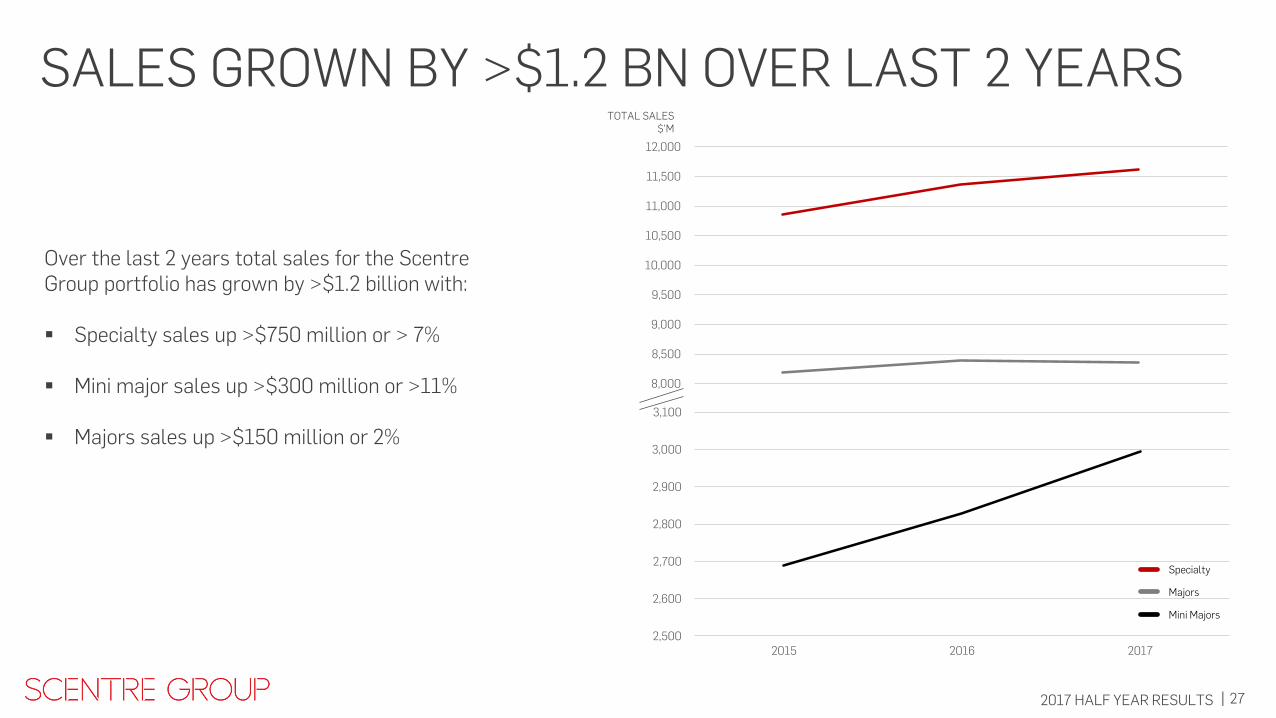
SALES GROWN BY >$1.2 BN OVER LAST 2 YEARS
Over the last 2 years total sales for the Scentre Group portfolio has grown by >$1.2 billion with: Specialty sales up >$750 million or > 7%
Mini major sales up >$300 million or >11%
Majors sales up >$150 million or 2%
8,000
8,500
9,000
9,500
10,000
10,500
11,000
11,500
12,000
2,500
2,600
2,700
2,800
2,900
3,000
3,100
2015 2016 2017
TOTAL SALES $’M
Specialty
Majors
Mini Majors
28 2017 HALF YEAR RESULTS |
Sales A$11,250psm
7,000
7,500
8,000
8,500
9,000
9,500
10,000
10,500
11,000
11,500
199
7
199
8
199
9
20
00
20
01
20
02
20
03
20
04
20
05
20
06
20
07
20
08
20
09
20
10
20
11
20
12
20
13
20
14
20
15
20
16
20
17
800
900
1,000
1,100
1,200
1,300
1,400
1,500
1,600
1,700
Rent PSM Sales PSM
Specialty Rent PSM
Specialty Sales PSM
Rent A$1,615psm
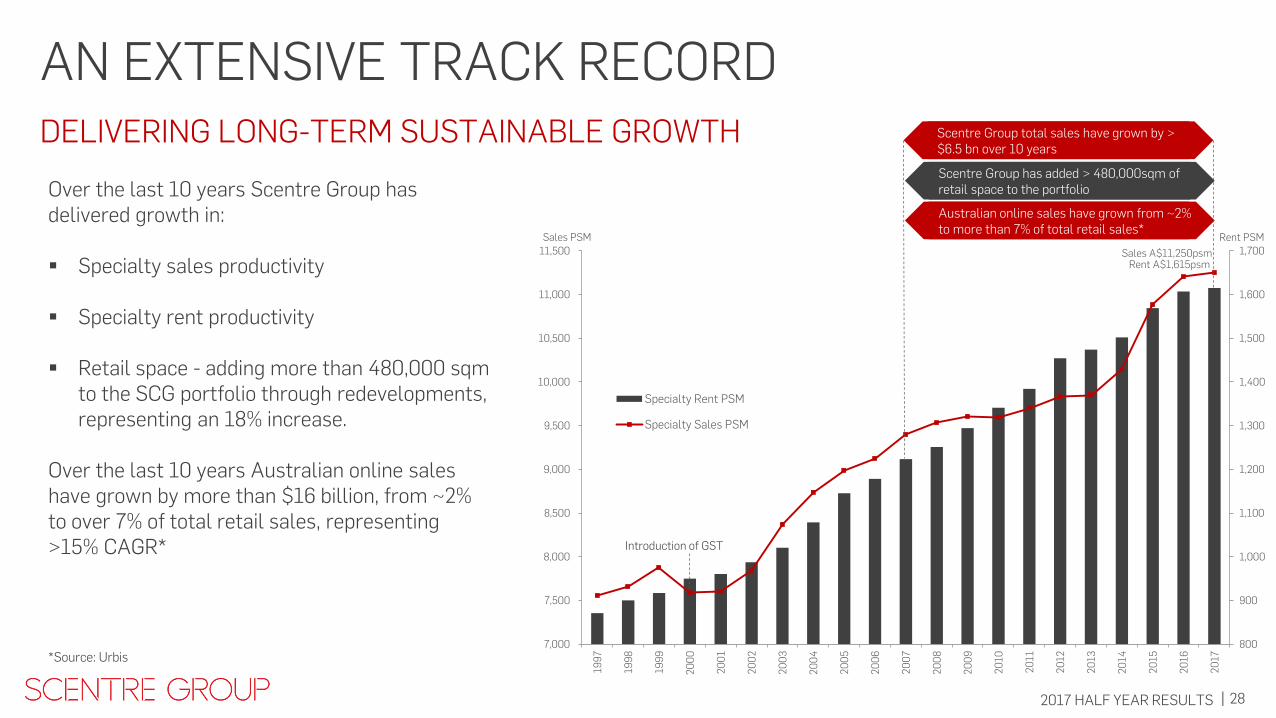
AN EXTENSIVE TRACK RECORD DELIVERING LONG-TERM SUSTAINABLE GROWTH
Over the last 10 years Scentre Group has delivered growth in: Specialty sales productivity
Specialty rent productivity Retail space - adding more than 480,000 sqm
to the SCG portfolio through redevelopments, representing an 18% increase.
Over the last 10 years Australian online sales have grown by more than $16 billion, from ~2% to over 7% of total retail sales, representing >15% CAGR*
*Source: Urbis
Introduction of GST
Australian online sales have grown from ~2% to more than 7% of total retail sales*
Scentre Group total sales have grown by > $6.5 bn over 10 years
Scentre Group has added > 480,000sqm of retail space to the portfolio
29 2017 HALF YEAR RESULTS |
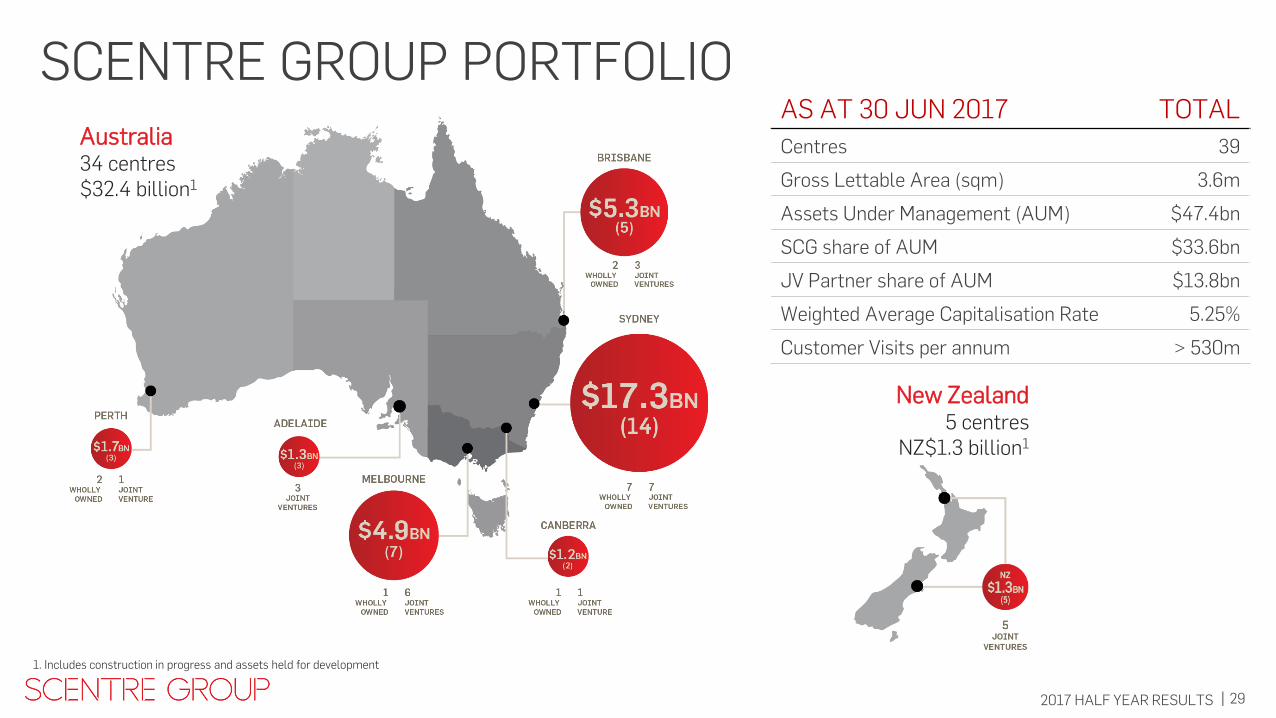
New Zealand 5 centres
NZ$1.3 billion1
Australia 34 centres $32.4 billion1
AS AT 30 JUN 2017 TOTAL
Centres 39
Gross Lettable Area (sqm) 3.6m
Assets Under Management (AUM) $47.4bn
SCG share of AUM $33.6bn
JV Partner share of AUM $13.8bn
Weighted Average Capitalisation Rate 5.25%
Customer Visits per annum > 530m
SCENTRE GROUP PORTFOLIO
1. Includes construction in progress and assets held for development

30 2017 HALF YEAR RESULTS |
FINANCE UPDATE MARK BLOOM
CFO
Westfield Warringah Mall
31 2017 HALF YEAR RESULTS |
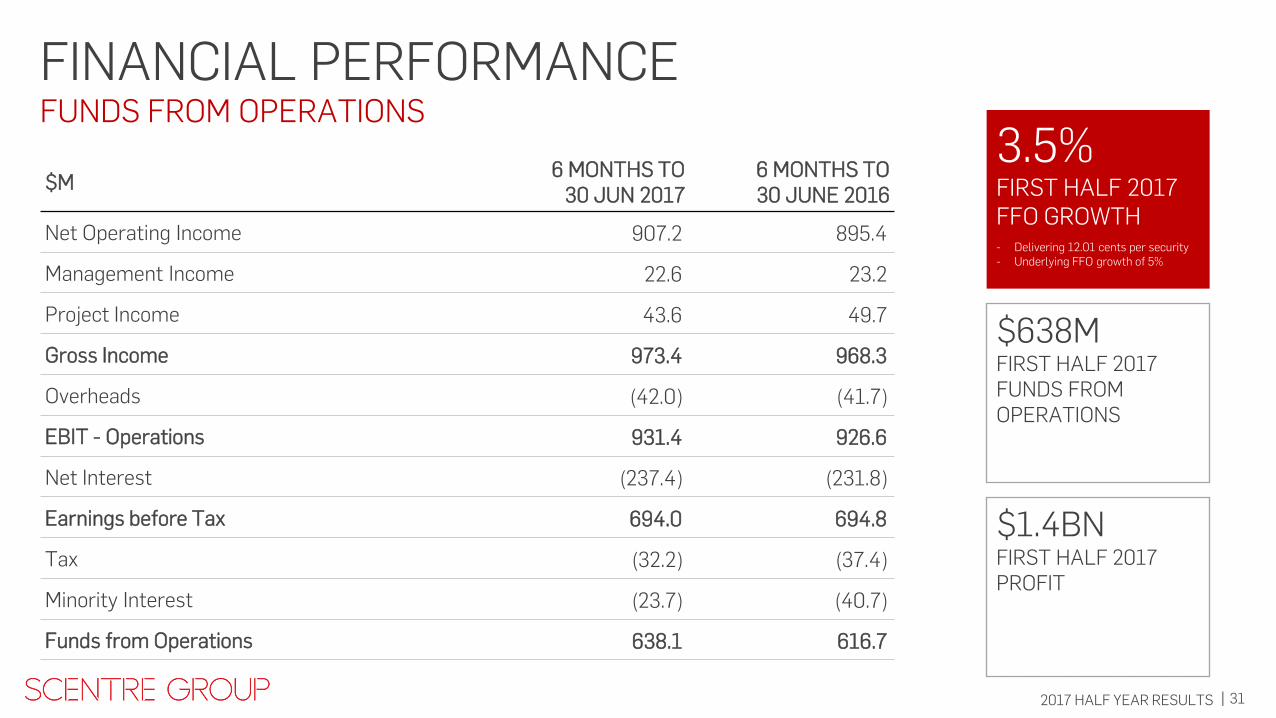
FINANCIAL PERFORMANCE
3.5% FIRST HALF 2017 FFO GROWTH
- Delivering 12.01 cents per security - Underlying FFO growth of 5%
$638M FIRST HALF 2017 FUNDS FROM OPERATIONS
$1.4BN FIRST HALF 2017 PROFIT
$M 6 MONTHS TO
30 JUN 2017 6 MONTHS TO 30 JUNE 2016
Net Operating Income 907.2 895.4
Management Income 22.6 23.2
Project Income 43.6 49.7
Gross Income 973.4 968.3
Overheads (42.0) (41.7)
EBIT - Operations 931.4 926.6
Net Interest (237.4) (231.8)
Earnings before Tax 694.0 694.8
Tax (32.2) (37.4)
Minority Interest (23.7) (40.7)
Funds from Operations 638.1 616.7
FUNDS FROM OPERATIONS
32 2017 HALF YEAR RESULTS |
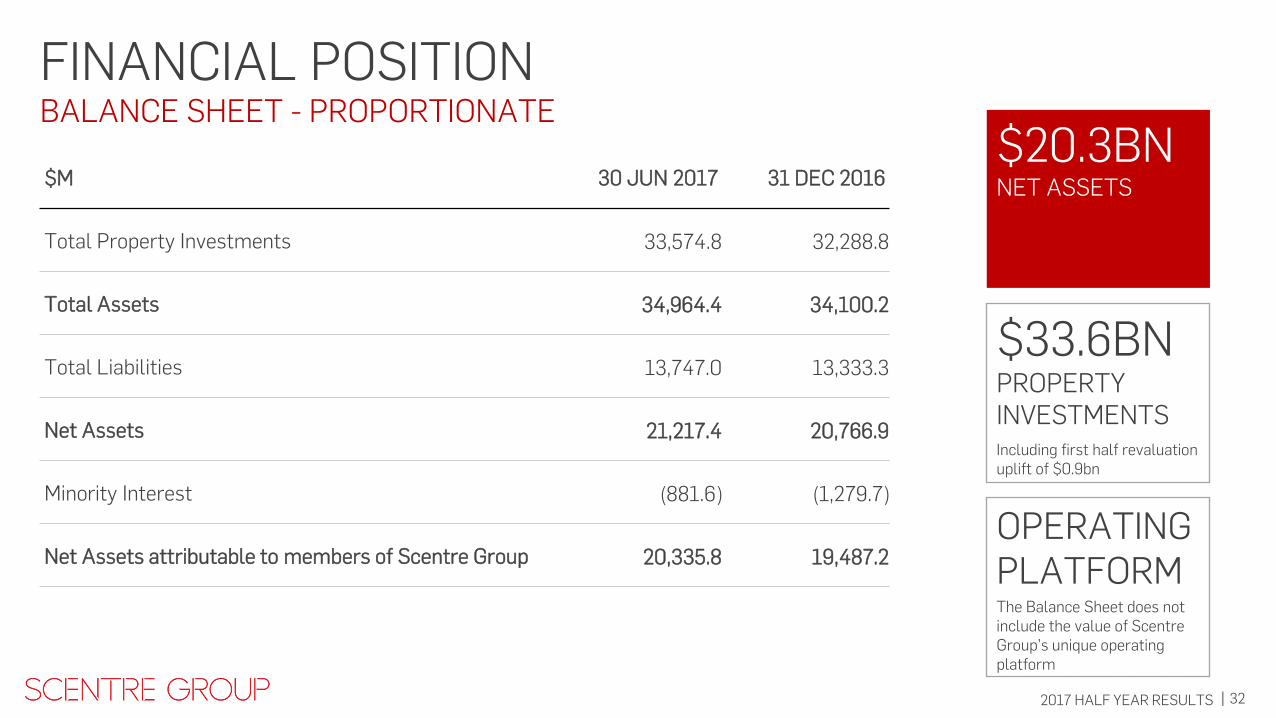
FINANCIAL POSITION
$20.3BN NET ASSETS
$33.6BN PROPERTY INVESTMENTS
Including first half revaluation uplift of $0.9bn
$M 30 JUN 2017 31 DEC 2016
Total Property Investments 33,574.8 32,288.8
Total Assets 34,964.4 34,100.2
Total Liabilities 13,747.0 13,333.3
Net Assets 21,217.4 20,766.9
Minority Interest (881.6) (1,279.7)
Net Assets attributable to members of Scentre Group 20,335.8 19,487.2 OPERATING PLATFORM
The Balance Sheet does not include the value of Scentre Group’s unique operating platform
BALANCE SHEET - PROPORTIONATE
33 2017 HALF YEAR RESULTS |
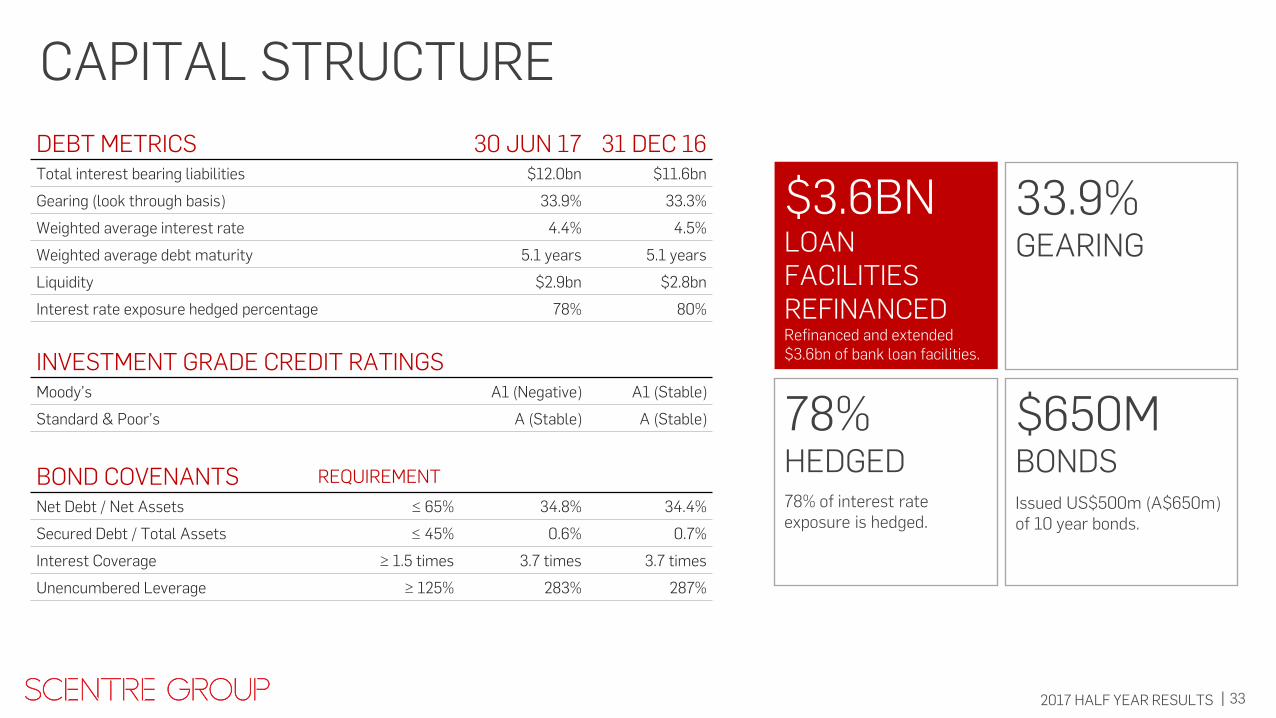
CAPITAL STRUCTURE
DEBT METRICS 30 JUN 17 31 DEC 16 Total interest bearing liabilities $12.0bn $11.6bn
Gearing (look through basis) 33.9% 33.3%
Weighted average interest rate 4.4% 4.5%
Weighted average debt maturity 5.1 years 5.1 years
Liquidity $2.9bn $2.8bn
Interest rate exposure hedged percentage 78% 80%
INVESTMENT GRADE CREDIT RATINGS Moody’s A1 (Negative) A1 (Stable)
Standard & Poor’s A (Stable) A (Stable)
BOND COVENANTS REQUIREMENT
Net Debt / Net Assets ≤ 65% 34.8% 34.4%
Secured Debt / Total Assets ≤ 45% 0.6% 0.7%
Interest Coverage ≥ 1.5 times 3.7 times 3.7 times
Unencumbered Leverage ≥ 125% 283% 287%
$3.6BN LOAN FACILITIES REFINANCED Refinanced and extended $3.6bn of bank loan facilities.
33.9% GEARING
78% HEDGED
78% of interest rate exposure is hedged.
$650M BONDS
Issued US$500m (A$650m) of 10 year bonds.

34 2017 HALF YEAR RESULTS |
CAPITAL MANAGEMENT
FACILITIES & LIQUIDITY1
MATURITY PROFILE1 A$bn
$2.9BN LIQUIDITY
5.1 YEARS Weighted average debt maturity
DEBT MATURITIES
No debt maturities until July 2018
1. Foreign currency bonds at fully hedged A$ equivalent face value.
30 JUNE 17 % $BN1
Bonds
USD 24% 3.5
EUR 26% 3.8
GBP 10% 1.5
AUD 4% 0.6
Total 64% 9.4
Bank Facilities
Drawn 17% 2.5
Undrawn 19% 2.7
Total 36% 5.2
Total Facilities 100% 14.6
Less Drawn (11.9)
Plus Cash 0.2
Total Liquidity 2.9
0.0
1.0
2.0
3.0
2017 2018 2019 2020 2021 2022 2023 2024 2025 2026 2027
BondsDrawn FacilitiesUndrawn Facilities
35 2017 HALF YEAR RESULTS |
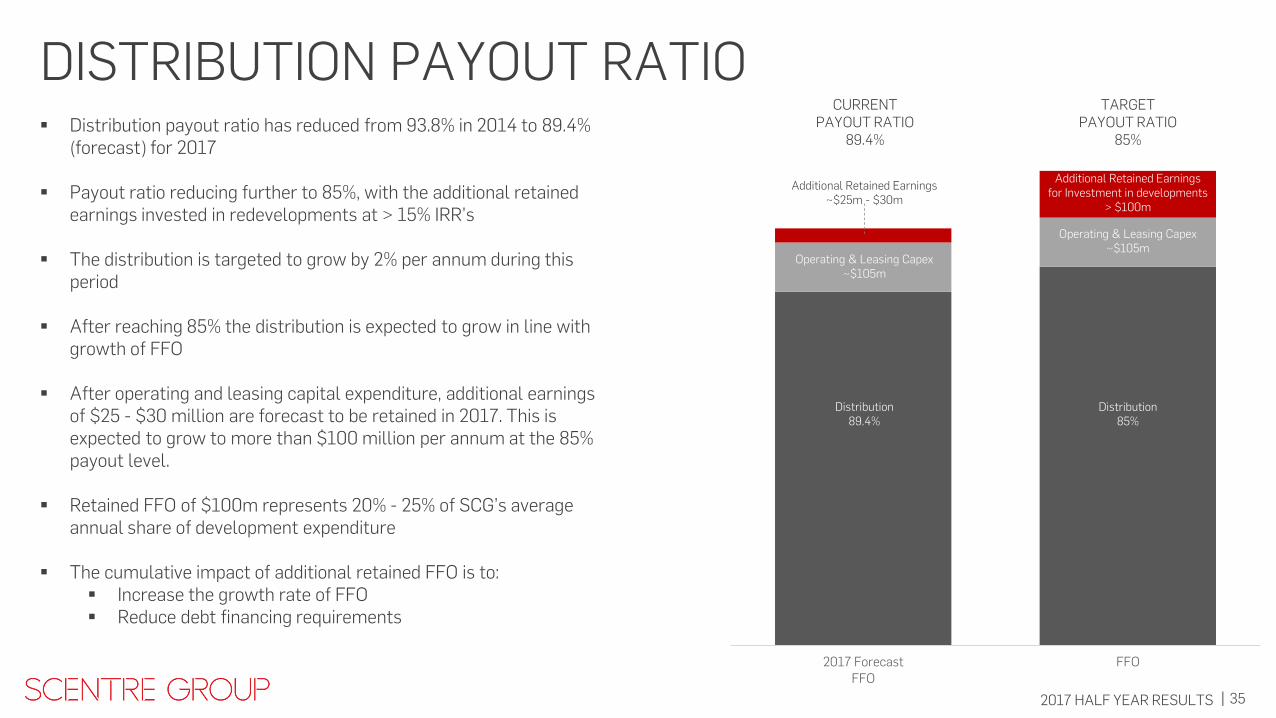
DISTRIBUTION PAYOUT RATIO Distribution payout ratio has reduced from 93.8% in 2014 to 89.4%
(forecast) for 2017
Payout ratio reducing further to 85%, with the additional retained earnings invested in redevelopments at > 15% IRR’s
The distribution is targeted to grow by 2% per annum during this period
After reaching 85% the distribution is expected to grow in line with growth of FFO
After operating and leasing capital expenditure, additional earnings of $25 - $30 million are forecast to be retained in 2017. This is expected to grow to more than $100 million per annum at the 85% payout level.
Retained FFO of $100m represents 20% - 25% of SCG’s average annual share of development expenditure
The cumulative impact of additional retained FFO is to: Increase the growth rate of FFO Reduce debt financing requirements
2017 Forecast
FFO
FFO
CURRENT PAYOUT RATIO
89.4%
TARGET PAYOUT RATIO
85%
Distribution 89.4%
Distribution 85%
Operating & Leasing Capex ~$105m
Operating & Leasing Capex ~$105m
Additional Retained Earnings ~$25m - $30m
Additional Retained Earnings for Investment in developments
> $100m
36 2017 HALF YEAR RESULTS |
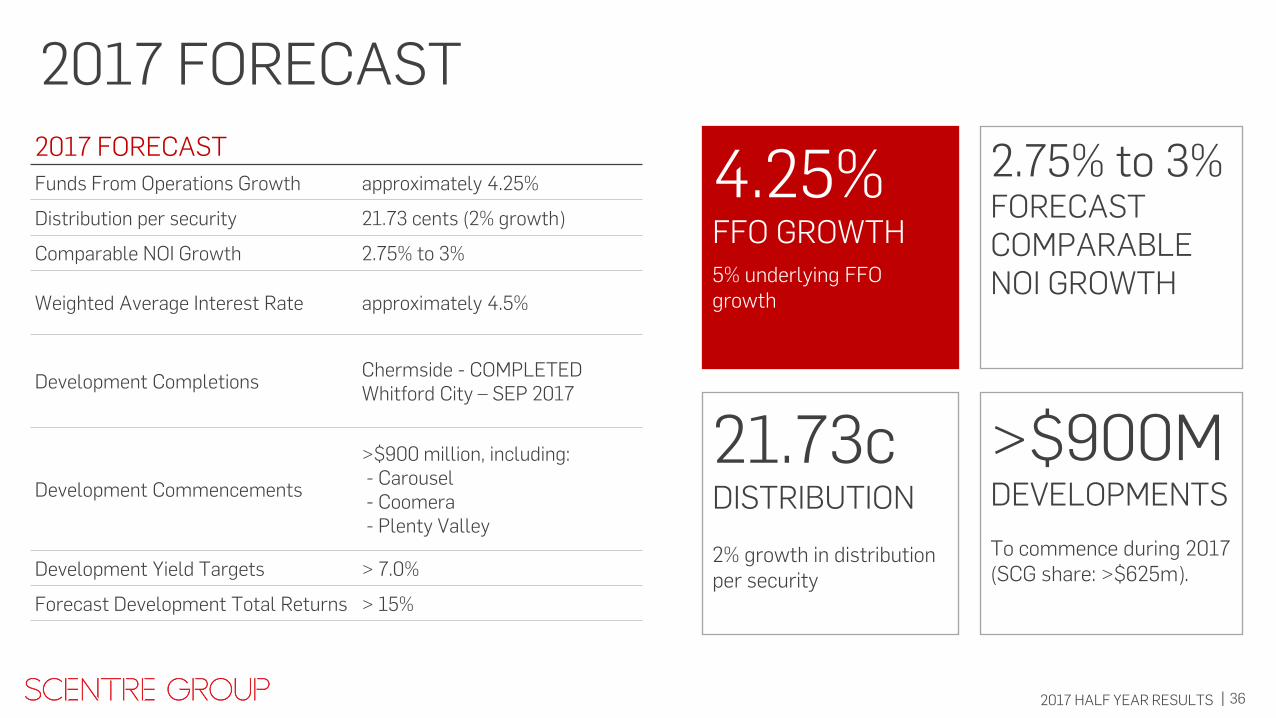
2017 FORECAST 2017 FORECAST
Funds From Operations Growth approximately 4.25%
Distribution per security 21.73 cents (2% growth)
Comparable NOI Growth 2.75% to 3%
Weighted Average Interest Rate approximately 4.5%
Development Completions Chermside - COMPLETED Whitford City – SEP 2017
Development Commencements
>$900 million, including: - Carousel - Coomera - Plenty Valley
Development Yield Targets > 7.0%
Forecast Development Total Returns > 15%
4.25% FFO GROWTH
5% underlying FFO growth
21.73c DISTRIBUTION 2% growth in distribution per security
>$900M DEVELOPMENTS
To commence during 2017 (SCG share: >$625m).
2.75% to 3% FORECAST COMPARABLE NOI GROWTH
37 2017 HALF YEAR RESULTS |
APPENDIX
Westfield Warringah Mall
38 2017 HALF YEAR RESULTS |
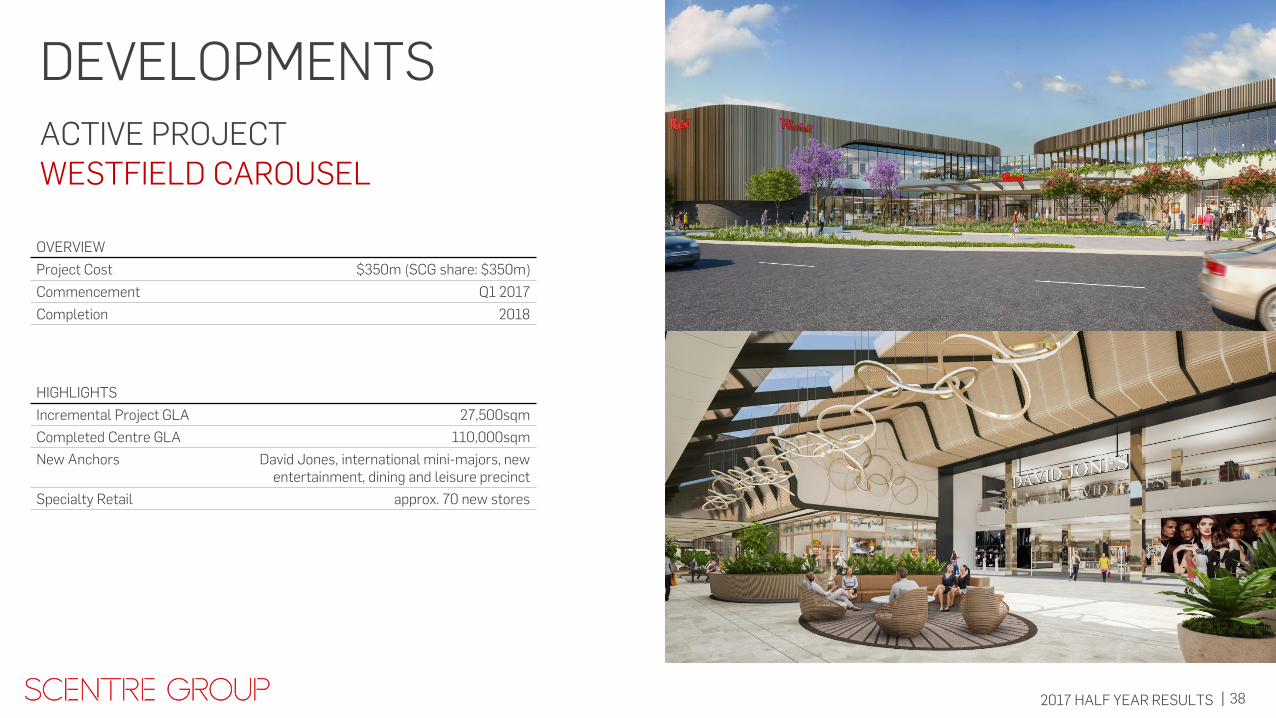
OVERVIEW
Project Cost $350m (SCG share: $350m)
Commencement Q1 2017
Completion 2018
HIGHLIGHTS
Incremental Project GLA 27,500sqm
Completed Centre GLA 110,000sqm
New Anchors David Jones, international mini-majors, new entertainment, dining and leisure precinct
Specialty Retail approx. 70 new stores
DEVELOPMENTS
WESTFIELD CAROUSEL ACTIVE PROJECT
39 2017 HALF YEAR RESULTS |
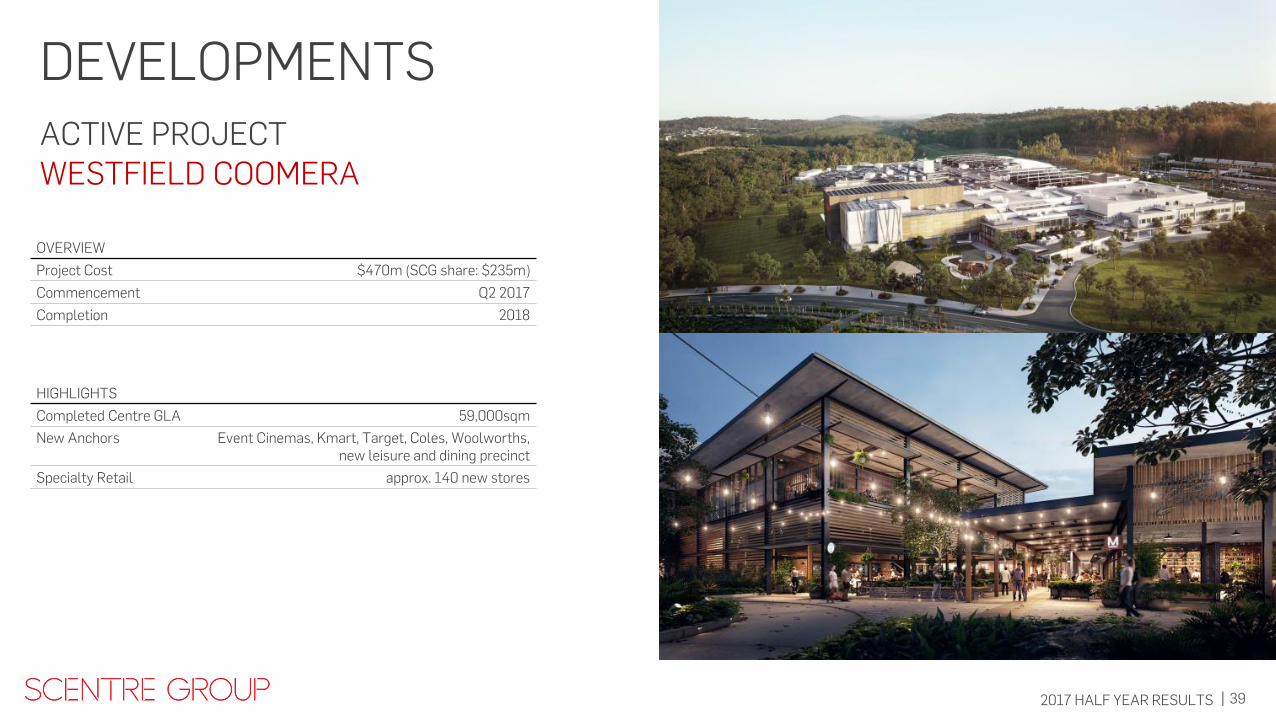
OVERVIEW
Project Cost $470m (SCG share: $235m)
Commencement Q2 2017
Completion 2018
HIGHLIGHTS
Completed Centre GLA 59,000sqm
New Anchors Event Cinemas, Kmart, Target, Coles, Woolworths, new leisure and dining precinct
Specialty Retail approx. 140 new stores
DEVELOPMENTS ACTIVE PROJECT WESTFIELD COOMERA
40 2017 HALF YEAR RESULTS |
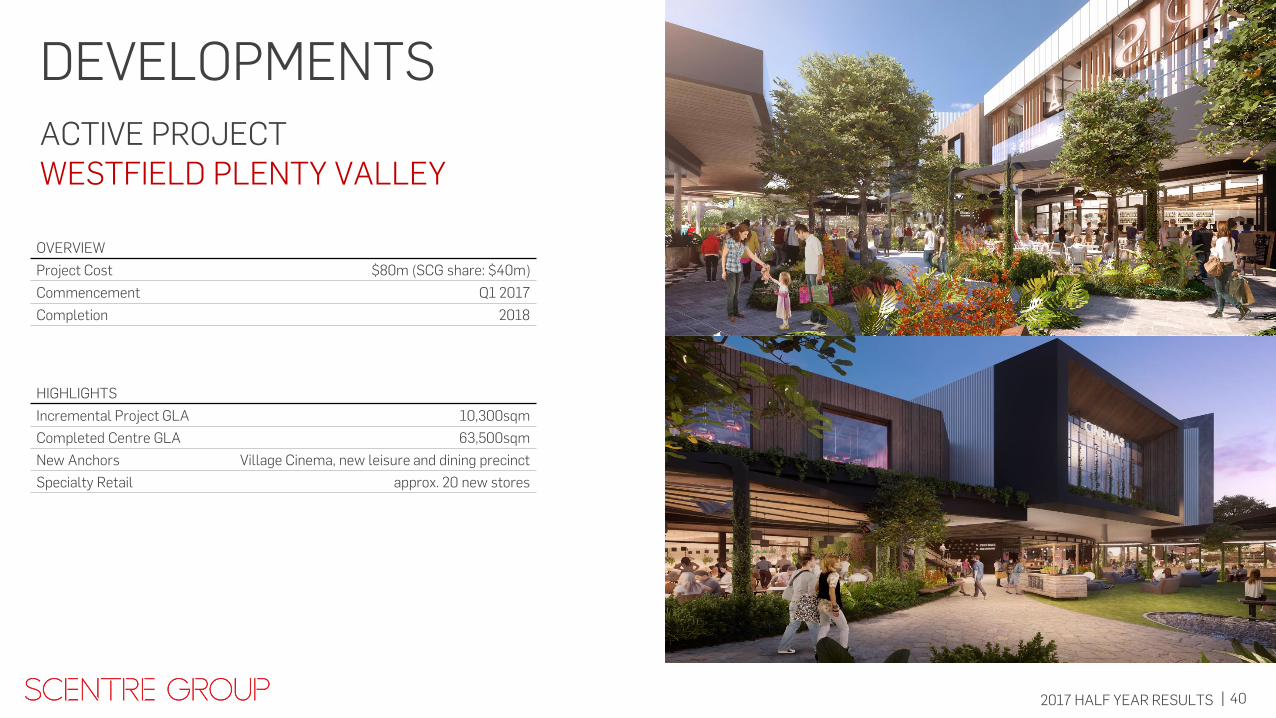
OVERVIEW
Project Cost $80m (SCG share: $40m)
Commencement Q1 2017
Completion 2018
HIGHLIGHTS
Incremental Project GLA 10,300sqm
Completed Centre GLA 63,500sqm
New Anchors Village Cinema, new leisure and dining precinct
Specialty Retail approx. 20 new stores
ACTIVE PROJECT WESTFIELD PLENTY VALLEY
DEVELOPMENTS
41 2017 HALF YEAR RESULTS |
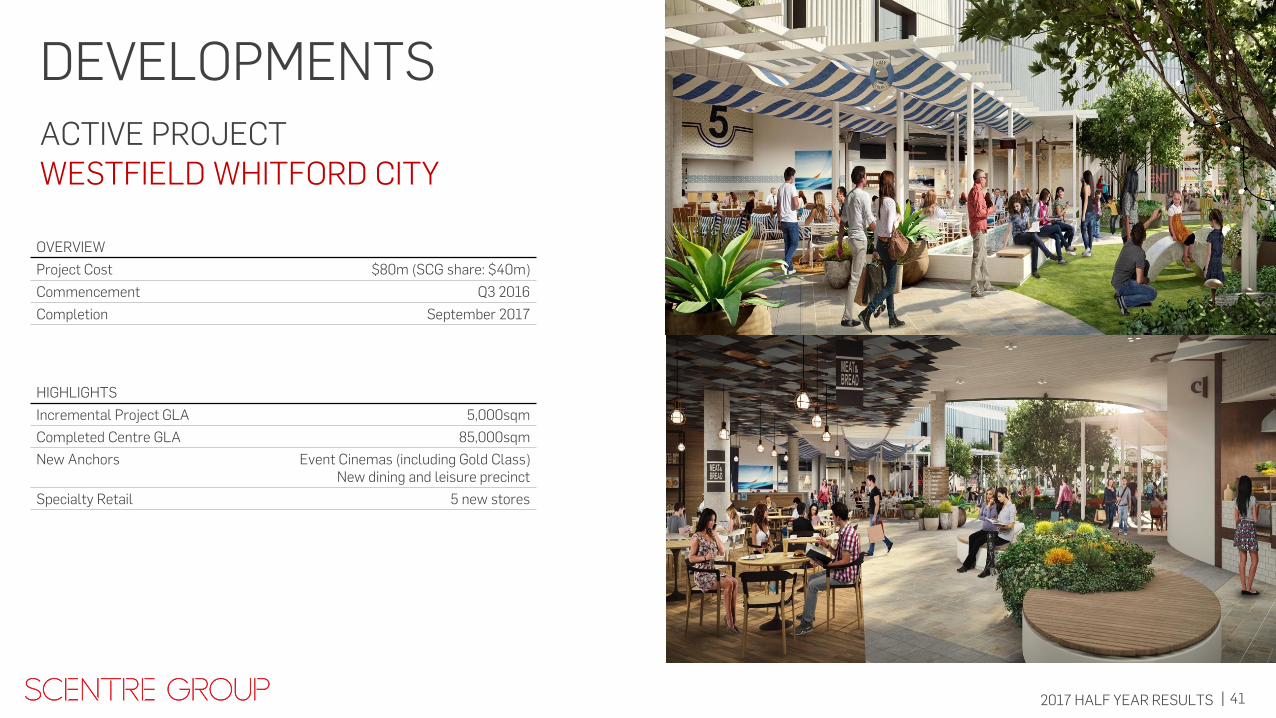
OVERVIEW
Project Cost $80m (SCG share: $40m)
Commencement Q3 2016
Completion September 2017
HIGHLIGHTS
Incremental Project GLA 5,000sqm
Completed Centre GLA 85,000sqm
New Anchors Event Cinemas (including Gold Class) New dining and leisure precinct
Specialty Retail 5 new stores
DEVELOPMENTS
WESTFIELD WHITFORD CITY ACTIVE PROJECT
42 2017 HALF YEAR RESULTS |
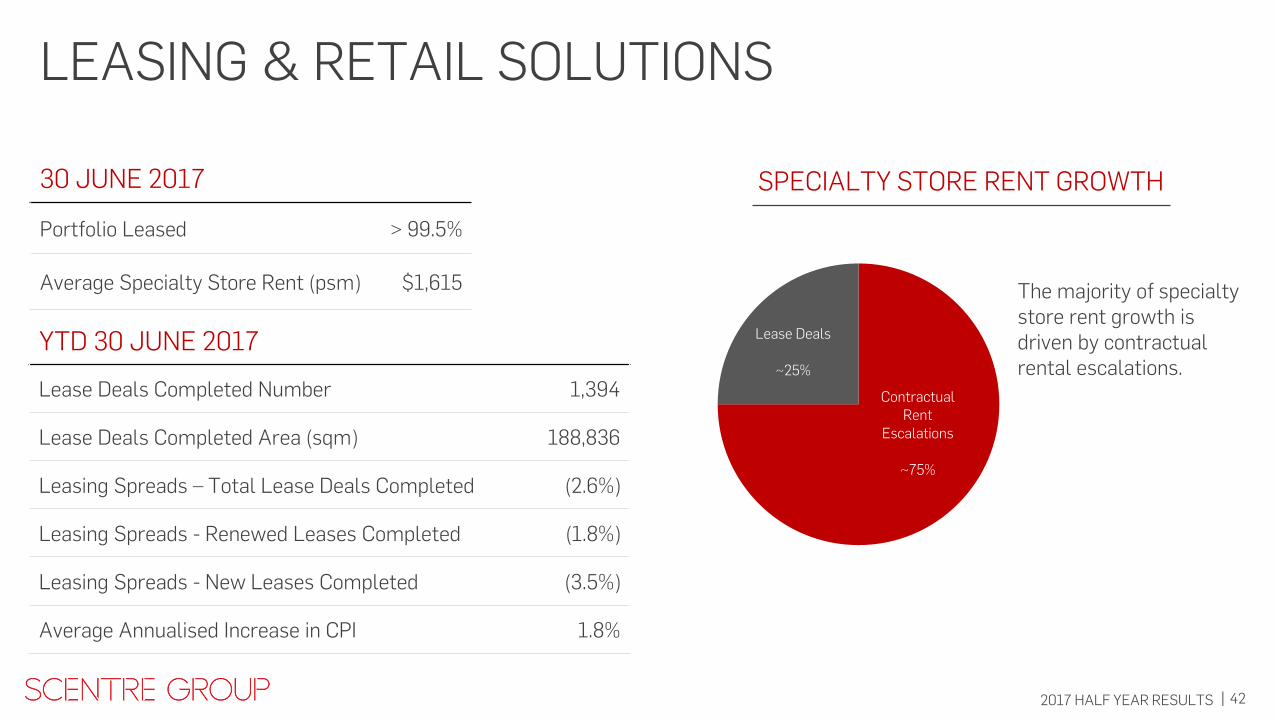
LEASING & RETAIL SOLUTIONS
YTD 30 JUNE 2017
Lease Deals Completed Number 1,394
Lease Deals Completed Area (sqm) 188,836
Leasing Spreads – Total Lease Deals Completed (2.6%)
Leasing Spreads - Renewed Leases Completed (1.8%)
Leasing Spreads - New Leases Completed (3.5%)
Average Annualised Increase in CPI 1.8%
30 JUNE 2017
Portfolio Leased > 99.5%
Average Specialty Store Rent (psm) $1,615
Contractual Rent
Escalations
~75%
Lease Deals
~25%
SPECIALTY STORE RENT GROWTH
The majority of specialty store rent growth is driven by contractual rental escalations.
43 2017 HALF YEAR RESULTS |
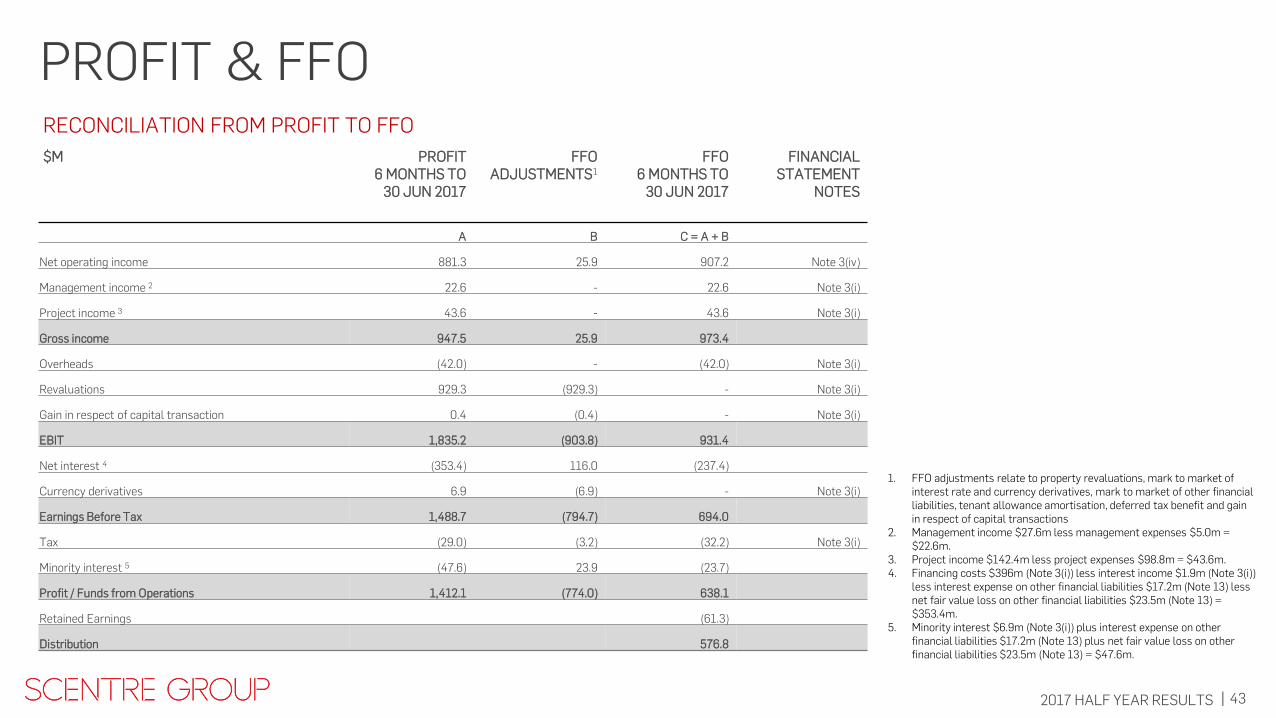
PROFIT & FFO
1. FFO adjustments relate to property revaluations, mark to market of interest rate and currency derivatives, mark to market of other financial liabilities, tenant allowance amortisation, deferred tax benefit and gain in respect of capital transactions
2. Management income $27.6m less management expenses $5.0m = $22.6m.
3. Project income $142.4m less project expenses $98.8m = $43.6m. 4. Financing costs $396m (Note 3(i)) less interest income $1.9m (Note 3(i))
less interest expense on other financial liabilities $17.2m (Note 13) less net fair value loss on other financial liabilities $23.5m (Note 13) = $353.4m.
5. Minority interest $6.9m (Note 3(i)) plus interest expense on other financial liabilities $17.2m (Note 13) plus net fair value loss on other financial liabilities $23.5m (Note 13) = $47.6m.
RECONCILIATION FROM PROFIT TO FFO
$M PROFIT 6 MONTHS TO
30 JUN 2017
FFO ADJUSTMENTS1
FFO 6 MONTHS TO
30 JUN 2017
FINANCIAL STATEMENT
NOTES
A B C = A + B
Net operating income 881.3 25.9 907.2 Note 3(iv)
Management income 2 22.6 - 22.6 Note 3(i)
Project income 3 43.6 - 43.6 Note 3(i)
Gross income 947.5 25.9 973.4
Overheads (42.0) - (42.0) Note 3(i)
Revaluations 929.3 (929.3) - Note 3(i)
Gain in respect of capital transaction 0.4 (0.4) - Note 3(i)
EBIT 1,835.2 (903.8) 931.4
Net interest 4 (353.4) 116.0 (237.4)
Currency derivatives 6.9 (6.9) - Note 3(i)
Earnings Before Tax 1,488.7 (794.7) 694.0
Tax (29.0) (3.2) (32.2) Note 3(i)
Minority interest 5 (47.6) 23.9 (23.7)
Profit / Funds from Operations 1,412.1 (774.0) 638.1
Retained Earnings (61.3)
Distribution 576.8
44 2017 HALF YEAR RESULTS |
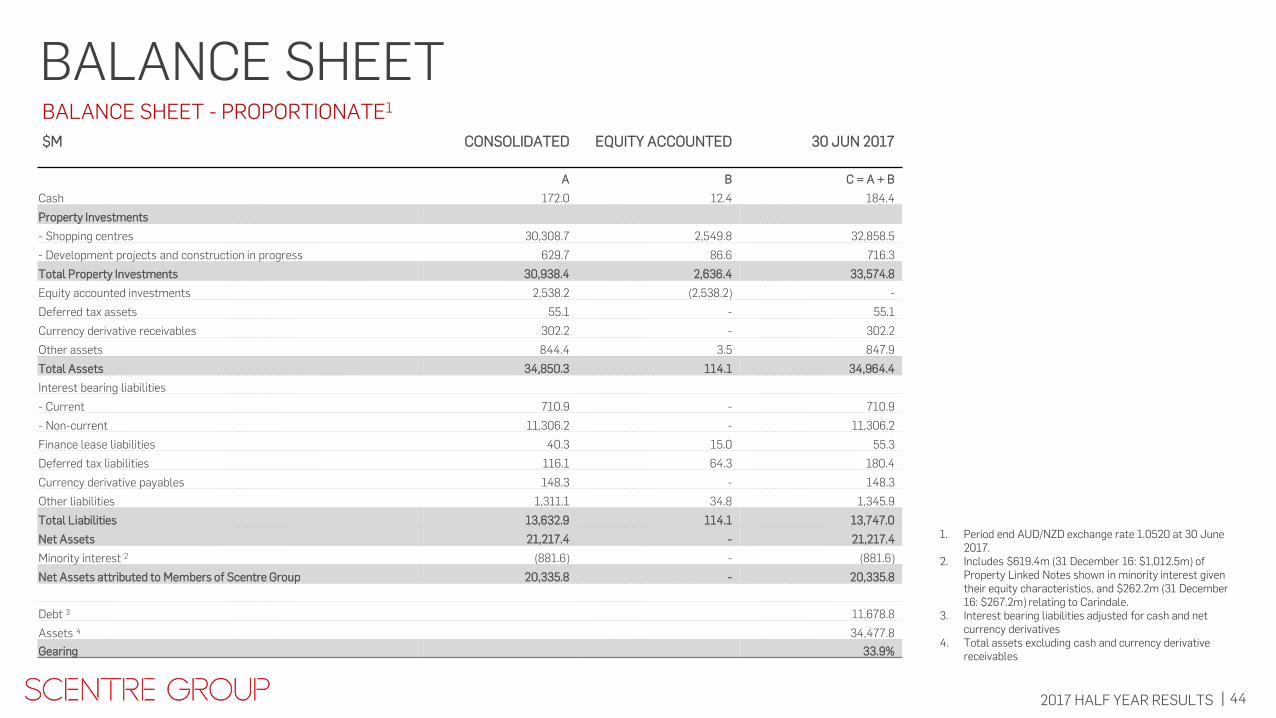
1. Period end AUD/NZD exchange rate 1.0520 at 30 June 2017.
2. Includes $619.4m (31 December 16: $1,012.5m) of Property Linked Notes shown in minority interest given their equity characteristics, and $262.2m (31 December 16: $267.2m) relating to Carindale.
3. Interest bearing liabilities adjusted for cash and net currency derivatives
4. Total assets excluding cash and currency derivative receivables
BALANCE SHEET - PROPORTIONATE1
$M CONSOLIDATED EQUITY ACCOUNTED 30 JUN 2017
A B C = A + B
Cash 172.0 12.4 184.4
Property Investments
- Shopping centres 30,308.7 2,549.8 32,858.5
- Development projects and construction in progress 629.7 86.6 716.3
Total Property Investments 30,938.4 2,636.4 33,574.8
Equity accounted investments 2,538.2 (2,538.2) -
Deferred tax assets 55.1 - 55.1
Currency derivative receivables 302.2 - 302.2
Other assets 844.4 3.5 847.9
Total Assets 34,850.3 114.1 34,964.4
Interest bearing liabilities
- Current 710.9 - 710.9
- Non-current 11,306.2 - 11,306.2
Finance lease liabilities 40.3 15.0 55.3
Deferred tax liabilities 116.1 64.3 180.4
Currency derivative payables 148.3 - 148.3
Other liabilities 1,311.1 34.8 1,345.9
Total Liabilities 13,632.9 114.1 13,747.0
Net Assets 21,217.4 - 21,217.4
Minority interest 2 (881.6) - (881.6)
Net Assets attributed to Members of Scentre Group 20,335.8 - 20,335.8
Debt 3 11,678.8
Assets 4 34,477.8
Gearing 33.9%
BALANCE SHEET
45 2017 HALF YEAR RESULTS |
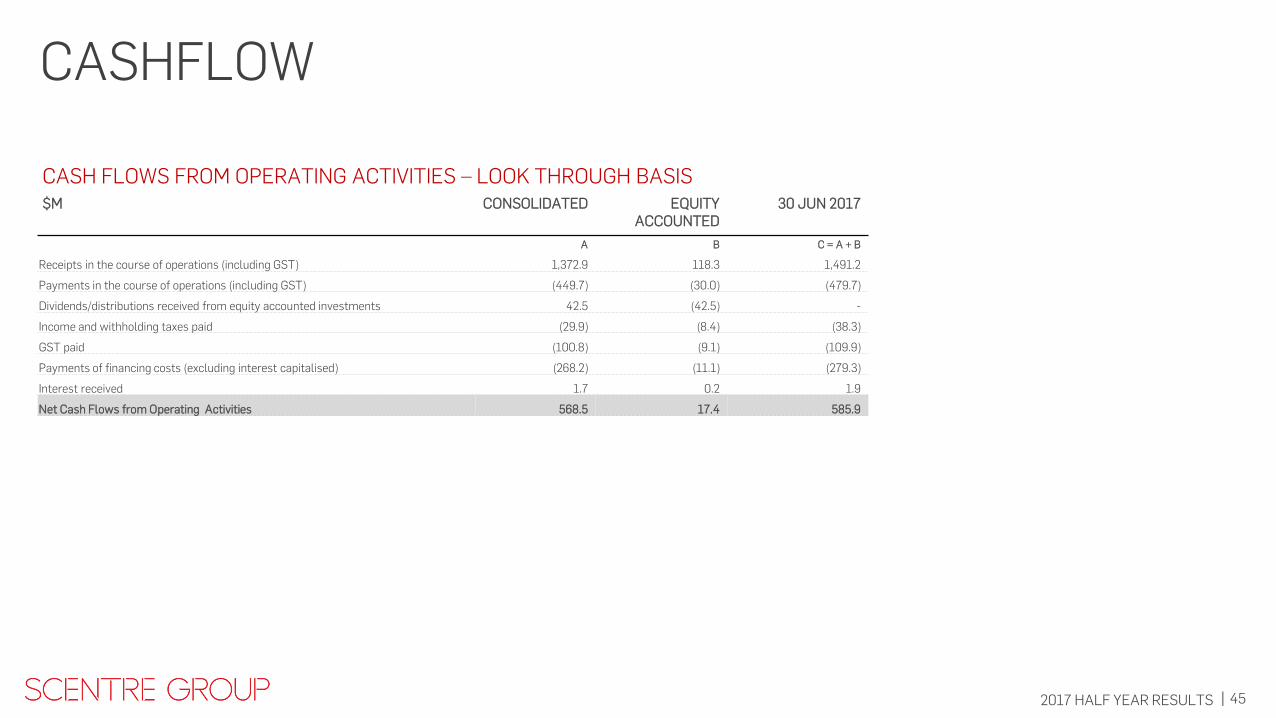
CASH FLOWS FROM OPERATING ACTIVITIES – LOOK THROUGH BASIS
$M CONSOLIDATED EQUITY ACCOUNTED
30 JUN 2017
A B C = A + B
Receipts in the course of operations (including GST) 1,372.9 118.3 1,491.2
Payments in the course of operations (including GST) (449.7) (30.0) (479.7)
Dividends/distributions received from equity accounted investments 42.5 (42.5) -
Income and withholding taxes paid (29.9) (8.4) (38.3)
GST paid (100.8) (9.1) (109.9)
Payments of financing costs (excluding interest capitalised) (268.2) (11.1) (279.3)
Interest received 1.7 0.2 1.9
Net Cash Flows from Operating Activities 568.5 17.4 585.9
CASHFLOW

46 2017 HALF YEAR RESULTS |
$ FIXED RATE DEBT DERIVATIVES $ DEBT PAYABLE $ SWAP PAYABLE NZ$ SWAP PAYABLE NZ$ COLLAR PAYABLE
31 DECEMBER1 $M FIXED RATE $M FIXED RATE NZ$M FIXED RATE NZ$M STRIKE RATE
2017 (580.0) 3.25% (8,528.5) 2.88% (450.0) 3.30% (70.0) 3.39%/5.25%
2018 (580.0) 3.25% (8,115.0) 2.86% (360.0) 3.26% (70.0) 3.39%/5.25%
2019 (430.0) 3.31% (7,255.0) 2.82% (380.0) 3.34%
2020 (430.0) 3.31% (5,745.0) 2.86% (330.0) 3.31%
2021 (30.0) 3.81% (5,295.0) 2.89% (250.0) 3.24%
2022 (4,285.0) 2.86% (200.0) 3.19%
2023 (3,015.0) 2.86% (150.0) 3.17%
2024 (2,000.0) 2.89% (100.0) 3.22%
2025 (1,000.0) 3.05% (50.0) 3.29%
78% Hedged at 30 June 2017
1. As at 30 June 2017. All rates exclude borrowing margin
INTEREST RATE HEDGING PROFILE
47 2017 HALF YEAR RESULTS |
IMPORTANT NOTICE All amounts in Australian dollars unless otherwise specified. The financial information included in this document is based on the Scentre Group’s IFRS financial statements. Non IFRS financial information included in this document has not been audited or reviewed. This document contains forward-looking statements, including statements regarding future earnings and distributions that are based on information and assumptions available to us as of the date of this document. Actual results, performance or achievements could be significantly different from those expressed in, or implied by, these forward-looking statements. These forward-looking statements are not guarantees or predictions of future performance, and involve known and unknown risks, uncertainties and other factors, many of which are beyond our control, and which may cause actual results to differ materially from those expressed in the statements contained in this document. You should not place undue reliance on these forward-looking statements. Except as required by law or regulation (including the ASX Listing Rules) we undertake no obligation to update these forward-looking statements. SCENTRE GROUP LIMITED ABN 66 001 671 496 SCENTRE MANAGEMENT LIMITED ABN 41 001 670 579 AFS Licence No: 230329 as responsible entity of Scentre Group Trust 1 ARSN 090 849 746 RE1 LIMITED ABN 80 145 743 862 AFS Licence No: 380202 as responsible entity of Scentre Group Trust 2 ARSN 146 934 536 RE2 LIMITED ABN 41 145 744 065 AFS Licence No: 380203 as responsible entity of Scentre Group Trust 3 ARSN 146 934 652