Embed Size (px)
Citation preview

Haig Stoddard, Industry Analyst Insight & Analysis from
WardsAuto North American Barometer and 6-Month Outlook
Q4 2014/Q1 2015
Haig Stoddard, Industry Analyst Insight & Analysis from
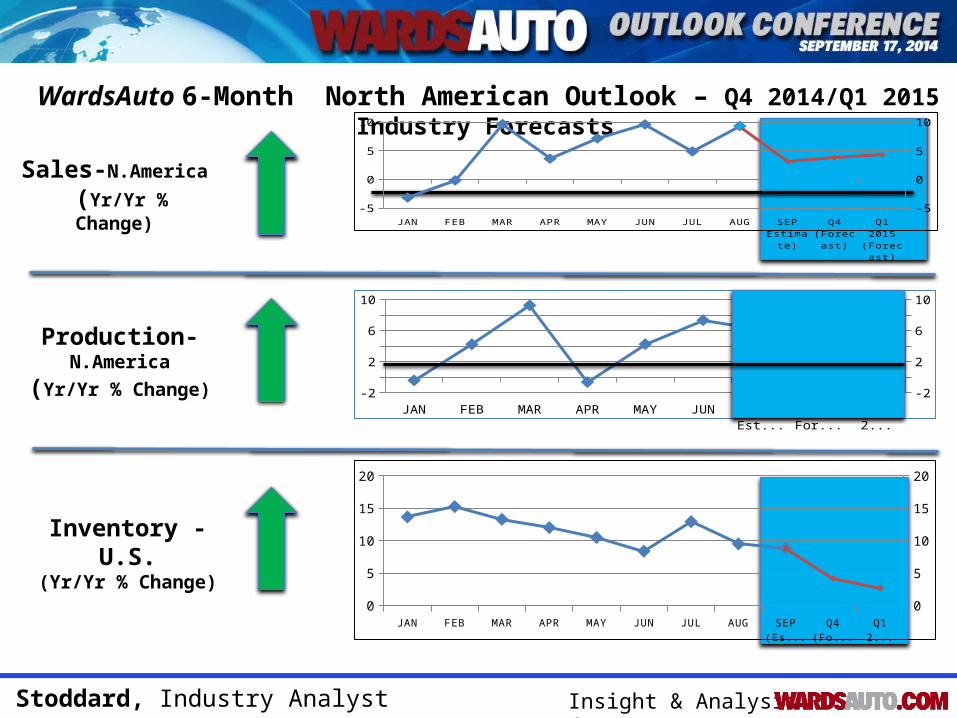
WardsAuto 6-Month North American Outlook – Q4 2014/Q1 2015 Industry Forecasts
Sales-N.America
(Yr/Yr % Change)
Production-N.America
(Yr/Yr % Change)
Inventory - U.S.(Yr/Yr % Change)
-202468
10
-20246810
JAN FEB MAR APR MAY JUN JUL AUG SEP (Es-timate)
Q4 (Fore-cast)
Q1 2015 (Forecast)
0
5
10
15
20
0
5
10
15
20
JAN FEB MAR APR MAY JUN JUL AUG SEP Es-timate)
Q4 (Fore-cast)
Q1 2015 (Forecast)
-4-202468
10
-5-3-113579
Haig Stoddard, Industry Analyst Insight & Analysis from
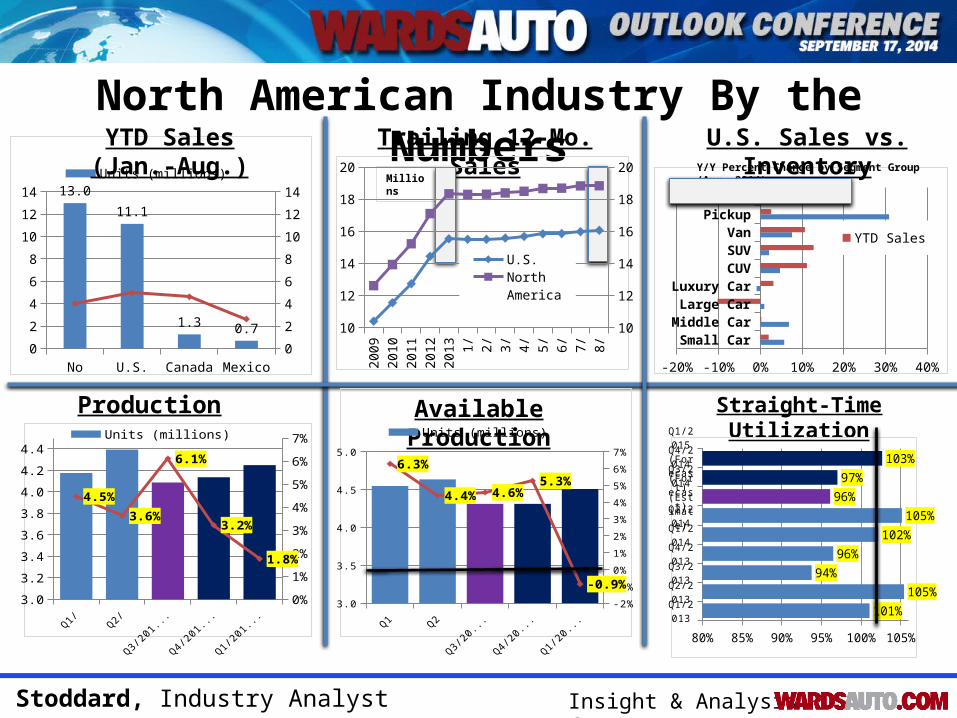
North American Industry By the Numbers
Production Available Production Straight-Time Utilization
North America
U.S. Canada Mexico0
2
4
6
8
10
12
14
0
2
4
6
8
10
12
1413.0
11.1
1.3 0.7
Units (millions) Y/Y % Chg. (R-scale)
YTD Sales (Jan.-Aug.) Trailing 12-Mo. SalesMillions
Small CarMiddle Car
Large CarLuxury Car
CUVSUVVan
PickupTotal U.S.
-20% -10% 0% 10% 20% 30% 40%
YTD SalesAug. Inventory
U.S. Sales vs. InventoryY/Y Percent Change by Segment Group (Aug. 2014)
2009
2010
2011
2012
2013 1/ 2/ 3/ 4/ 5/ 6/ 7/ 8/
1011121314151617181920
1011121314151617181920
U.S.
North America
Q1/2014 Q2/2014 Q3/2014 (Estimate)
Q4/2014 (Forecast)
Q1/2015 (Forecast)
3.0
3.2
3.4
3.6
3.8
4.0
4.2
4.4
0%
1%
2%
3%
4%
5%
6%
7%
4.5%
3.6%
6.1%
3.2%
1.8%
Units (millions) Y/Y % Chg. (R-scale)
Q1/2014 Q2/2014 Q3/2014 (Estimate)
Q4/2014 (Forecast)
Q1/2015 (Forecast)
3.0
3.5
4.0
4.5
5.0
-2%
-1%
0%
1%
2%
3%
4%
5%
6%
7%6.3%
4.4% 4.6%5.3%
-0.9%
Units (millions) Y/Y % Chg. (R-scale)
Q1/2013
Q2/2013
Q3/2013
Q4/2013
Q1/2014
Q2/2014
Q3/2014 (Es-timate)
Q4/2014
(Fore-cast)
Q1/2015
(Fore-cast)
80% 85% 90% 95% 100% 105%
101%
105%
94%
96%
102%
105%
96%
97%
103%
Haig Stoddard, Industry Analyst Insight & Analysis from
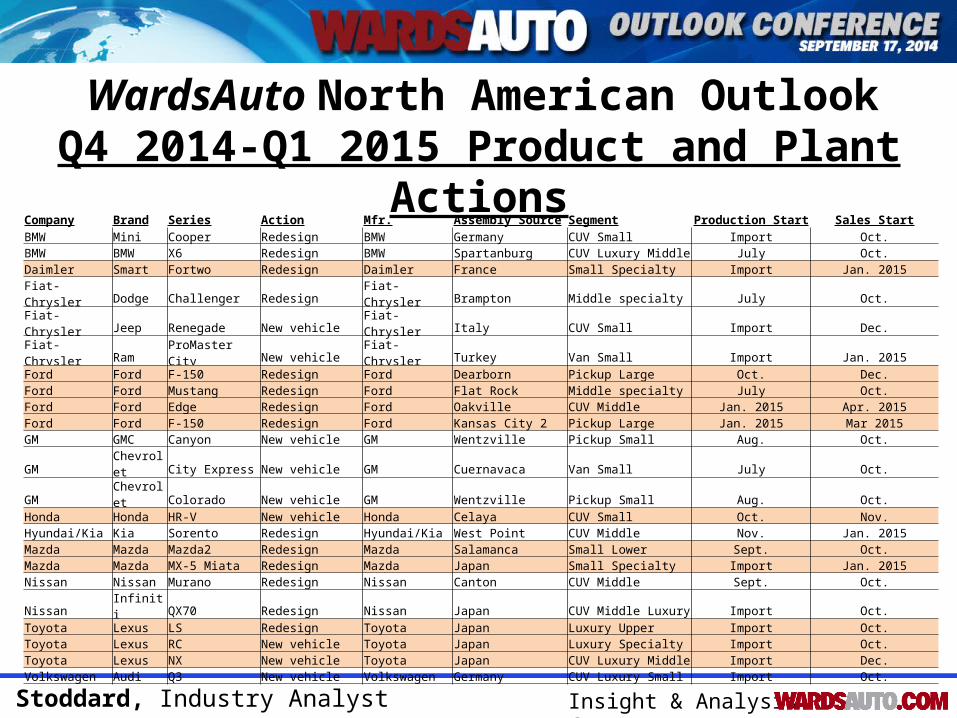
WardsAuto North American OutlookQ4 2014-Q1 2015 Product and Plant Actions
Company Brand Series Action Mfr. Assembly Source Segment Production Start Sales StartBMW Mini Cooper Redesign BMW Germany CUV Small Import Oct.BMW BMW X6 Redesign BMW Spartanburg CUV Luxury Middle July Oct.Daimler Smart Fortwo Redesign Daimler France Small Specialty Import Jan. 2015Fiat-Chrysler Dodge Challenger Redesign Fiat-Chrysler Brampton Middle specialty July Oct.Fiat-Chrysler Jeep Renegade New vehicle Fiat-Chrysler Italy CUV Small Import Dec.Fiat-Chrysler Ram ProMaster City New vehicle Fiat-Chrysler Turkey Van Small Import Jan. 2015Ford Ford F-150 Redesign Ford Dearborn Pickup Large Oct. Dec.Ford Ford Mustang Redesign Ford Flat Rock Middle specialty July Oct.Ford Ford Edge Redesign Ford Oakville CUV Middle Jan. 2015 Apr. 2015Ford Ford F-150 Redesign Ford Kansas City 2 Pickup Large Jan. 2015 Mar 2015GM GMC Canyon New vehicle GM Wentzville Pickup Small Aug. Oct.
GM Chevrolet City Express New vehicle GM Cuernavaca Van Small July Oct.
GM Chevrolet Colorado New vehicle GM Wentzville Pickup Small Aug. Oct.Honda Honda HR-V New vehicle Honda Celaya CUV Small Oct. Nov.Hyundai/Kia Kia Sorento Redesign Hyundai/Kia West Point CUV Middle Nov. Jan. 2015Mazda Mazda Mazda2 Redesign Mazda Salamanca Small Lower Sept. Oct.Mazda Mazda MX-5 Miata Redesign Mazda Japan Small Specialty Import Jan. 2015Nissan Nissan Murano Redesign Nissan Canton CUV Middle Sept. Oct.Nissan Infiniti QX70 Redesign Nissan Japan CUV Middle Luxury Import Oct.Toyota Lexus LS Redesign Toyota Japan Luxury Upper Import Oct.Toyota Lexus RC New vehicle Toyota Japan Luxury Specialty Import Oct.Toyota Lexus NX New vehicle Toyota Japan CUV Luxury Middle Import Dec.Volkswagen Audi Q3 New vehicle Volkswagen Germany CUV Luxury Small Import Oct.
Haig Stoddard, Industry Analyst Insight & Analysis from
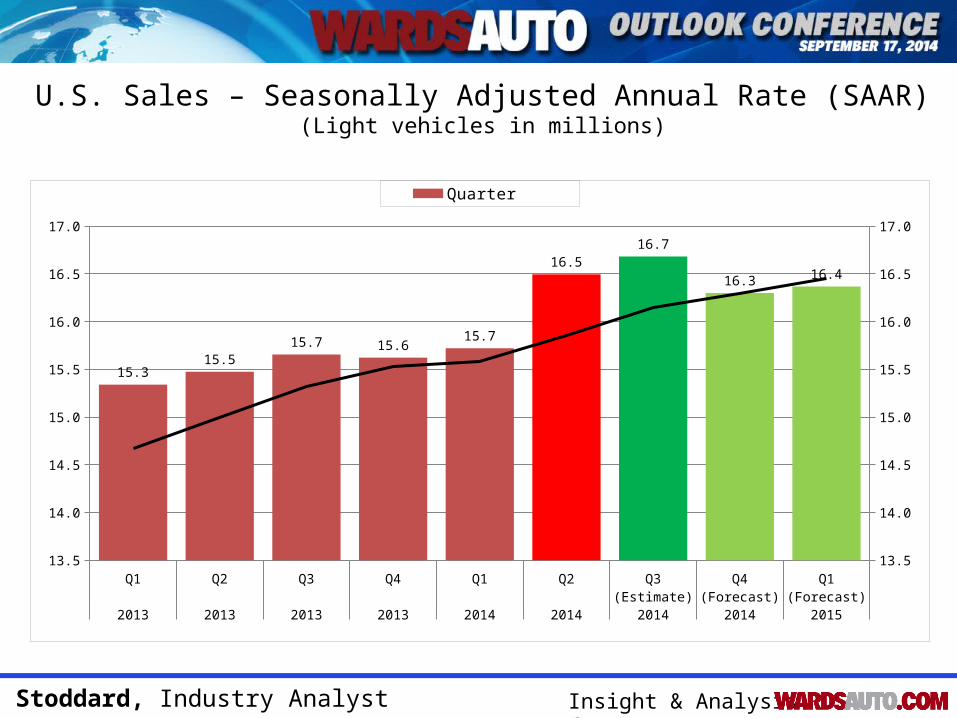
U.S. Sales – Seasonally Adjusted Annual Rate (SAAR)(Light vehicles in millions)
Q1 Q2 Q3 Q4 Q1 Q2 Q3 (Estimate) Q4 (Forecast) Q1 (Forecast)2013 2013 2013 2013 2014 2014 2014 2014 2015
13.5
14.0
14.5
15.0
15.5
16.0
16.5
17.0
13.5
14.0
14.5
15.0
15.5
16.0
16.5
17.0
15.315.5
15.7 15.615.7
16.516.7
16.3 16.4
Quarter 12-Mo Roll
Haig Stoddard, Industry Analyst Insight & Analysis from
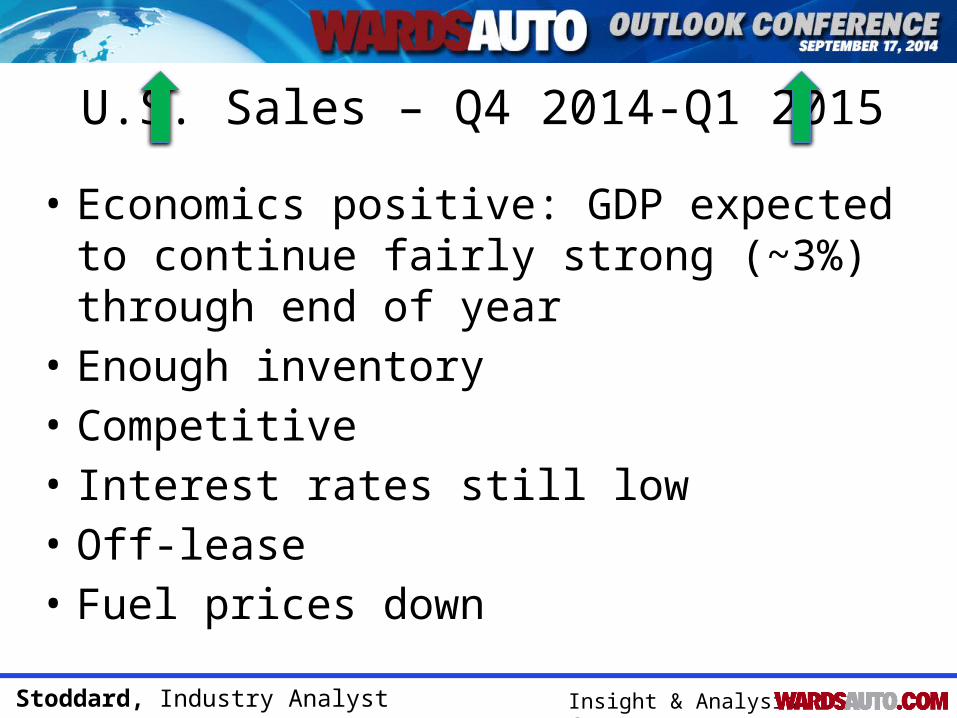
• Economics positive: GDP expected to continue fairly strong (~3%) through end of year
• Enough inventory• Competitive• Interest rates still low• Off-lease• Fuel prices down
U.S. Sales – Q4 2014-Q1 2015
Haig Stoddard, Industry Analyst Insight & Analysis from
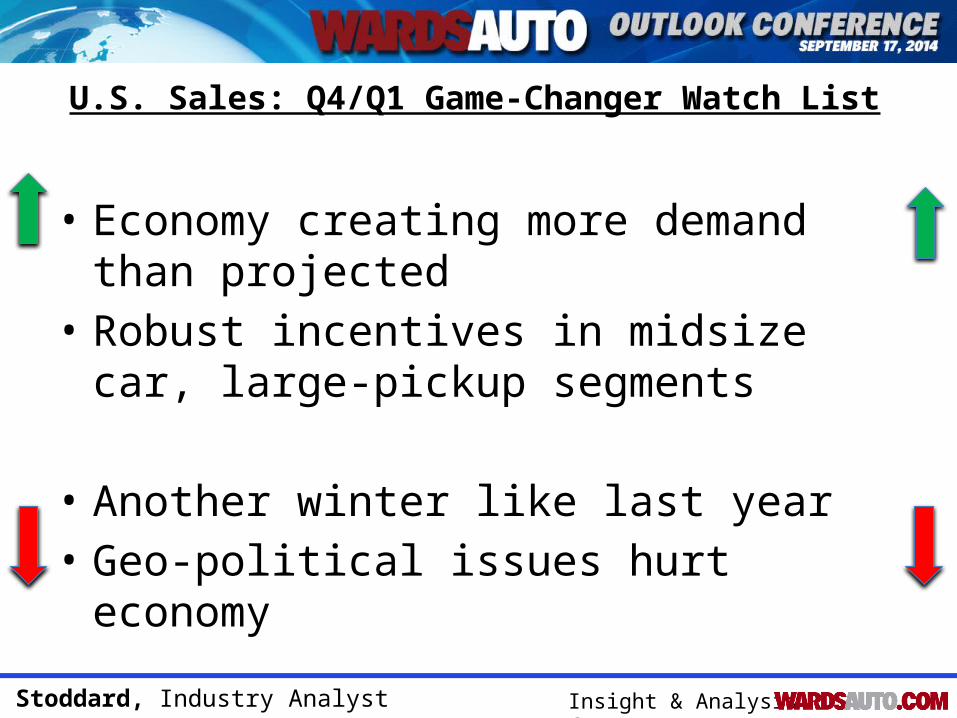
U.S. Sales: Q4/Q1 Game-Changer Watch List
• Economy creating more demand than projected
• Robust incentives in midsize car, large-pickup segments
• Another winter like last year• Geo-political issues hurt economy
Haig Stoddard, Industry Analyst Insight & Analysis from
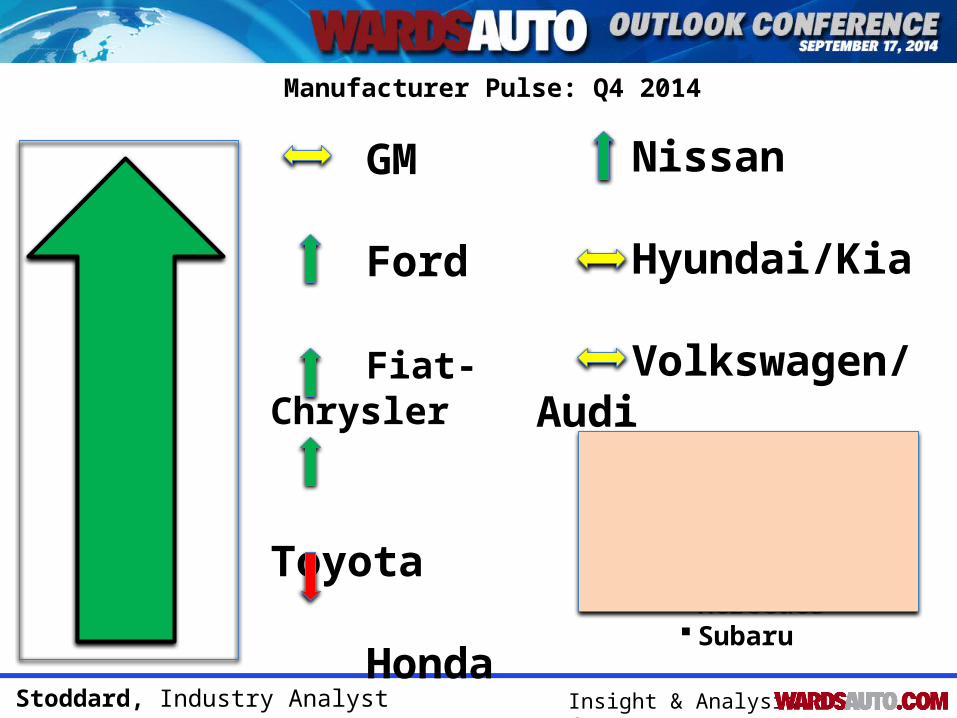
Manufacturer Pulse: Q4 2014
GM
Ford
Fiat-Chrysler
Toyota
Honda
Nissan
Hyundai/Kia
Volkswagen/Audi
Other BMW Mercedes Subaru
Haig Stoddard, Industry Analyst Insight & Analysis from
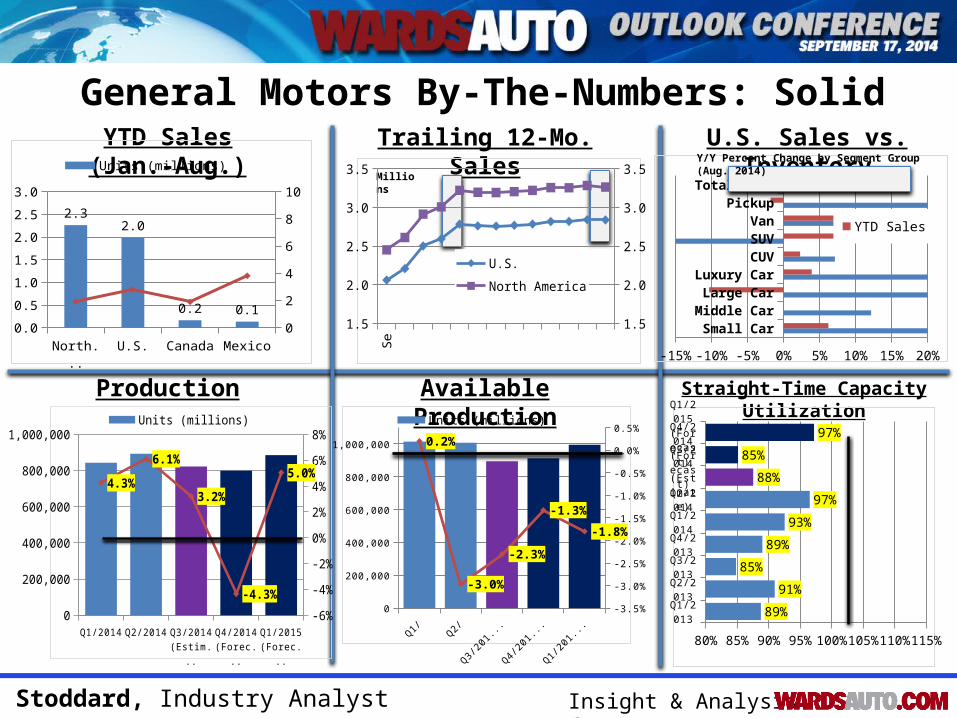
General Motors By-The-Numbers: Solid
Production Available Production Straight-Time Capacity Utilization
Small CarMiddle Car
Large CarLuxury Car
CUVSUVVan
PickupTotal U.S.
-15% -10% -5% 0% 5% 10% 15% 20%
YTD SalesAug. Inventory
YTD Sales (Jan.-Aug.) Trailing 12-Mo. Sales U.S. Sales vs. Inventory
North America
U.S. Canada Mexico0.0
0.5
1.0
1.5
2.0
2.5
3.0
012345678910
2.32.0
0.2 0.1
Units (millions) Y/Y % Chg. (R-scale)Millions
Y/Y Percent Change by Segment Group (Aug. 2014)
Q1/2013
Q2/2013
Q3/2013
Q4/2013
Q1/2014
Q2/2014
Q3/2014 (Es-timate)
Q4/2014
(Fore-cast)
Q1/2015
(Fore-cast)
80% 85% 90% 95% 100% 105% 110% 115%
89%
91%
85%
89%
93%
97%
88%
85%
97%
0
200,000
400,000
600,000
800,000
1,000,000
-3.5%
-3.0%
-2.5%
-2.0%
-1.5%
-1.0%
-0.5%
0.0%
0.5%0.2%
-3.0%
-2.3%
-1.3%
-1.8%
Units (millions) Y/Y % Chg. (R-scale)
Ser
1.5
2.0
2.5
3.0
3.5
1.5
2.0
2.5
3.0
3.5
U.S.
North America
Q1/2014 Q2/2014 Q3/2014 (Estimate)
Q4/2014 (Forecast)
Q1/2015 (Forecast)
0
200,000
400,000
600,000
800,000
1,000,000
-6%
-4%
-2%
0%
2%
4%
6%
8%
4.3%
6.1%
3.2%
-4.3%
5.0%
Units (millions) Y/Y % Chg. (R-scale)

Haig Stoddard, Industry Analyst Insight & Analysis from
General Motors: Why ?
(?) Management still in major transition though less a concern(?) Recall: still not affecting sales, but continue to have negative impact on earnings(?) Globally, mixed bag. Had Q2 earnings difficulties in South America and Europe; made wage concessions in South Korea. China is good(-) Cadillac, though not the bread-and-butter division like Chevrolet, is important – not riding the luxury wave(+/-) Fundamentals still good. Overall decent product portfolio; should have sales gains in U.S. Q4-14, Q1-15
Haig Stoddard, Industry Analyst Insight & Analysis from
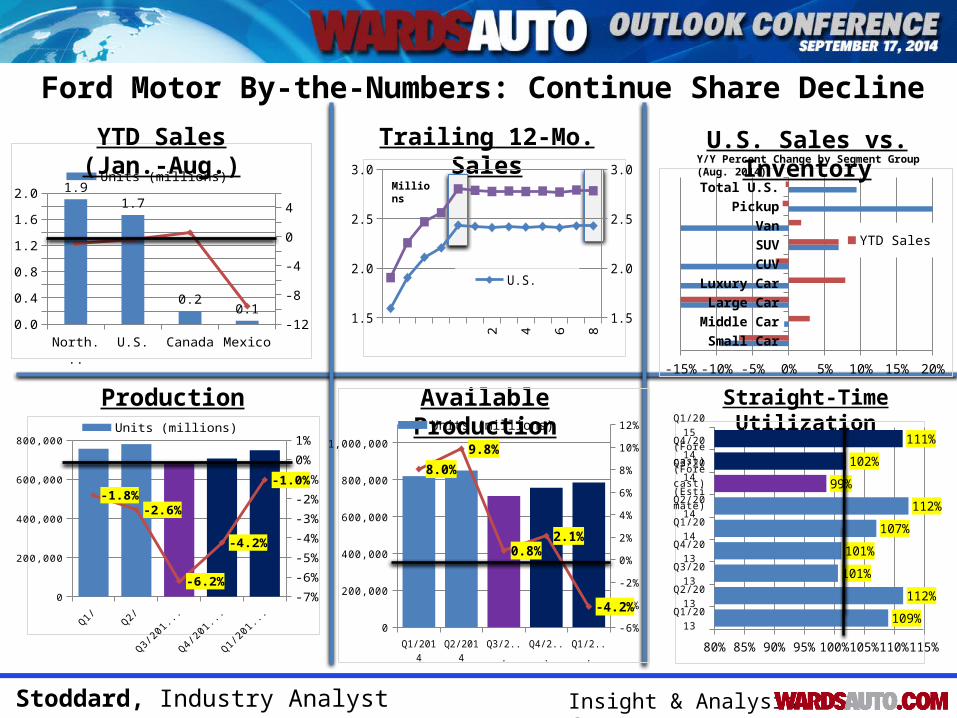
Ford Motor By-the-Numbers: Continue Share Decline
Production Available Production Straight-Time Utilization
North America
U.S. Canada Mexico0.00.20.40.60.81.01.21.41.61.82.0
-12-10-8-6-4-202461.9
1.7
0.20.1
Units (millions) Y/Y % Chg. (R-scale)
Small CarMiddle Car
Large CarLuxury Car
CUVSUVVan
PickupTotal U.S.
-15% -10% -5% 0% 5% 10% 15% 20%
YTD SalesAug. Inventory
YTD Sales (Jan.-Aug.) Trailing 12-Mo. Sales U.S. Sales vs. Inventory
Millions
Y/Y Percent Change by Segment Group (Aug. 2014)
2009
2010
2011
2012
2013 1/ 2/ 3/ 4/ 5/ 6/ 7/ 8/
1.5
2.0
2.5
3.0
1.5
2.0
2.5
3.0
U.S.North America
0
200,000
400,000
600,000
800,000
-7%
-6%
-5%
-4%
-3%
-2%
-1%
0%
1%
-1.8%-2.6%
-6.2%
-4.2%
-1.0%
Units (millions)
Q1/2014 Q2/2014 Q3/2014 (Esti-mate)
Q4/2014 (Forecast)
Q1/2015 (Forecast)
0
200,000
400,000
600,000
800,000
1,000,000
-6%
-4%
-2%
0%
2%
4%
6%
8%
10%
12%
8.0%
9.8%
0.8%2.1%
-4.2%
Units (millions) Y/Y % Chg. (R-scale)
Q1/2013
Q2/2013
Q3/2013
Q4/2013
Q1/2014
Q2/2014
Q3/2014 (Esti-
mate)
Q4/2014 (Fore-cast)
Q1/2015 (Fore-cast)
80% 85% 90% 95% 100% 105% 110% 115%
109%
112%
101%
101%
107%
112%
99%
102%
111%
Haig Stoddard, Industry Analyst Insight & Analysis from
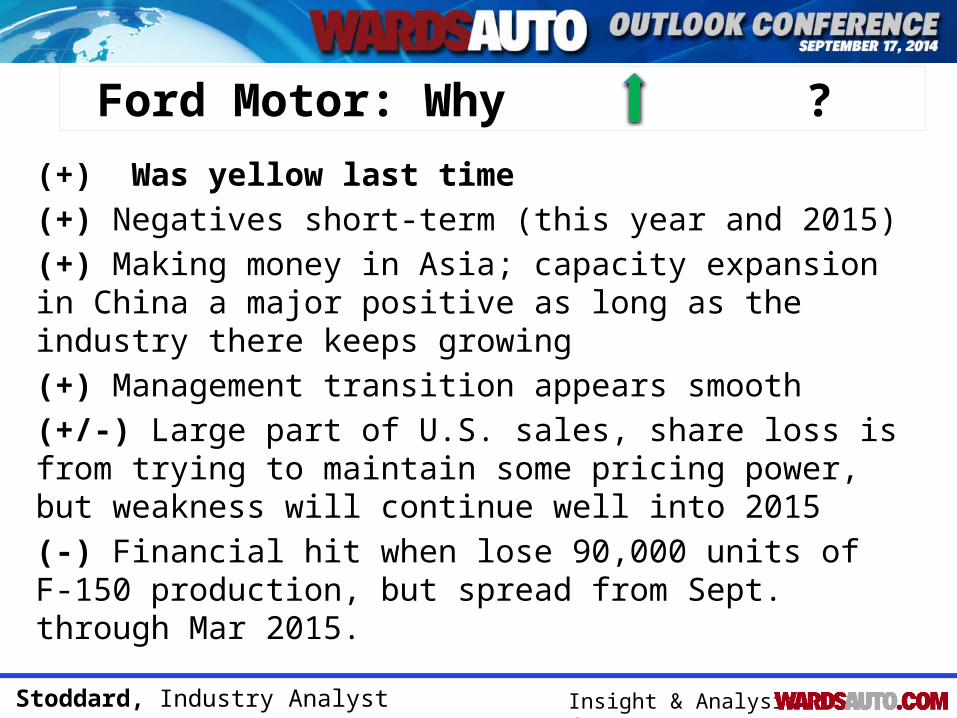
Ford Motor: Why ? (+) Was yellow last time(+) Negatives short-term (this year and 2015)(+) Making money in Asia; capacity expansion in China a major positive as long as the industry there keeps growing(+) Management transition appears smooth(+/-) Large part of U.S. sales, share loss is from trying to maintain some pricing power, but weakness will continue well into 2015(-) Financial hit when lose 90,000 units of F-150 production, but spread from Sept. through Mar 2015.
Haig Stoddard, Industry Analyst Insight & Analysis from
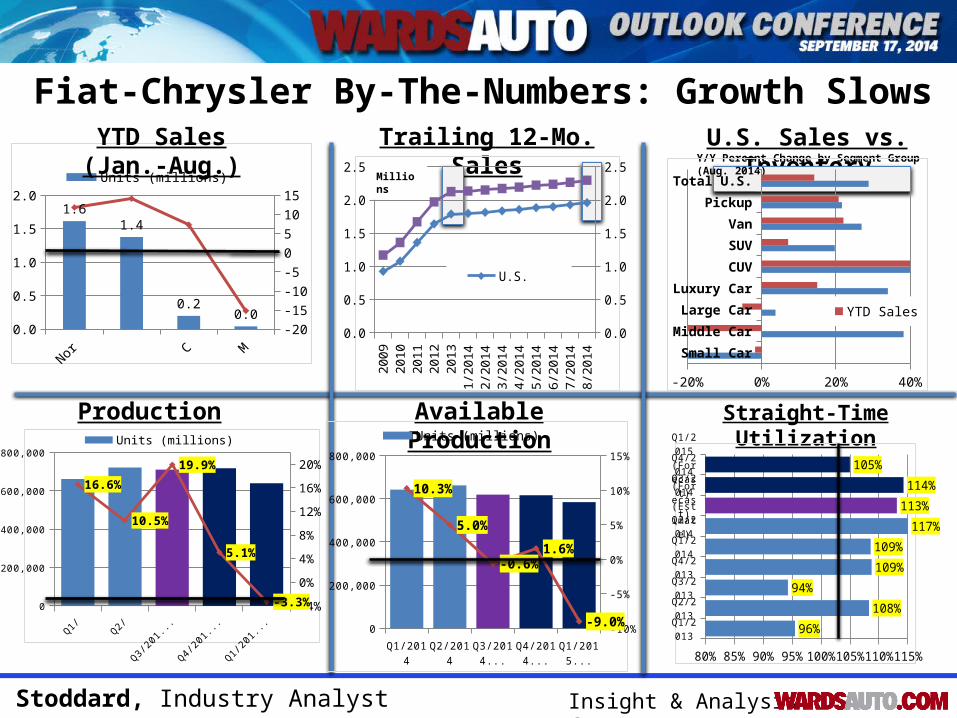
Fiat-Chrysler By-The-Numbers: Growth Slows
Production Available Production Straight-Time Utilization
North America
U.S. Canada Mexico0.0
0.5
1.0
1.5
2.0
-20-15-10-5051015
1.61.4
0.20.0
Units (millions) Y/Y % Chg. (R-scale)
YTD Sales (Jan.-Aug.) Trailing 12-Mo. Sales U.S. Sales vs. InventoryY/Y Percent Change by Segment Group (Aug. 2014)
Small Car
Middle Car
Large Car
Luxury Car
CUV
SUV
Van
Pickup
Total U.S.
-20% -10% 0% 10% 20% 30% 40%
YTD SalesAug. Inventory
2009
2010
2011
2012
2013
1/20
142/
2014
3/20
144/
2014
5/20
146/
2014
7/20
148/
2014
0.0
0.5
1.0
1.5
2.0
2.5
0.0
0.5
1.0
1.5
2.0
2.5
U.S.North America
Millions
Q1/2014 Q2/2014 Q3/2014 (Estimate)
Q4/2014 (Forecast)
Q1/2015 (Forecast)
0
200,000
400,000
600,000
800,000
-4%
0%
4%
8%
12%
16%
20%
16.6%
10.5%
19.9%
5.1%
-3.3%
Units (millions) Y/Y % Chg. (R-scale)
Q1/2014 Q2/2014 Q3/2014 (Esti-
mate)
Q4/2014 (Fore-cast)
Q1/2015 (Fore-cast)
0
200,000
400,000
600,000
800,000
-10%
-5%
0%
5%
10%
15%
10.3%
5.0%
-0.6%1.6%
-9.0%
Units (millions) Y/Y % Chg. (R-scale)
Q1/2013
Q2/2013
Q3/2013
Q4/2013
Q1/2014
Q2/2014
Q3/2014 (Es-timate)
Q4/2014
(Fore-cast)
Q1/2015
(Fore-cast)
80% 85% 90% 95% 100% 105% 110% 115%
96%
108%
94%
109%
109%
117%
113%
114%
105%

Haig Stoddard, Industry Analyst Insight & Analysis from
Fiat-Chrysler: Why ? (+) Overall sales, share, production still strong (though y/y volumes start to flatten)(+) Gradually solidifying North American product portfolio (+) Appear committed to Windsor investment, indicating don’t expect contentious negotiations next year with Canada union(?) But a lot of older product still behind sales gains; conceded in Q2 earnings report that U.S. incentives hurt margins(?) Lengthy early tooling shutdowns at plants in Canada, Mexico in Q1 and Q2 2015 a temporary drag(-) Corporate’s heavy dependence on North America
Haig Stoddard, Industry Analyst Insight & Analysis from
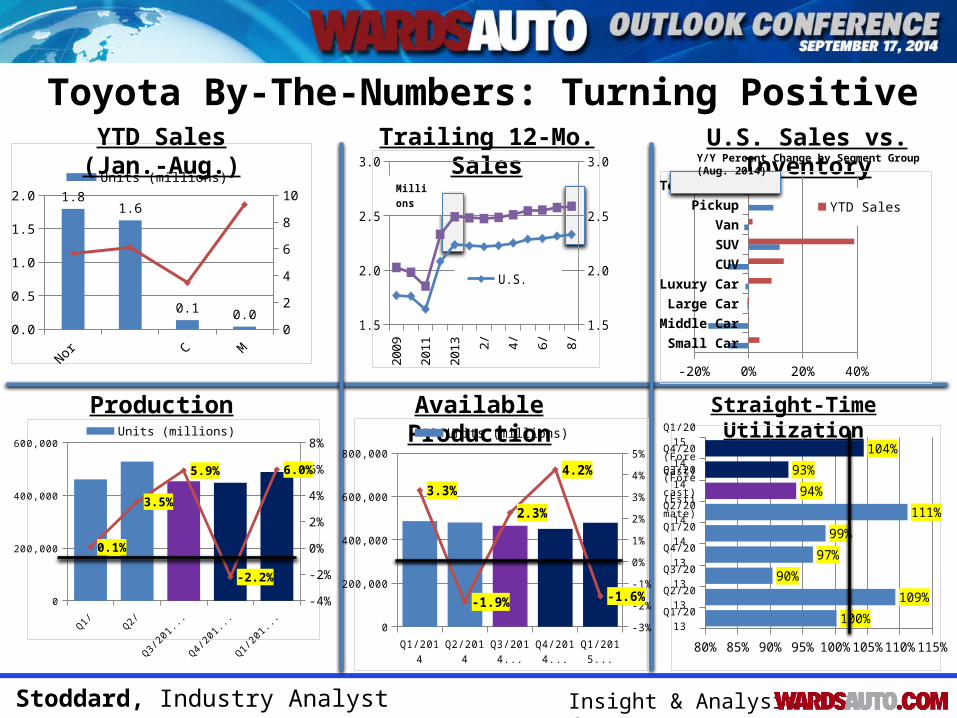
Toyota By-The-Numbers: Turning Positive
Production Available Production Straight-Time Utilization
North America
U.S. Canada Mexico0.0
0.5
1.0
1.5
2.0
0123456789101.8
1.6
0.1 0.0
Units (millions) Y/Y % Chg. (R-scale)
YTD Sales (Jan.-Aug.) Trailing 12-Mo. Sales U.S. Sales vs. Inventory
Small CarMiddle Car
Large CarLuxury Car
CUVSUVVan
PickupTotal U.S.
-20% 0% 20% 40%
YTD SalesAug. Inventory
Y/Y Percent Change by Segment Group (Aug. 2014)
2009
2010
2011
2012
2013 1/ 2/ 3/ 4/ 5/ 6/ 7/ 8/
1.5
2.0
2.5
3.0
1.5
2.0
2.5
3.0
U.S.North America
Millions
Q1/2014 Q2/2014 Q3/2014 (Estimate)
Q4/2014 (Forecast)
Q1/2015 (Forecast)
0
200,000
400,000
600,000
-4%
-2%
0%
2%
4%
6%
8%
0.1%
3.5%
5.9%
-2.2%
6.0%
Units (millions) Y/Y % Chg. (R-scale)
Q1/2014 Q2/2014 Q3/2014 (Estimate)
Q4/2014 (Forecast)
Q1/2015 (Forecast)
0
200,000
400,000
600,000
800,000
-3%
-2%
-1%
0%
1%
2%
3%
4%
5%
3.3%
-1.9%
2.3%
4.2%
-1.6%
Units (millions) Y/Y % Chg. (R-scale)
Q1/2013
Q2/2013
Q3/2013
Q4/2013
Q1/2014
Q2/2014
Q3/2014 (Esti-mate)
Q4/2014
(Fore-cast)
Q1/2015
(Fore-cast)
80% 85% 90% 95% 100% 105% 110% 115%
100%
109%
90%
97%
99%
111%
94%
93%
104%
Haig Stoddard, Industry Analyst Insight & Analysis from
Toyota: Why ?
(+) Sales, share still going up(+) Refreshed Camry should reassert its mid-car dominance; new Lexus NX small luxury CUV (?) Seeing some global weakness(-) Scion flagging

Haig Stoddard, Industry Analyst Insight & Analysis from
Honda By-The-Numbers: Continue Weakness
Production Available Production Straight-Time Utilization
YTD Sales (Jan.-Aug.)
North America
U.S. Canada Mexico0.0
0.3
0.6
0.9
1.2
1.5
-6
-4
-2
0
2
4
61.2
1.0
0.1 0.0
Units (millions) Y/Y % Chg. (R-scale)
Trailing 12-Mo. Sales U.S. Sales vs. InventoryY/Y Percent Change by Segment Group (Aug. 2014)
Small CarMiddle Car
Large CarLuxury Car
CUVSUVVan
PickupTotal U.S.
-40% -20% 0% 20% 40%
YTD SalesAug. Inventory
2009
2010
2011
2012
2013 1/ 2/ 3/ 4/ 5/ 6/ 7/ 8/
0.5
1.0
1.5
2.0
0.5
1.0
1.5
2.0
U.S.North America
Millions
Q1/2014 Q2/2014 Q3/2014 (Estimate)
Q4/2014 (Forecast)
Q1/2015 (Forecast)
0
150,000
300,000
450,000
600,000
-2%
0%
2%
4%
6%
-0.9%
-1.9%
-0.2%
3.7%4.3%
Units (millions) Y/Y % Chg. (R-scale)
Q1/2014 Q2/2014 Q3/2014 (Estimate)
Q4/2014 (Forecast)
Q1/2015 (Forecast)
0
150,000
300,000
450,000
600,000
0%
2%
4%
6%
8%
10%
12%
14%
16%
4.4%
9.9%
14.8%13.4%
8.4%
Units (millions) Y/Y % Chg. (R-scale)
Q1/2013
Q2/2013
Q3/2013
Q4/2013
Q1/2014
Q2/2014
Q3/2014 (Es-timate)
Q4/2014
(Fore-cast)
Q1/2015
(Fore-cast)
80% 85% 90% 95% 100% 105% 110% 115%
99%98%
92%89%
96%85%
81%83%
91%
Haig Stoddard, Industry Analyst Insight & Analysis from
Honda: Why ?
(-) Declining sales and dull product portfolio(-) U.S. inventory down from year-ago; good that manufacturer is undertaking inventory control, but possibly indicative it does not expect sales to rebound rest of the year.(-) Acura trending down again after temporary success from two redesigned CUVs (MDX, RDX)(+) New Fit and Fit-based HR-V crossover built at new plant in Mexico(?) Behind expectations in China, though expect overall demand in Asia (especially Japan) to improve
Haig Stoddard, Industry Analyst Insight & Analysis from
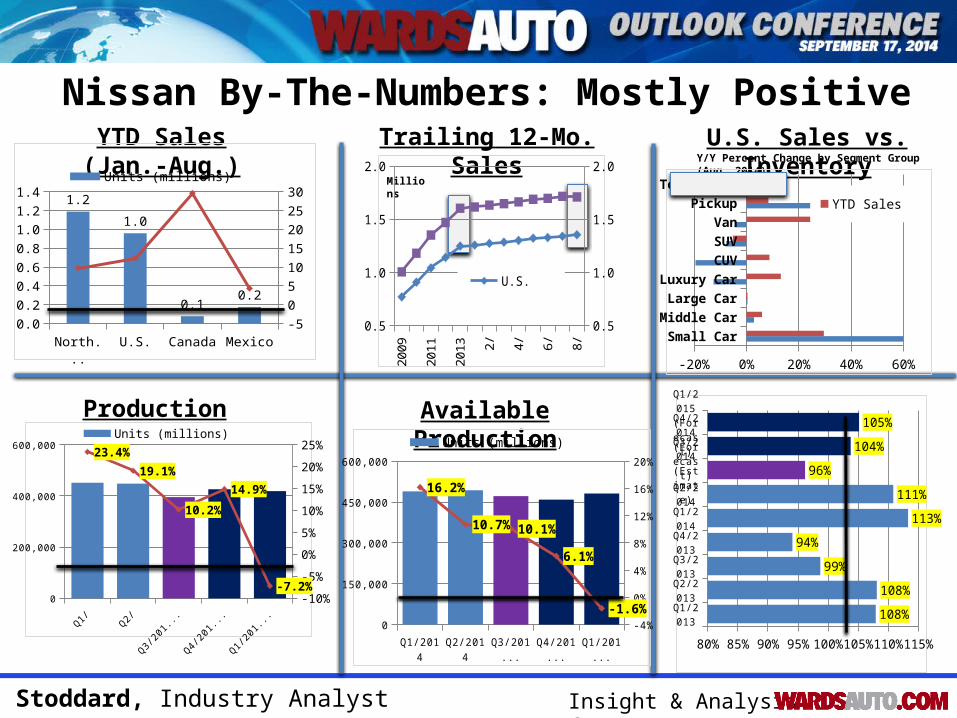
Nissan By-The-Numbers: Mostly Positive
Production Available Production
YTD Sales (Jan.-Aug.)
North America
U.S. Canada Mexico0.00.20.40.60.81.01.21.4
-5051015202530
1.2
1.0
0.10.2
Units (millions) Y/Y % Chg. (R-scale)
Trailing 12-Mo. SalesY/Y Percent Change by Segment Group (Aug. 2014)U.S. Sales vs. Inventory
Small CarMiddle Car
Large CarLuxury Car
CUVSUVVan
PickupTotal U.S.
-20% 0% 20% 40% 60%
YTD SalesAug. Inventory
Millions
2009
2010
2011
2012
2013 1/ 2/ 3/ 4/ 5/ 6/ 7/ 8/
0.5
1.0
1.5
2.0
0.5
1.0
1.5
2.0
U.S.North America
Q1/2014 Q2/2014 Q3/2014 (Estimate)
Q4/2014 (Forecast)
Q1/2015 (Forecast)
0
200,000
400,000
600,000
-10%
-5%
0%
5%
10%
15%
20%
25%23.4%
19.1%
10.2%
14.9%
-7.2%
Units (millions) Y/Y % Chg. (R-scale)
Q1/2014 Q2/2014 Q3/2014 (Estimate)
Q4/2014 (Forecast)
Q1/2015 (Forecast)
0
150,000
300,000
450,000
600,000
-4%
0%
4%
8%
12%
16%
20%
16.2%
10.7% 10.1%
6.1%
-1.6%
Units (millions) Y/Y % Chg. (R-scale)
Q1/2013
Q2/2013
Q3/2013
Q4/2013
Q1/2014
Q2/2014
Q3/2014 (Es-timate)
Q4/2014
(Fore-cast)
Q1/2015
(Fore-cast)
80% 85% 90% 95% 100% 105% 110% 115%
108%
108%
99%
94%
113%
111%
96%
104%
105%
Haig Stoddard, Industry Analyst Insight & Analysis from
Nissan: Why ?
(+) Sales, production still running on nearly all cylinders(+) Added capacity leading to more sales(?) Not impressed with overall portfolio, including powertrain – does not seem to match market success(+/-) Pulling back on incentives for Altima – sign of a bigger trend?
Haig Stoddard, Industry Analyst Insight & Analysis from
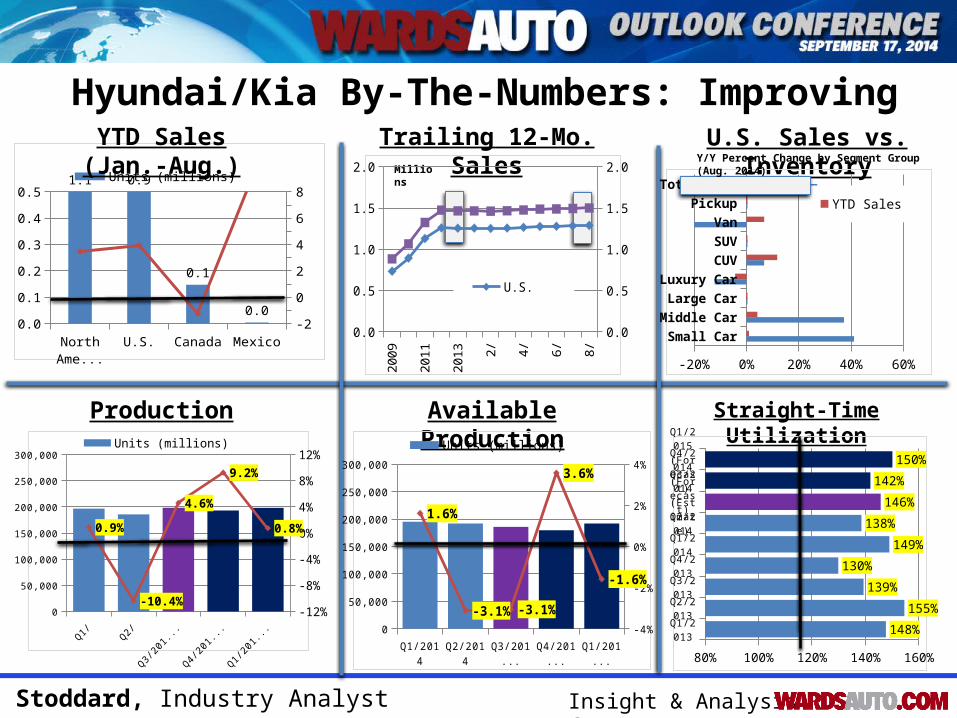
Hyundai/Kia By-The-Numbers: Improving
Production Available Production Straight-Time Utilization
North America
U.S. Canada Mexico0.0
0.1
0.2
0.3
0.4
0.5
-2-1012345678
1.1 0.9
0.1
0.0
Units (millions) Y/Y % Chg. (R-scale)
U.S. Sales vs. Inventory
Small CarMiddle Car
Large CarLuxury Car
CUVSUVVan
PickupTotal U.S.
-20% 0% 20% 40% 60%
YTD SalesAug. Inventory
Trailing 12-Mo. SalesYTD Sales (Jan.-Aug.)Y/Y Percent Change by Segment Group (Aug. 2014)
Millions
2009
2010
2011
2012
2013 1/ 2/ 3/ 4/ 5/ 6/ 7/ 8/
0.0
0.5
1.0
1.5
2.0
0.0
0.5
1.0
1.5
2.0
U.S.North America
Q1/2014 Q2/2014 Q3/2014 (Estimate)
Q4/2014 (Forecast)
Q1/2015 (Forecast)
0
50,000
100,000
150,000
200,000
250,000
300,000
-12%
-8%
-4%
0%
4%
8%
12%
0.9%
-10.4%
4.6%
9.2%
0.8%
Units (millions) Y/Y % Chg. (R-scale)
Q1/2014 Q2/2014 Q3/2014 (Estimate)
Q4/2014 (Forecast)
Q1/2015 (Forecast)
0
50,000
100,000
150,000
200,000
250,000
300,000
-4%
-2%
0%
2%
4%
1.6%
-3.1% -3.1%
3.6%
-1.6%
Units (millions) Y/Y % Chg. (R-scale)
Q1/2013
Q2/2013
Q3/2013
Q4/2013
Q1/2014
Q2/2014
Q3/2014 (Es-timate)
Q4/2014
(Fore-cast)
Q1/2015
(Fore-cast)
80% 100% 120% 140% 160%
148%
155%
139%
130%
149%
138%
146%
142%
150%
Haig Stoddard, Industry Analyst Insight & Analysis from
Hyundai/Kia: Why ?
(-) Major labor issues in home-base South Korea – stills source a lot of product globally from there, including to North America(-) Rising won also hurting profits(-) Higher discounts in U.S. hurt Q2 profits(+)Kia sales up; new Sedona and Sorento on the way
Haig Stoddard, Industry Analyst Insight & Analysis from
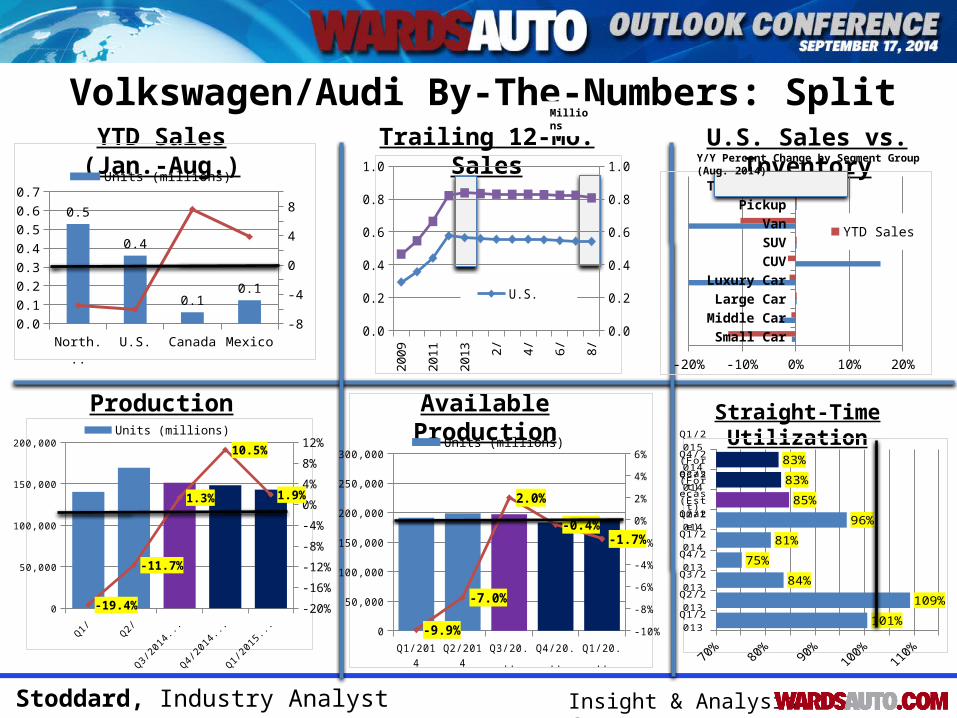
Volkswagen/Audi By-The-Numbers: Split
Production Available Production Straight-Time Utilization
YTD Sales (Jan.-Aug.)
North America
U.S. Canada Mexico0.00.10.20.30.40.50.60.7
-8-6-4-20246810
0.5
0.4
0.10.1
Units (millions) Y/Y % Chg. (R-scale)
Trailing 12-Mo. Sales U.S. Sales vs. Inventory
Small CarMiddle Car
Large CarLuxury Car
CUVSUVVan
PickupTotal U.S.
-20% -10% 0% 10% 20%
YTD SalesAug. Inventory
Y/Y Percent Change by Segment Group (Aug. 2014)
Millions
2009
2010
2011
2012
2013 1/ 2/ 3/ 4/ 5/ 6/ 7/ 8/
0.0
0.2
0.4
0.6
0.8
1.0
0.0
0.2
0.4
0.6
0.8
1.0
U.S.North America
Q1/2014 Q2/2014 Q3/2014 (Estimate)
Q4/2014 (Forecast)
Q1/2015 (Forecast)
0
50,000
100,000
150,000
200,000
-20%
-16%
-12%
-8%
-4%
0%
4%
8%
12%
-19.4%
-11.7%
1.3%
10.5%
1.9%
Units (millions) Y/Y % Chg. (R-scale)
Q1/2014 Q2/2014 Q3/2014 (Estimate)
Q4/2014 (Forecast)
Q1/2015 (Forecast)
0
50,000
100,000
150,000
200,000
250,000
300,000
-10%
-8%
-6%
-4%
-2%
0%
2%
4%
6%
-9.9%
-7.0%
2.0%
-0.4%-1.7%
Units (millions) Y/Y % Chg. (R-scale)
Q1/2013
Q2/2013
Q3/2013
Q4/2013
Q1/2014
Q2/2014
Q3/2014 (Es-timate)
Q4/2014
(Fore-cast)
Q1/2015
(Fore-cast)
101%
109%
84%
75%
81%
96%
85%
83%
83%
Haig Stoddard, Industry Analyst Insight & Analysis from
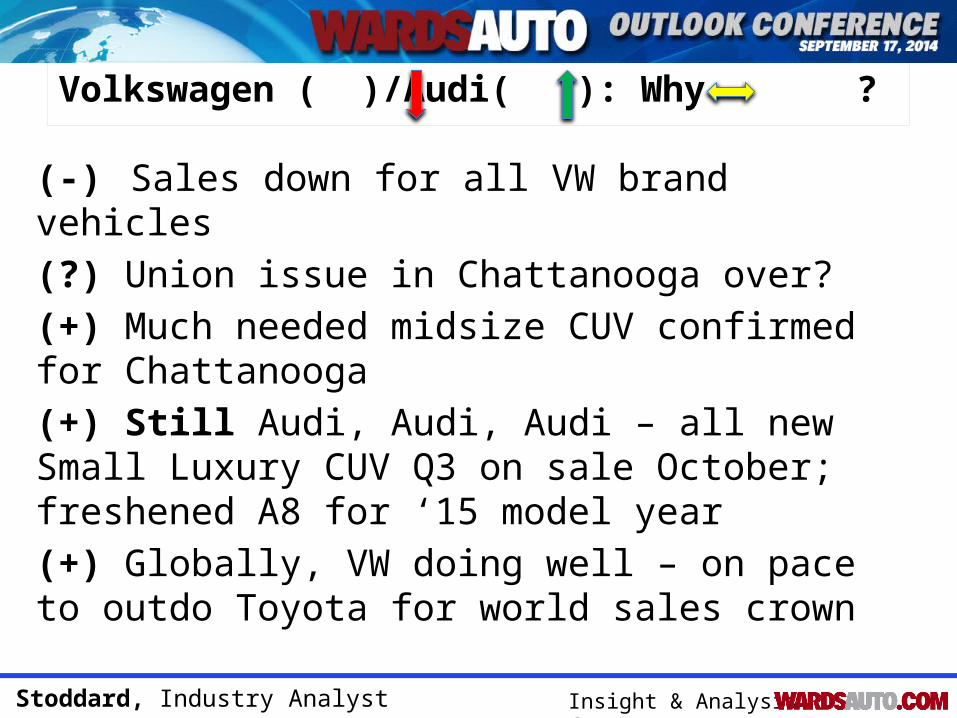
Volkswagen ( )/Audi( ): Why ?
(-) Sales down for all VW brand vehicles(?) Union issue in Chattanooga over?(+) Much needed midsize CUV confirmed for Chattanooga(+) Still Audi, Audi, Audi – all new Small Luxury CUV Q3 on sale October; freshened A8 for ‘15 model year(+) Globally, VW doing well – on pace to outdo Toyota for world sales crown

Haig Stoddard, Industry Analyst Insight & Analysis from
Rest of the Industry: Why ?
(+)BMW, Mercedes, Land Rover Jaguar riding high on luxury wave(+) More new product coming from BMW (X6), Mercedes (C-Class, GLA)(+) Subaru share, sales heading for records with new Legacy and Outback(+) Mazda sales up; new Mazda2 in Q4, Miata in Q1 2015
Haig Stoddard, Industry Analyst Insight & Analysis from
2009 2010 2011 2012 2013 2014 2015 2016 2017 20180
2
4
6
8
10
12
14
16
18
20
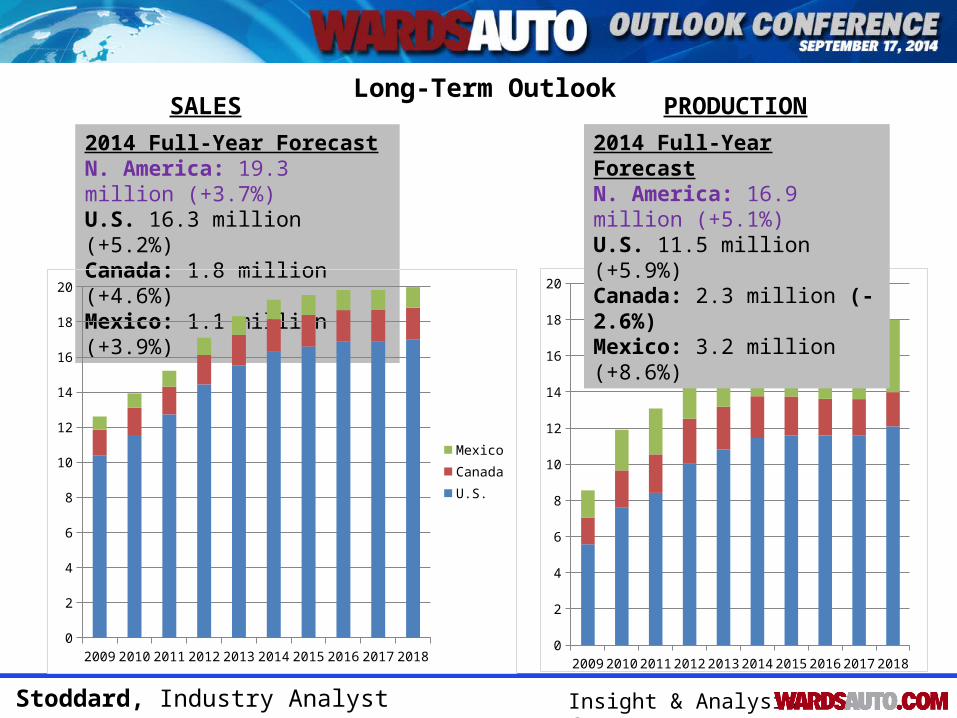
Long-Term OutlookSALES PRODUCTION
2014 Full-Year ForecastN. America: 19.3 million (+3.7%)U.S. 16.3 million (+5.2%)Canada: 1.8 million (+4.6%)Mexico: 1.1 million (+3.9%)
2014 Full-Year ForecastN. America: 16.9 million (+5.1%)U.S. 11.5 million (+5.9%)Canada: 2.3 million (-2.6%)Mexico: 3.2 million (+8.6%)
2009 2010 2011 2012 2013 2014 2015 2016 2017 20180
2
4
6
8
10
12
14
16
18
20
MexicoCanadaU.S.

Haig Stoddard, Industry Analyst Insight & Analysis from
CONTACT US TODAY:
LISA [email protected]
248-799-2642
AMBER [email protected]
248-799-2622