Embed Size (px)
Citation preview

Hafnia Tankers Ltd.
Interim Report
For the Three and Six Months Ended June 30, 2016 and 2015

Hafnia Tankers Ltd.
Condensed Consolidated Balance Sheet
(Unaudited)
2
As of
June 30 December 31
Note 2016 2015
(in thousands of U.S. dollars)
ASSETS
Current assets
Cash and cash equivalents 110,475 122,856
Accounts receivable 4,504 12,919
Prepaid expenses and other receivables 14,126 13,282
Inventories 4,305 4,496
Total current assets 133,410 153,553
Non-current assets
Vessels and dry dock 4 902,095 845,245
Vessels under construction 4 73,248 96,393
Goodwill 3 6,003 6,003
Time charters acquired 3 2,084 4,141
Contract values vessels under construction 3 1,498 4,279
Prepaid financing fee - 920
Interests in associates 1,953 4,108
Pool working capital deposit 5 25,800 24,400
Deferred tax 317 338
Total non-current assets 1,012,998 985,827
Total assets 1,146,408 1,139,380
LIABILITIES & EQUITY
Current liabilities
Bank loans 6 44,869 41,340
Accounts payable 3,259 3,433
Accrued expenses and other payables 8,464 12,261
Deferred revenue 378 -
Tax payable 1,142 68
Total current liabilities 58,112 57,102
Non-current liabilities
Bank loans 6 481,444 462,973
Derivatives 11 5,166 2,702
Total non-current liabilities 486,610 465,675
Total liabilities 544,722 522,777
Shareholders' equity
Issued, authorized and paid in share capital
Share capital 339 339
Additional paid in capital 351,694 351,743
Treasury shares (200) (200)
Accumulated profits 45,043 53,077
Cash flow hedging reserve (3,366) (1,767)
Translation reserve (34) (34)
Equity holders of the parent 393,476 403,158
Non-controlling interests 208,210 213,445
Total equity 601,686 616,603
Total liabilities and equity 1,146,408 1,139,380
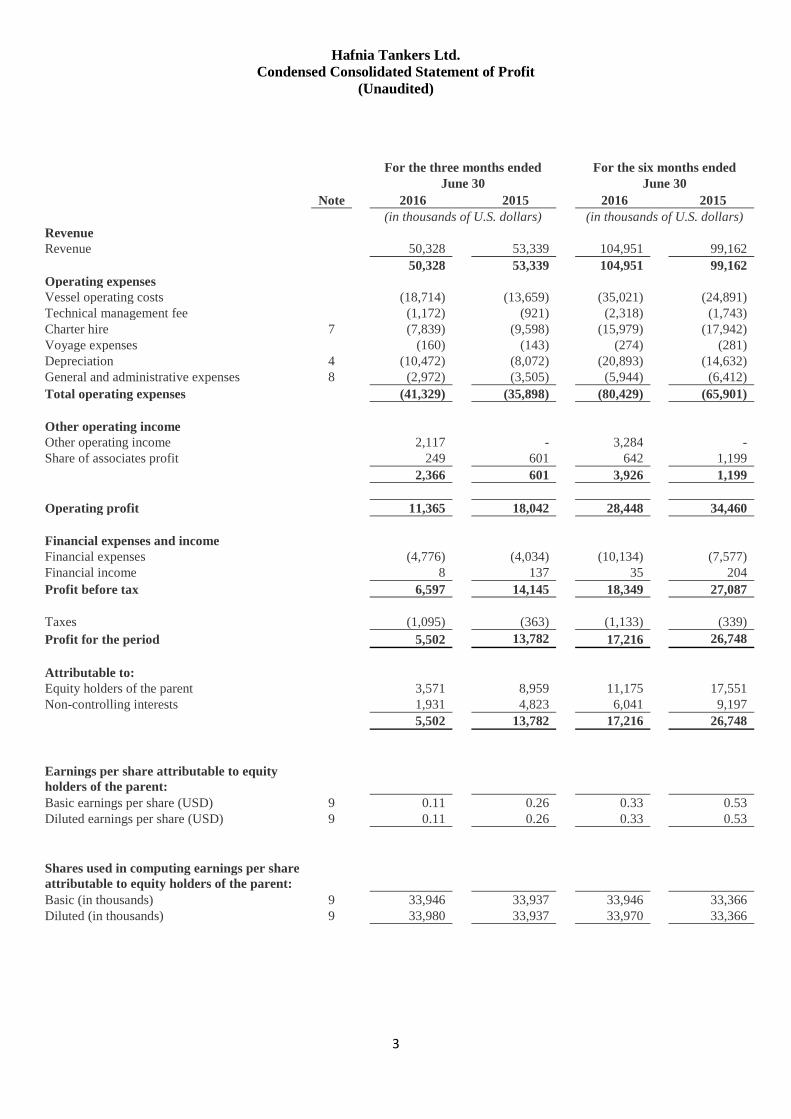
Hafnia Tankers Ltd.
Condensed Consolidated Statement of Profit
(Unaudited)
3
For the three months ended For the six months ended
June 30 June 30
Note 2016 2015 2016 2015
(in thousands of U.S. dollars) (in thousands of U.S. dollars)
Revenue
Revenue 50,328 53,339 104,951 99,162
50,328 53,339 104,951 99,162
Operating expenses
Vessel operating costs (18,714) (13,659) (35,021) (24,891)
Technical management fee (1,172) (921) (2,318) (1,743)
Charter hire 7 (7,839) (9,598) (15,979) (17,942)
Voyage expenses (160) (143) (274) (281)
Depreciation 4 (10,472) (8,072) (20,893) (14,632)
General and administrative expenses 8 (2,972) (3,505) (5,944) (6,412)
Total operating expenses (41,329) (35,898) (80,429) (65,901)
Other operating income
Other operating income 2,117 - 3,284 -
Share of associates profit 249 601 642 1,199
2,366 601 3,926 1,199
Operating profit 11,365 18,042 28,448 34,460
Financial expenses and income
Financial expenses (4,776) (4,034) (10,134) (7,577)
Financial income 8 137 35 204
Profit before tax 6,597 14,145 18,349 27,087
Taxes (1,095) (363) (1,133) (339)
Profit for the period 5,502 13,782 17,216 26,748
Attributable to:
Equity holders of the parent 3,571 8,959 11,175 17,551
Non-controlling interests 1,931 4,823 6,041 9,197
5,502 13,782 17,216 26,748
Earnings per share attributable to equity
holders of the parent:
Basic earnings per share (USD) 9 0.11 0.26 0.33 0.53
Diluted earnings per share (USD) 9 0.11 0.26 0.33 0.53
Shares used in computing earnings per share
attributable to equity holders of the parent:
Basic (in thousands) 9 33,946 33,937 33,946 33,366
Diluted (in thousands) 9 33,980 33,937 33,970 33,366

Hafnia Tankers Ltd.
Condensed Consolidated Statement of Comprehensive Income
(Unaudited)
4
For the three months ended For the six months ended
June 30 June 30
2016 2015 2016 2015
(in thousands of U.S. dollars) (in thousands of U.S. dollars)
Profit for the period 5,502 13,782 17,216 26,748
Other comprehensive (loss)
Items that may be reclassified
subsequently to profit or (loss):
Fair value (losses) on cash flow hedges (1,321) (1,373) (3,005) (1,373)
Reclassification to profit or (loss)
related to cash flow hedges 271 34 541 34
Other comprehensive (loss) after tax (1,050) (1,339) (2,464) (1,339)
Total comprehensive income 4,452 12,443 14,752 25,409
Attributable to:
Equity holders of the parent 2,890 8,085 9,576 16,676
Non-controlling interests 1,562 4,358 5,176 8,733
4,452 12,443 14,752 25,409

Hafnia Tankers Ltd.
Condensed Consolidated Statement of Changes in Equity
(Unaudited)
5
Attributable to the equity holders of the parent
Non-
controlling
interests
Share
capital
nominal
Additional
paid in
capital
Accumulated
profits
Cash flow
hedging
reserve
Total
(in thousands of U.S. dollars) Treasury
shares
Translation
reserve
Total
equity
Balance as of January 1, 2015 323 339,800 12,618 - - (23) 352,718 172,495 525,213
Profit for the period - - 17,551 - - - 17,551 9,197 26,748
Other comprehensive (loss) for the period - - - - (875) - (875) (464) (1,339)
Total comprehensive income - - 17,551 - (875) - 16,676 8,733 25,409
Capital contribution 16 13,183 - - - - 13,199 20,831 34,030
Cost related to capital contribution - (850) - - - - (850) - (850)
Prepaid costs relating to future share issuance - (737) - - - - (737) - (737)
Purchase of treasury shares - - - (200) - - (200) - (200)
Share-based compensation - - 1,261 - - - 1,261 - 1,261
Reallocation of non-controlling interests - 551 (437) - - - 113 (113) -
16 12,147 824 (200) - - 12,786 20,718 33,504
Balance as of June 30, 2015 339 351,947 30,994 (200) (875) (23) 382,182 201,946 584,128
Balance as of January 1, 2016 339 351,743 53,077 (200) (1,767) (34) 403,158 213,445 616,603
Profit for the period - - 11,175 - - - 11,175 6,041 17,216
Other comprehensive (loss) for the period - - - - (1,599) - (1,599) (865) (2,464)
Total comprehensive income - - 11,175 - (1,599) - 9,576 5,176 14,752
Prepaid costs relating to future share issuance - (76) - - - - (76) - (76)
Share-based compensation - - 1,354 - - - 1,354 - 1,354
Dividend paid, $0.592 per share - - (30,947) - - - (30,947) - (30,947)
Reallocation of non-controlling interests - 27 10,384 - - - 10,411 (10,411) -
- (49) (19,209) - - - (19,258) (10,411) (29,669)
Balance as of June 30, 2016 339 351,694 45,043 (200) (3,366) (34) 393,476 208,210 601,686

Hafnia Tankers Ltd.
Condensed Consolidated Statement of Cash Flow
(Unaudited)
6
For the six months ended
June 30
Note 2016 2015
(in thousands of U.S. dollars)
Operating activities
Profit for the period 17,216 26,748
Depreciation 4 20,893 14,632
Amortization of time charters acquired 3 2,057 2,339
Share-based compensation 1,354 1,261
Financial expenses 10,134 7,577
Tax expense 1,133 592
Share of associates profit 2,158 (1,199)
54,945 51,951
Changes in assets and liabilities:
Decrease / (increase) in inventories 191 (1,153)
Decrease / (increase) in accounts receivable 8,415 (1,224)
Decrease / (increase) in prepaid expenses and other receivables 217 (8,392)
(increase) in pool working capital deposit 5 (1,400) (4,500)
(decrease) / increase in accounts payable (139) 3,146
(decrease) / increase in accrued expenses and other payables (1,611) 3,414
Increase in deferred income 378 -
6,051 (8,708)
Financial expenses paid (12,320) (6,200)
Taxes paid (38) (389)
Net cash inflow from operating activities 48,638 36,654
Investing activities
Payments for vessels under construction (49,783) (57,789)
Payments for vessels including drydock (2,035) (140,643)
Net cash (outflow) from investing activities (51,818) (198,432)
Financing activities
Bank loan repayment (45,762) (38,596)
Draw down on credit facility 70,517 211,725
Cost relating to share issuance (76) (906)
Prepaid financing fee (2,899) (2,550)
Dividend paid (30,947) -
Proceeds from share capital increase - 34,030
Purchase of treasury shares - (200)
Net cash (outflow) / inflow from financing activities (9,167) 203,503
Net cash flow from operating, investing and financing activities (12,347) 41,725
Cash and cash equivalents at January 1 122,856 73,746
Effects of exchange rate changes on the balance of cash held in foreign
currencies (35) (35)
Cash and cash equivalents at June 30 110,475 115,436

Hafnia Tankers Ltd.
Notes to the Condensed Consolidated Financial Statements
(Unaudited)
7
(All amounts other than share data are provided in thousands of U.S. dollars, unless otherwise indicated)
Consolidated Financial Statements
1 — General Information
Hafnia Tankers Ltd. (the “Company”) is a private limited company incorporated on October 15, 2013 in the Republic of
the Marshall Islands.
The Company and its subsidiaries (together, the “Group”) provide seaborne transportation of petroleum products
worldwide.
The Company currently holds Class A Units representing approximately 64.9% of the outstanding membership interests
of the Company’s direct subsidiary Hafnia Tankers LLC, while the balance of Hafnia Tankers LLC’s outstanding
membership interests consists of exchangeable Class B and Class C Units held by existing investors representing an
interest of approximately 34.8% and 0.3%, respectively, which are presented as non-controlling interests in the
Company’s financial statements.
2 — Accounting Policies
Basis of Preparation
These unaudited condensed consolidated financial statements for the three and six months ended June 30, 2016 and 2015
have been prepared in accordance with International Accounting Standard (“IAS”) 34 “Interim Financial Reporting” as
issued by the International Accounting Standards Board (“IASB”). Certain information and footnote disclosures required
by International Financial Reporting Standards as issued by the IASB (“IFRS”) for a complete set of annual financial
statements have been omitted, and therefore, these unaudited condensed consolidated financial statements should be read
in conjunction with the Group’s annual consolidated financial statements for the year ended December 31, 2015.
Accounting Policies
The same accounting policies and methods of computation have been followed in these condensed consolidated financial
statements as were applied in the preparation of the Group’s financial statements for the year ended December 31, 2015,
except for the adoption of accounting policies required by IFRS standards effective for accounting periods beginning after
January 1, 2016. The new standards have not had any material effect on the Group’s financial statements.
Accounting Standards and Interpretations Not Yet Adopted
The IASB has issued new or revised accounting standards (IAS and IFRS) and interpretations (IFRICs) that are not
compulsory for the Group in the preparation of the financial statements for the current period. None of them are expected
to have a material impact on the financial reporting for the Group.

Hafnia Tankers Ltd.
Notes to the Condensed Consolidated Financial Statements
(Unaudited)
8
3 — Intangible Assets
Contract values
vessels under Time charters
(in thousands of U.S. dollars) Goodwill construction acquired Total
Cost
Balance at January 1, 2015 6,003 47,932 13,315 67,250
Addition - - - -
Disposals - (21,383) (982) (22,365)
Cost at December 31, 2015 6,003 26,549 12,333 44,885
Accumulated amortization
Balance at January 1, 2015 - (28,673) (4,657) (33,330)
Amortization - (14,980) (4,517) (19,497)
Disposals - 21,383 982 22,365
Accumulated amortization at December 31, 2015 - (22,270) (8,192) (30,462)
Carrying amount at December 31, 2015 6,003 4,279 4,141 14,423
Cost
Balance at January 1, 2016 6,003 26,549 12,333 44,885
Addition - - - -
Disposals - - - -
Cost at June 30, 2016 6,003 26,549 12,333 44,885
Accumulated amortization
Balance at January 1, 2016 - (22,270) (8,192) (30,462)
Amortization - (2,781) (2,057) (4,838)
Disposals - - - -
Accumulated amortization at June 30, 2016 - (25,051) (10,249) (35,300)
Carrying amount at June 30, 2016 6,003 1,498 2,084 9,585
Goodwill has been allocated for impairment testing purposes to the following cash-generating units (CGUs), short-
range (“SR”), medium-range (“MR”) and long-range 1 (“LR1”). As of June 30, 2016, the fair value less cost to sell the
LR1 fleet was greater than its carrying amount, and the value in use test for the SR and MR CGUs was greater than its
carrying amount and thus no impairment losses have been recognized during the period ended June 30, 2016.
Contract values for vessels under construction are related to newbuild contracts which were acquired as a result of the
merger between BTS Tanker Partners Limited and Hafnia Tankers LLC on December 31, 2013 (the “Combination”).
The value of the contracts is added to the cost of vessels under construction on a straight line until the time when the
vessels are delivered. The final vessel is expected to be delivered in the first quarter of 2017.
Time charters acquired are related to time charter contracts which were acquired as a result of the Combination. The
value of the contracts is amortized on a straight line over the remaining contract period. The amortization expense of
USD 2,057 for the period ended June 30, 2016 is recognized as charter hire. The final time charter contract acquired is
expected to run until the second quarter of 2017.

Hafnia Tankers Ltd.
Notes to the Condensed Consolidated Financial Statements
(Unaudited)
9
4 — Tangible Assets
Vessels under
(in thousands of U.S. dollars) Vessels Dry dock construction Total
Cost
Balance at January 1, 2015 496,986 11,507 154,709 663,202
Additions 136,653 8,254 203,674 348,581
Transfers 256,390 5,600 (261,990) -
Disposals - (725) - (725)
Cost at December 31, 2015 890,029 24,636 96,393 1,011,058
Accumulated depreciation
Balance at January 1, 2015 (32,513) (3,728) - (36,241)
Depreciation (29,713) (4,191) - (33,904)
Disposals - 725 - 725
Accumulated depreciation at December 31, 2015 (62,226) (7,194) - (69,420)
Carrying amount at December 31, 2015 827,803 17,442 96,393 941,638
Cost
Balance at January 1, 2016 890,029 24,636 96,393 1,011,058
Additions 458 1,577 52,564 54,599
Transfers 74,108 1,600 (75,709) (1)
Disposals - (359) - (359)
Cost at June 30 2016 964,595 27,454 73,248 1,065,297
Accumulated depreciation
Balance at January 1, 2016 (62,226) (7,194) - (69,420)
Depreciation (18,251) (2,642) - (20,893)
Disposals - 359 - 359
Accumulated depreciation at June 30, 2016 (80,477) (9,477) - (89,954)
Carrying amount at June 30, 2016 884,118 17,977 73,248 975,343
Vessels are pledged to secure the bank loans of the Group.
In accordance with IAS 36 Impairment of Assets, the Company has determined its cash-generating units (CGUs) based
on the vessel classes, namely SR, MR and LR1. As of June 30, 2016, the fair value less cost to sell of the LR1 fleet was
greater than its carrying amount. However, the fair value less cost to sell of the SR and the MR vessels were less than
their carrying amounts and accordingly, a value in use calculation was performed. The significant assumptions applied
in determining the value in use of the SR and MR fleet are the future charter rates, vessel operating expenses and the
discount rate. The Company estimated the future cash flows of the SR and MR CGUs based on a combination of the
current time charter rates for the next three years and the most recent ten-year historical average for one-year time
charter rates for periods thereafter. The Company estimated the operating expenses based on budgets agreed with third
party technical managers for 2016 adjusted for an escalation factor. The future cash flows were then discounted to their
present value.
The value in use calculation was greater than the carrying amount for both SR and MR vessels and as a result of this
testing, no impairment charge was recorded.
Vessels under construction
As of June 30, 2016, the Group has five vessels under construction. These vessels are expected to be delivered to the
Group between the third quarter of 2016 and the first quarter of 2017.
The contractual obligation arising from these newbuild contracts amounted to USD 115,640 as of June 30, 2016.

Hafnia Tankers Ltd.
Notes to the Condensed Consolidated Financial Statements
(Unaudited)
10
5 — Other Assets
As of
June 30 December 31
2016 2015
(in thousands of U.S. dollars)
Deposit of working capital to the pools, long term 25,800 24,400
25,800 24,400
Participating in pools requires a deposit of working capital. The deposit ranges from USD 600 to USD 1,000 per vessel.
The deposit is paid upon entrance to the pool and is repaid when the pool is exited. The amount is non-interest bearing.
6 — Bank Loans
In February 2016, the Group signed a USD 360,000 credit facility. The facility refinanced an existing USD 340,584
credit facility. The credit facility will mature in March 2023 and is priced at LIBOR plus a margin of 2.25%. The
refinanced USD 360,000 credit facility has in accordance with IFRS 9 been treated as a modification to the previous
USD 340,584 credit facility.
For the three months ended June 30, 2016, the Group drew down USD 21,000 on the USD 236,775 credit facility and
USD 22,350 on the USD 360,000 credit facility to finance newbuild vessels delivered in the quarter.
The interest rates on the drawn amounts are LIBOR plus a margin ranging from 2.25% to 2.60% and are to be repaid in
quarterly installments with a balloon payment at the end of the seventh year.
The drawn amounts are secured by first priority mortgages on vessels.
The drawn amounts are subject to the following significant financial covenants:
Working capital above zero
A minimum liquidity above USD 10,000 and above 5% of total debt
Equity above USD 100,000 and above 30% of the total assets
The Group was fully compliant with all loan covenants at June 30, 2016.
The Group is subject to a minimum security value clause under which the vessel values must not exceed a percentage of
the debt. The Group was fully compliant with this clause at June 30, 2016.
The following table summarizes the current contractual maturities of the Group’s bank loans and presents the total
principal amount based on the earliest date on which the Group can be required to pay.
As of June 30, 2016 <1 year 1-5 years >5 years Total
(in thousands of U.S. dollars)
Bank loans 44,869 183,413 298,031 526,313
As of December 31, 2015 <1 year 1-5 years >5 years Total
(in thousands of U.S. dollars)
Bank loans 41,340 196,552 266,421 504,313

Hafnia Tankers Ltd.
Notes to the Condensed Consolidated Financial Statements
(Unaudited)
11
7 — Charter Hire
The table below shows the Group’s time chartered-in vessel commitments as of June 30, 2016, assuming no off-hire
days:
Optional
Earliest extension Subject to Purchase
Type Delivery re-delivery period profit split option
MR 1-16-2014 12-31-2016 No Yes No
MR 1-16-2014 2-21-2017 No Yes No
MR 1-16-2014 5-11-2017 No Yes No
MR 9-15-2017 9-14-2025 2 years No Yes
MR 9-15-2017 9-14-2025 2 years No Yes
LR1 9-15-2012 9-5-2018 No No No
LR1 9-9-2012 8-29-2018 No No No
(in thousands of U.S. dollars) 2016 2017 2018 2019 2020
Minimum charter hire 14,260 17,893 19,431 11,607 11,639
Total as of
June 30 December 31
2021 2022 2023 2024 2025 2016 2015
11,607 11,607 11,607 11,639 8,173 129,463 133,710
8 — General and Administrative Expenses
For the three months ended For the six months ended
June 30 June 30
2016 2015 2016 2015
(in thousands of U.S. dollars) (in thousands of U.S. dollars)
Wages and salaries (1,478) (1,670) (2,876) (3,344)
Outsourced functions (92) (99) (200) (153)
Contributions to defined contribution plans (51) (47) (100) (97)
Other social security costs (6) (4) (12) (7)
Other administrative costs (269) (388) (631) (669)
Auditors, consultants and legal fees (390) (666) (771) (880)
(2,286) (2,874) (4,590) (5,150)
Share based compensation (non-cash) (686) (631) (1,354) (1,262)
(686) (631) (1,354) (1,262)
(2,972) (3,505) (5,944) (6,412)

Hafnia Tankers Ltd.
Notes to the Condensed Consolidated Financial Statements
(Unaudited)
12
9 — Earnings Per Share
For the three months ended
June 30
2016 2015
Profit for the period (USD thousand) 5,502 13,782
Consolidated profit attributable to non-controlling interests 1,931 4,823
Profit attributable to equity holders of the parent (USD thousand) 3,571 8,959
Weighted average number of shares (in thousands) 33,946 33,937
Diluted weighted average number of shares in issue (in thousands) 33,980 33,937
Earnings per share (USD) 0.11 0.26
Diluted earnings per share (USD) 0.11 0.26
For the six months ended
June 30
2016 2015
Profit for the period (USD thousand) 17,216 26,748
Consolidated profit attributable to non-controlling interests 6,041 9,197
Profit attributable to equity holders of the parent (USD thousand) 11,175 17,551
Weighted average number of shares (in thousands) 33,946 33,366
Diluted weighted average number of shares in issue (in thousands) 33,970 33,366
Earnings per share (USD) 0.33 0.53
Diluted earnings per share (USD) 0.33 0.53
During the period ended June 30, 2016, potentially dilutive securities include 18,191,712 Class B Units and 162,911
Class C Units. The Class B Units and the Class C Units have not had a dilutive effect for the period ended June 30,
2016. The Class B Units and the Class C Units are exchangeable on a one-for-one basis for the Company’s common
shares. The Class B Units and the Class C Units are considered in computing diluted profit or loss per share on an “if-
converted” basis. During the period ended June 30, 2016, a total of 2,300,000 warrants, 200,000 options and 34,291
Restricted Stock Units with a potential dilutive effect has been granted to employees. The warrant and options have not
had a dilutive effect in 2016 as they are not in the money.
10 — Categories of Financial Instruments
As of
June 30 December 31
2016 2015
Financial assets (in thousands of U.S. dollars)
Cash and cash equivalents 110,475 122,856
Receivables 33,354 40,122
Financial liabilities
Bank loans 526,313 504,313
Financial liabilities measure at amortised cost 9,259 12,974
Derivative instruments in designated hedge accounting
relationships 5,166 2,702

Hafnia Tankers Ltd.
Notes to the Condensed Consolidated Financial Statements
(Unaudited)
13
11 — Cash Flow Hedging
The Group has agreements to hedge part of the interest rate exposure to comply with the adopted Risk Management
Policy. The cost of the hedging instruments is paid over the period of the contracts.
The fair market value of the total hedging agreements as of June 30, 2016 was negative USD 5,166. The fair market
value of the hedging agreement is comprised of discounted premiums, negative USD 7,867, and the value of the
hedging instruments, USD 2,701.
12 — Fair Value Measurements
Except for the hedge agreements entered into in the second quarter of 2015 and the first quarter of 2016, no assets or
liabilities are measured at fair value after initial recognition, and the carrying values of financial instruments
approximate their respective fair values. Therefore, no additional disclosure related to fair value measurement has been
provided in these financial statements.
13 — Subsequent Events
Except for the below, there have not been any significant events after the balance sheet date at June 30, 2016.
In August, 2016, the Group took delivery of the fourth MR newbuild vessels (Hafnia Daisy) under the newbuild
program. To finance the payment at delivery, a drawdown on our USD 360,000 credit facility of USD 21,600 was
made.
The Condensed Consolidated Financial Statements were authorized for issuance by the Board of Directors on August
18, 2016.


![Tankers [Compatibility Mode]](https://img.dokumen.tips/doc/110x75/577cd8091a28ab9e78a04a70/tankers-compatibility-mode.jpg)


