Embed Size (px)
Citation preview
Hafnia Tankers Ltd.
Interim Report
For the Three Months Ended March 31, 2016 and 2015
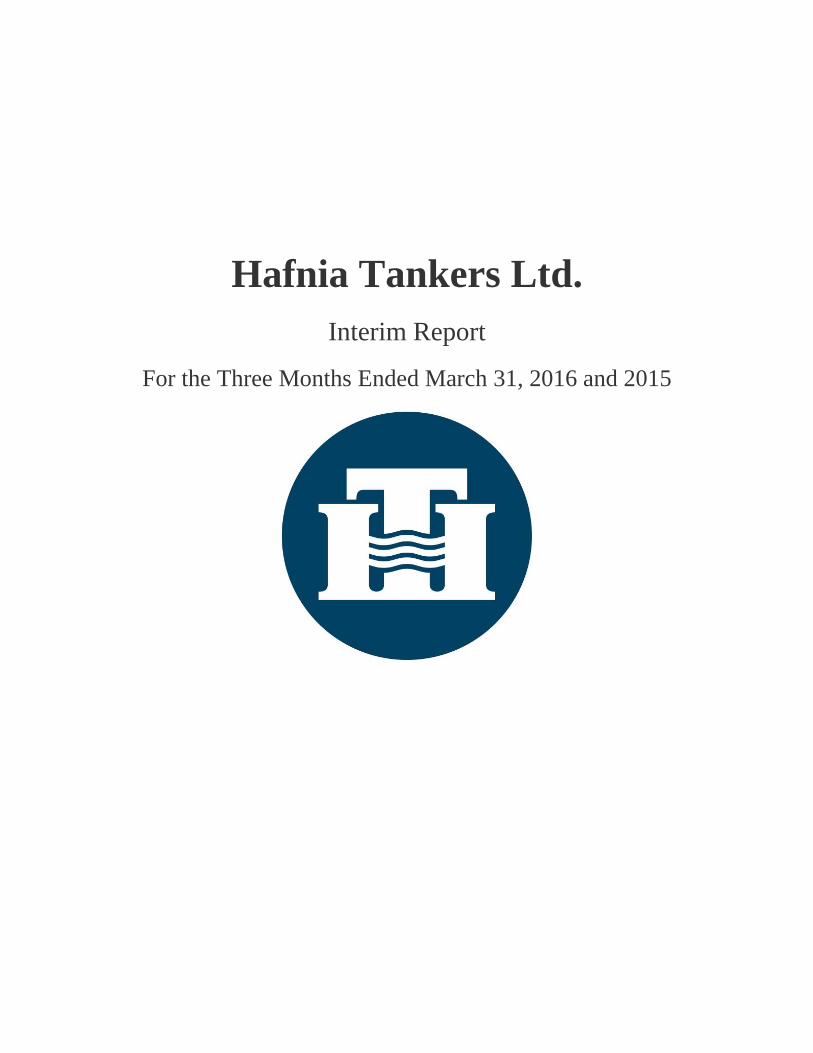
Hafnia Tankers Ltd.
Condensed Consolidated Balance Sheet
(Unaudited)
1
March 31 December 31
Note 2016 2015
ASSETS
Current assets
Cash and cash equivalents 135,329 122,856
Accounts receivable 2,577 12,919
Prepaid expenses and other receivables 17,315 13,282
Inventories 4,405 4,496
Total current assets 159,626 153,553
Non-current assets
Vessels and dry dock 4 835,160 845,245
Vessels under construction 4 101,334 96,393
Goodwill 3 6,003 6,003
Time charters acquired 3 3,113 4,141
Contract values vessels under construction 3 2,773 4,279
Prepaid financing fee - 920
Interests in associates 4,504 4,108
Pool working capital deposit 5 24,400 24,400
Deferred tax 347 338
Total non-current assets 977,634 985,827
Total assets 1,137,260 1,139,380
LIABILITIES & EQUITY
Current liabilities
Bank loans 6 43,160 41,340
Accounts payable 3,223 3,433
Payables to shareholders 30,962 -
Accrued expenses and other payables 6,909 12,261
Deferred revenue 474 -
Tax payable 85 68
Total current liabilities 84,813 57,102
Non-current liabilities
Bank loans 6 451,751 462,973
Derivatives 4,116 2,702
Total non-current liabilities 455,867 465,675
Total liabilities 540,680 522,777
Shareholders' equity
Issued, authorized and paid in share capital
Share capital 339 339
Additional paid in capital 7 351,724 351,743
Treasury shares (200) (200)
Accumulated profits 41,017 53,077
Cash flow hedging reserve (2,685) (1,767)
Translation reserve (34) (34)
Equity holders of the parent 390,161 403,158
Non-controlling interests 206,419 213,445
Total equity 596,580 616,603
Total liabilities and equity 1,137,260 1,139,380
(in thousands of U.S. dollars)
As of

Hafnia Tankers Ltd.
Consolidated Statement of Profit
(Unaudited)
2
Note 2016 2015
Revenue
Revenue 54,623 45,823
54,623 45,823
Operating expenses
Vessel operating costs (16,307) (11,105)
Technical management fee (1,146) (822)
Charter hire (8,140) (8,344)
Voyage expenses (114) (138)
Depreciation 4 (10,421) (6,560)
General and administrative expenses 8 (2,972) (2,907)
Total operating expenses (39,100) (29,875)
Other operating income
Other operating income 1,167 -
Share of associates profit 393 598
1,560 598
Operating profit 17,083 16,546
Financial expenses and income
Financial expenses (5,358) (3,543)
Financial income 27 67
Profit before tax 11,752 13,070
Taxes (38) (103)
Profit for the period 11,714 12,967
Attributable to:
Equity holders of the parent 7,604 8,593
Non-controlling interests 4,110 4,374
11,714 12,967
Earnings per share attributable to equity holders of the parent:
Basic earnings per share (USD) 9 0.22 0.26
Diluted earnings per share (USD) 9 0.22 0.26
Basic (in thousands) 9 33,946 32,789
Diluted (in thousands) 9 33,962 32,789
March 31
For the three months ended
(in thousands of U.S. dollars)
Shares used in computing earnings per share attributable to equity
holders of the parent:
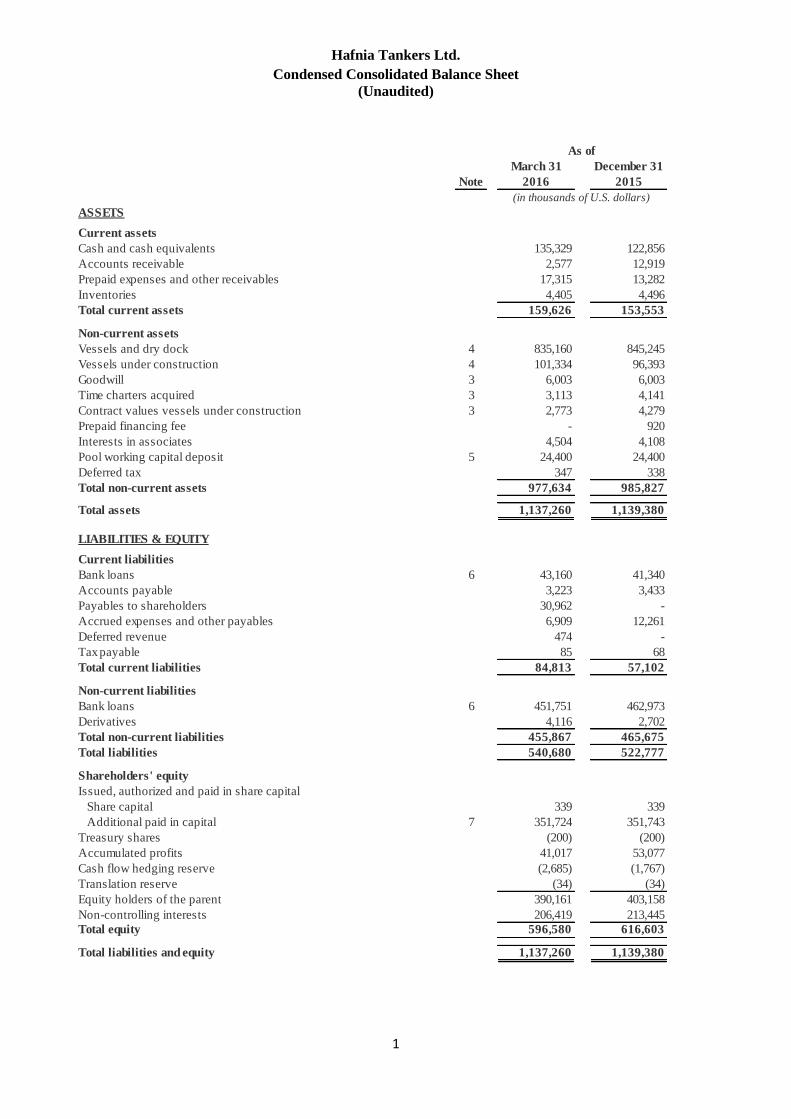
Hafnia Tankers Ltd.
Consolidated Statement of Comprehensive Income
(Unaudited)
3
2016 2015
Profit for the period 11,714 12,967
Other comprehensive (loss)
Items that may be reclassified subsequently to profit or loss:
Fair value losses on cash flow hedges (1,684) -
Reclassification to profit or loss related to cash flow hedges 270 -
Other comprehensive (loss) after tax (1,414) -
Total comprehensive income 10,300 12,967
Attributable to:
Equity holders of the parent 6,686 8,593
Non-controlling interests 3,614 4,374
10,300 12,967
For the three months ended
(in thousands of U.S. dollars)
March 31

Hafnia Tankers Ltd.
Consolidated Statement of Changes in Equity
(Unaudited)
4
(in thousands of U.S. dollars)
Treasury
shares
Translation
reserve Total equity
Balance as of January 1, 2015 323 339,800 12,618 - - (23) 352,718 172,495 525,213
Profit for the period - - 8,593 - - - 8,593 4,374 12,967
Total comprehensive income - - 8,593 - - - 8,593 4,374 12,967
Capital contribution 16 13,183 - - - 13,199 20,831 34,030
Cost related to capital contribution - (850) - - - (850) - (850)
Prepaid costs relating to future share issuance - (364) - - - - (364) - (364)
Share-based compensation - - 631 - - - 631 - 631
Reallocation of non-controlling interests - 406 (211) - - - 195 (195) -
16 12,375 420 - - - 12,811 20,636 33,447
Balance as of March 31, 2015 339 352,175 21,631 - - (23) 374,122 197,505 571,627
Balance as of January 1, 2016 339 351,743 53,077 (200) (1,767) (34) 403,158 213,445 616,603
Profit for the period - - 7,604 - - - 7,604 4,110 11,714
Other comprehensive (loss) for the period - - - - (918) - (918) (496) (1,414)
Total comprehensive income - - 7,604 - (918) - 6,686 3,614 10,300
Prepaid costs relating to future share issuance - (29) - - - - (29) - (29)
Share-based compensation - - 668 - - - 668 - 668
Dividend paid - - (30,962) - - - (30,962) - (30,962)
Reallocation of non-controlling interests - 10 10,630 - - - 10,640 (10,640) -
- (19) (19,664) - - - (19,683) (10,640) (30,323)
Balance as of March 31, 2016 339 351,724 41,017 (200) (2,685) (34) 390,161 206,419 596,580
Non-
controlling
interest
Attributable to the equity holders of the parent
Total
Share
capital
nominal
Additional
paid in
capital
Accumulated
profits
Cash flow
hedging
reserve
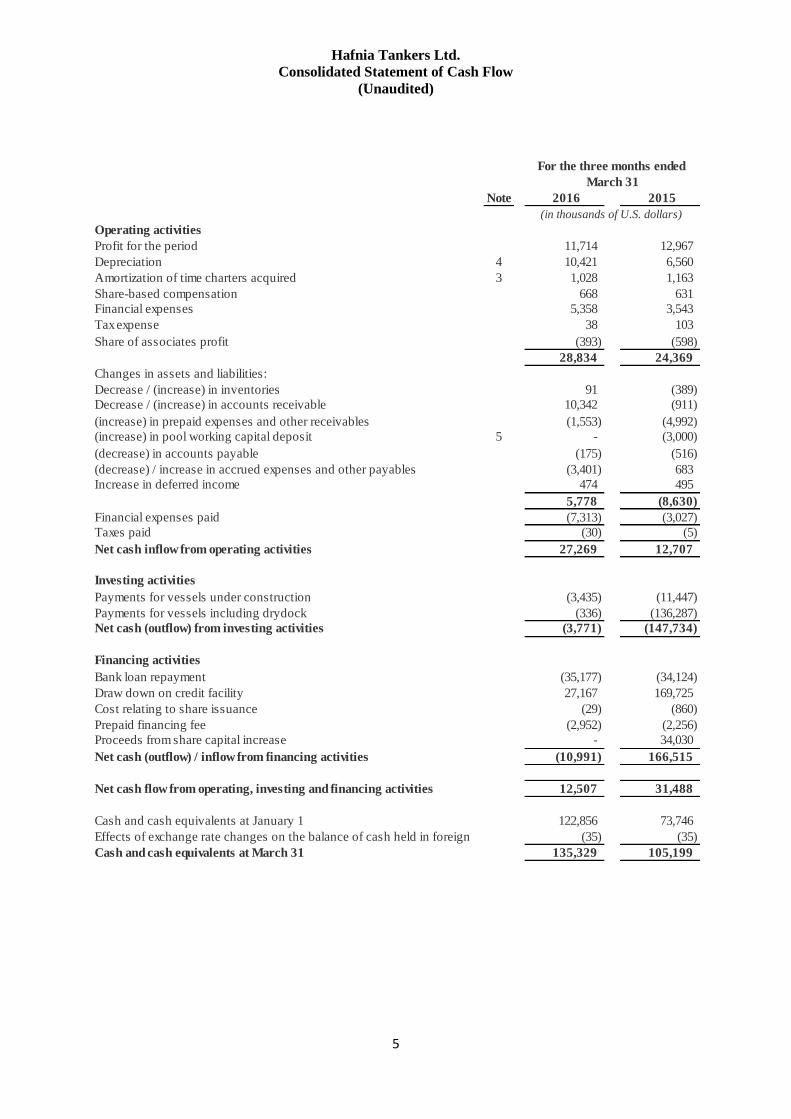
Hafnia Tankers Ltd.
Consolidated Statement of Cash Flow
(Unaudited)
5
Note 2016 2015
Operating activities
Profit for the period 11,714 12,967
Depreciation 4 10,421 6,560
Amortization of time charters acquired 3 1,028 1,163
Share-based compensation 668 631
Financial expenses 5,358 3,543
Tax expense 38 103
Share of associates profit (393) (598)
28,834 24,369
Changes in assets and liabilities:
Decrease / (increase) in inventories 91 (389)
Decrease / (increase) in accounts receivable 10,342 (911)
(increase) in prepaid expenses and other receivables (1,553) (4,992)
(increase) in pool working capital deposit 5 - (3,000)
(decrease) in accounts payable (175) (516)
(decrease) / increase in accrued expenses and other payables (3,401) 683
Increase in deferred income 474 495
5,778 (8,630)
Financial expenses paid (7,313) (3,027)
Taxes paid (30) (5)
Net cash inflow from operating activities 27,269 12,707
Investing activities
Payments for vessels under construction (3,435) (11,447)
Payments for vessels including drydock (336) (136,287)
Net cash (outflow) from investing activities (3,771) (147,734)
Financing activities
Bank loan repayment (35,177) (34,124)
Draw down on credit facility 27,167 169,725
Cost relating to share issuance (29) (860)
Prepaid financing fee (2,952) (2,256)
Proceeds from share capital increase - 34,030
Net cash (outflow) / inflow from financing activities (10,991) 166,515
Net cash flow from operating, investing and financing activities 12,507 31,488
Cash and cash equivalents at January 1 122,856 73,746
Effects of exchange rate changes on the balance of cash held in foreign (35) (35)
Cash and cash equivalents at March 31 135,329 105,199
For the three months ended
(in thousands of U.S. dollars)
March 31
Hafnia Tankers Ltd.
Notes to the Consolidated Financial Statements
(Unaudited)
6
(All amounts other than share data are provided in thousands of U.S. dollars, unless otherwise indicated)
Consolidated Financial Statements
1. General Information
Hafnia Tankers Ltd. (the “Company”) is a private limited company incorporated on October 15, 2013 in the
Republic of the Marshall Islands.
The Company and its subsidiaries (together, the “Group”) provide seaborne transportation of petroleum
products worldwide.
The Company currently holds Class A Units representing approximately 64.9% of the outstanding membership
interests of the Company’s direct subsidiary Hafnia Tankers LLC, while the balance of Hafnia Tankers LLC’s
outstanding membership interests consist of exchangeable Class B and Class C Units held by existing investors
representing an interest of approximately 34.8% and 0.3%, respectively, which are presented as non-
controlling interests in the Company’s financial statements.
2. Accounting Policies
Basis of Preparation
These unaudited condensed consolidated financial statements for the three months ended March 31, 2016 and
2015 have been prepared in accordance with International Accounting Standard (“IAS”) 34 “Interim Financial
Reporting” as issued by the International Accounting Standards Board (“IASB”). Certain information and
footnote disclosures required by International Financial Reporting Standards as issued by the IASB (“IFRS”)
for a complete set of annual financial statements have been omitted, and therefore, these unaudited condensed
consolidated financial statements should be read in conjunction with the Group’s annual consolidated financial
statements for the year ended December 31, 2015.
Accounting Policies
The same accounting policies and methods of computation have been followed in these condensed
consolidated financial statements as were applied in the preparation of the Group’s financial statements for the
year ended December 31, 2015, except for the adoption of accounting policies required by IFRS standards
effective for accounting periods beginning after January 1, 2016. The new standards have not had any material
effect on the Group’s financial statements.
Accounting Standards and Interpretations Not Yet Adopted
The IASB has issued new or revised accounting standards (IAS and IFRS) and interpretations (IFRICs) that
are not compulsory for the Group in the preparation of the financial statements for the current period. None of
them is expected to have a material impact on the financial reporting for the Group.
Hafnia Tankers Ltd.
Notes to the Consolidated Financial Statements
(Unaudited)
7
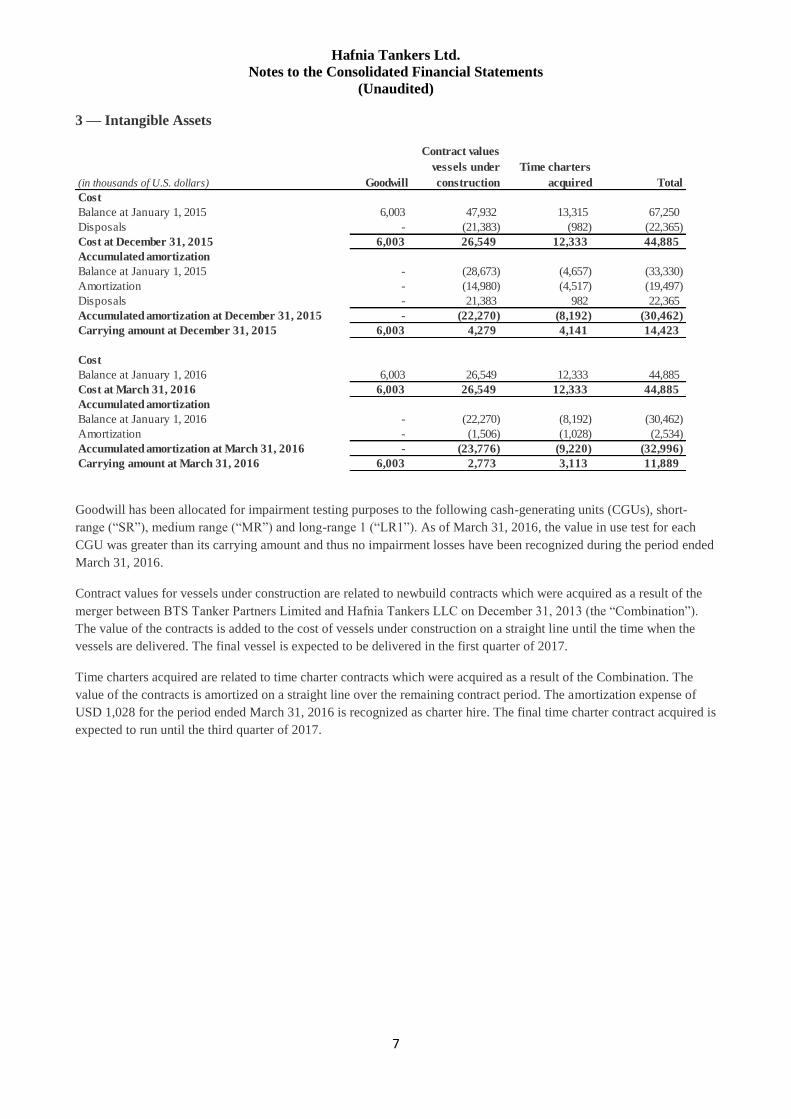
3 — Intangible Assets
Goodwill has been allocated for impairment testing purposes to the following cash-generating units (CGUs), short-
range (“SR”), medium range (“MR”) and long-range 1 (“LR1”). As of March 31, 2016, the value in use test for each
CGU was greater than its carrying amount and thus no impairment losses have been recognized during the period ended
March 31, 2016.
Contract values for vessels under construction are related to newbuild contracts which were acquired as a result of the
merger between BTS Tanker Partners Limited and Hafnia Tankers LLC on December 31, 2013 (the “Combination”).
The value of the contracts is added to the cost of vessels under construction on a straight line until the time when the
vessels are delivered. The final vessel is expected to be delivered in the first quarter of 2017.
Time charters acquired are related to time charter contracts which were acquired as a result of the Combination. The
value of the contracts is amortized on a straight line over the remaining contract period. The amortization expense of
USD 1,028 for the period ended March 31, 2016 is recognized as charter hire. The final time charter contract acquired is
expected to run until the third quarter of 2017.
(in thousands of U.S. dollars)
Cost
Balance at January 1, 2015
Disposals
Cost at December 31, 2015
Accumulated amortization
Balance at January 1, 2015
Amortization
Disposals
Accumulated amortization at December 31, 2015
Carrying amount at December 31, 2015
Cost
Balance at January 1, 2016
Cost at March 31, 2016
Accumulated amortization
Balance at January 1, 2016
Amortization
Accumulated amortization at March 31, 2016
Carrying amount at March 31, 2016
Time charters
acquiredGoodwill
Contract values
vessels under
construction
-
-
6,003
6,003
6,003
-
-
-
6,003
47,932
(21,383)
26,549
(28,673)
(14,980)
6,003
-
6,003
-
-
(23,776)
2,773
21,383
(22,270)
4,279
26,549
26,549
13,315
(982)
12,333
(4,657)
(4,517)
(22,270)
(1,506)
Total
67,250
(22,365)
44,885
(33,330)
(19,497)
982
(30,462)
(2,534)
(32,996)
11,889
(8,192)
(1,028)
(9,220)
3,113
22,365
(30,462)
14,423
44,885
44,885
(8,192)
4,141
12,333
12,333
Hafnia Tankers Ltd.
Notes to the Consolidated Financial Statements
(Unaudited)
8
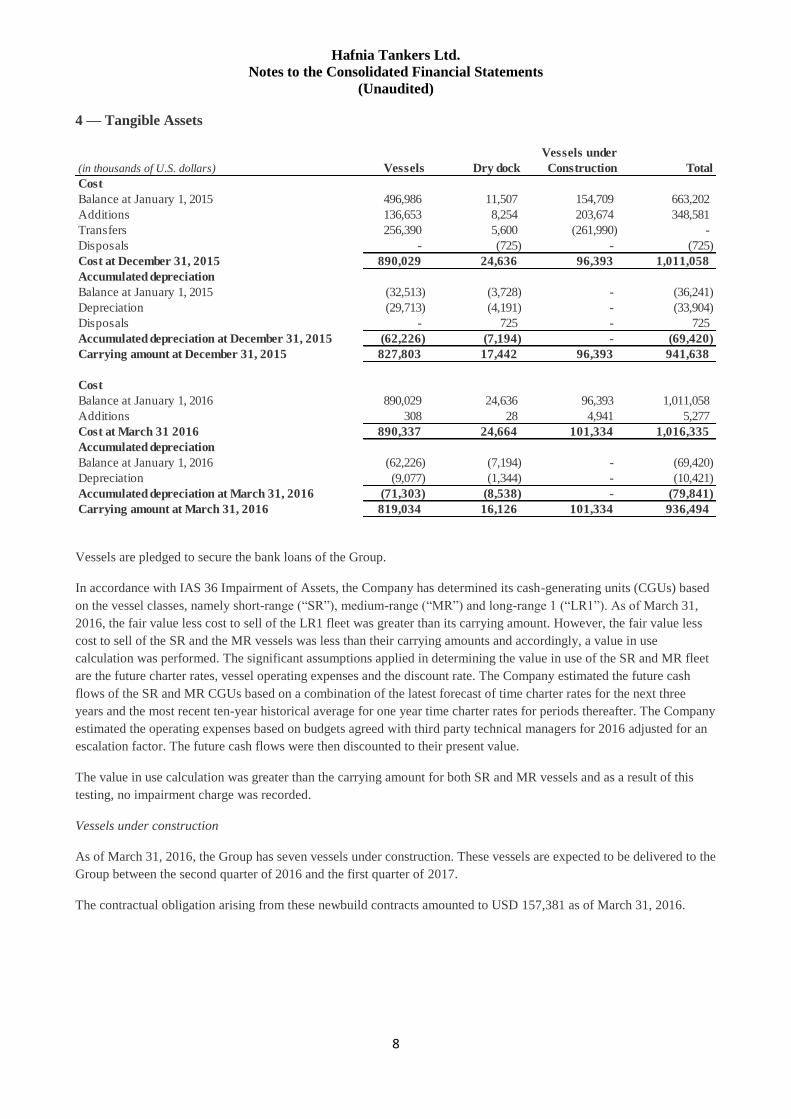
4 — Tangible Assets
Vessels are pledged to secure the bank loans of the Group.
In accordance with IAS 36 Impairment of Assets, the Company has determined its cash-generating units (CGUs) based
on the vessel classes, namely short-range (“SR”), medium-range (“MR”) and long-range 1 (“LR1”). As of March 31,
2016, the fair value less cost to sell of the LR1 fleet was greater than its carrying amount. However, the fair value less
cost to sell of the SR and the MR vessels was less than their carrying amounts and accordingly, a value in use
calculation was performed. The significant assumptions applied in determining the value in use of the SR and MR fleet
are the future charter rates, vessel operating expenses and the discount rate. The Company estimated the future cash
flows of the SR and MR CGUs based on a combination of the latest forecast of time charter rates for the next three
years and the most recent ten-year historical average for one year time charter rates for periods thereafter. The Company
estimated the operating expenses based on budgets agreed with third party technical managers for 2016 adjusted for an
escalation factor. The future cash flows were then discounted to their present value.
The value in use calculation was greater than the carrying amount for both SR and MR vessels and as a result of this
testing, no impairment charge was recorded.
Vessels under construction
As of March 31, 2016, the Group has seven vessels under construction. These vessels are expected to be delivered to the
Group between the second quarter of 2016 and the first quarter of 2017.
The contractual obligation arising from these newbuild contracts amounted to USD 157,381 as of March 31, 2016.
(in thousands of U.S. dollars)
Cost
Balance at January 1, 2015
Additions
Transfers
Disposals
Cost at December 31, 2015
Accumulated depreciation
Balance at January 1, 2015
Depreciation
Disposals
Accumulated depreciation at December 31, 2015
Carrying amount at December 31, 2015
Cost
Balance at January 1, 2016
Additions
Cost at March 31 2016
Accumulated depreciation
Balance at January 1, 2016
Depreciation
Accumulated depreciation at March 31, 2016
Carrying amount at March 31, 2016 936,494 101,334
Total
663,202
348,581
-
(725)
1,011,058
(36,241)
(33,904)
725
(69,420)
941,638
1,011,058
5,277
1,016,335
(69,420)
Vessels under
Construction
154,709
203,674
-
16,126
Dry dock
11,507
8,254
5,600
(725)
24,636
(3,728)
(4,191)
725
(7,194)
17,442
24,636
(8,538)
(10,421)
(261,990)
-
96,393
-
-
-
-
96,393
96,393
4,941
(79,841)
-
-
28
24,664
(7,194)
(1,344)
101,334
496,986
136,653
256,390
-
890,029
(32,513)
(29,713)
-
(62,226)
(62,226)
(9,077)
(71,303)
819,034
827,803
890,029
308
890,337
Vessels
Hafnia Tankers Ltd.
Notes to the Consolidated Financial Statements
(Unaudited)
9
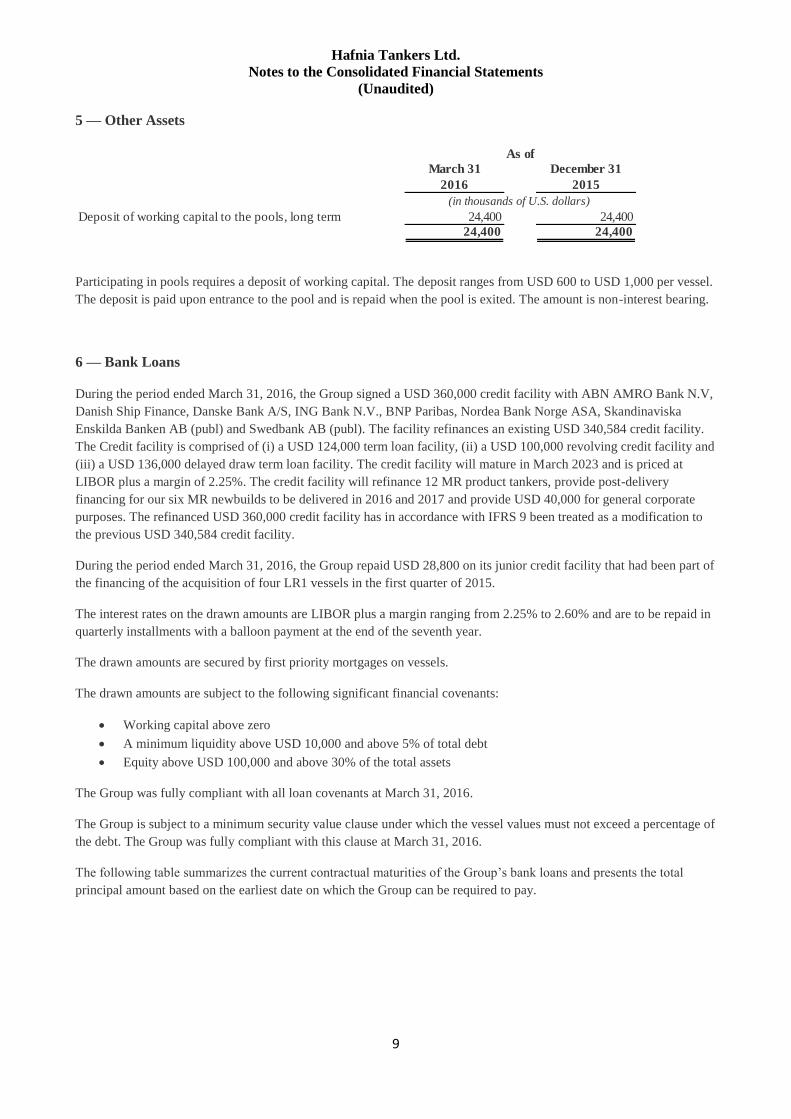
5 — Other Assets
Participating in pools requires a deposit of working capital. The deposit ranges from USD 600 to USD 1,000 per vessel.
The deposit is paid upon entrance to the pool and is repaid when the pool is exited. The amount is non-interest bearing.
6 — Bank Loans
During the period ended March 31, 2016, the Group signed a USD 360,000 credit facility with ABN AMRO Bank N.V,
Danish Ship Finance, Danske Bank A/S, ING Bank N.V., BNP Paribas, Nordea Bank Norge ASA, Skandinaviska
Enskilda Banken AB (publ) and Swedbank AB (publ). The facility refinances an existing USD 340,584 credit facility.
The Credit facility is comprised of (i) a USD 124,000 term loan facility, (ii) a USD 100,000 revolving credit facility and
(iii) a USD 136,000 delayed draw term loan facility. The credit facility will mature in March 2023 and is priced at
LIBOR plus a margin of 2.25%. The credit facility will refinance 12 MR product tankers, provide post-delivery
financing for our six MR newbuilds to be delivered in 2016 and 2017 and provide USD 40,000 for general corporate
purposes. The refinanced USD 360,000 credit facility has in accordance with IFRS 9 been treated as a modification to
the previous USD 340,584 credit facility.
During the period ended March 31, 2016, the Group repaid USD 28,800 on its junior credit facility that had been part of
the financing of the acquisition of four LR1 vessels in the first quarter of 2015.
The interest rates on the drawn amounts are LIBOR plus a margin ranging from 2.25% to 2.60% and are to be repaid in
quarterly installments with a balloon payment at the end of the seventh year.
The drawn amounts are secured by first priority mortgages on vessels.
The drawn amounts are subject to the following significant financial covenants:
Working capital above zero
A minimum liquidity above USD 10,000 and above 5% of total debt
Equity above USD 100,000 and above 30% of the total assets
The Group was fully compliant with all loan covenants at March 31, 2016.
The Group is subject to a minimum security value clause under which the vessel values must not exceed a percentage of
the debt. The Group was fully compliant with this clause at March 31, 2016.
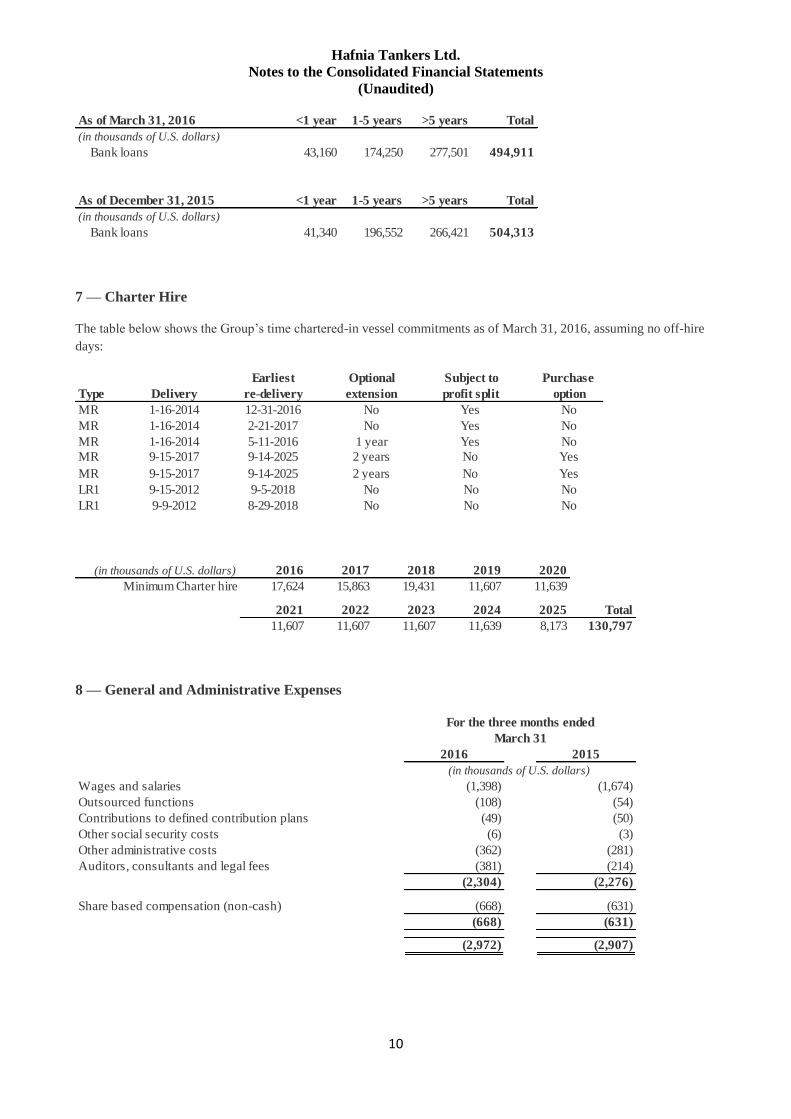
The following table summarizes the current contractual maturities of the Group’s bank loans and presents the total
principal amount based on the earliest date on which the Group can be required to pay.
Deposit of working capital to the pools, long term
March 31
(in thousands of U.S. dollars)
As of
December 31
2015
24,400
24,400
2016
24,400
24,400
Hafnia Tankers Ltd.
Notes to the Consolidated Financial Statements
(Unaudited)
10
7 — Charter Hire
The table below shows the Group’s time chartered-in vessel commitments as of March 31, 2016, assuming no off-hire
days:
8 — General and Administrative Expenses
1-5 years
174,250
>5 years
277,501
TotalAs of March 31, 2016
As of December 31, 2015
(in thousands of U.S. dollars)
Bank loans
<1 year
43,160
<1 year
41,340
494,911
Total
504,313
>5 years
266,421
1-5 years
196,552
(in thousands of U.S. dollars)
Bank loans
No
No
Optional
extension
No
No
1 year
2 years
2 years
Purchase Earliest
re-delivery
12-31-2016
2-21-2017
5-11-2016
9-14-2025
9-14-2025
9-5-2018
8-29-2018
Type
MR
MR
MR
MR
MR
LR1
LR1
Delivery
1-16-2014
1-16-2014
1-16-2014
9-15-2017
9-15-2017
9-15-2012
9-9-2012
option
No
No
No
Yes
Yes
No
No
Subject to
profit split
Yes
Yes
Yes
No
No
No
No
(in thousands of U.S. dollars)
Minimum Charter hire
130,79711,639
2020
11,639
2025
8,173
2024 Total
2016
17,624
2021
11,607
2017
15,863
2022
11,607
2018
19,431
2023
11,607
2019
11,607
Wages and salaries
Outsourced functions
Contributions to defined contribution plans
Other social security costs
Other administrative costs
Auditors, consultants and legal fees
Share based compensation (non-cash)
(631)
(2,907)
(1,674)
(50)
(3)
(281)
(214)
(2,276)
(631)
2015
(362)
(381)
(2,304)
(668)
(668)
(2,972)
2016
(1,398)
(49)
(6)
For the three months ended
March 31
(in thousands of U.S. dollars)
(108) (54)
Hafnia Tankers Ltd.
Notes to the Consolidated Financial Statements
(Unaudited)
11
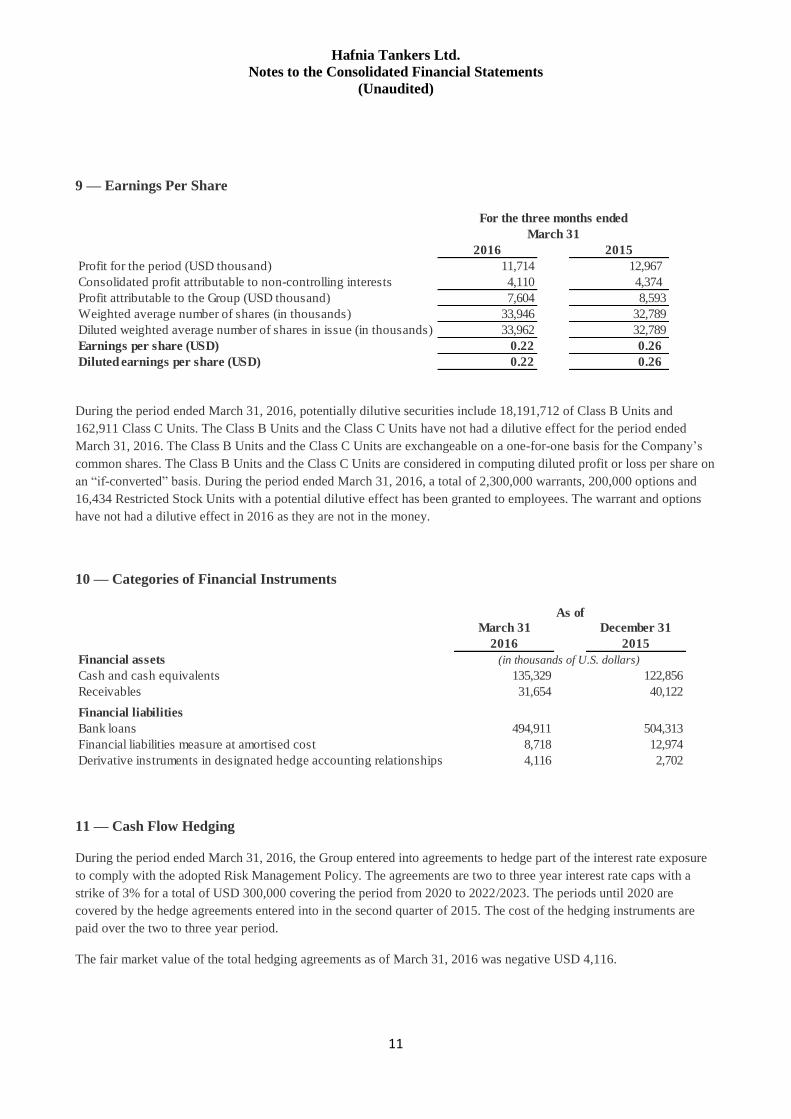
9 — Earnings Per Share
During the period ended March 31, 2016, potentially dilutive securities include 18,191,712 of Class B Units and
162,911 Class C Units. The Class B Units and the Class C Units have not had a dilutive effect for the period ended
March 31, 2016. The Class B Units and the Class C Units are exchangeable on a one-for-one basis for the Company’s
common shares. The Class B Units and the Class C Units are considered in computing diluted profit or loss per share on
an “if-converted” basis. During the period ended March 31, 2016, a total of 2,300,000 warrants, 200,000 options and
16,434 Restricted Stock Units with a potential dilutive effect has been granted to employees. The warrant and options
have not had a dilutive effect in 2016 as they are not in the money.
10 — Categories of Financial Instruments
11 — Cash Flow Hedging
During the period ended March 31, 2016, the Group entered into agreements to hedge part of the interest rate exposure
to comply with the adopted Risk Management Policy. The agreements are two to three year interest rate caps with a
strike of 3% for a total of USD 300,000 covering the period from 2020 to 2022/2023. The periods until 2020 are
covered by the hedge agreements entered into in the second quarter of 2015. The cost of the hedging instruments are
paid over the two to three year period.
The fair market value of the total hedging agreements as of March 31, 2016 was negative USD 4,116.
Profit for the period (USD thousand)
Consolidated profit attributable to non-controlling interests
Profit attributable to the Group (USD thousand)
Weighted average number of shares (in thousands)
Diluted weighted average number of shares in issue (in thousands)
Earnings per share (USD)
Diluted earnings per share (USD)
2015
12,967
4,374
8,593
32,789
32,789
0.26
0.26 0.22
2016
11,714
4,110
7,604
33,946
33,962
0.22
For the three months ended
March 31
Financial assets
Cash and cash equivalents
Receivables
Financial liabilities
Bank loans
Financial liabilities measure at amortised cost
Derivative instruments in designated hedge accounting relationships
494,911
8,718
4,116
March 31
2016
135,329
31,654
December 31
2015
122,856
40,122
As of
(in thousands of U.S. dollars)
504,313
12,974
2,702
Hafnia Tankers Ltd.
Notes to the Consolidated Financial Statements
(Unaudited)
12
12 — Fair Value Measurements
Except for the hedge agreements entered into in the second quarter of 2015 and the first quarter of 2016, no assets or
liabilities are measured at fair value after initial recognition, and the carrying values of financial instruments
approximate their respective fair values. Therefore, no additional disclosure related to fair value measurement has been
provided in these financial statements.
13 — Subsequent Events
Except for the below, there have not been any significant events after the balance sheet date at March 31, 2016.
In April, 2016, the Group paid out USD 30,962 in dividends to the common shareholders. Since the dividends were
authorized by the Board of Directors on March 23, 2016, they have been presented as a payable to shareholders in the
balance sheet at March 31, 2016.