Embed Size (px)
Citation preview
Guidance ManualHow to Establish and Operate Cleaner Production Centres
A B O U T T H E G U I D A N C E M A N U A L
About theGuidance Manual
A B O U T T H E G U I D A N C E M A N U A L
UNIDO/ UNEP Guidance Manual on How toEstablish and Operate Cleaner ProductionCentres
Introduction to the Guidance ManualWelcome to the UNIDO / UNEP Guidance Manual on How toEstablish and Operate Cleaner Production Centres!
Cleaner Production Centres (CPCs) / National Cleaner ProductionCenters (NCPCs) have become a major source of expertise andadvice on cleaner production in their respective countries. To date,24 NCPCs have been created within the context of the NCPCProgramme established jointly by UNIDO and UNEP. In parallel,more than 100 CPCs have been created through bilateral,governmental and other forms of assistance. There is now anextensive network of cleaner production-related institutions capableof delivering cleaner production at the local and national levels, andit is envisaged that this network will be enriched through theaddition of more (new) Centres.
An upcoming or newly established Centre requires information andguidance about the various aspects of establishing and running thesame. Previous experience suggests that it is both time-consumingand expensive to provide such guidance through an internationalexpert. This realization, coupled with the need for specific guidanceled to the preparation of this Training Manual.
This Guidance Manual is intended not only to provide you with acomprehensive account of all the planning that goes into setting upa new National Production Centre, but also the coarser and finerpoints that you would need to get into for successful operation ofsuch an institution. In essence, the Manual intends to provide acrucial platform for capacity building for new as well as existingCleaner Production Centres.
About this Guidance ManualThe Manual has been presented in six parts (Parts 1 to 6). The partshave been structured sequentially and logically so as to help youobtain an easy grasp of each topic. To illustrate, a brief synopsis ofeach part is provided below.
A B O U T T H E G U I D A N C E M A N U A L
Part 1 – Understanding Cleaner Production
As the name implies, Part 1 covers such fundamentals as theconcept of cleaner production, the evolution of this concept, itsdefinition, other terminologies and their relationship to CleanerProduction, barriers to Cleaner Production and the need tomainstream cleaner production and how that may be achieved. Thesub-section dealing with the concept of cleaner production containscarefully designed case studies so as to provide you with food forthought and help you gain a thorough insight to the subject in aninteresting and novel way.
Part 2 – Evolution of Cleaner Production Centres andNational Cleaner Production Centres
Part 2 presents a brief but thorough historical insight into thehistory and progression of Cleaner Production Centres in generaland National Cleaner Production Centres in particular. It explainsthe evolution of Cleaner Production Centres and National CleanerProduction Centres in the context of understanding the strategiesused and experiences gained along the way. Sub-sections in this partinclude the pollution prevention initiatives in North America sincethe late 1960s, conceptually parallel cleaner production initiatives inthe European region, establishment of Cleaner Production Centresacross the continents and some pertinent observations about them,an introduction to the National Cleaner Production Programme, itsevolution and the important lessons learnt from the experiences ofestablished National Cleaner Production Centres.
Part 3 – How to Establish a Cleaner ProductionCentre
Part 3 endeavors to provide a general blueprint which interestedparties would have to consider while setting up a National CleanerProduction Centre. This part begins with an introductory text whichexplains the general scheme of things in this context, including themilestones of (i) formulation of a conceptual plan for the Centre, (ii)creating its basic design, (iii) planning to meet its financialrequirements, and finally, (iv) the establishment of the Centre itself.An account of the nitty-gritty involved in achieving each of thesemilestones is provided in separate dedicated sub-sections. Given thecomplexity and importance of the process of establishing NCPCs,Part 3 is liberally interspersed with appropriate examples (sometaken from real-life scenarios and the rest adapted from them),important guiding messages, relevant inputs in the form of messagesfrom established National Cleaner Production Centres, and boxeshighlighting essential “dos and don’ts”.
A B O U T T H E G U I D A N C E M A N U A L
Part 4 – How to Deliver Services of a CleanerProduction Centre (Guidance on Basic Services)
Part 4 begins with an introduction to the different categories ofservices (basic / core as well as strategic / extension services) that aCentre may offer its clients, and the inter-relationship between thesetwo categories of services. It explores the aspects of the delivery ofthe basic services of a National Cleaner Production Centre, such as(i) awareness raising, (ii) training, (iii) cleaner productionassessments, and (iv) demonstration projects. It then goes to explorethe strategic approaches for the creation and sustenance of eachservice and explain their finer points. Part 4 also includes pertinentexamples, checklists, important guiding messages, guiding messagesfrom established National Cleaner Production Centres, and boxeshighlighting essential “dos and don’ts”.
Part 5 - How to Deliver Services of a CleanerProduction Centre (Guidance on Strategic Services)
Having provided a backdrop on the different categories of services aCentre may offer its clients, Part 5 expands the features of each ofthe five strategic services, namely (i) networking, (ii) matchmaking,(iii) knowledge management, (iv) interfacing with financialinstitutions, and (v) providing policy advice to national and localgovernments. Part 5 ends with a simple but crucial discussionelaborating on avenues of and suggested strategies for revenuegeneration from the delivery of services, so as to steer the Centretowards financial self-sustainability.
Part 6 – How to Monitor and Review the Progress ofa Cleaner Production Centre
Part 6 begins with an explanation for the need for monitoring andreviewing the progress of a Centre and goes on to elaborate thedifferent levels for such processes, namely from short-termmonitoring and to longer-term reviews. Sub-sections within this partinclude an introduction to performance indicators, theirfundamentals and hierarchy, suggested performance indicators forcertain services, criteria for monitoring and reviewing the progressof a Centre, establishment of data collection and reporting systems,and obtaining information on changing scenarios and updating thebusiness plan of the Centre. A concerted effort has been made todemystify all aspects of this important topic by providing a completeillustration of how to monitor and review the progress of a Centrewith respect to training as a service. In this context, Part 6 alsocontains three annexes (a sample evaluation sheet, a sample datasheet and a sample summary sheet) tied in with the sub-sections
A B O U T T H E G U I D A N C E M A N U A L
dealing with the hierarchy of performance indicators, and theestablishment of data collection and reporting systems respectively.
How to use this Guidance Manual
Cover-to-cover reading of this Manual is not mandatory. Perusal ofthe Manual is left to your discretion. If you are concerned with theoverall establishment of the Centre from scratch, it would beprudent to have a thorough read-through of each of the parts on theManual in the provided sequence. Alternately, if you already havesome exposure to cleaner production, and / or requireunderstanding the intricacies of revamping an existing Centre, youmay want to consider reading only pertinent parts of the Manual.Accordingly, each part of this Manual has been written as astandalone chapter. Adequate cross-references have been providedso that you may refresh your memory, and also have a glimpse ofwhat to expect in subsequent sections / parts.
Apart from the usual Table of Contents provided at the beginningof the Manual, the opening page of each of the six parts of theManual presents a handy truncated (up to the level of secondarytitles) list as a ready reference. If it is a particular word or term thatyou are interested in, feel free to look up the convenient KeywordIndex provided at the end of the Manual.
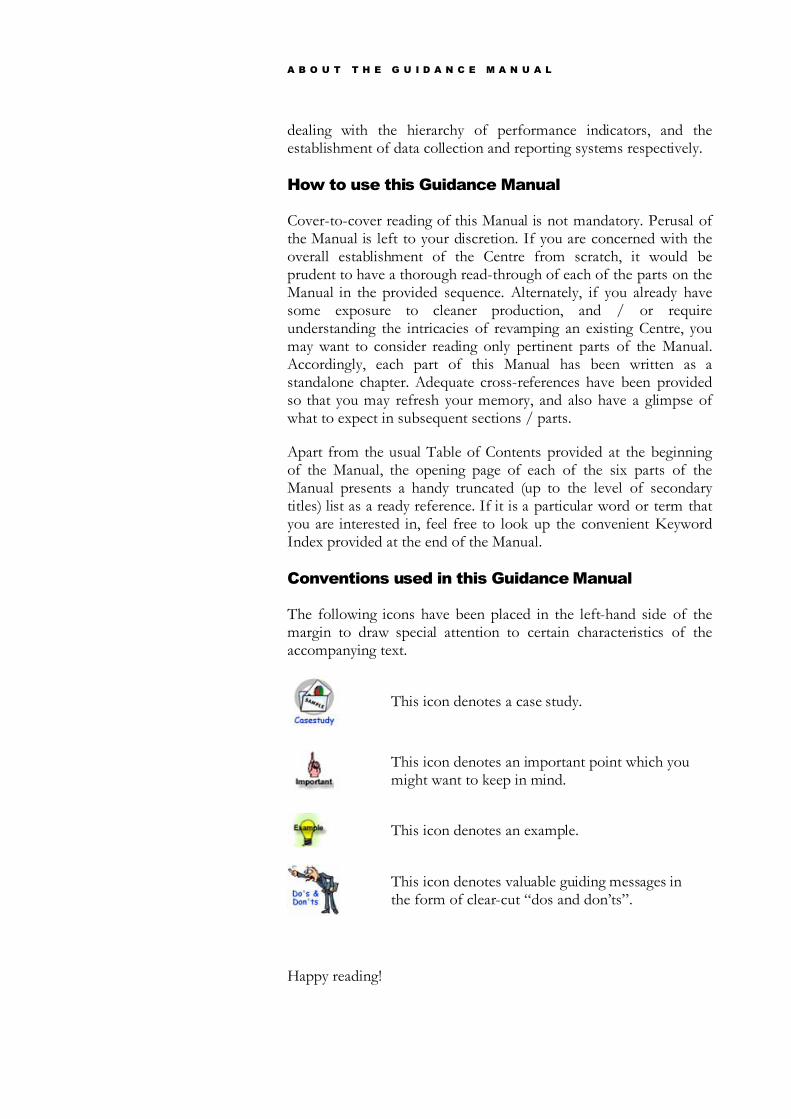
Conventions used in this Guidance Manual
The following icons have been placed in the left-hand side of themargin to draw special attention to certain characteristics of theaccompanying text.
This icon denotes a case study.
This icon denotes an important point which youmight want to keep in mind.
This icon denotes an example.
This icon denotes valuable guiding messages inthe form of clear-cut “dos and don’ts”.
Happy reading!
U N I D O / U N E P
Guidance ManualHow to Establish and Operate Cleaner Production Centres
Cleaner Production and Environmental Management Branch, UNIDOVienna International Centre, P.O. Box 300, A-1400 Vienna, Austria
Tel: (+431) 26026 3945, Fax: (+431) 26026 6819http://www.unido.org/cp
Production and Consumption BranchUNEP Division of Technology, Industry and Economics39-43 Quai André Citroën, 75739 Paris Cedex 15, France
Tel: (+33) (0)144 371 450, Fax: (33) (0)144 371 474http://www.uneptie.org/cp
U N I D O / U N E P G U I D A N C E M A N U A L :
H O W T O E S T A B L I S H A N D O P E R A T E C L E A N E R P R O D U C T I O N C E N T R E S
ii
Table of Contents
PART 1
1 Understanding Cleaner Production 2
1.1 The Concept of Cleaner Production 2
1.2 The Evolution of Cleaner Production 10
1 .2.1 Milestones in the Field of Productivity and Environmenta lManagement
10
1 .3 The Def init ion of Cleaner Production 14
1 .3.1 UNEP’S Def init ion of the Term “Cleaner Production” 13
1 .3.2 Extracting the Key Elements f rom UNEP’s Def init ion of CleanerProduction
15
1 .4 Other Terminologies and Their Rela tionship to Cleaner Production 17
1 .4.1 Cleaner Production and its Rela tion to other Similar -SoundingConcepts
17
1 .4.2 Cleaner Production and Environmenta l Management Systems 21
1 .5 Barr iers to Cleaner Production 26
1.6 Mainstreaming Cleaner Production 28
1.6.1 Susta inabil ity - The Driving Force and Cleaner Production - TheVehicle
28
1 .6.2 The Internationa l Declara tion on Cleaner Production 31
1 .6.3 Establ ishment of Cleaner Production Centres as a Milestone in theMainstreaming Process
31
PART 2
2 Evolution of Cleaner Production Centres and National Cleaner ProductionCentres
35
2.1 Cleaner Production Centres - Their Or igin and Evolution 35
2.1 .1 Pol lution Prevention Init ia t ives in North America 36
U N I D O / U N E P G U I D A N C E M A N U A L :
H O W T O E S T A B L I S H A N D O P E R A T E C L E A N E R P R O D U C T I O N C E N T R E S
iii
2.1 .2 Cleaner Production Init ia t ives in the European Region 37
2.1 .3 Establ ishment of CPCs across the Continents 38
2.1 .4 Some Observations about the CPCs 39
2.2 The National Cleaner Production Programme 40
2.2.1 An Introduction to the National Cleaner Production Programme 40
2.2.2 The Gradual Evolution of the NCPC Programme 42
2.3 Lessons Learnt 43
PART 3
3 How to Establ ish a Cleaner Production Centre 47
3.1 Introduction 47
3.2 Formulating the Conceptua l Plan for the Centre 49
3.2.1 Determining the Geographica l Coverage and Foca l Sectors to beAddressed by the Centre
50
3.2.2 Identifying Relevant Stakeholders for the Centre 52
3.2.3 Identifying Ongoing Cleaner Production Activit ie s and CleanerProduction Res ources in the Country/Region
56
3.2.4 Identifying Cleaner Production Needs 57
3.2.5 Identifying the Niche for the Centre 58
3.3 Creating the Basic Design for the Centre
3.3.1 Formulating the Mission and the Objectives of the Centre 59
3.3.2 Developing a Stra tegy to Achieve the Objectives of the Centre 62
3.3.3 Developing Targets and Tasks 64
3.3.4 Developing the Basic Organizationa l Structure of the Centre 65
3.3.5 Identifying the Physica l Location and Host Institution of the Centre 76
3.3.6 Identifying the Basic Resource Req uirements of the Centre 79
3.4 Meeting the Financia l Needs of the Centre 81
3.4.1 Secur ing Seed Funds for the Centre 81
3.4.2 Identifying Potentia l Sources to Meet the Shor tfa l l in Seed Funds 83
3.4.3 Prepar ing and Submitt ing a Formal Request for Funds 84
3.5 Establ ishing the Centre 85
3.5.1 Formally Register ing the Centre 85
3.5.2 Establ ishing the Oversight Bodies for the Centre 86
U N I D O / U N E P G U I D A N C E M A N U A L :
H O W T O E S T A B L I S H A N D O P E R A T E C L E A N E R P R O D U C T I O N C E N T R E S
iv
3.5.3 Recruit ing Sta f f for the Centre 87
3.5.4 Prepar ing the Physica l Facil it ies of the Centre 87
3.5.5 Launching the Centre 88
3.5.6 Del iver ing Services and Making the Centre Sel f -suff icient 88
PART 4
4 How to Del iver Services of a Cleaner Production Centre (Guidance onBasic Services)
91
4.1 Introduction 91
4.2 Awareness-ra ising 94
4.2.1 Identif ica tion of Target Stakeholders 95
4.2.2 Selection of (a) Par tner(s) 97
4.2.3 Preparations for an Awareness-ra ising Programme 98
4.2.4 Conducting Awareness-ra ising Programmes 103
4.3 Tra ining 105
4.3.1 Identif ica tion of Target Stakeholders and Tra ining Needs 106
4.3.2 Selection of (a) Par tner(s) 107
4.3.3 Preparation for the Tra ining Programme 109
4.3.4 Conducting the Tra ining Programme 111
4.4 Cleaner Production Assessments 114
4.4.1 The Gener ic CPA Process 115
4.4.2 P lanning and Organization 116
4.4.3 Pre-assessment 119
4.4.4 Assessment 130
4.4.5 Feasibil ity Analysis 142
4.4.6 Implementation of Cleaner Production Options 150
4.5 Demonstra tion Projects 154
4.5.1 Introduction 154
4.5.2 An Overview of Cleaner Production Demonstra tion Projects 154
4.5.3 Benef its of Demonstra tion Projects 157
4.5.4 Preparatory Activit ies 158
4.5.5 Conducting the Demonstra tion Project 163
4.5.6 How to Disseminate the Results of the Demonstra tion Project 165
U N I D O / U N E P G U I D A N C E M A N U A L :
H O W T O E S T A B L I S H A N D O P E R A T E C L E A N E R P R O D U C T I O N C E N T R E S
v
4.5.7 The Role of the Centre in Selecting, P lanning and ConductingDemonstra tion Projects
167
PART 5
5 How to Del iver Services of a Cleaner Production Centre (Guidance onStra tegic Services)
169
5.1 Introduction 169
5.2 Networking 169
5.2.1 Who Should be Networked 170
5.2.2 Establ ishing the Network 170
5.3 Matchmaking 172
5.3.1 Connecting Seekers and Providers 172
5.3.2 Extensions to Matchmaking 173
5.3.3 Mechanisms of Matchmaking 174
5.4 Knowledge Management 174
5.4.1 Del iver ies in Knowledge Management 175
5.5 Inter facing with Financial Institutions 176
5.5.1 Reasons for Interfacing with Financia l Institutions 176
5.5.2 Refer r ing of Cleaner Production Projects to Financia l Institutions 176
5.5.3 Options for F inancing 178
5.5.4 Possible Mechanism for F inancing 179
5.6 Pol icy Advice to National and Loca l Governments 181
5.6.1 Target Audience for Providing Pol icy Advice 181
5.6.2 Ways to Extend Pol icy Advice across Dif ferent Stakeholders 182
5.6.3 Possibil it ies to Usher Pol icy Changes 183
5.7 How to Build Revenue From Basic and Stra tegic Services to Make theCentre Sel f -Suf f icient
184
PART 6
6 How to Monitor and Review the Progress of a Cleaner Production Centre 191
6.1 The Need for Monitor ing and Reviewing the Progress of the Centre 191
6.2 The Fundamenta ls of Per formance Indicators 194
6.3 The Cr iter ia for Monitor ing and Reviewing the Progress of the Centre 195

U N I D O / U N E P G U I D A N C E M A N U A L :
H O W T O E S T A B L I S H A N D O P E R A T E C L E A N E R P R O D U C T I O N C E N T R E S
vi
6.4 Establ ishing a Data Col lection System 203
6.5 Establ ishing a Reporting System 204
6.6 Obta ining Information on Changing Scenar ios and Updating the BusinessPlan of the Centre
204
U N I D O / U N E P G U I D A N C E M A N U A L :
H O W T O E S T A B L I S H A N D O P E R A T E C L E A N E R P R O D U C T I O N C E N T R E S
vii
List of Boxes
P A R T 1
1.1 Cleaner Production Options 16
1.2 Environmental Management Systems - ISO 14001 and Eco-Management and AuditScheme
23
1.3 Reference to Cleaner Production in Agenda 21 30
P A R T 3
3.1 Dos and Don’ts of Executive Boards and Advisory Committees 70
3.2 Dos and Don’ts for Counterpart Institutions 76
3.3 Dos and Don’ts of a Host Institution 78
P A R T 4
4.1 Checklist for Selecting the Right Partner(s) for Awareness-raising Programmes 98
4.2 Dos and Don’ts for Nurturing the Training Partner(s) 108
4.3 Checklist of Questions to be Asked During the Walkthrough 123
4.4 Dos and Don’ts to be Followed During the Walkthrough 124
4.5 What You Should Equip Yourself with While Conducting the Walkthrough 125
4.6 Dos and Don’ts in Identifying Enterprises for Demonstration Projects 162
4.7 Dos and Don’ts for Conducting Demonstration Projects 164
4.8 Dos and Don’ts for Disseminating Results of Demonstration Projects 166
P A R T 5
5.1 Dos and Don’ts for Networking 171
5.2 Typical Requirements for Preparing Proposals for Loans from FinancialInstitutions
178
5.3 Dos and Don’ts for Interfacing with Financial Institutions 181
U N I D O / U N E P G U I D A N C E M A N U A L :
H O W T O E S T A B L I S H A N D O P E R A T E C L E A N E R P R O D U C T I O N C E N T R E S
viii
List of Figures
P A R T 1
1.1 Response of Businesses to Environmental Pollution 3
1.2 Tracking the Influence of Quality Programmes on Productivity 12
1.3 Major Milestones in the Field of Productivity 13
1.4 The Definition of Cleaner Production 15
1.5 Cleaner Production and its Relation to Other Similar-Sounding Concepts 21
1.6 The Environmental Management System Model 23
1.7 Typical Progression of Mainstreaming Cleaner Production 32
P A R T 2
2.1 NCPCs and CPCs around the world 36
2.2 Expansion of NCPC Services from Levels 1 to 3 45
P A R T 3
3.1 The Four Milestones of Establishing a Cleaner Production Centre 48
3.2 The Generic Organizational Structure of a Centre 67
3.3 Organizational Structure of the Vietnam Cleaner Production Centre 68
P A R T 4
4.1(a) Inter-relationship between the Basic Services 92
4.1 (b) Inter-relationship between the Strategic Services 92
4.2 Progression between the Foundation and Extension Phases of a Centre 93
4.3 A Strategic Approach for Creation and Sustenance of Awareness-raisingProgrammes
95
4.4 A Strategic Approach for Creation and Sustenance of Training Programmes 106
4.5 Steps and Tasks in the Generic CPA Process 116
4.6(a) A PFD for a Wet-textile Processing Factory 121
4.6(b) A Flowchart Indicating a Process Operation in a Wet-textile Processing Unitfor Special Situations
122
U N I D O / U N E P G U I D A N C E M A N U A L :
H O W T O E S T A B L I S H A N D O P E R A T E C L E A N E R P R O D U C T I O N C E N T R E S
ix
4.7 Typical Layout Map for a Manufacturing Factory 127
4.8 An Illustration of an Eco-map for Water in an Electroplating Factory 128
4.9(a) A Detailed Material Balance in a Wet-textile Processing Unit 131
4.9(b) A Detailed Energy Balance in a Wet-textile Processing Unit 132
4.10 Illustration of a Fishbone Diagram to Facilitate Cause Diagnosis in theDyeing Process
135
4.11 Generating Options through Brainstorming 137
4.12 Inflows and Outflows - Replacing Six Winch Machines with Three Jet DyeingMachines
148
P A R T 6
6.1 Monitoring and Reviewing the Progress of the Centre 193
6.2 Possible Triggers and Overlaps in the Delivery and Performance of Services 197
6.3 A Generic Approach to Assess the Performance of Services Delivered by theCentre
200
6.4 Updating the Business Plan of the Centre Based on its Performance 205
U N I D O / U N E P G U I D A N C E M A N U A L :
H O W T O E S T A B L I S H A N D O P E R A T E C L E A N E R P R O D U C T I O N C E N T R E S
x
List of Tables
P A R T 4
4.1 A Format for Training Needs Assessment 107
4.2 Matching the Problems Diagnosed Using the Fishbone Diagram with PossibleCleaner Production Options
140
4.3 Deciding Priorities for Implementation Among Cleaner Production Options 151
P A R T 5
5.1 Guidance on Generating Revenue from Various Services 187
P A R T 6
6.1 Suggested Performance Indicators for Certain Services 201
U N I D O / U N E P G U I D A N C E M A N U A L :
H O W T O E S T A B L I S H A N D O P E R A T E C L E A N E R P R O D U C T I O N C E N T R E S
1
Understanding Cleaner Production
What will we learn from Part 1?1 Understanding Cleaner Production 2
1.1 The Concept of Cleaner Production 2
1.2 The Evolution of Cleaner Production 10
1 .3 The Def init ion of Cleaner Production 14
1 .4 Other Terminologies and their Relationship to
Cleaner Production
17
1 .5 Barr iers to Cleaner Production 26
1.6 Mainstreaming Cleaner Production 28
Part
1
P A R T 1
2
1 Understanding Cleaner Production
1.1 The Concept of Cleaner Production
ll businesses use resources of one kind or another toproduce products and deliver services for meeting needsof other businesses and / or communities. In thisprocess, some resources remain unspent, or unwanted
products get produced as w a s t e because 100% conversion ortransfer of resources is seldom possible. This waste whendischarged to the environment causes pollution.
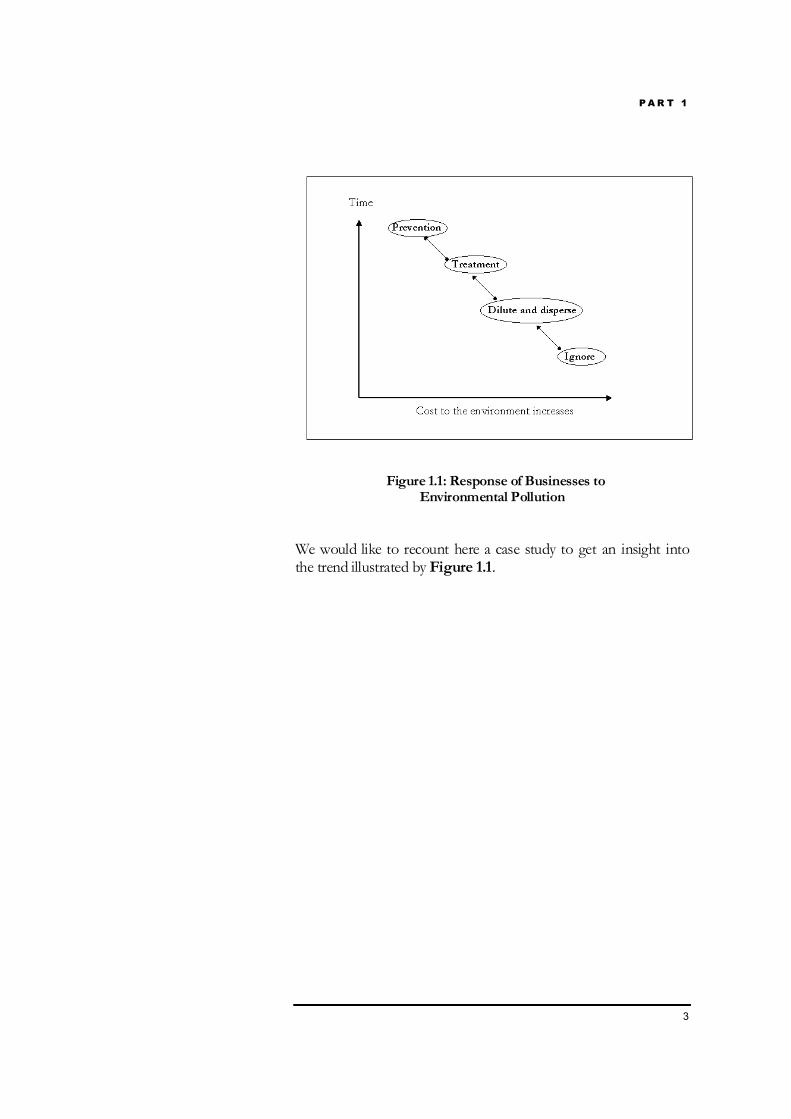
Historically, businesses have responded to pollution in four ways.
1. Firstly, by ignoring the problem. This always leads tomaximum damage to the environment. This damage is notlimited only to the local-scale or neighborhood; it can occur atthe regional and in some cases even the global scales.
2. Secondly, by prescribing to the doctrine "the solution topollution is dilution"; i.e. by diluting or dispersing pollution sothat its effects are less harmful or apparent.
3. Thirdly, by trying to treat pollution through the so-called end-of-pipe approach.
4. Fourthly (and most recently), through the prevention ofpollution and waste generation at the source itself.
Figure 1.1 illustrates this trend.
A
P A R T 1
3
Figure 1.1: Response of Businesses toEnvironmental Pollution
We would like to recount here a case study to get an insight intothe trend illustrated by Figure 1.1.
P A R T 1
4
Ca s e S t udy # 1 1
Reactive Chemical Industries Corporation (RCIC) specializes inthe production of additives for the processing of high polymermaterials. Historically, RCIC had discharged around 500 m3 ofwastewater each day into a nearby river without any treatment. Anincidence of fish kill downstream of the plant triggered monitoringand assessment of RCIC’s wastewater stream. It was found thatthe wastewater had a Chemical Oxygen Demand2 (COD) of 4,000mg/L. Since the maximum stipulated COD discharge to the riverat the time was 45 mg/L, RCIC built and commissioned awastewater treatment plant (WWTP), at a capital investment ofUS$960,000 and an annual operating cost of US$72,000.
Subsequently, demands for better water quality by downstreamusers led to a tightening of COD discharge regulations to 20mg/L. In keeping with the prevailing trend of "the solution topollution is dilution", the Corporation decided to revamp theexisting outfall by increasing its length and adding diffuser-port-riser mechanisms, at an investment of US$250,000. However,repeated negative impacts over time caused the river water qualityto decline, thus resulting in a further tightening of dischargeregulations. The Corporation found that additional investments interms of upgrading the WWTP were extremely cost-prohibitive.Installation of a new WWTP was not feasible, given the substantialarea requirement and escalating land prices.
1 Case Study #1 has been adapted from a real case study, although thenames and figures have been changed here.2 Chemical Oxygen Demand (COD) is a commonly used measure ofindustrial pollution that is determined by drawing a sample and conductinglaboratory analyses. The greater the COD, the greater the severity ofpollution. Domestic sewage typically has a COD of 250 mg/l whereas atextile effluent has a COD in the range of 600 to 1,000 mg/l.
P A R T 1
5
Given this scenario, the Corporation decided to look at theproblem of wastewater generation from a new angle. One idea wasreducing the wastewater discharge at the source in the productionprocesses where it was generated in the first place. An in-plantcleaner production assessment was conducted at RCIC to findsuch opportunities. Certain cleaner production options wereidentified and evaluated for technical and economical feasibility.Some of the cleaner production ideas that were implementedincluded improvements and expansions, improved housekeeping,direct recycling in the washing plant and certain processmodifications (e.g. installation of a microprocessor-based system tocontrol the quantity and rate of addition of raw materials,installation of vacuum pumps to allow the recovery of productpreviously lost with wastewater, etc.).
These options were implemented within a comparatively shorttime frame of 6 months, with an investment of US$60,000 and apayback period varying between 0.5 to 3 years. This helped theCorporation not only to meet the new stringent effluent dischargeregulations easily, but also to increase its production by 15%, andsave on raw materials and water. In fact, the effluent discharge tothe WWTP was reduced to such an extent that approximately one-fourth of the existing WWTP was found to be redundant! RCICtherefore closed one of the batteries (125 m3/day capacity) anddecommissioned some of the equipment. The management atRCIC realized that c l e a n e r p r o d u c t i o n should have been thef i r s t s t e p to manage the problem of pollution instead of dilutionand end-of-pipe treatment. These simple but important discoveriesmade the Corporation scout out other such initiatives in comingyears.
Conventionalapproaches topollution managementare generally after-the-event and reactive. Itmakes sound businesssense to be proactive;i.e. employanticipatory andpreventive strategies.
P A R T 1
6
Recounting this case study gets us thinking … we start to wonderabout the extent of time, land, money and other resources thatmight have been saved if RCIC had not used a reactive approachto pollution management in the first place. We start to make someimportant realizations - that pollution management may not be al i a b i l i t y if businesses simply become proactive. Indeed, as thestory of RCIC demonstrates, the pitfalls of being reactive aremany. An effective way to manage pollution, then, is to set out aproactive strategy that looks for minimization of resourceconsumption and a reduction of wastes, by increasing conversionof resources to products.
The strategy that integrates the concepts of environmentalprotection and improvement of resource productivity iscalled Cleaner Production.
Let us broaden our understanding of the concept of cleanerproduction now by reviewing another case study. Here we willlook at a business involved in packaging and learn how p r o d u c tr e d e s i g n helped in reducing wastes and making profits.
Ca s e s t udy # 2
PAC Foods supplies food-packaging solutions to restaurants. Foryears PAC Foods operated on a ‘business-as-usual’ basis set out byMr. George Sr. who founded the company three decades ago.
When George’s son Mathew took over operations, the situationwas starting to change. Solid waste was becoming an importantregulatory issue with environmental and economic dimensions.Disposal fees escalated and the neighborhood started expressing itsconcerns, with some articles appearing in the local newspapersagainst PAC Foods. Indeed, the company's packaging operationswere responsible for significant generation of solid wastes.
Mathew decided to reevaluate PAC Foods’ system of packaging.He proposed a Le s s Was te I ni t i a t i ve , to identify andimplement waste reduction options. The thrust of the initiativeconcentrated on materials substitutions and design alterations. Theentire programme was implemented by forming a team and byhiring a consultant. Within the first six months, PAC Foods wasable to eliminate almost 7,500 tons of superfluous packaging.
Innovative solutions that led to the decrease of food packagingmaterial volumes included:
P A R T 1
7
(a) Reducing raised designs on napkins: This simple actionenabled 23% more napkins to fit into a shipping container,saving 294,000 kg of corrugated packaging and 150 truckloadshipments.
(b) Redesigning drink shipment boxes to achieve a 4% reductionin corrugated packaging (i.e. saving 450,000 kg).
(c) Converting light-weight and non-greasy classified foodcontainers from paperboard cartons to paper bags, thus saving3 million kg worth of packaging.
PAC Foods also contributed to toxics use reduction by printing itspackaging material with soy-based inks, as well as by introducingunbleached carryout paper bags. These steps were applauded bythe local community.
The Le s s Was t e In i t i a t i v e led to a net savings of US$250,000from the second year onwards, with an initial investment ofUS$80,000. Mathew proposed a special bonus to all the membersof the Le s s Was te I ni t i a t i ve .
We need to understand here that the Le s s Was t e Ini t i a t i v e atPAC Foods was not a regulation-driven programme; rather, PACFoods actively anticipated the avoidance of waste as a proactivemeasure. This involved teamwork, and profits were shared as anincentive. But perhaps what mattered most was Mathew's strategyof change management and commitment.
The benefits of waste reduction were not limited to a reduction inthe company’s operating costs or its increase in profits. Decrease inpacking paper translated into less trees being cut down. Lesstruckload shipments translated into savings in fuel, decreasedgaseous emissions and better air quality. Toxics use reductiontranslates to significantly less environmental risks, and improvedworker health and safety. Thus, PAC Foods in many wayscontributed to planet’s sustainability – albeit to a limited extent.The company's image in the community also received a boost.
The cleaner productionconcept is not limitedto technology alone; itincludes redesign ofproducts andpackaging.
P A R T 1
8
Over the years, Mathew made PAC Foods stand out in the marketas an environmentally sensitive company and that helped himsecure new clients.
The concept of cleaner production is not limited to themanufacturing sector alone. The concept is equally applicable toother sectors such as services, infrastructure, natural resourcemanagement etc. Let us now discuss a case study from thehospitality sector, which illustrates how a medium-sized hotel usedcleaner production as a strategy to increase competitiveness andestablish a niche in the market.
Ca s e s t udy # 3
The Smiths operated a 40-room hotel called Relax at a holiday spotover a number of years. A number of new hotels had sprung up inthe neighborhood and Relax was losing its competitiveness.Something had to be done to turn the business around; i.e. reduceoperating costs, re-establish a foothold and create a niche for itselfin the market. The Smiths were looking for a systematic processthat would help them realize these objectives.
The Smiths used a water and energy audit as the starting guideline,as these two resources mattered most to Relax from the point ofview of operating costs. They got a consultant in place and formeda team. The audit programme was operated over a month andincluded a number of measurements, record-keeping, analyses andbrainstorming within the team. The following energy and water-saving measures were identified and subsequently adopted.
(a) Existing lighting was replaced with lower wattageincandescent fluorescent lighting. The team anticipatedsavings of approximately 25% on electricity costs for lighting.
(b) Flow restrictors were installed on all taps and showers, andthis was estimated to save approximately 16,000 L of waterper day. This worked out to annual savings of US$4,470.
(c) The electric water heaters were replaced with gas operatedunits, which led to annual savings of approximatelyUS$17,000.
(d) For an initial investment of only $250, the hotel could shutdown its fountain pump system for five hours a night, therebysaving US$2,475 annually.
Cleaner productioninvolves commitmentof top management,teamwork and avision to understandthe strategicadvantages to businessby beingenvironmentallyfriendly.
P A R T 1
9
The overall cost of investment worked out to be in the vicinity ofUS$55,000, with an annual monetary savings of US$26,000,greenhouse gas savings of 5.72 tons of CO2 per year and electricitysavings of 3.4 MWh.
The proprietors of the hotel were pleased that savings of such amagnitude could be had through such simple solutions. Publicizingtheir improved environmental performance helped the businessearn the goodwill of existing clientele, attract new business(occupancy rates increased by 30% in the first quarter alone,directly as a consequence of effecting the changes) and increaseprofits. These measures also indirectly reduced previously highemployee attrition rates. More importantly, the proprietors realizedthat there were further opportunities for improvement; other ideasin the pipeline include key-tag air-conditioning and lighting controlin guest units and installation of dual-flush toilets during futurerefurbishment. Smiths decided to make water and energy audits anon-going process instead of a one-off initiative, and starteddeveloping data formats and work instructions to ensure that theprocess of tracking, evaluating and finding such options would becontinuous.
Les s o ns f ro m t he Ca s e S t udi es
Our three case studies show us that cleaner production entailseliminating environmental problems at the source, to themaximum extent possible. Cleaner production is one of the mostcost-effective methods of environmental protection because itreduces the need for construction of expensive end-of-pipetreatment and disposal facilities, and reduces long-term risks andliabilities associated with releases of wastes to the environment.The RCIC case study was an illustration that stressed this point.
The critical issue in the case of Hotel Relax was the management’sdecision to install a continuous process of improvement and nottreat audits as a one-off activity. Cleaner production is therefore ac ont inuo us pr ev en t i v e s tr a te gy . Cleaner production is practicedthrough a structured process (e.g. water and energy audits in thecase of Hotel Relax) and is not an ad hoc approach.
It should also be stressed that cleaner production is very muchabout attitudinal change, and it requires commitment of the topmanagement and teamwork. That is what probably worked inthe example of PAC Foods.
Cleaner production isimplemented through astructured process. Itinvolves identificationof options andmethods of areasonable cost, theimplementation ofwhich can lead toeconomic andenvironmental gains.
P A R T 1
10
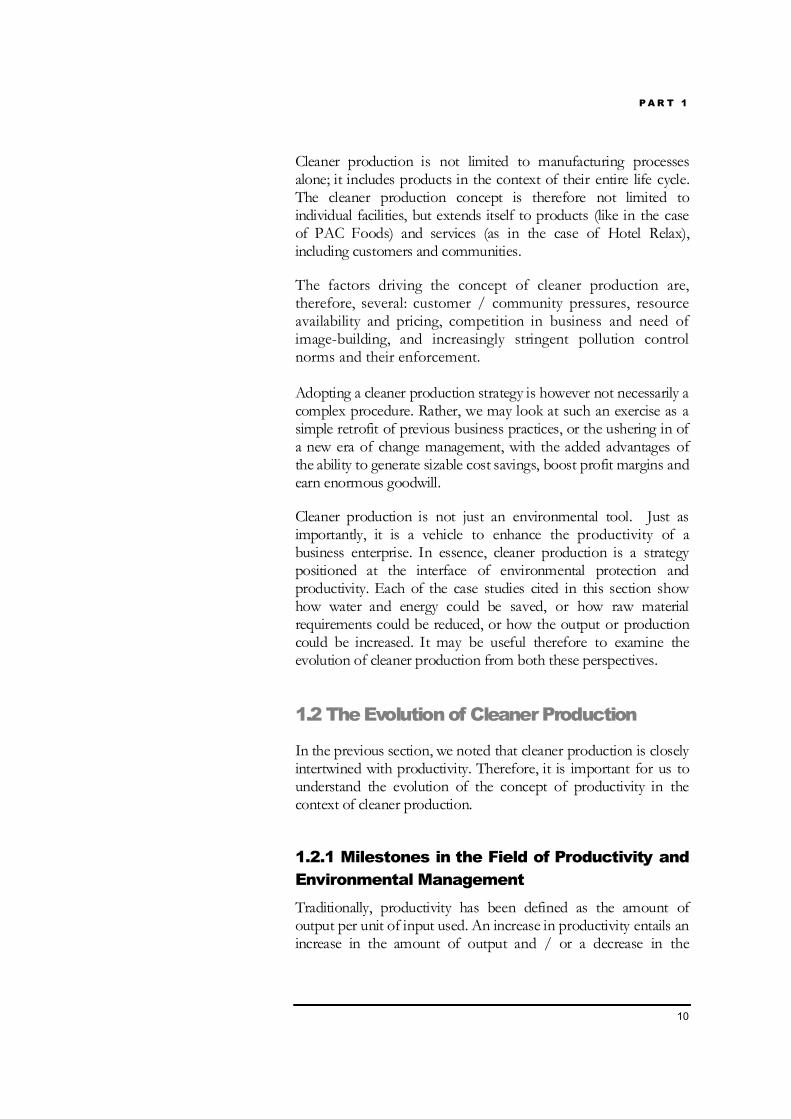
Cleaner production is not limited to manufacturing processesalone; it includes products in the context of their entire life cycle.The cleaner production concept is therefore not limited toindividual facilities, but extends itself to products (like in the caseof PAC Foods) and services (as in the case of Hotel Relax),including customers and communities.
The factors driving the concept of cleaner production are,therefore, several: customer / community pressures, resourceavailability and pricing, competition in business and need ofimage-building, and increasingly stringent pollution controlnorms and their enforcement.
Adopting a cleaner production strategy is however not necessarily acomplex procedure. Rather, we may look at such an exercise as asimple retrofit of previous business practices, or the ushering in ofa new era of change management, with the added advantages ofthe ability to generate sizable cost savings, boost profit margins andearn enormous goodwill.
Cleaner production is not just an environmental tool. Just asimportantly, it is a vehicle to enhance the productivity of abusiness enterprise. In essence, cleaner production is a strategypositioned at the interface of environmental protection andproductivity. Each of the case studies cited in this section showhow water and energy could be saved, or how raw materialrequirements could be reduced, or how the output or productioncould be increased. It may be useful therefore to examine theevolution of cleaner production from both these perspectives.
1.2 The Evolution of Cleaner Production
In the previous section, we noted that cleaner production is closelyintertwined with productivity. Therefore, it is important for us tounderstand the evolution of the concept of productivity in thecontext of cleaner production.
1.2.1 Milestones in the Field of Productivity andEnvironmental ManagementTraditionally, productivity has been defined as the amount ofoutput per unit of input used. An increase in productivity entails anincrease in the amount of output and / or a decrease in the
P A R T 1
11
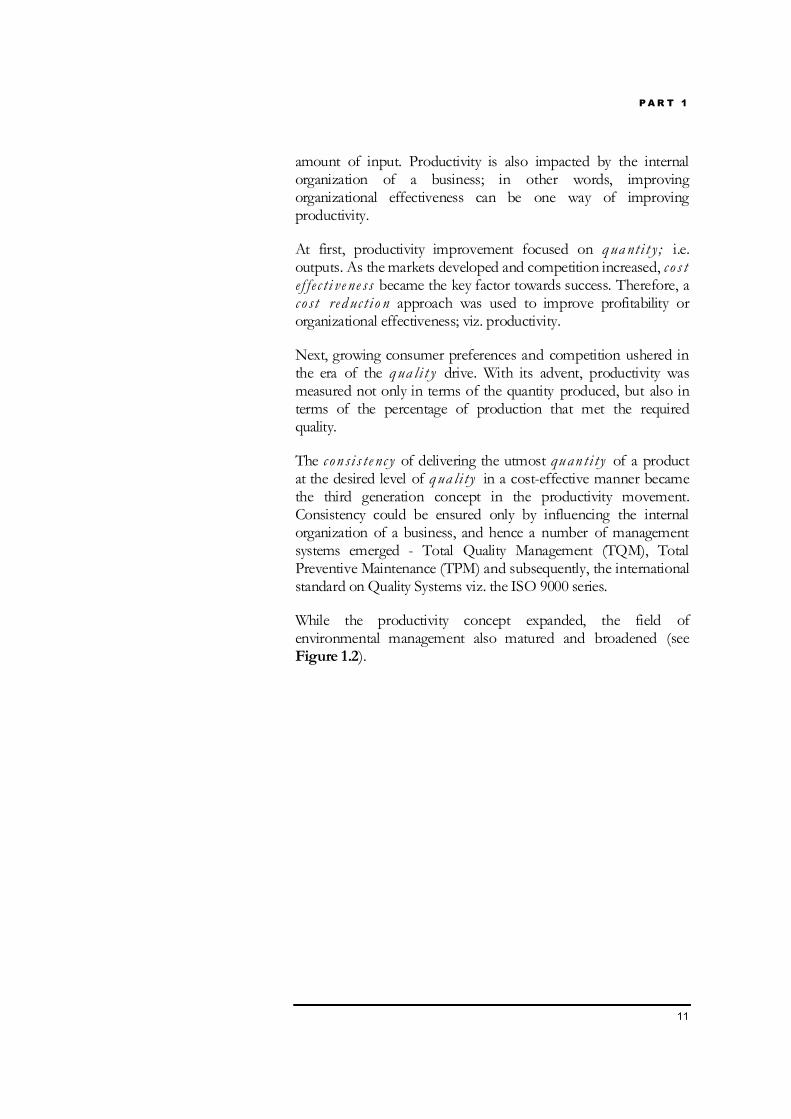
amount of input. Productivity is also impacted by the internalorganization of a business; in other words, improvingorganizational effectiveness can be one way of improvingproductivity.
At first, productivity improvement focused on qua nti t y ; i.e.outputs. As the markets developed and competition increased, c o s te f fe c t i ve ne ss became the key factor towards success. Therefore, ac o s t red uc t i o n approach was used to improve profitability ororganizational effectiveness; viz. productivity.
Next, growing consumer preferences and competition ushered inthe era of the qua li t y drive. With its advent, productivity wasmeasured not only in terms of the quantity produced, but also interms of the percentage of production that met the requiredquality.
The c on si s te nc y of delivering the utmost quan ti ty of a productat the desired level of qua li ty in a cost-effective manner becamethe third generation concept in the productivity movement.Consistency could be ensured only by influencing the internalorganization of a business, and hence a number of managementsystems emerged - Total Quality Management (TQM), TotalPreventive Maintenance (TPM) and subsequently, the internationalstandard on Quality Systems viz. the ISO 9000 series.
While the productivity concept expanded, the field ofenvironmental management also matured and broadened (seeFigure 1.2).
P A R T 1
12
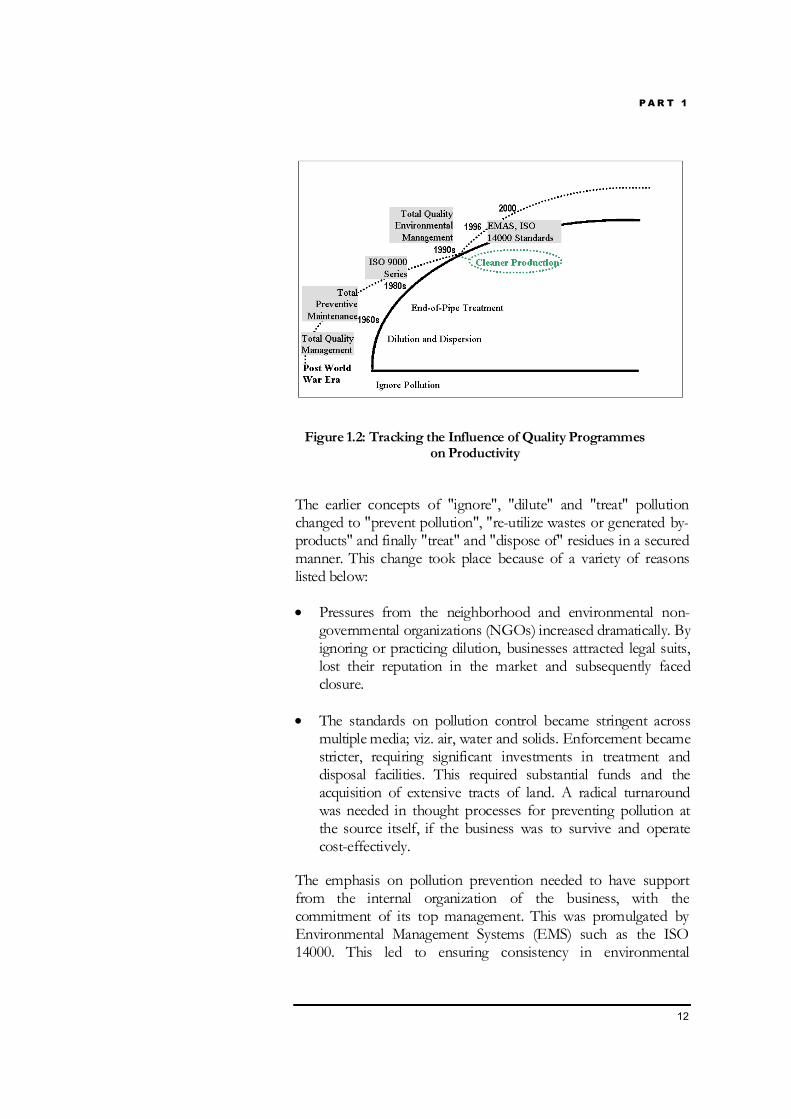
Figure 1.2: Tracking the Influence of Quality Programmeson Productivity
The earlier concepts of "ignore", "dilute" and "treat" pollutionchanged to "prevent pollution", "re-utilize wastes or generated by-products" and finally "treat" and "dispose of" residues in a securedmanner. This change took place because of a variety of reasonslisted below:
• Pressures from the neighborhood and environmental non-governmental organizations (NGOs) increased dramatically. Byignoring or practicing dilution, businesses attracted legal suits,lost their reputation in the market and subsequently facedclosure.
• The standards on pollution control became stringent acrossmultiple media; viz. air, water and solids. Enforcement becamestricter, requiring significant investments in treatment anddisposal facilities. This required substantial funds and theacquisition of extensive tracts of land. A radical turnaroundwas needed in thought processes for preventing pollution atthe source itself, if the business was to survive and operatecost-effectively.
The emphasis on pollution prevention needed to have supportfrom the internal organization of the business, with thecommitment of its top management. This was promulgated byEnvironmental Management Systems (EMS) such as the ISO14000. This led to ensuring consistency in environmental
P A R T 1
13
performance and establishing the strategic importance ofenvironmental thinking in business.
Around this time, the environmental factor got integrated intoproductivity improvement programmes (e.g. TQM to TQEM).Here, the concepts of resource vulnerability, life cycle assessment,and waste as an economic burden, were brought to the forethrough environmental management, thus reinforcing the need tointernalize environmental issues in business.
The need to fundamentally change the approach to business byusing natural resources efficiently, and taking a holistic life-cycleview of product generation was recognized in the 1990s. Efficientuse of natural resources translates into environmental protection,and also results in the improvement of productivity.
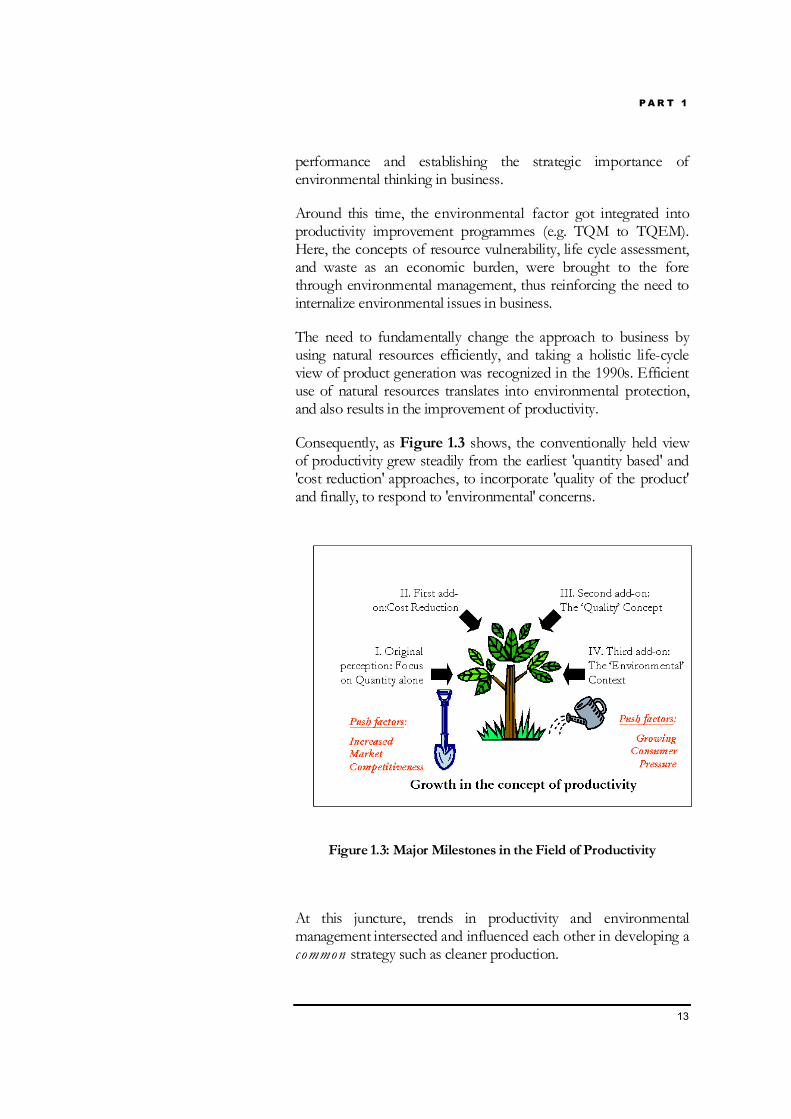
Consequently, as Figure 1.3 shows, the conventionally held viewof productivity grew steadily from the earliest 'quantity based' and'cost reduction' approaches, to incorporate 'quality of the product'and finally, to respond to 'environmental' concerns.
Figure 1.3: Major Milestones in the Field of Productivity
At this juncture, trends in productivity and environmentalmanagement intersected and influenced each other in developing ac ommon strategy such as cleaner production.
P A R T 1
14
1.3 The Definition of Cleaner Production
A formal definition of the term "cleaner production" will help us toorganize our ideas at this point. We will review the definition of cleanerproduction proposed by the United Nations EnvironmentProgramme (UNEP) in the next section.
1.3.1 UNEP's Definition of the Term "CleanerProduction"Cleaner production is defined3 as the continuous applicationof an integrated preventive environmental strategy applied toprocesses, products and services to increase overallefficiency, and reduce risks to humans and the environment.Cleaner production can be applied to the processes used in anyindustry, to products themselves and to various servicesprovided in society.
For production processes, cleaner production results fromone or a combination of the following - conserving rawmaterials and energy, substituting toxic/hazardous materialsby more benign ones and reducing the quantity and/ortoxicity of all emissions and wastes before they leave aproduction process.
For products, cleaner production focuses on the reduction ofenvironmental impacts over the entire life cycle of a product,from raw material extraction to the ultimate disposal of theproduct, by appropriate design.
For services, cleaner production entails incorporatingenvironmental concerns into the design and delivery ofservices.
Figure 1.4 shows a representation of this definition.
3 United Nations Environment Programme (UNEP) - Cleaner Production.Available at: http://www.uneptie.org/pc/cp/understanding_cp/home.htm

P A R T 1
15
Figure 1.4: The Definition of Cleaner Production4
1.3.2 Extracting the Key Elements from UNEP'sDefinition of Cleaner ProductionLet us now extract the key elements from UNEP's definition ofcleaner production. The following points come to mind.
• Cleaner production entails a continuous process; it is not aone-time activity.
• Cleaner production is not limited to industries or businessesof a certain type and/or size.
• Cleaner production moves towards striking a balancebetween the availability and consumption of materials(including water) and energy. It does not deny growth, butdoes insist that it be ecologically sustainable.
• Cleaner production refers to the approach of producinggoods and providing services with a minimum ofenvironmental impacts, given the technological andeconomic limits at the current time. It is not merely limited to
4 Modified from Joseph Strahl, 1996. Available at:http://www.lu.se/IIIEE/general/cp.html
P A R T 1
16
minimization of wastes; rather it employs a broader context,and uses the term "impacts" in the life cycle.
• In addition to life cycle impacts, cleaner production alsoaddresses health and safety concerns and emphasizes riskreduction. In this perspective, cleaner production is a holisticenvironmental management strategy.
• Cleaner production is both efficient (in terms of increasedo u tp ut s on an immediate basis) and effective (in terms ofpositive o u t c om e s over the long-term).
• Cleaner production is a 'win-win-win' strategy that protectsthe environment, communities (i.e. the health and safety ofworkers, consumers and the neighborhood) and business (i.e.its profitability and image). Therefore, cleaner productionaddresses economic, environmental as well as social concernsand should not be considered only as an environmentalstrategy.
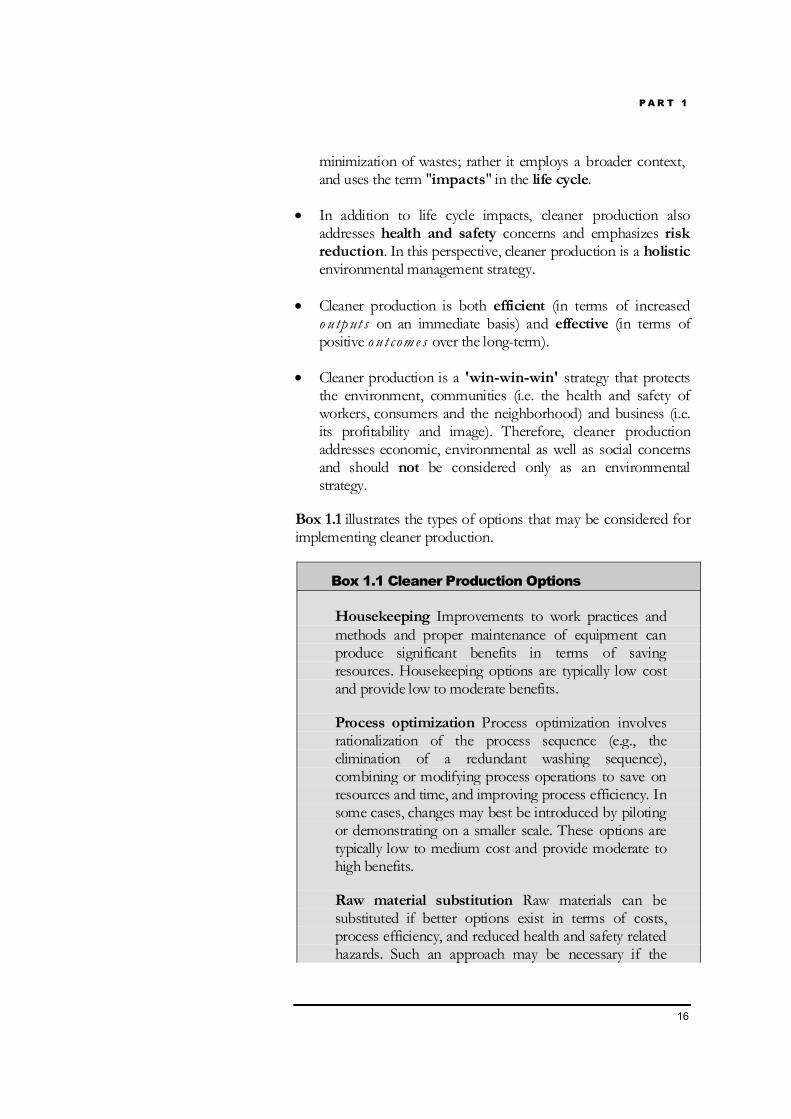
Box 1.1 illustrates the types of options that may be considered forimplementing cleaner production.
Box 1.1 Cleaner Production Options
Housekeeping Improvements to work practices andmethods and proper maintenance of equipment canproduce significant benefits in terms of savingresources. Housekeeping options are typically low costand provide low to moderate benefits.
Process optimization Process optimization involvesrationalization of the process sequence (e.g., theelimination of a redundant washing sequence),combining or modifying process operations to save onresources and time, and improving process efficiency. Insome cases, changes may best be introduced by pilotingor demonstrating on a smaller scale. These options aretypically low to medium cost and provide moderate tohigh benefits.
Raw material substitution Raw materials can besubstituted if better options exist in terms of costs,process efficiency, and reduced health and safety relatedhazards. Such an approach may be necessary if the

P A R T 1
17
materials already in use are difficult to source, orbecome expensive, or come under the purview of newconsumer, health and safety, or environmentalregulations. It is important to assess the options throughlaboratory / bench scale studies and pilots, to ensurethat the product quality is not changed and / or isacceptable to the market.
New technology Adopting and transferring newtechnologies can often reduce resource consumptionand minimize wastes, as well as increase the throughputor the productivity. These options are often capitalintensive, but can lead to potentially high benefits.
New product design Changing the product design cancause impacts on both the “upstream” as well as“downstream” side of the product life cycle. Product re-design can, for instance, reduce the quantity or toxicityof materials in a product, or reduce the use of energy,water and other materials during use, or reducepackaging requirements, or increase the "recyclability"of used components. This can lead to benefits such asreduced consumption of natural resources, increasedproductivity, and reduced environmental risks. Often,this helps in both establishing as well as widening themarket. Product re-design is however a major businessstrategy and may require feasibility studies and marketsurveys, especially if the supply-chain around theproduct is already established and is complex.
1.4 Other Terminologies and Their
Relationship to Cleaner Production
1.4.1 Cleaner Production and its Relation toOther Similar-Sounding ConceptsAt the time UNEP embarked on the overarching concept ofcleaner production in 1990, a number of quite similar conceptsexisted and many others subsequently emerged. In the realworld, some of these concepts are better applied in some placesrather than others. It is important therefore to clarify what
P A R T 1
18
cleaner production is in relation to some of these concepts.Equally importantly, if we want to communicate cleanerproduction to different stakeholders, we have to use thewords they are willing to hear.
Concepts similar to cleaner production may be grouped into sixparts - parallel approaches, allied approaches, developmentalapproaches, product-related approaches, service-relatedapproaches, and associated tools. Each of these approaches isdiscussed below.
P a ra l le l a ppro a ches
Gre e n P r o d u c t i v i t y It is a term used by the Asian ProductivityOrganization (APO) to address the challenge of achievingsustainable production. APO started its Green ProductivityProgramme in 1994. Just like cleaner production, greenproductivity is a strategy for enhancing productivity andenvironmental performance for overall socio-economicdevelopment. The concept of green productivity and cleanerproduction are almost synonymous.
E c o - e f f i c i e nc y The term was coined by the World BusinessCouncil for Sustainable Development (WBCSD) in 1992. It isdefined as the delivery of competitively priced goods and servicesthat satisfy human needs and ensure quality of life, whileprogressively reducing ecological impacts and resource intensitythroughout the life cycle, to a level at least in line with the earth'sestimated carrying capacity. This concept is favoured by many inthe industrial sector. The concepts of eco-efficiency and cleanerproduction are almost synonymous.
Wa s t e M i n i mi z a t i o n The concept of waste minimization wasintroduced by the U.S. Environmental Protection Agency(USEPA). In this concept, waste and pollution reduction occurson-site, at the source through changes of input raw materials, and /or technology changes, good operating practices and productchanges. Compared to cleaner production, waste minimization is inone sense broader, in that it also includes off-site recycling ofwaste, but in another sense, it is narrower, since it does not coverproduct (re)design to minimize all life cycle impacts.
P o l l u t i o n P r e v e n t i o n The terms cleaner production andpollution prevention are often used interchangeably. Thedistinction between the two tends to be geographic - pollutionprevention is mostly used in North America, while cleaner
P A R T 1
19
production is used in other parts of the world. Both conceptsfocus on a strategy of continuously reducing pollution andenvironmental impact through source reduction - i.e.eliminating waste within the process rather than at the end-of-pipe. However, cleaner production includes the aspect ofreduction of impacts and risks across the life cycle of a product,and in this sense is a more comprehensive concept thanpollution prevention5.
S o u r c e R e d u c t i o n This is a term that is rather synonymous withcleaner production - reducing generation of wastes orcontaminants at the source, and thereby reducing releases thatcould pose hazards to the environment and public health.
To x i c s Us e R e d u c t i o n Toxics use reduction is theelimination or avoidance of toxic substances in products orprocesses so as to reduce risks to the health of workers,consumers, and the public, and to minimize adverse effects onthe environment. Toxics use reduction is a special case ofcleaner production since it focuses specifically on the aspect ofreducing toxicity / hazards.
A l l i ed a ppro a ches
E ne r g y E f f i c i e n c y This is essentially a sub-set of cleanerproduction. The concepts of energy conservation and renewableenergy often have strong elements of cleaner production.
Oc c up a t i o na l H e a l t h a nd Sa f e t y It is often the case thatefforts to protect the health and safety of workers will requirereducing emissions at the source, by changing raw materials ormodifying the process. To all intents and purposes, this is cleanerproduction. In a more indirect way, efforts to make the workingenvironment safer for workers will result in better productivity.
M a t e r i a l s M a nag e m e n t Since the purpose of materialsmanagement is to manage materials more efficiently and reducelosses and waste, it comes very close to cleaner production.
P ro duct - re la t ed a ppro a ches
D e s i g n f o r t h e E nv i r o nm e n t ( DF E) DFE is the systematicconsideration, during product design, of issues associated with theenvironment over the entire life cycle of a product. This approach
5 Note that the acronym P2 is often used for pollution prevention.
The future of cleanerproduction will likelysee many attempts atweaving together itsthreads with other,environmentalmanagement andproductivity relatedconcepts. Suchdevelopments shouldbe embraced andencouraged; oneconstructive approachis to see all theseconcepts as differentfacets of approaches tosustainabledevelopment.
P A R T 1
20
attempts to create financial and environmental savings byredesigning products to reduce environmental impact. The objectis to minimize or eliminate anticipated waste generation andresource consumption in all the phases of the life cycle; viz. rawmaterial sourcing, production, product distribution, use, anddisposal. DFE is also called ec o - d e s i g n .
P r o d u c t -S e r v i c e S y s t e m s This concept focuses on creating acommunity-wide system for ensuring the best use and reuse ofproducts. As with DFE, this concept focuses on the productelement of cleaner production.
Serv i ce- r e la t ed a ppro a ches
S u s t a i na b l e T o u r i s m This term has strong links with cleanerproduction. Sustainable tourism requires tourist services to reducetheir use of material and energy intensity and to reduce theirgeneration of pollution.
D evelo pment a l a ppro a ches
Su s t a i na b l e D e v e l o p m e n t This term is defined asdevelopment that meets the needs of present generations withoutcompromising the ability of future generations to meet their ownneeds. The strategy of cleaner production is driven by the visionof sustainable development.
I nd u s t r i a l Ra t i o na l i z a t i o n This is a term that deals withlarge-scale shifts in patterns of industrial production. Since it isoften used in circumstances where inefficient industrial sectors arebeing phased out, it often has a strong, but generallyunrecognized, component of cleaner production.
M i s e à Ni v e a u A French term that corresponds to industrialupgrading, this term is used in circumstances where entireindustrial sectors are being upgraded and modernized. Suchmodernization (again) often contains a generally unrecognizedcomponent of cleaner production, since modern technologies areoften more efficient in their consumption of material inputs.
A s s o ci at ed co ncept s
Tr i p l e B o t to m L i n e A methodology for measuring andreporting on financial, environmental and social performance, thistool can have incorporated into it strong elements of cleanerproduction. Indeed, several cleaner production centres today have

P A R T 1
21
been experimenting with this tool as a way of pushing forward thecleaner production agenda.
Figure 1.5 illustrates the position of cleaner production withrespect to some of the concepts outlined above, as well as thereactive approach of end-of-pipe treatment discussed earlier.
Figure 1.5: Cleaner Production and its Relation toOther Similar-Sounding Concepts6
1.4.2 Cleaner Production and EnvironmentalManagement SystemsBy now, we have acquired a fair idea of the strategy of cleanerproduction, its definition and important associated concepts. Letus now look at the concept of Environmental ManagementSystems (EMS) and explore what it can offer.
An EMS7 serves as a tool to manage and improve in a systematicmanner the environmental performance of an organization. AnEMS is that aspect of the organization’s overall management
6 Modified from: Berkel, R. Van & J.V.D. Meer (1997), Training Course forFuture Trainers on Environmentally Sound Technology Transfer. IVAMEnvironmental Research, University of Amsterdam.7 "Environmental Management Systems". Available at: http://www.p2pays.org/iso/faqs.htm#faq1
P A R T 1
22
structure that addresses immediate and long-term impacts of itsproducts, services and processes on the environment.
An EMS gives order and consistency for organizations to addressenvironmental concerns through the allocation of resources,assignment of responsibility and ongoing evaluation of practices,procedures and processes. Importantly, an EMS focuses oncontinual improvement of the system.
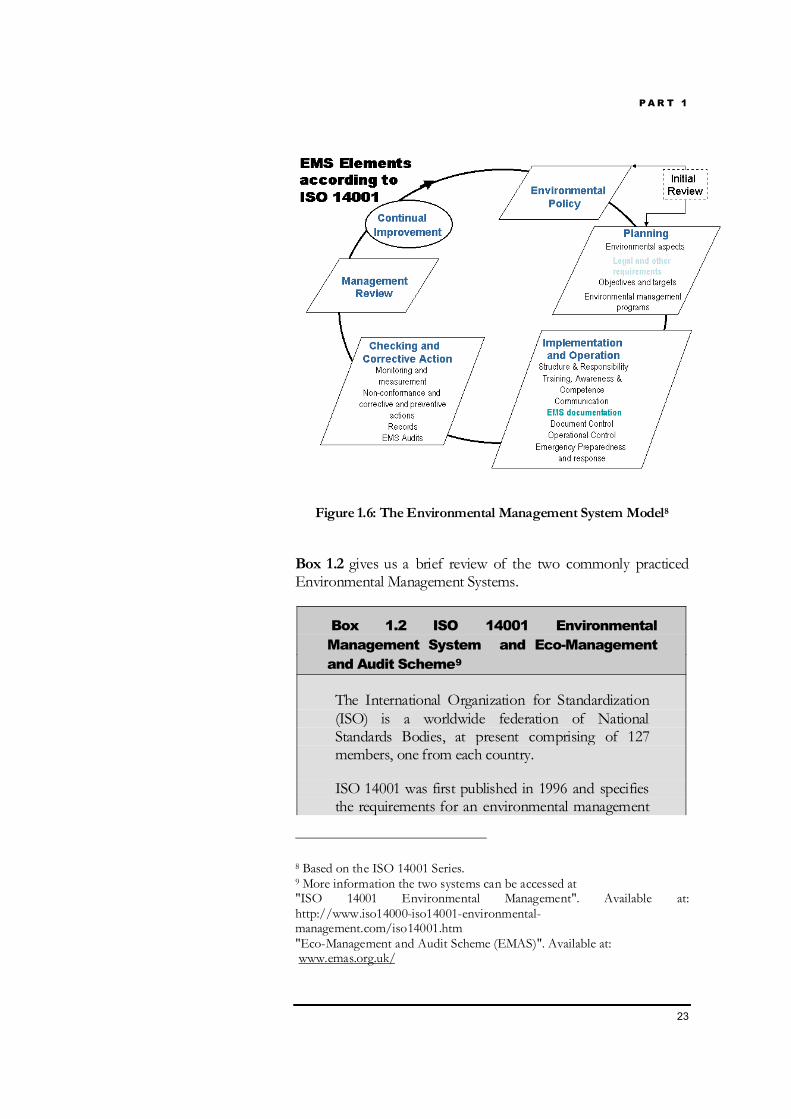
The EMS follows a Plan-Do-Check-Act Cycle, or PDCA. Figure1.6 shows the process of first developing an environmental policy,planning the system, and then implementing it. The process alsoincludes checking the system and putting into action theimprovements thereby identified. The model is continuous,because an EMS is a process through which an organization isconstantly reviewing and revising the system.
An EMS can offer increased efficiency and potential cost savingswhile managing environmental obligations. It can effectively targetand bring about savings of scarce environmental resources. It canprovide a competitive business advantage, and lead to an increasein employee morale. Finally, an EMS is a model that can be usedby a wide range of organizations - from manufacturing facilities toservice industries and government agencies.
P A R T 1
23
Figure 1.6: The Environmental Management System Model8
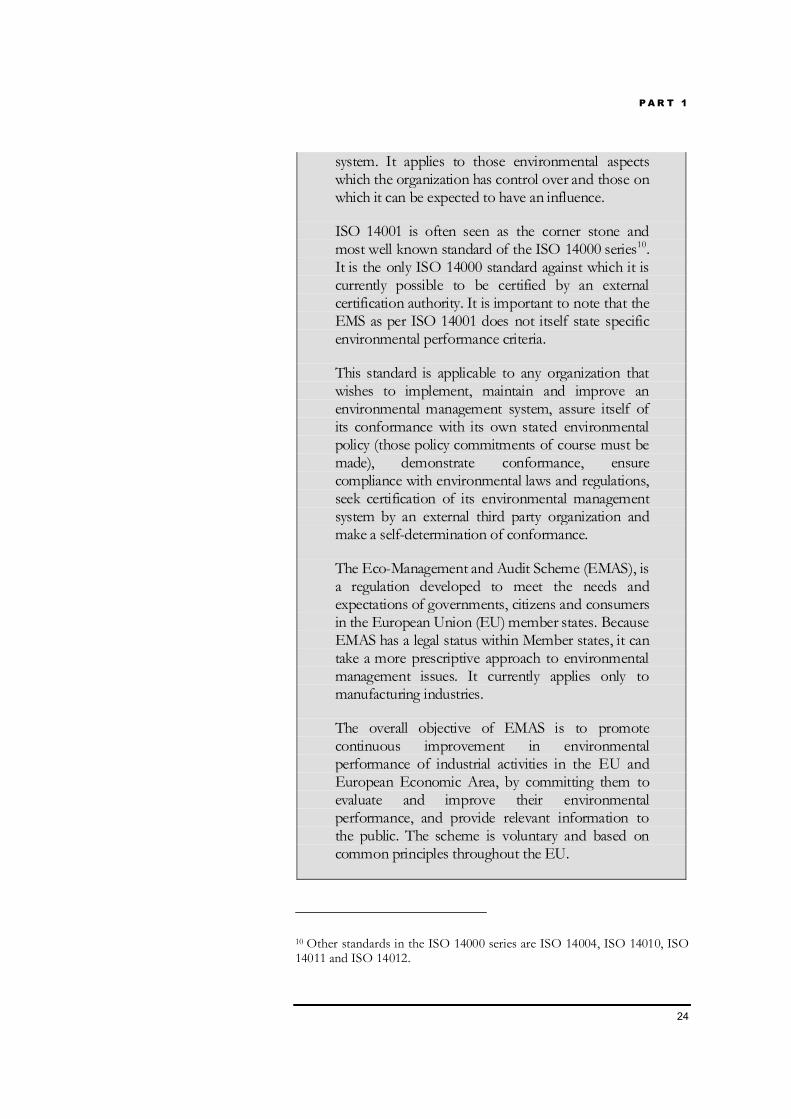
Box 1.2 gives us a brief review of the two commonly practicedEnvironmental Management Systems.
Box 1.2 ISO 14001 EnvironmentalManagement System and Eco-Managementand Audit Scheme9
The International Organization for Standardization(ISO) is a worldwide federation of NationalStandards Bodies, at present comprising of 127members, one from each country.
ISO 14001 was first published in 1996 and specifiesthe requirements for an environmental management
8 Based on the ISO 14001 Series.9 More information the two systems can be accessed at"ISO 14001 Environmental Management". Available at:http://www.iso14000-iso14001-environmental-management.com/iso14001.htm"Eco-Management and Audit Scheme (EMAS)". Available at: www.emas.org.uk/
P A R T 1
24
system. It applies to those environmental aspectswhich the organization has control over and those onwhich it can be expected to have an influence.
ISO 14001 is often seen as the corner stone andmost well known standard of the ISO 14000 series10.It is the only ISO 14000 standard against which it iscurrently possible to be certified by an externalcertification authority. It is important to note that theEMS as per ISO 14001 does not itself state specificenvironmental performance criteria.
This standard is applicable to any organization thatwishes to implement, maintain and improve anenvironmental management system, assure itself ofits conformance with its own stated environmentalpolicy (those policy commitments of course must bemade), demonstrate conformance, ensurecompliance with environmental laws and regulations,seek certification of its environmental managementsystem by an external third party organization andmake a self-determination of conformance.
The Eco-Management and Audit Scheme (EMAS), isa regulation developed to meet the needs andexpectations of governments, citizens and consumersin the European Union (EU) member states. BecauseEMAS has a legal status within Member states, it cantake a more prescriptive approach to environmentalmanagement issues. It currently applies only tomanufacturing industries.
The overall objective of EMAS is to promotecontinuous improvement in environmentalperformance of industrial activities in the EU andEuropean Economic Area, by committing them toevaluate and improve their environmentalperformance, and provide relevant information tothe public. The scheme is voluntary and based oncommon principles throughout the EU.
10 Other standards in the ISO 14000 series are ISO 14004, ISO 14010, ISO14011 and ISO 14012.
P A R T 1
25
Practicing EMAS does not replace existing EuropeanCommunity and/or national environmentallegislations, or absolve a company from itsresponsibility to fulfill all its legal obligations underenvironmental legislations.
The ISO 14001 EMS follows a structured approach toestablish, operate and review environmental management in anenterprise. It involves identifying significant e n v i r o nm e n t a la s p e c t s 11, assessing negative environmental impacts associatedwith those aspects under normal, abnormal and emergencysituations, and developing options to control and reduce thoseimpacts. In this process, ISO 14001 integrates the ideas ofimpact assessment, scenario-building, and control andreduction of impacts.
The ISO 14001 EMS offers a common standard approach,with its associated documentation, well defined certificationand surveillance criteria. It is important to remember that itdoes not in and of itself require or lead automatically to cleanerproduction and more broadly the preventive approach; it isperfectly possible to obtain an ISO 14001 certificate for aprogramme based entirely on the use of end-of-pipeapproaches. Cleaner production can be a strategic input intoan ISO 14001 EMS, making the goal of the EMS prevention ofinefficient consumption and waste generation. From the pointof view of cleaner production, this has the advantage of givingbusinesses a tool through which to apply the principles ofpreventive environmental management and productivity in asystematic manner, on a continuous basis, and over the entirelife cycle, rather than just within the factory boundary. Inaddition, since there is no basis for a standardized andinternationally agreed upon certification system for cleanerproduction, injecting cleaner production into an ISO 14001EMS is a way to have a business’s preventive approachformally recognized. In this perspective, an ISO 14001 EMScan add significant value to cleaner production.
11 According to ISO 14001, an environmental aspect is “the element of anorganization's activities, products or services that can interact with theenvironment”
P A R T 1
26
On the other hand, cleaner production can add significantvalue to the ISO 14001 EMS. Many organizations perceive theadoption of an ISO 14001 EMS as cost prohibitive due to itsassociated surveillance and documentation requirements. Insuch cases, cleaner production can provide an avenue foroffsetting the costs of establishing and maintaining an EMSthrough the economic benefits that it brings about.
1.5 Barriers to Cleaner Production
In the last ten years, cleaner production has led to a paradigm shiftin environmental management at the level of industries, businessesand financial institutions, as well as local governments andcommunities.
However, there have been a number of barriers to the promotionand adoption of cleaner production. Let us review these barriers soas to develop strategies to overcome them.
R es i s t a nce to cha ng e
Many stakeholders have an attitude to follow business as usual andnot adapt to change. Any change is considered as unwarranted,risky and not necessarily profitable.
La ck o f i n fo rma t io n , exper t i s e a nd a dequa t et ra i n i ng
Many a time, the stakeholders are interested in the concept ofcleaner production but are unable to put it in practice, due toinformation gaps and lack of technical assistance.
La ck o f co mmuni ca t i o n w it h i n ent erpr i s es
At times, a stakeholder gets interested in cleaner productionand has the necessary skills or expertise. However, thestakeholder is unable to communicate the concept and itsbenefits to the top management. This creates a barrier toimplement cleaner production.
Co mpet i ng bus i nes s pr i o r i t i es - i npa r t i cu la r , t he pres s ure fo r s ho r t - t e rmpro f i t s
A significant impediment to the adoption of cleaner productionis the emphasis of enterprises on short-term profitability. Since
P A R T 1
27
enterprises are judged by markets and investors principally onshort-term performance, they have difficulties in justifyingsome of the investment in cleaner production processes andtechnologies, even when there are demonstrably attractivelong-term financial returns.
P ercept i o n o f r i s k
Cleaner production involves possibilities of processmodification, equipment replacement or product/packagingredesign. Some stakeholders view this as risky, especially if thetechnology is not proven, or the product is not tested in themarket.
D i f f i cu l t y i n a cces s i ng c lea ner t ec hno lo g y
Investment in new, cleaner technology is a major decision forenterprises to undertake. In addition to the substantial costs ofnew technology, there are several potential external barriers,which may discourage or prevent enterprises from updatingtheir existing plant and equipment. These can include thecomplexity of new technology, the level of technologicalspecificity (cleaner technologies may be hard to transfer fromone user to the other), etc.
A cco unt i ng s ys t ems whi ch fa i l t o ca pt ureenv i ro nment a l co s t s a nd benef i t s
Accounting systems and project appraisal procedures very oftenfail to take adequate account of environmental impacts, risks,liabilities and associated costs (which are not easily quantifiable tostart with). Because of these limitations, the stakeholder is oftenunable to place environmental performance in the businessperspective and therefore fails to fully appreciate the economicbenefits of practicing cleaner production.
D i f f i cu l t y i n a cces s i ng ex t erna l f i na nce
The implementation of cleaner production technologies hasbeen hindered by a lack of access to finance. Banks,government investment agencies, corporate financialdepartments, venture capitalists, and other sources of riskcapital for industry either discriminate against or do not havethe competence to evaluate applications that concern cleanerproduction programmes, thus severely limiting their access tocapital.
P A R T 1
28
T he fa i lure o f ex i s t i ng reg ula t o ry a ppro a ches
A lack of orientation in the existing national policy andregulatory framework towards cleaner production is one of themajor impediments to the adoption of the cleaner productionstrategy. Conventional regulatory approaches have in manycases proved to be counterproductive to the uptake of cleanerproduction. By assuming that the regulators are in the bestposition to determine appropriate action, regulations mayengender an attitude of complacency on the part of themanagement.
P ervers e e co no mi c i ncent i ves
Economic subsidies for business resource inputs may be asignificant disincentive to cleaner production. For example, tothe extent that governments subsidize the price of energy andwater or the prices of relatively polluting fuels, throughsubsidies, they will diminish the financial benefits of cleanerproduction.
Many of these barriers can be addressed through strategies suchas awareness raising, training, provision of technical assistance,implementation of demonstration projects, opening upfinancing programmes, and by aligning national policies andregulations to promote cleaner production. In order to supportthese strategies, adequate institutional building is also necessary,as is the creation of partnerships between stakeholders. Theseefforts will then ensure that the cleaner production ismainstreamed.
In the next section, we will review of some of the effortsundertaken by various international agencies as well as nationalgovernments, to set a common agenda for cleaner productionand take it forward.
1.6 Mainstreaming Cleaner Production
1.6.1 Sustainability - The Driving Force andCleaner Production - The VehicleIn Section 1.2.1, we learnt that the intersections in the fields ofproductivity and environmental management led to a commonstrategy of cleaner production.
P A R T 1
29
Two important milestones were crucial to facilitate such a process.One was the Brundtland Report of 1987, and the second wasAgenda 21 of 1992, which was outlined and agreed upon at theUnited Nations Conference on Environment and Development(UNCED) (itself an outcome of the Brundtland Report). Agenda21 is a comprehensive action plan for global, national and localorganizations of the United Nations System, governments, andmajor groups in every area with human impacts on theenvironment.
The Brundtland Report, also known as "Our Common Future",alerted the world to the urgency of making progress towardeconomic development that could be sustained without depletingnatural resources or harming the environment. Published by aninternational group of politicians, civil servants and experts on theenvironment and development, this report provided a keystatement on the term "sustainable development", defining it as
‘Development that meets the needs of the present withoutcompromising the ability of future generations to meet theirown needs’
The Brundtland Report highlighted three fundamentalcomponents to sustainable development: environmentalprotection, economic growth and social equity.
The Report recommended that the environment should beconserved and our resource base enhanced, by gradually changingthe ways in which we develop and use technologies. Developingnations must be allowed to meet their basic needs of employment,food, energy, water and sanitation. If this is to be done in asustainable manner, then there is a definite need for a sustainablelevel of population. Economic growth should be revived anddeveloping nations should be allowed a growth of equal quality tothat of the developed nations.
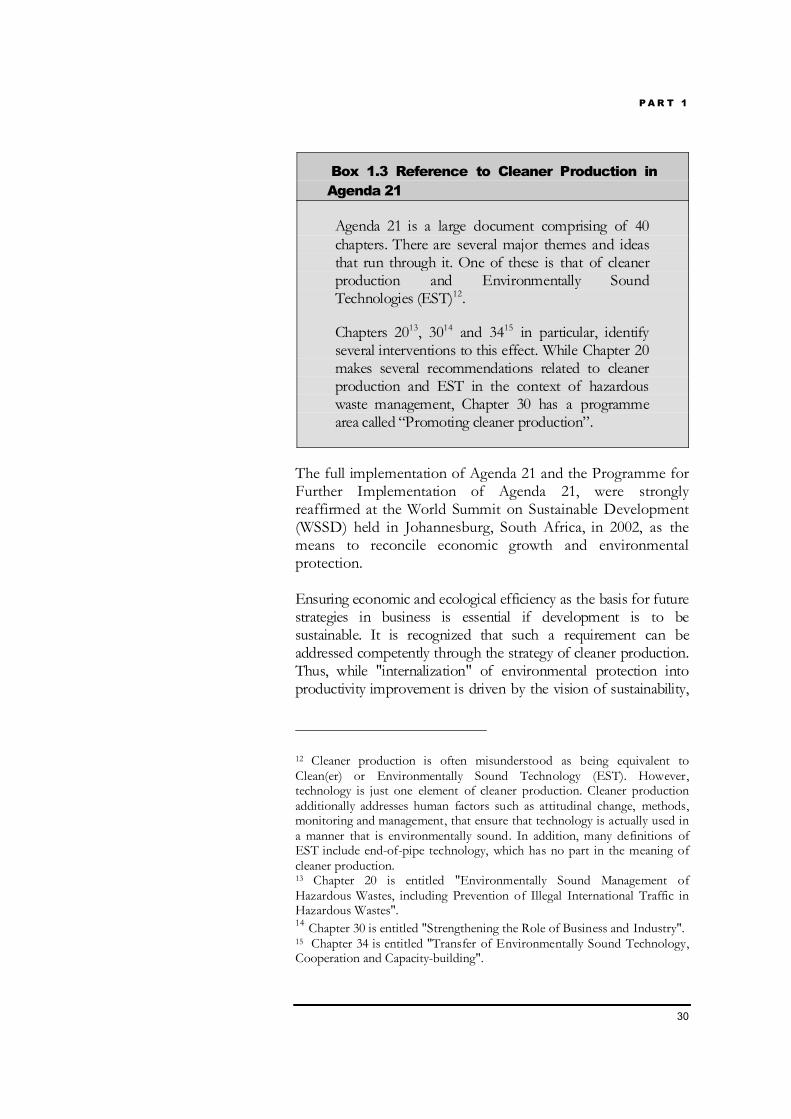
Agenda 21 made significant references to cleaner production(see Box 1.3). It provided a direction and focus for theadoption of cleaner production on a multi-stakeholder andmulti-partnership basis.
There are many otherdefinitions of"sustainability", butexact definition doesnot matter – thegeneral directiontowards sustainabilityis now clear. It is bestto start now – if abusiness waits for theroute to be fullysignposted, itscompetitors will gainan advantage over it.
P A R T 1
30
Box 1.3 Reference to Cleaner Production inAgenda 21
Agenda 21 is a large document comprising of 40chapters. There are several major themes and ideasthat run through it. One of these is that of cleanerproduction and Environmentally SoundTechnologies (EST)12.
Chapters 2013, 3014 and 3415 in particular, identifyseveral interventions to this effect. While Chapter 20makes several recommendations related to cleanerproduction and EST in the context of hazardouswaste management, Chapter 30 has a programmearea called “Promoting cleaner production”.
The full implementation of Agenda 21 and the Programme forFurther Implementation of Agenda 21, were stronglyreaffirmed at the World Summit on Sustainable Development(WSSD) held in Johannesburg, South Africa, in 2002, as themeans to reconcile economic growth and environmentalprotection.
Ensuring economic and ecological efficiency as the basis for futurestrategies in business is essential if development is to besustainable. It is recognized that such a requirement can beaddressed competently through the strategy of cleaner production.Thus, while "internalization" of environmental protection intoproductivity improvement is driven by the vision of sustainability,
12 Cleaner production is often misunderstood as being equivalent toClean(er) or Environmentally Sound Technology (EST). However,technology is just one element of cleaner production. Cleaner productionadditionally addresses human factors such as attitudinal change, methods,monitoring and management, that ensure that technology is actually used ina manner that is environmentally sound. In addition, many definitions ofEST include end-of-pipe technology, which has no part in the meaning ofcleaner production.13 Chapter 20 is entitled "Environmentally Sound Management ofHazardous Wastes, including Prevention of Illegal International Traffic inHazardous Wastes".14 Chapter 30 is entitled "Strengthening the Role of Business and Industry".15 Chapter 34 is entitled "Transfer of Environmentally Sound Technology,Cooperation and Capacity-building".
P A R T 1
31
cleaner production acts as the vehicle to translate this vision intopractice.
Both Agenda 21 and the WSSD Summit have provided cleanerproduction the needed national and global focus.
1.6.2 The International Declaration on CleanerProductionIn order to obtain a commitment to cleaner production across awide cross-section of stakeholders, an International Declaration onCleaner Production was launched by the UNEP in 1998. TheDeclaration is not limited to national governments but may also besigned by companies, associations and individuals. As of March2002, the Declaration had over 300 major signatories and had beentranslated into 15 languages.
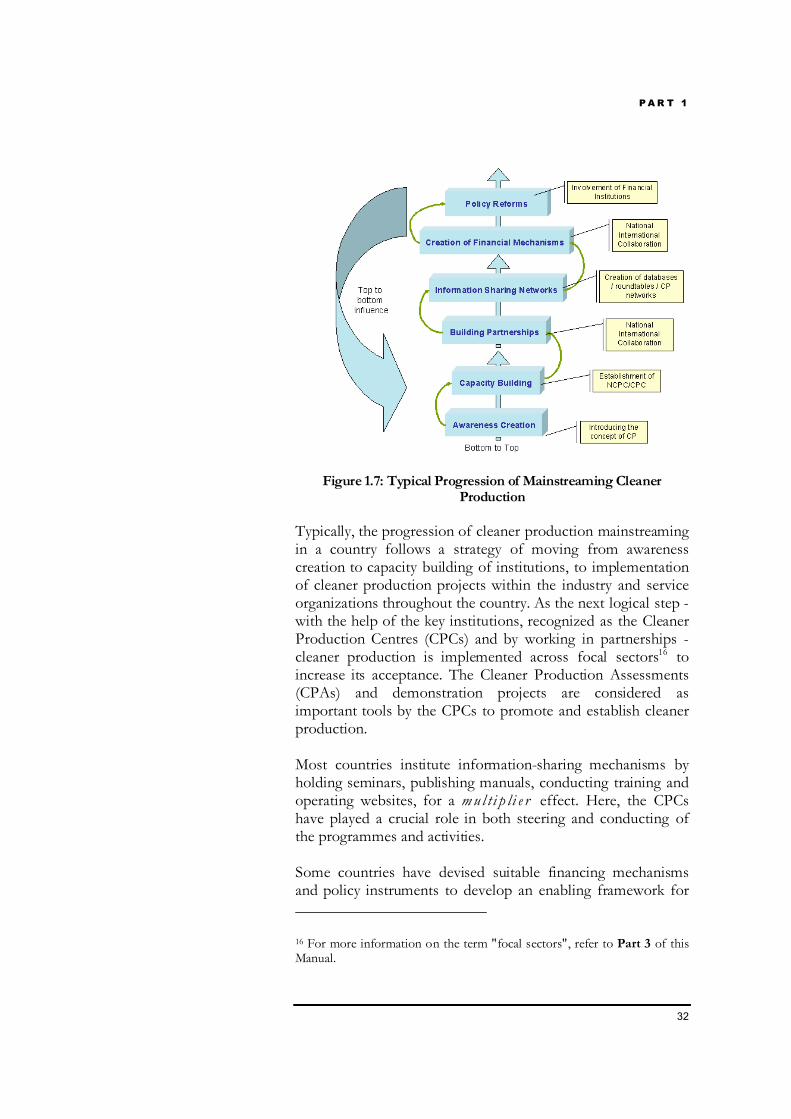
1.6.3 Establishment of Cleaner ProductionCentres as a Milestone in the MainstreamingProcessFigure 1.7 illustrates the typical progression of cleaner productionactivities in a country. There are adaptations and deviations to thismodel, as countries have evolved their own approaches topromote cleaner production that are most appropriate to the localframework. Most countries have thus adopted a combination oftop-to-bottom and bottom-to-top approaches to help facilitate theimplementation of cleaner production.
P A R T 1
32
Figure 1.7: Typical Progression of Mainstreaming CleanerProduction
Typically, the progression of cleaner production mainstreamingin a country follows a strategy of moving from awarenesscreation to capacity building of institutions, to implementationof cleaner production projects within the industry and serviceorganizations throughout the country. As the next logical step -with the help of the key institutions, recognized as the CleanerProduction Centres (CPCs) and by working in partnerships -cleaner production is implemented across focal sectors16 toincrease its acceptance. The Cleaner Production Assessments(CPAs) and demonstration projects are considered asimportant tools by the CPCs to promote and establish cleanerproduction.
Most countries institute information-sharing mechanisms byholding seminars, publishing manuals, conducting training andoperating websites, for a m u l t i p li e r effect. Here, the CPCshave played a crucial role in both steering and conducting ofthe programmes and activities.
Some countries have devised suitable financing mechanismsand policy instruments to develop an enabling framework for
16 For more information on the term "focal sectors", refer to Part 3 of thisManual.
P A R T 1
33
promotion of cleaner production. Technical support in thisregard has often been provided by the CPCs, especially to thefinancial institutions.
Policies and regulations have been found to play a critical rolein mainstreaming cleaner production. To this end, somecountries have undertaken suitable policy reforms and haveeven established National Cleaner Production Policies. Somenational governments have proposed new forms of regulations(e.g. product-based regulations) and have influenced directivesrelated to trade and taxation. The CPCs have played a catalyticrole in this reform process. Thus, the establishment of CPCshas been one of the crucial strategies in mainstreaming cleanerproduction.
To date, 25 National Cleaner Production Centres (NCPCs) havebeen established within the context of the NCPC Programmeestablished jointly by the United Nations Industrial DevelopmentOrganization (UNIDO) and the United Nations EnvironmentProgramme (UNEP). In parallel, more than 100 CPCs have beenestablished through bilateral, governmental and other forms ofassistance. There is now an extensive network of cleanerproduction-related institutions capable of delivering cleanerproduction at the local and national levels.
In this light, it is important that we understand the evolution andexperiences of the CPCs. This can indeed assist us in taking cueson how to establish and operate a cleaner production centre. Thenext Part of this Manual deals with this topic.
U N I D O / U N E P G U I D A N C E M A N U A L :
H O W T O E S T A B L I S H A N D O P E R A T E C L E A N E R P R O D U C T I O N C E N T R E S
34
Evolution of Cleaner Production Centres andNational Cleaner Production Centres
What will we learn from Part 2?
2 Evolution of Cleaner Production Centres and NationalCleaner Production Centres
35
2.1 Cleaner Production Centres - Their Or igin andEvolution
35
2.2 The National Cleaner Production Programme 40
2.3 Lessons Learnt 43
Part
2
P A R T 2
35
2 Evolution of Cleaner Production Centresand National Cleaner Production Centres
2.1 Cleaner Production Centres - Their Origin and
Evolution
art 1 concluded on the note of mainstreaming cleaner productionand the role of Cleaner Production Centres (CPCs) as criticalcapacity building institutions at the local and / or national levels.It is therefore interesting and worthwhile to track the history of
CPCs and in particular understand the origin and evolution of the NCPCProgramme that was established by UNIDO and UNEP.
For the purposes of this Part, the term "Cleaner Production Centres" orCPCs will include Pollution Prevention (P2) Centres, Regional CPCs,Green Technology Centres, National Centres for Cleaner Production1,Centres of Investment Projects and Environmental Certification,Technical Assistance Centres for Pollution Prevention and WasteMinimization, Technical Assistance Programmes for P2, CleanerProduction Laboratories, Centres for Pollution Prevention and CleanTechnology Offices2, etc. We shall use the term “National CleanerProduction Centres” or NCPCs exclusively in the context of theUNIDO/UNEP-backed Programme.
Figure 2.1 shows the NCPCs and CPCs around the world. To date, 25NCPCs have been established by UNIDO with support from UNEP. Inparallel, more than 100 CPCs have been established through bilateral,government and other forms of assistance. Thus, there is now anextensive network of cleaner production-related institutions capable ofdelivering cleaner production at the local and national levels.
1 Although they sound alike, the term “National Centres for Cleaner Production”(NCCP) differs from the term “National Cleaner Production Centre” (NCPC).The latter is always employed in the context of the UNIDO/UNEP-backedNCPC Programme (see Section 2.2).2 The underlying theme amongst all the terms is cleaner production. However,the terminologies are varied depending on the institutions / agencies financing thecentres.
P
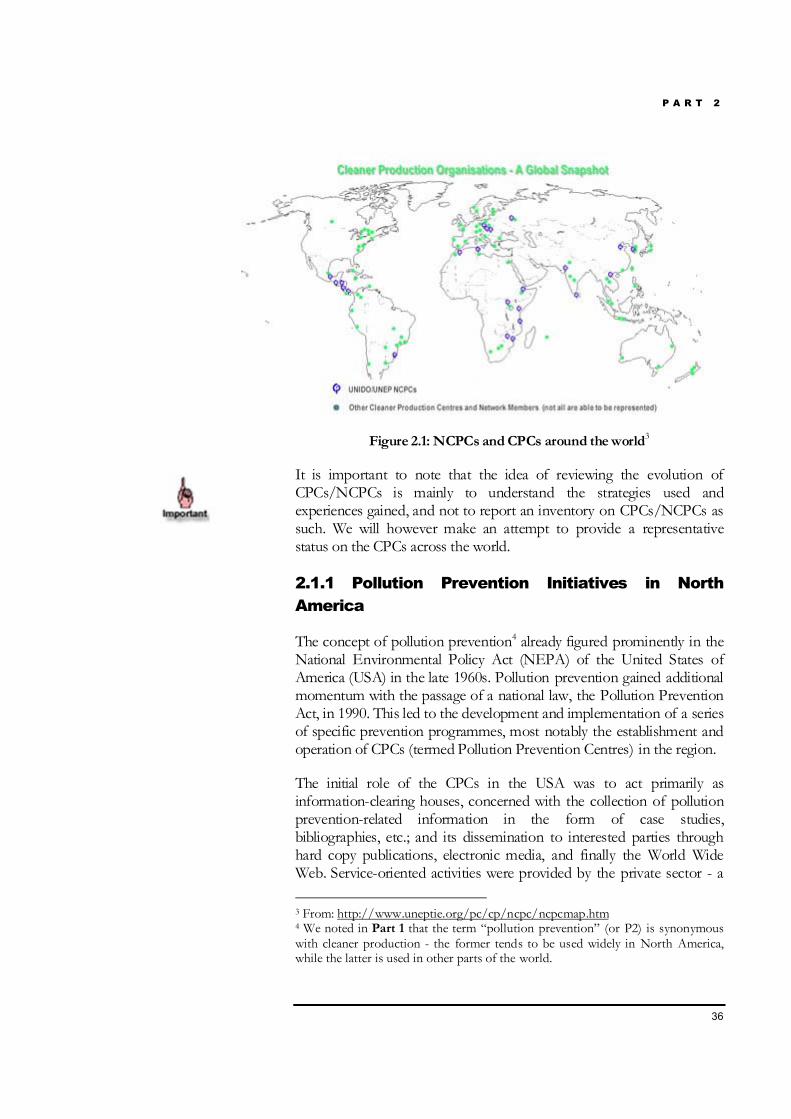
P A R T 2
36
Figure 2.1: NCPCs and CPCs around the world3
It is important to note that the idea of reviewing the evolution ofCPCs/NCPCs is mainly to understand the strategies used andexperiences gained, and not to report an inventory on CPCs/NCPCs assuch. We will however make an attempt to provide a representativestatus on the CPCs across the world.
2.1.1 Pollution Prevention Initiatives in NorthAmerica
The concept of pollution prevention4 already figured prominently in theNational Environmental Policy Act (NEPA) of the United States ofAmerica (USA) in the late 1960s. Pollution prevention gained additionalmomentum with the passage of a national law, the Pollution PreventionAct, in 1990. This led to the development and implementation of a seriesof specific prevention programmes, most notably the establishment andoperation of CPCs (termed Pollution Prevention Centres) in the region.
The initial role of the CPCs in the USA was to act primarily asinformation-clearing houses, concerned with the collection of pollutionprevention-related information in the form of case studies,bibliographies, etc.; and its dissemination to interested parties throughhard copy publications, electronic media, and finally the World WideWeb. Service-oriented activities were provided by the private sector - a 3 From: http://www.uneptie.org/pc/cp/ncpc/ncpcmap.htm4 We noted in Part 1 that the term “pollution prevention” (or P2) is synonymouswith cleaner production - the former tends to be used widely in North America,while the latter is used in other parts of the world.
P A R T 2
37
logical outcome, given that the legal and regulatory framework forpollution prevention was established at the outset. These CPCs confinedtheir area of activity to one or more (but never all) of the followingservices viz. publications, training, applied research, technical assistance,permit and regulatory assistance, financial assistance and so on5.Interestingly, in every State, CPCs were set up as project units, outreachoffices or technical assistance cells across environmental regulatoryoffices, small business assistance and promotion offices, environmentalNGOs, research units and universities. This provided a widerinstitutional base to mainstream pollution prevention in the USA.
The Pollution Prevention Act also mandated the allocation of revolvingfunds for local pollution prevention programmes. This greatly assisted inthe promotion of pollution prevention investments amongst businessesin the region. Some of the CPCs operated as project development andappraisal offices to service pollution prevention funds. Thus, the settingup of CPCs in the United States was rather well-strategized - it wasbroad-based and created an enabling framework through pollutionprevention legislation and financing schemes.
A CPC was established by Environment Canada in Ontario in 1992.Formerly called the "Great Lakes P2 Centre", it is now known as the"Canadian Centre for P2" or C2P2. Today, C2P2 functions as aninformation clearinghouse for promoting pollution prevention. It is anon-profit, non-governmental organization supported by businesses andthe Canadian government. The Board of Directors of the C2P2 includespersons from businesses, the government, trade institutions andacademia. In 1997, the centre decided not to limit itself to information-sharing alone and broadened its scope to include various other services.
2.1.2 Cleaner Production Initiatives in the EuropeanRegionDevelopments concerning CPCs were taking place in the Europeanregion in parallel. Adopting cleaner production throughout theEuropean industry was a recommendation put forth at the Industry andDevelopment Seminar in Warsaw, held prior to the 1990 BergenConference in preparation for the 1992 Earth Summit. As a result, in1991, the Norwegian government supported a Polish CPC as part of theNIF-NOT Cleaner Production Programme. This programme was runbetween the Norwegian Chartered Engineers' (Norske SivilenginoresForening, NIF) and the Polish Engineers' (Naczelna Organizacja
5 USEPA: Pollution Prevention State P2 Programmes Website. Available at:http://www.epa.gov/p2/resources/statep2.htm
P A R T 2
38
Techniczna, NOT) Societies. The CPC formulated in this programmecoordinated the work of eight other regional centres. Interestinglyenough, these societies were non-governmental organizations, with thePolish counterpart providing the existing infrastructure and network ofits various branch societies, and the Norwegian counterpart providingthe technical experts and the funding. The main objective of the CPCwas to raise awareness, conduct training, develop trainers and build aframework between cleaner production and EMS.
Around 1992, the concept of NCPC was promulgated, taking itsdirections from Agenda 21. In 1993, taking a cue from the forthcomingNCPC Programme, Australia launched a CPC (“Australia Centre forCleaner Production”) based on strong State and Federal Governmentinterest in and commitment to cleaner production. This CPC was a non-profit organization and any excess revenue was distributed toappropriate beneficiaries at the end of each financial year (e.g. for cleanerproduction scholarships, public good funding, etc.). The seed fundingfor the centre was provided by sponsoring and associate memberinstitutions. The centre was to be self-funding within three years;consequently it chose to build up a constant revenue base from itsservices as a broker in technology transfer, a consultant for cleanerproduction, and a developer of education and business packages incleaner production. Unfortunately, this CPC failed in 1996 and wasfinally wound up in 1997.
2.1.3 Establishment of CPCs across the ContinentsGiven the enthusiastic response to CPCs, some of the developedcountries decided to introduce CPCs in other countries, (especially thedeveloping countries), thereby establishing a gateway for marketingcleaner technologies. This led to the establishment of CPCs across thecontinents. These CPCs focused on the traditional information-dissemination, training and technology transfer activities, and graduallyexpanded their services to include technical assistance and catalyzinginvestments for cleaner technology projects.
While generally quite similar to NCPCs, these centres can and did differin some significant aspects, notably the importance given to technologytransfer rather than to the development of national capacities.
In the initial years, such CPCs were primarily funded by the bilateraldevelopmental agencies under various international projects. Between1994 and 1995, eleven CPCs were established in the Central and EasternEuropean region, specifically in Bulgaria, Czech Republic, Estonia,Hungary, Latvia, Lithuania, Poland (three centres), Romania andSlovakia through seed funding by USAID, and the assistance of the
P A R T 2
39
World Environment Centre (WEC). The USAID grants were availableto most centres until September 1997.
In 1994, the Government of Norway through the World CleanerProduction Society (WCPS) established Russian and Russian-NorwegianCPCs, drawing funds partly from the Government of Norway and partlythrough domestic funding.
In the Asia-Pacific region, USAID funded a CPC in the TaiwanProvince of China in 1995 through the US Asia EnvironmentPartnership (USAEP). USAEP along with the Singapore Confederationof Industries (SCI) established a CPC in Singapore in 1996 under aprogramme called Clean Technology and Environmental Management(CTEM). Initially, this Center was designed to be a clearinghouse forinformation on cleaner production practices, but today the centreprovides outreach activities such as briefings, seminars, and workshopsfor CEOs and industry associations.
There have also been instances of CPCs merging. For instance, theUSAID-funded CPCs in the Czech Republic and Slovakia merged withthe respective NCPCs of the countries after several years ofestablishment as CPCs.
2.1.4 Some Observations about the CPCsFrom the last section, it is clear that CPCs in developing countries andcountries in economic transition, evolved primarily as regional offshoots.These CPCs were influenced to a great extent by donor / fundinginstitutions.
While the concept of CPCs trickled down well with importantstakeholders, there were some inherent drawbacks. To a large extent,these CPCs tended to be more supply-driven than demand driven. Beingrather devoid of "national character", they could not influence nationalpolicies, and were generally confined to providing services such asinformation sharing, technology transfer and match making.
CPCs in the developed countries, on the other hand (US, Canada andAustralia), played an important role in catalyzing and mainstreamingcleaner production. These CPCs performed reasonably well because ofthe enabling framework already in place, such as a pollution prevention-oriented policy and pollution prevention regulations, as well assupportive financing and budgetary allocations.
P A R T 2
40
2.2 The National Cleaner Production Centre
Programme
We have tracked the evolution of CPCs in the previous section. Thereare many similarities between CPCs and NCPCs. In fact, many a time itbecomes difficult to assess which takes a cue from which. We also notedcertain drawbacks inherent to CPCs, notably their inability to influencenational policies, as they were devoid of national character.
NCPCs are backed by two multilateral UN institutions, the UnitedNations Industrial Development Organization (UNIDO) and the UnitedNations Environment Programme (UNEP). The NCPC Programmemandates a commitment by the National Governments to theirrespective NCPCs and hence (unlike the CPCs) NCPCs get uniquelypositioned in the national perspective. The NCPC Programme builds thecapacity of NCPCs to enable them to provide a wide range of services6
such as awareness-raising, training, cleaner production assessments,demonstration projects, etc. Finally, the NCPC is part of a worldwidenetwork that provides an opportunity to share both content andexperiences in cleaner production – a great advantage in being a memberof the same “family”.
Thus, the UNIDO/UNEP NCPC Programme design provides a uniqueset-up in terms of offering an opportunity for international co-operation,national capacity building and networking amongst the actors in cleanerproduction throughout the world. In the following section, we shall examinethe NCPC Programme in further detail.
2.2.1 An Introduction to the National CleanerProduction ProgrammeThe NCPC Programme is a joint initiative by UNIDO and the Divisionof Technology, Industry and Economics (DTIE) of UNEP, to helpdeveloping countries and countries with economies in transitionpromote the application of cleaner production in enterprises, andimportantly, to incorporate cleaner production in the nationalenvironmental policy and regulatory framework.
6 Covered in detail in Part 4 and Part 5 of this Manual.
P A R T 2
41
UNIDO has the lead role in establishing NCPCs. It is the executingagency for the NCPCs, being responsible to the funding or donororganizations and the NCPC counterparts; viz. the nationalgovernments. It is responsible for providing initial training to centrepersonnel, providing technical oversight for all activities undertaken bythe centres, formulating the annual work plans with the Directors of thecentres, assisting them in the management of their centres andmonitoring their progress.
For its part, UNEP plays a lead role in the dissemination of cleanerproduction information, the organization of in-country trainingactivities, and the mobilization of key policy-makers, particularly theMinistries of Environment.
The UNIDO/UNEP NCPC Programme typically provides funding forthe first three to five years of a centre’s life. These funds cover theNCPC director’s salary, short-term national and internationalconsultancies, initial international training and study tours, andprocurement of some equipment. The host country or institutiontypically provides the salaries of a deputy director, administrative staff,office space and logistical support (communications, supplies, etc).
NCPCs have relatively lean organizational structures, the idea being thateach centre creates a network of institutions and individuals in thecountry that it can work with. Each centre is directed by an experiencedcountry national. In nearly all cases, the NCPC is hosted within a localorganization7 - for example, in Costa Rica by the Chamber of Industry,in India by the National Productivity Council, in Kenya by the KenyaIndustrial Research Development Institute, and in Hungary by theDepartment of Environmental Economics and Technology, BudapestUniversity.
Host organizations and other local stakeholders make contributions(both financial and in-kind) to the centre, such as secondment ofpersonnel, office facilities and equipment. This arrangement has beeneffective in building ownership of activities in each country, and has alsominimized operational costs. Furthermore, co-operation with a strongnational host institution increases possibilities for the sustainability of thecentre, once the project funding period has elapsed.
7 For successful capacity building, it is crucial to form partnerships with localorganizations that are willing to invest resources for promoting cleaner production.A key requirement for the host is that it has to have good contacts with theindustry.
“The UNIDO/UNEPProgramme design provides aunique set-up in terms ofoffering a profoundinfrastructure forinternational co-operationand networking betweencleaner production actorsthroughout the world, whichbilateral programmes cannotprovide”.
- Evaluation Report of theNCPC Programme, 1996,Lund University, Sweden.
P A R T 2
42
2.2.2 The Gradual Evolution of the NCPC Programme
At the launching of the NCPC Programme in 1994, eight NCPCs wereset up - Zimbabwe (1994), Brazil (1995), China (1995), India (1995), theCzech Republic (1994), Mexico (1995), the Slovak Republic (1995), andthe United Republic of Tanzania (1995). These centres were selectedfrom solicitations received from 39 institutions in 25 countries. TheNCPCs in the Czech Republic and Slovakia were extensions of CPCsestablished earlier with USAID support. In 1996, the Tunisian CPCestablished a few years before with USAID funding was included in theProgramme. In 1997, a centre was established in Hungary.
The Government of the Netherlands funded the centres in China, India,Mexico, the United Republic of Tanzania and Zimbabwe, whereas theGovernment of Austria funded the centres in the Czech Republic,Hungary and Slovakia. The centre in Tunisia, when it entered theUNIDO / UNEP Programme, received funding from Norway. Thecentre in Brazil was funded nationally and continues to remain so.
At this stage, the NCPCs' activity profile was designed to cover thefollowing areas - awareness-raising, training, information dissemination,demonstration projects, and to some extent, policy advocacy.
Based on the encouraging progress of the Programme and requests fromdeveloping countries and countries with economies in transition, theyears 1998 and 1999 saw a continuation of the Programme and additionof new NCPCs. In 1998, a regional grouping of centres was establishedin Central America: Costa Rica, El Salvador, Guatemala and Nicaragua.The first three of these centres were funded by Switzerland (the SwissState Secretariat for Economic Affairs, SECO), while Austria funded theNCPC in Nicaragua. The year 1998 also saw the establishment of anNCPC in Vietnam, through initial funding from the Swiss DevelopmentCorporation (SDC), and later funding from SECO. Another centre, alsofunded by SECO, was set up in Morocco in 1999.
At this point, NCPC services were expanded to include assistance inobtaining cleaner production investments. Additional emphasis was alsoput on integrating cleaner production with Environmental ManagementSystems like ISO 14001. Performance indicators were also introducedfor monitoring and assessment of all NCPCs.
The period 2000-2001 saw the creation of a group of new centres inEastern and Southern Africa: Ethiopia, Mozambique (both funded byItaly), Kenya (funded by UNDP) and Uganda (funded by Austria). Thesame period saw the establishment of two more centres in Asia, one in
P A R T 2
43
Sri Lanka (funded by Norway) and one in the Republic of Korea (self-funded). The latter NCPC has a design specifically suited to the country'sspecialty; i.e. technological expertise. There was an added emphasis onproviding services concerning cleaner technology know-how. TheCroatian centre was also established in this period, as the outcome of acleaner production demonstration project which was funded by theCzech Government.
Finally, in 2002, centres were established in Lebanon (the first in theMiddle-East) and South Africa.
Presently, there are 25 NCPCs operating in the UNIDO / UNEPNCPC Programme. However, UNIDO has been flexible in its design ofprojects, establishing other types of CPCs or cleaner productionprogrammes. For instance, while all NCPCs have a multi-sectoral focus,UNIDO is experimenting with sector-specific centres. A self-fundedCPC was set up in Russia in 2001, which focuses on the oil and gasindustry. Preliminary work is underway to launch a centre focusing oncleaner fuels in Pakistan. UNIDO is also experimenting with centres thatlook at cleaner production as well as waste management. A centre withthis scope was established in St. Petersburg in 2001, with funding fromAustria and the United Kingdom. In 2001, a National Network (asopposed to a centre) was created in Cuba (with Austrian funding). Thiswas tailored to Cuba's economy, wherein most enterprises are owned byline ministries (for example, sugar factories are owned by the Ministry ofSugar).
2.3 Lessons Learnt8
Many countries have requested assistance from the NCPC Programmein developing their own cleaner production capacities. A frequentrequest from countries is for advice and know-how on how to establisha self-sufficient cleaner production centre. It therefore becomesimportant for us to learn from the experiences of established NCPCs.This is what we shall aim to do in this particular section of the Manual.
At the outset, it is important to note that there is no set recipe forestablishing a CPC. Countries are at different stages of socio-economicdevelopment, with different industry structures, socio-economic profiles, 8 Users of the Manual are encouraged to read the report “Learning from theExperience of National Cleaner Production Centres.” Available from the CleanerProduction Publications Catalogue: Changing Production Patterns at:www.uneptie.org/pc/cp/library/ catalogue/catalog_general.htm. Note that thereport applies equally to CPCs.
P A R T 2
44
cultures and challenges. Thus, what may work in one country will notnecessarily work in another.
Initially, it was thought that establishing and operating an NCPC wasgoing to be an easy task. However, in many cases the experience wasdifferent. Today, the UNIDO/UNEP Programme requires centres todevelop business plans that plan activities around basic businessprinciples, and adapt them according to local conditions.
Becoming self-sustainable has become rather critical for all the NCPCstoday. Generally, on average, five years of sustained funding is needed toenable a centre to become financially sustainable. Few donors accept tocontinue funding a centre for more than three years and hardly any willfund it for more than five. Therefore, centres have a “window ofopportunity” of three (possibly five) years in which to create a sufficientmarket for themselves in cleaner production and become financiallysustainable after the initial funding ends. All of the first generationNCPCs have made this transition to financial sustainability, some muchmore successfully than others. They are now financing their activitiesfrom various sources such as domestic funding (national or localgovernment grants or contracts), operational income (CleanerProduction Assessments or CPAs, training programmes, consultancyfees, membership fees, publication sales, etc.), and international funding(other multilateral / bilateral agencies – World Bank projects, bilateralassistance, etc.).
Not all activities of an NCPC have the potential to become self-financing, raising difficult questions for each centre about balancingincome-earning activities with the less profitable goals of a cleanerproduction centre (e.g., helping small- and medium-sized enterprises,policy dialogue, etc.). However, as a centre matures, the need for externaltechnical assistance declines, reducing the proportion of external fundingneeded, and centres become more adept at obtaining domestic orbilateral donor funding for non-income generating activities.
Therefore, from the point of view of financial sustainability, CPCs needto explore providing services to an ever wider range of stakeholders, anddeploying new strategies for “market development”.
Historically, NCPCs have expanded their services from Level 1 to Level2 as shown in Figure 2.2. The general trend is that recently establishedNCPCs focus on Level 1, with plans to move to Level 2, while matureNCPCs graduate from Level 2 to the more strategic Level 3.
The transition from beingdonor-financed to becomingself-sustainable can be bestsummarized as ‘desperate’!We will be covering between20 and 25% of our costs thisyear, and maybe next yearwill be able to reach up to50%. Many things are notpaid for, for example, policywork and dialogue.”
- NCPC, Mexico
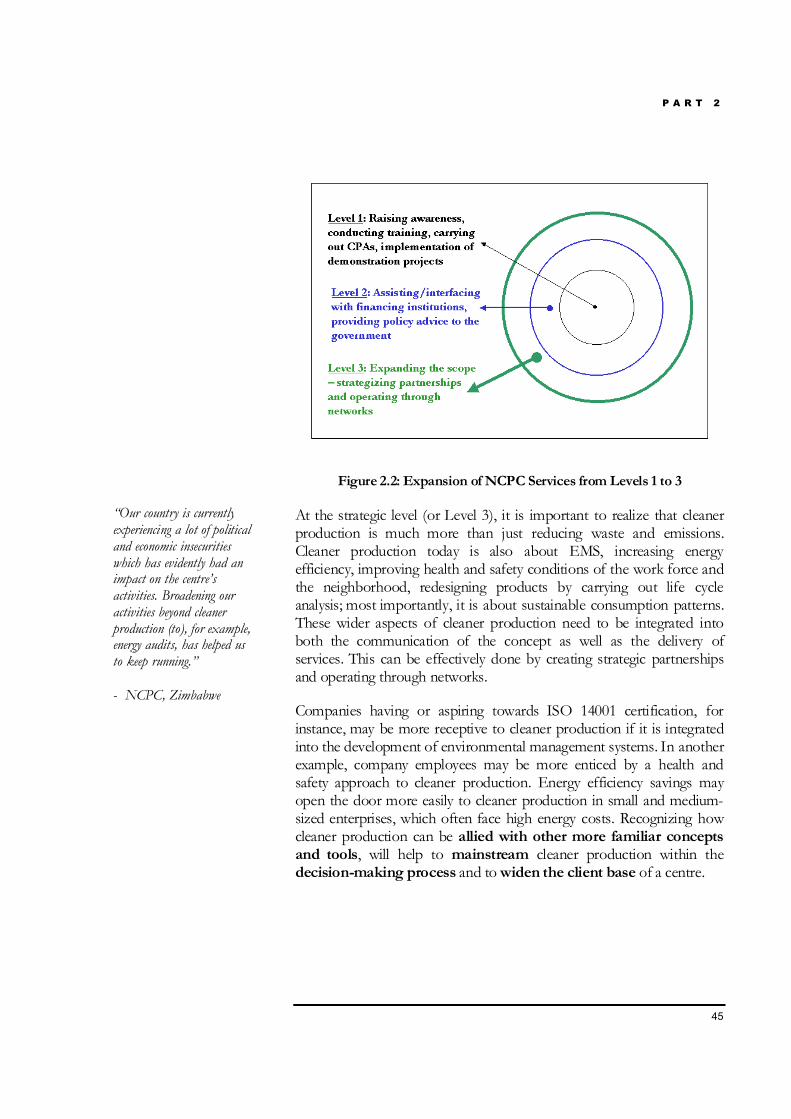
P A R T 2
45
Figure 2.2: Expansion of NCPC Services from Levels 1 to 3
At the strategic level (or Level 3), it is important to realize that cleanerproduction is much more than just reducing waste and emissions.Cleaner production today is also about EMS, increasing energyefficiency, improving health and safety conditions of the work force andthe neighborhood, redesigning products by carrying out life cycleanalysis; most importantly, it is about sustainable consumption patterns.These wider aspects of cleaner production need to be integrated intoboth the communication of the concept as well as the delivery ofservices. This can be effectively done by creating strategic partnershipsand operating through networks.
Companies having or aspiring towards ISO 14001 certification, forinstance, may be more receptive to cleaner production if it is integratedinto the development of environmental management systems. In anotherexample, company employees may be more enticed by a health andsafety approach to cleaner production. Energy efficiency savings mayopen the door more easily to cleaner production in small and medium-sized enterprises, which often face high energy costs. Recognizing howcleaner production can be allied with other more familiar conceptsand tools, will help to mainstream cleaner production within thedecision-making process and to widen the client base of a centre.
“Our country is currentlyexperiencing a lot of politicaland economic insecuritieswhich has evidently had animpact on the centre’sactivities. Broadening ouractivities beyond cleanerproduction (to), for example,energy audits, has helped usto keep running.”
- NCPC, Zimbabwe
U N I D O / U N E P G U I D A N C E M A N U A L :
H O W T O E S T A B L I S H A N D O P E R A T E C L E A N E R P R O D U C T I O N C E N T R E S
46
How to Establish a CleanerProduction Centre
What will we learn from Part 3?
3 How to Establ ish a Cleaner Production Centre 47
3.1 Introduction 47
3.2 Formulating a Conceptua l Plan for the Centre 49
3.3 Creating the Basic Design for the Centre 59
3.4 Meeting the Financia l Needs of the Centre 81
3.5 Establ ishing the Centre 85
Part
3
P A R T 3
47
3 How to Establish a Cleaner ProductionCentre
3.1 Introduction
o Cleaner Production Centre can be successfully establishedunless the lead is taken by an institution or a consortium ofinstitutions that has / have a clear stake in establishing it asa part of their mission and business objectives. We will call
such an institution or consortium the “Cha mp ion”.
Part 3 provides a general guidance to the Champion for establishinga CPC.
The process of establishing a CPC can be described in terms of fourmilestones. In essence, these four milestones form the B us in e ss P la nfor the centre.
1. Fo rmu la t i ng t he c o nc ep tua l p l a n : The Champion will need toformulate the concept that will be responsible for the genesis andoperation of the centre. The concept should clarify for instancewhat the CPC should do and how. The plan will also identify otherstakeholders that the Champion should induce to join together toestablish the centre.
2. D e ve lop in g t he ba si c d es i g n : The stakeholders of the centretogether will need to formulate its mission, objectives and strategy,along with its organizational set-up. In addition, the stakeholderswill also need to identify the basic resource requirements that willbe needed to render the centre operational.
3. M e eti ng th e f i n an c i a l n ee ds o f t he c e nt r e : Once the basicresource requirements of the centre have been finalized, the nextstep will be securing funding to meet those requirements. Funding
1 Refer to Section 1.6.2 of Part 1 of this Manual for an elaboration on IDCP(International Declaration on Cleaner Production).
NAlthough not a pre-requisite, it would beideal if the Championwere a signatory toIDCP1. This wouldhelp the champion toinduce otherstakeholders of theCPC to becomesignatories to IDCP,and thus disseminatethe message of cleanerproduction.
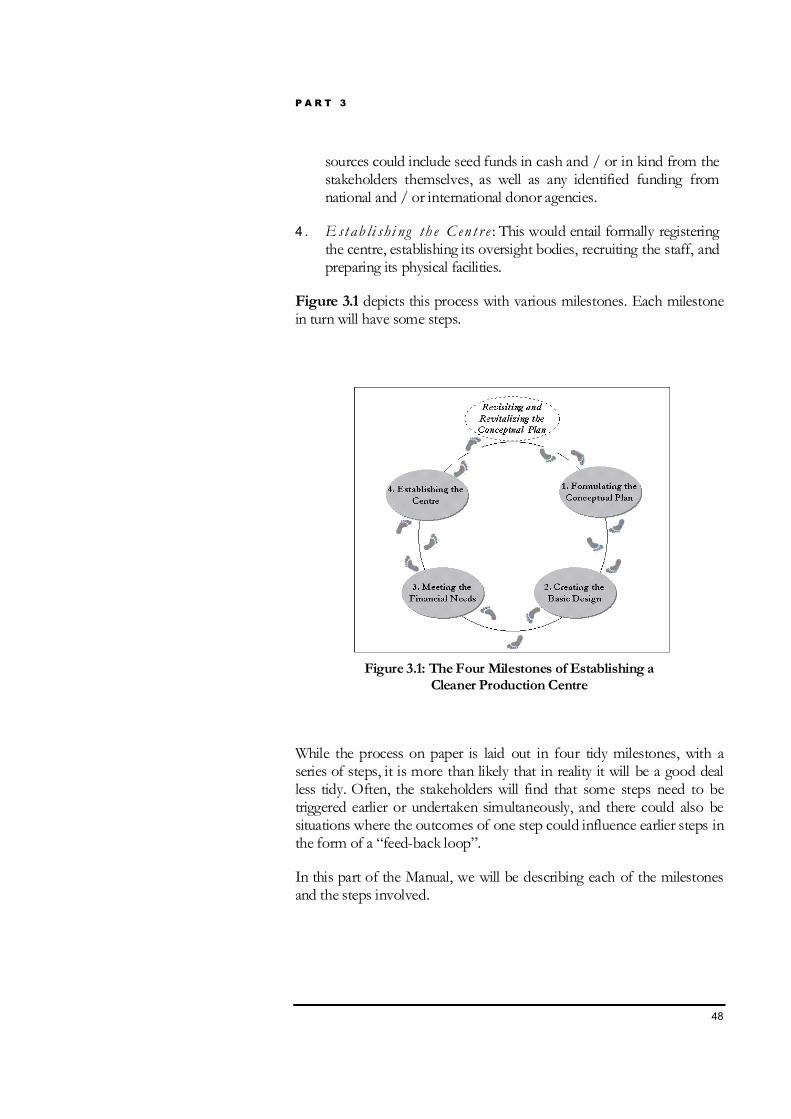
P A R T 3
48
sources could include seed funds in cash and / or in kind from thestakeholders themselves, as well as any identified funding fromnational and / or international donor agencies.
4 . E st ab li shi ng th e C en t r e : This would entail formally registeringthe centre, establishing its oversight bodies, recruiting the staff, andpreparing its physical facilities.
Figure 3.1 depicts this process with various milestones. Each milestonein turn will have some steps.
Figure 3.1: The Four Milestones of Establishing aCleaner Production Centre
While the process on paper is laid out in four tidy milestones, with aseries of steps, it is more than likely that in reality it will be a good dealless tidy. Often, the stakeholders will find that some steps need to betriggered earlier or undertaken simultaneously, and there could also besituations where the outcomes of one step could influence earlier steps inthe form of a “feed-back loop”.
In this part of the Manual, we will be describing each of the milestonesand the steps involved.
P A R T 3
49
Once th e pe r t i ne n t dec i s i o n s ha v e be e n tak e n , a t t h e e nd o fe a c h mi le s to ne , t he y s ho u ld be d o cum e nt ed a nd p r es e r vedca r e f ul l y . This documentation will come in handy towards later stages;i.e. revisiting and revitalizing the conceptual plan for the centre as andwhen the need arises, making formal presentations / proposals tointerested parties (e.g. donor institutions, etc.), getting into legalities, andso on.
3.2 Formulating the Conceptual Plan for the
Centre
• What should be the geographic coverage of the centre?
• What are the focal sectors that need to be addressed through thecentre?
• Which stakeholders should be involved in the establishment andoperation of the centre? What could be their roles and relationships?
At this point, the Champion and the stakeholders together will work onthe rest of the fundamental conceptual issues:
• What other cleaner production activities or resources exist in thecountry? What are the cleaner production-related needs that are stillunmet?
• What type of services should the centre focus on in its initial stage,the first three to five years? What could be the services that could beplanned for a later date (once the centre is well established)?
By answering these key questions, the Champion and the otherstakeholders can then:
• Identify the niche that the centre can suitably fill;
• Develop a preliminary design for the centre, i.e. the draft mission,objectives and strategies; and
• Elaborate the basic organizational structure of the centre, includingthe centre’s physical location, and the use of a host institution ornot.
Each of these points is discussed in more detail below.
F l f h l l
P A R T 3
50
3.2.1 Determining the Geographical Coverage andFocal Sectors to be Addressed by the CentreThe Champion must decide what the coverage of the centre will be interms of:
• The geographical area of the country the centre will cover; and
• The focal sectors the centre will address.
With regards to geographical coverage, the Champion may like toconsider whether the centre will:
• Play a national role; i.e. address the entire country; or
• Play a regional / local role; i.e. a centre could be established at thestate, provincial, or even the municipal level. As outlined in Part 2of this Manual, examples of centres at all these levels currently exist.
The decision here will be situation-specific. In some cases, the latteroption is chosen if the Champion is a local player. In other cases, it ispossible that the Champion may be in a position to source limited fundsor gather support mainly from regional institutions. Sometimes, the planof setting up a regional centre may be chosen to serve as a pilot or as aconfidence-building strategy, with a possible launch in the future as anational centre.
With regards to the sectoral coverage, it should be remembered that thei nd u st ri a l ma nu fac t uri n g se c to r h as rec e i v ed t he m os ta t te n t i o n to da te . This is because this sector has been considered onethat causes the greatest environmental impacts (in terms of resourcesconsumed and wastes produced), is economically critical (in terms ofcontributions to the Gross Domestic Product or GDP) and is sociallyimportant (in terms of employment).
The Champion should, however, examine r e l e v a nc e o f o t he r s ec to rsas well - the service sector, the government and agriculture - in decidingthe focus of the centre. The characteristics of each of these sectors arebriefly described below.
• T h e s er vi c e s e c to r : Cleaner production has been successfullypromoted in service sectors such as tourism, hospitality and healthservices. The emphasis for the service sector may well be on issuessuch as minimization of consumption (especially that of naturalresources), redesign of products, rethinking delivery of services, aswell as minimization of wastes, and more importantly, promoting
P A R T 3
51
sustainable consumption within communities. This sector alsoincludes consultants, technology providers and operators involvedin waste management services.
• Th e go ve r nme n t se c to r : Cleaner production concerns in thissector have mostly focused on public or government-ownedbusiness enterprises, infrastructure providers and operators ofwater, power, transportation services, etc. They are characterized byhigh consumption of natural resources, and high inefficiencies ofresource conversion and reutilization. Municipalities, armed forces,ministries, roads and telecom departments, etc. are also examples inthis sector where cleaner production can be usefully adopted.
• Th e ag ri c u lt u r a l sec to r : This sector involves intensive use ofnatural resources (e.g. water). As in other sectors, this sector toogenerates a significant amount of wastes (for instance, post-harvestlosses). Furthermore, agricultural activities use a variety of agro-chemicals, such as fertilizers and pesticides, which pose risks to theenvironment in their life cycle.
When deciding what sectors a new centre should focus on, it is oftenuseful to study each of the sectors in the context of the nationaleconomy, social indicators and environmental sensitivity. Some of theuseful statistics that the Champion may consult would fall under thefollowing sub-groups:
• Economic (percent contribution to the GDP, percent contributionto the exports, percent investments)
• Social (percent employment of the total)
• Environmental (percent consumption of natural resources, namely,materials, water and fuels)
Sectors making a large contribution to the GDP, having a high order ofemployment and, at the same time, demonstrating significantconsumption of natural resources, could well be the focal sectors for anew centre. However, more detailed analyses may be required byexamining the geographical and size distribution of the sectors, supply-chain linkages across the sectors and most critically, the relevant nationalpriorities proclaimed by the government. For instance, priority might begiven to a sector that is a major user of natural resources (certain types ofmaterials, water and / or fuels), and where the reduction in consumptionis prioritized by national policy. Or perhaps the Champion may prefer anexport-oriented sector, with wide cross-sectoral influences due to its
P A R T 3
52
supply chain, which may be under environmental pressures at the sametime.
The Champion could also decide that the industrial sector may not bethe most relevant sector of the economy for a centre, especially wherethere are possibilities of setting up a local centre. For instance, in acoastal region with significant tourism activities, the tourism sector mayserve as one of the focal sectors. In another example, the Champion willprobably want to focus a municipality-based centre on those particularindustries that are present in the municipality. It might also want to focuson the commercial sector and / or even on the services that themunicipality itself operates.
Note that one centre c a nnot e f f e c t i v e ly cover a l l sectors of theeconomy a t t h e sa me t im e . Therefore, in establishing a centre, oneneeds to adopt a phased approach, supported by strategic partnerships.
The Champion may therefore consider the options of covering only afew relevant sectors, or work across all the critical sectors while limitingto select sub-sectors.
One must remember that at this stage the Champion is not makingdefinitive decisions, and is working primarily at a conceptual level. Itcould well be that during later discussions with other stakeholders; therecould be modifications to both the geographical coverage and thesectoral focus that it proposed initially. There could be even furthermodifications when the stakeholders assess what cleaner productionactivities are already ongoing and/or what cleaner production expertisealready exists in the region / sector(s).
3.2.2 Identifying Relevant Stakeholders for theCentreThe Champion should not attempt to establish a centre alone. It isimportant to bring together all relevant, equally interested or committedstakeholders. A centre will function sustainably only if the stakeholdersrepresenting all the different facets of cleaner production are involvedand take ownership for the centre. If these institutions are not involvedupfront, there are risks such as duplication, poor coordination, lack ofsupport, especially in messaging and implementing cleaner production,and perhaps, even the threat of competition!
In many cases, the initial decisions made about the geographical coverageand sectoral focus of the centre will determine the stakeholders that may
P A R T 3
53
have to be approached. For instance, if a Champion is trying to form anational centre focusing on certain industrial sectors, “natural”stakeholders are the relevant national associations of industries.
In order to identify institutions of relevance, the Champion (helped byother stakeholders as they get identified) should do a “matchmaking”exercise by comparing the centre’s coverage and focus to the profiles ofcleaner production-related stakeholders in the country. The profilesshould include details on cleaner production-related activities (past aswell as existing projects / initiatives), national and internationalcollaborations, pool of expertise (key staff), infrastructure (laboratory andcomputer facilities) and so on.
Some general guidance can be given about what types of institutionscould be stakeholders in a centre. These can be listed as follows:
• Representatives of the focal sectors;
• Representatives of the government authorities that are involved inthe management of production and consumption patterns of thefocal sectors;
• Representatives of the financial institutions who are intimatelyconnected with the focal sectors, to influence the decisionsregarding investment in cleaner technologies;
• Representatives of institutions of higher learning and research thatcan work with the focal sectors to develop cleaner technologies;
• Representatives of those parts of civil society that are impacted bythe activities of the focal sectors (e.g., resource depletion anddegradation, health and safety related issues, etc.).
Each of these stakeholders is discussed further below.
R epres ent a t i ves o f t he fo ca l s ec t o rs
This is probably the most important class of stakeholders for a centre.
• They will help the centre to get to know and reach its “clients”.
• They will be a source of sector-specific technical and economicknowledge that will allow the centre to evolve more appropriatesector-specific cleaner production promotion strategies.
P A R T 3
54
• After adequate training, they can also be a source of sector-specificcleaner production experts, who in alliance with the centre can offercleaner production services to their members.
• Often, they are respected partners of governments - anotherimportant class of stakeholders in a centre - who use them not onlyto understand the needs of the sector, but also to transmit thegovernment’s policy decisions.
Industry or trade associations are a very common stakeholder, either asgeneral industrial associations that cover numerous industry sectors (e.g.,the General Confederation of the Enterprises of Morocco, in the case ofthe NCPC in Morocco), or that cover specific industrial sectors (e.g., theSugar Industry Association for the NCPC in Guatemala). Chambers ofCommerce have also been stakeholders in centres (e.g., the NationalChamber of Commerce for the NCPC in Costa Rica), as have BusinessFederations (e.g., the Confederation of Indian Industries for the NCPCin India).
R epres ent a t i ves o f g o vernment
Because cleaner production involves many public policy issues,government authorities should always be one of the importantstakeholders in a centre.
Government policies and actions (or inactions) can influence theproduction and consumption patterns of a multitude of institutions andprogrammes across sectors. For instance, subsidized prices for water orenergy will discourage the users of these resources from using themefficiently. By being involved with a centre, government authorities canbe made aware of where their policies are unfavourably distortingproduction and consumption patterns, and how they can take steps toeliminate such distortions. Conversely, by actively pursuing policies topromote cleaner production with the help of a centre, governmentauthorities can implement cleaner production oriented policies.
Note that, depending on the geographical coverage desired for the newcentre, the governmental authorities to involve can be at the national,regional or local level.
Since historically there have always been links between cleanerproduction and environmental protection (see Section 1.2 of Part 1 ofthis Manual), Ministries of Environment, Environmental ProtectionAgencies, Environmental Departments and so on, have generally beenone of the stakeholders in CPCs.
P A R T 3
55
Cleaner production has important links to industrial efficiency,innovation, productivity and competitiveness. Therefore, the Ministriesof Industry (or equivalents) are also often stakeholders in centres. Ifenergy efficiency (one element of cleaner production) is considered animportant part of a centre’s mandate, then Ministries of Energy - wherethey exist - could be stakeholders. The need to create an enablingframework for cleaner production-related investments suggests that theMinistries of Finance or Economy could be important stakeholders. Afocus on tourism could mean that the Ministry of Tourism should be astakeholder.
R epres ent a t i ves o f f i na nci a l i ns t it u t io ns
It is being increasingly recognized that financial institutions have animportant role to play in promoting cleaner production. Involvingfinancial institutions as stakeholders in a centre can help in establishing a“virtuous circle” between project financiers and project seekers. Theenterprises or institutions with a need to make investments in cleanerproduction-related projects could get connected to bankers who arelooking for low-risk high-return projects.
R epres ent a t i ves o f i ns t it u t io ns o f h i g herlea rn i ng a nd res ea rch
These institutions can have a stake in cleaner production at two levels:
• Cleaner production can often require basic or applied research toadapt existing technologies or develop new process technologies, orredesign products from the point of view of the environment (i.e.eco-design). Institutions that are involved in such research anddevelopment activity can be stakeholders in the activities undertakenby a centre.
• Institutions of higher learning in engineering, business, finance(universities, vocational training schools, and so on) have a role toplay in mainstreaming cleaner production, as they are involved ineducating the younger generations. If the education programmes atthese institutions provide an exposure to students on cleanerproduction concepts, tools and techniques, then it will be easier todevelop the required pool of cleaner production professionalsacross multiple sectors.
R epres ent a t i ves o f t he c i v i l s o c i e t y
Depending on the focus of the centre, NGOs can have a large stake incleaner production. Environmental NGOs are of particular importanceas they represent sections of civil society that are impacted by pollution
P A R T 3
56
or environmental degradation, and / or consequent health and / oreconomic damage. Their role in awareness creation and informationdissemination is particularly important. There are examples whereenvironmental NGOs have worked proactively with industry to catalyzecleaner production, rather than taking a confrontationist approach.
By this point, the Champion should have identified the most relevantgroup of stakeholders for the new centre. The Champion will then haveto conduct one-on-one meetings with the identified stakeholders, so thateach party can understand each others’ concerns, obtain answers to anydoubts and clarify their respective roles in the venture. These activitieswill be followed by a brainstorming session, which could requirerevisiting the Champion’s proposed conceptual plan for the centre, andwhich subsequently will translate the understanding of establishing thecentre into a concrete commitment.
After this step, the Champion and the stakeholders will have to continuethe process of developing the design and implementation plan of thenew centre and obtain the necessary funding towards its establishment.It could well be that the Champion will have to continue to play a leadrole; however the decisions from now on should follow a participatoryor consultative mode as a group.
3.2.3 Identifying Ongoing Cleaner ProductionActivities and Cleaner Production Resources in theCountry / RegionDuring the process of establishing a centre, it is important for thestakeholders to take stock of what cleaner production activities havealready been undertaken in the country / region, or are underway.
It could be that no cleaner production work has ever been undertaken inthe country / region. However, the experience of the CPCs indicatesthat this is rarely the case; often something (however modest) is alreadybeing done with regards to cleaner production, and persons may alreadyhave received some training on cleaner production concepts andmethods. It would be prudent for the stakeholders in a new centre toexplore the efforts already undertaken and the resources alreadyavailable.
The best time to take stock of cleaner production activities is during thephase of stakeholder identification, profiling and subsequent consultativeprocess. During this phase, the Champion should be spreading its netwide and holding discussions with as large a group as possible of
P A R T 3
57
potential stakeholders of the centre. Such discussions will often be thebest way of discovering what has already been done or is being done oncleaner production, and who might be the cleaner production resourcepersons that are already available.
It is important that the Champion and other stakeholders not use toonarrow a definition of cleaner production in this review or stock-takingexercise. There are many activities that may not have the title of “cleanerproduction”, but may actually have a very strong element of cleanerproduction (e.g., green productivity, eco-design and so on2). Similarlythere may be persons who do not list cleaner production as one of theirareas of expertise, but who do actually have considerable expertise that isrelevant to cleaner production.
3.2.4 Identifying Cleaner Production NeedsOnce the group of stakeholders in the new centre has been consolidated,and once all are in agreement about the geographical coverage andsectoral focus of the proposed centre, the stakeholders will need to takepart in a process that will help in moving ahead from the conceptual planto the design and implementation plan for the centre. It could be moreeffective that the Champion leads this process, assuming it is acceptableto the other stakeholders.
There are a number of possible different needs in cleaner production,namely, awareness raising, training, cleaner production assessments,demonstration projects, networking, matchmaking, knowledgemanagement, interfacing with financial institutions and policy advice. Infact, these needs would lead to the identification of services that thecentre could provide. Awareness raising, training, cleaner productionassessments and demonstration projects could be viewed as the “basic”services the centre may provide to its clients during the initial three tofive year period after its establishment. After this period, the centre maystart providing other “strategic” services, namely networking,matchmaking, knowledge management, interfacing with financialinstitutions and policy advice. We will learn more about all these servicesand how they can be provided in Parts 4 and 5 of this Manual.
2 Refer to Section 1.4.1 of Part 1 of this Manual for a complete list of “CleanerProduction and its Relation to other Similar-Sounding Concepts”.
P A R T 3
58
Note that a centre cannot address all the identified needs /services at the same time. It becomes important to assignpriorities to the identified services. A careful consideration is requiredto plan the timing and execution of the programmes / initiativesnecessary to attend to the identified services. Such prioritization andconsideration will tend to follow a phased approach. Indeed, it may alsofollow an iterative approach, depending on changing priorities andsituations within the focal sectors, economy, and so on. It isrecommended that the centre limit itself to providing certain services inthe initial thee to five years after its establishment. Thereafter, it shouldexpand its scope to providing the remaining identified services.
This thought process will aid the centre in identifying a niche for itself.This will form the subject of our next section.
3.2.5 Identifying the Niche for the CentreOnce the needs (services) in cleaner production, on the one hand, andthe cleaner production resources already available, on the other, havebeen identified, the Champion together with the other stakeholders canidentify the niche that the centre should occupy. Through a “Strengths,Weaknesses, Opportunities and Threats” (SWOT) analysis or somethingsimilar, stakeholders can work on the needs in cleaner production thatthey have identified. They can determine which of these needs arealready satisfied by existing institutions, and therefore which needs thecentre should focus on. It is very important that a new centre should notduplicate capacities and resources that already exist, particularly since inmany countries resources for new initiatives are scarce and must be usedwisely.
During such an analysis, particular attention should be given to thecleaner production activities, resources and capacities that thestakeholders have. The fact that they are stakeholders in cleanerproduction suggests that they could already be active in the cleanerproduction field. Since the stakeholders need to closely identify with thecentre for it to succeed, it is especially important that during this phase itis clear to all what roles the individual stakeholders could, and would, liketo play in cleaner production. Clarification of this will ensure that therole chosen for the centre will be complementary to and not incompetition with the stakeholders’ role. It is important that stakeholder-specific Memoranda of Understanding (MoU) be drawn up and finalizedat this point in time.
The logical conclusion of this is that the centre must create strongpartnerships with those stakeholders and other institutions that are active
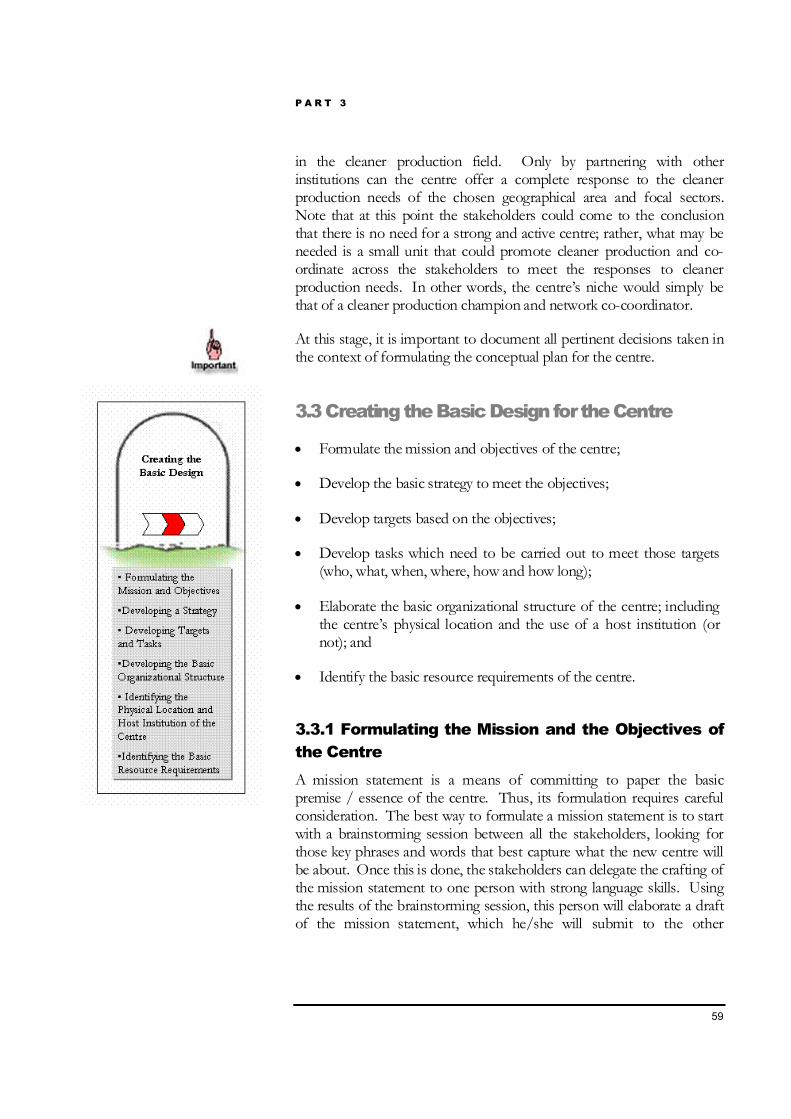
P A R T 3
59
in the cleaner production field. Only by partnering with otherinstitutions can the centre offer a complete response to the cleanerproduction needs of the chosen geographical area and focal sectors.Note that at this point the stakeholders could come to the conclusionthat there is no need for a strong and active centre; rather, what may beneeded is a small unit that could promote cleaner production and co-ordinate across the stakeholders to meet the responses to cleanerproduction needs. In other words, the centre’s niche would simply bethat of a cleaner production champion and network co-coordinator.
At this stage, it is important to document all pertinent decisions taken inthe context of formulating the conceptual plan for the centre.
3.3 Creating the Basic Design for the Centre
• Formulate the mission and objectives of the centre;
• Develop the basic strategy to meet the objectives;
• Develop targets based on the objectives;
• Develop tasks which need to be carried out to meet those targets(who, what, when, where, how and how long);
• Elaborate the basic organizational structure of the centre; includingthe centre’s physical location and the use of a host institution (ornot); and
• Identify the basic resource requirements of the centre.
3.3.1 Formulating the Mission and the Objectives ofthe CentreA mission statement is a means of committing to paper the basicpremise / essence of the centre. Thus, its formulation requires carefulconsideration. The best way to formulate a mission statement is to startwith a brainstorming session between all the stakeholders, looking forthose key phrases and words that best capture what the new centre willbe about. Once this is done, the stakeholders can delegate the crafting ofthe mission statement to one person with strong language skills. Usingthe results of the brainstorming session, this person will elaborate a draftof the mission statement, which he/she will submit to the other
P A R T 3
60
stakeholders for review and comments. Remember that the best missionstatements are short and concise.
The stakeholders should ensure that at least the following issues arecovered in the mission statement:
• The geographical focus that has been chosen for the centre;
• The focal sectors which it will serve; and
• The ultimate purpose of its activities (e.g., to reduce environmentalimpacts at the source; to render the economy more efficient, and soon).
The mission statement is basically a means to translate the centre’s visionor policy into action. Given below are a few examples of missionstatements of some centres.
Given here is the “Policy for Quality and Environment”, as formulatedby the Vietnam Cleaner Production Centre3.
Policy for Quality and Environment
The Vietnam Cleaner Production Centre is a knowledge-basedorganization delivering a wide range of high quality cleanerproduction solutions that gives added value to industry, consultingcompanies, research institutions, academia, and governmentalorganizations.
As a national focal point on cleaner production we are committed tocontinual improvement and prevention of pollution. We will complywith legislation and are committed to the International Declarationon Cleaner Production.
We will continuously strive to improve the quality of our solutionsand services and to improve the effectiveness of our IntegratedManagement System.
3 Vietnam Cleaner Production Centre: Introduction. Available at:www.un.org.vn/vncpc/introduction/index.html
P A R T 3
61
The mission of the Kaunas Centre4 in Lithuania is as follows:
Mission of the Kaunas Centre in Lithuania
To become the primary centre in Lithuania for providing industrialsectors with relevant research, technical assistance and training onvarious environmental subjects (e.g. EMS) and critical managementskills (e.g. problem solving and raising funds), all with the ultimategoal of introducing cleaner production techniques, preventingpollution, and achieving economic savings. These industry aimedservices will be supplemented by educational efforts for relatedgovernmental organizations, NGOs and academia.
The mission of the Hungarian Cleaner Production Centre5 is as follows:
The Hungarian Cleaner Production Centre serves as a centralcoordinating and catalytic clearinghouse determined to:
Contribute to sustainable industrial development in Hungary;
Improve the environmental performance and competitive advantage ofindustry by means of cleaner production;
Increase nation-wide awareness of cleaner production and sustainabledevelopment, and therefore;
Reach an overall reduction in environmental pollution.
Once the stakeholders have agreed on the mission statement for thecentre, they need to set its objectives. These may change over time,
4 Organization for Co-operation and Economic Development: Task Force for theImplementation of the Environmental Action Programmes for Central andEastern Europe (EAP) CCNM/ENVIRONMENTAL/EAP (99)25. “PollutionPrevention Centre at the Institute of Environmental Engineering, KaunasUniversity of Technology, Lithuania” in Cleaner Production Centres in Central andEastern Europe and the New Independent States.
5 Organization for Co-operation and Economic Development: Task Force for theImplementation of the Environmental Action Programmes for Central andEastern Europe (EAP) CCNM/ENVIRONMENTAL/EAP (99)25. “HungarianCleaner Production Centre” in Cleaner Production Centres in Central and Eastern Europeand the New Independent States.
P A R T 3
62
depending on changing situations (regulatory and policy changes,modifications in the clients’ needs, etc.). Little guidance can be given onwhat specific objectives a centre must have, because they will be verysituation-specific. However, some general guidance can be given:
• The objectives should derive from the mission statement. Theirpurpose is to turn its naturally abstract language into concrete aims,so that the centre can build a strategy around them.
• The objectives should be both short-term as well as long-term; i.e.the steps the centre must take at the present time to fulfill itsmission may not be what it may need to do in several years time,since the cleaner production needs that it is responding to canchange, as can the overall economic and environmental context ofthe country.
• The Champion and stakeholders need to go through the exercise ofupdating the objectives for the centre on a periodic basis in the lightof changing circumstances.
3.3.2 Developing a Strategy to Achieve theObjectives of the CentreOnce the initial objectives have been set, the Champion and stakeholderscan lay down the overall strategy that the centre will have to follow tomeet them. Again, this strategy will depend very much on the localconditions under which the centre is working. Decisions will need to bemade concerning the details for the provision of services and theirphasing to implement the strategy.
In general, the strategy should lay out in broad terms:
• The general set of services the centre will undertake; this will follownaturally from the decisions the stakeholders made about the nichethe centre will fill;
• The phasing of the centre’s services, i.e. the order in which it shouldprovide them, and the period of time allocated to their provision.For instance, where little (if any) cleaner production activities havealready been undertaken in the geographical area of interest, thestrategy should stress that for the first six months, the centre willfocus its activities on awareness-raising. Later on, this can be givenless importance as the other activities of the centre get underway;
P A R T 3
63
• The key clients or audiences that the centre should target for each ofthe services;
• The working partnerships the centre should pursue and formalize,and therefore the inputs the centre would require for its servicesfrom its partners;
• The resources (both personnel and non-personnel) that the centrewill require in order to provide its services in a manner in which itcan meet the objectives; and finally
• The programme the centre should pursue to cover the costs of theresources it needs.
It is important to realize that that there is an inherent relationshipbetween different services; e.g., one particular service may set inmotion the demand for other specific services. As mentioned earlierin Section 3.2.4, it becomes important to decide the phasing of theprovision of services. Fostering partnerships in this context alsobecomes important, whereby a centre may decide to allocate certainservices to partners in the future and move on to fulfilling its long-termobjectives (e.g. providing other downstream services, creating a widerbase for itself through networking, shaping government policy advice inrelevant areas, and so on). Planning strategically will ensure that thecentre remains lean, impacts a wider audience, and thus gets increasedoutcomes with minimized inputs.
The strategy should not concentrate on making short-term profits.While certain services may not earn much revenue (e.g. raisingawareness), they are extremely crucial from the point of view of layingthe foundation of cleaner production, and thus triggering other services.Similarly, the outcome of investments in education and research incleaner technologies may take time to materialize; however, suchstrategies will allow the centre to reap the desired long-term benefits.
P A R T 3
64
Below is an example of the strategies employed by the Kaunas Centre6.
The mission of the Kaunas Centre will be achieved by concentrating onthe following four strategic efforts:
Technical assistance (including waste minimization / cleaner productionopportunity assessments, research, laboratory services, etc.) in Lithuaniaand other CEEC / NIS;
Environmental management (including training, auditing, consulting inEMS and standards, certification);
Financial intermediary (including training in “Financial Engineering”,preparation of bankable cleaner production projects and loanapplications, project monitoring and supervision, project progressreports); and
Education (including courses on cleaner production and EMS forundergraduate and postgraduate students, coordination of Ph.D. studiesin environmental engineering.
3.3.3 Developing Targets and TasksOnce the strategy of the centre has been formulated, the stakeholderswill need to decide on the targets to be achieved and the tasks to beexecuted, in line with the objectives and, hence, the mission of thecentre.
The targets will entail the accomplishment of short-term and long-termobjectives of the centre. In this light, targets have a direct bearing on theresources the centre would need. Targets need to be “s-m-a-r-t”; i.e.Spec i f i c , Me as ura b l e , A t ta i nab le , R ea li s t i c and T ra c eab l e o ve rt ime . Setting targets is also an adaptive process; long-term targets mayneed to be reviewed and revised depending on the achievements of
6 Organization for Co-operation and Economic Development: Task Force for theImplementation of the Environmental Action Programmes for Central andEastern Europe (EAP) CCNM/ENVIRONMENTAL/EAP (99)25. “PollutionPrevention Centre at the Institute of Environmental Engineering, KaunasUniversity of Technology, Lithuania” in Cleaner Production Centres in Central andEastern Europe and the New Independent States.
P A R T 3
65
short-term targets and / or changing economic and environmentalsituations.
After deciding the targets for the centre, the stakeholders will have toallocate tasks needed to meet a particular target. The tasks will entailanswering the following questions - who, what, when, where, how andhow long. In this context, the stakeholders will be faced with thefollowing questions:
• H uma n r es ou rc e r e qui re me n ts fo r t he c en t re : The number ofpeople required, their skills, training needs (if any) and thepossibilities of the host institution / stakeholders providing thecentre with a part of its human resource requirements.
• Ba si c ( f i na nc i a l) re so u rc e r equi r em e nt s fo r th e c e n tr e : Seedfunds, securing the shortfall in seed funds (if any), revenue streamgenerated from the delivery of the centre’s services and thepossibilities of the host institution / stakeholders providing thecentre with a certain part of its amenities, which could help it lessenits capital and / or operating costs.
Both of the above aspects are discussed in detail in later sections of thispart of the Manual.
As in the case of targets, tasks also need to be executed over a period oftime. It is important that the tasks have quantified performanceindicators against which the centre’s progress can be measured(discussed to a greater extent in Part 6 of this Manual). In this way, itwill be easier to evaluate if the centre is succeeding, in terms of achievingits targets.
Let us now address the topic of human resource requirements at thecentre, or more specifically, the basic organizational structure of thecentre.
3.3.4 Developing the Basic Organizational Structureof the CentreThere are two important points that stakeholders should keep in mindwhile devising the basic organizational structure of the centre:
• Efficiency and effectiveness requires that a relatively independentcentre be established, where its Director is put in the position wherehe / she can autonomously take decisions for the operation of thecentre in the best manner possible;
P A R T 3
66
• Establishing a centre should be a partnership process; i.e. the keystakeholders should be strongly involved in its establishment, andthey are expected to be active partners of the centre. Thisunderscores the need to have a mechanism through which thestakeholders can provide inputs about the performance of thecentre.
This suggests that the basic organizational structure of a centre shouldhave the centre itself, which implements the strategy that has beendecided on, and a body or bodies (Steering Committee, Executive Boardand Advisory Committee) to which it reports and which has / have basicoversight functions over the centre.
As far as the centre itself is concerned, experience suggests to have assimple and as small a structure as possible, to keep resourcerequirements and overheads low. The centre should be run by aDirector, who in turn should have reporting directly to him / her a smallnumber of professionals and some administrative support staff. TheDirector can then apportion between the professional staff the varioustasks to be undertaken by the centre to implement the tasks, keeping forhimself / herself the promotional, strategic and management functions.
Figure 3.2 provides a generic organizational structure for a centre,where the Director of the centre reports to an Executive Board andwhere an Advisory Committee7 provides strategic advice to theExecutive Board and the Director. The core staff reporting to theDirector is responsible for the delivery and marketing of services. Otherstaff within the centre is responsible for matters pertaining toadministration and other routine back-office functions. The centre is alsosupported by counterpart institutions and local or internationalconsultants, who may be required to provide the necessary expertise incertain aspects of cleaner production and / or assist the centre in thedelivery of services.
7 In this Manual, the terms “Executive Board” and “Advisory Committee” areused to cover bodies with executive and advisory responsibilities, respectively.Other terms, such as “Steering Committee” or “Board of Directors”, may also beused.
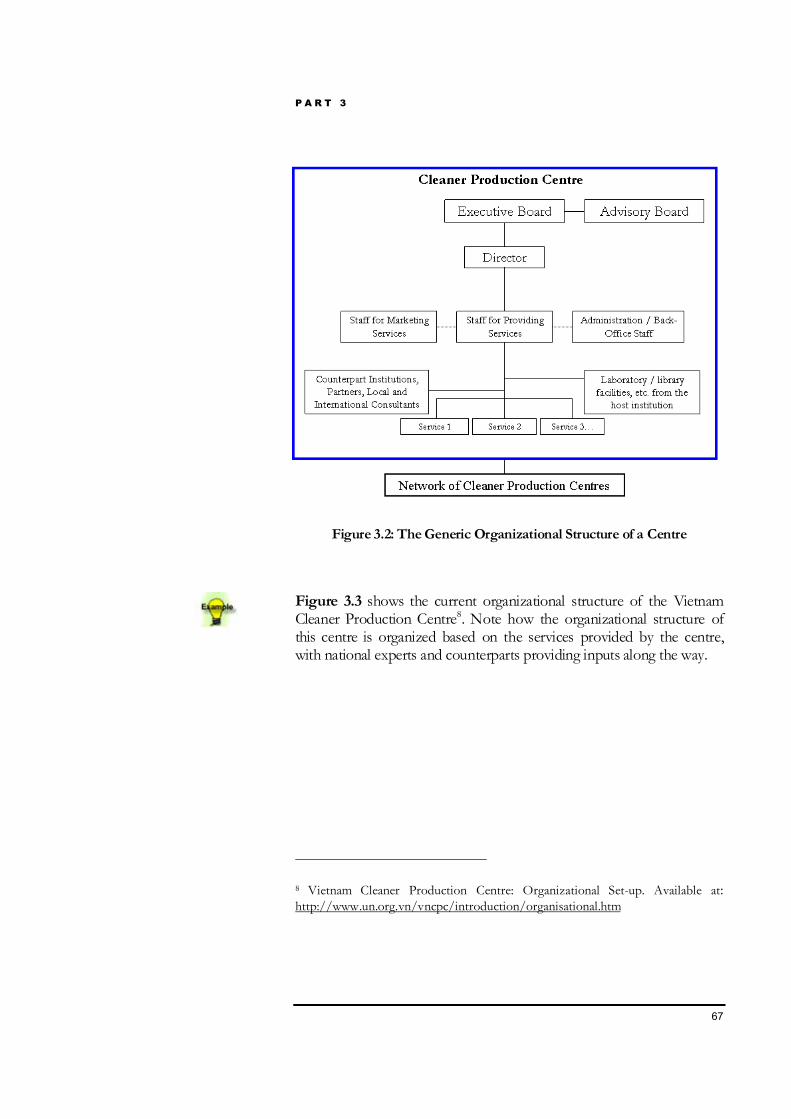
P A R T 3
67
Figure 3.2: The Generic Organizational Structure of a Centre
Figure 3.3 shows the current organizational structure of the VietnamCleaner Production Centre8. Note how the organizational structure ofthis centre is organized based on the services provided by the centre,with national experts and counterparts providing inputs along the way.
8 Vietnam Cleaner Production Centre: Organizational Set-up. Available at:http://www.un.org.vn/vncpc/introduction/organisational.htm
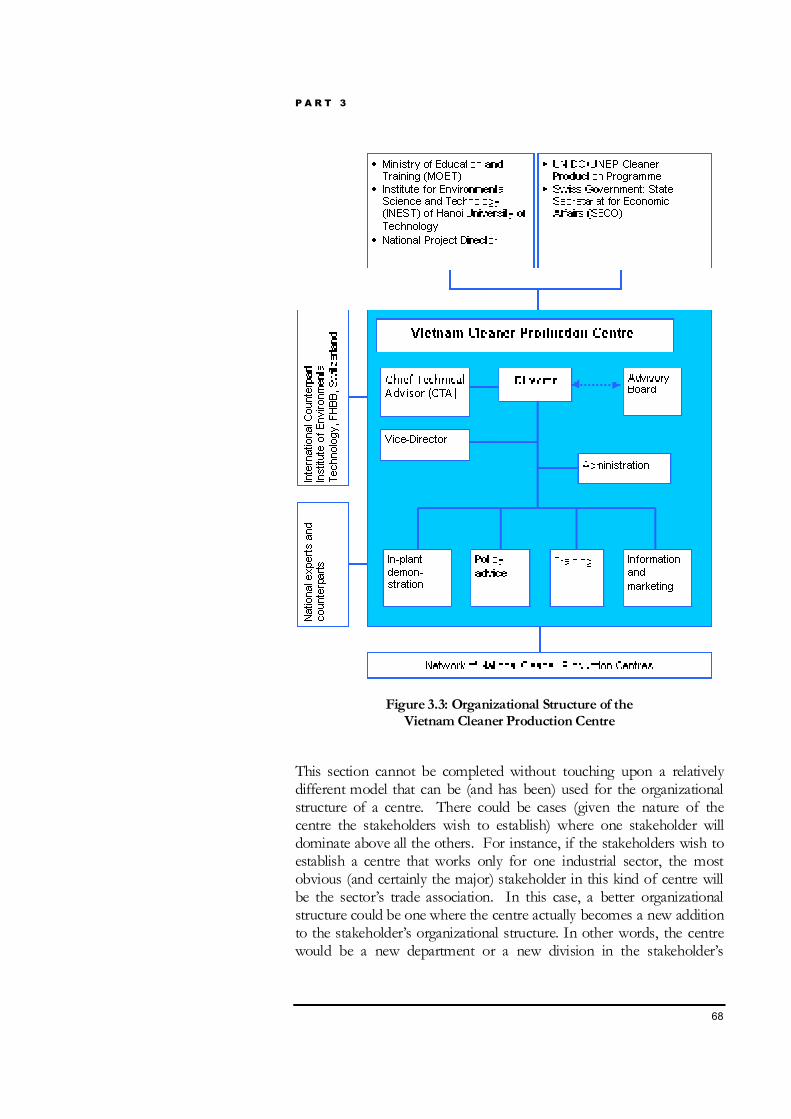
P A R T 3
68
Figure 3.3: Organizational Structure of theVietnam Cleaner Production Centre
This section cannot be completed without touching upon a relativelydifferent model that can be (and has been) used for the organizationalstructure of a centre. There could be cases (given the nature of thecentre the stakeholders wish to establish) where one stakeholder willdominate above all the others. For instance, if the stakeholders wish toestablish a centre that works only for one industrial sector, the mostobvious (and certainly the major) stakeholder in this kind of centre willbe the sector’s trade association. In this case, a better organizationalstructure could be one where the centre actually becomes a new additionto the stakeholder’s organizational structure. In other words, the centrewould be a new department or a new division in the stakeholder’s
P A R T 3
69
organization (refer also to Section 3.3.5 of this Manaul). The executiveoversight body of the stakeholder then becomes the oversight body ofthe centre. There could still be an Advisory Committee made up of otherstakeholders with a lesser direct interest in the centre.
O vers i g ht bo di es : A dv i s o ry Co mmi t t ees a ndExecut i ve Bo a rds
As for the oversight body / bodies, there are several issues that need tobe thought about - membership, size, and responsibilities.
In principle, all the centre’s stakeholders could be members of theoversight body or bodies. In cases where relatively few stakeholdershave been identified, it is best to have them all members of one oversightbody. The basic responsibilities of this oversight body would be:
• Setting the objectives for the centre;
• Setting the strategic direction of the centre;
• Hiring the Director and the staff;
• Approving the work programmes submitted to it by the Director;
• Approving the budgets and financial statements submitted to it bythe Director; and
• Monitoring the progress of the centre and its success in meeting itsobjectives in terms of accomplishment of targets.
Generally, an oversight body of this nature can function effectively if itsmembership is limited to five.
In this context, the NCPC in El Salvador has an important insight toshare with us - “ We h a ve 24 me mb e rs o n ou r Ad vi so ry Boa r d .T r yi ng to g e t c on s en s u s i s imp o s s i b l e ! Ou r Bo a rd o fDi r ec to r s , r ep r es e nt i n g th e p ri va te s ec to r , uni ve r s i ty a ndgo v e r nm e nt , wo rk s be t t e r ."
If there are more than five stakeholders, a better alternative is to havetwo bodies, one with executive functions (termed in this Manual as“Executive Board”) and one with advisory functions (termed in thisManual as “Advisory Committee”). In this case, the Executive Boardcan remain small, while the Advisory Committee can more easily have alarger membership. The Executive Board would be responsible for allthe oversight functions listed above, except providing guidance
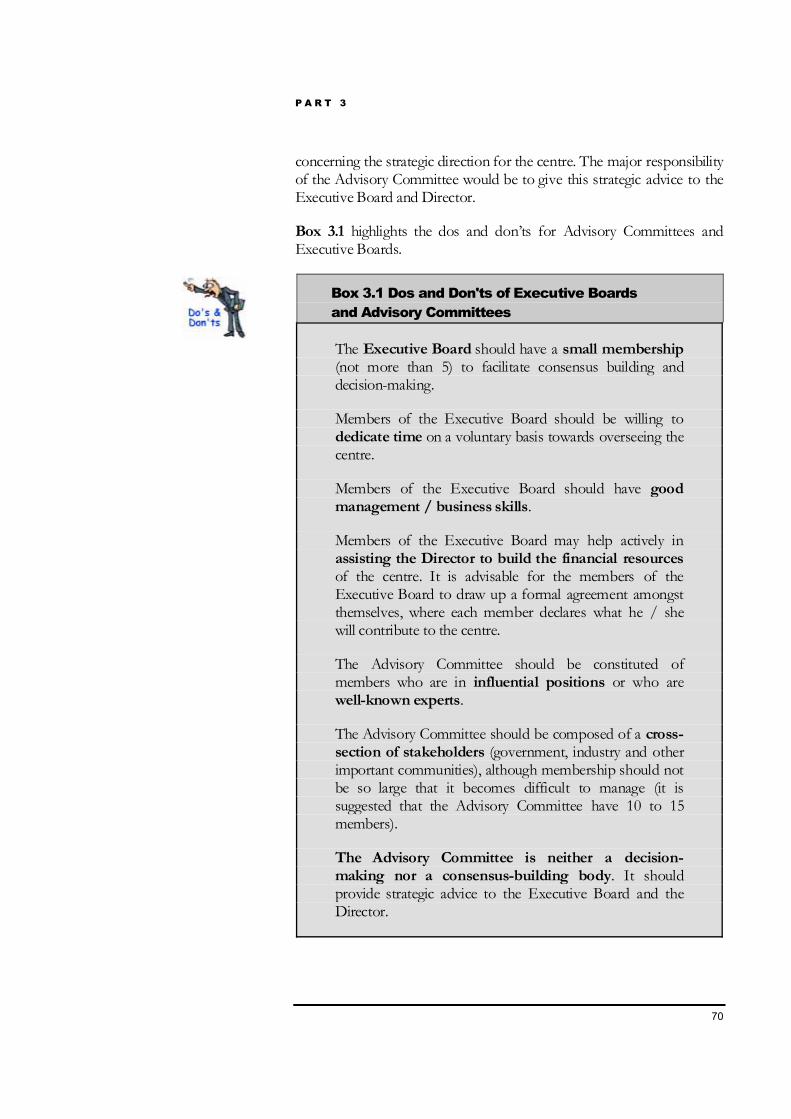
P A R T 3
70
concerning the strategic direction for the centre. The major responsibilityof the Advisory Committee would be to give this strategic advice to theExecutive Board and Director.
Box 3.1 highlights the dos and don’ts for Advisory Committees andExecutive Boards.
Box 3.1 Dos and Don'ts of Executive Boardsand Advisory Committees
The Executive Board should have a small membership(not more than 5) to facilitate consensus building anddecision-making.
Members of the Executive Board should be willing todedicate time on a voluntary basis towards overseeing thecentre.
Members of the Executive Board should have goodmanagement / business skills.
Members of the Executive Board may help actively inassisting the Director to build the financial resourcesof the centre. It is advisable for the members of theExecutive Board to draw up a formal agreement amongstthemselves, where each member declares what he / shewill contribute to the centre.
The Advisory Committee should be constituted ofmembers who are in influential positions or who arewell-known experts.
The Advisory Committee should be composed of a cross-section of stakeholders (government, industry and otherimportant communities), although membership should notbe so large that it becomes difficult to manage (it issuggested that the Advisory Committee have 10 to 15members).
The Advisory Committee is neither a decision-making nor a consensus-building body. It shouldprovide strategic advice to the Executive Board and theDirector.
P A R T 3
71
All members should have a genuine interest in thesuccess of the centre. Members who are likely to haveconflicting priorities and/or individual interests that are notcompatible with the collective interest of the centre shouldbe avoided.
While this sharing of responsibilities between two bodies is a practicalsolution from a managerial point of view, it can be diplomatically delicateto implement. All stakeholders will want to be on the Executive Board,since it appears to be more important of the two bodies. This potentiallyembarrassing situation can be resolved by making membership of theExecutive Board conditional on its members making a financialcontribution (in cash or in kind) to the centre. Often, it will only be asmall number of stakeholders that can, or are willing to, make such acontribution. This approach has the additional advantage of making thefunction of the Executive Board more important, since each membernow has some financial ownership in the centre.
Given below are a few examples of Advisory Committees /Executive Boards of some centres.
Like most centres, the NCPC of India has an Advisory Committee,which consists of a broad range of influential members including:
• Ministry of Industry (Joint Secretary);
• Ministry of Environment (Senior Advisor);
• UNIDO (Country Director);
• Central Pollution Control Board (Chairman);
• Confederation of Indian Industries (Head - EnvironmentalManagement Division);
• National Productivity Council – the host institution (DirectorGeneral)
The India NCPC no Executive Board, because this is an example of acentre that is to all intents and purposes an integral part of the hostinstitution’s organizational structure.
P A R T 3
72
The Centre in Guatemala has an Executive Board and an AdvisoryCommittee. Its Executive Board consists of:
• Cámara de Industria de Guatemala (National Chamber of Industryand the host institution),
• Presidencia de la Républica (the Office of the President ofGuatemala),
• Universidad del Valle (University),
• Federación de Pequeña y Mediana Empresa (FEPYME orFederation of Small and Medium Enterprises),
• Swiss Government (for the term of funding),
• UNIDO / UNEP (for the term of funding).
To ensure good co-operation of the NCPC in Guatemala with small-and medium-sized enterprises, academic and governmental sectors,the Advisory Committee includes the following members:
• Universidad de San Carlos (University),
• Comisión Nacional de Medio Ambiente (CONAMA) (NationalCommission on the Environment),
• Consejo Nacional de Ciencia y Tecnología (CONCYT or NationalCouncil of Science and Technology),
• Comisión Centroamericana de Ambientey Desarrollo (CCAD orCentral American Commission of Environment and Development).The co-operation of the NCPC with the CCAD is especiallyimportant to support the harmonization of national legislationwithin the region. The following institutions also co-operate closelywith the NCPC: SYME (Programa Nacional para Fomento de laMicro y Pequeña Empresa or National Program for theDevelopment of Small and Microentreprises) and SEGEPLAN(Ministerio de Planificación or Ministry of Planning).
T he co re s t a f f o f a cent re
The core staff of the centre should consist of the followingpersonnel:
P A R T 3
73
D i rect o r
Re spo n si b i l i t i e s - Planning, management / administration,representing the centre, providing guidance and support to otherstaff, liaising with stakeholders, developing networks and marketingthe services of the centre (mainly interfacing with financialinstitutions, and providing policy advice).
Q ua li f i c a t i o n s - Tec hnical or business ba ckg round.Managerial qualities. Excellent communicator, rapport-buildingcapabilities, contacts with stakeholders, team builder.
T echni ca l s t a f f
Re spo n si b i l i t i e s - Delivering the centre’s services (awarenessraising, training, cleaner production assessments, demonstrationsprojects, knowledge management, networking, matchmaking andweb-enabled services), preparing manuals, reports and otherinformation materials.
Possible future needs could include additional technical personnel,an economist, an information management specialist, industry sectorspecialists, specialists in allied subjects (e.g., environmentalmanagement systems, energy efficiency, health and safety, and soon), and a policy analyst.
Q ua li f i c a t i o n s - Technical capabilities, training and communicationcapabilities, ability to work with industries, team working ability.
Suppo r t s t a f f ( Secre t a ry)
Re spo n si b i l i t i e s - Providing all support facilities, officemaintenance, programme organization, accounts, etc.
Q ua li f i c a t i o n s - Secretarial qualities, computer skills, knowledge ofaccounts, office organization and maintenance.
Subsequently, depending upon the need and demand, more staff maybe added or contracted on a regular or as-needed basis.
Given below is an example of the core staff employed by the Centrein China.
• 1 Director, responsible for overall programme direction;
“Select a highlycommitted staff thatreally understandswhat cleanerproduction means andwhat it stands for.The deputies should begood technicians, butthe Director should bean entrepreneur.”
- Brazil Centre
P A R T 3
74
• 1 Deputy Director, for assisting overall programme direction andconducting implementation of projects;
• 1 Division Chief of cleaner production, for conducting cleanerproduction projects;
• 4 Technical staff of cleaner production division, for assistingconducting cleaner production projects;
• 1 Division Chief of environmental management system (EMS), forstudying the relationship between cleaner production and EMS andconducting projects concerning ISO 14000;
• 3 Technical staff of EMS Division, for assisting the chief to conductEMS projects;
• 1 Division Chief of public-relations and information exchange, foroperating the China National Cleaner Production network andother daily tasks;
• 1 staff of public-relations and information exchange, for assistingthe chief to deal with day-to-day tasks and translation tasks; and
• Support / secretarial staff.
Co unt erpa r t i ns t i t ut i o n
A centre in developing countries and countries with economies intransition does not have, nor is it expected to have available to it in thecountry all the necessary expertise and skills to perform its task,especially during the initial stages of its establishment. Therefore, in theirprogramme UNIDO and UNEP have always provided professionalsupport to new centres in the form of twinning arrangements with anexperienced counterpart institution. This institution is responsible fortraining and developing the centre’s staff to undertake the tasks ofcleaner production promotion and implementation. As the specificneeds vary from centre to centre, UNIDO has found it important toensure that this support be tailor-made to fit the individual requirementsof the centre. Furthermore, as the responsibilities and functions of thecentre evolve, UNIDO has ensured that the nature of the supportneeded also changes.
Areas in which centres may require support for building expertiseinclude design and implementation of demonstration projects, systemsand techniques for information acquisition, preparation of cleanerproduction financing proposals, preparation of manuals and reports,
P A R T 3
75
project proposal preparation for local, national and / or internationalsources of funding, sectoral expertise and policy expertise. Apart fromtheir experience and knowledge, counterpart institutions can also sharecertain facilities with the centre; i.e. laboratories, sampling /testingequipment, library access to pertinent journals and publications, etc.
On the basis of the experience gained in the UNIDO/UNEP NCPCprogramme, stakeholders in a new CPC can consider several alternativestrategies to provide their new centre such professional support.
• The simplest is to link centres to a counterpart institution withexperience in cleaner production. From its home base, thecounterpart institution supports the development of expertise in thecentre through short-term missions to the centre, and responds torequests from the centre for information (e.g., on suppliers ofcleaner technologies) from its home base. This was the strategy ofchoice in the first generation of NCPCs established by UNIDO.
• A variant on this base strategy is to station a senior professionalfrom the counterpart institution at the centre for the first few years.Having one of its staff in place can greatly help the counterpartinstitution understand the centre’s support needs and assess theevolution in those needs. This has been the approach adopted forthe NCPC in Vietnam. Note that this approach can be considerablymore costly than the base strategy.
• Another variant on the base strategy that has evolved as more andmore CPCs mature involves transferring the experience andexpertise gained by mature centres to new centres. In other words,mature centres can act as counterpart institutions themselves. TheNCPCs in Brazil, the Czech Republic, India, Mexico, and Slovakia,for example, have started to offer their services to new NCPCs. Itis also the strategy of choice when regional or local CPCs are beingestablished in a country where a national CPC already exists.
• Yet another variant is to link a new CPC with several counterpartinstitutions, to better meet its different support needs. Either thesupport institutions can act independently from each other in theirrelations with the centre, or they can join together in some form ofconsortium so that their individual actions can be coordinated. Forexample, the former was the approach used by the NCPC in India,while the latter is being used by the NCPC in Morocco.
Box 3.2 highlights the dos and don’ts for counterpart institutions.
It is important thatthe relationshipbetween counterpartinstitutions andcentres be clearlydefined andtransparent on bothsides…
“We sometimes feltthat the counterpartinstitution wasfurthering its ownprofessional interestsrather than ours. Attimes, it seemedreluctant to help usspecify needs that itcould not meet itself.”
- Tanzania Centre
P A R T 3
76
Box 3.2 Dos and Don’ts for CounterpartInstitutions
The counterpart institution should first build thecentre’s skills and expertise in cleaner productionassessment and training, as these are basic building blocks.
The need for counterpart expertise evolves as a centrematures. A certain amount of flexibility is desirable toenable the centre to obtain the needed expertise whenrequired.
The centre should be fully aware of the range of expertiseand skills that counterpart institutions have and thecounterpart institutions should be willing to share alltheir expertise.
The counterpart institution should be genuinelyinterested in identifying the professional needs of thecentre and providing the appropriate expertise required. Itshould not be motivated simply by a desire to further itsown interests.
The counterpart institution should be able and willing tosource from outside its own institution a particularexpertise the centre wants but it does not have.
3.3.5 Identifying the Physical Location and the HostInstitution of the CentreMuch thought has been given to where best to locate a centre. Two basicmodels have been proposed for this. One is to locate the centre in thepremises of one of the stakeholders, which becomes its host institution.This approach has two major advantages:
• Initially, when the centre is unknown, it can easily “piggy-back” onits host institution, which can introduce it to its potential clients (thebasic assumption being that the host institution is well known to,and well respected by the centre’s client base – see below). In thisway, the centre can get itself known more rapidly, and therefore canbecome operational in a shorter time.
P A R T 3
77
• This approach reduces the demand on funds that the centre musthave at the beginning of its life to pay for rent and utilities.
This model has always been chosen for the UNIDO/UNEP NCPCs.Since they have focused primarily on manufacturing industry, they havebeen located in industry support institutions such as industrial tradeassociations, chambers of commerce, productivity councils, technicaluniversities, etc.
The disadvantage of this approach is that the host institution may cometo feel a strong and exclusive sense of ownership towards the centre, as itfeels it has made a significant in-kind contribution to the latter’s finances.This then creates tensions with the other stakeholders, who feelexcluded. It can also create managerial problems, with the hostinstitution beginning to “micro-manage” the centre. This can bemitigated by bringing together other stakeholders as members of anExecutive Board (discussed in a later section of this Manual), where theymake decisions collectively about the centre, thus rightly perceivingthemselves as a part of the centre.
The other model is to have the centre located in rented commercialspace like a business centre. This assures that the centre is relativelyindependent of all its stakeholders, but it also means that a certainamount of funds must be available at the time of the centre'sestablishment to pay for its rent and utilities. It would also mean that thecentre would have a less easy task in promoting itself with its potentialclient base. However, this situation could be mitigated by the Directorstarting his / her career in the centre by undertaking aggressivepromotional campaigns.
Neither of these two models is “better” than the other. It is clear thatboth have their advantages and disadvantages. Note also that thestakeholders can adopt a hybrid of these two models, which has beenadopted successfully by a number of NCPCs and other CPCs. Here, thecentre starts by being hosted by one of its stakeholders, and then a fewyears later, when it is generating sufficient funds, it can move into rentedcommercial space and take on more of an independent operation.
In those cases where the stakeholders decide to use a host institution,UNIDO’s experience shows what the typical profile of such a hostinstitution might be. Centres should be hosted by well-establishedinstitutions, which will commit to providing office space, utilities andlogistical support (communications, supplies, etc.), support staff and afacilitated access to industry, government and other stakeholders. Thehost institution may be a government-run organization (although it
P A R T 3
78
should not have any enforcement powers), an industry association, anacademic or technical institution, a nongovernmental organization or anon-profit association. What works best depends upon a country’sculture and socio-economic context.
If the stakeholders opt for using a host institution, the selection needs tobe done with great care. Having a strong supportive host institution cangreatly enhance the success of a centre. And getting it wrong meanshaving to start all over again!
It should be mentioned that host institutions have not always been ableto meet their promised commitments to CPCs. This has led to situationsin which a centre becomes under-staffed or alternative funding has to befound. As a result, the UNIDO/UNEP Programme now requires itsNCPCs to develop business plans to enable them to plan activitiesaround basic business principles and to update them according to localrealities and financial possibilities.
Box 3.3 highlights the dos and don'ts of a host institution.
Box 3.3 Dos and Don'ts of a Host Institution
The host institution must have a stake in promotingcleaner production. Cleaner production should fit intothe mainstream business of the host institution. Thehost institution should have the confidence and trust ofindustry, the centre’s primary target for cleanerproduction. Otherwise, receptivity to cleaner productionand sharing of information may be compromised.
The host institution should preferably have someexperience in running capacitybuilding / development projects and be patient andsupportive during the centre’s infancy period.
The long-term stability of the host institution should beexamined in order to avoid having to change hostinstitutions before the centre has become self-sufficient.
The host institution should be willing and able to providetimely, logistical support to the centre to enable it tostart functioning and deliver output as soon as possible.It should participate in the selection of a Director toensure a certain degree of compatibility.
P A R T 3
79
The host institution should not be an institution havingresponsibilities for ensuring compliance withenvironmental (or other) laws and regulations. Beinghosted by such an institution will tend to keep clientsaway from the centre, for fear that any legal or regulatoryproblems they have will become known to thecompliance authorities. Instead, the host institutionshould have strong links to the sector(s) that havebeen identified as the focus of the centre.
3.3.6 Identifying the Basic Resource Requirementsof the CentreAt this point, the stakeholders are in the position of being able todetermine what the basic resource requirements of the new centre willbe. The stakeholders can cost all these requirements on the basis of thelocal market conditions.
The costs will be essentially broken up into either capital costs oroperating costs.
Capital costs could include office space, furniture, books, specializedperiodicals, software, on-line cleaner production databases,equipment, office equipment (fax machines, phones, computers,photocopying machines, etc.), training equipment (overheadprojectors, etc.), monitoring equipment (pH meters, volumetric flowmeters, sampling equipment, other laboratory analysis equipment,etc.), vehicles for travel, and so on.
However, it may be prudent to keep capital costs as low as possible.The centre should look for opportunities to offload certain capitalcosts as operating costs. For example, host institutions could providethe centre access to laboratory equipment and laboratory analyticalfacilities. Thus, the centre need not invest large sums of capitalunduly and may pay the host institution a fee for using such facilities,which would thus be absorbed as operating costs. Similarly, vehiclesfor travel may also form part of the centre’s operating costs.
The main operating cost will be the salaries of centre staff, reflectingthe fact that a centre’s main resource requirement will be person-power. If the centre can be designed to work within a strongnetwork of other institutions working on cleaner production, theperson-power resources can be quite modest. On the other hand, if
P A R T 3
80
the stakeholders decide on a centre design such that the centre worksalone, the person-power needs could be significantly higher. Manycentres work with no more than 5 professional staff and 2administrative support staff even at full operating capacity. If thecentre is designed to be part of a network, it will require access to theperson-power of its partners. The centre will require access tonational or international consultants (from within counterpartinstitutions or outside them) for specialized services that neither itnor its partners can supply, and also for capacity building within thecentre.
Other items under operating costs would include office utilities(lighting, heating, air-conditioning), office stationary, vehicles fortravel, charges for using laboratory facilities of the host institution,charges for using the host institution’s facilities for conductingawareness raising and training functions (as part of the centre’sservices), charges for using space for conducting seminars /awareness / training sessions, costs associated with travelling on thefield, costs of technical documentation, costs for printingpromotional brochures, training materials etc., costs forestablishment and upkeep of the centre’s website, and so on.
It is recommended that the stakeholders minimize a centre’s rentalrequirements and utility costs in the initial three to five years after itsestablishment by giving it (as an in-kind contribution) the necessaryoffice space and utilities. Once it becomes financially self-sufficient,it may explore the options of renting or even owning its own offices.It may even consider opening local branches in different parts of thecountry / region.
At this stage, it is important to document all pertinent decisions taken inthe context of creating the basic design for the centre.

P A R T 3
81
3.4 Meeting the Financial Needs of the Centre
At this point, the stakeholders will have formulated a detailed design ofhow the centre will function, and how much funding will be required. Itis now time to consider the issue of how to secure this funding. This isan issue that the stakeholders should devote considerable attention to. Itmakes little sense to go to all the trouble and expense of establishing acentre only to see it collapse a short time later because the necessaryfunding was not secured properly.
The centre should eventually be able to sustain itself financially, byproviding services to its clients. However, there will be a time at thebeginning of the centre’s life (the first three to five years), when it cannotsupport itself completely, as it has not established its client base yet andis not fully geared to deliver the necessary range of services to its clients.
The challenge of securing funds therefore becomes two-fold. The first isto secure sufficient seed funds to sustain the centre over the first three tofive years, during which time it has to establish its place in the market.The second is to assure the sustainability of the centre from a businesspoint of view; i.e. ensure that the market for the centre’s services is largeenough, and its fee structure is set properly, so that it can generateenough income to cover its operating and capital costs. Income will begenerated through revenue earned from the basic services delivered bythe centre. The stakeholders will need to make initial projections of thisrevenue generation, as it will help meet some of the financialrequirements of the centre.
The challenge of securing seed funds is discussed below. The challengeof securing funds for the long-term sustainability of the centre will bediscussed in Parts 4 and 5 of this Manual.
3.4.1 Securing Seed Funds for the CentreSecur i ng Co nt r i but i o ns f ro m t he S t a k eho lders
Here, the stakeholders have to determine the contributions they canmake during the centre’s initial phase. These contributions can be eitherin cash or in kind. Monetary contributions would be preferred as they areeasier to manage, but the reality is that most stakeholders will only beable to make in-kind contributions. As a guide, examples are given belowof in-kind contributions that stakeholders have made to different centresaround the world:
P A R T 3
82
• Stakeholders can loan the centre members of their staff to workfull-time or part-time for a few years. In this case, the stakeholderswill continue to pay the salaries and social contributions of theloaned personnel. These persons act in effect as consultants for thecentre, but the fees the centre can charge its clients for the servicesrendered by these persons remain with the centre to build up itsreserves. Stakeholders involved in such a contribution can come toan understanding with the Director, that after a few years thesepersons may either become full-fledged staff members of the centreand the centre takes over paying them their salary, or they go backto their original institution but may be hired back as short-termconsultants by the centre on an as-needed basis.
Note that deployment of part-time or seconded staff has its ownproblems. There is a lack of commitment from the personnel as theydo not see a career with the centre. There can also be a lack ofstability if the seconded staff is rotated. Finally, the secondingorganizations may not be willing to send the best personnel, andoften the seconded persons are those whom the organization wantsto get rid of.
• Stakeholders can assist the centre in its promotion activities. Forinstance, an industrial association can spend time and some costs(e.g., free advertising space in association magazines) to introducethe centre to its members. Stakeholders can also give the centreslots to promote its services in conferences or seminars they areorganizing.
• As already mentioned earlier, it is very common for stakeholders tooffer a centre the office space it needs for free, together with therelevant office furniture, furnishings and stationary (and more rarelyequipment such as computers, photocopiers, fax machines, etc.).Later on, the centre can start paying rent for these facilities or moveout and rent commercial space elsewhere.
• Where stakeholders offer free office space, they also often offer thecentre free access to training rooms or conference rooms where thecentre can put on cleaner production training courses andawareness-raising seminars.
• Where stakeholders offer free office space, they also often givelighting and heating/air conditioning for free. More rarely, they maycover the centre’s telecommunication bills.
“Our host institution,the Chinese ResearchAcademy ofEnvironmentalSciences (CRAES),provided the necessarylogistical support,including office space,supplies andfavourablemanagement fees,during the start-upphase. When you givea lot of early supportto the centre, it canbecome profitableearlier.”
- China Centre
P A R T 3
83
• If the stakeholders also have a pool of vehicles, they can offer thecentre free use of the vehicles to visit clients.
• Stakeholders having laboratory analytical facilities can offer toundertake for free analyses that the centre needs done on its clients’waste streams.
Centres must have autonomous control over at least part of the fundsinitially used to establish them. For instance, a “discretionary budget”could be provided with a certain degree of flexibility and authority (e.g.,choosing national consultants, etc.) to enable the Director to take certaindecisions without having to wait for higher approval.
3.4.2 Identifying Potential Sources to Meet theShortfall in Seed FundsIn the ideal case, the stakeholders together can make sufficientcontributions of seed funds in cash or in kind to cover the needs of thecentre for the first few years when it is establishing itself. However, iftheir contributions are not enough, then the shortfall must be covered byother sources. As a benchmark, experience with the UNIDO / UNEPNCPC Programme shows that an NCPC usually requires US$150,000 toUS$200,000 a year of external funding (i.e. over and above the type ofin-kind contributions from stakeholders cited above). Of this, US$50,000to US$70,000 a year is spent on counterpart institutions, internationalconsultants and other external resources.
For the sake of efficiency, the stakeholders should delegate to theChampion the task of securing the remaining seed funds. TheChampion must then do two things:
• It must identify potential sources for these funds; and
• It must prepare, submit and promote a formal request for the funds.
Normally, the Champion will have two primary sources of funding totap into - national funds (primarily from the government), andinternational funds.
If the national, regional or local government is a potential fundingsource, there is a good chance that it will already be a stakeholder in thecentre. Thus, its capability to cover the needs for seed funds will havebeen explored already. However, it is possible that governmentauthorities, which are not stakeholders, have certain funds that could betapped into. For instance, the World Bank and other regional
P A R T 3
84
Development Banks give countries technical and financial assistance forspecific purposes. In such a case, the Champion could attempt to tapinto these funds.
The alternative is for the Champion to try and secure the necessaryfunds from international donors. These are many and varied, and can bebroadly classified as either bilateral funds or multilateral funds. Anumber of donor countries have given bilateral funds for establishingCPCs. It will be worthwhile for the Champion to identify the donorcountries having active bilateral programmes in the country, and thenapproach the representatives of these countries to explore with them ifthe establishment of a CPC would fit into any of their priority areas.
With respect to multilateral funding, the most important playerworldwide for funding NCPCs is UNIDO, although UNDP has alsooccasionally funded NCPCs. The Champion needs to approach theUNIDO country representative (if there is one), or otherwisecommunicate directly with the UNIDO Headquarters in Vienna.Similarly for UNDP, the stakeholder needs to approach the UNDPcountry representative.
At this stage, it is important to document all pertinent decisions taken inthe context of meeting the financial needs of the centre.
3.4.3 Preparing and Submitting a Formal Request forFundsOnce a promising source of funding has been identified, the Championneeds to prepare a formal request for funds. Each funding sourcenormally has its own specific format for preparing funding requests, butin most cases they will follow the general format shown below:
• Outline the conceptual plan that is responsible for the genesis andoperation of the centre;
• Outline the basic design for the centre; i.e. the mission, objectives,strategy, targets and tasks, along with the organizational structureand the basic resource requirements;
• Outline the identified financial needs of the centre, along with theearmarked seed funding;
• Outline the initial projections made for revenue generated as a resultof delivering basic services;
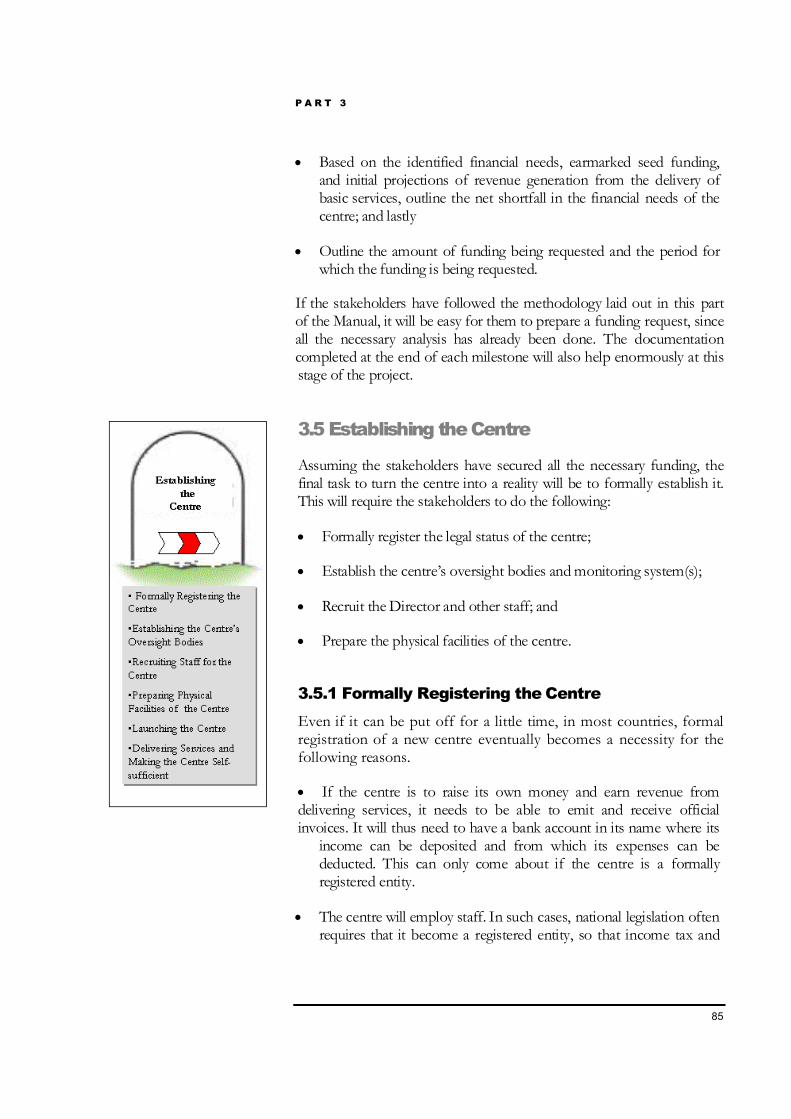
P A R T 3
85
• Based on the identified financial needs, earmarked seed funding,and initial projections of revenue generation from the delivery ofbasic services, outline the net shortfall in the financial needs of thecentre; and lastly
• Outline the amount of funding being requested and the period forwhich the funding is being requested.
If the stakeholders have followed the methodology laid out in this partof the Manual, it will be easy for them to prepare a funding request, sinceall the necessary analysis has already been done. The documentationcompleted at the end of each milestone will also help enormously at thisstage of the project.
3.5 Establishing the Centre
Assuming the stakeholders have secured all the necessary funding, thefinal task to turn the centre into a reality will be to formally establish it.This will require the stakeholders to do the following:
• Formally register the legal status of the centre;
• Establish the centre’s oversight bodies and monitoring system(s);
• Recruit the Director and other staff; and
• Prepare the physical facilities of the centre.
3.5.1 Formally Registering the CentreEven if it can be put off for a little time, in most countries, formalregistration of a new centre eventually becomes a necessity for thefollowing reasons.
• If the centre is to raise its own money and earn revenue fromdelivering services, it needs to be able to emit and receive officialinvoices. It will thus need to have a bank account in its name where its
income can be deposited and from which its expenses can bededucted. This can only come about if the centre is a formallyregistered entity.
• The centre will employ staff. In such cases, national legislation oftenrequires that it become a registered entity, so that income tax and
P A R T 3
86
social contributions can be levied at source, and so that the staff iscovered by the country’s employment legislation.
Therefore, once the stakeholders have taken the pertinent decisionsand documented them, it is best to register the centre as the first stepin its formal establishment and set up the accounting / book-keepingsystems for it.
The only exception to the need for registration would be those caseswhere the centre will not be an independent entity, but will be part of alarger institution. In this case, all the financial and personnel matters ofthe centre will be dealt with by that particular institution.
Regarding accounting / book-keeping systems, it may be that acertain accounting / book-keeping system is mandatory because ofthe legal status of the centre. This can create problems in caseswhere external funding has been necessary (see Sections 3.4.2 and3.4.3 of this Manual), because the sponsors often mandate some sortof accounting / book-keeping system of their own. In such cases, thestakeholders will have to negotiate with the sponsors to get them tomodify their systems where these differ from those required by thecountry’s own laws. In addition, where the sponsors require thesame or more detailed book-keeping but in a different format, toavoid confusion and the expenditure of unnecessary time, thestakeholders should try to reach agreement with the sponsor for aharmonization of the two systems.
3.5.2 Establishing the Oversight Bodies for theCentreBy this stage, the stakeholders should have made the basic decisionsabout the oversight bodies of the centre (see Section 3.3.4 of thisManual). Therefore, it should now be simply a question ofimplementing those decisions.
If they are not already set by the national legislation governing thelegal status of the centre, it is advisable that the stakeholders comeup with a short set of “rules” governing the manner in which theoversight bodies will be run, covering especially:
• The basic responsibilities of the bodies;
• How the chair of the bodies will be chosen;
• How decisions will be taken;
P A R T 3
87
• With what frequency the bodies will meet; and
• How disputes will be resolved.
Once the stakeholders have taken the pertinent decisions anddocumented them, they may establish the oversight bodies for thecentre.
3.5.3 Recruiting Staff for the CentreThe first major decision that the Executive Board will take is therecruitment of the staff of the centre, and in particular the Director.As can be imagined, the Director will be the key to the initial successof the centre. Therefore, the Executive Board should devoteconsiderable time and attention to find and recruit the right personfor this job.
The remaining staff is less critical than the Director, although it isimportant to get the right mix of skills (see Section 3.3.4 of thisManual).
It is important that the Executive Board lay down the rules foremploying full-time and part-time staff, as well as local and / orinternational consultants, and seconded staff. This may include (butnot be limited to) laying down guidelines for recruitment of staff(required qualifications and skills, number of interviews requiredbefore the hiring process is finalized and so on), deciding on detailsconcerning the orientation of centre’s staff, their job profiles, dutiesand responsibilities, their pay structure, their paid / unpaid leavebenefits, travel allowances, medical reimbursements, etc. The trainingneeds for the hired staff would also need to be identified andperiodically updated.
Once the Executive Board has taken the pertinent decisions anddocumented them, it may recruit staff for the centre.
3.5.4 Preparing the Physical Facilities of the CentreThe stakeholders should already have reached agreementsconcerning the physical facilities of the centre (see Sections 3.3.5and 3.3.6 of this Manual), the contributions to the physical facilitiesthat will come from the stakeholders (see Section 3.4.1 of thisManual), and those that will come from external funding sources (seeSection 3.4.2 of this Manual).
P A R T 3
88
At this point, it is simply necessary to implement these agreements.This should not be done by the stakeholders, but by the Director aspart of his / her duties of running the centre. However, it is possiblethat there will need to be meetings of the Executive Board to resolvecertain issues.
It is also important for the centre to design the elements of the officespace in a theme relevant to cleaner production and / or in anenvironmentally friendly manner (e.g., the centre could use lead-freepencils, recycled paper, unbleached paper napkins made fromrecycled content, non-plastic cutlery and non-styrofoam plates,water-conserving plumbing equipment, CFC-free air-conditioners,and so on).
Once the Executive Board and Director have taken the pertinentdecisions and documented them, they may prepare the physicalfacilities for the centre.
3.5.5 Launching the CentreThe centre is now ready to launch itself into the market. It will need topromote and sell itself in the market. This step will require the designinga logo for the centre, preparation of attractive brochures, setting up awebsite, widely publicizing itself in all major local newspapers, decidingon the launching time, date and location, and so on.
Once the centre has been launched, it is ready to start operations.
3.5.6 Delivering Services and Making the CentreSelf-sufficientThe centre is now operational. It should concentrate on building aclient base, delivering services to its clients and becoming financiallyself-sufficient in the long run. These aspects will be fully explored inParts 4 and 5 of this Manual.
Eventually, once the centre has crossed the preliminary teething period(the initial three to five years), it has to achieve financial self-sufficiency,and run itself like any smart business centre. In line with this thought, itis vital that the centre:
• Evaluate its operations periodically and when needed;
• Strengthen its weak points; and

P A R T 3
89
• Adapt to changes in external situations by revisiting and revitalizingthe conceptual plan.
These aspects will be fully explored in Part 6 of this Manual.

U N I D O / U N E P G U I D A N C E M A N U A L : H O W T O E S T A B L I S H A N D
O P E R A T E C L E A N E R P R O D U C T I O N C E N T R E S
90
How to Deliver Basic Services of aCleaner Production Centre
What will we learn from Part 4?
4 How to Del iver Services of a CleanerProduction Centre (Guidance on Basic Services)
91
4.1 Introduction 91
4.2 Awareness-ra ising 94
4.3 Tra ining 105
4.4 Cleaner Production Asses sment 114
4.5 Demonstra tion Project 154
Part
4
P A R T 4
91
4 How to Deliver Services of aCleaner Production Centre(Guidance on Basic Services)
4.1 Introduction
he personnel targeted for this part of the Manual are theDirectors of the centres and, to a lesser degree, the membersof the Executive Board of the centre.
Although the range of services undertaken by each centre will bespecific to that centre, the services in general fall into the ninecategories outlined in Part 3 of this Manual. These nine servicecategories are further grouped into two phases and shown below:
Phase-1 Foundation Phase (Basic Services):
1. Awareness-raising;
2. Training;
3. Cleaner Production Assessments; and
4. Demonstration Projects.
Phase-2 Extension Phase (Strategic Services):
5. Networking;
6. Match making;
7. Knowledge management;
8. Interfacing with financial institutions; and
9. Providing policy advice.
Awareness raising and networking form the core services under thefoundation and extension phases respectively. These services do notby themselves generate revenue, however as shown in Figure 4.1(a)
T
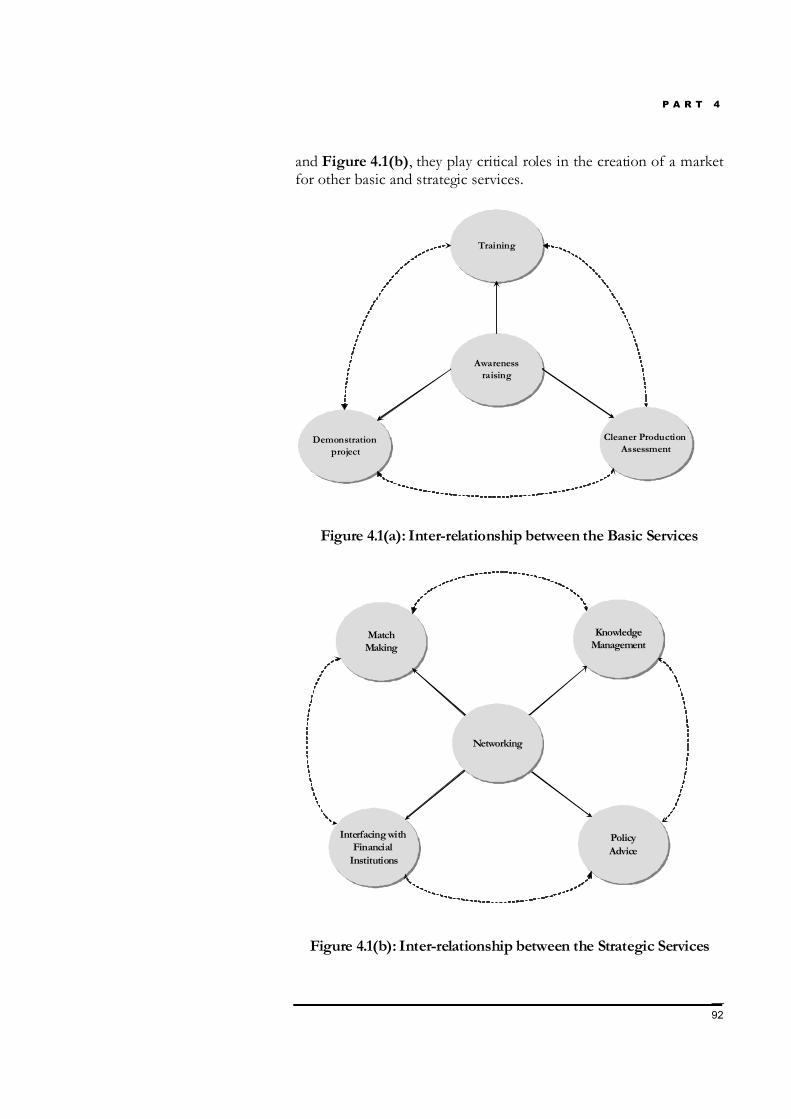
P A R T 4
92
and Figure 4.1(b), they play critical roles in the creation of a marketfor other basic and strategic services.
Awarenessraising
Awarenessraising
TrainingTraining
Cleaner Production Assessment
Cleaner Production Assessment
Demonstrationproject
Demonstrationproject
Figure 4.1(a): Inter-relationship between the Basic Services
MatchMakingMatchMaking
PolicyAdvicePolicyAdvice
Interfacing with Financial
Institutions
Interfacing with Financial
Institutions
KnowledgeManagementKnowledge
Management
NetworkingNetworking
Figure 4.1(b): Inter-relationship between the Strategic Services
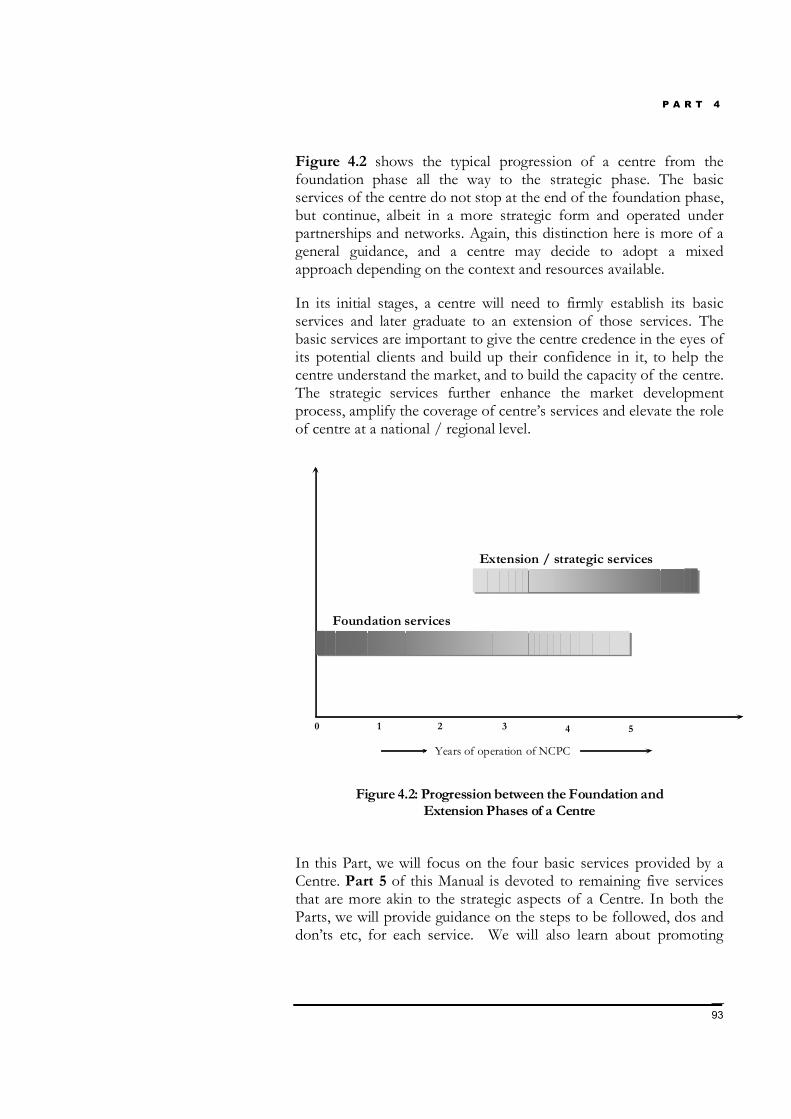
P A R T 4
93
Figure 4.2 shows the typical progression of a centre from thefoundation phase all the way to the strategic phase. The basicservices of the centre do not stop at the end of the foundation phase,but continue, albeit in a more strategic form and operated underpartnerships and networks. Again, this distinction here is more of ageneral guidance, and a centre may decide to adopt a mixedapproach depending on the context and resources available.
In its initial stages, a centre will need to firmly establish its basicservices and later graduate to an extension of those services. Thebasic services are important to give the centre credence in the eyes ofits potential clients and build up their confidence in it, to help thecentre understand the market, and to build the capacity of the centre.The strategic services further enhance the market developmentprocess, amplify the coverage of centre’s services and elevate the roleof centre at a national / regional level.
0 2 3
Years of operation of NCPC
4 5
Foundation services
Extension / strategic services
1
Figure 4.2: Progression between the Foundation andExtension Phases of a Centre
In this Part, we will focus on the four basic services provided by aCentre. Part 5 of this Manual is devoted to remaining five servicesthat are more akin to the strategic aspects of a Centre. In both theParts, we will provide guidance on the steps to be followed, dos anddon’ts etc, for each service. We will also learn about promoting
P A R T 4
94
these services effectively and using them to make the centrefinancially self-sufficient.
4.2 Awareness-raising
The need for cleaner production is evident at all levels – that ofenterprises, of government and industry-support institutions andeven that of individuals. There is, however, little awareness aboutthe nature and benefits of cleaner production. Thus, while there isundoubtedly a need for cleaner production, the demand for cleanerproduction related services is relatively low. The first and foremosttask of the centre in such a situation is to raise awareness aboutcleaner production and its benefits, thereby creating a demand forcleaner production. Unless awareness is created, it is difficult for acentre to establish its niche. Good awareness creation, on the otherhand, helps greatly in the promotion of the centre’s services.
Typically, awareness-raising programmes should focus on varioustarget stakeholders in order to ensure that awareness of cleanerproduction results in action. For every awareness-raising programme,there must be clarity in terms of the intended next step or theexpected action, which then defines the objective of conductingawareness raising. Planning awareness-raising programmes withintended action in mind assists in bringing to bear the required scopeand focus for the chosen target groups.
An objective of conducting awareness-raising programmes oncleaner production in an industrial cluster could be to develop as anext step cleaner production demonstration projects. Amongstfinancial institutions, an awareness-raising programme may beenvisaged to enable the development of a cleaner production fund.The idea of exposing faculty at various universities to cleanerproduction could be to develop a cleaner production basedcurriculum.
Again, it is very important that awareness is not just created for aspecific action but is sustained so that actions can continue, multiplyand lead to the adoption or mainstreaming of cleaner production.Remember that creating awareness as a one-time activity is easierthan sustaining awareness! In this perspective, it is important that theawareness-raising programmes are launched not on an ad-hoc basisbut as part of a strategic operation.
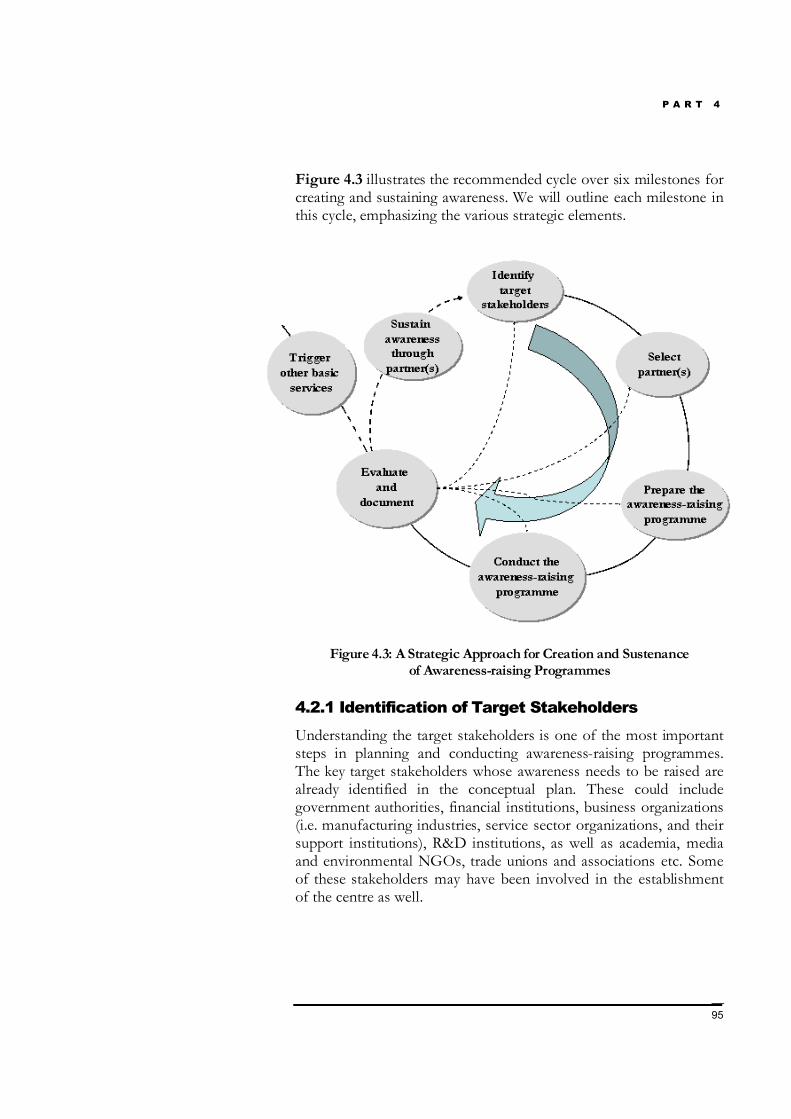
P A R T 4
95
Figure 4.3 illustrates the recommended cycle over six milestones forcreating and sustaining awareness. We will outline each milestone inthis cycle, emphasizing the various strategic elements.
Figure 4.3: A Strategic Approach for Creation and Sustenanceof Awareness-raising Programmes
4.2.1 Identification of Target StakeholdersUnderstanding the target stakeholders is one of the most importantsteps in planning and conducting awareness-raising programmes.The key target stakeholders whose awareness needs to be raised arealready identified in the conceptual plan. These could includegovernment authorities, financial institutions, business organizations(i.e. manufacturing industries, service sector organizations, and theirsupport institutions), R&D institutions, as well as academia, mediaand environmental NGOs, trade unions and associations etc. Someof these stakeholders may have been involved in the establishmentof the centre as well.
P A R T 4
96
For instance, if the focus is on the hospitality industry then it will beimportant to raise the awareness of stakeholders such as hotels,resorts, etc. On the other hand, if the focus is on the manufacturingsector, then industries in a cluster or across the supply chain will bethe target stakeholders for awareness-raising programmes.
We should however note that the mere identification ofstakeholders is not sufficient here; information on theirgeographic location / size distribution, cleaner production needs,barriers and opportunities is also necessary.
For example, if awareness is to be created in the tourist industry,then it is necessary to compile information about the hotels andresorts, their ownership (e.g. whether a hotel is part of aninternational chain), their capacities (number of rooms) andoccupancy rates, the resource-related pressures they are under; e.g.water and electricity, the environmental issues they face; e.g. disposalof kitchen waste; whether there is any hotels association and whetherthere have been any previous cleaner production related seminarsetc.
We should also bear in mind that awareness-raising programmesneed not be restricted to one target stakeholder. Bringing togetherrelated stakeholders makes such programmes more effective.
For instance, if an awareness-raising programme is launched withindustries as the prime target stakeholders, it may be useful to alsoinvolve the financing institutions and key officials of the relevantministries (e.g. industry, commerce and environment). Theirpresence can enrich the discussions because of their experience anddifferent perspectives. At the same time, these representatives canget sensitized and oriented to some of the more pressing issues facedby the industries and hence undertake some of the de-bottleneckingsteps on a proactive basis.
Sometimes, bringing together businesses across the supply-chain ofkey products can also be a good strategy for launching awareness-raising programmes. For example, an awareness-raising programmecould be organized around newly imposed eco-labels on textiles, andthe objective of the programme could be to show how cleanerproduction assessments could assist in securing eco-labels in aprofitable manner. Here, the target group could consist of cottongrowers, yarn and fabric processors, garment makers, fashionmerchants, dyes and chemical suppliers, textile technology
P A R T 4
97
equipment providers and export houses. It is important tocommunicate here that changes made by one stakeholders (inprocess and products) need to be responded to by other stakeholdersto get the desired results.
4.2.2 Selection of (a) Partner(s)Finding a partner to work with is very important in strategizingawareness-raising programmes. Partners often assist in ice-breakingand in jumpstarting the awareness-raising activity.
Partners are needed for several reasons. First, they understand thetarget stakeholders better in terms of barriers and preferences.Second, they hold key information about the target stakeholders thatis useful in customizing awareness-raising programmes. Third, anyearlier work done by the partners becomes an add-on and hencereduces duplication of content. Fourth, the partners can help inreducing the costs of awareness-raising programmes by sharingresources or by connecting the centre to possible sponsors ordonors. Finally, and most importantly, after a series of awareness-raising programmes, partners can become the change agents andwork with the centre as ambassadors to continue promoting thecleaner production concept. This helps greatly in sustainingawareness.
If the target audience is the industry, say for example a leathertanning cluster, then the leather industries association or leatherresearch institute could be the possible partner. In the case offinancing institutions, the partner could be the national bankersassociation.
Partners need to belong to the same geographic area as thestakeholders and have a healthy relationship with them. Thesepartners should have good reputations and networking experienceswith the stakeholders. Importantly, partners must have a stakebeyond the awareness-raising activities. For instance, a leatherresearch association interested to become a partner to the centremust be keen to demonstrate the cleaner technologies they havedeveloped on an industrial scale.
Box 4.1 below presents a checklist for selecting the right partner(s).
If a third party such as acentre approaches thetarget stakeholders with anew concept such ascleaner production thenthere is a possibility thatthe concept may remainalien to the targetstakeholders. There couldbe some resistance.
On the other hand, if thecentre approaches thetarget stakeholders alongwith a partner, who isalready known orfamiliar, then manybarriers get removed.
P A R T 4
98
Box 4.1 Checklist for Selecting the Right Partner(s)for Awareness-raising Programmes
The partner should have had some past experience withconducting awareness raising programmes (not necessarily oncleaner production).
The partner should enjoy a respected and important positionamongst the target stakeholders.
The partner should have high networking potential with thetarget stakeholders.
The partner should have an interest and stake in the overallawareness creation activity.
The partner should possess sufficient knowledge about the targetstakeholders.
The partner should be willing to share resources with the Centrein the preparation and conduct of the awareness-raisingprogrammes.
The partner should be willing to provide a platform to the Centreduring the conduct of its own outreach programmes.
4.2.3 Preparations for an Awareness-raisingProgrammeThe next milestone is preparations for the awareness-raisingprogramme. Here, the important decisions deal with the content(scope and focus) and appropriate delivery mechanisms. Theseaspects require careful consideration as content and deliverymechanisms are closely related.
Content and delivery mechanisms are best determined by holdingbrainstorming sessions with the partner(s) and by organizing focusgroup meetings with key stakeholders. Apart from judging theperception of the stakeholders, the following questions should beraised in the brainstorming sessions:
• What works? What doesn’t? Why?
P A R T 4
99
• What must be avoided? What should not be missed?
• Who must be present? Who must not be present?
Answers to these questions influence the design, development anddelivery of the content. In this process, the centre builds the capacityof the partner(s) as well.
D eci di ng t he co nt ent
The content of the awareness programme should preferably be in alanguage and style that the stakeholders are most familiar with. As ageneral principle the content should be easy to read and grasp andnot overwhelming. This may require text to the point and in asummary form that uses bullets, boxes and deploys effective visuals.
The content of the awareness programme should be based on fourimportant elements viz. concept, experience, methodology andcontacts. Such content structure generally addresses most of thebarriers that need to be resolved.
a. C o nc e p t : This element should include a summary of the evolvingrelationship between the target stakeholders and the environment,the definition of cleaner production, its relationship with otherconcepts that are relevant or better known to the target stakeholders,and the benefits of cleaner production. Ideally, the concept shouldbe communicated through a driving message.
The driving message will differ depending on the target stakeholders.For instance, for manufacturing industries the driving message couldbe “cleaner production to save raw materials, water and energy”,“cleaner production to improve productivity”, “cleaner productionto improve health and safety”, “cleaner production to reduce thequantities of waste and pollution generated and the costs of theircontrol and proper management”, etc. In such messaging, it couldwell be more effective (depending on the target stakeholders) toemphasize the economic and business related benefits more than theenvironmental benefits.
It is critical to pass the message that practicing cleaner productionentails an increase in productivity by virtue of increased outputsand / or reduced inputs, which in turn leads to increasedprofitability.
“We could only do twohalf-day awareness-creatingseminars a month when wetried to do everythingourselves – organisation,lecture, handlingparticipants, etc. Now, weare able to do 70 or moreawareness-creatingworkshops a year by‘piggybacking’ on others’events, such as industryassociation meetings. Wealso look for non-technicalopportunities, such as theLions Club, which are alsogood ways of reaching ourtarget audiences.”
- NCPC, India
P A R T 4
100
Remember that there is no universal remedy to overcome all thebarriers. For example, in the case of state-owned enterprises, themanagers typically focus on meeting set production targets. They arenot required to make profits; the prices of products are fixed, andthe costs of inputs are often subsidized. The only way to prod thesemanagers into action is by sensitizing other stakeholders; e.g. localregulators, environmental NGOs in the neighborhood and the tradeunions. Such managers are typically laggards, respond only onpressures and unfortunately look at cleaner production only whendirected.
Again, not all owners are interested in maximizing profits. A goodmany may be quite content with the current level of profit theirenterprise is generating and feel no great pressure to further increaseprofits by reducing operating costs or enhancing efficiency. Theseowners are often not aware of the changing situations; e.g.emergence of new competitors, supply-chain pressures such asenvironmental and social codes of conduct, market regulations suchas eco-labels, stricter rules on compliance and tightening ofenvironmental standards, etc. Focusing the message on the risingpressures and the advantages of cleaner production as a proactivestrategy could help here to overcome the barrier.
This is where citing experience counts and hence has a critical role inthe content.
b. E xpe ri e nc e : The experience with cleaner production is bestcommunicated through case studies. Ideally, the case studies shouldinclude national or local experiences. The case studies should cover awide range of possibilities such as no-cost or low-cost measures forthe implementation of high benefit options. It is important that thesecase studies are presented in a consistent format, complete withtechnical and financial details. Such case studies may also stimulatedemonstration projects, which can in turn lead to spin-offs oncleaner production related investments.
c. M e tho do lo g y : The methodology or scheme is important in orderto communicate to the audience the ways to put the cleanerproduction concept into practice; viz. cleaner productionassessments, or scheme for a demonstration project, etc. It is alsoimportant to clarify linkages with other systems and methodologies[e.g. the ISO 14001 Environmental Management System (EMS), life-
P A R T 4
101
cycle assessment, etc.], so that the audience understands theirsimilarities and distinguishing features1.
d. Co nt ac t s : Contacts are important as they provide the stakeholderswith an opportunity to obtain more specific information or seekappointments for one-to-one meetings.
D eci di ng t he de l i ver y mec ha ni s ms
Several mechanisms can be employed in the delivery of content, andthey could be used either singly or in combination, whichever givesthe best results. The delivery mechanisms should be suitable to thetype of content and target stakeholders. Awareness-raisingmechanisms are most effective when they take into account localconditions, language, culture, traditions, etc. Here, the partner canprovide useful insight to the centre based on its past experiences.The delivery mechanisms can be broadly divided into event-basedand tool-based approaches. The event-based delivery mechanismsinclude:
• One-to-one meetings;
• Seminars / conferences;
• Workshops;
• Organising field visits;
• Holding or participating in exhibitions; and
• Conducting radio and television shows.
Seminars / conferences and workshops are the most commonly useddelivery mechanisms. While seminars and conferences focus on theconcept and case studies, workshops are useful to deepen theconcept in terms of methodologies and to gain experiences ofputting the cleaner production concept into practice. Half-dayseminars are particularly useful in influencing top management,whereas one-day workshops focusing on themes such as energyefficiency, water conservation etc. are more suited (effective) formiddle-level management. Getting the centre staff to participate in aseminar or a workshop on a related topic organized by a partner or
1 Refer to Section 1.4.2 of Part 1 of this Manual for an elaboration on “CleanerProduction and Environmental Management Systems”.

P A R T 4
102
other key stakeholder is good strategy, especially in the early days ofoperation of the Centre.
Keep in mind while organizing such seminars / conferences, that theprimary focus of awareness raising is retained. The focus should notdiverge into skill-building or training at this stage.
One-to-one meetings serve as good follow-up mechanisms after aseminar or a workshop, moving a stakeholder to the next intendedstep such as undertaking a cleaner production assessment or takingpart in a demonstration project. Field visits are a good complementor add-on to a seminar or a workshop. Generally, a field-visit by theattendees to a seminar or workshop to a facility where cleanerproduction has been implemented helps in raising awarenesseffectively. Holding exhibitions is also a useful method of raisingawareness on cleaner techniques and technologies -- both the know-how and the equipment. In the early stages, it may be difficult andresource intensive for a centre to organize an exhibition on its own;however, Directors should certainly explore putting a stall or a boothat exhibitions organized by others.
Conducting radio and television shows is useful to communicate thecleaner production concept to a wide cross-section of businesses andthe general community. These shows are effective if a campaign-based approach is used, where the Director of the centre interviewsevery week or fortnightly business leaders who have taken a lead inimplementing cleaner production. Such shows would typicallyrequire a sponsor (or multiple sponsors), since the centre wouldprobably be unable to budget for them. In order to avoid conflicts ofinterest, care should be taken to ensure that the business leadersbeing interviewed do not form part of the sponsor family. Rather,sponsors may be sourced from the Government, corporations (otherthan those being interviewed) and relevant trust funds.
The tool-based delivery mechanism can be used by a centre inisolation or in combination with the event-based deliverymechanisms described above. These mechanisms include:
• Developing videos;
• Distributing brochures, banners, posters;
• Bringing out newsletters;
• Operating websites;
P A R T 4
103
• Writing newspaper articles; and
• Publishing articles in scientific or business journals andperiodicals.
Typically, videos are prepared at a stage when a centre hassuccessfully completed a number of cleaner production assessmentsand demonstration projects. Here, videos are basically created todocument and narrate the experience thereby making them effectivetools in the seminars and workshops.
Brochures, banners and posters are useful to promote as well as tosustain the awareness-raising programmes. For example, brochuresare effective if distributed before a seminar or a workshop. Bannersmay be provided to those organizations that have signed an MoUwith the Centre to undertake a cleaner production assessment or ademonstration project. When such banners are placed on the gatesof the factories, the workers of the factory as well as the communityin the neighborhood get sensitized about cleaner production. Postersare an excellent mechanism for communicating the concept ofcleaner production to workers in the work place, as well as thecompany / enterprise staff.
Operation of websites, newsletters and scientific articles (in a journal)should be the preferred mechanism for introducing cleanerproduction to professionals and other stakeholders such ascommunity-based NGOs, regulators and administrators. Thewebsites should also include feedback and registration forms, so asto understand the nature and information needs of frequent visitors.
4.2.4 Conducting Awareness-raising ProgrammesConducting awareness-raising programmes refers to logistics, sharingof responsibilities, promotion of the event, and actual conduct of theevent.
Logistics include deciding on the venue, timing and duration of theawareness-raising programme. Promoting and conducting the actualprogramme are the joint responsibility of both the centre and thepartner(s). We will confine ourselves here to the event-based deliverymechanisms described in the earlier section.
P A R T 4
104
W ho s ho uld co nduct a wa renes s - ra i s i ngpro g ra mmes ?The Director of the centre must spearhead the awareness-raisingprogrammes, at least in the initial phases. Later, the senior staff ofthe centre may carry out this function.
The representative(s) from the partner organization(s) should alsoplay an important role. Other important speakers could be local leadstakeholders; e.g. a representative of a company that hasimplemented a cleaner production demonstration project, orrepresentatives from Implementing Agencies if tough newregulations have been enacted, which the Government is determinedto implement.
W hen s ho uld a wa renes s - ra i s i ng pro g ra mmes beco nduct ed?
There are some practical points that need to be kept in mind whiledeciding the timing and schedule for awareness-raising programs:
• Where possible, time an awareness-raising programme tocoincide with any major policy or regulatory changes affectingthe target stakeholders (e.g. removal of a subsidy that wouldincrease cost of raw material, or tightening of effluent standardsetc.).
• Alternatively, conduct awareness-raising programmes followingany major market development; e.g. imposition of an eco-label.
• Target presentations for slots during majorseminars / workshops where a large gathering of targetstakeholders is expected.
• Avoid conducting programmes during local holidays, periods offinancial closing (monthly or annual) and peakproduction / business times (in the case of manufacturing orservice organizations).
W here s ho uld a wa renes s - ra i s i ng pro g ra mmes b eco nduct ed?
Deciding the venue of the programmes is significant from the followingperspectives:
P A R T 4
105
• The venue should be easily accessible to most of the participants ortarget stakeholders.
• The venue should also be decided based on the content of theprogramme. For instance, awareness-raising programmes targeted topromote demonstration projects could best be conducted on-site(i.e. at a facility where demonstrations have been already undertaken)rather than in a conference room.
• If a field visit is planned after a seminar, the venue should be close tothe facility that will be visited.
4.3 Training
Training is typically the next activity a centre will get involved inonce the awareness-raising programmes have been going for a while.Training helps to build the capacity of professionals so that they canput the cleaner production concept into practice. Training is bothresource intensive and time consuming and hence a strategicapproach is necessary.
We will develop the topic of training in this section following asimilar approach to the one used in creating awareness (see Figure4.4). Each of the milestones of the cycle described below isexplained in the following sections.
“Instead of organizing ourown meetings andworkshops ourselves, whichproved to be very expensive,we now are doing morepresentations at industrialmeetings. Especially thesmaller chambers ofcommerce and industry – atthe municipal or regionallevels – as this is moreeffective because moreinterested people go thereinstead of going to the largechambers.”
- NCPC, Mexico

P A R T 4
106
Select a Partner/s
Select a Partner/s
Prepare the trainingprogramme
Prepare the trainingprogramme
Conduct the training
programme
Conduct the training
programme
Evaluate and Document
Evaluate and Document
Sustain the training activity
Sustain the training activity
Identify Target Stakeholders & Training Needs
Triggerother
services
Triggerother
services
Figure 4.4: A Strategic Approach for Creation and Sustenance of Training Programmes
4.3.1 Identification of Target Stakeholders andTraining NeedsThe first task for a centre is to identify the target stakeholders fortraining and to understand their training needs. Typically, the targetstakeholders are those where the awareness creation process hasbeen already initiated.
To plan training programmes, the Director of the centre shouldprepare what is known as a Training Needs Assessment (TNA). Thebasic outcome of a TNA is to understand the training modulesneeded for the various types of stakeholders. A TNA is bestprepared by sending questionnaires to representative stakeholdersfollowed by one-to-one meetings.
The questionnaire should include topics of training modules with abrief description of their contents, and the representative stakeholder
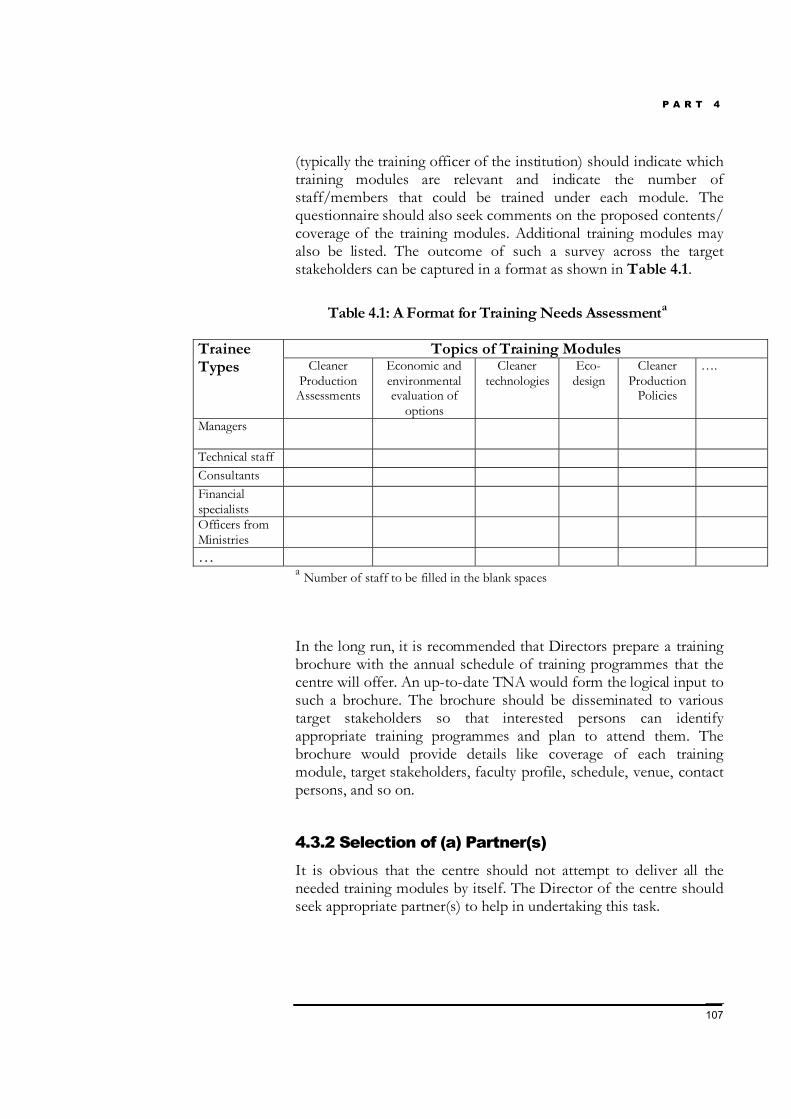
P A R T 4
107
(typically the training officer of the institution) should indicate whichtraining modules are relevant and indicate the number ofstaff/members that could be trained under each module. Thequestionnaire should also seek comments on the proposed contents/coverage of the training modules. Additional training modules mayalso be listed. The outcome of such a survey across the targetstakeholders can be captured in a format as shown in Table 4.1.
Table 4.1: A Format for Training Needs Assessmenta
Topics of Training ModulesTraineeTypes Cleaner
ProductionAssessments
Economic andenvironmentalevaluation of
options
Cleanertechnologies
Eco-design
CleanerProduction
Policies
….
Managers
Technical staffConsultantsFinancialspecialistsOfficers fromMinistries…
a Number of staff to be filled in the blank spaces
In the long run, it is recommended that Directors prepare a trainingbrochure with the annual schedule of training programmes that thecentre will offer. An up-to-date TNA would form the logical input tosuch a brochure. The brochure should be disseminated to varioustarget stakeholders so that interested persons can identifyappropriate training programmes and plan to attend them. Thebrochure would provide details like coverage of each trainingmodule, target stakeholders, faculty profile, schedule, venue, contactpersons, and so on.
4.3.2 Selection of (a) Partner(s)It is obvious that the centre should not attempt to deliver all theneeded training modules by itself. The Director of the centre shouldseek appropriate partner(s) to help in undertaking this task.

P A R T 4
108
We have already noted the requirement, importance and criteria forselecting a partner for the purposes of awareness raising. The samecriteria apply for selecting a partner for conducting training as well.
Generally, the partner in awareness-raising programmes should bethe first choice for training as well. However, it is possible that thepartner selected for awareness raising has less interest in training or isless experienced in conducting training programmes. In such cases, itmay be useful to explore additional partners. Typically, universitiesoffering courses on environmental management, energy technology,business management etc., or vocational training institutes arepotential partners.
It is worth stressing here that it is extremely crucial for the centre toget this task right at the outset, as one of the additional objectives ofconducting training is to develop a network of trainers/traininginstitutions that could assist the centre in meeting its future trainingneeds. This is typically the Training of Trainers approach.
Finally, unlike the awareness-raising programmes, the relationshipbetween the centre and the training partner(s) is important in view oftwo important aspects:
• Training, unlike an awareness-raising programme, is potentially arevenue generating service. Hence models of revenue sharing needto be clearly defined and perhaps formalized with the trainingpartner(s).
• Training leads to the preparation of specialized content that canhave implications of Intellectual Property Rights (IPR). It isimportant, therefore, to define the ownership of training materialsupfront in this perspective.
Box 4.2 highlights the dos and don'ts for nurturing the trainingpartner.
Box 4.2 Dos and Don’ts for Nurturing the TrainingPartner (s)
Do not treat the partner as an outsider.
Ensure that the partner understands what is expected ofhim / her / them; i.e. in terms of donning a part of thetraining mantle of the Centre, in the future.
P A R T 4
109
Where possible, sign an MoU with the partner. This couldunderscore details of sustaining the training cycle on behalfof the Centre in the future, details of intellectual ownership,revenue-sharing and so on.
4.3.3 Preparation for the Training ProgrammePreparation for the training programme would entail the centre’sinteraction with the partner on the following:
1. The content of the training programme
2. The preferred delivery mechanisms
D eci di ng t he co nt ent
The content of the training programme should preferably be in thelanguage and style the stakeholders are most familiar with. As ageneral principle the content should be easy to read and grasp andnot overwhelming. It is important that the content of the trainingprogramme reflects the actual training needs and not the content thata centre or its partner can easily provide.
The content of the training programme should be based on fourimportant components; viz. lecture notes, self-assessment questions,case studies and resources. It should test the conceptual, analyticaland quantitative understanding of the trainee. Self-assessmentquestions help the trainer and the participant understand the extentof assimilation of the overall contents of the programme; i.e. theconcept, familiarity with the procedures and tools (e.g. material andenergy balances, ecomaps, process flow diagrams, etc.2), and theirapplications. To achieve this end, self-assessment exercises couldinclude short problems and quizzes. Case studies induce a problemsolving approach by the trainee. Resources can be used by the traineeat a later date as a reference material. Resources can typically includebenchmarks, technology fact sheets, important formulae, etc. Such abasic structure of content helps in building the necessarycompetence of the trainee in the chosen training module.
2 The terms “material and energy balance”, “ecomap” and “process flow diagram”are explained in later sections of this Part of the Manual.
P A R T 4
110
In situations where cleaner production is to be delivered as a newconcept, the content of the training programme should focus oncreating core competencies. For instance, the content could includethe methodology for cleaner production assessments and exposureto some of the basic tools (e.g. preparation of material and energybalances, conducting cause analysis, identification and screening ofcleaner production options, preparing implementation plans, etc.).
If the core competencies are already in place, then the content couldinclude broader topics that are more quantitative, or knowledge-driven and discussion-oriented. This can include cleaner technologyoptions in specific sectors, economic and environmental evaluationof options, and allied areas such as environmental cost accounting,cleaner production and EMS, cleaner production policy, cleanerproduction in educational curricula, etc.
At a tertiary level, i.e. on maturity, training could address conceptsthat are closely related to cleaner production; e.g. health and safety,green productivity, eco-design, life-cycle assessment and so on.
D eci di ng t he de l i ver y mec ha ni s m
There are a number of possibilities in deciding on the deliverymechanisms. The following are some of the commonly useddelivery mechanisms. Generally, a mix is recommended to get thebest results.
• Classroom instruction;
• Group work based or case study driven instruction; and
• Field or facility based instruction.
Classroom instruction is effective when trainees are to be exposed tofundamental topics such as cleaner production methodology, life-cycle assessments, etc. Group work based or case study driventraining sessions are recommended when trainees are to be exposedto problem solving approaches; e.g. setting up of a cleanerproduction demonstration project. Facility based or in-plantinstruction (or training by doing) is preferred when the trainees fromthe same organization are to be trained for a specific objective; e.g.implementation of cleaner production options etc. This form oftraining is often used in conducting facility based cleaner productionassessments.
P A R T 4
111
Again, training can be delivered in different forms such as:
• A continuous training event; e.g. over three days to five days atone time; or
• A discrete training event; e.g. one day a week over a longduration; e.g. three months; or
• A flexible learning event; e.g. distance learning.
These models should be considered as options to suit theconvenience of the trainees. Long duration, discrete training eventsare best suited when operating a continuing education programmeon cleaner production. A continuous training event; e.g. a hands-ontraining workshop over say 3 to 5 days, is useful to build focusedskills in a relatively short time. Distance learning (e.g. bycorrespondence or via the Internet) is effective to provide basictraining on cleaner production to a large number of stakeholders.However, this technique is appropriate only when the trainingresources are sufficiently built and have been adequately tested oraccredited.
4.3.4 Conducting the Training ProgrammeConducting training refers to the logistics, sharing of responsibilities,preparation of the training materials, promotion of the event, andactual conduct of the event. Logistics include deciding on the venue,providing required training equipment, and deciding on the timingand duration of the training programme. The promotion andconduction of these training programmes is generally the jointresponsibility of the centre and the partner.
Training programmes must be conducted in a disciplined andstandardized manner. All the persons involved in conducting thetraining programme should be provided with standardized templatesto prepare lecture notes and overhead projections. Details such astype of font, size, and formatting should be specified to achieveuniformity in the training materials. All materials should be carefullyproofread. Key portions of the text may require to be translateddepending on the background of the trainees. Hence, the trainingmaterials should be prepared well in advance.
The centre should develop a number of checklists for selecting andinspecting the venue, organizing training equipment (e.g. projector,boards, flip charts, pens, microphone system, etc.), assembling and
P A R T 4
112
packaging the training kit (lecture notes, disks / CD-ROMs, files /folders, pens, etc.). It is important that some of the principles ofcleaner production be followed while conducting the trainingprogramme itself; e.g. photocopying should be done on both sides ofthe paper, plastic folders / files should be avoided, etc.
H o w s ho uld t he t ra i n i ng pro g ra mme beo rg a ni zed?
It is desirable that the training programme includes the followingitems, apart from the conduct of the actual technical sessions:
• A short presentation on the purpose or objectives of the trainingprogramme;
• A self introduction of the participants and faculty;
• Time slotted for discussions/questions after each presentation orsession;
• Adequate time for experience sharing by the participants;
• Time reserved at the beginning and close of each day for makingany practical announcements;
• Sessions to assess the trainees (short quizzes, group work, etc.);and
• A closing session on evaluation of the training programme.
It is equally important for the trainer(s) to pay attention to timemanagement during the planning, preparation and conduct of thetraining programme. Here, the senior staff of the centre (e.g. theDirector) will have to play the moderator’s role.
W ho s ho uld be co nduct i ng t he t ra i n i ngpro g ra mme?
The selection of the training faculty is a critical aspect. The facultymust have practical experience in cleaner production and / or alliedareas. In addition, the training faculty must be excellentcommunicators; good communicators make good trainers, whereastechnically proficient persons alone may not always be good trainers.

P A R T 4
113
Training programmes run by a single faculty are not effective,however competent the training faculty may be. Hence, the centreshould involve at least two to three lead faculty members indesigning the content and implementing the training programme.Again, the faculty should be drawn from a mix of experience; e.g.from university, industry, financing institution etc. This helps inwidening the perspective. Since a number of different facultymembers belonging to different organizations are generally used, thecentre should play the role of a “training manager”. In this capacity,the centre should organize a meeting of the entire faculty before theconduct of a training programme. This meeting should be used toget to know each other, reduce overlaps in the content, and maintaina consistency in messaging cleaner production.
P A R T 4
114
4.4 Cleaner Production Assessments
The Cleaner Production Assessment (CPA) is perhaps the coreservice a centre can offer an enterprise. A good CPA helps theenterprise in many ways. The benefits of a CPA include:
• Identification, characterization and quantification of wastestreams and thus environmental and economic assessments ofloss of resources (material and energy)
• Identification of easy to implement and low-cost cleanerproduction options that enterprises can immediately implement;and
• Preparation of investment proposals to financing institutions forundertaking medium to high cost cleaner production measuresthat may require technology or equipment change.
Additional benefits of a CPA include:
• Building a “cleaner production culture” in the company, which iscrucial for long-term sustainability;
• Generating local examples / case studies which could beeffectively used in training and awareness-raising programmes;
• Helping in the estimation of the potential of cleaner productionin the concerned sector and thus in the formation of the basis forsectoral policy reforms; and
• Helping in identifying the technology and skill developmentneeds of the company and sector.
In fact, conducting the CPA is an excellent method of buildingcompetence of the staff at the centre, as well as the staff in theparticipating company.
A CPA should be conducted in a systematic form and not on an ad-hoc basis. A structured approach is necessary to get the best results.Such an approach ensures that the outcomes of CPA are consistentwith those identified in the organization’s broader planning process.
P A R T 4
115
4.4.1 The Generic CPA ProcessA generic CPA process consists of the following steps:
• Planning and organization;
• Pre-assessment;
• Assessment;
• Feasibility analysis;
• Implementation; and
• Monitoring.
Figure 4.5 shows these steps and the related tasks of a typical CPAprocess.
In this section, we will learn about the CPA process and understandeach milestone with associated tools and examples.
While the explanations are oriented to a typical manufacturingenterprise, the guidance is equally applicable to enterprises engagedin service sectors. We will also discuss some of the variations in thegeneric CPA process.
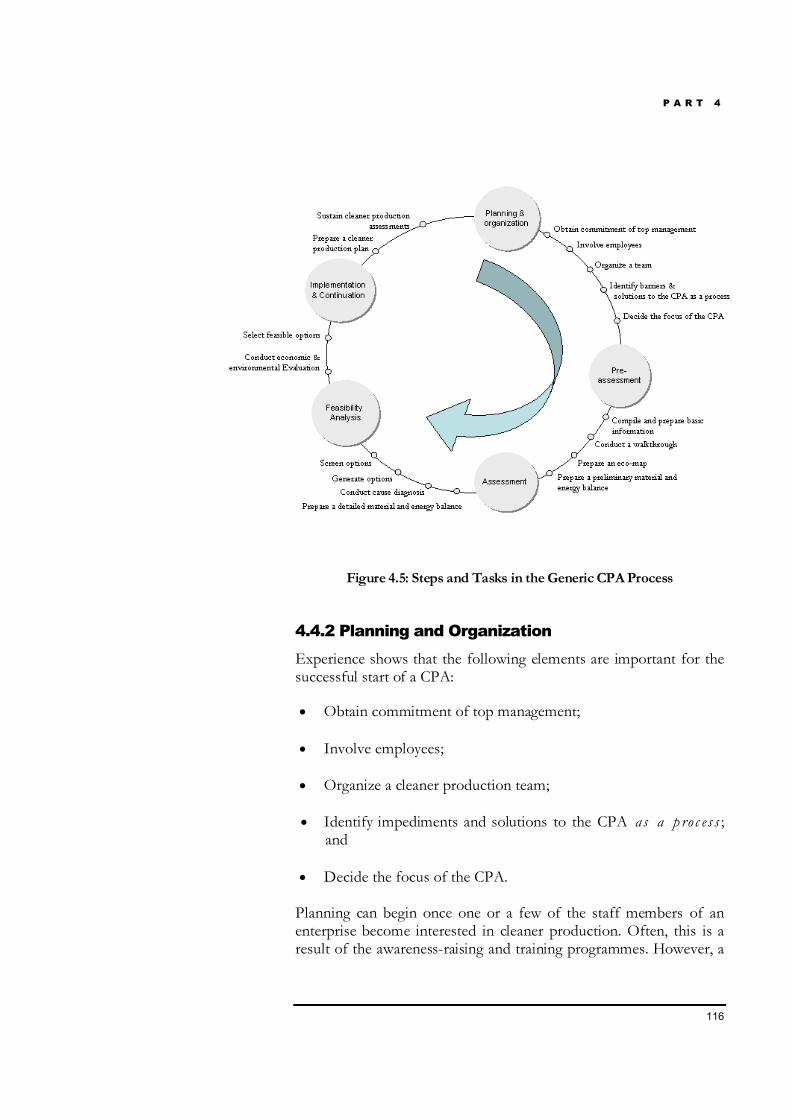
P A R T 4
116
Figure 4.5: Steps and Tasks in the Generic CPA Process
4.4.2 Planning and OrganizationExperience shows that the following elements are important for thesuccessful start of a CPA:
• Obtain commitment of top management;
• Involve employees;
• Organize a cleaner production team;
• Identify impediments and solutions to the CPA a s a p ro c es s ;and
• Decide the focus of the CPA.
Planning can begin once one or a few of the staff members of anenterprise become interested in cleaner production. Often, this is aresult of the awareness-raising and training programmes. However, a
P A R T 4
117
CPA can only be initiated after a decision has been made by themanagement to take action.
O bt a i n co mmi t ment o f t o p ma na g ement
If the enterprise decides to involve the centre, a meeting is normallyrequired between the centre and the top management of theenterprise to formalize the decision. Typically, an MoU should bedrawn up between the centre and the enterprise, defining theobjectives of the CPA, a work plan that indicates time frame, thesharing of responsibilities and sharing of the outcomes, and the fee.
The management of an enterprise has to set the stage for the CPA, inorder to ensure cooperation and participation of the staff members.Other than signing an MoU, the commitment of top managementtakes the form of:
• Directing the formation of a cleaner production team;
• Making the required resources available; and
• Being responsive to the results of CPA.
I nvo lve emplo yees
The success of a CPA also depends on the collaboration of the staff.It is important to remember that successful CPAs are not carried outby persons external to the enterprise, such as consultants or the staffof the centre, but by the staff of the enterprise itself, supported ifand where necessary by external persons. The staff includes not onlythe senior management but also the staff on the shop-floor, involvedin everyday operations and maintenance. The staff on the shop-flooroften has a better understanding of the process and is able to comeup with suggestions for improvement. Again, the staff involvementshould not be limited to technical or production staff. There can be aconsiderable role for other departments such as purchasing,marketing, accounts and administration. These staff membersprovide useful data, especially on “inputs” and “outputs”; assist inthe assessment of the economic and financial feasibility of cleanerproduction options; provide information on alternative rawmaterials; or, provide market feedback when redesign of products isenvisaged.
P A R T 4
118
O rg a ni ze a c lea ner pro du ct i o n t ea m
CPAs are best performed by teams, so the formation of one or moreteams is an important part of the planning of a CPA. The teamsshould consist of staff of the enterprise, supported and assistedwhere necessary by the staff of the centre or by local consultants.Efforts should be made to gel the members of the team by holdingfrequent meetings. Getting the right mix of team members is crucial,otherwise it is possible that the team may face hindrances fromwithin as well as outside (e.g. from the staff and the workers of theenterprise).
For large organizations, a team could consist of a core team (formedwith representatives from different departments) and a few sub-teams for specific tasks. For small and medium scale units, on theother hand, the team could just have the owner or proprietor and asupervisor or manager who looks after the day-to-day operations.This team should initiate, co-ordinate and supervise the CPAactivity. In order to be effective, the team should have, on acollective basis, enough knowledge to analyze and review the presentproduction practices. They should have the creativity to explore,develop and evaluate modifications in the production practices.Finally, they must have the competence to implement theeconomically feasible interventions.
I dent i fy i mpedi ment s a nd s o lut i o ns t o t he CP Aa s a pro ces s
In order to develop workable solutions, the cleaner production teamshould identify impediments in the CPA process for a particularenterprise. For instance, there could be impediments in obtaininginformation from some of the departments. The team shouldhighlight such difficulties right away so that adequate directives canbe issued by the management to resolve the issue before the start ofthe CPA itself. Other impediments could include lack of awarenessand / or skills amongst the workers and staff of the enterprise oncleaner production. Solutions to such impediments would typicallyinclude performing in-plant awareness-raising sessions, conductingassociated training activities, providing and explaining relevant casestudies and so on.
D eci de t he fo cus o f t he CP A
Deciding the focus of the CPA involves making decisionsconcerning:
P A R T 4
119
• The s c op e ; i.e. whether to include the entire plant or limit theCPA to certain units / departments; and
• The e m pha si s in terms of materials; e.g. water, energy orchemicals.
In the case of a textile industry, for instance, the garmentingdepartment is often excluded, as it does not lead to majorconsumption of resources or generation of wastes or emissions. Inthe case of a cement industry, water is not given much emphasis inthe CPA as against focus on energy and materials.
4.4.3 Pre-assessment
The first step the cleaner production team will execute is a pre-assessment. This consists of four important tasks:
• Compiling and preparing the basic information;
• Conducting a walkthrough;
• Preparing an eco-map;
• Carrying out preliminary material and energy balances.
Co mpi le a nd pre pa re ba s i c i n fo rma t i o n
In this step, the cleaner production team generates two importantoutputs:
1. A Process Flow Diagram (PFD; and
2. An eco-map of the site.
We will learn about how the team can produce these two outputs in thissub-section.
P r ep a ra t i on o f P r oces s F l ow D i a gr am
The preparation of a PFD is an important step in the CPA. To constructa PFD, it is best for the cleaner production team to start by listing theimportant unit operations right from receipt of raw materials to thestorage / dispatch of final products. Next, each of the unit operationscan be shown in a block diagram indicating detailed steps with relevant
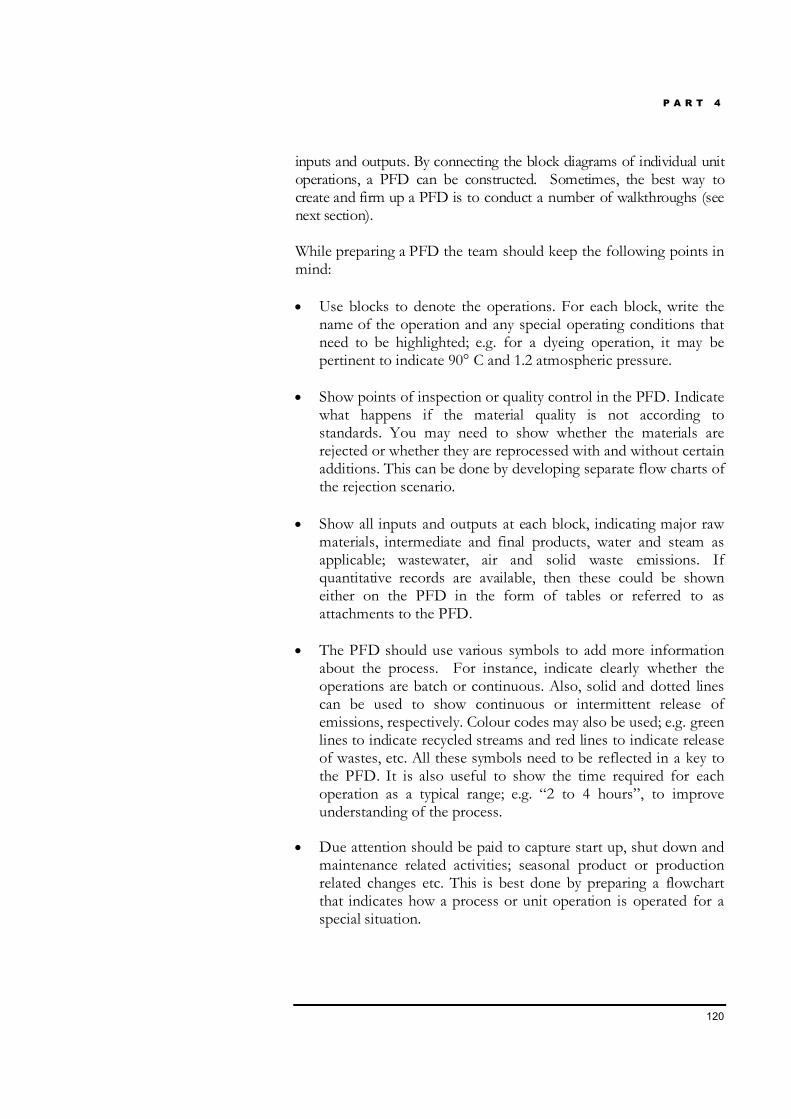
P A R T 4
120
inputs and outputs. By connecting the block diagrams of individual unitoperations, a PFD can be constructed. Sometimes, the best way tocreate and firm up a PFD is to conduct a number of walkthroughs (seenext section).
While preparing a PFD the team should keep the following points inmind:
• Use blocks to denote the operations. For each block, write thename of the operation and any special operating conditions thatneed to be highlighted; e.g. for a dyeing operation, it may bepertinent to indicate 90° C and 1.2 atmospheric pressure.
• Show points of inspection or quality control in the PFD. Indicatewhat happens if the material quality is not according tostandards. You may need to show whether the materials arerejected or whether they are reprocessed with and without certainadditions. This can be done by developing separate flow charts ofthe rejection scenario.
• Show all inputs and outputs at each block, indicating major rawmaterials, intermediate and final products, water and steam asapplicable; wastewater, air and solid waste emissions. Ifquantitative records are available, then these could be showneither on the PFD in the form of tables or referred to asattachments to the PFD.
• The PFD should use various symbols to add more informationabout the process. For instance, indicate clearly whether theoperations are batch or continuous. Also, solid and dotted linescan be used to show continuous or intermittent release ofemissions, respectively. Colour codes may also be used; e.g. greenlines to indicate recycled streams and red lines to indicate releaseof wastes, etc. All these symbols need to be reflected in a key tothe PFD. It is also useful to show the time required for eachoperation as a typical range; e.g. “2 to 4 hours”, to improveunderstanding of the process.
• Due attention should be paid to capture start up, shut down andmaintenance related activities; seasonal product or productionrelated changes etc. This is best done by preparing a flowchartthat indicates how a process or unit operation is operated for aspecial situation.

P A R T 4
121
Figure 4.6(a) shows an illustration of a PFD for a wet-textileprocessing factory.
Figure 4.6(a): A PFD for a Wet-textile Processing Factory
Figure 4.6(b) provides a flowchart showing decision points forspecial situations within it; i.e. whether bleaching and scouring isrequired, whether the material needs to be dyed.
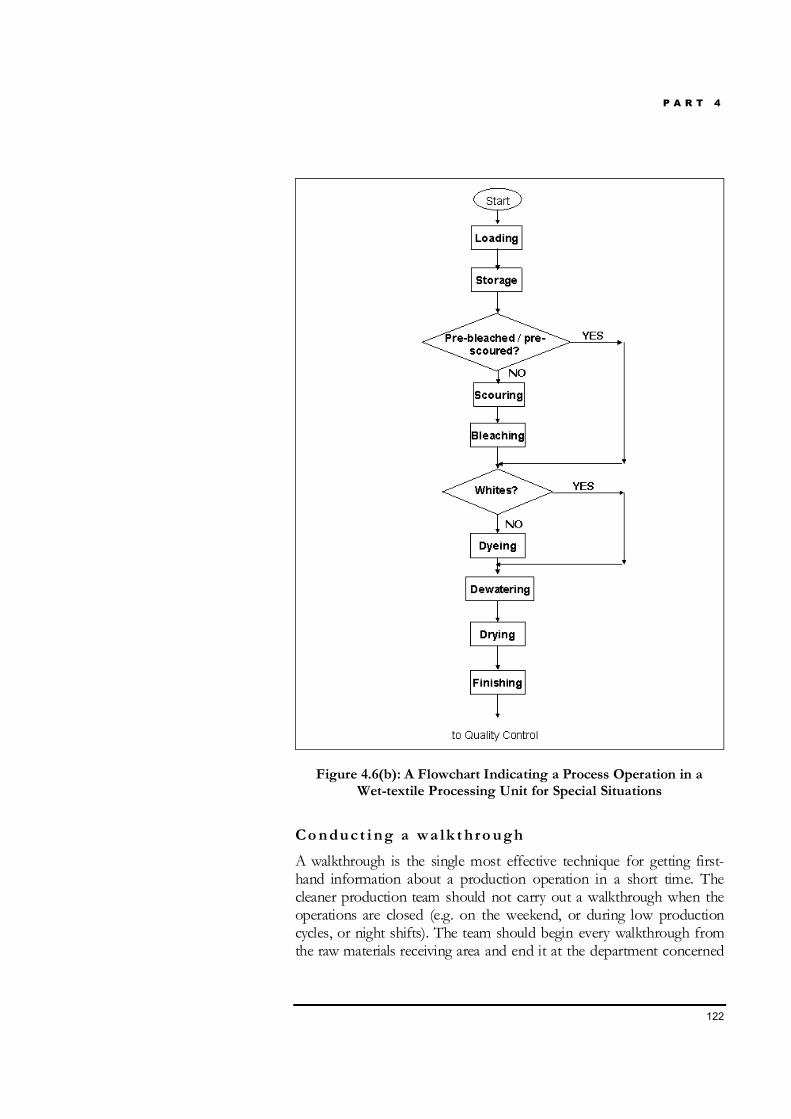
P A R T 4
122
Figure 4.6(b): A Flowchart Indicating a Process Operation in aWet-textile Processing Unit for Special Situations
Co nduct i ng a wa lk t hro ug h
A walkthrough is the single most effective technique for getting first-hand information about a production operation in a short time. Thecleaner production team should not carry out a walkthrough when theoperations are closed (e.g. on the weekend, or during low productioncycles, or night shifts). The team should begin every walkthrough fromthe raw materials receiving area and end it at the department concerned
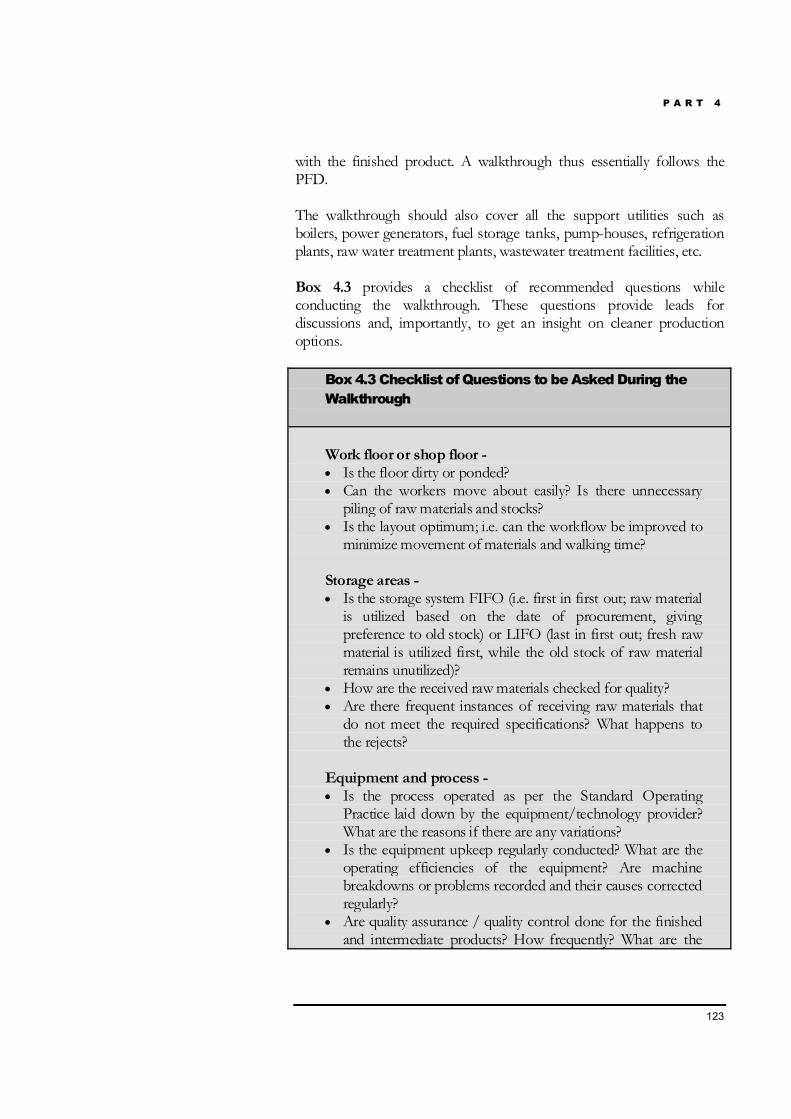
P A R T 4
123
with the finished product. A walkthrough thus essentially follows thePFD.
The walkthrough should also cover all the support utilities such asboilers, power generators, fuel storage tanks, pump-houses, refrigerationplants, raw water treatment plants, wastewater treatment facilities, etc.
Box 4.3 provides a checklist of recommended questions whileconducting the walkthrough. These questions provide leads fordiscussions and, importantly, to get an insight on cleaner productionoptions.
Box 4.3 Checklist of Questions to be Asked During theWalkthrough
Work floor or shop floor -• Is the floor dirty or ponded?• Can the workers move about easily? Is there unnecessary
piling of raw materials and stocks?• Is the layout optimum; i.e. can the workflow be improved to
minimize movement of materials and walking time?
Storage areas -• Is the storage system FIFO (i.e. first in first out; raw material
is utilized based on the date of procurement, givingpreference to old stock) or LIFO (last in first out; fresh rawmaterial is utilized first, while the old stock of raw materialremains unutilized)?
• How are the received raw materials checked for quality?• Are there frequent instances of receiving raw materials that
do not meet the required specifications? What happens tothe rejects?
Equipment and process -• Is the process operated as per the Standard Operating
Practice laid down by the equipment/technology provider?What are the reasons if there are any variations?
• Is the equipment upkeep regularly conducted? What are theoperating efficiencies of the equipment? Are machinebreakdowns or problems recorded and their causes correctedregularly?
• Are quality assurance / quality control done for the finishedand intermediate products? How frequently? What are the

P A R T 4
124
current results?
Boiler and steam distribution system -• Are there any leaking joints, glands, valves, safety valves?• Is the condensate being returned to the maximum extent
possible?• Are the condensate return lines and feed tanks jacketed or
lagged?• Are steam traps of correct types being used for each process?• What is the fuel used? Is it of a consistent quality and
composition?• What is the source of water? Is the raw water treated before
use?• What is the type of boiler (e.g. single pass / double pass,
etc.)? How frequently does the boiler blow down?
Waste and emissions -• Is the waste properly collected, segregated and transported?• Is the waste generation continuous? Or in spurts?• Are any measurements made of waste generated or
emissions emitted?• Are any valuable raw materials or products wasted as part of
the emissions? Is it possible to reuse or recycle them ifrecovered?
Box 4.4 lists the dos and don’ts that may be followed while conductingthe walkthrough.
Box 4.4 Dos and Don’ts to be Followed During theWalkthrough
Do not find faults. A walk-through is not for fault finding. It is tounderstand material and energy flows better, and to generateideas for efficiency gains, higher profitability and overallenvironmental improvement. A walk-through is also to “makefriends” for future contacts and possible partnerships. Hence,do not be critical, but be constructive and make suggestions.
Do not dominate or take over the conversation. During thewalkthrough, give a chance for the responsible staff to speak andexplain.
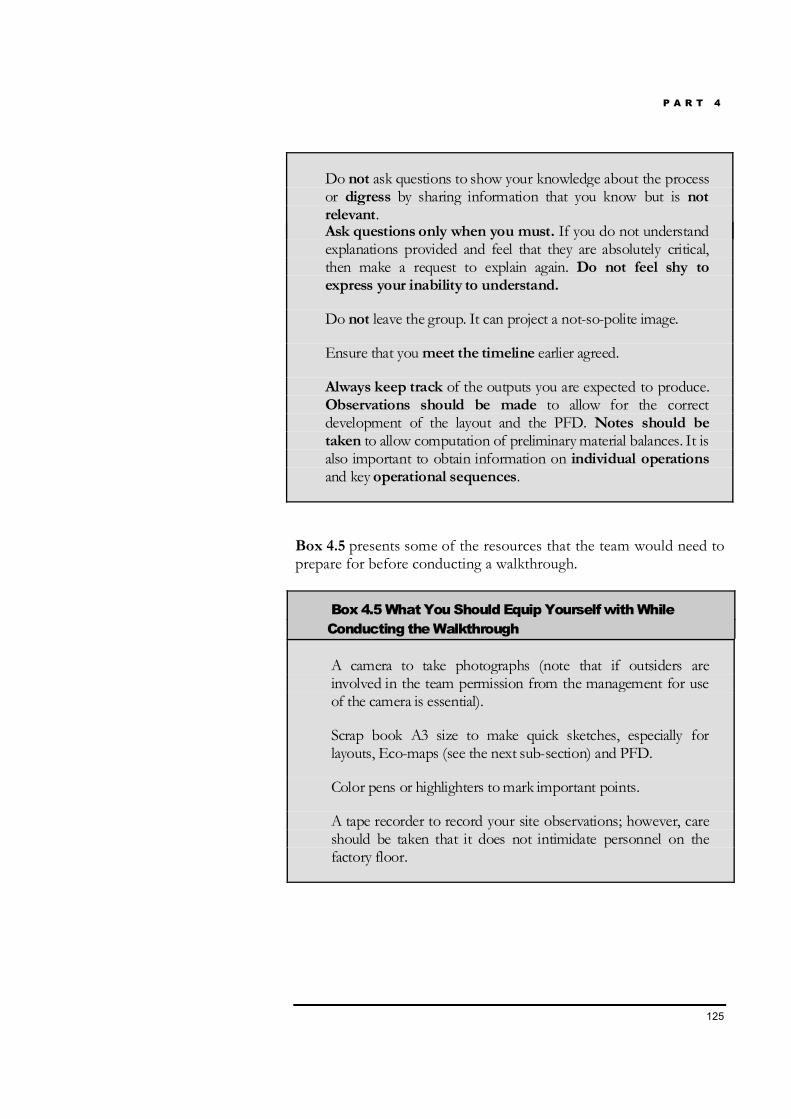
P A R T 4
125
Do not ask questions to show your knowledge about the processor digress by sharing information that you know but is notrelevant.Ask questions only when you must. If you do not understandexplanations provided and feel that they are absolutely critical,then make a request to explain again. Do not feel shy toexpress your inability to understand.
Do not leave the group. It can project a not-so-polite image.
Ensure that you meet the timeline earlier agreed.
Always keep track of the outputs you are expected to produce.Observations should be made to allow for the correctdevelopment of the layout and the PFD. Notes should betaken to allow computation of preliminary material balances. It isalso important to obtain information on individual operationsand key operational sequences.
Box 4.5 presents some of the resources that the team would need toprepare for before conducting a walkthrough.
Box 4.5 What You Should Equip Yourself with WhileConducting the Walkthrough
A camera to take photographs (note that if outsiders areinvolved in the team permission from the management for useof the camera is essential).
Scrap book A3 size to make quick sketches, especially forlayouts, Eco-maps (see the next sub-section) and PFD.
Color pens or highlighters to mark important points.
A tape recorder to record your site observations; however, careshould be taken that it does not intimidate personnel on thefactory floor.
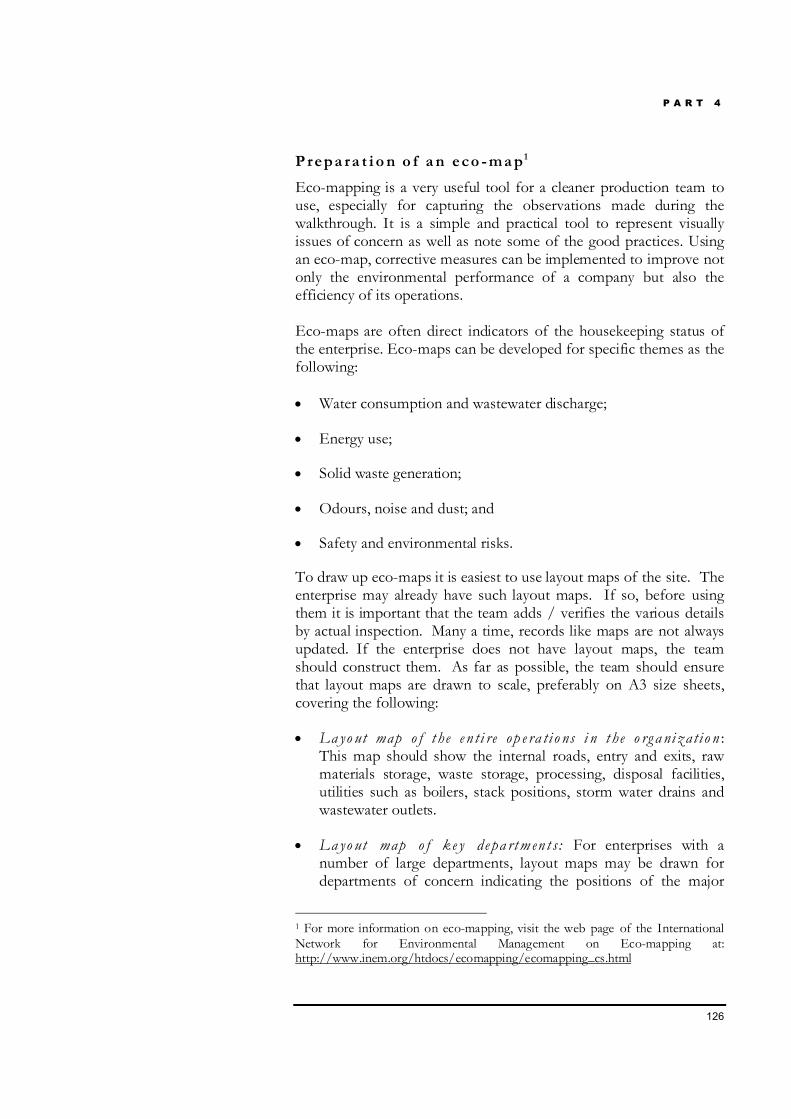
P A R T 4
126
P repa ra t i o n o f a n eco -ma p1
Eco-mapping is a very useful tool for a cleaner production team touse, especially for capturing the observations made during thewalkthrough. It is a simple and practical tool to represent visuallyissues of concern as well as note some of the good practices. Usingan eco-map, corrective measures can be implemented to improve notonly the environmental performance of a company but also theefficiency of its operations.
Eco-maps are often direct indicators of the housekeeping status ofthe enterprise. Eco-maps can be developed for specific themes as thefollowing:
• Water consumption and wastewater discharge;
• Energy use;
• Solid waste generation;
• Odours, noise and dust; and
• Safety and environmental risks.
To draw up eco-maps it is easiest to use layout maps of the site. Theenterprise may already have such layout maps. If so, before usingthem it is important that the team adds / verifies the various detailsby actual inspection. Many a time, records like maps are not alwaysupdated. If the enterprise does not have layout maps, the teamshould construct them. As far as possible, the team should ensurethat layout maps are drawn to scale, preferably on A3 size sheets,covering the following:
• La yo ut map o f t he e n t i re op e ra t i o ns i n t he o rg a niz at i o n :This map should show the internal roads, entry and exits, rawmaterials storage, waste storage, processing, disposal facilities,utilities such as boilers, stack positions, storm water drains andwastewater outlets.
• La yo ut map o f k e y de pa rtm en t s : For enterprises with anumber of large departments, layout maps may be drawn fordepartments of concern indicating the positions of the major
1 For more information on eco-mapping, visit the web page of the InternationalNetwork for Environmental Management on Eco-mapping at:http://www.inem.org/htdocs/ecomapping/ecomapping_cs.html
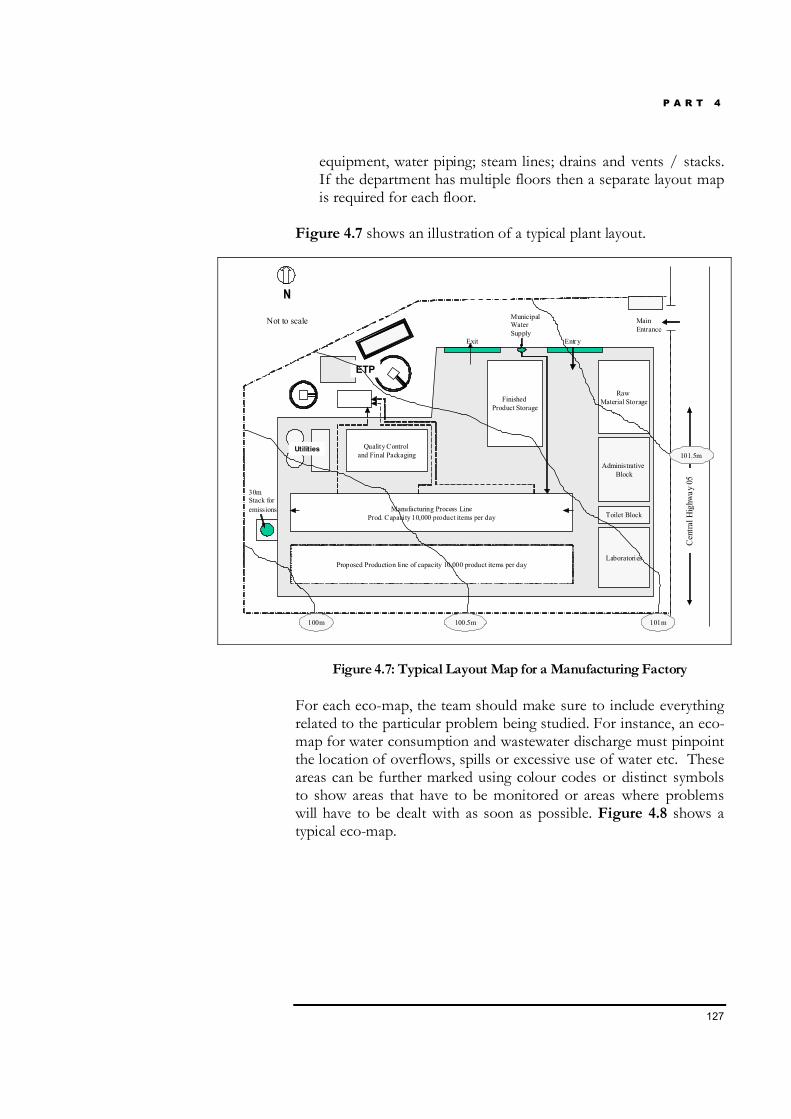
P A R T 4
127
equipment, water piping; steam lines; drains and vents / stacks.If the department has multiple floors then a separate layout mapis required for each floor.
Figure 4.7 shows an illustration of a typical plant layout.
NN
ETP
Finished Product Storage
Raw Material Storage
Manufacturing Process LineProd. Capacity 10,000 product items per day
Administrative Block
Quality Control and Final Packaging
Proposed Production line of capacity 10,000 product items per day
Utilities
Laboratories
Toilet Block
30m Stack for emissions
Cen
tral H
ighw
ay 0
5
MainEntrance
100m 100.5m 101m
Municipal Water Supply
Entr yExit
Not to scale
101.5m
Figure 4.7: Typical Layout Map for a Manufacturing Factory
For each eco-map, the team should make sure to include everythingrelated to the particular problem being studied. For instance, an eco-map for water consumption and wastewater discharge must pinpointthe location of overflows, spills or excessive use of water etc. Theseareas can be further marked using colour codes or distinct symbolsto show areas that have to be monitored or areas where problemswill have to be dealt with as soon as possible. Figure 4.8 shows atypical eco-map.

P A R T 4
128
Figure 4.8: An Illustration of an Eco-Map for Waterin an Electroplating Factory
The team should use eco-maps in the task of problem identification,where visual overlays of eco-maps for various utilities or resourcescan identify problems. Also, they can be used during monitoring andreview, where the eco-map developed b e fo re can be compared withthe updated eco-map after cleaner production optionimplementation so as to examine the change. To ensure that eco-maps continue to serve their purpose, they should be updated once ayear or every time the work site is renovated or operations expanded.
P repa ra t i o n o f a pre l i mi na ry ma t er i a l a nd energ yba la nce
A material and energy (M&E) balance is a basic inventory tool, whichallows for the quantitative recording of material and energy inputs andoutputs. The basis of the material balance is the PFD. An essential stepin the M&E balance is to check that “what goes in must come outsomewhere.” All inputs should thus have related outputs.
Material balances are typically carried out to make an inventory of thematerial flows (raw materials, chemicals, water, energy etc.) entering andleaving a manufacturing / service company. Energy balances are usefulto find options to minimize the use of energy or to recover the energylost in the system.

P A R T 4
129
The first task for the team here is to conduct a preliminary M&E balanceat processes or departments that have been identified in the planningstage as the focus.
Preliminary M&E balances are normally prepared using secondary data,supported by the information recorded during the walkthrough. Waterand energy bills paid give some idea of their consumption levels. On theoutput side, production figures or orders serviced over a certain periodof time can give an estimate of average production. Obtaining figures onwastes and emissions is generally more difficult. Sometimes,concentration data for water and air pollutants exist, which can beestimated back to mass emissions, while data on mass or volumes ofsolid waste are sometimes available. Often, approximate calculations willneed to be used, based on “typical” values given in the literature.
An energy balance is generally carried out through the followingsteps:
1. For each type of fuel used (e.g. electricity, gas, diesel, fuel oil, etc.),write down the amount consumed over a given period, along withthe per unit cost and the total cost for the period, show which of thefuels is used in each area of operations, and show energy flowsbetween the areas.
2. Estimate the proportion of each fuel used in each area of theoperations. To do this, the cleaner production team should prepare alist of the rated energy consumption of the equipment, number ofequipments and the type of the fuel used. Once done for each of theareas, the percentage usage of each fuel in each area can becalculated.
Generally, M&E balances at this level are best set by examining threemonths of data and computing monthly averages. Care should be takento ensure that all quantification is expressed in the right units(preferably SI units), that they are uniform, and that the associatedcosts are provided.
A material balance normallyrequires a tie compound, whichforms the basis for measuringthe efficiency of the processes.The selection of the tiecompound is a function ofseveral possible parameters; itcould be:• An expensive resource• A toxic or hazardous
compound• A resource common to
most of the processes• A parameter which is easy
to measure / record
P A R T 4
130
4.4.4 Assessment
P repa ra t i o n o f det a i led ma t er i a l & energ yba la nce
It is probable that the cleaner production team finds substantialdiscrepancies in the preliminary M&E balance. This may requirerediscussing the assumptions behind the numbers, conductingmeasurements, and making whatever revisions are necessary to the dataused for inputs and outputs. Hence, the next task for the team is toprepare detailed material and energy balances around certain parts of thePFD. Developing a detailed material balance for each operation isneither practical nor relevant. The critical operations are generally chosenbased on:
• The focus of the CPA and results of the preliminary M&E balancearrived at in the earlier steps; and
• The types of materials and processes used; i.e. operations are selectedwhere hazardous materials are used or where materials used areexpensive or where materials are used in quantities exceeding thebenchmarks. Detailed M&E balances are often performed when theprocesses have long operational sequences.
Before concluding the M&E balance it could be extremely useful toassign costs to the materials lost or the waste streams that have beenidentified in the balance. Experience has shown that this could be thesingle most important information in convincing the management ofan enterprise, of the value of cleaner production and securing theircommitment for the next steps. While assigning a monetary value tothe materials or waste streams, the team should consider thefollowing:
• The cost of raw materials / intermediate products / finalproducts lost in the waste streams (e.g., the costs of unexhausteddye in waste dye liquor);
• The cost of energy in waste streams, in terms of the energyconsumed to heat or chill them;
• The cost of treatment / handling / disposal of waste streams,including tipping or discharge fees if any;
• The costs incurred, if any, in protecting the workers andmaintaining safe working conditions (e.g., shop floor exhaustsystems);
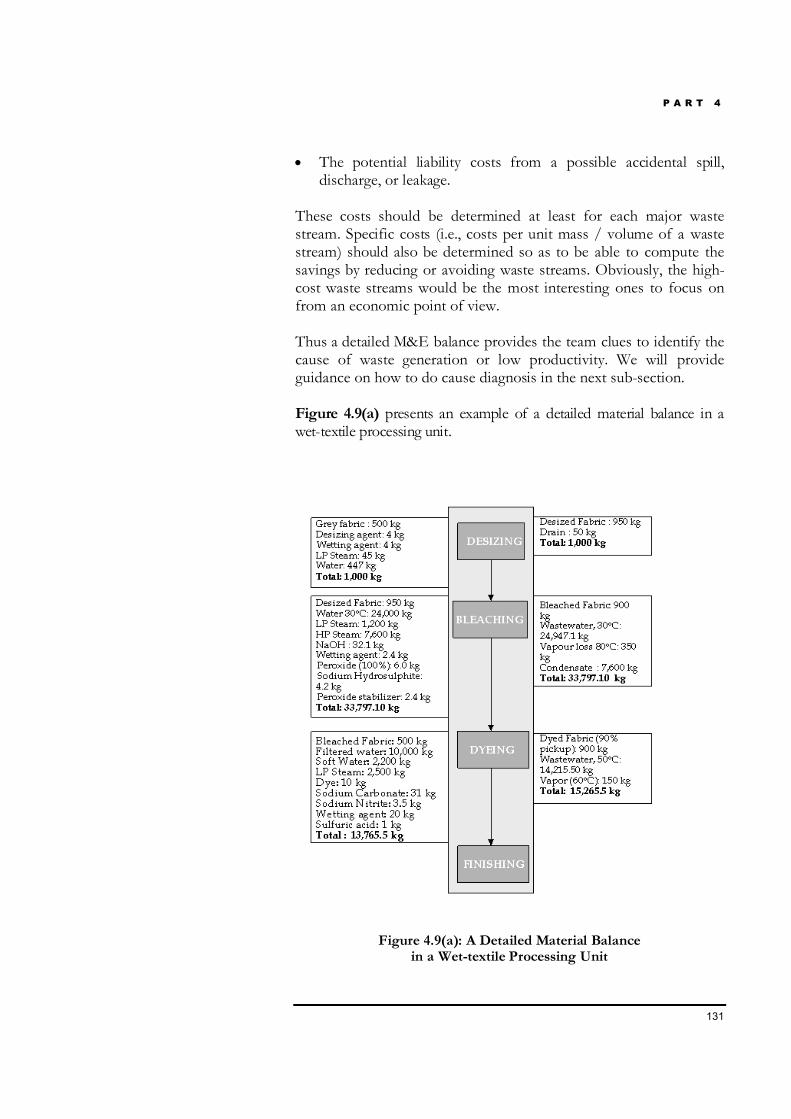
P A R T 4
131
• The potential liability costs from a possible accidental spill,discharge, or leakage.
These costs should be determined at least for each major wastestream. Specific costs (i.e., costs per unit mass / volume of a wastestream) should also be determined so as to be able to compute thesavings by reducing or avoiding waste streams. Obviously, the high-cost waste streams would be the most interesting ones to focus onfrom an economic point of view.
Thus a detailed M&E balance provides the team clues to identify thecause of waste generation or low productivity. We will provideguidance on how to do cause diagnosis in the next sub-section.
Figure 4.9(a) presents an example of a detailed material balance in awet-textile processing unit.
Figure 4.9(a): A Detailed Material Balancein a Wet-textile Processing Unit
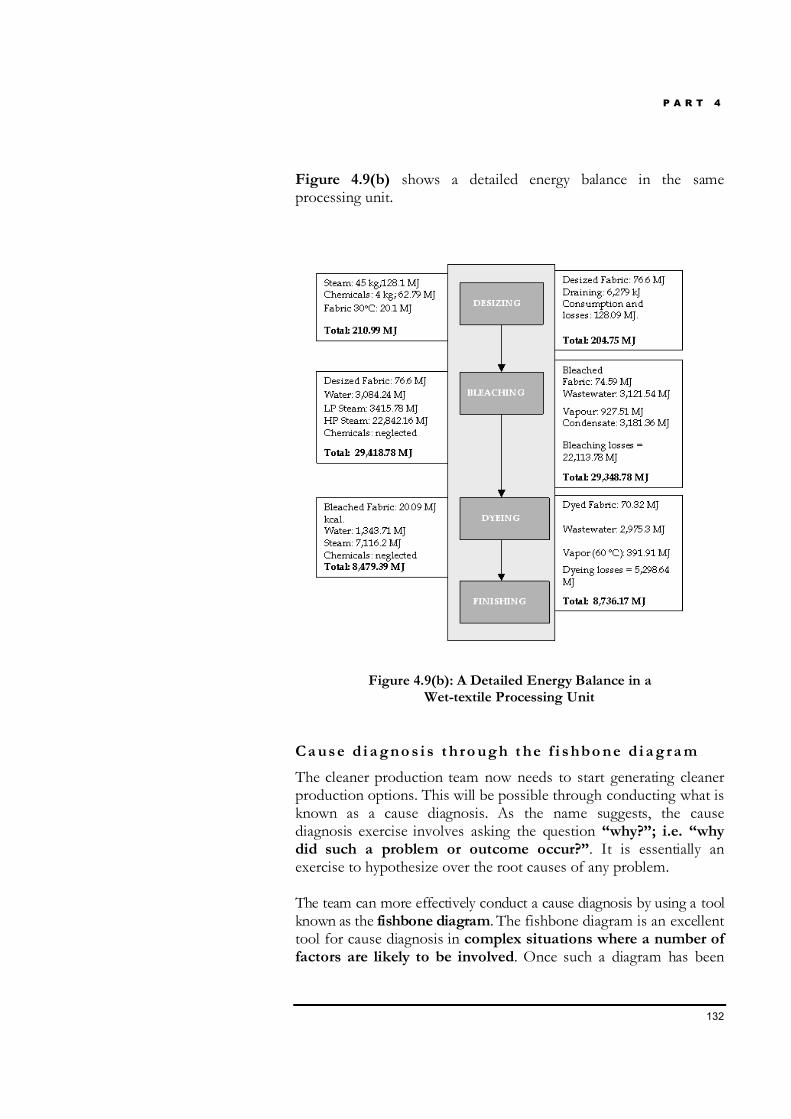
P A R T 4
132
Figure 4.9(b) shows a detailed energy balance in the sameprocessing unit.
Figure 4.9(b): A Detailed Energy Balance in aWet-textile Processing Unit
Ca us e d i a g no s i s t hro ug h t he f i s hbo ne d i a g ra m
The cleaner production team now needs to start generating cleanerproduction options. This will be possible through conducting what isknown as a cause diagnosis. As the name suggests, the causediagnosis exercise involves asking the question “why?”; i.e. “whydid such a problem or outcome occur?”. It is essentially anexercise to hypothesize over the root causes of any problem.
The team can more effectively conduct a cause diagnosis by using a toolknown as the fishbone diagram. The fishbone diagram is an excellenttool for cause diagnosis in complex situations where a number offactors are likely to be involved. Once such a diagram has been
P A R T 4
133
prepared, the team can effectively use it for the generation of cleanerproduction options (explained in more detail in the following sub-sections).
The technique used in preparing a fishbone diagram is given below.We will use the textile dyeing process as an example. Let us assumethat a winch is used as the dyeing equipment.2 Refer to Figure 4.10below.
1. Identify the principal problem that is to be diagnosed andwrite it next to the head of the fish. For instance, one of thecommon problems in textile dyeing is that the shade of the dyedfabric does not match with the shade specified by the client.This is referred to as "low Right First Time (RFT)". This causesexcessive product reject, thus lowering productivity andgenerating waste (improperly dyed cloth).
2. Identify the primary causes of the problem. Primary causes aretypically categorized generically as Man, Method, Materialand Machine. To illustrate further, primary causes to theprincipal problem of low RFT could be:
(a) “Lack of supervision” (Category = Man);
(b) “Dyeing operation not properly carried out” (Category =Method);
(c) “Poor quality of input materials” (Category = Material);and
(d) “Uneven pulling of fabric in the dye liquor” (Category =Machine).
These primary causes are to be listed on the “primary fishbones”, as shown in Figure 4.10.
3. Every primary cause is the outcome of one or more secondarycauses. Consequently, this step involves identifying thesecondary cause(s) attributable to each primary cause. To carry
2 A winch is an open-top machine with a tub-like structure where the fabric in a“rope” form is pulled through a dye liquor for a number of hours. It is one of thecheapest pieces of equipment used for dyeing, and is therefore extensively used bysmall and medium sized enterprises.
P A R T 4
134
the illustration further from point (2b) noted above, the dyeingoperation may not have been properly carried out due to:
(a) Excessive use of salt in the dyeing operation;
(b) Incorrect procedure followed while dosing the chemicals.
Similarly, for point (2c) noted above, the poor quality of inputmaterials may have been the result of:
(c) Impurities in the dyes used for the dyeing operation;
(d) Auxiliaries for the dyeing operation having exceeded theirshelf-life;
(e) Improper storage of fabric used in the dyeing operation; and
(f) Poor quality of water used in the dyeing operation.
These secondary causes are to be listed on the "secondary fishbones", as shown in Figure 4.10.
Note that the technique of identifying the possible primary /secondary causes of any problem involves asking the question"why?"; i.e. "why did such a problem or outcome occur?"
Interestingly, certain causes appear several times in the diagnosisof primary (or perhaps even secondary) causes. Commonexamples in this case include “poor water quality used in thedyeing operation” and “lack of clear and concise workinstructions”. This allows us to identify common causes, whichwhen corrected could resolve several productivity andenvironment related issues. Options that address correction ofthe common causes thus become priority options in drawing theimplementation plan.
The fishbone diagram is complete at this point. Primary andsecondary causes may be colour-coded for the sake of clarity,although this is not a must. Figure 4.10 shows the completedfishbone diagram for the preceding example.
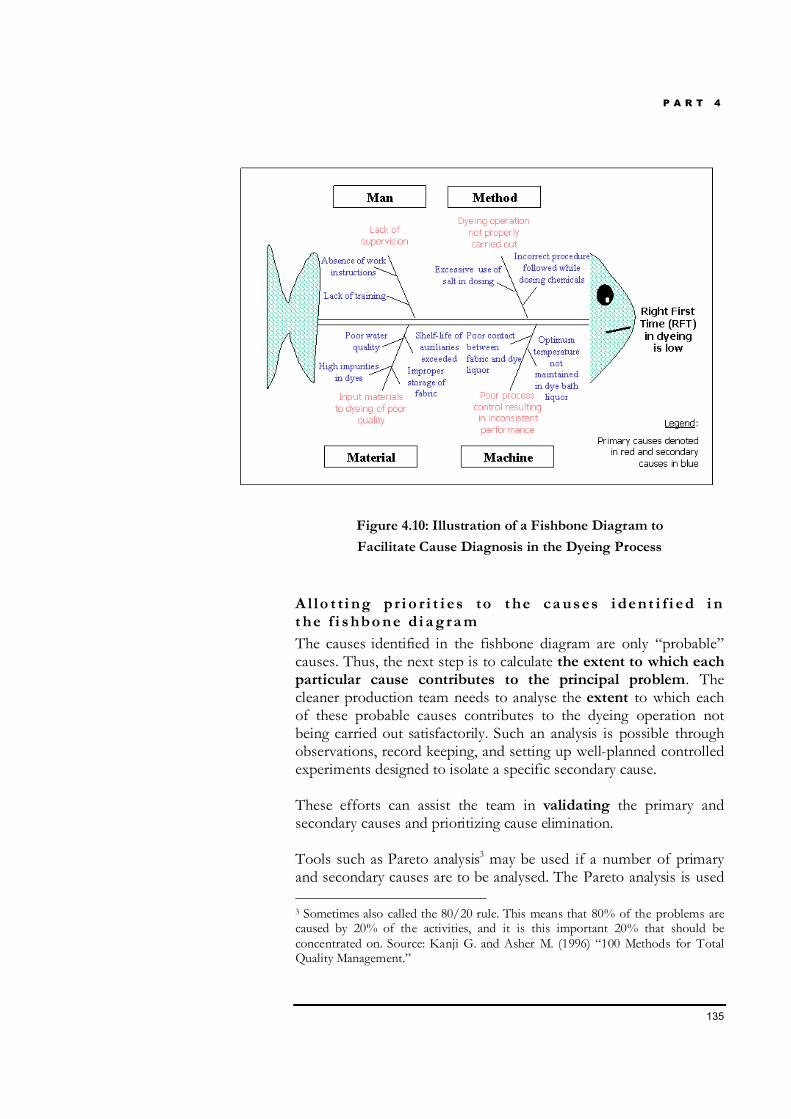
P A R T 4
135
Figure 4.10: Illustration of a Fishbone Diagram to
Facilitate Cause Diagnosis in the Dyeing Process
A l lo t t i ng pr i o r i t i es to t he ca us es i dent i f i ed i nt he f i s hbo ne d i a g ra m
The causes identified in the fishbone diagram are only “probable”causes. Thus, the next step is to calculate the extent to which eachparticular cause contributes to the principal problem. Thecleaner production team needs to analyse the extent to which eachof these probable causes contributes to the dyeing operation notbeing carried out satisfactorily. Such an analysis is possible throughobservations, record keeping, and setting up well-planned controlledexperiments designed to isolate a specific secondary cause.
These efforts can assist the team in validating the primary andsecondary causes and prioritizing cause elimination.
Tools such as Pareto analysis3 may be used if a number of primaryand secondary causes are to be analysed. The Pareto analysis is used 3 Sometimes also called the 80/20 rule. This means that 80% of the problems arecaused by 20% of the activities, and it is this important 20% that should beconcentrated on. Source: Kanji G. and Asher M. (1996) “100 Methods for TotalQuality Management.”
P A R T 4
136
to separate the most important causes of a problem from the manytrivial ones, and thereby identify the most important problems forthe team to concentrate on.
Many cleaner production teams stumble at this juncture, sinceestimating the relative importance of each probable cause seems awearisome task. It cannot be stressed too much that teamsshould be strongly encouraged to push through with this stepcompletely, since it can avoid significant wastage of time (andmoney) later on in the CPA.
Clea ner p ro duct i o n o pt io n g enera t i o n t hro ug hbra i ns t o rmi ng
Once the points of action and priorities are understood and listed,the cleaner production team should move on to the logical nextphase; i.e. option generation.
Option generation is a creative process, and is best performed, as inthe case of the cause diagnosis, by the team as well as the enterprisepersonnel. Including the enterprise personnel in this activity wouldlead them to have a sense of ownership of the generated options anda deeper sense of understanding as to why a certain option is finallyrecommended for implementation. The option generation exercise isconducted through brainstorming, a commonly used tool forgenerating ideas. Given a particular item which needs to be resolved,the team and the enterprise personnel have to deliberate on the waysand means of obtaining a solution to it. In this sense, the causediagnosis described in the earlier section provides a startingframework for the brainstorming exercise.
In a typical brainstorming session, an idea may be proposed by aperson, which may be supported and / or extended by otherpersons. Further discussions yields other new, transformed, opposingand / or supporting ideas, thus paving the way for the generationof cleaner production options. The principle question to be askedduring the brainstorming session is "how?"; i.e. "how does onesolve this particular problem effectively?"

P A R T 4
137
Figure 4.11: Generating Options through Brainstorming
Cleaner production options could fall under one of the followingcategories:
Housekeeping – Improvements to work practices and methods,proper maintenance of equipment etc., fall under this category.Efficient housekeeping can provide significant benefits in terms ofsaving resources. These options are typically low cost and providelow to moderate benefits4.
A simple example of good housekeeping in a dyeing operation is toclean the floors and machines of dirt, grease, rust, etc. regularly,which will reduce the possibility of accidentally soiling the fabric, andthus minimize the need for extra washing.
Management and personnel practices – Management andpersonnel practices include effective supervision, employee training,enhancing operator skills, and the provision of incentives andbonuses to encourage employees to conscientiously strive to reducewaste and emissions. These options are typically low cost and canprovide moderate to high benefits.
4 For more information on housekeeping, refer to the “Good Housekeeping Guidefor Small and Medium-sized Enterprises”. Available as:www.getf.org/file/toolmanager/O16F15343.pdf
P A R T 4
138
Process optimization – Process optimization involvesrationalization of the process sequence, combining or modifyingprocess operations to save on resources and time, and improveprocess efficiency. For instance, certain washing operations may notbe required due to changes in raw materials or product specifications.
Raw material substitution – Primary / auxiliary raw materials canbe substituted if better options exist in terms of costs, processefficiency, and reduced health and safety related hazards. Such anapproach may be necessary if the materials already in use are difficultto source, or become expensive, or come under the purview of newenvironmental or health and safety regulations. In all cases ofmaterial substitution, it is crucial to test the suitability of the newmaterial in terms of environmental and economic benefits, optimumconcentration, product quality, productivity, and improved workingconditions.
For instance, sodium sulphide and acidified dichromate tend to beused as auxiliary agents in the sulphur black textile dyeing process5.However, both these agents are toxic and hazardous to handle. Theirusage may leave harmful residues in the finished fabric and generateeffluents that are difficult to treat and damage the environment. Boththese agents may be safely substituted without a decline in fabricquality, thus eliminating adverse health and environmental impacts.Sodium sulphide may be replaced with glucose or dextrose, whereasacidified dichromate may be substituted with sodium perborate orammonium persulphate. The substitution of chemical dyes withnatural dyes may also be cited as an example of raw materialsubstitution.
New technology – Adopting and transferring new technologies canoften reduce resource consumption, minimize wastes, as well asincrease the throughput or the productivity. These options are oftencapital intensive, but can lead to potentially high benefits.Modifications in equipment design can be another option, whichtends to be slightly less or equally capital intensive as the option fornew technology, and can lead to potentially high benefits.
New product design – Changing the product design can cause impactson both the “upstream” as well as “downstream” side of the product
5 Sulphur black dyes are generally used to produce a jet black colour in cottonfibres. Sulphur dyes are insoluble and must first be converted to a water solubleform by adding an agent – traditionally sodium sulphide – so that the dyes can beabsorbed by the fibre. After dyeing the fabric, the dye is converted back toinsoluble form with the addition of another agent, often acidified dichromates.
P A R T 4
139
life-cycle. Product re-design for instance, can reduce the quantity ortoxicity of materials in a product, or reduce the use of energy, water andother materials during use, or reduce packaging requirements, or increasethe “recyclability” of used components. This can lead to benefits such asreduced consumption of natural resources, increased productivity, andreduced environmental risks. Often, this helps in both establishing aswell as widening the market. Product re-design is, however, a majorbusiness strategy and may require feasibility studies and market surveys,especially if the supply-chain around the product is already establishedand is complex.
Recovery of useful byproducts / resources – This cleanerproduction option entails the recovery of wastes as byproducts /resources, which may have useful applications within the industryitself or outside it. This type of options essentially leads to the reuse/ recycle, and thus minimization, of waste as well as to cost savings.
A common example of recovery from a waste stream for manyindustries is heat recovery through the use of heat exchangers. Suchoptions are typically medium cost and can provide moderate to highbenefits.
Onsite recycling and reuse – Onsite recycling and reuse involvesthe return of a waste material either to the originating process or toanother process as a substitute for an input material.
For instance, in the case of a textile dyeing unit, instead of drainingoff the last cold washes, they can be collected in an undergroundtank, adjusted for pH6, and then filtered prior to reuse in subsequentwashing operations. These options are typically low to medium costand can provide moderate to high benefits.
The team should always be made to remember that in general it isbetter to not generate a waste in the first place, rather than generateit and later recycle or recover / reuse it. Therefore, the teamshould only consider the latter type of options once all theothers that could prevent waste generation have beenexamined.
In reality, many of the options a team will identify result as acombination of the above categories so as to produce cost-effectiveand sustainable results. For instance, any option of new technologyshould be preceded and followed by improvements in management 6 "pH" is a term used universally to express the intensity of an acidic or alkalinesolution.
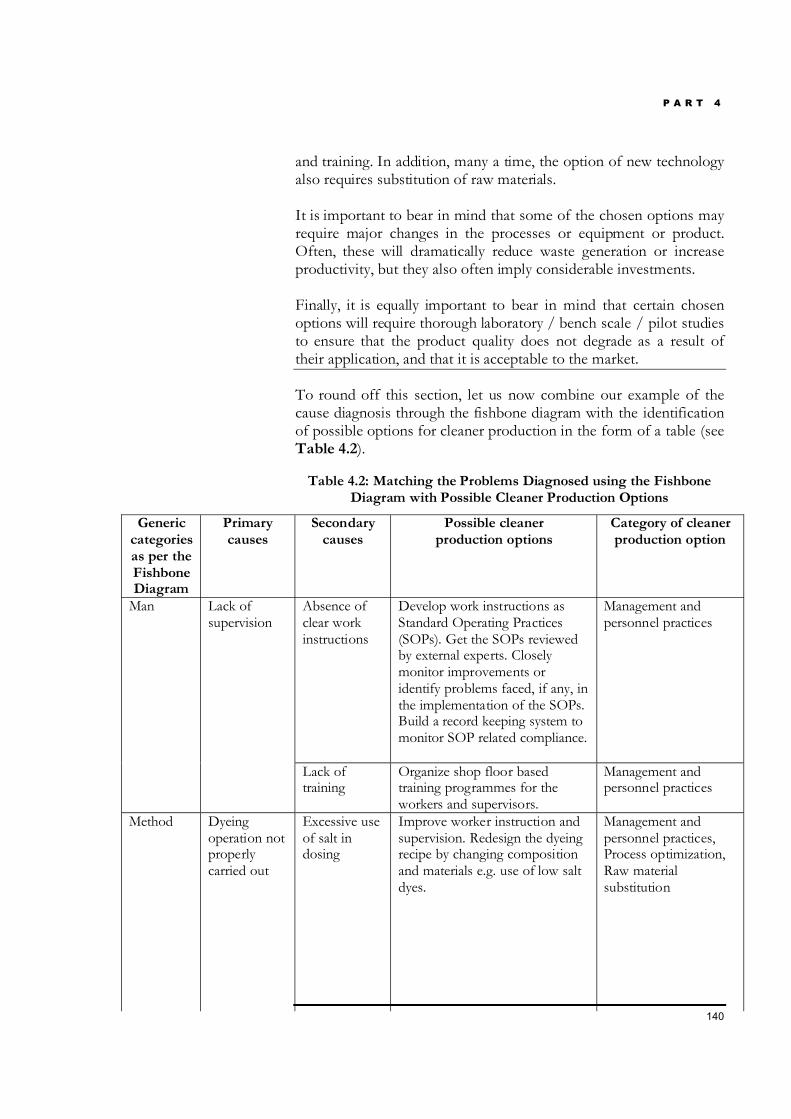
P A R T 4
140
and training. In addition, many a time, the option of new technologyalso requires substitution of raw materials.
It is important to bear in mind that some of the chosen options mayrequire major changes in the processes or equipment or product.Often, these will dramatically reduce waste generation or increaseproductivity, but they also often imply considerable investments.
Finally, it is equally important to bear in mind that certain chosenoptions will require thorough laboratory / bench scale / pilot studiesto ensure that the product quality does not degrade as a result oftheir application, and that it is acceptable to the market.
To round off this section, let us now combine our example of thecause diagnosis through the fishbone diagram with the identificationof possible options for cleaner production in the form of a table (seeTable 4.2).
Table 4.2: Matching the Problems Diagnosed using the FishboneDiagram with Possible Cleaner Production Options
Genericcategoriesas per theFishboneDiagram
Primarycauses
Secondarycauses
Possible cleanerproduction options
Category of cleanerproduction option
Absence ofclear workinstructions
Develop work instructions asStandard Operating Practices(SOPs). Get the SOPs reviewedby external experts. Closelymonitor improvements oridentify problems faced, if any, inthe implementation of the SOPs.Build a record keeping system tomonitor SOP related compliance.
Management andpersonnel practices
Man Lack ofsupervision
Lack oftraining
Organize shop floor basedtraining programmes for theworkers and supervisors.
Management andpersonnel practices
Method Dyeingoperation notproperlycarried out
Excessive useof salt indosing
Improve worker instruction andsupervision. Redesign the dyeingrecipe by changing compositionand materials e.g. use of low saltdyes.
Management andpersonnel practices,Process optimization,Raw materialsubstitution
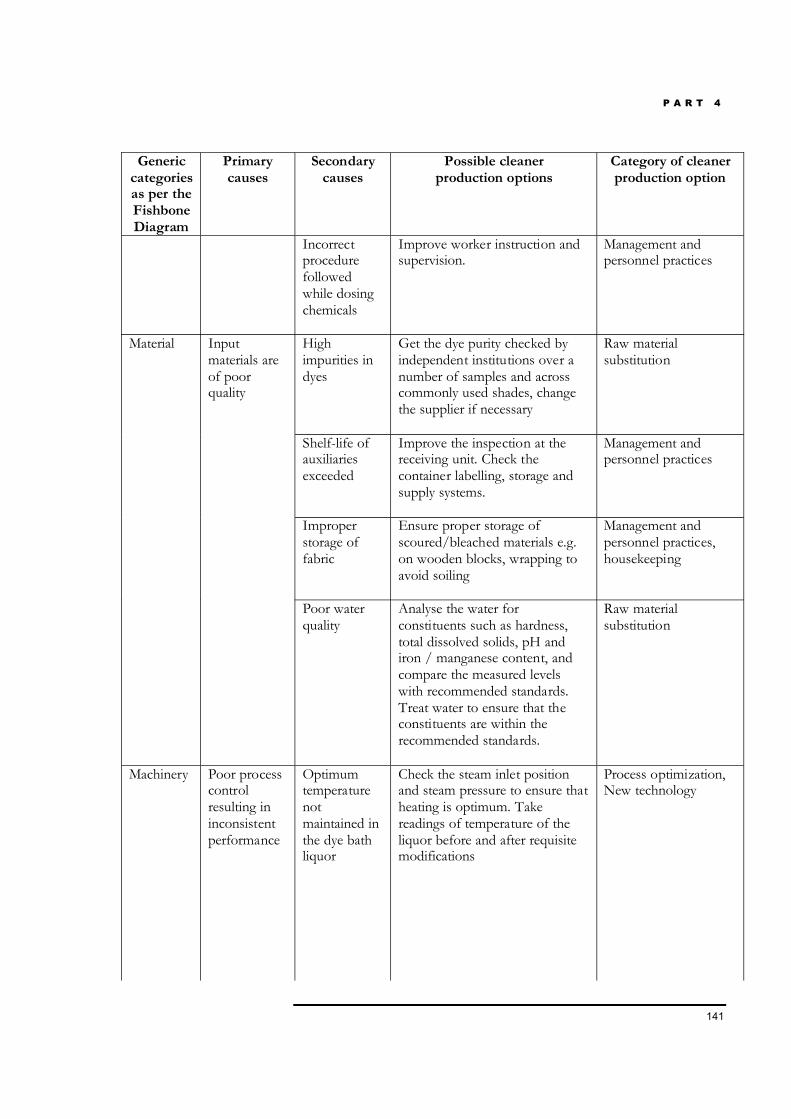
P A R T 4
141
Genericcategoriesas per theFishboneDiagram
Primarycauses
Secondarycauses
Possible cleanerproduction options
Category of cleanerproduction option
Incorrectprocedurefollowedwhile dosingchemicals
Improve worker instruction andsupervision.
Management andpersonnel practices
Highimpurities indyes
Get the dye purity checked byindependent institutions over anumber of samples and acrosscommonly used shades, changethe supplier if necessary
Raw materialsubstitution
Shelf-life ofauxiliariesexceeded
Improve the inspection at thereceiving unit. Check thecontainer labelling, storage andsupply systems.
Management andpersonnel practices
Improperstorage offabric
Ensure proper storage ofscoured/bleached materials e.g.on wooden blocks, wrapping toavoid soiling
Management andpersonnel practices,housekeeping
Material Inputmaterials areof poorquality
Poor waterquality
Analyse the water forconstituents such as hardness,total dissolved solids, pH andiron / manganese content, andcompare the measured levelswith recommended standards.Treat water to ensure that theconstituents are within therecommended standards.
Raw materialsubstitution
Machinery Poor processcontrolresulting ininconsistentperformance
Optimumtemperaturenotmaintained inthe dye bathliquor
Check the steam inlet positionand steam pressure to ensure thatheating is optimum. Takereadings of temperature of theliquor before and after requisitemodifications
Process optimization,New technology
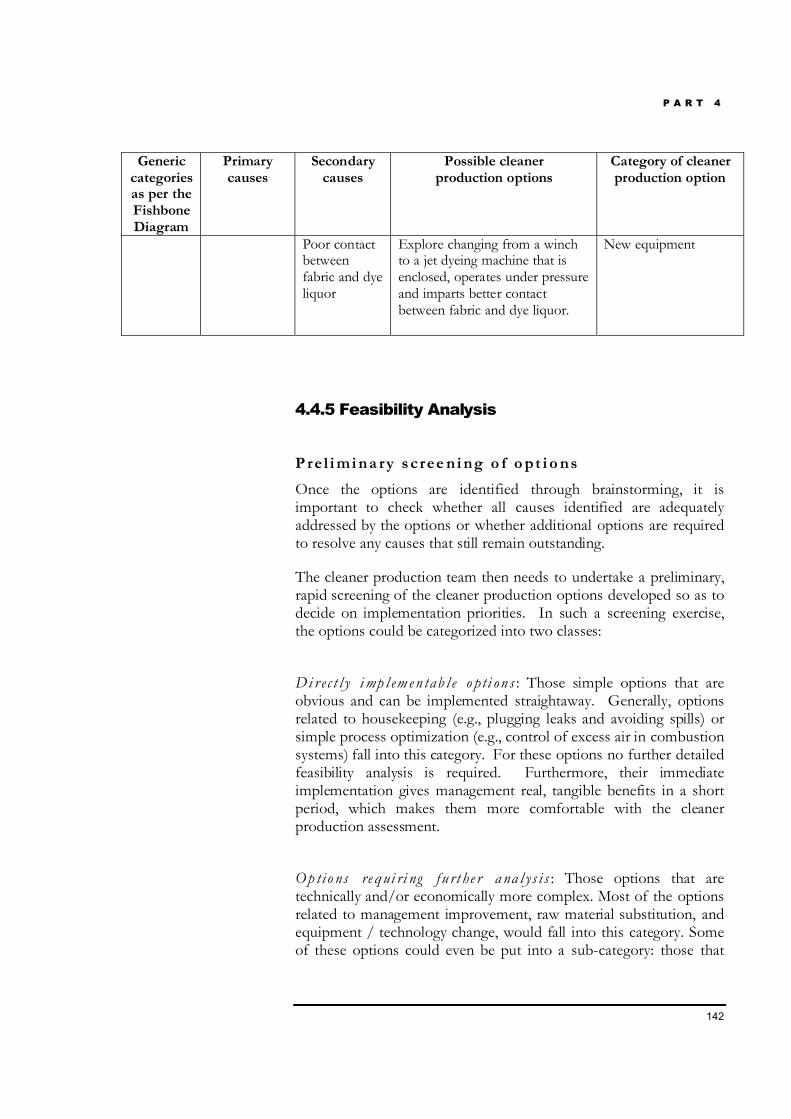
P A R T 4
142
Genericcategoriesas per theFishboneDiagram
Primarycauses
Secondarycauses
Possible cleanerproduction options
Category of cleanerproduction option
Poor contactbetweenfabric and dyeliquor
Explore changing from a winchto a jet dyeing machine that isenclosed, operates under pressureand imparts better contactbetween fabric and dye liquor.
New equipment
4.4.5 Feasibility Analysis
P re l i mi na ry s cree ni ng o f o pt i o ns
Once the options are identified through brainstorming, it isimportant to check whether all causes identified are adequatelyaddressed by the options or whether additional options are requiredto resolve any causes that still remain outstanding.
The cleaner production team then needs to undertake a preliminary,rapid screening of the cleaner production options developed so as todecide on implementation priorities. In such a screening exercise,the options could be categorized into two classes:
Di r ec t l y i mp l em e n tab l e o p t i on s : Those simple options that areobvious and can be implemented straightaway. Generally, optionsrelated to housekeeping (e.g., plugging leaks and avoiding spills) orsimple process optimization (e.g., control of excess air in combustionsystems) fall into this category. For these options no further detailedfeasibility analysis is required. Furthermore, their immediateimplementation gives management real, tangible benefits in a shortperiod, which makes them more comfortable with the cleanerproduction assessment.
Op ti o ns re qui ri ng f u rt he r a na l ys i s : Those options that aretechnically and/or economically more complex. Most of the optionsrelated to management improvement, raw material substitution, andequipment / technology change, would fall into this category. Someof these options could even be put into a sub-category: those that
P A R T 4
143
require much more information collection or are difficult toimplement (due to reasons such as very high costs, lack oftechnology, requiring major changes, etc.). These can be left pendingfor later consideration.
D et a i led s creeni ng o f o pt i o ns
The team can now undertake a detailed screening of the options inthe category requiring further analysis in order to determine which ofthe options are technically feasible, and ascertain both the economicand the environmental benefits of implementing these options. Eachof these aspects is described below.
T echni ca l eva lua t i o n
The technical evaluation should cover the following aspects:
M at e ri a l s and e ne r gy c o ns ump ti o n – For each option, it isimportant to establish material and energy balances for conditionsbefore and after implementation to quantify the materials and energysavings that will result.
P ro d uc t / b yp ro du c t qua li t y – Assess the product / by productquality before and after the implementation of the option.
Rig ht Fi r s t Tim e – Provide estimates on the possibleimprovement of the RFT corresponding to before and after optionimplementation.
It is also important to examine the following aspects from the pointof view of implementation.
H uma n r es ou rc e s r equi r ed – whether the option can beimplemented by in-house staff, or whether external expertise orcollaboration with partner organization is required.
R isk s i n i mp l em e nti n g th e op t i o n - Some options may not befully proven and may require laboratory scale experiments or pilotstudies to assess the outcomes before a full-scale implementation iscarried out. Some options may affect the key production process orproduct features, so the potential impact on the business if the optiondoes not work as planned is very high.
Ea s e o f imp le me n ta t i o n – The technical ease with which anoption can be implemented will depend on such things as the layout
P A R T 4
144
of the production processes and of the auxiliary services such assteam lines, water lines, inert gas lines, etc., the physical spaceavailable, the maintenance requirements, the training requirements,etc. Also, if options require working on key production processes,the timing of the options’ implementation becomes critical. If theoption requires major changes in, or interruptions to, productionpatterns, any loss in production needs to be factored into theeconomic analysis of the option.
T im e r e qui re d fo r impl e me n ta t i o n – Time required if equipmentor material needs to be procured, installed or commissionedincluding consideration of shut-down time for affecting theimplementation of the option.
C ros s -l i nk ag es wi t h o t he r op t i o ns – Whether a particular optionis linked to implementation of other options and / or whether theoption is best implemented stand-alone or in consideration withother options.
Env i ro nment a l eva lua t i o n
The environmental evaluation of an option should ideally take intoaccount its impacts on the entire lifecycle of a product or a service,wherever practically possible. In practical situations, however, theevaluation is often restricted to on-site and off-site (neighbourhood)environmental improvements.
The environmental evaluation should include estimation offollowing benefits that each option can bring about:
• Likely reduction in the quantity of waste/emission released(expressed on a mass basis);
• Likely reduction in the release of hazardous, toxic, or non-biodegradable wastes/emissions (expressed on a mass basis);
• Likely reduction in the consumption of renewable naturalresources (expressed on a mass basis);
• Likely reduction in consumption of non-renewable naturalresources, e.g. fossil fuels consumed (expressed on a mass basis);
• Likely reduction in noise levels;
P A R T 4
145
• Likely reduction in odour nuisance (due to elimination of anodorous compound);
• Likely reduction in the on-site risk levels (from the point ofprocess safety);
• Likely reduction in the release of globally important pollutants,viz. ozone depleting substances, greenhouse gas emissions.
Eco no mi c eva lua t io n
The team must now evaluate the economic benefits of all thereductions in waste generation and resource consumption that eachoption can bring about. It must estimate the immediately obvioussavings in the purchase costs of materials and fuels, the treatmentand disposal costs avoided as well as the material and waste streamcosts (identified during the M&E balance earlier). However, it mustalso estimate less obvious financial benefits such reduced sick daysfor workers or generally higher worker productivity, lower personnelcosts from reducing the burden of special management and reportingof hazardous materials, wastes and pollution, reduced worker andenvironmental liability, potential profits from sale of waste as by-product, from carbon dioxide credits, etc. Experience has shown thatsuch an e xp ande d financial assessment often helps in considerablyimproving the economic feasibility of an option.
The team must also estimate the economic costs of each option, inthe form of investments in new technology or equipment, but also interms of training and other costs ancillary to the implementation ofthe option.
These benefits and costs are then analyzed and computed usingvarious evaluation criteria [e.g. pay back period, Net Present Value(NPV), Internal Rate of Return (IRR), etc.].
A simple payback period is evaluated based on a comparison of theannual savings and the initial investment. It simply indicates the timeperiod to return the initial investment.
It is calculated as,
Payback Period in years = (Capital Investment/AnnualSavings)
P A R T 4
146
The payback period should be generally considered only as a ballparkassessment as it ignores depreciation of the investment made and thetime value of money. Usually, investment decisions can only be madeon the basis of payback period alone if the investment required islow and / or the returns are high so that the payback period is lessthan two years.
If these conditions are not met, a better approach is to use theconcepts of NPV or IRR. These concepts consider the time value ofcash inflows and outflows during the useful life of the investmentmade. This kind of economic evaluation requires information on:
• The capital costs associated with any investments required;
• Net revenue, which is computed as a difference between totalrevenue (that could be higher than the base case) and the operatingcosts (that are typically lower in the changed scenario); and
• Rates of interest and depreciation to enable computation of thePresent Value.
The following are the equations that can be used for computation ofNPV:
∑=
= ++−=
ni
i ii
rCashflowNet
CFNPV00 )1(
)(
CFo = Cash outflow in the first year (capital investment)r = opportunity cost of capital (i.e. for a rate of 10% ‘r’ would be 0.1)n = useful life of the investment in years
For an investment to be financially viable NPV must be greaterthan zero.
Another indicator commonly used along with NPV is theProfitability Index (PI). PI is computed as the ratio of the presentvalue of the total cash inflows to the present value of the total cashoutflows. For an investment to be financially viable, PI must begreater than 1.
IRR is essentially that rate of return on an investment that ensuresthat during the investment’s lifetime the net cash inflows (i.e. inflows– outflows) are equal to zero, i.e., IRR is the value of r that gives zeroas the value of NPV:
P A R T 4
147
∑=
= ++−=
ni
i ii
rCashflowNet
CFNPV00 )1(
)( = 0
This problem is solved by assuming r and then following aninterpolation procedure. The IRR is then compared with the rate ofinterest of the borrowings that may be needed from the market.Typically, if the IRR is lower than the market borrowing rate, thenthe investment is not considered to be financially viable.
It is useful to carry out a sensitivity analysis to understand the“ruggedness” of an option. This can be done by varying the expectedefficiencies or yields, prices that the by-products may fetch in themarket, or the capital costs of new equipment, and see how much ofan effect these have on the outcome. This can help in building bothoptimistic and pessimistic scenarios to test how sensitive the IRR orNPV are to the data assumed in the economic analysis.
Consider an example of changing six existing winch machines tothree jet dyeing machines at a textile dyeing unit. Jet dyeing machinesare superior to winch machines in productivity, resourceconsumption, dyeing quality and versatility. Effectively, three jetmachines will result in the same level of production as will six winchmachines.
Figure 4.12 presents a cash flow diagram showing various inflowsand outflows. The results of payback, NPV and IRR are also given.
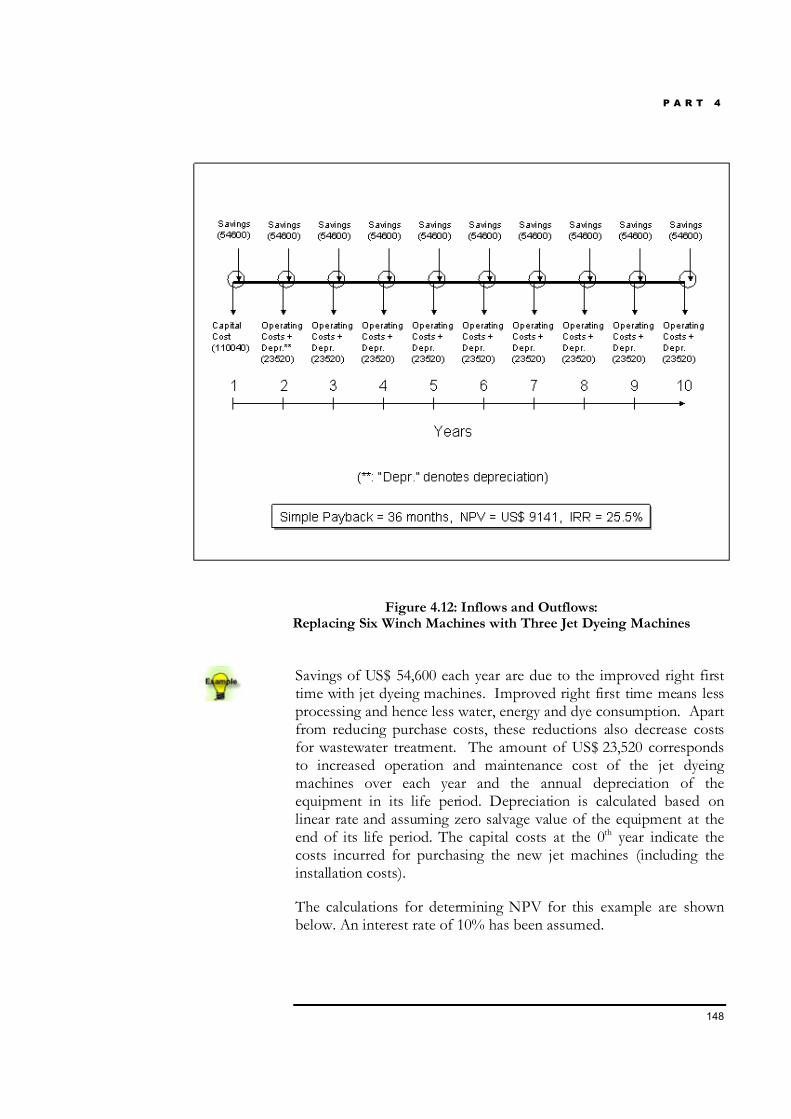
P A R T 4
148
Figure 4.12: Inflows and Outflows:Replacing Six Winch Machines with Three Jet Dyeing Machines
Savings of US$ 54,600 each year are due to the improved right firsttime with jet dyeing machines. Improved right first time means lessprocessing and hence less water, energy and dye consumption. Apartfrom reducing purchase costs, these reductions also decrease costsfor wastewater treatment. The amount of US$ 23,520 correspondsto increased operation and maintenance cost of the jet dyeingmachines over each year and the annual depreciation of theequipment in its life period. Depreciation is calculated based onlinear rate and assuming zero salvage value of the equipment at theend of its life period. The capital costs at the 0th year indicate thecosts incurred for purchasing the new jet machines (including theinstallation costs).
The calculations for determining NPV for this example are shownbelow. An interest rate of 10% has been assumed.
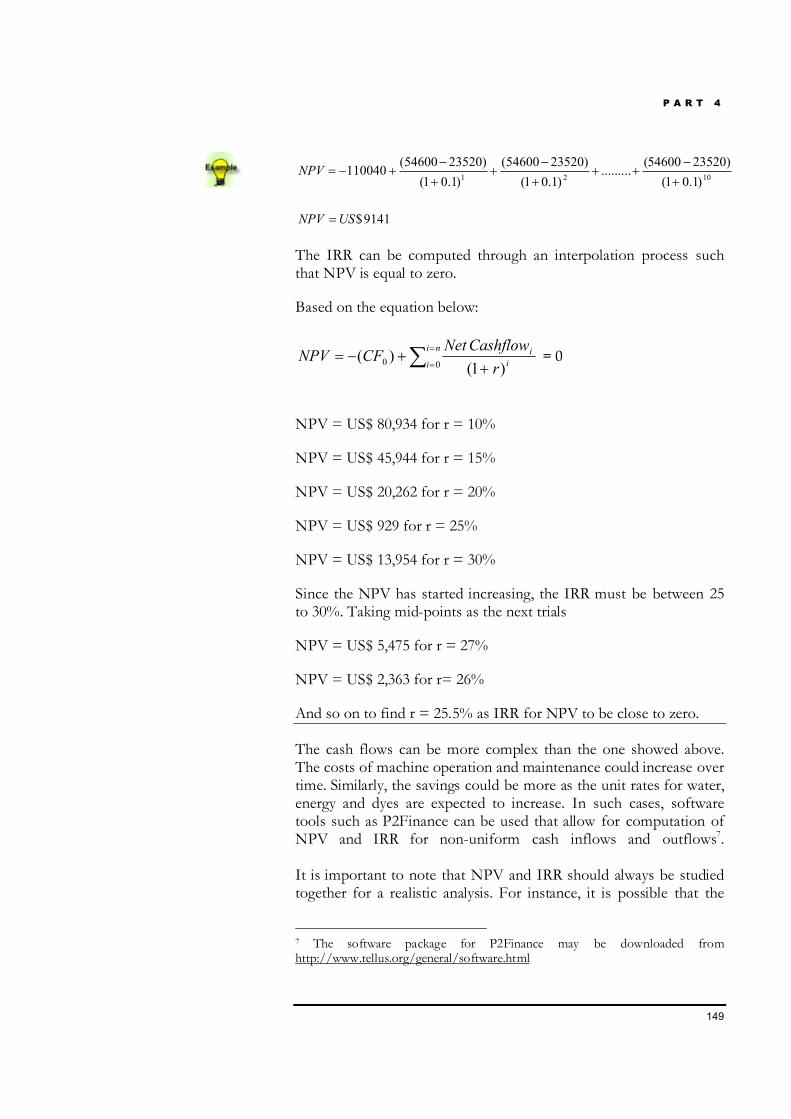
P A R T 4
149
1021 )1.01()2352054600(.........
)1.01()2352054600(
)1.01()2352054600(110040
+−
+++−
++−
+−=NPV
9141$USNPV =
The IRR can be computed through an interpolation process suchthat NPV is equal to zero.
Based on the equation below:
∑=
= ++−=
ni
i ii
rCashflowNet
CFNPV00 )1(
)( = 0
NPV = US$ 80,934 for r = 10%
NPV = US$ 45,944 for r = 15%
NPV = US$ 20,262 for r = 20%
NPV = US$ 929 for r = 25%
NPV = US$ 13,954 for r = 30%
Since the NPV has started increasing, the IRR must be between 25to 30%. Taking mid-points as the next trials
NPV = US$ 5,475 for r = 27%
NPV = US$ 2,363 for r= 26%
And so on to find r = 25.5% as IRR for NPV to be close to zero.
The cash flows can be more complex than the one showed above.The costs of machine operation and maintenance could increase overtime. Similarly, the savings could be more as the unit rates for water,energy and dyes are expected to increase. In such cases, softwaretools such as P2Finance can be used that allow for computation ofNPV and IRR for non-uniform cash inflows and outflows7.
It is important to note that NPV and IRR should always be studiedtogether for a realistic analysis. For instance, it is possible that the
7 The software package for P2Finance may be downloaded fromhttp://www.tellus.org/general/software.html

P A R T 4
150
absolute returns from an investment are more than those of anotherinvestment even when the IRR value for the former is lower than thelatter. Thus a study of the IRR alone could be misleading whiledeciding the investment options.
4.4.6 Implementation of Cleaner Production OptionsThe three evaluations help to eliminate options that are not viable.The remaining options may be considered in the preparation of acleaner production implementation plan.
P r i o r i t i za t io n o f c lea ner pro duct i o n o pt io ns
In most cases, after conducting the feasibility analysis, it will emergethat different options have differing levels of technical feasibility,economic viability, and environmental performance. Since it is notdesirable to implement all the options at the same time it will benecessary for the team to prioritize the cleaner production options.To assist the process of prioritization, a common evaluationframework will be necessary. A weighted-sum method could beconsidered for this purpose.
In this method, the team will assign weights to each of the threeaspects of the feasibility analysis (technical feasibility, economicalviability, environmental performance). These weights could bedecided through a brainstorming session and involving the topmanagement. The weights will vary from enterprise to enterprise,depending on their technical competence, financial conditions,environmental sensitivity etc. For example, a financially healthysmall-scale enterprise facing considerable environmental pressuresmay decide to give the highest weightage to environmentalperformance (say, 50%), less to technical feasibility (say, 30%) andleast to financial viability (the remaining 20%). This indicates thatthe enterprise is most keen to reduce pollution load but does nothave high levels of capability to undertake technically involvedoptions.
Once weights are assigned, simple indicators such as “scores” can bedeveloped to assess the relative performance of each option. Forexample, economic viability could be assessed based on the paybackperiod / NPV / IRR. Environmental performance could beassessed based on percent pollutant load reduction. Technicalfeasibility could be assessed based on technical complexity,requirements for new equipment / technology, requirement ofadditional technical skills, etc. Each option is then evaluated on a
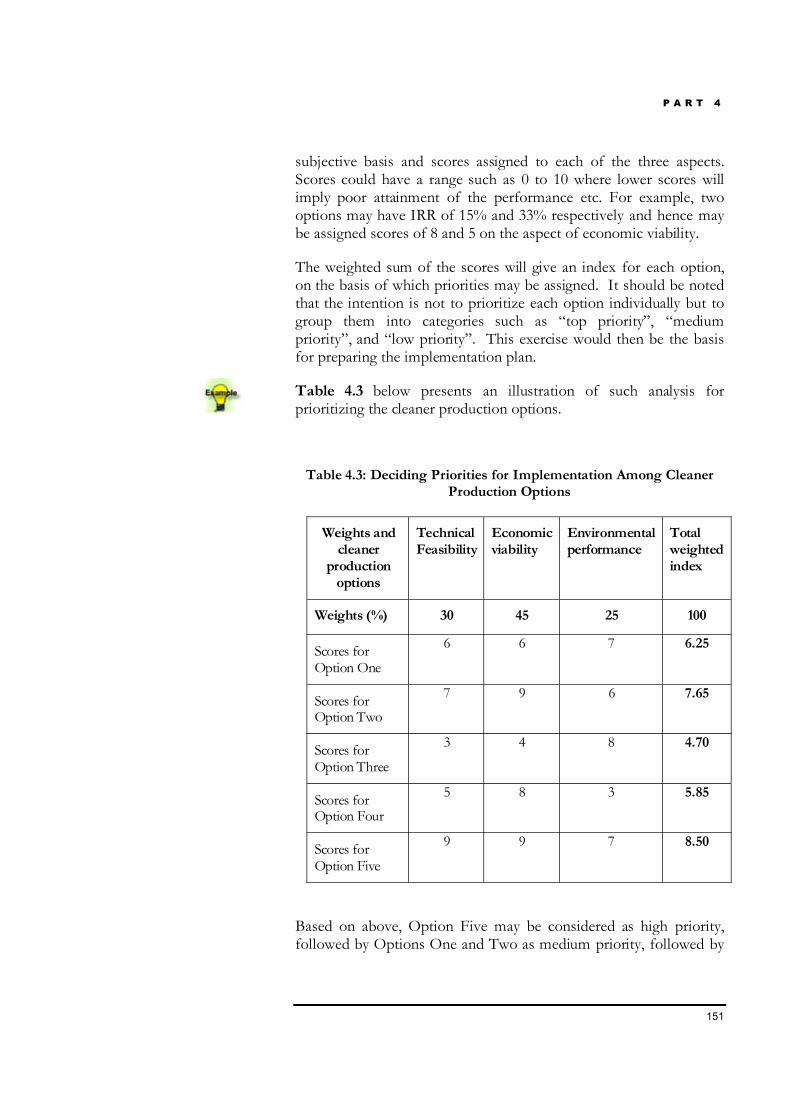
P A R T 4
151
subjective basis and scores assigned to each of the three aspects.Scores could have a range such as 0 to 10 where lower scores willimply poor attainment of the performance etc. For example, twooptions may have IRR of 15% and 33% respectively and hence maybe assigned scores of 8 and 5 on the aspect of economic viability.
The weighted sum of the scores will give an index for each option,on the basis of which priorities may be assigned. It should be notedthat the intention is not to prioritize each option individually but togroup them into categories such as “top priority”, “mediumpriority”, and “low priority”. This exercise would then be the basisfor preparing the implementation plan.
Table 4.3 below presents an illustration of such analysis forprioritizing the cleaner production options.
Table 4.3: Deciding Priorities for Implementation Among CleanerProduction Options
Weights andcleaner
productionoptions
TechnicalFeasibility
Economicviability
Environmentalperformance
Totalweightedindex
Weights (%) 30 45 25 100
Scores forOption One
6 6 7 6.25
Scores forOption Two
7 9 6 7.65
Scores forOption Three
3 4 8 4.70
Scores forOption Four
5 8 3 5.85
Scores forOption Five
9 9 7 8.50
Based on above, Option Five may be considered as high priority,followed by Options One and Two as medium priority, followed by
P A R T 4
152
Options Three and Four. Such a method of prioritization helps inthe development of an implementation plan.
P repa r i ng a c lea ner pro du ct i o n i mplement a t i o npla n
An implementation plan consists of the organization of the projectsrequired to implement the options, the mobilization of the necessaryfunds and human resources, and logistics. Training, monitoring andestablishment of a management system such as EMS are also oftenimportant components of an implementation plan.
The implementation plan should clearly define the timing, tasks andresponsibilities. This involves:
• Prioritizing implementation of options depending on availableresources;
• Preparing the required technical specifications, site preparation,preparing bidding documentation, short-listing submissions, etc.;and
• Allocating responsibilities and setting up monitoring/reviewschedules.
The cleaner production team should give first priority toimplementing options that are low in cost, easy to implement and /or are a pre-requisite for the implementation of other options. Thisshould be followed by options that require more investment,laboratory or pilot trials, or interruption in production schedules.
Many a time, options are implemented during or immediately afterthe CPAs at enterprises. The very conduct of a CPA in this formbecomes a demonstration for others to follow.
Sus t a i n i ng c lea ner pro duct i o n a s s es s ment
The application of CPA and implementation of cleaner productionoptions will often require changes in the organization and managementsystem of the enterprise.
The key areas of changes are: integration of new technical knowledge;understanding new operating practices, laying down revised purchasingprocedures, installing and operating new equipment, or changing thepackaging and marketing of the products / by-products. These changes

P A R T 4
153
will include modified preventive maintenance schedules, wastesegregation and recycling practices, etc.
It is important, therefore, to ensure that the CPA is implemented as anon-going activity, by integrating the concept of cleaner production intothe enterprise’s management system.
P A R T 4
154
4.5 Demonstration Projects
4.5.1 Introduction
Experience has indicated that the best way to persuade enterprises andinstitutions to adopt and implement cleaner production is by showingthem the results from practical demonstrations. A common barrier tocleaner production is the lack of local examples demonstrating thatcleaner production can be applied in the local context to any industrialsector and that waste can be turned into profit. Local entrepreneurs areusually not aware of the scope and potential of cleaner production. A keyactivity of CPCs, particularly in the beginning, is in-plant demonstrationprojects, which assist volunteer local companies undertake a CPA and toimplement the results, and publicize the results of the CPA to as manyother companies as possible.
Generally speaking, a demonstration project is the operation of somehardware (typically a technology, but also materials) or the use ofsoftware (for instance, a methodology) that is innovative. Sometimes ademonstration may be warranted because the hardware or software wasdeveloped or proven elsewhere but has not been yet adapted to the localsituation. Sometimes a demonstration may be needed because notenough technical and financial information is available onimplementing the hardware or software. Finally, demonstration mayinvolve a hardware or software that has an element of risk of theunknown that dissuades stakeholders from its application. Ademonstration in this case is essentially a confidence building measure.
Many a time, demonstration projects are considered as means to prove anew technology; e.g. an efficient process or equipment. In the UNEP /UNIDO NCPC Programme, demonstration projects are not intendedfor this purpose. Demonstration projects are basically to showcase amethodology; viz. CPA.
4.5.2 An Overview of Cleaner ProductionDemonstration Projects
In the early stages, i.e. 1990-1995, demonstration projects were basicallycatalyzed through several donor-assisted programmes on cleanerproduction. These projects were more or less technology-equipmentdriven and were launched to facilitate the dissemination of results to
During 1997-98, in-plantassessments carried out by theNational Cleaner ProductionCentres in China, Mexico, theCzech Republic, the SlovakRepublic, Hungary, Zimbabwe,India, for 71 enterprises(comprised of 35 small- andmedium-sized enterprises, 25large enterprises, 11 non-industrial establishments)showed that about 80% of thecleaner production optionsidentified pertain to thecategories of good housekeeping,better process control andequipment/hardwaremodification/replacement. Ofthe total options identified, 64%were implemented during theduration of the demonstrationproject.
P A R T 4
155
convince industries of the economic and environmental benefits ofcleaner production. The manufacturing sectors where most of thedemonstrations were carried out were textile industries, pulp and paperindustries, metal finishing works and tanneries.
One of the early demonstration projects was PRISMA8. This project waslaunched in 1988. It had two principal objectives:
• To show the Dutch industry that the prevention of waste andemissions is possible in the short term and that it offers benefitsto both companies and the environment.
• To formulate recommendations for an effective pollutionprevention policy.
In many ways, PRISMA created the framework for all cleanerproduction demonstration projects that followed.
Some other trend-setting demonstration projects have been DESIRE9 inIndia (implemented by National Productivity Council, New Delhi, withUNIDO), ProduksiH in Indonesia (implemented by the IndonesiaEnvironmental Impact Management Agency, or BAPEDAL, with thesupport of Gesellschaft für Technische Zusammenarbeit GmbH orGTZ, Germany), and SEAM10 in Egypt (implemented by the EgyptianEnvironmental Affairs Agency or EEAA with the support ofDepartment for International Development, or DfID, UK).
Many of the early demonstration projects on cleaner production werefully funded through grants, principally from the international donoragencies cited above, so that the participating enterprises were notrequired to make a financial commitment. However, the current trend isto require a formal assurance from enterprises that agree to participate(in the form an MOU or otherwise) to commit human resources andsometimes a small, nearly token, amount of money, to ensure meaningfulparticipation in the demonstration and ownership of the results, as wellas continuation of cleaner production activities after the demonstration isover.
8 The acronym “PRISMA” stands for “Project Industriele Successen MetAfvalpreventie”.9 The acronym “DESIRE” stands for “Diverse, Environment, Simple, Innovative,Rational, and Economical”.10 The acronym “SEAM” stands for “Support for Environmental Assessment andManagement”.
“Do not make themistake of imposingyourself as a fault-findingspecialist. It is notenough to identify cleanerproduction opportunities;company personnel haveto implement them forthe demonstration projectto be successful. Try toget the words from theirmouth.
Make them own thecleaner productionoptions as if they havedeveloped them. Thenyou have a fair chance ofgetting it implemented.”
- India NCPC
P A R T 4
156
The Asian Productivity Organization, or APO, based in Tokyo, hassupported a number of Green Productivity Demonstration Projects(GPDP), which are very similar to cleaner production demonstrationprojects, in various Asian countries. The United States Agency forInternational Development (USAID) under the Environmental PollutionPrevention Project (EP3), which concluded in 1998, the WorldEnvironment Centre (WEC) and the World Cleaner Production Society(WCPS), have all co-financed and facilitated a large number ofdemonstration projects in various regions.
The results of all these demonstrations generally have been positive, andcase studies / fact sheets have been prepared for distribution or havebeen uploaded on web sites for wider dissemination. Videos that showinterviews with the industry personnel and the facilitators have also beenprepared in several cases.
Most of the cleaner production demonstration projects have primarilyfocused on preventing or reducing waste or pollution, or increasingefficiency. Issues such as market access, supply chain requirements,occupational safety and health, and community participation have oftennot been adequately covered, if at all. An exception is the SEAMProgramme in Egypt, which has supported demonstration projectsfocusing on protecting / widening Egyptian exports to the EuropeanUnion and US markets by securing ecolabels. The demonstrations herehave shown that the companies not only secured ecolabels and widenedtheir export market, but also increased their productivity and cut downcosts of input resources.
In general, cleaner production demonstration projects have taken placein the manufacturing sector. Promoting demonstrations in the servicesectors and communities is a recent phenomenon. APO has, forinstance, initiated Green Productivity Demonstration Projects in thetourism sector and has set up demonstrations in communities inVietnam. The Cleaner Production and Industrial Efficiency (CPIE)project in Thailand, supported by the Asian Development Bank (ADB),is demonstrating the utility of the 5S11 concept for implementing cleanerproduction in a small textile printing company.
11 Based on Japanese words that begin with ‘S’ (Seiri = organization, Seiton =neatness, Seiso = cleaning, Seiketsu = standardization, and Shitsuke = discipline), the5S Philosophy focuses on effective work place organization and standardized workprocedures. 5S can simplify your work environment, reduces waste and non-productive activity while improving quality, efficiency and safety. Refer to: OsadaT. (1991) “The 5S’s – Five Keys to a Total Quality Environment.”
P A R T 4
157
Cleaner production demonstration projects have always been a strongelement of the UNIDO/UNEP NCPC Programme. As stated earlier, inthis programme, emphasis is given to demonstrating a methodologyrather than technology, new materials, know-how, or equipment. Thisconcept has been now adopted by other programmes as well. Forinstance, in the Cleaner Production and Industrial Efficiency (CPIE)project supported by Asian Development Bank, the demonstrationproject at a textile printing factory consisted of implementing the 5Smethodology, and showing the environmental and economic benefits ofdoing this. In a study conducted in 1994/95, the Danish InternationalCooperation Agency (DANIDA)12 has emphasized that the effectivenessof demonstration projects is limited if the concept is confined to anarrow technical approach.
4.5.3 Benefits of Demonstration Projects
The primary objective of the demonstration projects is to show, at thelocal level, the potential, relevance and applicability of cleaner productionapproaches, with a view to encouraging their wider adoption across thetarget stakeholders.
In this perspective, the demonstration projects have several side-benefitsfor the centres:
• They provide the Directors with an opportunity to build locallyrelevant case studies for preparing content for awareness-raisingmaterials. In this sense, demonstration projects are an awareness-raising mechanism.
• Demonstration projects help CPCs to widen their market.Enterprises that participate in the demonstration realize the “cleanerproduction advantage” and help in spreading the message across thesector or in the geographical cluster.
• They provide an opportunity for the centre staff to understand andbe trained in CPA and implementation methods, especially in theearly years of operation.
• They help in establishing partnerships and networks with localconsultants. This enables the centre to build up a group of experts
12 “Analysis of Donor programmes for promotion of Environmental Management,Pilot Programme for Promotion of Environment Management in the PrivateSector of Developing Countries”, GTZ, April 1998.

P A R T 4
158
who can undertake further cleaner production assessments anddemonstrations.
• They help in building capacities at the participating enterprises tosustain cleaner production.
• Finally, they help in building the centre’s “consultant qualifications”that will help in marketing the centre’s services.
4.5.4 Preparatory Activities
I dent i f i ca t io n o f t he s ta k eho lders i n t hedemo ns t ra t i o n pro jec t
Other than the enterprises themselves, which will be the “guinea pigs”for a demonstration project, the stakeholders in a demonstration projecttypically include:
• Enterprise associations;
• Relevant research / technology institutions;
• Financing institutions; and
• The Cleaner Production Centre.
Generally, regulatory agencies are not involved as stakeholders since theirinvolvement can create barriers.
Se lec t i ng t he ent er pr i s es
Selection of enterprises is often the key to a successful demonstrationproject. The enterprises are generally identified by examining the prioritysectors of economic activities, size and geographical distribution of theenterprise and prevailing environmental problems.
The PROPEL13 Programme [in Colombia, supported by theInternational Network for Environmental Management (INEM),Germany] and SEAM / Egypt (supported by DfID in partnership withEEAA) completed sectoral reviews at the outset to identify prioritysectors, and then identified geographic locations and facilities of
13 The acronym “PROPEL” stands for “Promoción de la Pequeña Empresa Eco-Eficiente Latinoaméricana”.
P A R T 4
159
importance to which to propose demonstration projects. USAID’s EP3programme in Indonesia focused on areas that were relevant to manysmall and medium scale enterprises of a particular sector of focus.
In these cases, sectors for demonstrations were chosen on the groundsof economic and environmental importance, current technology andfinancial absorption capabilities, as well as the magnitude of populationsdependent on the sector for employment.
It is extremely important for Directors to choose very carefully theenterprises that will participate in a demonstration project. If participantsdo not actively participate then the value of the whole demonstrationproject is jeopardized. With experience, existing Centres have evolvedvarious strategies to ensure that they choose participants well.
• It is important to secure commitment and willingness for thedemonstration project from the highest levels of the enterprise, forinstance, the owner in a small enterprise, the site manager, and so on.
• It is good to choose wherever possible enterprises whose owner/topmanagement is dynamic, forward-looking, risk-taking, and seenperhaps by the local competitors as being a “leader”. Such personswill be more willing to take on the “unknown” that a demonstrationproject consists of and carry through the commitment.
For example, the criteria which the India NCPC uses are:
S i g ni fi c a n t m u lt i p li e r e f f e c t : The basic purpose of ademonstration project is to show and convince other industries ofthe potential and feasibility of cleaner production. It is thereforeessential that the sector selected is large enough to have a significantmultiplier effect.
The multiplier effect is governed by two factors:
• Number of clusters of similar units; and
• Total number of units in the selected sector.
A sector with a large number of units in clusters would be preferableto one with a few dispersed units.
P A R T 4
160
Hi gh po ss i b i l i t y o f r ep li c a t i o n b y o t he r uni t s : For an effectivemultiplier effect is important that demonstrated cleaner productionmeasures be replicated by other units throughout the sector. Twofactors should thus be considered when selecting an industry sector:
• Uniformity of production processes and products; and
• Availability of technical manpower within the units.
Subs ta n t i a l c le an e r p rod uc t i o n po t e nt i a l : Not all industrysectors have the same potential for cleaner production. In the earlystages, when success needs to be demonstrated to prove theusefulness of the centre, industry sectors with the greatest cleanerproduction potential should be selected over those where it may bemore difficult to obtain clear results.
S i g ni fi c a n t po l lu t i o n i nt e ns i t y : The advantages of cleanerproduction may at first be more persuasive in industry sectors thatare pollution intensive rather than those in which pollution is muchless, although the cleaner production potential will also need to beconsidered. Pollution intensity could be measured in terms of wastequantity, toxicity, concentration of pollutants in waste streams, etc.cleaner production in a pollution intensive sector could also lead to asubstantial decline in end-of-pipe pollution control requirements,thus making cleaner production a more obvious and attractivepreference.
Hi gh ec ono mi c i mpo rt a nc e : It has been the experience of the IndiaNCPC that industry sectors which are important in the nationaleconomic scenario accept newer concepts like cleaner productionmore readily. The economic importance of the sector has severalfacets such as impact on imports/exports, overall gross output,relationship with other up-stream or down-stream sectors, etc.
Good po te n t i a l c o op e ra t i o n f ro m ind us t ri e s : Industrycooperation in cleaner production assessment and implementation isvital for a successful demonstration project. It has been observedthat the cooperation from industries varies widely from sector tosector as well as from place to place.
S t ab le f i na nc i a l hea l t h o f t he sec to r : In the experience of theIndia NCPC, there is no clear correlation between an industrysector’s financial situation and its receptivity to cleaner production.The sectors which have reached a plateau of growth and can foreseea possible decline in future profits unless corrective measures are
P A R T 4
161
taken, have tended to be the most suitable ones for early successes.
I n te n se i n tr a -s ec to r a l c o mp e t i t i on : Industry sectors characterisedby intense competition tend to be the most receptive to cleanerproduction. However, when cleaner production demonstrations haveproved successful, there is less willingness to share the informationwith other units in the industry.
Su f fi c i e n t l y o rga ni se d se c to ra l s t r uc tu r e : To obtain early success,the Centre should begin with industry sectors which are sufficientlyorganised to be able to initiate and sustain a cleaner productionprogramme. Industry sectors with informal structures are likely tohave greater difficulty in obtaining success for reasons such as lack oftrained / technical manpower, over-burdened management, lack ofmeasurement/monitoring facilities, etc.
Hi gh na t i o na l p ri o ri t i e s : Finally, the selection of sectors shouldalso recognise governmental priorities (e.g. Ministry of Environment,Ministry of Industry, Pollution Control Boards, etc.) as in the longrun, demonstration projects will not serve much purpose unless theyare also able to further government polices and programmes.
It may be useful to identify enterprises for demonstrations by holdingawareness and training programmes. Promotional events could also beheld such as seminars with one to one meetings inviting the targetstakeholders. These events can be organized in partnership with therelevant industrial associations or even with financing institutions /government authorities that may sponsor the demonstration project.
Once the stakeholders are identified for demonstration, it is wise toformalize the agreement on the part of an enterprise to take part in ademonstration project, by signing a MoU. In the UNEP / UNIDONCPC Programme, demonstrations are essentially the conduct of CPAs.The demonstrations are performed in groups where CPAs areundertaken at the same time, governed by the agreement. The MoUhelps in establishing a clear understanding on individual as well ascollective responsibilities.
Box 4.6 lists some of the dos and don’ts in identification of enterprises.
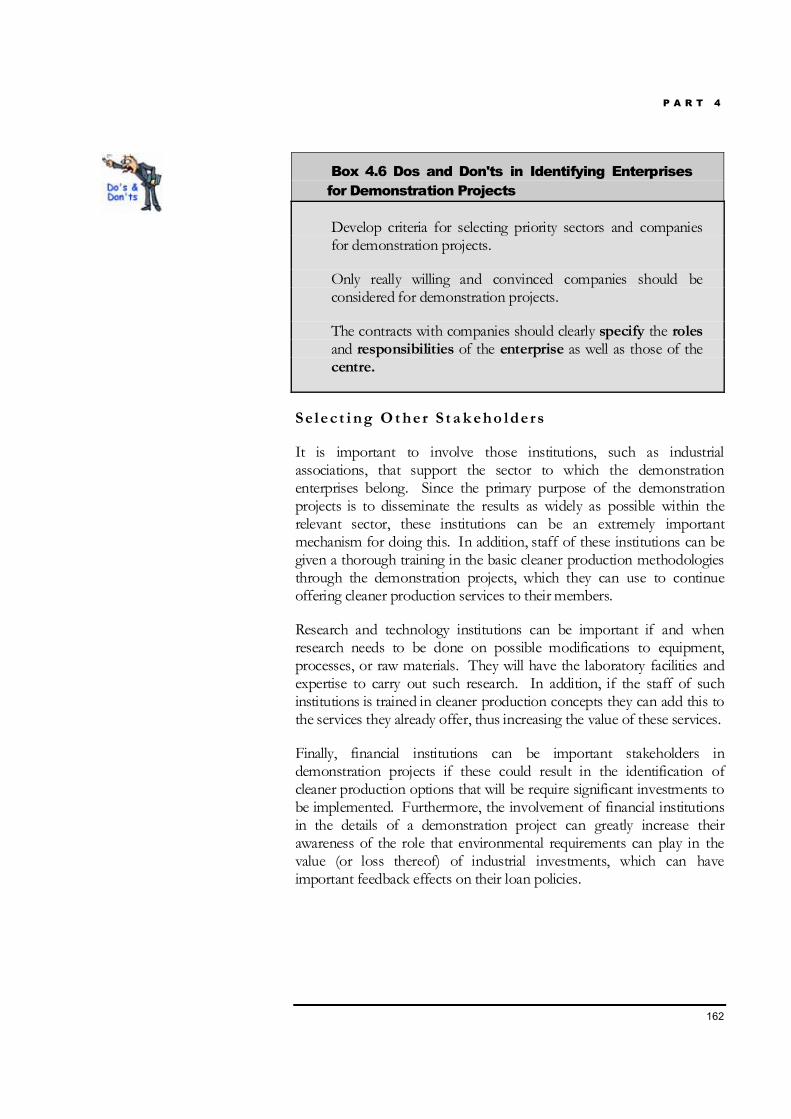
P A R T 4
162
Box 4.6 Dos and Don'ts in Identifying Enterprisesfor Demonstration Projects
Develop criteria for selecting priority sectors and companiesfor demonstration projects.
Only really willing and convinced companies should beconsidered for demonstration projects.
The contracts with companies should clearly specify the rolesand responsibilities of the enterprise as well as those of thecentre.
Se lec t i ng O t her S t a k eho lders
It is important to involve those institutions, such as industrialassociations, that support the sector to which the demonstrationenterprises belong. Since the primary purpose of the demonstrationprojects is to disseminate the results as widely as possible within therelevant sector, these institutions can be an extremely importantmechanism for doing this. In addition, staff of these institutions can begiven a thorough training in the basic cleaner production methodologiesthrough the demonstration projects, which they can use to continueoffering cleaner production services to their members.
Research and technology institutions can be important if and whenresearch needs to be done on possible modifications to equipment,processes, or raw materials. They will have the laboratory facilities andexpertise to carry out such research. In addition, if the staff of suchinstitutions is trained in cleaner production concepts they can add this tothe services they already offer, thus increasing the value of these services.
Finally, financial institutions can be important stakeholders indemonstration projects if these could result in the identification ofcleaner production options that will be require significant investments tobe implemented. Furthermore, the involvement of financial institutionsin the details of a demonstration project can greatly increase theirawareness of the role that environmental requirements can play in thevalue (or loss thereof) of industrial investments, which can haveimportant feedback effects on their loan policies.
P A R T 4
163
4.5.5 Conducting the Demonstration Project
After the agreements are executed and commitments have been made inthe form of an MoU, the implementation of the demonstration projectshould be commenced. Implementation is a partnership activity and thesole responsibility of the centre. It is strategic that the centre includestraining as a part of the CPA cum demonstration activity to buildcapacity of the enterprises that have volunteered. Including training ofcompany personnel as part of a demonstration project ensures thatcleaner production continues after the external experts leave.Demonstration projects are only one component of a broaderprogramme to build awareness and local capacity for cleanerproduction.
The Vietnam Cleaner Production Centre trains cleaner productiontrainers with a systematic, in-depth training programme, consisting ofseven modules. During the programme, participants go through acomplete cleaner production assessment, coached by national andinternational experts.
Currently, the programme is directly linked to in-plant demonstrationprojects; therefore the trainees are given a good practical as well astheoretical grounding in cleaner production by the end of the course.A selection of these trained national experts have been serving ascleaner production trainers / coaches in Phase II, by the end ofwhich the centre plans to have conducted about 15 in-plantdemonstration projects. Some of those trained will work asindependent consultants on cleaner production.
The China National Cleaner Production Centre has conducted in-plant demonstration / training programmes in some 100 enterprisesand cleaner production demonstration activities in more than 20provinces and large cities. At the start of a cleaner productionassessment in an enterprise, the centre provides a one-dayintroductory seminar for managers and owners of the enterprises todisseminate information on experience with cleaner productiontechniques and technologies. In each of the 100 enterprises wherecleaner production assessments have been carried out, a comparisonwas done of the extent of pollution generated before and afterimplementation of cleaner production options using the materialbalance prepared at the plant level. In all its cleaner productionassessments, the centre provides technical expertise for theimplementation of cleaner production options at company level. Thecentre has held seminars to share results with industry associations,
P A R T 4
164
local environmental protection bureaus, etc.
When the NCPC in Tunisia did its demonstration projects, itcombined training with CPAs in companies, a factor which thecentre believes made the “cleaner production demonstration projectsrun properly”. The centre built mostly upon the existing expertiseand technical capacity of the companies, as it did not have muchfunding for international consultants. This strategy had twoadvantages – the expertise stayed within the company and it created a“sustainable momentum”; once the programme was completed, thepersonnel associated with it continued with the cleaner productionphilosophy.
Box 4.7 below summarizes dos and don’ts in the conduct ofdemonstration projects.
Box 4.7 Dos and Don'ts for ConductingDemonstration Projects
The implementation phase should not wait for the wholeassessment to be complete. The implementation ofstraightforward cleaner production options should take placealongside the assessment so that the enterprise can startseeing the savings.
Take time to develop good relationships with enterprisepersonnel – the number of demonstration projects is lessimportant than their effectiveness.
Include the enterprise’s financial managers in thedemonstration project so that the enterprise can accuratelycalculate its economic interest in adopting cleaner productionoptions.
Find ways to motivate enterprises which do not implementeven no- or low-cost options, or to recover the costs to thecentre of their involvement if they don’t.
Evaluate demonstration projects periodically for a betterunderstanding of which options did or did not get implemented,and why.
If enterprises don’t implement capital-intensive cleanerproduction options for lack of finance, develop the expertise to
P A R T 4
165
convert such cleaner production options into bankableloan proposals and act as intermediary between financialinstitutions and the enterprises.
The objective of a demonstration project should not just be toidentify a number of cleaner production options and presentthem in the form of a report; it should be a satisfactorycompletion of the project with the maximum possible levelof implementation of cleaner production optionsidentified, and to build enterprise expertise to spread cleanerproduction in the enterprise and industry sector.
4.5.6 How to Disseminate the Results of theDemonstration Project
This is a key part of demonstration projects, because it is only if this isdone well that the project can truly be said to have demonstratedcleaner production and its benefits. Based on the experience gathered byexisting centres, Directors can consider various means of dissemination.
At the end of the demonstration project, centres should hold one ormore seminars to which they invite as many as possible of the enterprisesthat belong to the sector or geographic zone that was covered by thedemonstration project, as well as other concerned stakeholders, wherethe results of the demonstration project are presented. The impact isgreatest if the enterprises that took part in the demonstration projectpresent their results and discuss their experiences.
In the case of sector-specific demonstration project, centres may team upwith a sector association or other sectoral support institution (e.g. asectoral research association) to organize such a seminar. Suchpartnering might draw more organizations / institutions to the event.
Centres should also prepare a report that outlines the results of thedemonstration project in the form of a guidance manual. The purpose ofthis manual is to assist other enterprises that have been motivated by thepresentation of the demonstration project’s results or in some other wayto launch cleaner production assessments and other activities. For thesake of comprehension, it should be produced in all the necessary locallanguages. Centres can also prepare one-page leaflets on some of themore significant results that came out of the demonstration project, asmailers for inclusion as part of the promotional material of the centre.
“Nothing works better withinan industry group than acolleague telling them aboutthings. Demonstrationcompanies should becomeambassadors of cleanerproduction. This they will onlydo if they get something out of it.So you need to make sure thatyou are passing on the skills,not taking the expertise out withyou. This may take severalmonths of building uprelationships, but if you are notable to develop personalrelationships with your partners,the project will not besustainable.”
- India NCPC
P A R T 4
166
If funds are available, then centres can make a video of thedemonstration project. This can be expensive, since it requires the use ofhighly experienced professionals, but it gives a product that can lead to abetter and wider communication of the concept, working and the results.As an alternative to creating their own videos, centres could considerpartnering with a local television station.
Whatever dissemination mechanisms Directors adopt, they must makesure that the information about the demonstrations is reaching the targetstakeholders. Box 4.8 provides guidance on the dissemination ofinformation.
Box 4.8 Dos and Don'ts for Disseminating Resultsof Demonstration Projects
The objective of information dissemination should be to provideinformation which is required by the user (demand-driven)rather than providing information simply because it exists(supply driven).
Different stakeholders have different information needs. A centreshould do an ‘information needs’ survey to identify andunderstand actual information needs. Specific informationpackages should then be developed taking into account therelevance of the information to the user, its presentation in a‘directly usable’ format and the user’s capability and facilityto apply the information.
Maximize use of existing information dissemination channelsand networks instead of creating new ones. Piggyback onexisting nodal points (industry associations, government agencies,etc.) as a resource-effective means of providing information.
Information dissemination is continuously evolving; theinformation needs of yesterday may be quite different from theneeds of today and tomorrow. Develop a feedback system tocontinuously assess and meet user needs.
Feedback from local cleaner production users should be madeaccessible to regional and global networks to enable others tointegrate grass roots needs into development projects.
P A R T 4
167
4.5.7 The Role of the Centre in Selecting, Planningand Conducting Demonstration Projects
The centre should be involved in the demonstration project as a mentor,a facilitator, as well as in the guise of a professional manager. The pointsbelow summarize the role of the centre in this perspective.
1. Select the sector or geographical area in which a demonstrationproject will take place.
2. Publicize to the members of the chosen sectors or in the chosengeographical areas the fact that a demonstration project will be heldfor them.
3. Select the enterprises (or other organizations and institutions) thatwill take part in the demonstration project.
4. Come to a formal agreement with the selected enterprises andorganizations/ institutions about the form and content of theirparticipation in the demonstration project.
5. Set the schedule for the demonstration project.
6. Provide methodological inputs and technical support. Includetraining as a part of the demonstration activity.
7. Select (and if necessary contract with) the national consultants whowill mentor the enterprises (or organizations / institutions) duringthe demonstration project and possibly the person who will be theteam leader for the whole project.
8. Monitor the progress of the demonstration project, and if necessarytake corrective action if there is slippage in the schedule or otherproblems.
9. Ensure that the necessary photographs, videos, etc. are taken duringthe work to track progress and to use as promotional material lateron.
10. Prepare the overall project report.
11. Hold the necessary awareness-raising and dissemination campaignsat the end of the project.

U N I D O / U N E P G U I D A N C E M A N U A L : H O W T O E S T A B L I S H A N D
O P E R A T E C L E A N E R P R O D U C T I O N C E N T R E S
P A R T 5
168
How to Deliver Strategic Services ofCleaner Production Centres
What will we learn from Part 5?
5 How to Del iver Services of a Cleaner ProductionCentre (Guidance on Stra tegic Services)
169
5.1 Introduction 169
5.2 Networking 169
5.3 Matchmaking 172
5.4 Knowledge Management 174
5.5 Inter facing with Financia l Institutions 176
5.6 Pol icy Advice to National and Loca lGovernments
181
5.7 How to Build Revenue From Basic and Stra tegicServices to Make the Centre Sel f -Suf f icient
184
Part
5

P A R T 5
169
5 How to Deliver Services of aCleaner Production Centre(Guidance on Strategic Services)
5.1 Introduction
aving discussed the manner of delivery of the basic servicesoffered by the centre in Part 4 of this Manual, we now turn tothe strategic services that the centre needs to supply. Strategicservices build upon the confidence and the credence attained
by the centre through the delivery of its basic services. They assist inamplifying both the geographical coverage and intensity of basic services,and help in the creation of an environment that enables themainstreaming of cleaner production. These services play a great role inelevating the position of a centre, widening its market and assisting it toachieve financial sustainability. The strategic services that will bediscussed in this Part include:
• Networking;
• Matchmaking;
• Knowledge management;
• Interfacing with financial institutions; and
• Policy advice.
The sections that follow will provide guidance on each of these services.
5.2 Networking
Networking is synonymous with marketing, and is therefore one of theessential services a centre should undertake. Basically, networking is astrategy for cultivating relationships, improving market intelligence andenhancing the image of the centre. The Director of the centre is the bestperson to take charge of the centre’s networking activities.
H
P A R T 5
170
5.2.1 Who Should be Networked
Networking should be undertaken in order to keep the variousstakeholders of the centre informed about its activities and services.Networking enables sharing of experiences, building of new partnershipsand widening the market base of the centre. In this perspective,networking activities should be carried out in at least the following threeareas:
• Networking amongst the members of the executive board, advisorycommittee, and other peer groups;
• Networking across the stakeholders where services are provided ortargeted (i.e. the centre’s clientele); and
• Networking with other CPCs / NCPCs, potential donors, etc. Thisform of networking is critical to increase the centre’s visibility andsecure additional funding.
In the initial stages, networking is, for the most part, carried out on aninformal basis through one-to-one meetings, by participation in otherevents, etc. As these relationships mature or as interests startoverlapping, more formal mechanisms should be introduced so as toestablish centre’s very own network.
5.2.2 Establishing the Network
A network can be established and operated through a variety oftechniques. These include the following:
• Holding independent as well as joint events (e.g., roundtables,exhibitions). If such events are used as networking mechanisms,then they must be organized on a regular basis (e.g., annualroundtables on cleaner production or biennial exhibitions oncleaner technologies, etc.). A one-time event or events held oncein a while do not help in establishing a network;
• Participating in events organized by others;
• Formulating joint products (e.g. newsletters, knowledge bases ona CD-ROM);
• Undertaking joint services (e.g. training, cleaner productionassessments);
P A R T 5
171
• Publishing newsletters and operating websites. Here, jointpossibilities are sharing of mailing addresses or members to thewebsites. Possibilities of joint memberships may also beconsidered;
• Organizing consultative meetings on a regular basis between themembers of the executive board, advisory committee and thepartners. Partners refer to the organizations that assist the centrein the delivery of services or whose capacities have been built;and
• Signing an MoU, which can act as a formal mechanism to firmup networking arrangements. Ideally, these kinds of MoUsshould be drafted on a broad basis with annexes that definespecific agreements so as to allow future insertions ormodifications.
Box 5.1 highlights the dos and don’ts that apply to networking activitiesin any area.
Box 5.1 Dos and Don’ts for Networking
Do not embark on a networking venture without beingabsolutely clear as to the intent of the activity (i.e. thewhys, whos, whats and hows).
Ensure that adequate funding is available for all actionsthat are envisaged during the planning stage for anynetworking venture.
Where possible, formalize partnerships through MoUsor other such agreements with the involved parties.
Ensure that such MoUs and other such agreements areupdated periodically and / or when the need arises.
Remember that for the network to gain credibility, itshould be adopted and endorsed by all relevantorganizations working on cleaner productiondissemination in that particular locality / region / country.
Always attempt to provide value for service to yourmembers, to retain their participation in and / orcontributions to the network.
P A R T 5
172
Advertise the network to the farthest extent possible. Thiswill increase the centre’s outreach and visibility, and veryimportantly, will keep the network operational and vibrant.
5.3 Matchmaking
5.3.1 Connecting Seekers and Providers
Matchmaking is a service that connects “seekers” with “providers” or“buyers” with “sellers”. In cleaner production, the seekers include thefollowing:
• Enterprises and consultants seeking cleaner technologies (e.g.,process know-how and equipment, etc.), and suppliers ofmaterials (e.g., eco-friendly products, etc.);
• Enterprises, government and communities that are looking fortechnical experts or consultants;
• Enterprises, government and communities seeking sponsors tofinance cleaner production investments;
• Financing institutions seeking good projects to fund (often, theyhave money but no projects);
• Sponsors/donors seeking innovative ideas, projects, etc. oncleaner production;
• Enterprises, government and communities that are looking fortrainers, training sessions / courses, knowledge bases etc.; and
• Enterprises seeking suppliers of wastes as a cheap substitute forthe raw materials presently used1.
The providers typically include the following:
• Technology / equipment suppliers;
• Consultants; 1 Waste exchange hovers on the edges of the definition of cleaner production(refer to Section 1.4.1 and Figure 1.5 of Part 1 of this Manual). However, suchpractices are common and do offer an environmental benefit, so much so that theydeserve to be mentioned in this particular context.
P A R T 5
173
• Trainers, educators;
• Sponsors / financial institutions; and
• Waste generating businesses.
Essentially, the principal service of matchmaking is connecting a seekerwith the correct provider(s). The centre’s role in such cases is strictly thatof a middleman or a facilitator.
5.3.2 Extensions to Matchmaking
There are possibilities for extending the basic matchmaking service ofthe middleman or facilitator by offering assistance to fructify atransaction. If requested, and found feasible in the local or nationalcontext, a centre could provide at least three extension services:
• Acc r ed i ta t i o n o f a p ro vi d e r : The centre may use its owncriteria or criteria established and accepted elsewhere in decidingwhether a product or technology is “eco-friendly”. Here, thecentre could conduct the required field investigations (e.g., acleaner production assessment with life cycle perspective, or anenvironmental technology assessment) at the cost of the seller orthe provider. This service could include a one-time fee foraccreditation, in addition to an annual inspection fee formaintaining it.
• As si s t a nc e i n c om pl e t i ng t he t r a nsa c t i o n b et we e n t heb u ye r a nd th e s e l l e r : The centre could counsel the buyer orseller, and / or conduct independent studies required in ensuringa successful transaction.
• P ro vi d i ng i n t e l l i g e nc e r epo r ts : Many a time, developers andsuppliers are interested in understanding the needs of the marketvis-à-vis a product or a technology they are offering, or are aboutto offer. For instance, an R&D institution may like the centre toprovide a one-time / regular feedback on the types of cleanerproduction technologies that are generally requested by themarket. The centre could distill such reports based on therequests it receives or transactions it undertakes, and provide thestudy as a service to interested suppliers.
P A R T 5
174
5.3.3 Mechanisms of Matchmaking
A centre can use a variety of mechanisms to provide matchmakingservices. Examples include the following:
• Publishing “Buyer-Seller guides” on technology, eco-friendlymaterials for greening a supply chain;
• Holding buyer-seller meets; and
• Operating business-to-business (B2B) websites which allowonline transactions of buying and selling of technology /equipment / wastes. This is a very effective means ofmatchmaking because here, transactions can take place 24 hoursa day, 7 days a week, with relatively little input of resources fromthe centre. In addition, the transactions can be monitored onlineand put into a database for future reference and follow-up.
Centres could earn revenue by way of brokerage or transaction fees oreven success fees. Additional revenue could come from membershipfees; i.e. the fees charged in order to get listed in the buyer-seller guidesand websites. As described earlier, revenues could also be collected fromaccreditation and inspection services.
5.4 Knowledge Management
As the networking activities expand, the centre will gain access to a vastrepository of information on cleaner production and other relatedresources. The task, then, is to organize, review and process thisinformation and deliver it to meet the information needs of the centre’svarious stakeholders. It is also important to ensure that channels areestablished to update the information so collected on a regular basis.Such issues are essentially addressed in the task of knowledgemanagement. Knowledge includes holding of data, derived informationand accumulated experience.
As knowledge management can be a daunting task, it becomes criticalfor the centre to build revenues out of this service. In this context, it ismore strategic that the centre engages only in “productizing” theknowledge pooled from other sources rather than getting involved in thetask of developing primary data or information per se. Once again, theseactivities are best carried out through partnerships. However, specialattention does need to be given to Intellectual Property Rights (IPR),since the products may very well have some commercial value.
P A R T 5
175
5.4.1 Deliveries in Knowledge Management
Typical demands for knowledge in the cleaner production area that aregenerally not met by a single organization include the following:
• How-to manuals, guidance documents on cleaner productionassessment;
• Sector-specific best practices;
• Case studies;
• Technology fact sheets, Material Safety Data Sheets, bannedsubstances and technologies;
• Benchmarks on resource consumption, waste generation etc.;
• Financing resources, funding criteria;
• Eco-labels, brands, their environmental and social requirementsor codes of conduct; and
• Compilation of national and international environmentalregulations, emission / effluent standards.
A centre could attempt to meet these demands through a variety ofmechanisms such as the following:
• P ubl i c a t i o ns : The centre could publish guidance manuals ortechnology fact sheets for selected sectors based on itsexperiences from various services (matchmaking, cleanerproduction assessments, demonstration projects etc.). Thesepublications may be priced.
• C om p ut e r- ba se d pr od uc t s : CD-ROMs could be sold tointerested clients. They could contain searchable databases onMaterial Safety Data Sheets, banned substances and processes,technology fact-sheets, sectoral benchmarks contact lists oftechnology / equipment providers, etc.
• We b -ba s ed de li v e ry : This is one of the most effective andleast expensive modes of delivering information to anyoneacross the world ─ 24 hours a day, 7 days a week. Amembership fee could be charged for the web site and memberscould access regular uploads of manuals, databases, etc.
P A R T 5
176
5.5 Interfacing with Financial Institutions
5.5.1 Reasons for Interfacing with FinancialInstitutions
Financial institutions are important for a centre from two perspectives:
• As so ur c e s o f f und i ng fo r b u si ne s s c l i e nt s : Financialinstitutions could provide funding to enterprises or otherinstitutions on the basis of loans or partial grants or on the basisof equity (i.e. partial ownership), to implement cleanerproduction options. Here, a centre could play a catalytic role inassisting their clients in the preparation of a bankable project ora basket of projects.
• As c li e nt s : Financial institutions may require technicalassistance in finding and appraising low-risk and high-returnprojects. A centre could provide such a service on a consultancybasis.
It is therefore necessary for the centre to build relationships with keyfinancial institutions.
5.5.2 Referring of Cleaner Production Projects toFinancial Institutions
Not all cleaner production options are good material for referral tofinancial institutions. Options such as housekeeping, direct reuse /recovery / recycle, process rationalization and optimization, materialsubstitution, upkeep of equipment maintenance etc., are generally bestfinanced internally (i.e. through the enterprise’s own funds). This isbecause not only are the capital investments needed for these optionsoften very low, but also because the payback periods are reasonablyshort (less than six months).
Options such as indirect reuse / recovery / recycle (requiring pre-treatment), process / equipment modification etc., generally fall into themoderate investment category, where a mix of internal and externalfinance (through a financial institution) can be sought. The skill here liesin arriving at the correct blend of internal-external finance, and providingappropriate advice to the enterprise.
Options such as equipment / process change, installation of automatedsystems, product redesign etc., generally require moderate to high
P A R T 5
177
investments, where external finance could be the principal source offunding.
In order to present a “systems approach” to the financial institution,which it will appreciate, as well as to improve the net payback period orInternal Rate of Return (IRR), it may be strategic to combine optionsfrom all of the above three categories.
Before funding any cleaner production options, a financial institutionrequires sound economic analyses (e.g., computation of payback, IRRetc.), an evaluation of the financial situation of the business / enterprise(balance sheets, profit and loss statements) and a statement of theenvironmental / social benefits to be derived from the cleanerproduction option(s). These requirements are generally specified in theloan application forms.
Before preparing the documentation, it is important to decide upon thefinancial institution that will be approached for assistance, as theconditions for giving loans, grants, etc. may vary to quite an extent fromone individual financial institution to another. For instance, somefinancial institutions offer low-interest loans but with caps (i.e., themaximum amount of money that can be lent per facility / enterprise), oronly for companies of a certain size; others offer loan guaranteeschemes, to help with lack of collateral; still others operate speciallydesigned concessional funds loans but only for investments for aparticular purpose (e.g., replacement of chlorofluorocarbons, reductionof energy consumption, etc.). There will also often be requirements forthe requester to commit their own contribution (e.g., 25% of the projectcost).
Box 5.2 provides some typical requirements for preparing loanproposals.
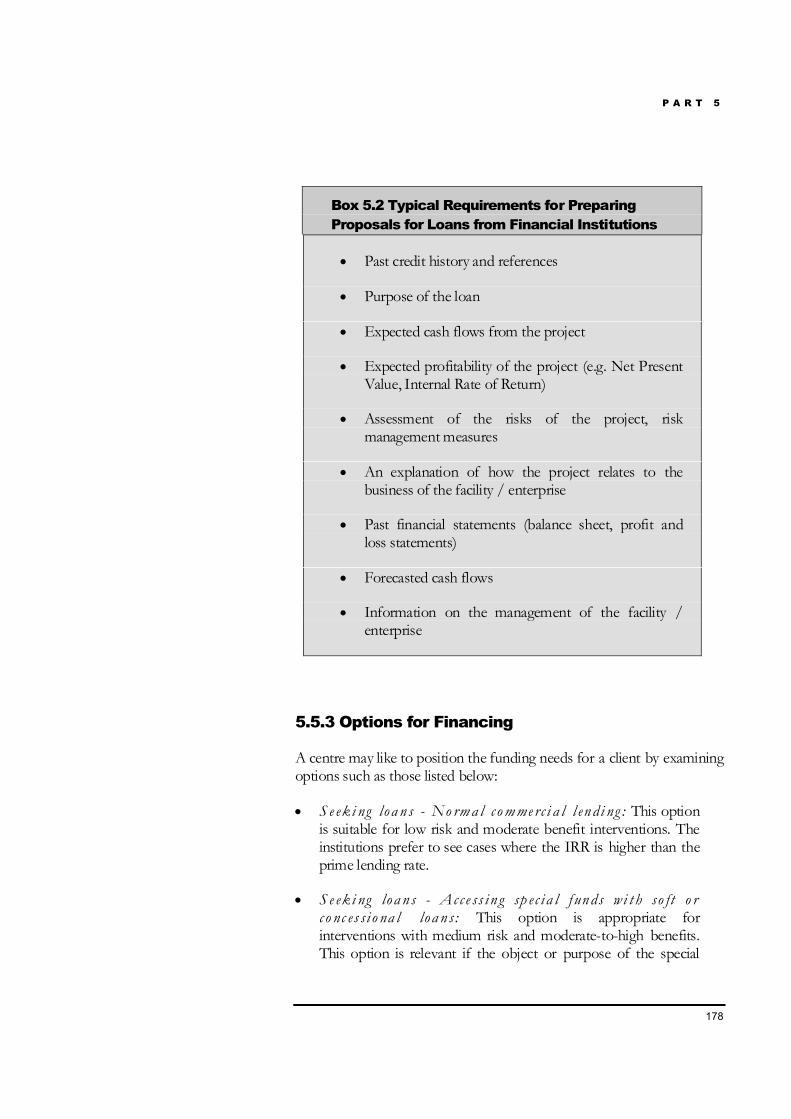
P A R T 5
178
Box 5.2 Typical Requirements for PreparingProposals for Loans from Financial Institutions
• Past credit history and references
• Purpose of the loan
• Expected cash flows from the project
• Expected profitability of the project (e.g. Net PresentValue, Internal Rate of Return)
• Assessment of the risks of the project, riskmanagement measures
• An explanation of how the project relates to thebusiness of the facility / enterprise
• Past financial statements (balance sheet, profit andloss statements)
• Forecasted cash flows
• Information on the management of the facility /enterprise
5.5.3 Options for Financing
A centre may like to position the funding needs for a client by examiningoptions such as those listed below:
• S e ek i ng loa n s - No rma l c o mme rc i a l l en d i ng : This optionis suitable for low risk and moderate benefit interventions. Theinstitutions prefer to see cases where the IRR is higher than theprime lending rate.
• S e ek i ng loa n s - Ac c e ss i n g sp ec i a l f unds wi t h so ft o rc o nc es s i o na l loa n s: This option is appropriate forinterventions with medium risk and moderate-to-high benefits.This option is relevant if the object or purpose of the special
P A R T 5
179
fund is in line with the concept and expected benefits of thecleaner production investment. Projects that lead to theelimination of a toxic substance, improvement of worker healthand safety or alleviation of neighborhood nuisance may qualifyfor softer funds. However, it may be required that such projectscross over a minimum or threshold IRR. It may also benecessary to attempt a quantification of the environmentalbenefits in monetary terms to the greatest extent possible (e.g.,using the Total Cost Assessment approach).
• S e ek i ng e qui ty i n t he fo rm o f v e nt u r e c ap i ta l : Thisoption is appropriate for medium to high risk but high benefitinterventions. Here, the documentation could become copious,as the financial institution could ask for equity in the enterpriseas a proviso to concessional venture capital funds. In this case,until the capital invested is returned, a representative of thefinancial institution remains a part of the Board of Directors ofthe enterprise. Projects to demonstrate high-investmenttechnology may fall in this category.
• S e ek i ng e qui ty i n t he fo rm o f a Jo i nt Ve n t u re : Thisoption will typically entail the participation of a technologyprovider in the form of equity. This model is perhaps relevantwhere high capital and moderate risks are involved and wherethere are restrictions on the transfer of technology. Many times,the technology provider is not keen on transferring thetechnology entirely, and prefers to maintain a stake, therebyhaving a claim on a portion of the project benefits. In such cases(similar to the venture capital approach), a representative of thetechnology provider sits on the Board of Directors of theenterprise. It is possible to channel high-investmentdemonstration projects with this approach. Note that thedocumentation for setting up a Joint Venture can be rathercomplex, so a commitment to this approach needs to becarefully weighed first.
5.5.4 Possible Mechanisms for Financing
In each of the options outlined above, the centre is in a position toprovide technical assistance to the financial institution, the enterpriseitself, or to the technology provider.
The centre may assist the financial institution in the following ways:
P A R T 5
180
• Modify the project appraisal process in order to incorporate intoloan application forms the cleaner production approach andmore generally evaluations of the risks related to environmentalliabilities;
• Accompany the representatives of the financial institution onfield visits during project implementation as a technical advisor(e.g., for de-bottlenecking);
• Conduct monitoring on behalf of the financial institution afterthe implementation of projects to assess the extent of benefits;and
• Advise on establishing and operating “special purpose”environmental funds; i.e. funds specifically designed to promotecleaner production investments.
Centres can thus serve as partners to financial institutions in thebuilding of a pipeline of bankable cleaner production-relatedinvestments.
The centre may provide the following assistance to enterprises:
• Identify cleaner production investment projects for possiblefunding from financial institutions and / or technologyproviders;
• Identify the most promising financial institution and / ortechnology provider to approach;
• Prepare (or assist in the preparation of) the loan applications;and
• Assist in the implementation and evaluation of cleanerproduction investment projects.
Box 5.3 provides some dos and don’ts while interfacing withfinancial institutions.
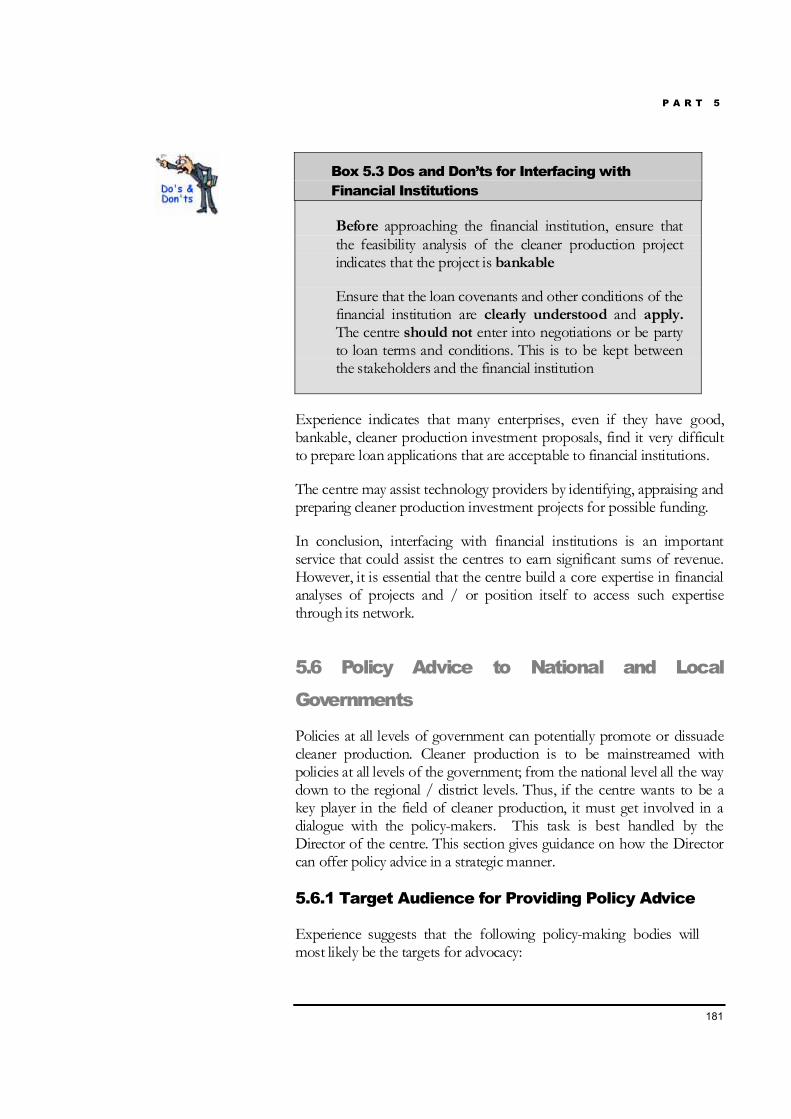
P A R T 5
181
Box 5.3 Dos and Don’ts for Interfacing withFinancial Institutions
Before approaching the financial institution, ensure thatthe feasibility analysis of the cleaner production projectindicates that the project is bankable
Ensure that the loan covenants and other conditions of thefinancial institution are clearly understood and apply.The centre should not enter into negotiations or be partyto loan terms and conditions. This is to be kept betweenthe stakeholders and the financial institution
Experience indicates that many enterprises, even if they have good,bankable, cleaner production investment proposals, find it very difficultto prepare loan applications that are acceptable to financial institutions.
The centre may assist technology providers by identifying, appraising andpreparing cleaner production investment projects for possible funding.
In conclusion, interfacing with financial institutions is an importantservice that could assist the centres to earn significant sums of revenue.However, it is essential that the centre build a core expertise in financialanalyses of projects and / or position itself to access such expertisethrough its network.
5.6 Policy Advice to National and Local
Governments
Policies at all levels of government can potentially promote or dissuadecleaner production. Cleaner production is to be mainstreamed withpolicies at all levels of the government; from the national level all the waydown to the regional / district levels. Thus, if the centre wants to be akey player in the field of cleaner production, it must get involved in adialogue with the policy-makers. This task is best handled by theDirector of the centre. This section gives guidance on how the Directorcan offer policy advice in a strategic manner.
5.6.1 Target Audience for Providing Policy Advice
Experience suggests that the following policy-making bodies willmost likely be the targets for advocacy:
P A R T 5
182
• At th e nat i o na l a nd pr o vi nc i a l l e ve l s : Ministries ofenvironment, ministries of industry, ministries of economy,ministries for trade, ministries of health, ministries of labor orequivalent, bodies setting standards for worker health and safety,ministries of energy or equivalent, ministries of finance, orequivalent, etc.
• At th e lo c a l l e ve l : Environmental authorities, local tradepromotion boards, industrial development authorities orequivalent, municipal bodies, etc.
The Director of the centre should focus primarily on the policy-making bodies covering the area of the centre’s geographical focus(refer to Section 3.2.1 of Part 3 of this Manual). For instance, theDirector of a centre at the municipal level should concentrateprimarily on policy-making at the municipal level. However, onecannot afford to ignore the other levels (e.g., state level, provinciallevel, national level). To give an example, it is possible that barriers tocleaner production exist due to interpretation of nationalregulations at the local level. Therefore, the Director needs to workthrough networks of like-minded organizations to achieverepresentation at all levels of policy-making. In this context,networking and partnerships are important strategies that are muchneeded in the achievement of such objectives.
5.6.2 Ways to Extend Policy Advice across DifferentStakeholders
There could be many ways to extend policy advice across differentstakeholders. Some examples are given below:
• Governments often request centres to carry out studies onvarious aspects related to cleaner production and public policy.By conducting these studies, the centre can put forthrecommendations with regard to changes in the policy regime topromote cleaner production to the government.
• Enterprises, institutions, or one of their supporting organizationscould ask the centre to undertake studies to assess the impacts ofnew government policies (or the lack of such policies). Forinstance, with the increase in globalization, there could be anincreasing demand for analysis in trade-related cleanerproduction issues.
P A R T 5
183
• Financial institutions could ask the centre to prepare studies ontheir possible role in promoting cleaner production or on waysto reduce their exposure to environmental risks in lending. Suchstudies would include the element of a process guidanceframework for financial institutions in the context of existingand / or amended environmental policies.
5.6.3 Possibilities to Usher Policy Changes
In Part 1 of this Manual, we noted that cleaner production entails thefollowing aspects:
• Increasing the efficiency of resource (materials and energy)utilization and / or;
• Changing consumption patterns of goods and services and / or;
• Decreasing reliance on materials hazardous or toxic to man andthe environment and / or;
• Decreasing reliance on non-renewable sources of materials andenergy.
These central aspects need to be considered while advocating cleanerproduction to the policy-makers.
Some of the potential areas where the concept of cleaner production canbe introduced are listed below:
• S t anda rd s a nd reg u l a t i o n s (e.g., moving fromconcentration based standards to load or mass based standards,levying pollution charges, using information on benchmarkswhile proposing load based regulations, extending process basedregulations to product based regulation, banning harmfulsubstances as administered through ministries of environment aswell as commerce and industry, etc.);
• E nvi ro nm e nt a l i mp ac t a ss e ss me n t (e.g., introducing cleanerproduction in the preparation and review of environmentalimpact assessments, especially in assessing the consumption ofmaterials and energy, choice of technology and materials, etc.);
P A R T 5
184
• Wo rke r hea l t h a nd sa f e t y r eg u la t i o n s (e.g.,recommending a ban on harmful processes and materials,promoting environmentally-friendly and safer substitutes, etc.);
• M a rke t -ba s ed i n s t rum en t s (e.g., discouraging use ofhazardous or toxic materials in the consumer products bypromoting eco-labeling, providing more information to theconsumer on better ways of manufacturing and designing ofproducts, etc.);
• E ner gy - r e la t ed re g ul a t i on s (e.g., wherever possible,promoting use of renewable sources of energy over non-renewable sources of energy, encouraging clean fuels, promotingenergy efficiency through fiscal instruments, etc.);
• I ndu s tr y a nd c o mme rc e - r e la t ed re g u la t i o ns (e.g.,removing subsidies on all materials and energy so that users feelthe real cost of resources, encouraging growth of cleaner sectorsthrough tax-based incentives or rebates; and
• Fi na nc e a nd fi s c a l po li c y-maki n g (e.g., favoring cleanerproduction related investment by suitable tax structures, etc.).
5.7 How to Build Revenue from Basic and
Strategic Services to Make the Centre Self-
sufficient
Broadly speaking, the process of delivering basic services providesthe centre with the foundation and confidence needed to ascend tothe next stage; i.e. delivering strategic services. In one sense, thecentre is building its own capacity. After all, if the basic services ofawareness-raising, training and cleaner production assessments arenot delivered properly, there will be no triggering of (demand for)other services occurring higher up the ladder.
However, not all services will follow the sequential order ofbasic-to-strategic. For instance, networking may be (andideally should be) performed at all times. Note that suchplanning will be situation-specific.
Revenue generation from the delivery of services is a crucial aspectof steering the centre towards financial self-sustainability Therefore,
“The NCPCProgramme came in atthe right time. Newinvestment policies werebeing decided by thegovernment –most ofwhich were end-of-pipeoriented. WithUNIDO / UNEP,we have been able tohelp change the policyframework.”
- The El SalvadorCentre
P A R T 5
185
the Director of the centre should specially taken note of this aspectas he/she creates the varying mix of basic and strategic services thecentre will offer. In deciding this mix, it is important for Directors toremember that services like awareness-raising and networking do notnecessarily generate revenue as such, but they may act as triggersfor other revenue-generating services. Therefore, it is highlyrecommended that the Director of the centre spearheads the deliveryof the awareness-raising and networking services himself / herself.Also, it is essential that the centre attempt to cover the basic costs ofservices that do not raise revenue. This can be made possiblethrough seeking sponsorships, soliciting the help from stakeholders/ host institutions on resources (see Section 3.4.1 of this Manual)and / or involving the centre’s partners.
Table 5.1 provides some guidance as to how revenue may begenerated through the delivery of services. Note that the delivery ofone service may also lead to revenue generation for another service;for instance, trainees from a particular training session may beinterested in the centre following up with them for a cleanerproduction assessment (CPA) at their enterprise / facility. Thus, acentre should use a multi- service based approach rather thanfocusing only on high revenue generating services.
It is evident that it takes time for the revenue generated from allthese services to build up to a comfortable level, i.e. to the point atwhich the centre may call itself financially self-sustainable. Till suchtime, it is important for the centre to build up or have access to astore of reserve funds. These reserve funds must be managedprudently, e.g., by employing only core staff at the inception of thecentre, and gradually expanding them in later years. Costs can becontrolled by having short-term contracts with local consultants, andby sharing resources with partners to the maximum extent possible.It may be useful to remain on the alert through a regular monitoringand review process and seek incremental funds from external donorsin time.
Establishing and operating a centre is no different from settingup a Strategic Business Unit in the private sector. However, thecentre is not necessarily equivalent to a conventional privateconsulting company. Unlike a consulting company, the centre oftenhas a “public” status, enjoying national recognition and internationalsupport, and operating in areas that include not just consulting butalso project development and strategic advice. By doing so, it isexpected that the centre “offer a public good”.
P A R T 5
186
As the centre matures, it may offer a n addi t i o na l s e r vi c e –c o n s ul t i ng . The need for such consulting activities could possiblyfructify as a result of the centre’s involvement and acquired expertisein CPAs. Such consulting activities might include a number ofdifferent aspects, those related to cleaner production, as well as thosebordering on cleaner production. Examples include detailed energyaudits, quality control, product redesign, health and safety of theworkplace, establishment of EMS, environmental cost accounting,trends in environmental regulations, environmental impactassessments (to some degree) and so on. It is important to rememberto p e r fo rm p ro g re ss i v e ly ; trying to influence all of the aboveaspects at one time is an imprudent strategy. Expanding suchconsulting services in stages will also help build the confidence of thecentre over time. Revenues in such cases will also be progressive.
Operating a financially sustainable centre tests the concept of cleanerproduction in practice – i.e. whether the cleaner production works inthe commercial world! We hope that this Guidance Manual equipsthe Director of the centre with the necessary tools to set forth in thisdirection.
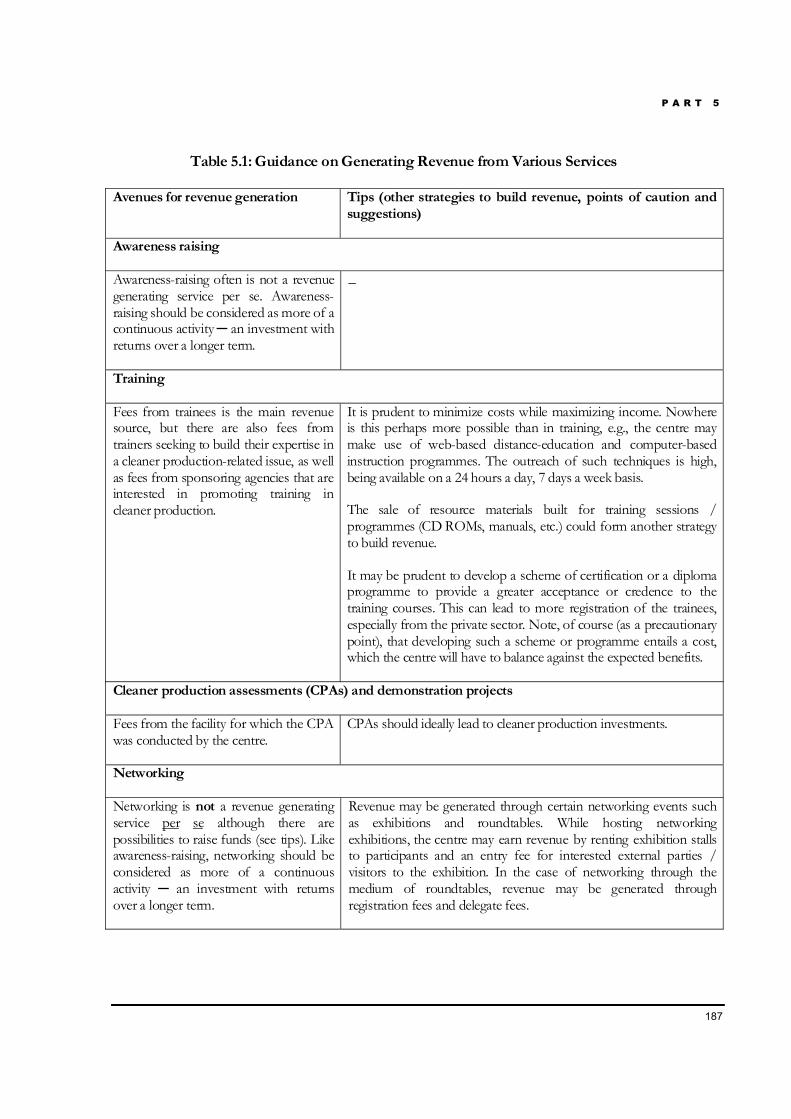
P A R T 5
187
Table 5.1: Guidance on Generating Revenue from Various Services
Avenues for revenue generation Tips (other strategies to build revenue, points of caution andsuggestions)
Awareness raising
Awareness-raising often is not a revenuegenerating service per se. Awareness-raising should be considered as more of acontinuous activity ─ an investment withreturns over a longer term.
_
Training
Fees from trainees is the main revenuesource, but there are also fees fromtrainers seeking to build their expertise ina cleaner production-related issue, as wellas fees from sponsoring agencies that areinterested in promoting training incleaner production.
It is prudent to minimize costs while maximizing income. Nowhereis this perhaps more possible than in training, e.g., the centre maymake use of web-based distance-education and computer-basedinstruction programmes. The outreach of such techniques is high,being available on a 24 hours a day, 7 days a week basis.
The sale of resource materials built for training sessions /programmes (CD ROMs, manuals, etc.) could form another strategyto build revenue.
It may be prudent to develop a scheme of certification or a diplomaprogramme to provide a greater acceptance or credence to thetraining courses. This can lead to more registration of the trainees,especially from the private sector. Note, of course (as a precautionarypoint), that developing such a scheme or programme entails a cost,which the centre will have to balance against the expected benefits.
Cleaner production assessments (CPAs) and demonstration projects
Fees from the facility for which the CPAwas conducted by the centre.
CPAs should ideally lead to cleaner production investments.
Networking
Networking is not a revenue generatingservice per se although there arepossibilities to raise funds (see tips). Likeawareness-raising, networking should beconsidered as more of a continuousactivity ─ an investment with returnsover a longer term.
Revenue may be generated through certain networking events suchas exhibitions and roundtables. While hosting networkingexhibitions, the centre may earn revenue by renting exhibition stallsto participants and an entry fee for interested external parties /visitors to the exhibition. In the case of networking through themedium of roundtables, revenue may be generated throughregistration fees and delegate fees.
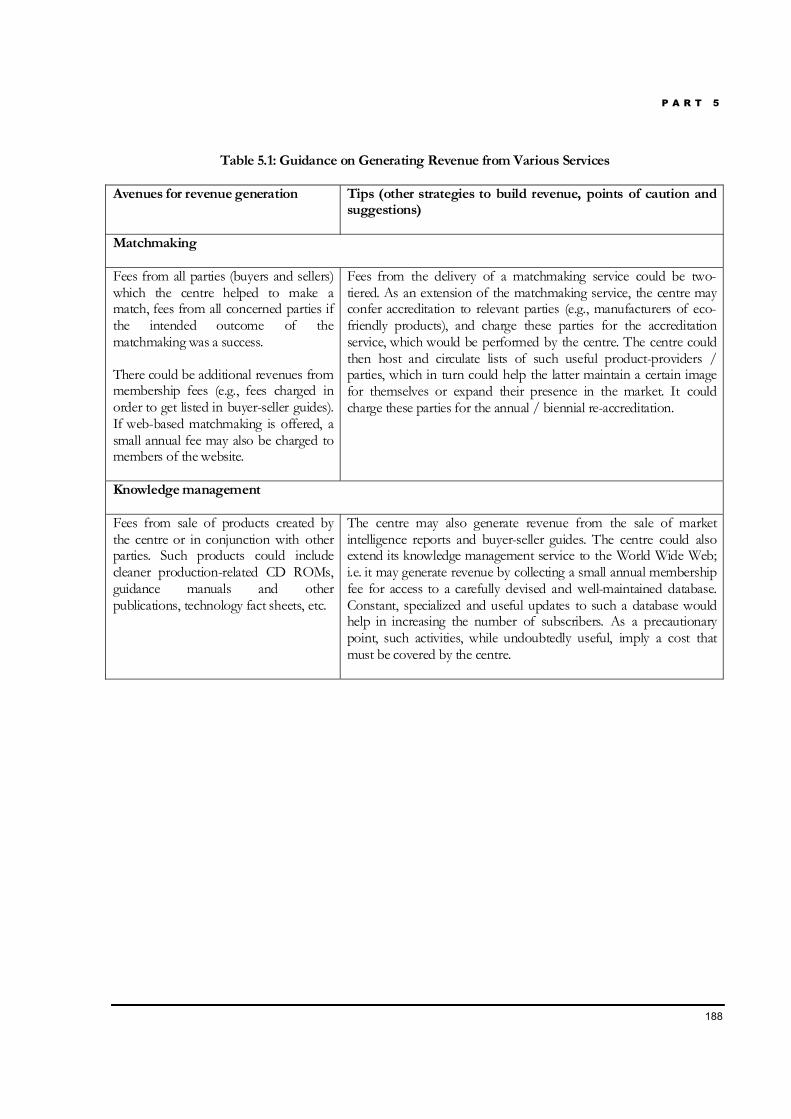
P A R T 5
188
Table 5.1: Guidance on Generating Revenue from Various Services
Avenues for revenue generation Tips (other strategies to build revenue, points of caution andsuggestions)
Matchmaking
Fees from all parties (buyers and sellers)which the centre helped to make amatch, fees from all concerned parties ifthe intended outcome of thematchmaking was a success.
There could be additional revenues frommembership fees (e.g., fees charged inorder to get listed in buyer-seller guides).If web-based matchmaking is offered, asmall annual fee may also be charged tomembers of the website.
Fees from the delivery of a matchmaking service could be two-tiered. As an extension of the matchmaking service, the centre mayconfer accreditation to relevant parties (e.g., manufacturers of eco-friendly products), and charge these parties for the accreditationservice, which would be performed by the centre. The centre couldthen host and circulate lists of such useful product-providers /parties, which in turn could help the latter maintain a certain imagefor themselves or expand their presence in the market. It couldcharge these parties for the annual / biennial re-accreditation.
Knowledge management
Fees from sale of products created bythe centre or in conjunction with otherparties. Such products could includecleaner production-related CD ROMs,guidance manuals and otherpublications, technology fact sheets, etc.
The centre may also generate revenue from the sale of marketintelligence reports and buyer-seller guides. The centre could alsoextend its knowledge management service to the World Wide Web;i.e. it may generate revenue by collecting a small annual membershipfee for access to a carefully devised and well-maintained database.Constant, specialized and useful updates to such a database wouldhelp in increasing the number of subscribers. As a precautionarypoint, such activities, while undoubtedly useful, imply a cost thatmust be covered by the centre.
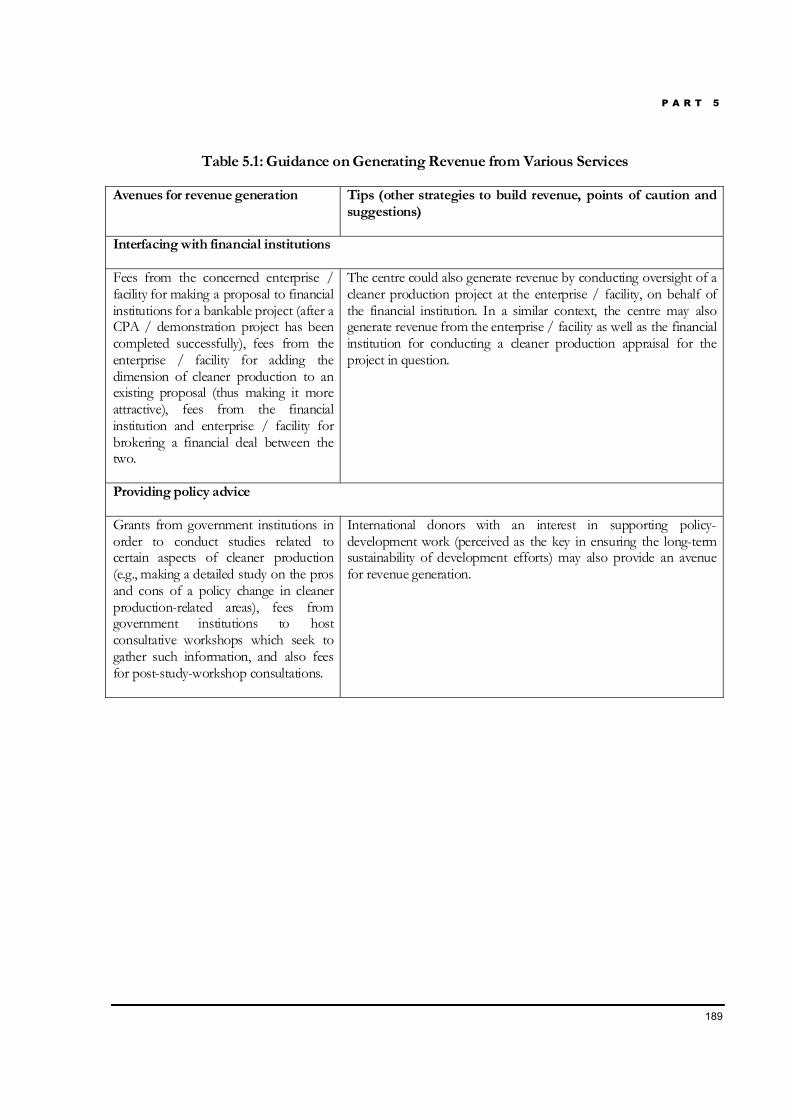
P A R T 5
189
Table 5.1: Guidance on Generating Revenue from Various Services
Avenues for revenue generation Tips (other strategies to build revenue, points of caution andsuggestions)
Interfacing with financial institutions
Fees from the concerned enterprise /facility for making a proposal to financialinstitutions for a bankable project (after aCPA / demonstration project has beencompleted successfully), fees from theenterprise / facility for adding thedimension of cleaner production to anexisting proposal (thus making it moreattractive), fees from the financialinstitution and enterprise / facility forbrokering a financial deal between thetwo.
The centre could also generate revenue by conducting oversight of acleaner production project at the enterprise / facility, on behalf ofthe financial institution. In a similar context, the centre may alsogenerate revenue from the enterprise / facility as well as the financialinstitution for conducting a cleaner production appraisal for theproject in question.
Providing policy advice
Grants from government institutions inorder to conduct studies related tocertain aspects of cleaner production(e.g., making a detailed study on the prosand cons of a policy change in cleanerproduction-related areas), fees fromgovernment institutions to hostconsultative workshops which seek togather such information, and also feesfor post-study-workshop consultations.
International donors with an interest in supporting policy-development work (perceived as the key in ensuring the long-termsustainability of development efforts) may also provide an avenuefor revenue generation.
U N I D O / U N E P G U I D A N C E M A N U A L : H O W T O E S T A B L I S H A N D
O P E R A T E C L E A N E R P R O D U C T I O N C E N T R E S
190
How to Monitor and Review the Progressof a Cleaner Production Centre
What will we learn from Part 6?
Part
6
6 How to Monitor and Review the Progress of aCleaner Production Centre
191
6.1 The Need for Monitor ing and Reviewing theProgress of the Centre
191
6.2 The Fundamenta ls of Per formance Indicators 194
6.3 The Cr iter ia for Monitor ing and Reviewing theProgress of the Centre
195
6.4 Establ ishing a Data Col lection System 203
6.5 Establ ishing a Reporting System 204
6.6 Obta ining Information on Changing Scenar iosand Updating the Business P lan of the Centre
204
P A R T 6
191
6 How to Monitor and Review the Progressof a Cleaner Production Centre
6.1 The Need for Monitoring and Reviewing the
Progress of the Centre
n Part 3, we noted that once the strategy of the centre is formulated,the stakeholders decide on the targets to be achieved in line with theobjectives and the mission of the centre. These targets will bringabout the accomplishment of the objectives of the centre.
Another important realization made from the discussions in Part 3 andPart 5 was the prospect of r e v i s i t i ng a nd re vi ta li zi ng t hec o nc ep t ua l p la n of the centre a f t e r i t s e s t ab li sh me n t , dependingon the achievements of targets and the changing economic andenvironmental situations. Therefore, the requirements for measuring theprogress of a centre are two-fold:
• Firstly, in terms of monitoring: This involves ascertaining andmeasuring the achievement of the set targets; and
• Secondly, in terms of reviewing: This involves revisiting andrevitalizing the business plan of the centre after its establishment.
Against this backdrop, Part 6 is intended to provide the centre’sDirector, oversight bodies (Advisory Committee and Executive Board),staff and external sponsors (if any), with a general guideline onmonitoring and reviewing the progress of the centre.
The Director of the centre will need to know whether the tasks of thecentre are occurring at the planned levels and whether they are attainingthe desired effect. It is only with this feedback that the Director canensure that the centre is achieving its targets, and in turn meeting itsobjectives, in conformity with its mission (see Level 1 of Figure 6.1). Ifdeficiencies are identified through the feedback, then it is necessary toascertain the actions required to bring the focus and resources back ontrack. In this light, the Director needs to apply the basic concept ofcontinuous improvement; i.e. the Plan-Do-Check-Act or PDCA cycle(see Section 1.4.2 of Part 1 of this Manual). These actions will help the
I
P A R T 6
192
Director to utilize the available resources optimally, improve theeffectiveness of it’s the centre’s services and fetch more business. Theseactions are also crucial to establish and maintain the credibility of thecentre and increase confidence amongst its stakeholders.
The centre’s oversight bodies need to be aware of the progress made bythe centre, as they provide s t r a te g i c d i rec t i o n s to it. Decisionsconcerning the strategic directions that the centre should take will beinfluenced primarily by the “marketing intelligence” available to theoversight bodies. Such marketing intelligence should ideally includeinformation for review with respect to the following:
• The performance of the centre in the market with respect to itscompetitors in cleaner production-related activities, areas forimprovement, and the necessity for repositioning its services (seeLevel 2 of Figure 6.1); and
• Changes in the environmental and / or economic factors andsectoral focus of the centre: This may give rise to an expansion inthe initial / present scope of the centre in terms of revising itsgeographical coverage and focus (see Level 3 of Figure 6.1).
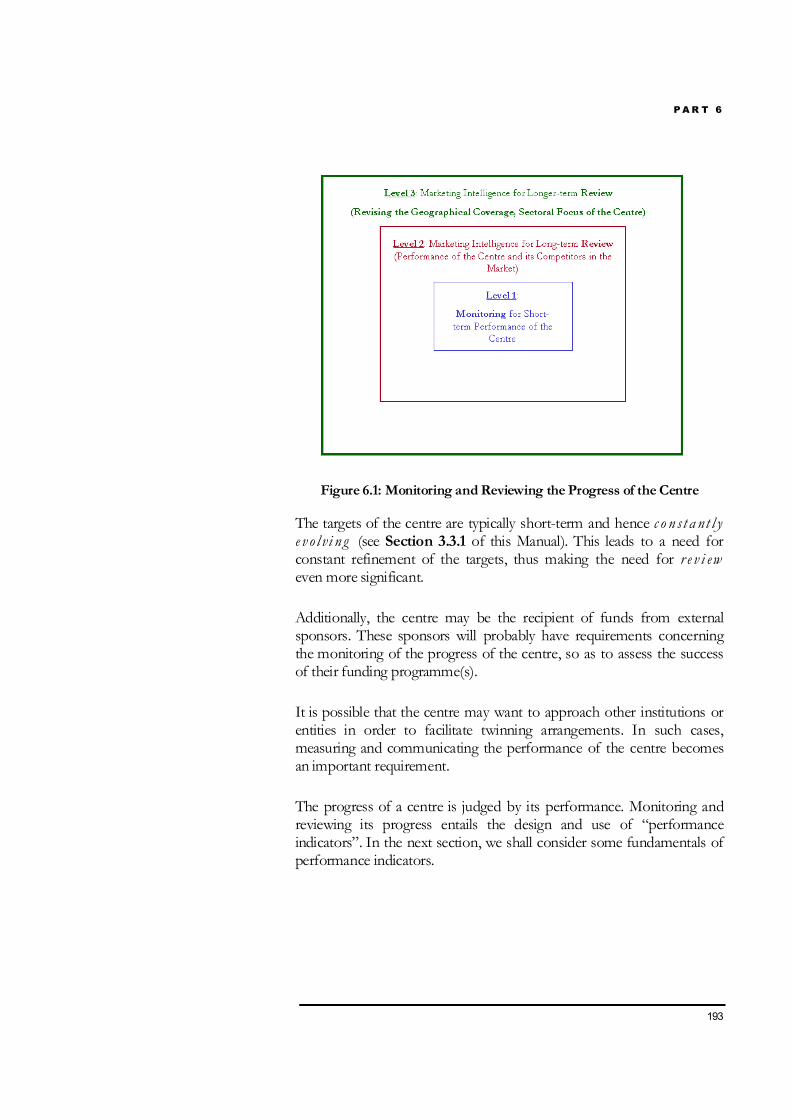
P A R T 6
193
Figure 6.1: Monitoring and Reviewing the Progress of the Centre
The targets of the centre are typically short-term and hence c o n st a nt l ye v o l vi n g (see Section 3.3.1 of this Manual). This leads to a need forconstant refinement of the targets, thus making the need for r e v i eweven more significant.
Additionally, the centre may be the recipient of funds from externalsponsors. These sponsors will probably have requirements concerningthe monitoring of the progress of the centre, so as to assess the successof their funding programme(s).
It is possible that the centre may want to approach other institutions orentities in order to facilitate twinning arrangements. In such cases,measuring and communicating the performance of the centre becomesan important requirement.
The progress of a centre is judged by its performance. Monitoring andreviewing its progress entails the design and use of “performanceindicators”. In the next section, we shall consider some fundamentals ofperformance indicators.
P A R T 6
194
6.2 The Fundamentals of Performance Indicators
An indicator is defined as “something that provides a clue to a matter oflarger significance or makes perceptible a trend or phenomenon that isnot immediately detectable”1.
Performance indicators have been used extensively in a number of fields.Examples can be found in economics, where indicators such as theGross Domestic Product (GDP), national debt, unemployment rate etc.,are used. Environmental indicators are becoming increasingly popular inthe evaluation of policies at the country level, the state of theenvironment and inter-country comparisons.
The main characteristics of performance indicators are that they quantifyand simplify information in a manner that promotes the understandingby interested parties of the problems associated with achieving a target /targets.
Other special features of performance indicators are that although theyare implicitly understood as having a quantitative basis, they can also becommunicated in qualitative formats2.
A performance indicator carries with it information of the variousparameters from which it was evolved. A p e r fo rma nc e i nd i c a to r i st h u s no t m er e ly a s t a t em e nt o f t he exi s t i n g s ta tu s , b ut a l sop ro vok e s th e n e ed to d i ag no se t h e c au s e and e f fe c t . Suchdiagnosis is possible with the application of the PDCA cycle. Theperformance indicator provides us with the relevant information at the“Check” stage of this cycle. Based on this information (which may be
1 Hammond, Allen, A. Adriaanse, E. Rodenburg, D. Bryant, and R. Woodward. 1995.Environmental Indicators: A Systematic Approach to Measuring and Reporting on EnvironmentalPolicy Performance in the Context of Sustainable Development. A Report from the WorldResources Institute, Washington, DC.
2 This facet will be further expanded on in later sections of this Part of the Manual.
P A R T 6
195
positive or negative in nature), we may then decide on the necessarycorrective actions to be taken (i.e. at the “Act” stage of the cycle).
Note that corrective actions need not be taken o n l y when aperformance indicator indicates a negative response. They may a l s o betaken when the performance indicator indicates a positive response.Such actions would tend to be situation-specific, but in general they mayinvolve modifying that particular target qualitatively or quantitatively.
Remember that indicators are a lwa ys to be compared against abenchma rk . A stand-alone number generally fails to provide anyconcrete information, thus defeating the very purpose of devising aperformance indicator in the first place. A very simple example canillustrate this point. Let us say that the Director of a centre wishes toexamine the number of training sessions conducted during a year, and he/ she has the information that the number of such sessions was 15. Thenumber “15” by itself has no meaning, unless the Director c o m pa re sthis number with the number of training sessions targeted for that year(through the Training Needs Assessment or TNA). It follows naturallythat if the TNA targeted a number higher than 15, then the Centre’starget has not been met. In this way, the number of training sessionstargeted for that year in the TNA becomes the benchmark for thecentre.
Choosing an appropriate performance indicator is a not always aneasy task. No universal set of performance indicators which would beequally applicable in all cases exists. Thus, the choice of a particularperformance indicator is dependent on the context, and consequentlythe objectives and mission of the centre.
6.3 Criteria for Monitoring and Reviewing the
Progress of the Centre
If we were to re-examine a centre’s mission, right down to the tasks thatit has assigned itself, we would realize that its basic aim is to delivercleaner production-related services to its clients. These services havebeen already outlined and discussed in Parts 4 and 5 of this Manual. Itthen follows that the centre would be interested in tracking itsperformance in relation to the delivery of services.
The centre’s services could be assessed against four criteria, namely:

P A R T 6
196
• The input expended in delivering a service;
• The efficiency (output) with which the delivery was performed;
• The effectiveness (outcome) of the delivery; and
• The impact of the delivery.
This hierarchy will give rise to four types of indicators - namely, “inputindicators”, “output indicators”, “outcome indicators” and “impactindicators” respectively3.
As mentioned earlier, the choice of a particular performance indicator isdependent on the context, and consequently the objectives and missionof the centre. It is also possible that in the case of certain services (e.g.,policy advice), it may not be possible to calculate or arrive at an agreeddefinition for the input indicator. Therefore, it is possible that not allservices may contain all four performance indicators in the hierarchymentioned above.
Performance indicators are implicitly understood as having a quantitativebasis. However, it may not be possible to quantify impact indicators forcertain services, such as networking. In a similar vein, the impactindicator (or perhaps even the outcome indicator) of a service such as anawareness session could be that it t r i g g e re d a cleaner productiondemonstration project. Such a performance indicator would bequalitative in nature.
Further, there could be difficulties in apportioning contributions madeby two or more services to the observed outcome or impact. Forexample, a policy change can occur due to contributions made byawareness campaigns, training, networking, interfacing with financinginstitutions etc. The outcomes and impacts of different services ma yo v er l ap , as the performance of one service could depend on the
3 More information on performance indicators may be had from: World Bank,September, 1997 “Pollution Prevention and Abatement Handbook: Towards Cleaner Production.”
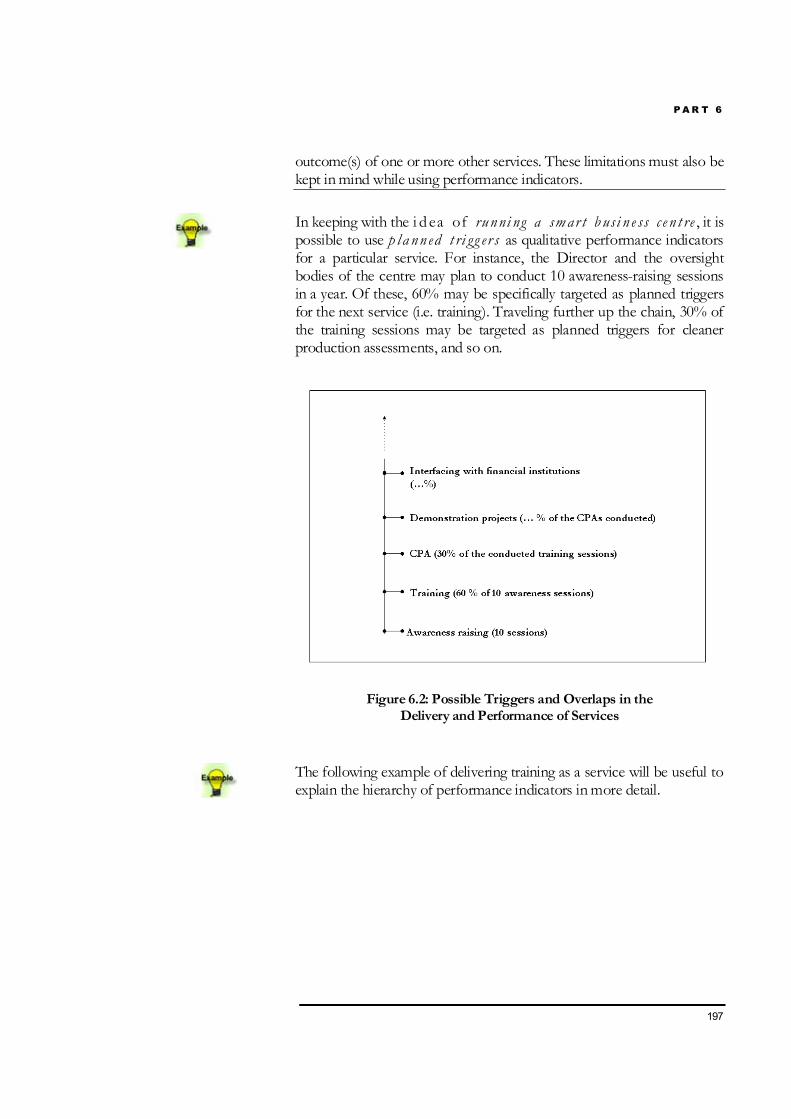
P A R T 6
197
outcome(s) of one or more other services. These limitations must also bekept in mind while using performance indicators.
In keeping with the i d ea of runni ng a smar t b usi n e ss c e n t re , it ispossible to use p l a nn ed t ri g g er s as qualitative performance indicatorsfor a particular service. For instance, the Director and the oversightbodies of the centre may plan to conduct 10 awareness-raising sessionsin a year. Of these, 60% may be specifically targeted as planned triggersfor the next service (i.e. training). Traveling further up the chain, 30% ofthe training sessions may be targeted as planned triggers for cleanerproduction assessments, and so on.
Figure 6.2: Possible Triggers and Overlaps in theDelivery and Performance of Services
The following example of delivering training as a service will be useful toexplain the hierarchy of performance indicators in more detail.
P A R T 6
198
It is common for Directors to plan that their centre gives a certainnumber of training sessions during the year, based on its TNA. Let ussay that the centre has organized a particular training session. Calculationof the input indicator could entail gathering data on the number ofperson-days spent in preparing for that particular session, rental chargesfor the space hired to host the session4, advertising costs to market thesession, the cost of material (stationery) and refreshments served duringthe session, and so on. The input indicator in this case would take theform of funds spent for that particular training session. Since theprovision of training sessions is a revenue-generating activity, theinformation from the input performance indicator will assist the centrein comparing the costs incurred for the session against the revenueearned from it.
The output indicator can be sourced from an inventory of the invitationssent for the training session versus the actual number of registeredtrainees for that particular session, specially designed feedback forms (seeAnnex 1), etc. In keeping with the PDCA cycle, any negative revelationsand responses must be examined in further detail (e.g., why was theaudience number below par? Was the session poorly advertised?).Adequate steps would need to be taken to ascertain the reason for lessattendance and ensure to the maximum extent possible that suchinstances do not recur.
The revenue earned from the training session could also form an inputto this performance indicator. Feedback from the specially designedfeedback forms could also provide leads to the centre’s staff as to whichtrainers may be more effective than others. We have seen that buildingthe capacity of the partner is also crucial and it reflects directly on theperformance of the centre. Therefore, one of the output indicators forthe training session may measure the extent of capacity-building achievedfor each identified partner.
Another possible set of outputs from the training session could be theidentification of positive (“plus”) aspects of the session, accompanied by
4 Assuming that the host institution may not absorb all or part of the costs for thetraining session.
Evaluation of atraining session and itsdocumentation isperhaps one of the mostimportant, and one ofthe least understoodparts of the trainingcycle. Many sessionstend to concentrate onthe output indicatorsand neglect the outcomeand impact indicators.
P A R T 6
199
suggested changes (“delta”) for the benefit of future sessions. Such anidentification is normally termed as a “Plus / Delta reflection”5. Onceagain, in keeping with the PDCA cycle, all negative revelations (deltas)must be examined in further detail. Further, subject to their relevance, allpositive revelations (plusses) must be replicated across all future trainingsessions.
The outcomes of the training session will investigate its effectiveness,and will require the centre to follow-up with the audience c onc e r ningt h e u se f u l ne s s o f t h e t ra i ni ng a f te r i t s ap p l i c a t i o n to t he i rwo rk . The latter may require a time lag of a few weeks to a few months,in order to accurately gauge the outcomes of the training session. Onceagain, in keeping with the PDCA cycle, any negative revelations andresponses must be examined in further detail.
The impacts of the training session may be ascertained by obtaininginformation on the number of trainees functioning as cleaner productiontrainers to date. However, a negative answer in this context does notimply a negative impact through the training session. Instead, itprovides an important trigger for the Director to continue “hand-holding”, or restructure future training sessions to ensure that a networkof cleaner production trainers is created.
Figure 6.3 provides an illustration of the above example at a genericlevel.
5 Refer to http://www.pekin.net/pekin108/quality_tools/plus_delta/ for moreinformation on plus/delta

P A R T 6
200
Figure 6.3: A Generic Approach to Assess the Performance of ServicesDelivered by the Centre
So far, we have noted the power that a properly designed and appliedperformance indicator wields. We have also noted that it may not bepossible to calculate or arrive at an agreed definition for quantitativeinput and / or impact indicator(s) for all services. Further (as seen fromthe illustration on training and the annexes), output and outcomeperformance indicators tend to ally for operations at the level ofindividual services, while input and impact performance indicatorstend to ally for operations at the level of the entire centre.
Thus, while performance indicators are elegant, their transformation inrealistic terms can be quite difficult. There is thus a need to arrive at acompromise, so that the issues related to complexities in calculation andimpracticalities of associated information overload may be addressedadequately.
Having said that, Table 6.1 provides us with some leads about settingperformance indicators for specific services of the centre.
In the next section, we shall examine the importance of documentationin the process of monitoring and reviewing the progress of the centre.
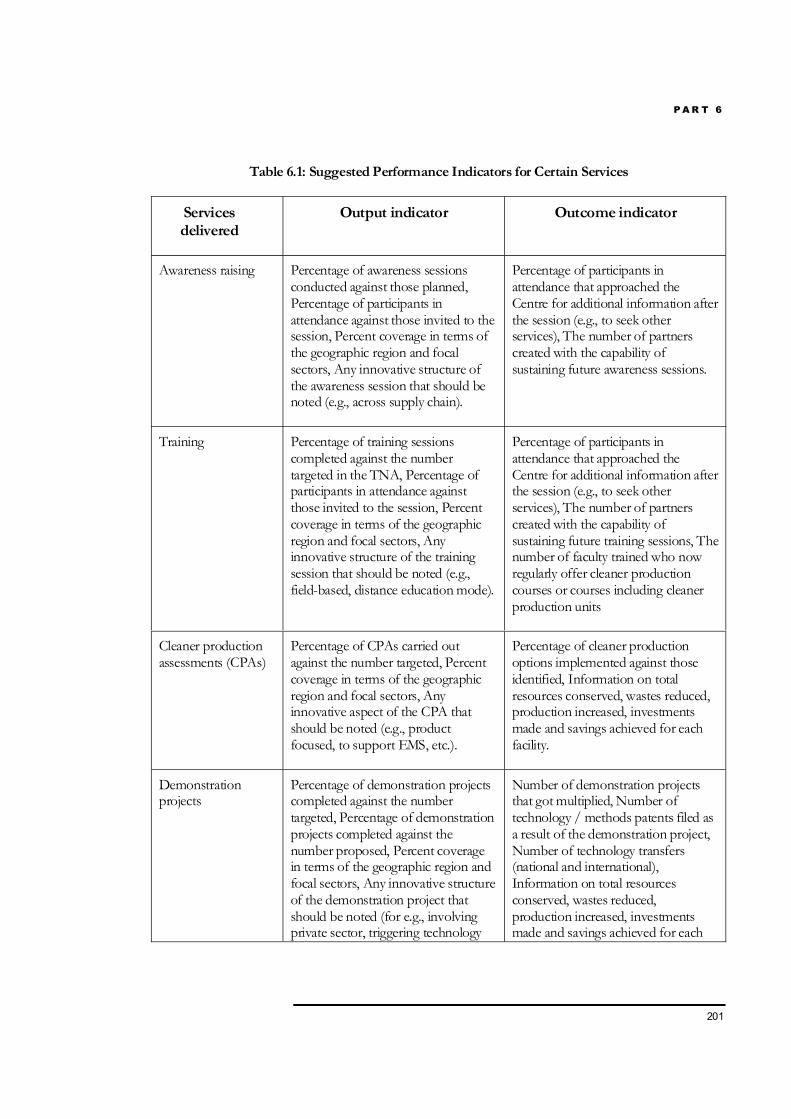
P A R T 6
201
Table 6.1: Suggested Performance Indicators for Certain Services
Servicesdelivered
Output indicator Outcome indicator
Awareness raising Percentage of awareness sessionsconducted against those planned,Percentage of participants inattendance against those invited to thesession, Percent coverage in terms ofthe geographic region and focalsectors, Any innovative structure ofthe awareness session that should benoted (e.g., across supply chain).
Percentage of participants inattendance that approached theCentre for additional information afterthe session (e.g., to seek otherservices), The number of partnerscreated with the capability ofsustaining future awareness sessions.
Training Percentage of training sessionscompleted against the numbertargeted in the TNA, Percentage ofparticipants in attendance againstthose invited to the session, Percentcoverage in terms of the geographicregion and focal sectors, Anyinnovative structure of the trainingsession that should be noted (e.g.,field-based, distance education mode).
Percentage of participants inattendance that approached theCentre for additional information afterthe session (e.g., to seek otherservices), The number of partnerscreated with the capability ofsustaining future training sessions, Thenumber of faculty trained who nowregularly offer cleaner productioncourses or courses including cleanerproduction units
Cleaner productionassessments (CPAs)
Percentage of CPAs carried outagainst the number targeted, Percentcoverage in terms of the geographicregion and focal sectors, Anyinnovative aspect of the CPA thatshould be noted (e.g., productfocused, to support EMS, etc.).
Percentage of cleaner productionoptions implemented against thoseidentified, Information on totalresources conserved, wastes reduced,production increased, investmentsmade and savings achieved for eachfacility.
Demonstrationprojects
Percentage of demonstration projectscompleted against the numbertargeted, Percentage of demonstrationprojects completed against thenumber proposed, Percent coveragein terms of the geographic region andfocal sectors, Any innovative structureof the demonstration project thatshould be noted (for e.g., involvingprivate sector, triggering technology
Number of demonstration projectsthat got multiplied, Number oftechnology / methods patents filed asa result of the demonstration project,Number of technology transfers(national and international),Information on total resourcesconserved, wastes reduced,production increased, investmentsmade and savings achieved for each
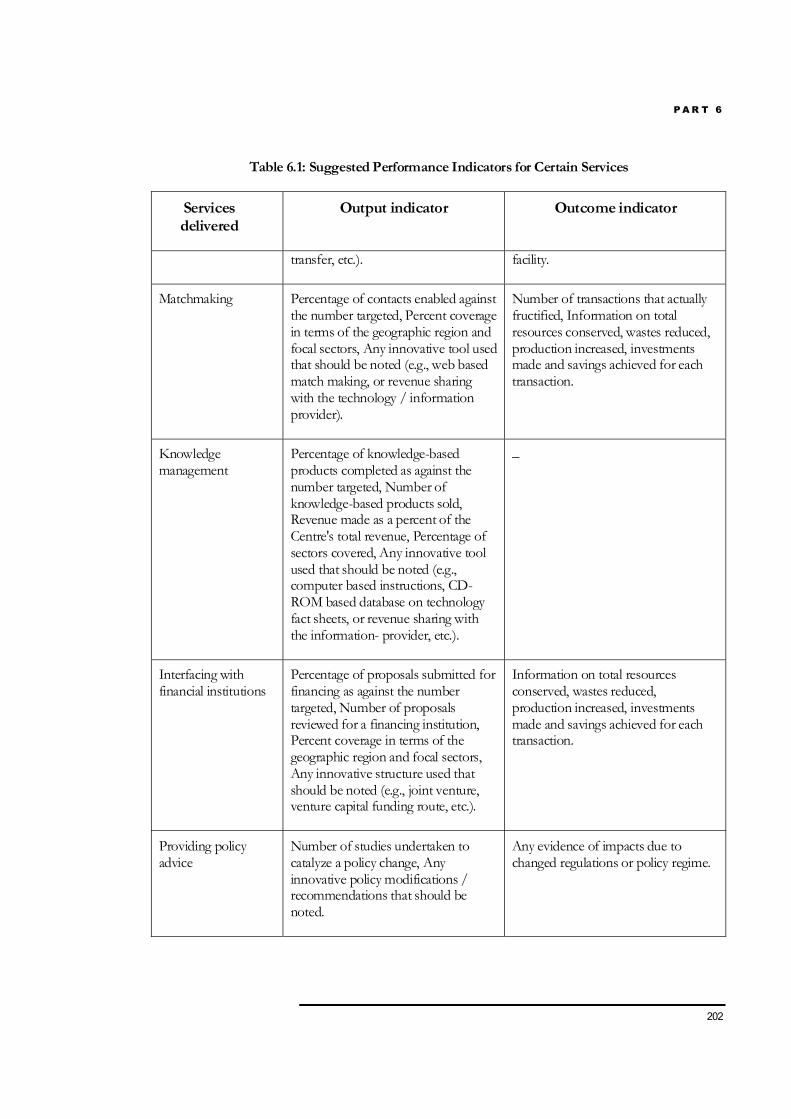
P A R T 6
202
Table 6.1: Suggested Performance Indicators for Certain Services
Servicesdelivered
Output indicator Outcome indicator
transfer, etc.). facility.
Matchmaking Percentage of contacts enabled againstthe number targeted, Percent coveragein terms of the geographic region andfocal sectors, Any innovative tool usedthat should be noted (e.g., web basedmatch making, or revenue sharingwith the technology / informationprovider).
Number of transactions that actuallyfructified, Information on totalresources conserved, wastes reduced,production increased, investmentsmade and savings achieved for eachtransaction.
Knowledgemanagement
Percentage of knowledge-basedproducts completed as against thenumber targeted, Number ofknowledge-based products sold,Revenue made as a percent of theCentre's total revenue, Percentage ofsectors covered, Any innovative toolused that should be noted (e.g.,computer based instructions, CD-ROM based database on technologyfact sheets, or revenue sharing withthe information- provider, etc.).
_
Interfacing withfinancial institutions
Percentage of proposals submitted forfinancing as against the numbertargeted, Number of proposalsreviewed for a financing institution,Percent coverage in terms of thegeographic region and focal sectors,Any innovative structure used thatshould be noted (e.g., joint venture,venture capital funding route, etc.).
Information on total resourcesconserved, wastes reduced,production increased, investmentsmade and savings achieved for eachtransaction.
Providing policyadvice
Number of studies undertaken tocatalyze a policy change, Anyinnovative policy modifications /recommendations that should benoted.
Any evidence of impacts due tochanged regulations or policy regime.
P A R T 6
203
6.4 Establishing a Data Collection System
Having understood what a particular performance indicator may or maynot entail (given the specifics of each situation), we should pay equalattention to its documentation. Continuing from our example of trainingin the previous section, documenting the outputs and outcomes oftraining sessions will help the centre understand and map out whatworks or does not work given a particular scenario.
The centre could then capitalize on the strengths of that particularsession, learn from its weaknesses, and resolve ways and means toimprove future training sessions within the same scenario, and possiblyeven across varying scenarios. The results of this documentation wouldnot only have to be fed into the centre’s TNA for its updating, but alsoforwarded to and discussed with the centre’s partners, as part of theircapacity building efforts. In essence, the centre would be monitoring itsperformance. Such documentation could be in the form of a Data Sheet(see Annex 2).
The sustained collation of such documentation over the long term, inthe form of a Summary Sheet (see Annex 3), will eventually help thecentre plan for its future. This repository of information would providethe centre with the information it needs to review its performance.
In sum, Annex 1 provides certain guidelines on the documentation thatwould be required after the completion of a training session. In essence,this is the feedback form that trainees would fill in and pass on to thestaff of the centre. Annex 2 provides a guideline for the Data Sheet foran individual training session. A member of the centre staff who has hada close association with that particular training session would completethis Data Sheet. Annex 3 provides a guideline for the Summary Sheet,which would be a result of the collation of summaries of all trainingsessions held during that year. The information for the Summary Sheetwill be compiled by centre staff in charge of delivering the service oftraining, and presented to the Director and oversight bodies of thecentre for their review, comments, and follow-up actions.
In this context, it is also important for the Director and the oversightbodies to give thought to the data collection time and effort requiredby each performance indicator under consideration. However, thisrequirement should be balanced evenly with the significance and ultimateconsequences of the data collection exercise. Having said that, the

P A R T 6
204
energies expended towards the data collection exercise should bereviewed as an investment, instead of a barrier or drain on resources.
The task of documentation is not as daunting as it sounds. In fact, thenumerous data management software available in the market could makethis task significantly easier for the centre.
6.5 Establishing a Reporting System
The Director and the oversight bodies of the centre will also have todecide on the nature of information to be reported, to whom, and how.It will also be useful (if not necessary) to report such information toexternal donors (if any) and other external parties (e.g., prospectiveclients). The Director will need to ensure that performance data arecollected in sufficient time so as to meet reporting deadlines, and thatthey are reported in a manner which is easy-to-understand and well-structured. There may be required formats for reporting, such as in theform of an Annual Report. Where the reporting of performanceindicators is mandated by external donors, the Directors and staff needto arrive at an understanding with the donor as to the required formatfor reporting, so as not to waste precious time reformatting data at a laterstage.
6.6 Obtaining Information on Changing Scenarios
and Updating the Business Plan of the Centre
The state of affairs in the real world is never static. A smart business isalways on the lookout for information on changing scenarios, so as tocontinually review and reposition its Business Plan as and when the needarises. So too must any Cleaner Production Centre. The marketingintelligence of the centre may reveal changing situations such as:
• Transitions in the economy;
• The need to revise the sectoral focus of the centre;
• The need to revise the geographical coverage of the centre;
• Induction of new stakeholders;
• Mentoring newer centres;
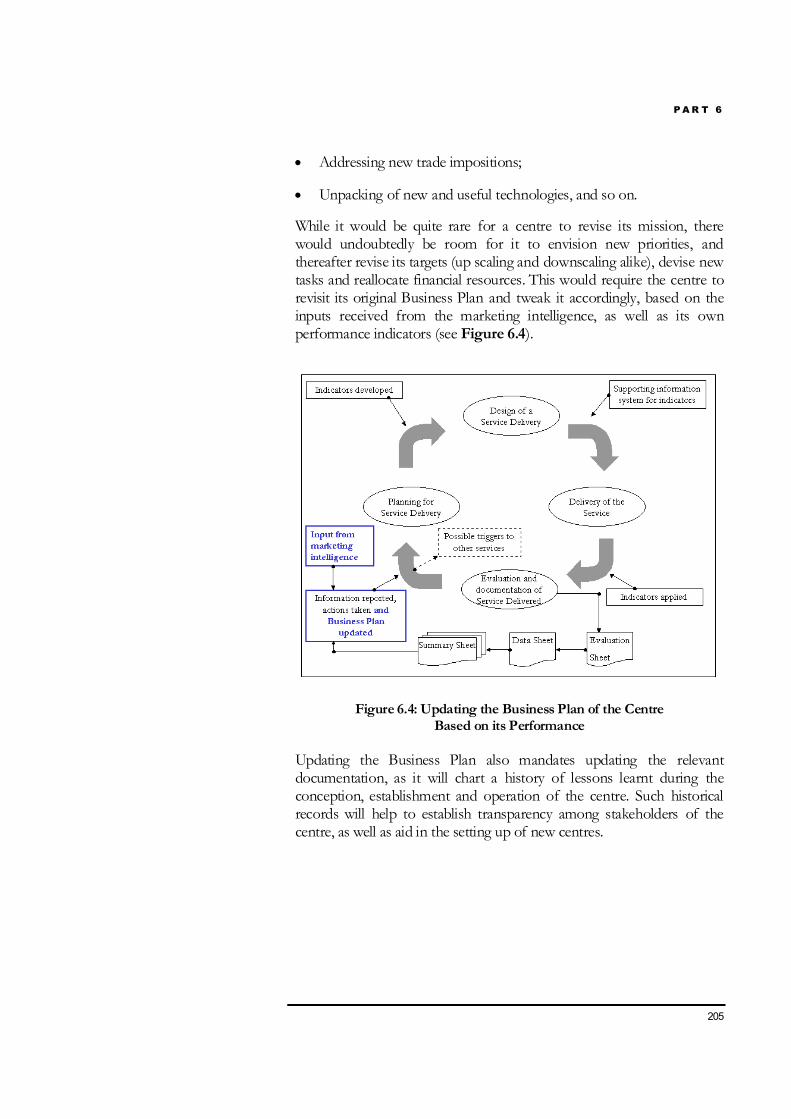
P A R T 6
205
• Addressing new trade impositions;
• Unpacking of new and useful technologies, and so on.
While it would be quite rare for a centre to revise its mission, therewould undoubtedly be room for it to envision new priorities, andthereafter revise its targets (up scaling and downscaling alike), devise newtasks and reallocate financial resources. This would require the centre torevisit its original Business Plan and tweak it accordingly, based on theinputs received from the marketing intelligence, as well as its ownperformance indicators (see Figure 6.4).
Figure 6.4: Updating the Business Plan of the CentreBased on its Performance
Updating the Business Plan also mandates updating the relevantdocumentation, as it will chart a history of lessons learnt during theconception, establishment and operation of the centre. Such historicalrecords will help to establish transparency among stakeholders of thecentre, as well as aid in the setting up of new centres.

P A R T 6
i
Annex 1
Sample Evaluation Sheet for a Training Session6
Date: __________
Kindly take a few moments to fill in this Evaluation Sheet. It will help us greatly in assessingthe usefulness of our training session. Do feel free to ask for any assistance if the needarises. Additional sheets will be provided to you if required. Thank you!
I. General information7
Name of the trainee: ___________________________________________
Name of the trainee's employer: ___________________________________
Contact details of the trainee (at the place of work): ____________________
Designation of the trainee: _______________________________________
Title of the training session attended: _______________________________
Name of the trainer8: ___________________________________________
6 This Evaluation Sheet will be filled in by the trainees. There could be some additions / deletions to theEvaluation Sheet depending on centre-specificity.
7 Some centres may want to consider excluding the fields concerning the name and contact details of thetrainee, so as to encourage “more frankness” in their opinions / evaluation.

P A R T 6
ii
Has the trainee had any previous exposure to cleaner production? Yes / No
If "Yes", how so?
II. Please provide a rating on a scale of 1 to 5 for the following items by placing a tick mark inthe relevant column. A rating of “1” denotes the lowest level of achievement while a rating of“5” denotes the highest level of achievement.
Item 1 2 3 4 5
(a) Venue
(b) Travel arrangements to thevenue
(c) Audio-visual equipment
(d) Refreshments
(e) Resources (reading materialand CD-ROM)
(f) Ability of the trainer tocommunicate with the audience
(g) Content of the training
(h) Technical skills of the trainer
8 If the training session is being conducted by more than one trainer, the relevant fields will need to bemodified accordingly.

P A R T 6
iii
III. Please feel free to provide any suggestions that would improve future training sessions(e.g., ways to make them more effective and relevant to your work, coverage of the trainingcontent, improving the training content, etc.)

P A R T 6
iv
Annex 2
Sample Evaluation Sheet for a Training Session9
Date: __________
Name and date of the training session for which this Data Sheet
is being filled: ______________________________________________________
Name of the centre staff completing this Data Sheet: ________________________
1.1 Calculation of the input indicator for the training session (assign a monetary value; add allcosts associated in conducting this session - rental charges for space, cost of stationery, cost ofrefreshments, cost of travel, charges paid to local consultants, monetary value of staff person-hours spent towards preparing for and conducting the session, etc.)
…
Input indicator = _______________
9 This Data Sheet will be filled in and analyzed by a member of the Centre's staff, who was directly involvedin planning and / or conducting that particular training session. The source of the information needed by thismember of staff will be the evaluation sheets from all the trainees of that training session. There could besome additions / deletions to the Data Sheet depending on Centre-specificity.

P A R T 6
v
1.2 Calculation of the output indicators for the training session (showing the calculations for theratios)
Ratio (Number of people trained in the session / number of people targeted for training inthat particular session) = _______________
Percentage of trainees who felt that the trainer was a good communicator =_______________
Percentage of trainees who felt that the trainer was technically skilled =_______________
Revenue earned from the training session = _______________
Ratio of revenue earned from the training session / cost of the training session =_______________
1.3 Calculation of the outcome indicator(s) for the training session
Percentage of trainees contacted by Centre Staff for follow-up: _______________
Percentage of contacted trainees who used the training they received in their work =_______________
1.4 Assessment of positive outcomes: Identify and list all positive outcomes collated from Boxes1.2 and 1.3, as well as any other information from the evaluation sheets (e.g. identification ofgood trainers, identification of good partners, etc.)
…
1.5 Assessment of negative outcomes: Identify and list the causes of negative outcomes collatedfrom Boxes 1.2 and 1.3 (e.g. some contacted trainees might not have used the training theyreceived in their work if an incorrect TNA was made)
…
1.6 Actions taken to alleviate the cause of each negative outcome identified in Box 1.5 (for each
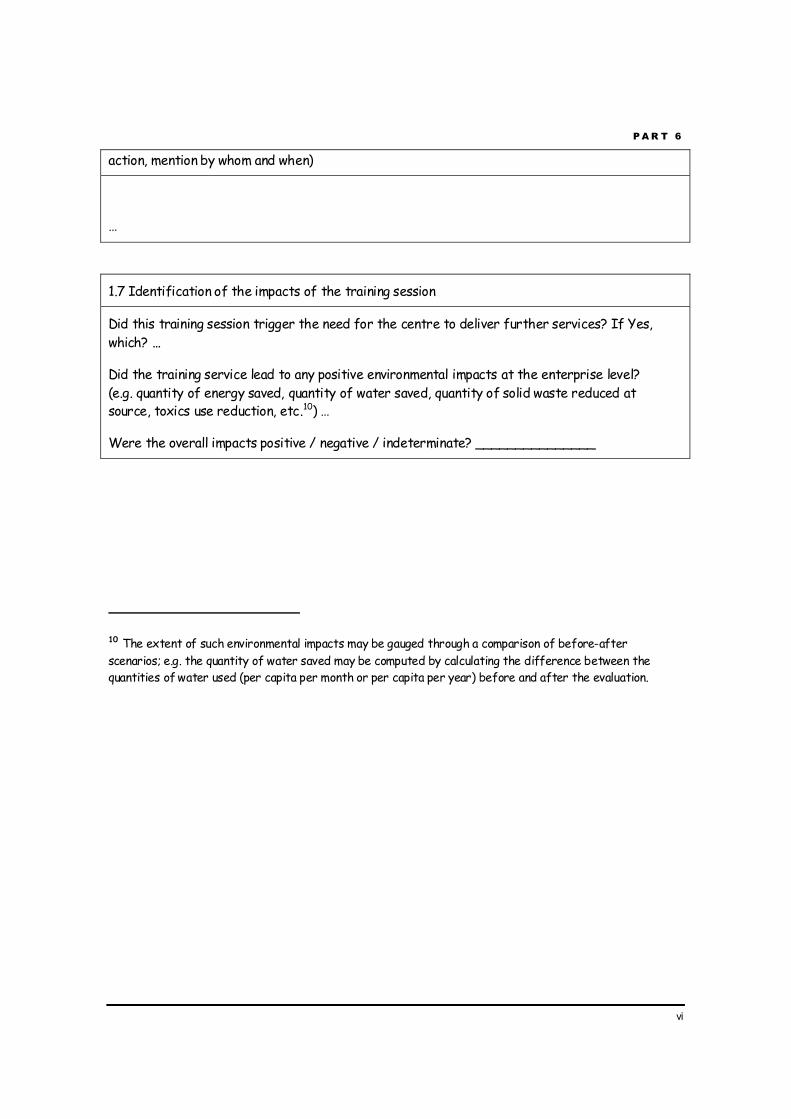
P A R T 6
vi
action, mention by whom and when)
…
1.7 Identification of the impacts of the training session
Did this training session trigger the need for the centre to deliver further services? If Yes,which? ...
Did the training service lead to any positive environmental impacts at the enterprise level?(e.g. quantity of energy saved, quantity of water saved, quantity of solid waste reduced atsource, toxics use reduction, etc.10) …
Were the overall impacts positive / negative / indeterminate? _______________
10 The extent of such environmental impacts may be gauged through a comparison of before-afterscenarios; e.g. the quantity of water saved may be computed by calculating the difference between thequantities of water used (per capita per month or per capita per year) before and after the evaluation.

P A R T 6
vii
Annex 3
Sample Summary Evaluation Sheet for Training SessionsConducted Throughout the Year11
Date: __________
Financial year for which this Summary Sheet is being filled: ____________________
Name of the centre staff filling in this Summary Sheet: _______________________
1.1 Assessing whether targets for training have been met
Number of training sessions conducted throughout the year = _______________
Number of training sessions targeted in the TNA for this year = _______________
Have the targets for training been met: Yes / No
1.2 Assessment of the inputs expended on all training sessions throughout the year, versus therevenue earned from them
11 This Summary Sheet will be filled in by a member of the centre's staff who is familiar with deliveringtraining as a service. The source of the information needed by this member of staff will be the data sheetsfrom all training sessions held during the year. The completed Summary Sheet will then be analyzed by theDirector of the centre. There could be some additions / deletions to the Summary Sheet depending oncentre-specificity.
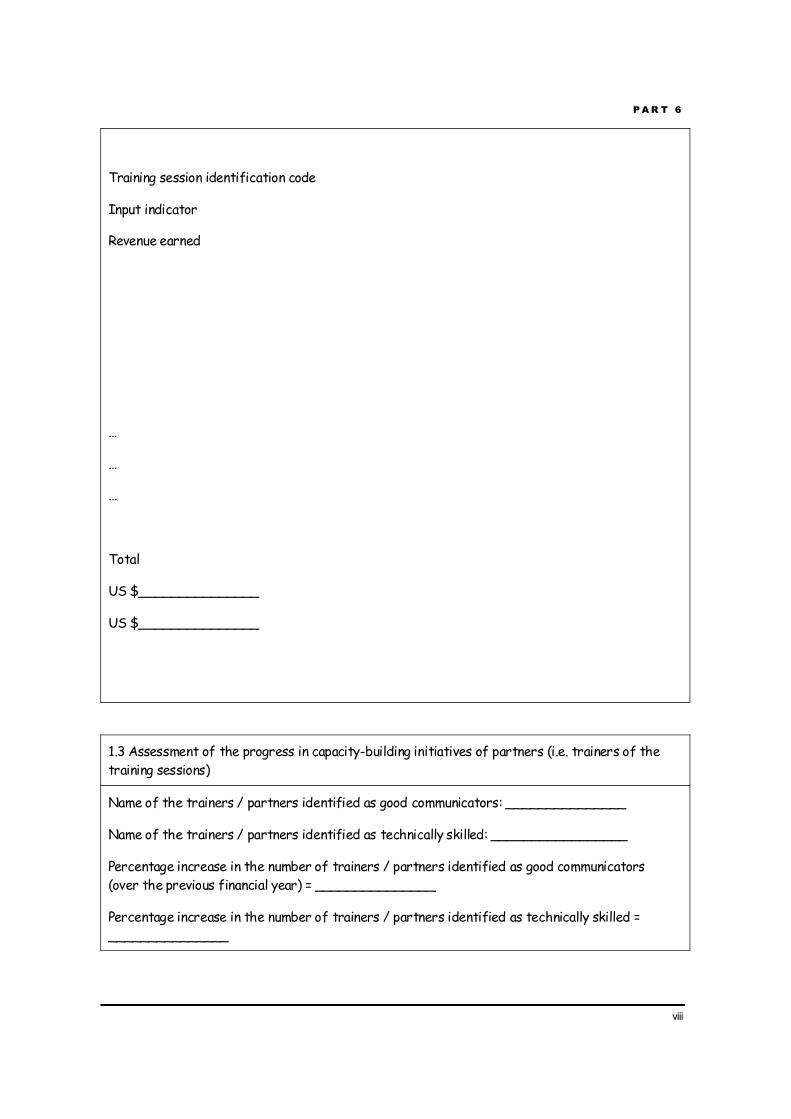
P A R T 6
viii
Training session identification code
Input indicator
Revenue earned
…
…
…
Total
US $_______________
US $_______________
1.3 Assessment of the progress in capacity-building initiatives of partners (i.e. trainers of thetraining sessions)
Name of the trainers / partners identified as good communicators: _______________
Name of the trainers / partners identified as technically skilled: _________________
Percentage increase in the number of trainers / partners identified as good communicators(over the previous financial year) = _______________
Percentage increase in the number of trainers / partners identified as technically skilled =_______________

P A R T 6
ix
1.4 Summary of positive outcomes from all training sessions given in this financial year
…
1.5 Summary of negative outcomes from all training sessions given in this financial year and theactions taken to alleviate each negative outcome
Training session identification code
Negative outcome
Description of the action taken
By whom and when?
Was the action taken effective?
…
…
…
1.6 Summary of identified impacts from all training sessions given in this financial year
Training session identification code
Description of the identified impact
Nature of the impact (positive / negative / indeterminate)

P A R T 6
x
…
…
…
1.7 Comments from the Director (including but not necessarily restricted to follow-up actions forall positive and negative indicators)
…
1.8 Comments from the oversight bodies (including but not necessarily restricted to follow-upactions for all positive and negative indicators)
…