Embed Size (px)
Citation preview
Canadian Environmental Protection Act, 1999
CANADIAN INSTITUTE OF TREATED WOODINSTITUT CANADIEN DES BOIS TRAITES
Guidance for Wood PreservationFacilities Reporting to the National
Pollutant Release Inventory
Manufacturers/ Treaters Steering CommitteeWood Preservation Sector Strategic Options Process
December 2002
Guidance for Wood Preservation Facilities Reporting to the National Pollutant Release Inventory
Acknowledgements
Prepared by: Manufacturers/ Treaters Steering Committee – National PollutantRelease Inventory (NPRI) Reporting Working Group
In collaboration with:
Paul A. Cooper & Associates, Toronto, Ontario
H. M. Rollins Company, Inc., Gulfport, MS, USA
NPRI National and Regional Offices
With contributions by:
Terry Mah, Environment CanadaAndrea Moore, Environment Canada
Adobe and Acrobat are trademarks of Adobe Systems Incorporated.D-U-N-S is a trademark of Dun & Bradstreet, Inc.Microsoft, MS, MS DOS, Windows and Windows NT are trademarks of the Microsoft Corporation.Other brand and product names are trademarks or registered trademarks of the respective holders.
The Chemical Abstracts Service (CAS) Registry Number is the property of the American ChemicalSociety and any use or redistribution, except as required in supporting regulatory requirements and/or forreports to the government when the information and the reports are required by law or administrativepolicy, is not permitted without the prior, written permission of the American Chemical Society.

Guidance for Wood Preservation Facilities Reporting to the National Pollutant Release Inventory
Table of Contents
PREFACE...................................................................................................................................... I
DISCLAIMER............................................................................................................................... III
I INTRODUCTION ........................................................................................................................ 1
II REPORTING TO THE NATIONAL POLLUTANT RELEASE INVENTORY ............................. 5OVERVIEW OF THIS GUIDE........................................................................................................... 5NPRI REPORTING REQUIREMENTS.............................................................................................. 5NPRI DEFINITIONS ..................................................................................................................... 6
By-products ........................................................................................................................... 6Contiguous Facility................................................................................................................ 6Disposal ................................................................................................................................ 6Facility ................................................................................................................................... 6Manufacture .......................................................................................................................... 7Other Use.............................................................................................................................. 7On-Site Release.................................................................................................................... 7Off-Site Transfer.................................................................................................................... 7Pollution Prevention (P2) ......................................................................................................7Process ................................................................................................................................. 7Production Ratio and Activity Index ...................................................................................... 8Recycling............................................................................................................................... 8Toxic Equivalency (TEQ) ...................................................................................................... 8
COMPLETING THE NPRI REPORTING FORMS AND SUBMITTING INFORMATION TO ENVIRONMENTCANADA’S NPRI OFFICES........................................................................................................... 9
III–A WOOD PRESERVATIVE MANUFACTURING ACTIVITIES.............................................. 10NPRI-LISTED SUBSTANCES RELATED TO WOOD PRESERVATIVE MANUFACTURING ACTIVITIES.... 10REPORTABLE SUBSTANCES SPECIFIC TO INDIVIDUAL PRESERVATIVE MANUFACTURERS.............. 11
III–B INFORMATION REQUIRED BY WOOD PRESERVATIVE MANUFACTURINGFACILITIES REPORTING TO THE NPRI .................................................................................. 12
III–C CHROMATED COPPER ARSENATE MANUFACTURE (CCA TYPE C) ........................ 12PROCESS DESCRIPTION............................................................................................................ 12POTENTIAL SOURCES OF EMISSIONS......................................................................................... 13
Estimation Methodologies to Determine Releases and Transfers—CCA ManufacturingFacilities .............................................................................................................................. 16Airborne Emissions .............................................................................................................16Liquid Emissions to Soil or Water ....................................................................................... 18Solid Wastes ....................................................................................................................... 18
SUMMARY OF NPRI REPORTING STEPS—CCA MANUFACTURING FACILITIES ............................. 19
III–D CREOSOTE MANUFACTURE .......................................................................................... 20PROCESS DESCRIPTION............................................................................................................ 20POTENTIAL SOURCES OF EMISSIONS OF CREOSOTE AND PAH CONSTITUENTS........................... 20

Guidance for Wood Preservation Facilities Reporting to the National Pollutant Release Inventory
Water Discharges to Sewer ................................................................................................ 20Air Discharges from Vents and Fugitive Losses ................................................................. 20
ESTIMATION METHODOLOGIES TO DETERMINE RELEASES AND TRANSFERS—CREOSOTEMANUFACTURING FACILITIES..................................................................................................... 24
Airborne Releases............................................................................................................... 24Releases to Surface Water ................................................................................................. 26Solid Waste Releases ......................................................................................................... 26
SUMMARY OF NPRI REPORTING STEPS—CREOSOTE MANUFACTURING FACILITIES.................... 27
IV–A WOOD PRESERVATION TREATMENT ACTIVITIES ...................................................... 29NPRI-LISTED SUBSTANCES RELATED TO WOOD PRESERVATION ACTIVITIES .............................. 29REPORTABLE SUBSTANCES SPECIFIC TO INDIVIDUAL WOOD PRESERVATION FACILITIES ............. 30
IV–B INFORMATION REQUIRED BY WOOD PRESERVATION FACILITIES REPORTING TOTHE NPRI ................................................................................................................................... 32
IV–C CCA WOOD PRESERVATION FACILITIES..................................................................... 33OVERVIEW................................................................................................................................ 33PROCESS DESCRIPTION............................................................................................................ 33POTENTIAL SOURCES OF EMISSIONS OF CCA COMPONENTS ..................................................... 34ESTIMATION METHODOLOGIES TO DETERMINE RELEASES AND TRANSFERS—CCA WOODPRESERVATION FACILITIES........................................................................................................ 37
Air Emissions ...................................................................................................................... 37Wastewater Discharges ...................................................................................................... 39Water Discharges to Soil..................................................................................................... 43Releases Caused by Remedial Action................................................................................ 45Release Due to Catastrophic Events .................................................................................. 46Releases of Solid Hazardous Waste................................................................................... 47
SUMMARY OF NPRI REPORTING STEPS—CCA WOOD PRESERVATION FACILITIES..................... 47
IV–D AMMONIACAL COPPER ZINC ARSENATE (ACZA) WOOD PRESERVATIONFACILITIES ................................................................................................................................ 49
OVERVIEW................................................................................................................................ 49PROCESS DESCRIPTION............................................................................................................ 49ESTIMATION METHODOLOGIES TO DETERMINE RELEASES AND TRANSFERS—ACZA WOODPRESERVATION FACILITIES........................................................................................................ 53
Airborne Emissions of Ammonia ......................................................................................... 53SUMMARY OF NPRI REPORTING STEPS—ACZA WOOD PRESERVATION FACILITIES................... 55
IV–E AMMONIACAL COPPER QUATERNARY (ACQ) WOOD PRESERVATION FACILITIES56OVERVIEW................................................................................................................................ 56PROCESS DESCRIPTION............................................................................................................ 56CHEMICAL DISCHARGES............................................................................................................ 56ESTIMATION METHODOLOGIES TO DETERMINE RELEASES AND TRANSFERS FOR ACQ WOODPRESERVATION FACILITIES........................................................................................................ 59SUMMARY OF NPRI REPORTING STEPS—ACQ WOOD PRESERVATION FACILITIES..................... 60
IV–F CREOSOTE WOOD PRESERVATION FACILITIES......................................................... 61OVERVIEW................................................................................................................................ 61PROCESS DESCRIPTION............................................................................................................ 61

Guidance for Wood Preservation Facilities Reporting to the National Pollutant Release Inventory
CHEMICAL DISCHARGES............................................................................................................ 62ESTIMATION METHODOLOGIES TO DETERMINE RELEASES AND TRANSFERS FOR CREOSOTE WOODPRESERVATION PLANTS............................................................................................................ 66
Process Air Emissions ........................................................................................................ 66Wastewater Discharges ...................................................................................................... 70Releases Caused by Remedial Action................................................................................ 71Release Due to Catastrophic Events .................................................................................. 72Transfers in Solid Hazardous Waste................................................................................... 73
SUMMARY OF NPRI REPORTING STEPS — CREOSOTE WOOD PRESERVATION FACILITIES.......... 73
IV-G: PENTACHLOROPHENOL WOOD PRESERVATION FACILITIES ................................. 75PROCESS DESCRIPTION............................................................................................................ 75SOURCES OF RELEASES AND TRANSFERS OF NPRI-LISTED SUBSTANCES.................................. 79METHODS USED FOR RELEASE AND TRANSFER ESTIMATIONS .................................................... 81
Releases to the Air from Closed Tanks and Vessels .......................................................... 82Releases to the Air from Open-Topped Tanks.................................................................... 83Releases to the Air from Piping, Valves, Flanges and Associated Equipment ................... 83Releases to the Air from Treated Wood During Cool-Down and Storage........................... 83Releases to Air from the Management of Water Containing Pentachlorophenol ................ 84Releases to Surface Water from Point-Source Discharges and Storm Water Run-off ....... 84On-Site Releases to Land ................................................................................................... 84Transfers of NPRI-Listed Substances................................................................................. 85Automated Release and Transfer Calculations for the NPRI Reports ................................ 85
REFERENCES ........................................................................................................................... 86
APPENDICES............................................................................................................................. 89
Guidance for Wood Preservation Facilities Reporting to the National Pollutant Release Inventory
List of Tables
TABLE 3.1: PROBABLE REPORTABLE COMPOUNDS WITH CAS NUMBERS — CCAMANUFACTURING FACILITIES ...................................................................................... 13
TABLE 3.2: PROBABLE REPORTABLE COMPOUNDS WITH CAS NUMBERS—CREOSOTEMANUFACTURINGFACILITIES ..................................................................................................................23
TABLE 4.1: PROBABLE REPORTABLE COMPOUNDS WITH CAS NUMBERS—CCA MANUFACTURING FACILITIES ..............................................................................34
TABLE 4.2: EMISSION FACTORS FROM CCA TREATMENT (MRI 1999, NPI 1999) ...........................39TABLE 4.3: PROBABLE REPORTABLE COMPOUNDS WITH CAS NUMBERS—ACZA
PRESERVATION FACILITIES..........................................................................................50TABLE 4.4: PROBABLE REPORTABLE SUBSTANCES WITH CAS NUMBERS—ACQ
PRESERVATION FACILITIES .....................................................................................59TABLE 4.5: PROBABLE REPORTABLE COMPOUNDS WITH CAS NUMBERS—CREOSOTE WOOD
PRESERVATION FACILITIES..........................................................................................63TABLE 4.6: EMISSION FACTORS FOR WOOD TREATED WITH CREOSOTE .........................................69TABLE 4.7: PROBABLE REPORTABLE SUBSTANCES WITH CAS NUMBERS—PRESERVATION
FACILITIES USING PENTACHLOROPHENOL....................................................................76TABLE 4.8: INFORMATION USED TO CALCULATE RELEASES OR TRANSFERS FROM
PENTACHLOROPHENOL WOOD PRESERVING FACILITIES ...............................................82
Guidance for Wood Preservation Facilities Reporting to the National Pollutant Release Inventory
List of Figures
FIGURE 3.1. CCA CONCENTRATE MANUFACTURING PLANT LAYOUT ..............................................14FIGURE 3.2. CCA CONCENTRATE MANUFACTURING PLANT POTENTIAL EMISSIONS ........................15FIGURE 3.3. CREOSOTE MANUFACTURING PLANT LAYOUT.............................................................21FIGURE 3.4: CREOSOTE MANUFACTURING PLANT — SOURCE OF POTENTIAL EMISSIONS ...............22FIGURE 4.1: CCA PRESERVATION PLANT LAYOUT.........................................................................35FIGURE 4.2: POTENTIAL SOURCES OF EMISSIONS — CCA WOOD PRESERVATION FACILITIES........36FIGURE 4.3: ACZA PRESERVATION PLANT LAYOUT.......................................................................51FIGURE 4.4: POTENTIAL SOURCES OF RELEASES FROM AN ACZA WOOD PRESERVATION
PLANT ........................................................................................................................52FIGURE 4.5: ACQ WOOD PRESERVATION PLANT LAYOUT .............................................................57FIGURE 4.6: POTENTIAL SOURCES OF RELEASES FROM AN ACQ WOOD PRESERVATION
PLANT ........................................................................................................................58FIGURE 4.7: CREOSOTE TREATING PLANT LAYOUT........................................................................64FIGURE 4.8: SOURCES OF RELEASES FROM CREOSOTE WOOD PRESERVATION PLANTS.................65FIGURE 4.9: NPRI FLOW DIAGRAM — WOOD PRESERVATION USING PENTACHLOROPHENOL
PRESSURE PROCESS ..................................................................................................77FIGURE 4.10: NPRI FLOW DIAGRAM — WOOD PRESERVATION USING PENTACHLOROPHENOL
THERMAL PROCESS ....................................................................................................78

Guidance for Wood Preservation Facilities Reporting to the National Pollutant Release Inventory
i
Preface
Environment Canada and Health Canada developed a process for managingenvironmental contaminants under the Canadian Environmental Protection Act (CEPA).This process involved establishing a Priority Substances List, performing anassessment of toxicity, and developing a risk-management strategy through a StrategicOptions Process (SOP). As part of the Strategic Options Process for the WoodPreservation Sector, recommendations for the most effective options for reducingexposure to the following CEPA-toxic substances were developed by stakeholders:
• chromium VI• inorganic arsenic compounds• polycyclic aromatic hydrocarbons (PAHs)• creosote-impregnated waste materials• polychlorinated dibenzodioxins (dioxins)• polychlorinated dibenzofurans (furans), and• hexachlorobenzene (HCB).
The Wood Preservation Sector SOP developed recommendations for those industry-related activities that cause the release of these CEPA-toxic substances. The finalreport from the Issue Table, Strategic Options for the Management of CEPA-ToxicSubstances from the Wood Preservation Sector – Final Report from the Issue Table,was made publicly available in July 1999.1 This publication is referred to as theStrategic Options Report (SOR). For wood preservative manufacturers and treatment plants, Environment Canada’sNational Pollutant Release Inventory (NPRI) was identified in the SOR as themechanism that will be used to track releases and transfers of the above-noted CEPA-toxic substances on an annual basis. As identified in Recommendation B3 of the SOR,all wood preservative manufacturing and treatment facilities in Canada must examinethe criteria and determine if they are required to report all releases and transfers ofthe applicable CEPA-toxic substances each year. The number of substances listed on the NPRI is subject to change as substances canbe added, removed or regrouped. Refer to the Canada Gazette Part I Notice for theyear being reported for the relevant list of reportable substances to the NPRI.
1 The final report from the Issue Table can be downloaded electronically from the following Environment
Canada Web site: http://www.ec.gc.ca/sop/wood-bois/pubs/sor_e.htm.

Guidance for Wood Preservation Facilities Reporting to the National Pollutant Release Inventory
ii
It is important to note the following: The Wood Preservation Sector SOP only addresses CEPA-toxic substances that aremanufactured, processed or used by the wood preservation sector. If facilities meet thereporting criteria for other NPRI-listed substances, such as ammonia – total, copper(and its compounds), zinc (and its compounds), mercury, naphthalene, and anthracene,criteria air contaminants, or other NPRI listed substances they are legally obligated tofile an NPRI report to Environment Canada by the deadline date. This guide only addresses wood preservatives that contain the CEPA-toxic substanceslisted above and one formulation of ammoniacal copper quaternary (ACQ). Facilitiesshould consult the guidance material and Canada Gazette Part I Notice for the yearbeing reported to determine the reporting requirements for other wood preservativesand their components including ACQ and Copper Azole.
Guidance for Wood Preservation Facilities Reporting to the National Pollutant Release Inventory
iii
Disclaimer The Guidance for Wood Preservation Facilities Reporting to the National PollutantRelease Inventory (referred to as the Guide) is intended only to assist owners andoperators of wood preservative manufacturing and treatment facilities in reportingreleases and transfers to the NPRI. This Guide does not replace or substitute in anymanner the official guidance documents listed below that are published and provided bythe NPRI for reporters. All wood preservation manufacturing and treatment facilitiesshould refer specifically to the following NPRI documents for the year being reported:
• Guide for Reporting to the National Pollutant Release Inventory• Supplementary Guide for Reporting to the National Pollutant Release
Inventory – Alternate Thresholds• Supplementary Guide for Reporting Criteria Air Contaminants (CACs) to the
National Pollutant Release Inventory (NPRI) Furthermore, should any inconsistencies be found between this Guide, the official NPRIguidance documents identified above, and the official Canada Gazette Part I Notice, theCanada Gazette Part I Notice for the year being reported will prevail.

Guidance for Wood Preservation Facilities Reporting to the National Pollutant Release Inventory
1
I Introduction Environment Canada and Health Canada developed a process for managingenvironmental contaminants under the Canadian Environmental Protection Act (CEPA)that consisted of the following stages:
• identification of potentially toxic chemicals;• assessment of the risk to the Canadian environment and population; and• identification and review of the options available to reduce environmental and/or
public health risk posed by toxic chemicals. This process involved establishing a Priority Substances List, performing anassessment of toxicity, and developing a risk-management strategy through a StrategicOptions Process (SOP). In the SOP, recommendations for the most effective optionsfor reducing exposure to toxic substances were developed by stakeholders. An Issue Table was established in December 1994 to address issues of concern fromthe wood preservation sector. The Issue Table, with representation from the federalgovernment, provincial governments, wood preservative manufacturers, woodpreservative treatment facilities, industrial users of treated wood products, andenvironmental non-government organizations (ENGOs), met as a whole and in variousworking groups over a four-year period to determine:
• chemical release data, and• criteria to determine priority areas for investigation prior to making
recommendations for the most effective options for reducing exposure to toxicsubstances.
The wood preservation sector covers a wide range of areas related to the manufactureand use of the heavy-duty wood preservatives chromated copper arsenate (CCA),ammoniacal copper zinc arsenate (ACZA), creosote, and pentachlorophenol (PCP).Activities included under the sector definition are wood preservative manufacture,application of preservative to the wood, the use of treated wood products, themanagement of used treated wood, the transportation of both preservative chemicalsand treated products, and the contamination of sites. It was determined that the CEPA-toxic substances may be released to the environment from the above areas of activity,as shown in the table following.

Guidance for Wood Preservation Facilities Reporting to the National Pollutant Release Inventory
2
CEPA-Toxic Substance Wood Preservative
Chromium VI, Inorganic arseniccompounds
Chromated Copper Arsenate (CCA)
Inorganic arsenic compounds Ammoniacal Copper Zinc Arsenate(ACZA)
Polycyclic Aromatic Hydrocarbons (PAHs) CreosoteCreosote-impregnated waste materials CreosotePolychlorinated dibenzodioxins (Dioxins)Polychlorinated dibenzofurans (Furans)Hexachlorobenzene (HCB)
Pentachlorophenol (PCP)2
The Wood Preservation Sector SOP developed recommendations for those activitiesthat may cause the release of these CEPA-toxic substances. The final report from theIssue Table, Strategic Options for the Management of CEPA-Toxic Substances from theWood Preservation Sector – Final Report from the Issue Table, was made publiclyavailable in July 1999.3 This publication is referred to as the Strategic Options Report(SOR).
The recommendations identified by the Issue Table were categorized into the followingfour sections:
A. General Recommendations;B. Manufacturers and Treaters recommendations;C. Consumer Treated Wood Product Recommendations; andD. Industrial Treated Wood User Recommendations.
The SOR summarized the recommendations for the wood preservative manufacturersand treating facilities as follows:
1. Mandatory reporting of CEPA-toxic releases through the National PollutantRelease Inventory (NPRI).
2. Voluntary implementation of “best management practices” or therecommendations found in Recommendations for the Design and Operation ofWood Preservation Facilities (March 1999). This is referred to as the Technical
2 Polychlorinated dibenzodioxins, polychlorinated dibenzofurans, and hexachlorobenzene are found as
micro-contaminants in pentachlorophenol.
3 The final report from the Issue Table can be downloaded electronically from the following EnvironmentCanada Web site: http://www.ec.gc.ca/sop/wood-bois/pubs/sor_e.htm.
Guidance for Wood Preservation Facilities Reporting to the National Pollutant Release Inventory
3
Recommendations Document (TRD). It was acknowledged that woodpreservative manufacturing plants already have adequate management systemsin place.
3. Program implementation will be overseen by a multi-stakeholder steeringcommittee that will recommend mandatory implementation of the TRD should thevoluntary approach be unsuccessful.
4. Evaluation of the success of the program will be conducted by the steeringcommittee twice within the five years following the program's commencement.
5. The TRD implementation program will continue beyond the five-year evaluationprogram.
More specifically regarding the mandatory reporting of CEPA-toxic releases throughthe NPRI, Recommendation B3 (page 51 of the SOR) states the following:
Annual Reporting for All PlantsB3. It is recommended that all wood preservation treatment facilities and
wood preservative chemical manufacturers report their emissions ofCEPA-toxic substances as listed below to the National PollutantRelease Inventory (NPRI) beginning in 2001 (this will cover the year2000 releases). The NPRI list will be expanded for the woodpreservation sector to include dioxins, furans, PAHs (a list specific tothe wood preservation sector), and hexachlorobenzene. The industrywill also report on chromium (and its compounds), arsenic (and itscompounds), naphthalene and anthracene, which are already listed onNPRI. The reporting requirements will be developed to ensureduplicative and inconsistent reporting will not occur. Moreover, releasedata generated above and beyond the normal NPRI requirements bythe sector are to be compiled separately from other NPRI data and notaggregated with data from other industries. This reporting programimplementation is contingent upon the outcome of the currentEnvironment Canada review of NPRI.
The Issue Table agreed that reporting CEPA-toxic substances to the NPRI will provide abenchmark as well as a mechanism for tracking anticipated reductions in releases andtransfers on a yearly basis that result from upgrades of treating facilities and practices.
For more information on the progress of the implementation of the above-notedrecommendation, refer to Environment Canada’s website athttp://www.ec.gc.ca/sop/wood-bois/.
What is the National Pollutant Release Inventory?

Guidance for Wood Preservation Facilities Reporting to the National Pollutant Release Inventory
4
The NPRI is at the centre of the Government of Canada’s efforts to track toxicsubstances. It is the only nation-wide, publicly accessible program in Canada thatprovides information on pollutants being released to the environment and transferred fordisposal. Since its inception in 1992, the role of the NPRI has expanded to include thegathering of information on the recycling of NPRI substances as well as on pollution-prevention activities being undertaken by facilities.
How has the NPRI been modified to accommodate the requirements of the WoodPreservation Sector SOP?
As identified in the SOR recommendations, reporting requirements specific to the woodpreservation sector were incorporated into the Canada Gazette Part I Notice for NPRIand published on December 25, 1999. As such, most, if not all wood treatment facilitiesshould meet the reporting requirements for the CEPA toxic substances covered by thisguide. Reporting requirements for all NPRI-listed substances are subject to change andso the Canada Gazette Part I notice for the year being reported should be consulted forthe relevant reporting criteria.
This Guide, together with the guidance documents published by NPRI for the year beingreported, should be consulted by owners and operators of wood preservativemanufacturing and wood preservation treating facilities in reporting to the NPRI.
More information on the NPRI is available on Environment Canada’s Web site atwww.ec.gc.ca/pdb/npri.

Guidance for Wood Preservation Facilities Reporting to the National Pollutant Release Inventory
5
II Reporting to the National Pollutant Release Inventory
Overview of this Guide
This Guide is broken into two specific categories: wood preservative manufacturers andwood preservation treatment facilities. More specifically, this Guide providesinformation on the following:
• reporting requirements for NPRI-listed substances used in wood preservation. • methodologies to estimate on-site releases and off-site transfers of NPRI-
listed substances applicable for wood preservative manufacturing and woodpreservation treatment facilities; and
• examples of how to estimate on-site releases and off-site transfers of
substances for the purposes of reporting to the NPRI. For a full listing of NPRI substances, please refer to the Canada Gazette Part I Notice orthe Guide for Reporting to the National Pollutant Release Inventory for the year beingreported.
NPRI Reporting Requirements
Report Due Dates Reporting deadlines for the NPRI are subject to change and should be verified in theCanada Gazette Part I Notice for the year being reported. PAST EXAMPLE:
Canada Gazette Part INotice
Reporting Year Due Date
December 25, 1999 2000 calendar year June 1, 2001

Guidance for Wood Preservation Facilities Reporting to the National Pollutant Release Inventory
6
NPRI Definitions All definitions are subject to modification. For the most relevant definitions, pleaseconsult the Canada Gazette Part I Notice and the Guide for Reporting to the NPRI forthe year being reported. Other NPRI definitions can also be found in the above twodocuments. Wood Preservation
"Wood preservation" means the use of a preservative for the preservation ofwood by means of heat or pressure treatment, or both, and includes themanufacture, blending, or reformulation of wood preservatives for that purpose.
By-products
"By-product" means an NPRI substance which is incidentally manufactured,processed or otherwise used at the facility at any concentration, and released onsite to the environment, released to surface waters or transferred off site fordisposal. By-products are included in the calculation of the mass-reporting threshold forsome NPRI substances in order to capture large-volume, low-concentrationreleases and transfers. Verify in the Canada Gazette Part I Notice for the yearbeing reported which substances require the inclusion of by-products in masscalculations.
Contiguous Facility
"Contiguous facility" means all buildings, equipment, structures and stationaryitems that are located on a single site or on contiguous or adjacent sites and thatare owned or operated by the same person and that function as a singleintegrated site and includes wastewater collection systems that discharge treatedor untreated wastewater into surface waters.
Disposal “Disposal” means the final disposal of the material (e.g., landfill), or treatment(e.g., stabilization) prior to final disposal.
Facility
"Facility" means a contiguous facility and a pipeline installation.
Guidance for Wood Preservation Facilities Reporting to the National Pollutant Release Inventory
7
Manufacture “Manufacture” means to produce, prepare or compound an NPRI substance andincludes the coincidental production of an NPRI substance as a by-product (seedefinition) as a result of the manufacturing, processing or other use of othersubstances.
Other Use
The terms “other use” and “otherwise used” encompass any use of an NPRIsubstance at a facility that does not fall under the definitions of “manufacture” or“process”. This includes the use of the substance as a chemical processing aid,manufacturing aid or some other ancillary use. Other use does not includeroutine janitorial or facility grounds maintenance. "Other use" includes any use of a substance, listed in Schedule 1 of the CanadaGazette Part I Notice, relevant to the purpose of the facility which is not includedunder the definitions of "manufacture" or "process".
On-Site Release
An “on-site release” is an on-site discharge of a pollutant to the environment.This includes emissions to air, discharges to surface waters, on-site releases toland and deep-well underground injection, within the boundaries of the facility.
Off-Site Transfer
An “off-site transfer” is a shipment of an NPRI substance to an off-site location fordisposal or recycling.
Pollution Prevention (P2)
"Pollution prevention" means the use of processes, practices, materials,products, substances or energy that avoid or minimize the creation ofpollutants and waste, and reduce the overall risk to the environment orhuman health.” P2 seeks to eliminate the causes of pollution rather than managing it afterit has been created. It encourages the kinds of changes that are likely tolead to lower production costs, increased efficiencies and more effectiveprotection of the environment. Pollution prevention does not include on-site treatment activities (pollution control) or off-site recycling and disposalactivities.
Process
Guidance for Wood Preservation Facilities Reporting to the National Pollutant Release Inventory
8
“Process” means the preparation of an NPRI substance, after itsmanufacture, for commercial distribution. Processing includes thepreparation of a substance with or without changes in physical state orchemical form. The term also applies to the processing of a mixture orformulation that contains an NPRI substance as one component, as wellas the processing of “articles”.
Production Ratio and Activity Index
A “production ratio” is the ratio of “reporting-year production” to “prior-yearproduction” that will permit year-to-year comparisons of changes in the total on-site releases plus off-site transfers. An “activity index” is based on a variable,other than production, that is the primary influence on the total, and that will inturn permit comparison of changes from year to year.
Recycling
“Recycling” refers to activities that keep a material or a component of the materialfrom becoming a waste destined for disposal. Recyclable materials may becleaned, regenerated or reprocessed to their original specifications and reusedfor their original purpose. They may also be used for an entirely differentpurpose without any pretreatment or modification. Components may berecovered or reclaimed from the recyclable material or the material may be usedas a fuel for energy recovery. The recyclable material may be used in themanufacture of another product. For the purposes of the NPRI, recycling alsoincludes substances sent back to the manufacturer or supplier for reprocessing,repackaging, resale or for credit or payment.
Toxic Equivalency (TEQ)
"TEQ" is the relative toxicity of a particular congener of dioxins/furans to thetoxicity of 2,3,7,8-TCDD, the most toxic congener. The relative toxicity iscomputed by the use of toxic equivalent factors (TEFs), relating the toxicity ofspecific congeners to that of 2,3,7,8-TCDD, which is assigned a TEF of 1. TheGuide for Reporting to the National Pollutant Release Inventory should beconsulted to obtain these weighting factors for the year being reported.
Guidance for Wood Preservation Facilities Reporting to the National Pollutant Release Inventory
9
Completing the NPRI Reporting Forms and SubmittingInformation to Environment Canada’s NPRI Offices For more information regarding the completion of the NPRI report using the NPRIreporting software, all wood preservative manufacturing facilities and woodpreservation facilities should refer to the Guide for Reporting to the National PollutantRelease Inventory for the year being reported. The NPRI report and a signedStatement of Certification must be submitted to your regional Environment Canadaoffice no later than the date specified in the Canada Gazette Part I Notice of thatreporting year.

Guidance for Wood Preservation Facilities Reporting to the National Pollutant Release Inventory
10
III–A Wood Preservative Manufacturing Activities
NPRI-listed Substances Related to Wood PreservativeManufacturing Activities The following substances may have to be reported to NPRI by companies in the woodpreservative manufacturing sector:
• anthracene• ammonia (total)• arsenic (and its compounds)• biphenyl• chromium (and its compounds)• copper (and its compounds)• cresol (all isomers, including m-,o- and p-)(and its salts)• criteria air contaminants (including oxides of nitrogen (expressed as NOx),
sulphur dioxide (SO2), carbon monoxide (CO), volatile organic compounds(VOCs), total particulate matter (TPM), particulate matter with a diameter = 2.5microns (PM2.5), and particulate matter with a diameter = 10 microns (PM10))
• dimethyl phenol• hexavalent chromium compounds• mercury (and its compounds)• naphthalene• PAHs• quinoline (and its salts)• zinc (and its compounds)
The NPRI-listed substances shown above provide a summary of the substances thatmay be applicable for wood preservative manufacturers.
It is important to note the following: If facilities meet the reporting criteria for other NPRI-listed substances not shown above,they are legally obligated to file an NPRI report on those substances to EnvironmentCanada by the date specified in the Canada Gazette Part I Notice for the year beingreported.
In what concentrations can some of the above-listed substances be found incertain wood preservatives?
• Chromated Copper Arsenate (CCA): CCA-C on a solids basis containsapproximately 24.7% wt chromium, 22.7% wt arsenic and 14.8% wt copper.

Guidance for Wood Preservation Facilities Reporting to the National Pollutant Release Inventory
11
• Ammoniacal Copper Zinc Arsenate (ACZA): ACZA on a solids basis typicallycontains about 39.9% wt copper, 20.1% wt zinc, and 16.3% wt arsenic.Ammonium hydroxide solutions are typically at 1.95% wt.
Reportable Substances Specific to Individual PreservativeManufacturers CCA and ACZA Manufacturers: The following list comprises examples of substances that should be considered forreporting. Refer to the Canada Gazette Part I Notice for the year being reported for thespecific reporting criteria for these substances in determining if reporting is necessary.
• ammonia (total)• arsenic (and its compounds)• chromium (and its compounds)• copper (and its compounds)• criteria air contaminants (including oxides of nitrogen (expressed as NOx),
sulphur dioxide (SO2), carbon monoxide (CO), volatile organic compounds(VOCs), total particulate matter (TPM), particulate matter with a diameter = 2.5microns (PM2.5), and particulate matter with a diameter = 10 microns (PM10))
• hexavalent chromium compounds• mercury (and its compounds)• zinc (and its compounds)
Creosote Manufacturers: The following list comprises examples of substances that should be considered forreporting. Refer to the Canada Gazette Part I Notice for the year being reported for thespecific reporting criteria for these substances in determining if reporting is necessary.
• criteria air contaminants (including oxides of nitrogen (expressed as NOx),sulphur dioxide (SO2), carbon monoxide (CO), volatile organic compounds(VOCs), total particulate matter (TPM), particulate matter with a diameter = 2.5microns (PM2.5), and particulate matter with a diameter = 10 microns (PM10))
• mercury (and its compounds)• PAHs
This Guide, together with the guidance documents published by NPRI for the year beingreported, should be consulted by owners and operators of wood preservativemanufacturing facilities in reporting to the NPRI.

Guidance for Wood Preservation Facilities Reporting to the National Pollutant Release Inventory
12
III–B Information Required by Wood PreservativeManufacturing Facilities Reporting to the NPRI
In order to make an accurate determination of the quantity of releases each year, awood preservative manufacturing facility must gather as much information as possibleabout its processes, waste shipments, and releases to the environment. This requires adetailed investigation of the sources of releases to each medium (air, water and land),identification of the components that contribute to those releases or transfers, and theestablishment of the proper engineering approaches needed to quantify those releasesor transfers. The facility must use all relevant monitoring data and emissionsmeasurements collected to meet other regulatory requirements, or as part of routineplant operations, or to the extent a facility has such data. No monitoring data or emissions measurements need to be collected specifically forNPRI reporting. In the absence of data, reasonable estimates must be made usingpublished emission factors, mass balance calculations, or engineering calculations.However, the rationale for the Wood Preservation Sector SOP recommendation that allapplicable CEPA-toxic substances be reported to the NPRI for all wood preservativemanufacturers was to determine whether the adoption of the SOP recommendationswould result in a reduction of those specific substances to the environment. It istherefore important that an accurate and quantitative estimate of releases and transfersbe made such that any improvements by the sector can be demonstrated anddocumented.
III–C Chromated Copper Arsenate Manufacture (CCA type C)
Process Description (Carrol-Hatch 1998, El Rayes 1998) The production process of CCA-C is described in Figure 3.1. Liquid chromic acid (CrO3in water solution at 60% concentration), arsenic acid (As2O5 in water solution at 75%)and solid copper (oxide) are mixed for approximately two hours to form a 50%concentrate. The concentrate is stored in a settling tank, then filtered and transferred toa storage tank. The liquid components are hard piped from their storage tanks to thereactor to minimize air emissions. Reactor vents are equipped with a wet scrubber toremove most airborne emissions. Storage tank areas are protected by secondarycontainment (paved and dyked) to collect drips or spills and avoid discharge to surfacewater or groundwater. Paved areas are coated with an impervious chemical resistantmembrane. Storage tank vents are equipped with wet scrubbers. The process is a closed cycle and the facilities are enclosed so that the risk of stormwater contamination is minimized. Process water and wastewater are recycled formakeup of the CCA concentrate. Solid wastes and sludges containing copper,chromium (mainly hexavalent), and arsenic generated in the process from chemical

Guidance for Wood Preservation Facilities Reporting to the National Pollutant Release Inventory
13
impurities are washed to remove any soluble components. The wash water is used asmakeup water for the concentrate. Any residual solids are then disposed of in ahazardous landfill. Arsenic in air emissions is monitored for personnel exposure and thescrubber is tested for efficiency every two to three years.
Potential Sources of Emissions (Figure 3.2) • Material Unloading Area: drippage at raw materials unloading area (liquid discharge
of arsenic and chromium—recovered and recycled), airborne dust (copper), aerosol(arsenic and chromium), potential for catastrophic spills.
• Raw Materials and Finished Product Storage Areas: spills, leaks (recovered and
recycled). • Mixing Reactor: aerosol at vents (copper, chromium and arsenic). • Finished Product (CCA concentrate) Loading Area: drips (recovered and
recycled), aerosol (all components), potential for catastrophic spills. Table 3.1: Probable Reportable Compounds with CAS Numbers — CCA Manufacturing Facilities
Compound
CAS* Registry Number
Arsenic pentoxide (arsenic acid) 1303-28-2 Chromium trioxide (chromic acid) 12018-01-8 Copper oxide 1317-38-0 Criteria air contaminants (including oxidesof nitrogen (expressed as NOx), sulphurdioxide (SO2), carbon monoxide (CO),volatile organic compounds (VOCs), totalparticulate matter (TPM), particulate matterwith a diameter = 2.5 microns (PM2.5), andparticulate matter with a diameter = 10microns (PM10))
Refer to the Canada GazettePart I Notice for the yearbeing reported.
* CAS denotes Chemical Abstracts Service.

Guidance for Wood Preservation Facilities Reporting to the National Pollutant Release Inventory
14
Figure 3.1. CCA Concentrate Manufacturing Plant Layout
Legend: Valve PipeVentPress. pumpFilterRoofed and paved areaDrip basin SumpCurb
Copper oxide storageUnloading area Loading area
V
Water Effluent V
VChromic acid tank
V Reactor
Settling and
filtration
Storage of CCA
concentrate Arsenic acid tank
V

Guidance for Wood Preservation Facilities Reporting to the National Pollutant Release Inventory
15
Figure 3.2. CCA Concentrate Manufacturing Plant PotentialEmissions
Raw material delivery
Chemical storage
Reactor
Settling/Filtration
CCA concentrate storage
Con
tam
inat
ed so
lutio
n
PROCESS
Loading area
SpillsLeaks
Spills Leaks
LeaksDrips
SpillsDrips
LIQUIDWASTE
Spills Leaks
Sludge
SludgeSolid w.
Landfill
SOLID WASTE
Aerosol
Vents
Aerosol
Aerosol
AIR BORNE
Aerosol
Solid waste
LeaksDrips

Guidance for Wood Preservation Facilities Reporting to the National Pollutant Release Inventory
16
Estimation Methodologies to Determine Releases and Transfers—CCAManufacturing Facilities Estimates of emissions can generally be made by one of the following procedures:
• sampling or direct measurement• mass balance• engineering calculations, or• emission factors
However, as noted above, one of the primary objectives of using the NPRI is to monitorannual releases and transfers of applicable CEPA-toxic substances from the woodpreservation sector. Annual release and transfer information obtained from the NPRIwill demonstrate if the measures adopted and implemented by the wood preservativemanufacturing and treating sector, in response to the Wood Preservation Sector SOP,are successful in reducing releases of CEPA-toxic substances.
Facilities that meet the NPRI reporting criteria for CACs should refer to theSupplementary Guide for Reporting Criteria Air Contaminants (CACs) to the NationalPollutant Release Inventory (NPRI) and other reference documents to estimateemissions of CACs to air.
In consideration of this fact, it is very important that any estimation methodologies usedprovide an accurate and quantitative measurement such that an evaluation of year-to-year improvements can be monitored and determined. For example, emission factorsbased on general average process estimates of releases per unit of chemicalmanufactured, will not provide this quantitative comparison—unless emission factorscan be modified based on control measures that are put in place.
Airborne Emissions
Aerosol emissions are possible at the raw materials unloading and final product loadingareas, storage tank vents and reactor vents. These are generally fugitive uncontrolledlosses, except where emission-control technologies are employed, such as wetscrubbers on the storage and reactor vents. Airborne concentrations should bemonitored periodically by plants at different locations for occupational health control. Ifmonitoring is performed, this can provide an estimate of the average concentration ofemitted substances in the manufacturing facility; however, without information on airflowor air-exchange rates of the building(s), emission rates cannot be determined.
Estimation by Direct MeasurementThe airborne concentrations of NPRI substances are measured directly at variouslocations in a plant several times per year, representing the entire building volume, attimes when different activities are ongoing. The average concentrations (C in mg/m3
air) weighted with the fraction of time that the activity is ongoing (F) is determined; the
Guidance for Wood Preservation Facilities Reporting to the National Pollutant Release Inventory
17
volume of the facility is V m3; the average air exchange rate is determined for the facility(R in building volume per day); the relevant number of days per year is determined (D).
The estimated emission is (C x V x R x D x 10-3 mg/g) g per year.
Example
The air quality is measured four times per year during the mixing process, when theplant is idle, and at different locations in the plant. The overall average airborneconcentrations are based on the average; mixing accounts for 40% of plant time (F =0.4) and no mixing activity accounts for 60% of the time (F = 0.6):
Cu: 3.0 x 10⁻³ mg/m3 when mixing and 0.8 x 10⁻³ mg/m3 when idleAs: 2.2 x 10⁻³ mg/m3 when mixing and 0.5 x 10⁻³ mg/m3 when idleCr: 2.2 x 10⁻³ mg/m3 when mixing and 0.5 x 10⁻³ mg/m3 when idle
The volume of the facility, V, is 15,000 m3; the building air exchange rate is 0.6 timesper hour (14.4 times per day = R); the emissions are mainly from the storage tanks andare assumed to be similar 365 days per year (D).
Then the estimated emissions are:
Cu: (0.4 x 3.0 x 10-3 + 0.6 x 0.8 x 10-3) x 15,000 x 14.4 x 365= 132,450 mg or 132 g or 0.13 kg per year
Cr: (0.4 x 2.2 x 10-3 + 0.6 x 0.5 x 10-3) x 15,000 x 14.4 x 365= 93,030 mg or 93 g or 0.09 kg per year
As: (0.4 x 2.2 x 10-3 + 0.6 x 0.5 x 10-3) x 15,000 x 14.4 x 365= 93,030 mg or 93 g or 0.09 kg per year
Estimation by emission factorTypical process emission factors have been generated by the U.S. EPA (MRI 1999) andthe Australian Timber Preservers’ Association (NPI 1999) for the CCA treating process,but none have been developed for the CCA manufacturing process. Since theseemission factors are based on the volume of wood treated, involve releases at thetreating retort and associated vacuum pumps, and are developed for facilities withgenerally fewer emission-control technologies installed compared to manufacturingfacilities, they are not appropriate for estimating releases by CCA manufacturingfacilities; however they may be used to assist manufacturers in developing their ownemission factors.
Estimation by Mass Balances and Engineering CalculationsSince aerosol releases are very low, mass-balance estimates cannot accuratelydetermine airborne releases. Also, since engineering calculations are dependent on

Guidance for Wood Preservation Facilities Reporting to the National Pollutant Release Inventory
18
properties like vapour pressure of components (considered negligible for inorganiccompounds), this approach is not appropriate for estimating airborne emissions.
Liquid Emissions to Soil or Water
As it is expected that all plant process water is recovered and recycled, and incidentalleaks are contained and recovered, the main potential source of liquid emissions to soilor ground/surface water is catastrophic spills at the liquid loading or unloading sites.These estimates are determined by measuring the amount spilled, minus amountsrecovered, multiplied by the concentration of NPRI substance in the spilled liquid.
Example
At a plant, 75% liquid arsenic acid (H3AsO4), which consists of 39.6% elemental arsenic,is received by tanker at the raw materials unloading site. A hose breaks and 54 kg ofarsenic acid sprays beyond the containment; 29.6 kg of this acidic solution isimmediately recovered by wiping up the spill. The release to soil is as follows:
(54 - 29.6) or 24.4 kg lost at 39.6% As or 9.66 kg As
The recovered amount (29.6 kg x 39.6% = 11.72 kg As) if not re-solubilized andrecycled will be transferred off site for disposal and must be reported as such.
Solid Wastes
Production sludge, used filters, and other solid wastes are collected for several monthsbefore being transferred off site for disposal. Prior to shipment, this solid waste shouldbe sampled and analyzed for elemental copper, chromium and arsenic using anappropriate analytical technique. If the elements were analyzed as ppm (mg/kg), theemissions are calculated as follows:
ppm Cu x mass of solid waste (kg) x 10-6 mg/kgppm Cr x mass of solid waste (kg) x 10-6 mg/kgppm As x mass of solid waste (kg) x 10-6 mg/kg(determined on an annual basis)
Example
A plant transfers 650 kg solid waste off site on June 30, 2002 (analyzed at the followingconcentrations: 11,500 ppm Cu, 20,600 ppm Cr and 12,200 ppm As). A secondshipment of 760 kg solid waste is sent off site on December 31 (analyzed at:13,050 ppm Cu, 21,430 ppm Cr and 18,200 ppm As). The reportable amounts are:
Cu: ((11,500 x 650 x 10-6) + ((13,050 x 760 x 10-6)) = 17.4 kg

Guidance for Wood Preservation Facilities Reporting to the National Pollutant Release Inventory
19
Cr: ((20,600 x 650 x 10-6) + ((21,430 x 760 x 10-6)) = 29.7 kg
As: ((12,200 x 650 x 10-6) + ((18,200 x 760 x 10-6)) = 21.8 kg
Summary of NPRI Reporting Steps—CCA Manufacturing Facilities
1. Gather information on sources of releases to air, soil, groundwater, storm water,and off-site releases.
2. Determine reporting thresholds for NPRI reportable substances from CanadaGazette Part I Notice for the year being reported.
3. Estimate quantities released on site or transferred off site, based on monitoringdata, engineering calculations or emission factors.
Sample Release Summary Form
Substance Type of Release Release Kg Released
Arsenic Process Stack emissions to airProcess Fugitive aerosol and
vapourStorm water Release to sewerCatastrophic releases Release to
soil/groundwaterHazardous waste Solid waste transferred
to hazardous-waste site
Guidance for Wood Preservation Facilities Reporting to the National Pollutant Release Inventory
20
III–D Creosote Manufacture
Process Description(Carrol-Hatch 1998, El Rayes 1998)
The production process of creosote is described in Figure 3.3. Coal tar from steel millcoke ovens arrives by rail car and is distilled to separate different fractions, includingcoal tar creosote used for wood preservation. The creosote is condensed from thedistillation tower into storage tanks. Creosote is pumped from the storage tanks into railtankers for shipment to the treating plants.
Potential Sources of Emissions of Creosote and PAHConstituents(Figure 3.4)
Water Discharges to Sewer
Process and wastewater are collected and treated (API oil/ water separation) prior todischarging to a municipal sewer system. Storm water run-off from the site isdischarged to the sewers.
Air Discharges from Vents and Fugitive Losses
• Loading and unloading areas: spills to the ground and drips. These areas should be paved and any wastes collected from leaks and spills shouldbe recycled on site as stock feed for the distillation unit. Vapours generated duringloading are recovered using an oil scrubber system.
• Storage tanks: spills and leaks.
Air emissions should be controlled by a scrubber system allowing recovery of mostvolatile components from tank vents.
• Distillation plant: leaks and spills to ground.
The process and handling areas should be paved and contained; air emissionsshould be collected and recycled or destroyed by an appropriate technology, such asincineration.
• Solid wastes generated:
Most solid waste materials are recycled back into the process or transferred to a steelmill as fuel; the remainder is disposed of at an off-site hazardous-waste landfill.

Guidance for Wood Preservation Facilities Reporting to the National Pollutant Release Inventory
21
Figure 3.3. Creosote Manufacturing Plant Layout
Legend: Valve PipeVentPress. pumpVacuum pumpFilterRoofed and paved areaDrip basin DrainageCurb
VLoading areaUnloading area
VVP
Dis
tilla
tion
colu
mn
Oth
er
prod
ucts
VVP
Storage V
Oil /water V
Storage V
vp

Guidance for Wood Preservation Facilities Reporting to the National Pollutant Release Inventory
22
Figure 3.4: Creosote Manufacturing Plant — Source of PotentialEmissions
Coal tar delivery
Chemical storage
Distillation column
Creosote storageOil/
Wat
er se
para
tor
PROCESS
Rail car loading area
SpillsDrips
Drips
SpillsDrips
SpillsDrips
LIQUID WASTE
Drips
Sludge
Landfill or steel mill
SOLID WASTE
Solid waste
Aerosol
Vents
Aerosol
Aerosol
Vapour
AIR BORNE
Aerosol
Waste water treatment
Sewer

Guidance for Wood Preservation Facilities Reporting to the National Pollutant Release Inventory
23
Table 3.2: Probable Reportable Compounds with CAS Numbers —Creosote Manufacturing Facilities
Compound CAS RegistryNumber*
VFT TypicalAnalysis**
Typical AnalysisAWPA P1 creosote†
% %
Anthracene 120-12-7 2.43 1.7Biphenyl 92-52-4 1.57 1.3Naphthalene 91-20-3 9.53 12.9
Aniline 62-53-3 - 0.21o-Cresol*** 108-39-4 - 0.10m-Cresol*** 95-48-7 - 0.12p-Cresol*** 106-44-5 - 0.12Dimethyl phenol 1300-71-6 - 0.41Quinoline (and its salts) 91-22-5 0.97 0.59
Benzo(a)anthracene 56-55-3 0.89 0.50Benzo(a)phenanthrene 218-01-9 - 0.10Benzo(a)pyrene 50-32-8 0.17 0.20Benzo(b)fluoranthene 205-99-2 - -Benzo(e)pyrene 192-97-2 - 0.20Benzo(g,h,I)perylene 191-24-2 0.04 0.10Benzo(j)fluoranthene 205-82-3 - 0.12Benzo(k)fluoranthene 207-08-9 - 0.22Dibenz(a,j)acridine 224-42-0 - -Dibenzo(a,h)anthracene 53-70-3 <0.01 -Dibenzo(a,I)pyrene 189-55-9 - -7H-Dibenzo(c,g)carbazole 194-59-2 - -Fluoranthene 206-44-0 5.76 4.6Indeno(1,2,3-c,d)pyrene 193-39-5 0.04 -Perylene 198-55-0 - 0.10Phenanthrene 85-01-8 14.26 11.2Pyrene 129-00-0 3.44 3.7

Guidance for Wood Preservation Facilities Reporting to the National Pollutant Release Inventory
24
Criteria air contaminants(including oxides ofnitrogen (expressed asNOx), sulphur dioxide(SO2), carbon monoxide(CO), volatile organiccompounds (VOCs), totalparticulate matter (TPM),particulate matter with adiameter = 2.5 microns(PM2.5), and particulatematter with a diameter =10 microns (PM10))
Refer to theCanadaGazette Part INotice for theyear beingreported.
NA**** NA****
* CAS denotes Chemical Abstracts Service** Environment Canada (2000a)*** Listed together on the NPRI as cresol (and its isomers)(and its salts)**** Not applicable† Betts (1990)
Estimation Methodologies to Determine Releases and Transfers—Creosote Manufacturing Facilities
Airborne Releases
Estimates of fugitive PAH releases, as aerosols or vapour, can be made based onmonitoring results for occupational health if the air-exchange rate of the facility is known(see example for CCA manufacturing facility above). Alternatively, emission factors canbe developed and used by the manufacturer; at this time such emission factors have notbeen developed. Stack or vent emissions should be estimated from the average stackoutlet concentration and average airflow rates.
Facilities that meet the NPRI reporting criteria for CACs should refer to theSupplementary Guide for Reporting Criteria Air Contaminants (CACs) to the NationalPollutant Release Inventory (NPRI) and other reference documents to estimateemissions of CACs to air.
Example:Calculating Air Releases of PAHs Using Stack Monitoring Data
Stack testing has determined that PAHs are detected in a facility’s stack gases atconcentrations (g per dry standard cubic metre of gas) as follows:
The moisture content in the stack is estimated to be 10%.

Guidance for Wood Preservation Facilities Reporting to the National Pollutant Release Inventory
25
The stack gas velocity was determined to be 1.8 m/s.The diameter of the stack is 0.3 m.
To calculate the annual air release of the PAHs from the stack:
1. Calculate volumetric flow of stack gas stream:
Volumetric flow = (gas velocity) x Pi x (internal stack diameter)2 / 4]= (1.8 m/s) x [3.142 x (0.3m)2 / 4]= 0.13 m3/s
2. Correct volumetric flow for moisture content in stack gas stream:
Stack gases may contain large amounts of water vapour. The concentration of thesubstance in the exhaust is often presented on a ‘dry gas’ basis. For an accurateemission rate, correct the stack or vent gas-flow rate in Step 1 for the moisturecontent in the facility’s stack gas. This can be done as follows:
Corrected dry gas volumetric flow = (volumetric flow) x (1 - fraction of water vapour)= (0.13 m3/s) x (1 - 0.10)= 0.11 m3/s
3. Estimate annual stack emissions to air:Multiply the dry gas volumetric flow rate by the concentration of PAHs measured inthe stack gases, as follows:
R air = C x V x CF x H
Where:
R air = Annual release of PAHs to air (g/year)C = Stack gas concentration of PAHs (g/dry standard m3)V = Hourly volumetric flow rate of combustion stack gas (m3/hour)
CF = Capacity factor, fraction of time that the facility operates on an annual basis(e.g., 0.85)
H = Total hours in a year (8,760 hours/year)
Example:Calculations Based on Direct Measurements(emission factors not available)

Guidance for Wood Preservation Facilities Reporting to the National Pollutant Release Inventory
26
Substance Concentration(g/m3), C
Air flow(m3/h), V
Hours/yactive
(CF x H)
Emissions(g/year), R
Naphthalene 0.06 412 3,842 95,000Anthracene 0.02 412 3,842 31,700Benzo(a)anthracene
3 x 10⁻⁵ 412 3,842 47.5
Benzo(b)fluoranthene
6 x 10⁻⁵ 412 3,842 95.0
Benzo(k)fluoranthene
4 x 10⁻⁶ 412 3,842 6.3
Benzo(a)pyrene 2 x 10⁻⁶ 412 3,842 3.2
Releases to Surface Water
Example:Estimating Water Releases of PAHs to Surface Water
A facility discharges 4,550 litres per day of treated wastewater into surface water. Theaverage measured emissions for the facility are 1.2 mg naphthalene and 0.02 mgbenzo(a)pyrene per litre of wastewater discharged. The emission values reflect thelevel of PAH control that is occurring at the facility. This facility operates 365 days eachyear. Estimate the annual release of PAHs to surface water.
Calculate the annual release of PAHs to water:
• Naphthalene release (kg) = 4,550 L/ day x 365 days x 1.2 mg naphthalene x 10-6 kg/ mg = 1.99 kg naphthalene
• Benzo(a)pyrene release (kg) =
4,550 L/ day x 365 days x 0.02 mg benzo(a)pyrene x 10-6 kg/ mg= 0.033 kg benzo(a)pyrene
Solid Waste Releases
Under NPRI reporting requirements, the disposal of NPRI-listed substances to a landfillon site is considered a release to land. The disposal of NPRI-listed substances to alandfill off site is considered to be an off-site transfer.
Example:

Guidance for Wood Preservation Facilities Reporting to the National Pollutant Release Inventory
27
Estimating Releases On Site to Land in the Disposal of Sludge
A facility generates approximately 1 kg of dry sludge per 4,000 litres of wastewatertreated at the facility’s on-site industrial wastewater treatment plant. The facilityoperations produce approximately 100,000 litres of wastewater per day. The facilityoperates 350 days per year. Monitoring results indicate that the sludge, on average,contains approximately 140 mg naphthalene and 1.8 mg benzo(a)pyrene per kg drysludge produced. All of the sludge from the facility is placed in an on-site landfill. Tocalculate the annual amount of PAHs released to land from this facility, as a function ofland disposal of the sludge contaminated with PAHs:
1. Determine the amount of sludge produced per day from the wastewater treatmentprocess.
Total sludge = (1 kg/4,000 L) x 100,000 L/day = 25 kg/day
2. Determine the amount of PAHs contained in the sludge produced each day.
Total amount of PAHs in sludge= (total sludge generated) × (average PAH concentration in sludge)
= (25 kg sludge/day) x (140 mg naphthalene/kg sludge) x 350 days x 10-6 kg/mg= 1.225 kg naphthalene/year
and
= (25 kg sludge/day) x (1.8 mg benzo(a)pyrene/kg sludge) x 350 days x 10-6
kg/mg= 0.016 kg benzo(a)pyrene/year
Summary of NPRI Reporting Steps—Creosote ManufacturingFacilities
1. Gather information on sources of releases to air, soil, groundwater, storm water, andoff-site releases.
2. Determine reporting thresholds for NPRI reportable substances from the CanadaGazette Part I Notice for the year being reported.
3. Estimate quantities released on site or transferred off site, based on monitoring data,engineering calculations or emission factors.
Sample Release Summary Form

Guidance for Wood Preservation Facilities Reporting to the National Pollutant Release Inventory
28
Substance Type of Release Release Kg Released
Pyrene Process Stack emissions to airProcess Fugitive aerosol and vapourProcess Fugitive losses to soilStorm water Release to sewerCatastrophicreleases
Release to soil/groundwater
Hazardous waste Solid waste transferred tohazardous-waste site
Guidance for Wood Preservation Facilities Reporting to the National Pollutant Release Inventory
29
IV–A Wood Preservation Treatment Activities
NPRI-listed Substances Related to Wood Preservation Activities
The following substances may have to be reported to NPRI by companies in the woodpreserving sector:
• anthracene• ammonia (total)• arsenic (and its compounds)• biphenyl• chromium (and its compounds)• copper (and its compounds)• cresol (and its isomers, including m-, o- and p-) (and its salts)• criteria air contaminants (including oxides of nitrogen (expressed as NOx), sulphur
dioxide (SO2), carbon monoxide (CO), volatile organic compounds (VOCs), totalparticulate matter (TPM), particulate matter with a diameter = 2.5 microns (PM2.5),and particulate matter with a diameter = 10 microns (PM10))
• dimethyl phenol• dioxins• furans• hexachlorobenzene• hexavalent chromium compounds• mercury (and its compounds)• naphthalene• PAHs• quinoline (and its salts)• zinc (and its compounds)
The NPRI-listed substances shown above provide a summary of substances that maybe applicable for wood preservation facilities.
It is important to note the following: If facilities meet the reporting criteria for other NPRI-listed substances not shown above,they are legally obligated to file an NPRI report on those substances to EnvironmentCanada by the date specified in the Canada Gazette Part I Notice for the year beingreported. In what concentrations can some of the above-listed substances be found incertain wood preservatives?
Guidance for Wood Preservation Facilities Reporting to the National Pollutant Release Inventory
30
• Chromated Copper Arsenate (CCA): CCA-C on a solids basis containsapproximately 24.7% wt chromium, 22.7% wt arsenic and 14.8% wt copper.
• Ammoniacal Copper Zinc Arsenate (ACZA): ACZA on a solids basis typically
contains about 39.9% wt copper, 20.1% wt zinc, and 16.3% wt arsenic. Ammoniumhydroxide solutions are typically at 1.95% wt.
• Ammoniacal Copper Quaternary (ACQ): ACQ-B contains approx. 53.3% wt copper
on a dry solids basis. ACQ-B solutions are typically found in concentrations 1.9% wtor greater. Treating solutions contain a mass of ammonia equal to or greater thanthe mass of CuO, therefore, ACQ solutions higher than 1.5% as well as concentratedammonia solutions will meet or exceed 1% wt total ammonia.
Reportable Substances Specific to Individual Wood PreservationFacilities CCA and ACZA Wood Preservation Facilities: The following list comprises examples of substances that should be considered forreporting at CCA and ACZA wood preservation facilities. Refer to the Canada GazettePart I Notice for the year being reported for the specific reporting criteria for thesesubstances in determining if reporting is necessary. • ammonia (total)• arsenic (and its compounds)• chromium (and its compounds)• copper (and its compounds)• criteria air contaminants (including oxides of nitrogen (expressed as NOx), sulphur
dioxide (SO2), carbon monoxide (CO), volatile organic compounds (VOCs), totalparticulate matter (TPM), particulate matter with a diameter = 2.5 microns (PM2.5),and particulate matter with a diameter = 10 microns (PM10))
• hexavalent chromium compounds• mercury (and its compounds)• zinc (and its compounds)
Creosote Wood Preservation Facilities: The following list comprises examples of substances that should be considered forreporting at creosote wood preservation facilities. Refer to the Canada Gazette Part INotice for the year being reported for the specific reporting criteria for these substancesin determining if reporting is necessary. • criteria air contaminants (including oxides of nitrogen (expressed as NOx), sulphur
dioxide (SO2), carbon monoxide (CO), volatile organic compounds (VOCs), totalparticulate matter (TPM), particulate matter with a diameter = 2.5 microns (PM2.5),

Guidance for Wood Preservation Facilities Reporting to the National Pollutant Release Inventory
31
and particulate matter with a diameter = 10 microns (PM10))mercury (and itscompounds)
• PAHs Pentachlorophenol Wood Preservation Facilities: The following list comprises examples of substances that should be considered forreporting at pentachlorophenol wood preservation facilities. Refer to the CanadaGazette Part I Notice for the year being reported for the specific reporting criteria forthese substances in determining if reporting is necessary. • criteria air contaminants (including oxides of nitrogen (expressed as NOx), sulphur
dioxide (SO2), carbon monoxide (CO), volatile organic compounds (VOCs), totalparticulate matter (TPM), particulate matter with a diameter = 2.5 microns (PM2.5),and particulate matter with a diameter = 10 microns (PM10))
• Dioxins and furans• hexachlorobenzene This Guide, together with the guidance documents published by NPRI for the year beingreported, should be consulted by owners and operators of wood preservation treatingfacilities in reporting to the NPRI.

Guidance for Wood Preservation Facilities Reporting to the National Pollutant Release Inventory
32
IV–B Information Required by Wood Preservation FacilitiesReporting to the NPRI
In order to make an accurate determination of the quantity of releases each year, awood preservation facility must gather as much information as possible about itsprocesses, waste shipments, and releases to the environment. This requires a detailedinvestigation of the sources of releases to each medium (air, water and land),identification of the components that contribute to those releases or transfers, and theestablishment of the proper engineering approaches needed to quantify those releasesor transfers. The facility must use all relevant monitoring data and emissionsmeasurements collected to meet other regulatory requirements, or as part of routineplant operations, or to the extent a facility has such data. No monitoring data or emissions measurements need to be collected specifically forNPRI reporting. In the absence of data, reasonable estimates must be made usingpublished emission factors, mass balance calculations, or engineering calculations.However, the rationale for the Wood Preservation Sector SOP recommendation that allapplicable CEPA-toxic substances be reported to the NPRI for all wood preservationtreaters was to determine whether the adoption of the SOP recommendations wouldresult in a reduction of those specific substances to the environment. It is thereforeimportant that an accurate and quantitative estimate of releases and transfers be madesuch that any improvements by the sector can be demonstrated and documented.
Guidance for Wood Preservation Facilities Reporting to the National Pollutant Release Inventory
33
IV–C CCA Wood Preservation Facilities
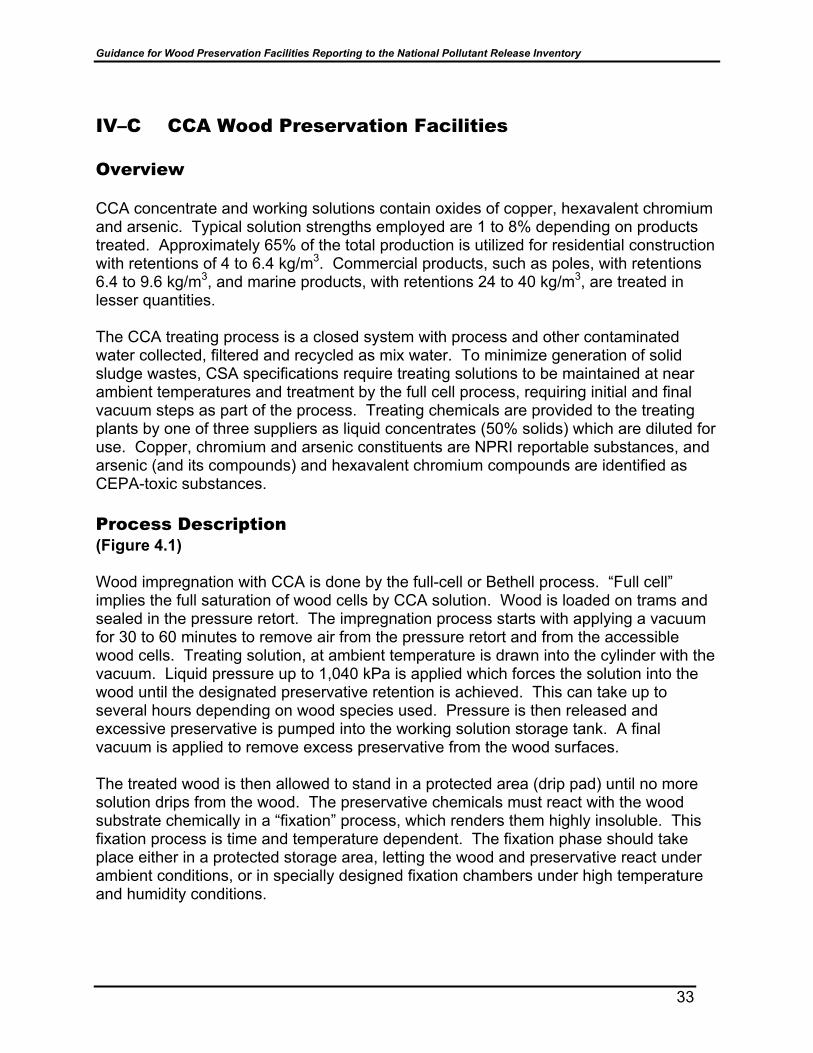
Overview CCA concentrate and working solutions contain oxides of copper, hexavalent chromiumand arsenic. Typical solution strengths employed are 1 to 8% depending on productstreated. Approximately 65% of the total production is utilized for residential constructionwith retentions of 4 to 6.4 kg/m3. Commercial products, such as poles, with retentions6.4 to 9.6 kg/m3, and marine products, with retentions 24 to 40 kg/m3, are treated inlesser quantities. The CCA treating process is a closed system with process and other contaminatedwater collected, filtered and recycled as mix water. To minimize generation of solidsludge wastes, CSA specifications require treating solutions to be maintained at nearambient temperatures and treatment by the full cell process, requiring initial and finalvacuum steps as part of the process. Treating chemicals are provided to the treatingplants by one of three suppliers as liquid concentrates (50% solids) which are diluted foruse. Copper, chromium and arsenic constituents are NPRI reportable substances, andarsenic (and its compounds) and hexavalent chromium compounds are identified asCEPA-toxic substances.
Process Description (Figure 4.1) Wood impregnation with CCA is done by the full-cell or Bethell process. “Full cell”implies the full saturation of wood cells by CCA solution. Wood is loaded on trams andsealed in the pressure retort. The impregnation process starts with applying a vacuumfor 30 to 60 minutes to remove air from the pressure retort and from the accessiblewood cells. Treating solution, at ambient temperature is drawn into the cylinder with thevacuum. Liquid pressure up to 1,040 kPa is applied which forces the solution into thewood until the designated preservative retention is achieved. This can take up toseveral hours depending on wood species used. Pressure is then released andexcessive preservative is pumped into the working solution storage tank. A finalvacuum is applied to remove excess preservative from the wood surfaces. The treated wood is then allowed to stand in a protected area (drip pad) until no moresolution drips from the wood. The preservative chemicals must react with the woodsubstrate chemically in a “fixation” process, which renders them highly insoluble. Thisfixation process is time and temperature dependent. The fixation phase should takeplace either in a protected storage area, letting the wood and preservative react underambient conditions, or in specially designed fixation chambers under high temperatureand humidity conditions.

Guidance for Wood Preservation Facilities Reporting to the National Pollutant Release Inventory
34
Potential Sources of Emissions of CCA Components Generally the preservation system is closed, meaning that preservative losses due toleaks, spills and drips are contained and recovered as much as possible and returnedback to the process. Unloading, chemical storage and treating areas, all with potentialfor spills and leaks are curbed and paved, and connected to a drain system so spillsand leaks can be captured. The main potential for releases is from catastrophicreleases, such as when a hose breaks during unloading. Treated wood can continue todrip CCA components and leach significant amounts if it is not confined to protectedstorage until the fixation reactions are complete. After fixation, some leaching will occur from wood placed in storage and exposed toprecipitation. The airborne emissions of CCA components may be fugitive or may bedrawn into a central exhaust. Process sludges, classified as hazardous wastes, resultfrom the reaction of CCA components with wood extractives and wood particles in theworking tank. Other solid wastes result from dust, dirt and debris on the drip pad,fixation chamber floor and treating retort sump, as well as from used clothing and filters.Non-hazardous wastes such as broken pieces of treated wood may also be transferredoff site for disposal. Table 4.1: Probable Reportable Compounds with CAS Numbers—
CCA Manufacturing Facilities
Compound CAS* Registry Number Arsenic pentoxide 1303-28-2 Chromium trioxide 12018-01-8 Copper oxide 1317-38-0 Criteria air contaminants (includingoxides of nitrogen (expressed asNOx), sulphur dioxide (SO2), carbonmonoxide (CO), volatile organiccompounds (VOCs), total particulatematter (TPM), particulate matter witha diameter = 2.5 microns (PM2.5), andparticulate matter with a diameter =10 microns (PM10))
Refer to the Canada Gazette Part INotice for the year being reported.
* CAS denotes Chemical Abstracts Service.

Guidance for Wood Preservation Facilities Reporting to the National Pollutant Release Inventory
35
Figure 4.1: CCA Preservation Plant Layout
Charging area Reloading area
Fixation chamber
Legend: Valve PipeVent
Press/Transfer pump Vacuum pumpFilterRoofed areaDrip padsDrip basin DrainageCurb
V
VP
Unloading area
Boiler
Water Effluent V
Working solution
V Conc. V
Retort
VVP
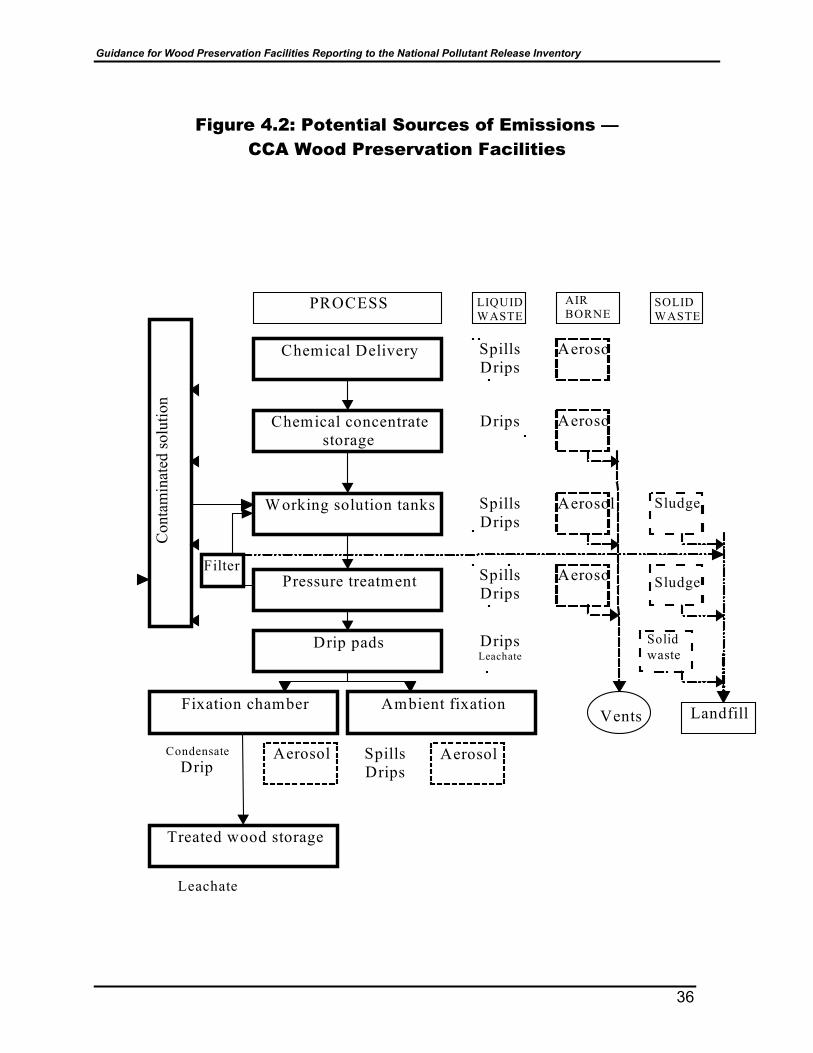
Guidance for Wood Preservation Facilities Reporting to the National Pollutant Release Inventory
36
Figure 4.2: Potential Sources of Emissions —CCA Wood Preservation Facilities
Chemical Delivery
Chemical concentrate storage
W orking solution tanks
Pressure treatment
Fixation chamber
Treated wood storage
Ambient fixation
Con
tam
inat
ed so
lutio
n
Filter
PROCESS
Drip pads
SpillsDrips
Drips
SpillsDrips
SpillsDrips
Condensate Drip
SpillsDrips
Leachate
LIQUIDWASTE
DripsLeachate
Sludge
Sludge
Landfill
SOLID WASTE
Solid waste
AerosolAerosol
Aeroso
Vents
Aeroso
Aerosol
Aeroso
AIR BORNE

Guidance for Wood Preservation Facilities Reporting to the National Pollutant Release Inventory
37
Estimation Methodologies to Determine Releases and Transfers—CCA Wood Preservation Facilities Potential types of releases and other waste-management activities from the sourcesdescribed above include fugitive and stack air emissions, direct and indirect wastewaterdischarges, and on-site and off-site management of solid wastes. Air Emissions Air emissions from the retort door opening, from valves, flanges, and pumps, and fromthe treated wood while on the drip pad and in storage, are typically considered fugitiveemissions because they are often released into the ambient air and not from a specificpoint or stack. Air emissions from the vacuum system may be fugitive emissions ifemitted direct to the ambient air, or stack emissions if channeled through a pollution-control device, and should be reported appropriately. Air emissions from CCA waterborne wood preserving plants are very low. The vapourpressure (measure of tendency to evaporate) of CCA inorganic metals is very low underthe low ambient temperature treating conditions (15 to 30oC), and fixing and drying oftreated wood (up to 90oC) used for this preservative. For example, the concentration ofarsenic oxide in a saturated environment is about 1.1 mg/m3 at 100oC and theextrapolated value at 20oC is about 0.08 ug/m3. Release of CCA solution as an aerosol, however, can occur at vacuum pump exhausts,work tank vents, retort door openings, and fixation chamber vents (although studiesperformed in 1984 showed no significant releases), as well as from fixation kiln vents(Bridges 1984). Facilities that meet the NPRI reporting criteria for CACs should refer to theSupplementary Guide for Reporting Criteria Air Contaminants (CACs) to the NationalPollutant Release Inventory (NPRI) and other reference documents to estimateemissions of CACs to air. Direct Measurement If exhausts from the above sources are collected in a vented hood, the amountsreleased can be estimated from the time-weighted concentrations of NPRI substancesmeasured in the exhaust and from the flow rate through the exhaust. This will allow thedetermination of positive effects of introducing emission-control technologies such aswet scrubbers to the exhaust. It is important that measurements reflect the effects ofdifferent process steps since there will be higher releases at certain points, such aswhen the retort is opened or the vacuum pumps are operating.

Guidance for Wood Preservation Facilities Reporting to the National Pollutant Release Inventory
38
Example 1 Aerosols from the retort door opening, vacuum pumps and storage tanks are all ventedthrough one exhaust vent. The exhaust vent is determined to have a flow rate (F) of100 m3 per hour. Air concentrations of Cu, Cr and As are measured (Ci in mg/m3) atthe vent outlet on several occasions:
• when the retort door is opened and the charge removed,• when the initial and final vacuum pumps are operating,• during the rest of the impregnation process (fill retort, pressure treat, empty
solution), and• when the treating system is not in operation.
The number of days that wood was treated per year (Dt) and the number of days it wasinactive (Dnt) are known, as well as the number of hours each day that the differentprocess steps are active (ti).
The estimated emission during a given process step (such as retort opening andunloading) is derived using the following formula:
Emission (kg) = F (m3/h) x ti (h/day) x Dt (days) x Ci (mg/m3) x 10-6 kg/mg
An example of estimates for annual releases is shown in the table below.
Process Hoursper day
Operatingdays
Hoursper year
Exhaustvent rate
(m3/h)
As conc. inexhaust(mg/m3)
Annual Asemission
(mg)Dooropening,unload
3 300 900 100 2 x 10⁻³ 180
Vacuum 2 300 600 100 1.1 x 10⁻³ 66Fill,pressure,empty
5 300 1500 100 3 x 10⁻⁴ 45
Retort idle 14 300 4200 100 1.2 x 10⁻⁴ 5024 65 1560 100 1.2 x 10⁻⁴ 19
Total 360(0.36g)
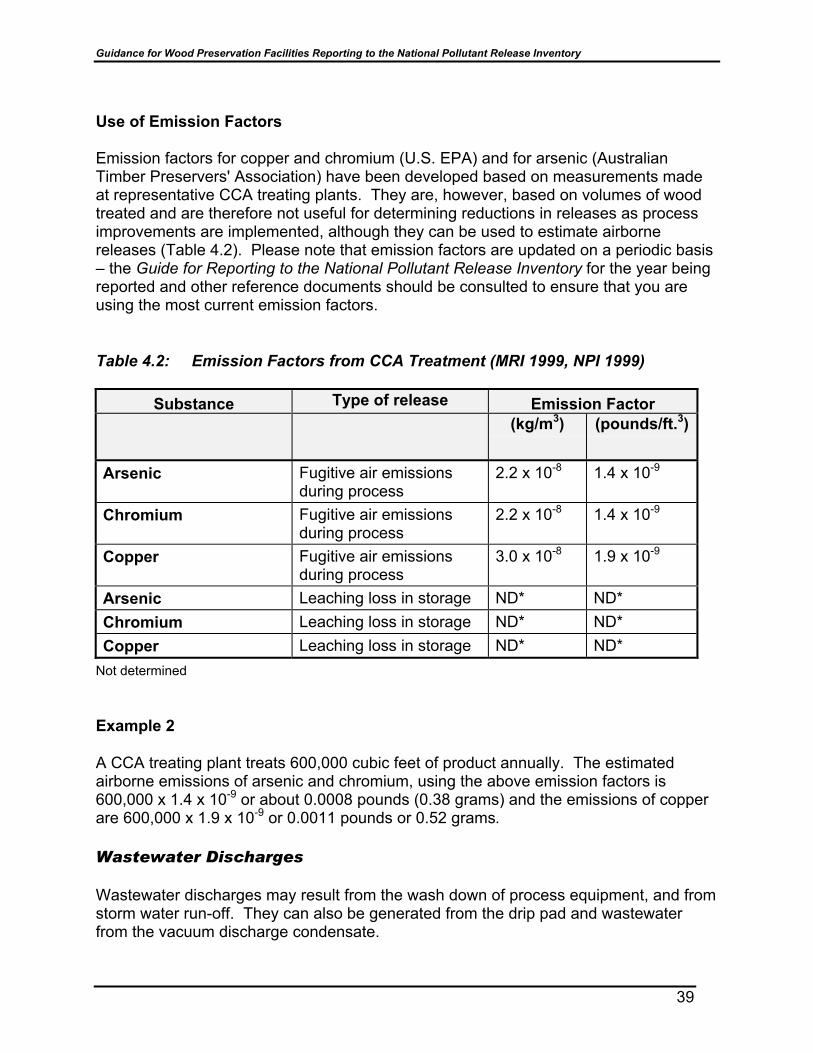
Guidance for Wood Preservation Facilities Reporting to the National Pollutant Release Inventory
39
Use of Emission Factors
Emission factors for copper and chromium (U.S. EPA) and for arsenic (AustralianTimber Preservers' Association) have been developed based on measurements madeat representative CCA treating plants. They are, however, based on volumes of woodtreated and are therefore not useful for determining reductions in releases as processimprovements are implemented, although they can be used to estimate airbornereleases (Table 4.2). Please note that emission factors are updated on a periodic basis– the Guide for Reporting to the National Pollutant Release Inventory for the year beingreported and other reference documents should be consulted to ensure that you areusing the most current emission factors.
Table 4.2: Emission Factors from CCA Treatment (MRI 1999, NPI 1999)
Substance Type of release Emission Factor(kg/m3) (pounds/ft.3)
Arsenic Fugitive air emissionsduring process
2.2 x 10⁻⁸ 1.4 x 10⁻⁹
Chromium Fugitive air emissionsduring process
2.2 x 10⁻⁸ 1.4 x 10⁻⁹
Copper Fugitive air emissionsduring process
3.0 x 10⁻⁸ 1.9 x 10⁻⁹
Arsenic Leaching loss in storage ND* ND*Chromium Leaching loss in storage ND* ND*Copper Leaching loss in storage ND* ND*
Not determined
Example 2
A CCA treating plant treats 600,000 cubic feet of product annually. The estimatedairborne emissions of arsenic and chromium, using the above emission factors is600,000 x 1.4 x 10-9 or about 0.0008 pounds (0.38 grams) and the emissions of copperare 600,000 x 1.9 x 10-9 or 0.0011 pounds or 0.52 grams.
Wastewater Discharges
Wastewater discharges may result from the wash down of process equipment, and fromstorm water run-off. They can also be generated from the drip pad and wastewaterfrom the vacuum discharge condensate.

Guidance for Wood Preservation Facilities Reporting to the National Pollutant Release Inventory
40
Note: Most wood preserving facilities using waterborne preservative solutions, such asCCA Type C recycle 100% of the CCA solution. The following calculation is included toassist any facility that may not conduct 100% recycling of the CCA solution.
Direct Measurement
Example 1
A facility discharges its wastewater to municipal sewers. Provincial regulations requireyou to record the total flow and monitor for chromium, copper, and arsenic. Theaverage monthly flow was 525,000 imperial gallons; the chromium concentrationaveraged 0.5 mg/L; the copper concentration averaged 2.0 mg/L; and the arsenicconcentration, 0.05 mg/L.
The amount of chromium discharged is:
= (525,000 gal./month, total flow) x 12 months/year x (0.5 mg/L, Crconcentration) x (10-6 kg/mg) x (4.54 L/gal.)
= 14.3 kg per year
The amount of copper discharged is:
= (525,000 gal./month, total flow) x 12 months/year x (2.0 mg/L, Cuconcentration) x (10-6 kg/mg) x (4.54 L/gal.)
= 57.1 kg per year
The amount of arsenic discharged is:
= (525,000 gal./month, total flow) x 12 months/year x (0.05 mg/L, Asconcentration) x (10-6 kg/mg) x (4.54 L/gal.)
= 1.44 kg per year

Guidance for Wood Preservation Facilities Reporting to the National Pollutant Release Inventory
41
Example 2:Storm Water Release Estimates(if flow rates are not known)
Quantification of storm water releases is required if a facility has data on theconcentration of NPRI-listed substances in its discharges. Determination of the amountof CCA components released in storm water run-off involves calculating the totalamount of volumetric run-off from the site and applying the measured or estimatedconcentration of CCA to that volume.
To determine the total volume of run-off, the facility must determine the total areadrained by each outfall and the weighted average run-off coefficient for that area that isdependent on that area's soil structure, topography, usage and development. The run-off coefficient represents the amount of rainfall that does not soak into the ground butruns off as storm water. Typical values are 0.80 for impervious areas and 0.20 forpervious areas (unimproved). Once the volumetric flows are determined, the facilitymust apply the correct concentration (found through sampling during the event) at eachoutfall to each outfall’s flow.
I. Calculate total drainage area of each outfall:
L x W = sq. ft.
Outfall#1 Outfall#2 575,200 sq. ft. 568,100 sq. ft.
II. Calculate square footage of pervious and impervious land areas in each outfalldrainage:
A. Pervious – land area that water will soak into (i.e., lawns, gravel yards,unimproved areas, etc.)
B. Impervious – land area that water runs off of (i.e., roofs, streets, etc.)
Outfall # 1 Outfall #3 92,200 sq. ft. – pervious 510,500 sq. ft. – pervious483,000 sq. ft. – impervious 57,600 sq. ft. – impervious
III. Determine run-off coefficient for land area.
IV. Determine number of gallons of storm water traveling into each outfall and offsite:
A. Calculate average rainfall for area:
# inches of yearly rainfall ÷ 12 = # ft. of rain/year

Guidance for Wood Preservation Facilities Reporting to the National Pollutant Release Inventory
42
i.e., average rainfall is 50 in./year
50 in. of yearly rainfall ÷ 12 = 4.16 ft. of rain/year
B. Calculate run-off from impervious and pervious areas:
# ft. of rain/year x sq. ft. of impervious area (step 2b) x 7.48 (# gal. per cu. ft. ofrain) x 0.8 (run-off coefficient).
Outfall #1: 4.16 ft. x 483,000 x 7.48 x 0.8 = 12,023,531 gal.
Outfall #2: 4.16 ft. x 57,600 x 7.48 x 0.8 = 1,433,862 gal.
# ft. of rain/year x sq. ft. of pervious area (step 2b) x 7.48 (# gal. per cu. ft. ofrain) x 0.2 (run-off coefficient).
Outfall #1: 4.16 ft. x 92,200 x 7.48 x 0.2 = 573,793 gal.
Outfall #2: 4.16 ft. x 510,500 x 7.48 x 0.2 = 3,177,025 gal.
C. Add gallons together for pervious and impervious areas to obtain total gallonsfor each outfall:
Outfall #1 Outfall #312,023,531 1,433,862+ 573,793 +3,177,025= 12,597,324 gal. = 4,610,887 gal.
D. Convert gallons to litres:
gal. (step 4c) x 4.54 L/gal.
Outfall #1 Outfall #212,597,324 gal. 4,610,887 gal.x 4.54 x 4.54 57,191,851 L 20,933,427 L
V. Determine kg of copper (Cu), chromium (Cr), and arsenic (As) released for eachoutfall:
Use composite results from your storm water sample data for your calculations.(Note: mg/L = ppm)
Outfall #1 Outfall #2 Cr = 0.03 mg/L Cr = 0.20 mg/L
As = 0.02 mg/L
Guidance for Wood Preservation Facilities Reporting to the National Pollutant Release Inventory
43
Litres of rainwater traveling off site x mg/L Cr x 10-6 kg/mg = kg Cr/year
(Note: Do same calculation for copper, chromium and arsenic for each outfall)
Outfall #1:57,191,851 litres x 0.03 mg/L Cr x 10-6 kg/mg = 1.72 kg Cr/year
Outfall #2:20,933,427 litres x 0.20 mg/L Cr x 10-6 kg/mg = 4.18 kg Cr/year
20,933,427 litres x 0.02 mg/L As x 10-6 kg/mg = 0.42 kg As/year
VI. Determine total release volumes:
Add kilograms of copper, chromium, and arsenic separately from each outfall tocalculate the total kilograms of copper, chromium and arsenic released:
Chromium Arsenic
Outfall #1: 1.72 kg Cr/year and 0 kg As/yearOutfall #3: 4.18 kg Cr/year and 0.42 kg As/year
Total Release: 6.00 kg Cr/year and 0.42 kg As/year
Water Discharges to Soil
One source of emissions to soil is leaching from treated wood during rain events while itis being stored. Leaching rates from freshly treated wood are highly variable, dependingon the time of year, type of treated product (species, shape, retention), weatherconditions during storage, configuration of stored material (e.g., height of stacks),season and length of storage.
Direct Measurement
Water drippage from representative stored treated product can be collected andmeasured for volume (V in L) and average concentration (C in mg/L) of CCAcomponents during rain events over the average storage time (t in weeks) for theproduct. Using the amount of wood represented by the tested material (At in any units)and the average amount of similar material in the yard at any time (A in same units), theleaching emissions to soil can be estimated:
Emissions (kg) = [C (mg/L) x 10-6 kg/mg] x [V (L) x A/At x 52 weeks/year]/ t(weeks)
Guidance for Wood Preservation Facilities Reporting to the National Pollutant Release Inventory
44
Example 1
Drip water was collected from a stack of treated lumber containing 800 cubic feet (At).At any given time, the amount of wood in the yard (A) is 50,000 cubic feet. Over theaverage storage time of six weeks (t), there were seven rain events and a total volumeof 1,350 litres (V) of drip water was collected with an average arsenic content of1.4 mg/L (C).
Please note that this is only an example—no general emission factors have beendeveloped for wood leaching.
Then the estimated arsenic emissions for the year are:
[1.4 mg/L x 10-6 kg/mg] x [1,350 L x 50,000/800 x 52 weeks/year]/6 weeks= 1.02 kg As/year
Emission factorsEmission factors have been published for freshly treated wood, but these are variableand depend on estimating the surface area of exposed wood in the yard.
Examples of measured emission factors (Taylor et al. 2000) are:
Cr: 13 mg/m2/rain event,Cu: 44 mg/m2/rain event, andAs: 33 mg/m2/rain event.
Example 2
Lumber is piled in rectangular stacks 6.5-metres high, 1.4-metres wide and 5.1-metreslong. It is assumed that the area exposed to rain at any time is that of the top and foursides with a total area of 91.6 m2 . At any given time there are an average of 36 suchstacks in the yard and it is determined from meteorological records that there were47 rain events during the year.
The estimated emissions of the CCA components are:
Cr: 13 mg/m2/rain event x 10-6 kg/mg x 47 rain events x 91.6 m2 per stack x 36stacks = 2.01 kg Cr/year
Cu: 44 mg/m2/rain event x 10-6 kg/mg x 47 rain events x 91.6 m2 per stack x 36stacks = 6.80 kg Cu/year
As: 33 mg/m2/rain event x 10-6 kg/mg x 47 rain events x 91.6 m2 per stack x 36stacks = 5.10 kg As/year

Guidance for Wood Preservation Facilities Reporting to the National Pollutant Release Inventory
45
Releases Caused by Remedial Action
Remedial action can include a number of activities: disposal of contaminated soils,recovery and treatment of contaminated groundwater, or other one-time, non-routineclean-ups.
If groundwater near the plant has been contaminated, it is usually pumped out of theground and into the treating plant for use as make-up water for the process. Insituations where groundwater is treated and released, the amount of release is afunction of concentration and volume of water discharge meeting provincial and federallimits.
Example
Groundwater in the amount of 250,000 gallons was recovered, treated, and dischargedwith concentrations of copper, chromium and arsenic to septic drains at 0.15 ppm, 0.10ppm and 0.2 ppm, respectively. This results in releases of 0.375, 0.25, and 0.50pounds per year of Cu, Cr and As, respectively.
Releases to soil were determined by applying the results from soil sample analysis ofthe chromium, copper and arsenic in the soil samples to the total amount of soilinvolved. In this example, 20,000 pounds of soil were removed as a result of remedialactivities containing calculated Cu, Cr, and As concentrations slightly above currentCCME guidelines for industrial sites. The actual concentrations of copper, chromiumand arsenic by weight were multiplied by 20,000 pounds as follows:
20,000 lb. x 20 ppm (Cu) x 10-6 = 0.4 lb.20,000 lb. x 50 ppm (Cr) x 10-6 = 1.0 lb.20,000 lb. x 100 ppm (As) x 10-6 = 2.0 lb.
Guidance for Wood Preservation Facilities Reporting to the National Pollutant Release Inventory
46
Release Due to Catastrophic Events
These involve spills or accidental releases outside the containment areas and in allcases require reporting to the environmental authorities. The amount of the release is afunction of CCA concentration and volume released.
Example
CCA 50% concentrate in an amount of 200 gallons is spilled outside the containmentarea due to a ruptured hose during the unloading process. The release is promptlycleaned up and neutralized with spill neutralizer, and subsequently stored in drums ashazardous waste for shipment to a secure landfill. The appropriate authorities arepromptly notified. The total amount of the spill can be calculated as follows:
1. Calculate the total mass of the spill:
200 gal. x 1.638 lb./gal. x 10 lb./gal. = 3,276 lb.
CuO = 3,276 lb. x 9.25% = 303.0 lb.
CrO3 = 3,276 lb. x 23.75% = 778.0 lb.
As2O5 = 3,276 lb. x 17.00% = 557.0 lb.
2. Determine actual elemental Cu, Cr, and As:
Element Atomic Mass
Cu 64 (CuO) = 64/(64+16) = 0.8Cr 52 (CrO3) = 52/(52 = 3(16)) = 0.52As 75 (As2O5) = 2(75)/(2(75) + 5(16)) = 0.65
3. Multiply the elemental ratio in step 2 by the determined total oxide mass from step 1:
Cu = 303.0 lb. x 0.8 = 242.4 lb.Cr = 778.0 lb. x 0.52 = 404.56 lb.As = 557.0 lb. x 0.65 = 362.05 lb.

Guidance for Wood Preservation Facilities Reporting to the National Pollutant Release Inventory
47
Releases of Solid Hazardous Waste
For solid hazardous waste, a determination of the total quantity of waste as well as theconcentration of the copper, chromium and arsenic must be made. Hazardous wastemanifests are used to determine the amount of hazardous waste that was shipped offsite. In addition, a waste analysis should be performed to determine the concentrationof Cu, Cr and As in the waste. This analysis should then be used to determine theactual release to landfill.
Example
The facility sent six 45-gallon drums of hazardous waste to a secure landfill. The totalquantity of waste disposed was 2,104 kg containing copper, chromium and arsenic inthe following proportions 1.966%, 2.262% and 4.219%, respectively. None of theresults contained hexavalent chromium.
Therefore actual quantity in the waste is:
2,104 kg x 1.966% = 41.36 kg Cu2,104 kg x 2.262% = 47.59 kg Cr2,104 kg x 4.219% = 88.77 kg As
The facility had additional manifests for the soils disposed of during remedial action.However these releases have already been accounted for in that section.
Summary of NPRI Reporting Steps—CCA Wood PreservationFacilities
1. Gather information on sources of releases to air, soil, groundwater, storm water, andoff-site releases.
2. Determine reporting thresholds for NPRI reportable substances from the CanadaGazette Part I Notice for the year being reported.
3. Estimate quantities released on site or transferred off site based on monitoring data,engineering calculations or emission factors.

Guidance for Wood Preservation Facilities Reporting to the National Pollutant Release Inventory
48
Sample Release Summary Form
Substance Type of Release Release Kg Released
Cr/ Cu/ As Process Fugitive aerosol andvapour
Storage Leaching losses to soilRemedial action Contaminated soil, etc.Storm water Release to sewerCatastrophic releases Release to
soil/groundwaterNon-hazardous wastes Solid wood, etc., to
landfillHazardous waste Solid waste transferred
to a hazardous-wastesite

Guidance for Wood Preservation Facilities Reporting to the National Pollutant Release Inventory
49
IV–D Ammoniacal Copper Zinc Arsenate (ACZA) WoodPreservation Facilities
Overview
The treating process is similar to that of CCA in that a full-cell treating process is usedto achieve preservative retentions similar to those required for CCA. The treatingprocess is a closed system, and process water and liquid releases are collected andreused. The active preservative constituents are kept in solution at high pH withammonia. Copper, zinc, arsenic and ammonia constituents are all NPRI reportablesubstances—arsenic is a CEPA-toxic substance.
Process Description(Figure 4.3)
ACZA preservative is made on site by mixing arsenic acid, copper oxide, zinc oxide,ammonium hydroxide, ammonium bicarbonate and water. Zinc oxide, copper oxide andammonium bicarbonate are manually added into a mixing tank containing water. Aftermixing and slurry formation, ammonium hydroxide is added followed by arsenic acid,and mixing continues until the copper is dissolved, which takes 10 to 72 hours. Thisinitial concentrate of 8 to 13% total oxides with the ratio of the ZnO:CuO:As2O5 of 1:2:1,is then diluted to a working solution concentration of 2 to 7% total oxides.
The preservation process is similar to that of CCA. Wood impregnation is obtainedusing the full-cell or Bethell process. Wood is loaded on trams and sealed in thepressure retort. The impregnation process starts with applying vacuum for 30 to 60minutes to remove air from the pressure retort and from the accessible wood cells.Treating solution, at ambient temperature, is drawn into the cylinder with the vacuum.Liquid pressure up to 1,040 kPa is applied.
The pressure is held until the designated amount of preservative enters the wood, whichcan take up to several hours depending on the wood species used. Pressure is thenreleased and excessive preservative is pumped out to a storage tank. A final vacuum isusually applied to remove excess preservative from the wood surfaces. The treatedwood is then allowed to stand in a protected area (drip pad) until no more solution dripsfrom the wood. ACZA fixation is achieved by the loss of ammonia from the treatedwood, ideally under ambient temperature conditions.
Please refer to Figure 4.4 for an illustration of potential sources of emissions of ACZAcomponents.
Arsenic, copper, zinc and ammonia are the compounds that have to be monitoredduring the above processes for NPRI reporting. Processing steps that can result inemissions to air, soil, and groundwater or for off-site disposal are shown in Figure 4.4.
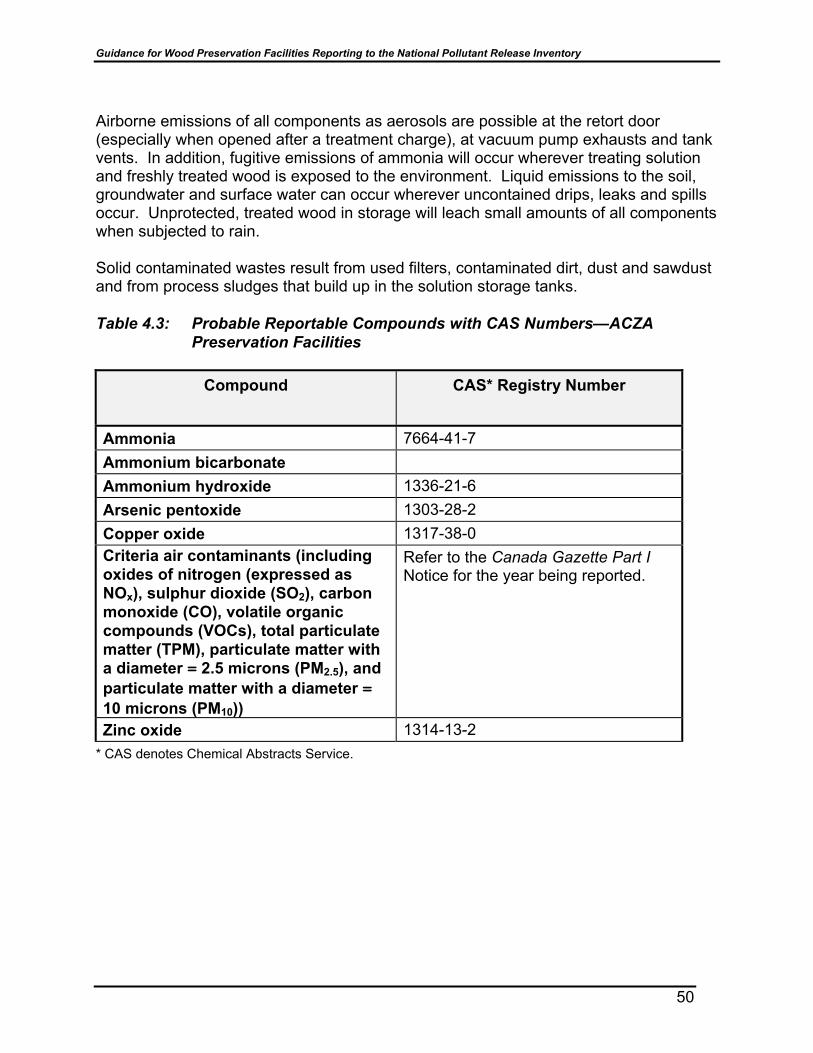
Guidance for Wood Preservation Facilities Reporting to the National Pollutant Release Inventory
50
Airborne emissions of all components as aerosols are possible at the retort door(especially when opened after a treatment charge), at vacuum pump exhausts and tankvents. In addition, fugitive emissions of ammonia will occur wherever treating solutionand freshly treated wood is exposed to the environment. Liquid emissions to the soil,groundwater and surface water can occur wherever uncontained drips, leaks and spillsoccur. Unprotected, treated wood in storage will leach small amounts of all componentswhen subjected to rain.
Solid contaminated wastes result from used filters, contaminated dirt, dust and sawdustand from process sludges that build up in the solution storage tanks.
Table 4.3: Probable Reportable Compounds with CAS Numbers—ACZAPreservation Facilities
Compound CAS* Registry Number
Ammonia 7664-41-7Ammonium bicarbonateAmmonium hydroxide 1336-21-6Arsenic pentoxide 1303-28-2Copper oxide 1317-38-0Criteria air contaminants (includingoxides of nitrogen (expressed asNOx), sulphur dioxide (SO2), carbonmonoxide (CO), volatile organiccompounds (VOCs), total particulatematter (TPM), particulate matter witha diameter = 2.5 microns (PM2.5), andparticulate matter with a diameter =10 microns (PM10))
Refer to the Canada Gazette Part INotice for the year being reported.
Zinc oxide 1314-13-2* CAS denotes Chemical Abstracts Service.

Guidance for Wood Preservation Facilities Reporting to the National Pollutant Release Inventory
51
Figure 4.3: ACZA Preservation Plant Layout
Charging area Reloading area
Legend: Valve PipeVentPress/Transf. pumpVacuum pumpFilterRoofed areaDripping Dripping basin DrainageCurb
V
VP
Zinc oxide storage
VVP
Unloading area
Copper oxide storage
Am
mon
ium
bi
carb
onat
e
stor
age
Retort
Ammonia storage
V Arsenic storage
V
Water Effluent
V
Working solution V
Mixing tank
V

Guidance for Wood Preservation Facilities Reporting to the National Pollutant Release Inventory
52
Figure 4.4: Potential Sources of Releases from an ACZA WoodPreservation Plant
V ents A erosol
Leachate
Spills D rips
V apour
Treated w ood storage
Am bient fixation
D rip pads
Chem ical D elivery
Chem ical storage
Chem ical m ixing
W orking solution
Pressure treatm ent
Efflu
ent
F ilter
PR OC ESS
SpillsD rips
D rips
SpillsD rips
SpillsD rips
SpillsD rips
LIQU IDW ASTE
D ripsLeachate
V apours
Aerosol V apours
Aerosol V apours
Aerosol V apours
Aerosol V apours
AIR B O RN E
A erosoV apou
Sludge
Sludge
Sludge
Landfill
SOLID W ASTE
Solidw aste
Scrubber

Guidance for Wood Preservation Facilities Reporting to the National Pollutant Release Inventory
53
Estimation Methodologies to Determine Releases and Transfers—ACZA Wood Preservation Facilities
Estimation methodologies for emissions are similar to those for CCA wood preservationfacilities, with two exceptions:
• Emission factors have not been developed for ACZA airborne emissions.• There will be a release of ammonia during the process and from freshly treated
wood.
Facilities that meet the NPRI reporting criteria for CACs should refer to theSupplementary Guide for Reporting Criteria Air Contaminants (CACs) to the NationalPollutant Release Inventory (NPRI) and other reference documents to estimateemissions of CACs to air. For the determination of releases to water, soil and off-site transfers of solid wastes,refer to the section on estimating releases for CCA wood preservation facilities. Airborne Emissions of Ammonia Ammonia releases can be estimated by direct measurements for occupational exposuremonitoring for those process steps where information on flow rates or air-exchangerates are known. Treaters can also develop their own emission factors. It may also befeasible to use a mass-balance approach. Direct Measurement: Vented or Stack Releases Example 1 The ammonia concentration is measured at different times during the treating processat the outlet of the wet scrubber installed in the exhaust vent (see table below).Aerosols and vapours from the retort door opening, vacuum pumps and storage tanksare all vented through the one exhaust. The vent is determined to have a flow rate (F)of 1,000 m3 per hour. Air concentrations of ammonia are measured (Ci in mg/m3) at thevent outlet on several occasions when the retort door is opened and the chargeremoved, when the initial and final vacuum pumps are operating, during the rest of theimpregnation process (fill retort, pressure treat, empty solution) and when the treatingsystem is not in operation. The number of days that wood was treated per year (Dt) andthe number of days it was inactive (Dnt) are known, as well as the number of hourseach day that the different process steps are active (ti). The estimated emission during a given process step (such as retort opening andunloading) is given by:
Emission (kg) = F (m3/h) x ti (h/day) x Dt (days) x Ci (mg/m3) x 10-6 kg/mg

Guidance for Wood Preservation Facilities Reporting to the National Pollutant Release Inventory
54
Examples of estimated releases based on direct measurements (emission factors notdeveloped):
Process Hoursper day
Operatingdays
Hoursper year
Exhaustvent rate
(m3/h)
NH3 Conc.in exhaust
(mg/m3)
Annual NH3emission
(kg) Dooropening,unload
3 300 900 1000 150 135
Vacuum 2
300 600 1000 87 52.2
Fill,pressure,empty
5 300 1500 1000 56 84.0
Retort idle 14 300 4200 1000 21 88.2 24 65 1560 1000 21 32.8 Total 392.2
(0.39 tonnes) Example 2: Mass Balance It is known that much of the ammonia used in the process will be released to theenvironment as a result of process losses and evaporation of ammonia from the treatedwood to fix the preservative chemicals. However, it is also known that some ammoniais retained in the final treated product as a reaction product between the woodcomponents and the other preservative components, and process ammonia isrecovered by vacuum and other post-treatment processes in the retort. If it is assumedthat 50% of the ammonia is retained in the treated wood and the remainder is released,mainly as vapour. • A treater uses 120,000 kg dry mass basis of ACZA containing 39.9% copper
(47,880 kg). They formulate the solution with ammonia at 1.8 x the weight of copper(1.8 x 47,880 = 86,184 kg ammonia).
• Assuming 50% is released during and after treatment, the total release is 86,184/2 or
43,092 kg (43.1 tonnes).
Note that this example ignores ammonia recovered by post-treatment conditioning andthrough scrubbers in vents and will be an overestimate.
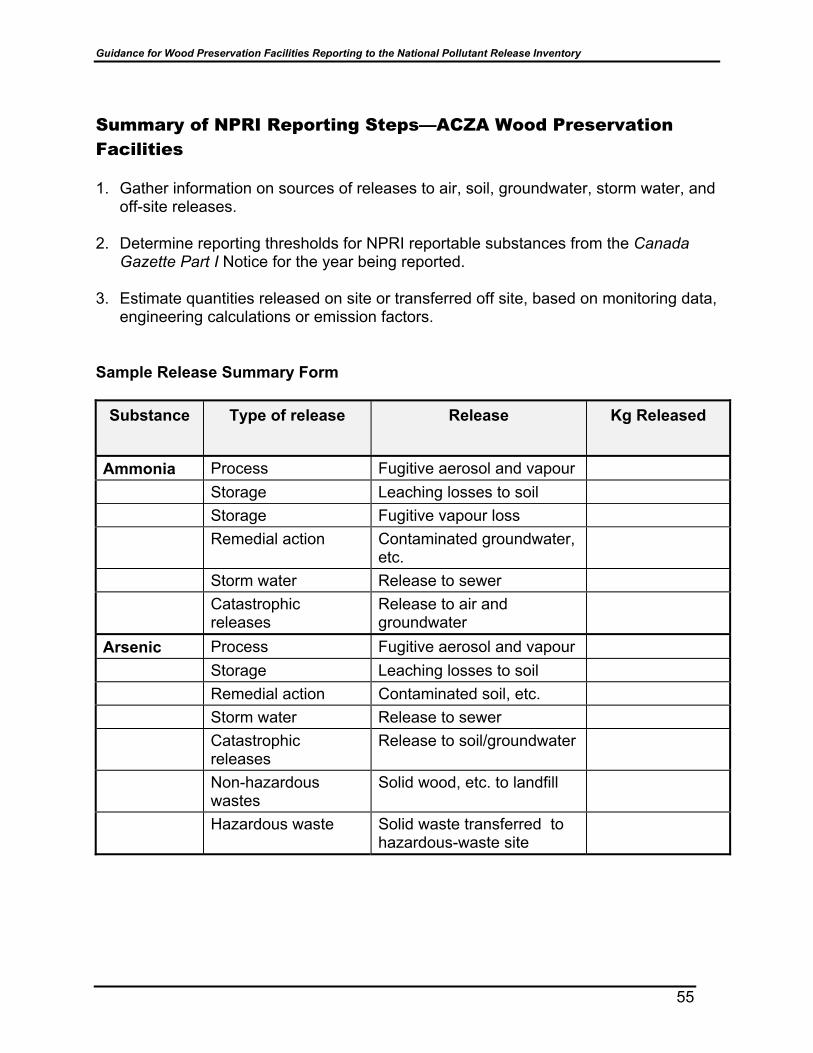
Guidance for Wood Preservation Facilities Reporting to the National Pollutant Release Inventory
55
Summary of NPRI Reporting Steps—ACZA Wood PreservationFacilities
1. Gather information on sources of releases to air, soil, groundwater, storm water, andoff-site releases.
2. Determine reporting thresholds for NPRI reportable substances from the CanadaGazette Part I Notice for the year being reported.
3. Estimate quantities released on site or transferred off site, based on monitoring data,engineering calculations or emission factors.
Sample Release Summary Form
Substance Type of release Release Kg Released
Ammonia Process Fugitive aerosol and vapourStorage Leaching losses to soilStorage Fugitive vapour lossRemedial action Contaminated groundwater,
etc.Storm water Release to sewerCatastrophicreleases
Release to air andgroundwater
Arsenic Process Fugitive aerosol and vapourStorage Leaching losses to soilRemedial action Contaminated soil, etc.Storm water Release to sewerCatastrophicreleases
Release to soil/groundwater
Non-hazardouswastes
Solid wood, etc. to landfill
Hazardous waste Solid waste transferred tohazardous-waste site

Guidance for Wood Preservation Facilities Reporting to the National Pollutant Release Inventory
56
IV–E Ammoniacal Copper Quaternary (ACQ) WoodPreservation Facilities
Overview
Ammoniacal copper quaternary (Type B) wood preservative is formulated with copperoxide (66.7%) and the quaternary ammonium compound,didecyldimethylammoniumchloride – DDAC (33.3The treating process and sources ofemissions are similar to ACZA.
Process Description(Figure 4.5)
As with the other water-based treatments, the process should be a closed system soliquid releases are collected for reuse. ACQ is diluted to similar working solutionconcentrations as for CCA and ACZA. Wood is treated using a full-cell processinvolving initial and final vacuums and a pressure process of variable duration,depending on the species and target preservative loading. Chemical fixation of theactive components is relatively rapid and, as with ACZA, involves the evaporation ofammonia under ambient conditions.
Chemical Discharges(Figure 4.6)
Copper, ammonia, and the criteria air contaminants are compounds that should bemonitored during the processes for NPRI reporting. Processing steps that can result inemissions to air, soil, and groundwater or for off-site disposal are shown in Figure 4.6.Airborne emissions of all components as aerosols are possible at the retort door(especially when opened after a treatment charge), at vacuum pump exhausts, and tankvents. In addition, fugitive emissions of ammonia will occur wherever treating solutionand freshly treated wood is exposed to the environment. Liquid emissions to the soil,groundwater and surface water can occur wherever uncontained drips, leaks and spillscan occur. Unprotected treated wood in storage will leach small amounts ofcomponents when subjected to rain. Solid contaminated wastes result from usedfilters, contaminated dirt, dust and sawdust, and from process sludges that build up inthe solution storage tanks.

Guidance for Wood Preservation Facilities Reporting to the National Pollutant Release Inventory
57
Figure 4.5: ACQ Wood Preservation Plant Layout
Charging area Reloading area
Legend: Valve PipeVentPress/Transfer pumpVacuum pumpFilterRoofed areaDripping padsDripping basin DrainageCurb
V
VP Unloading area
VVP
Copper concentrate storage
Quat concentrate storage
Water Effluent
V
Working solution
V Mixing
tank V
Ammonia stora ge V
Retort

Guidance for Wood Preservation Facilities Reporting to the National Pollutant Release Inventory
58
Figure 4.6: Potential Sources of Releases from an ACQ WoodPreservation Plant
Drip pads
Con
tam
inat
ed so
lutio
n
Chemical Delivery
Chemical storage
Chemical mixing
Working solution
Pressure treatmentFilter
PROCESS
SpillsDrips
Drips
SpillsDrips
SpillsDrips
SpillsDrips
LIQUID WASTE
DripsLeachate
Vapours
Aerosol Vapours
Aerosol Vapours
Aerosol Vapours
Aerosol Vapours
AIR BORNE
Aerosol Vapour
AerosolDust
Leachate
Spills Drips
Vapour
Ambient fixation
Sludge
Sludge
Sludge
Landfill
Solid waste
Vents
Landfill
SOLID WASTE
Scrubber
Treated wood storage
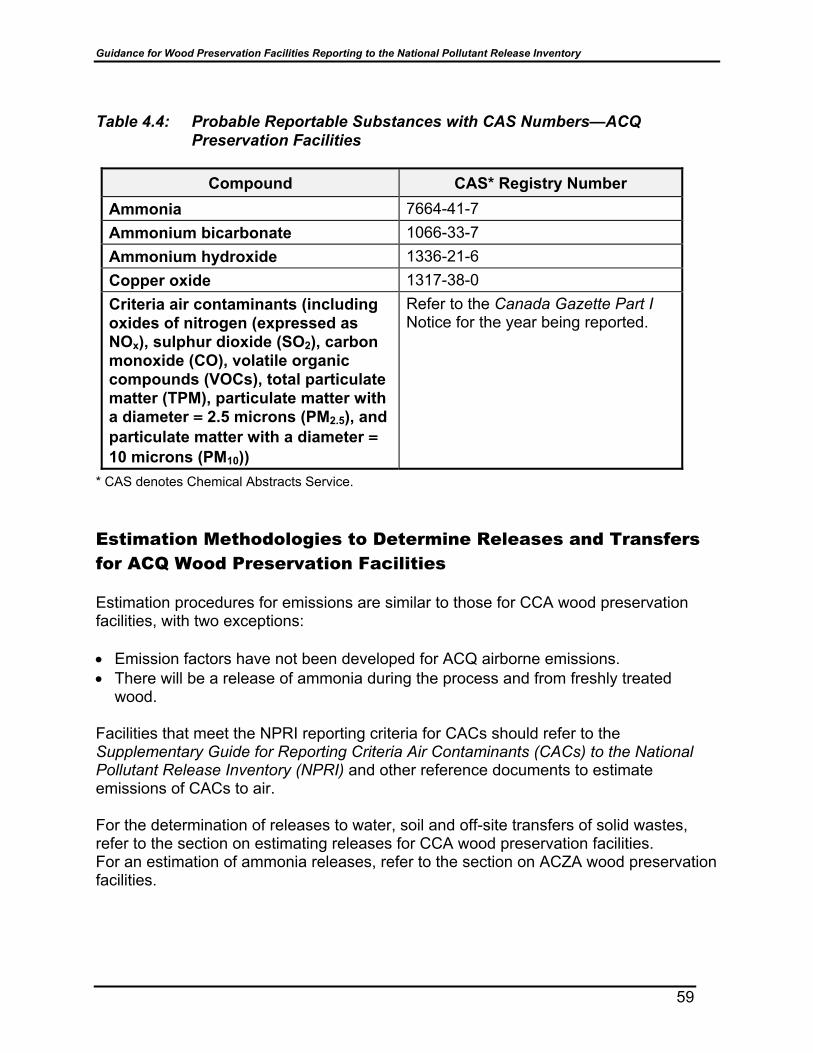
Guidance for Wood Preservation Facilities Reporting to the National Pollutant Release Inventory
59
Table 4.4: Probable Reportable Substances with CAS Numbers—ACQPreservation Facilities
Compound CAS* Registry NumberAmmonia 7664-41-7Ammonium bicarbonate 1066-33-7Ammonium hydroxide 1336-21-6Copper oxide 1317-38-0Criteria air contaminants (includingoxides of nitrogen (expressed asNOx), sulphur dioxide (SO2), carbonmonoxide (CO), volatile organiccompounds (VOCs), total particulatematter (TPM), particulate matter witha diameter = 2.5 microns (PM2.5), andparticulate matter with a diameter =10 microns (PM10))
Refer to the Canada Gazette Part INotice for the year being reported.
* CAS denotes Chemical Abstracts Service.
Estimation Methodologies to Determine Releases and Transfersfor ACQ Wood Preservation Facilities
Estimation procedures for emissions are similar to those for CCA wood preservationfacilities, with two exceptions:
• Emission factors have not been developed for ACQ airborne emissions.• There will be a release of ammonia during the process and from freshly treated
wood.
Facilities that meet the NPRI reporting criteria for CACs should refer to theSupplementary Guide for Reporting Criteria Air Contaminants (CACs) to the NationalPollutant Release Inventory (NPRI) and other reference documents to estimateemissions of CACs to air.
For the determination of releases to water, soil and off-site transfers of solid wastes,refer to the section on estimating releases for CCA wood preservation facilities.For an estimation of ammonia releases, refer to the section on ACZA wood preservationfacilities.
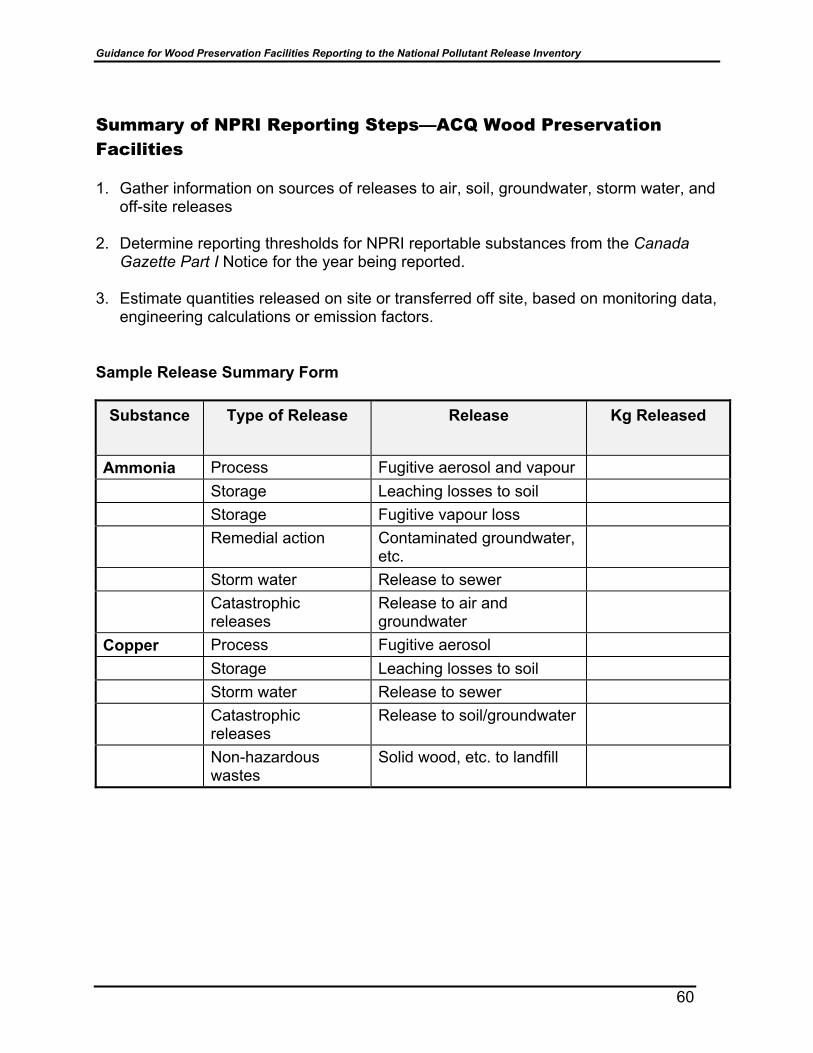
Guidance for Wood Preservation Facilities Reporting to the National Pollutant Release Inventory
60
Summary of NPRI Reporting Steps—ACQ Wood PreservationFacilities
1. Gather information on sources of releases to air, soil, groundwater, storm water, andoff-site releases
2. Determine reporting thresholds for NPRI reportable substances from the CanadaGazette Part I Notice for the year being reported.
3. Estimate quantities released on site or transferred off site, based on monitoring data,engineering calculations or emission factors.
Sample Release Summary Form
Substance Type of Release Release Kg Released
Ammonia Process Fugitive aerosol and vapourStorage Leaching losses to soilStorage Fugitive vapour lossRemedial action Contaminated groundwater,
etc.Storm water Release to sewerCatastrophicreleases
Release to air andgroundwater
Copper Process Fugitive aerosolStorage Leaching losses to soilStorm water Release to sewerCatastrophicreleases
Release to soil/groundwater
Non-hazardouswastes
Solid wood, etc. to landfill
Guidance for Wood Preservation Facilities Reporting to the National Pollutant Release Inventory
61
IV–F Creosote Wood Preservation Facilities
Overview
Creosote contains a large number of compounds, many of which are polycyclic aromatichydrocarbons (PAHs). Creosote solutions contain a number of NPRI reportablesubstances including naphthalene, anthracene, biphenyl, and certain individual PAHs.
Process Description(Figure 4.7)
Where high creosote retentions are required the full-cell or Bethel process is used.Creosote is heated to 70 to 90°C to reduce its viscosity and promote better penetration.Wood is loaded on trams and sealed in the pressure retort, and a vacuum is applied toremove air from the retort and accessible wood cells. The heated solution is drawn orpumped in and pressure is applied until the target retentions are achieved. After theimpregnation stage, treated wood is subjected to an expansion bath before thepreservative is drained and a final vacuum is applied in order to remove excesspreservative from the surface. In some cases, the treated wood is subjected to a post-steaming treatment to improve the wood’s surface cleanliness.
Where lower retentions are required, empty-cell processes can be performed, either bythe Rueping or the Lowry process. These processes result in preservative coating theinner cell walls rather than saturating the cell voids. Empty-cell processes differ fromthe full-cell process in the initial impregnation stage. In the Rueping process, treatingcommences by applying air pressure of 200 to 500 kPa for a short time, so that the airinside the wood is compressed. Creosote is pumped under pressure into the treatingretort and pressure is increased to about 1,040 kPa and held for sufficient time for thepredetermined amount of solution to enter the wood. After pressure release, thecompressed air in the wood expands pushing the excess preservative out, which isfacilitated by a final vacuum.
In the Lowry process no air pressures are applied at the initial impregnation stage. Thepreservative is pumped into the retort at atmospheric pressure (no initial vacuum).When pressure is applied, the air in the wood is compressed as the preservativepenetrates. When the pressure is released, the air inside the wood expands resulting inthe “kick out” of treating solution, although to a lesser extent than the Reuping process.The application of an expansion bath, final vacuum and post-treatment steaming arealso common with empty-cell treatments.
It is also possible to season and condition wood in the retort prior to pressure treatment.These processes result in contaminated water condensates. For example, unseasonedpilings can be seasoned in the retort by the Boultonizing or boiling under a vacuumprocess. Piles are sealed in the retort and hot creosote is then added. A vacuum is
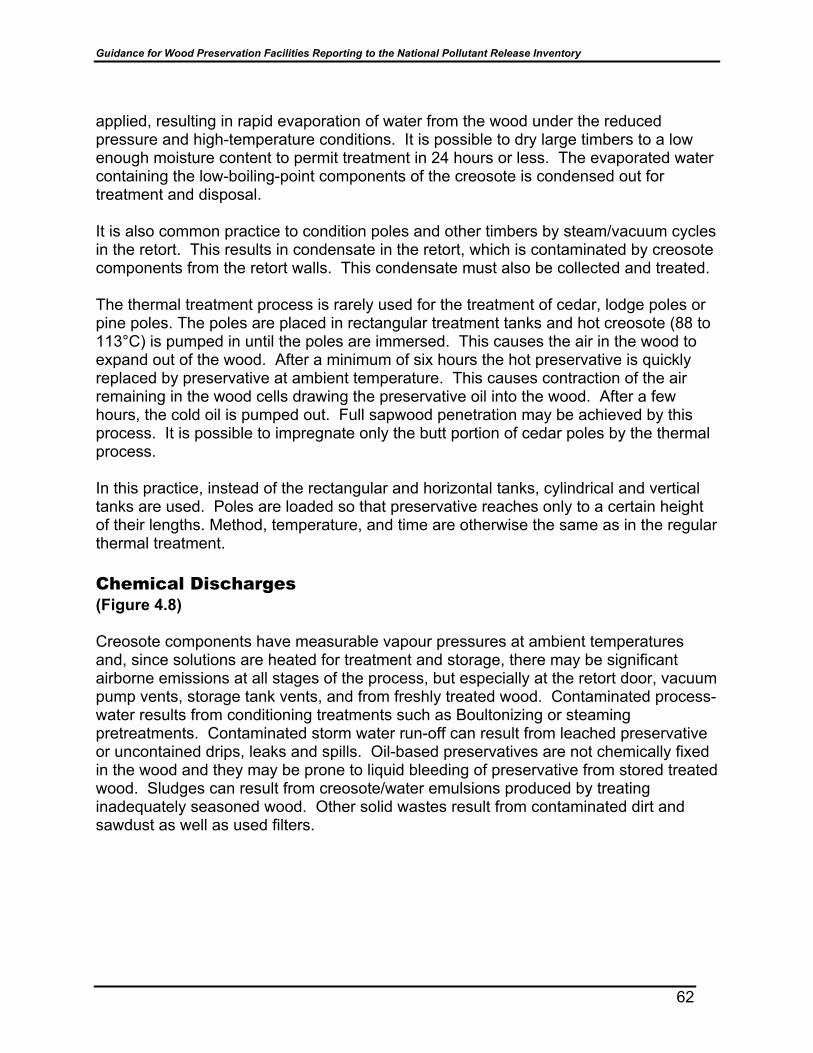
Guidance for Wood Preservation Facilities Reporting to the National Pollutant Release Inventory
62
applied, resulting in rapid evaporation of water from the wood under the reducedpressure and high-temperature conditions. It is possible to dry large timbers to a lowenough moisture content to permit treatment in 24 hours or less. The evaporated watercontaining the low-boiling-point components of the creosote is condensed out fortreatment and disposal.
It is also common practice to condition poles and other timbers by steam/vacuum cyclesin the retort. This results in condensate in the retort, which is contaminated by creosotecomponents from the retort walls. This condensate must also be collected and treated.
The thermal treatment process is rarely used for the treatment of cedar, lodge poles orpine poles. The poles are placed in rectangular treatment tanks and hot creosote (88 to113°C) is pumped in until the poles are immersed. This causes the air in the wood toexpand out of the wood. After a minimum of six hours the hot preservative is quicklyreplaced by preservative at ambient temperature. This causes contraction of the airremaining in the wood cells drawing the preservative oil into the wood. After a fewhours, the cold oil is pumped out. Full sapwood penetration may be achieved by thisprocess. It is possible to impregnate only the butt portion of cedar poles by the thermalprocess.
In this practice, instead of the rectangular and horizontal tanks, cylindrical and verticaltanks are used. Poles are loaded so that preservative reaches only to a certain heightof their lengths. Method, temperature, and time are otherwise the same as in the regularthermal treatment.
Chemical Discharges(Figure 4.8)
Creosote components have measurable vapour pressures at ambient temperaturesand, since solutions are heated for treatment and storage, there may be significantairborne emissions at all stages of the process, but especially at the retort door, vacuumpump vents, storage tank vents, and from freshly treated wood. Contaminated process-water results from conditioning treatments such as Boultonizing or steamingpretreatments. Contaminated storm water run-off can result from leached preservativeor uncontained drips, leaks and spills. Oil-based preservatives are not chemically fixedin the wood and they may be prone to liquid bleeding of preservative from stored treatedwood. Sludges can result from creosote/water emulsions produced by treatinginadequately seasoned wood. Other solid wastes result from contaminated dirt andsawdust as well as used filters.

Guidance for Wood Preservation Facilities Reporting to the National Pollutant Release Inventory
63
Table 4.5: Probable Reportable Compounds with CAS Numbers—CreosoteWood Preservation Facilities
Compound CAS* RegistryNumber
VFT TypicalAnalysis**
Typical AnalysisAWPA P1creosote†
% %
Anthracene 120-12-7 2.43 1.7Biphenyl 92-52-4 1.57 1.3Naphthalene 91-20-3 9.53 12.9
Benzo(a)anthracene 56-55-3 0.89 0.50Benzo(a)phenanthrene 218-01-9 - 0.10Benzo(a)pyrene 50-32-8 0.17 0.20Benzo(b)fluoranthene 205-99-2 - -Benzo(e)pyrene 192-97-2 - 0.20Benzo(g,h,i)perylene 191-24-2 0.04 0.10Benzo(j)fluoranthene 205-82-3 - 0.12Benzo(k)fluoranthene 207-08-9 - 0.22Dibenz(a,j)acridine 224-42-0 - -Dibenzo(a,h)anthracene 53-70-3 <0.01 -Dibenzo(a,i)pyrene 189-55-9 - -7H-Dibenzo(c,g)carbazole 194-59-2 - -Fluoranthene 206-44-0 5.76 4.6Indeno(1,2,3-c,d)pyrene 193-39-5 0.04 -Perylene 198-55-0 - 0.10Phenanthrene 85-01-8 14.26 11.2Pyrene 129-00-0 3.44 3.7
Criteria air contaminants(including oxides of nitrogen(expressed as NOx), sulphurdioxide (SO2), carbonmonoxide (CO), volatileorganic compounds (VOCs),total particulate matter (TPM),particulate matter with adiameter = 2.5 microns (PM2.5),and particulate matter with adiameter = 10 microns (PM10))
Refer to theCanada GazettePart I Notice forthe year beingreported.
NA*** NA***
* CAS denotes Chemical Abstracts Service.** Environment Canada 2000a*** Not applicable† Betts (1990)

Guidance for Wood Preservation Facilities Reporting to the National Pollutant Release Inventory
64
Figure 4.7: Creosote Treating Plant Layout
LegendValve
Pipe Vent Press. pumpVacuum pumpFilter Roofed areaDripping padsDripping basin DrainageCurb
Condenser
Unloading area
Charging area Reloading area
Working tank V Oil tank
VP
Creosote
V VP
V V
V V
Oil/water separator
Condens. tank
Retort
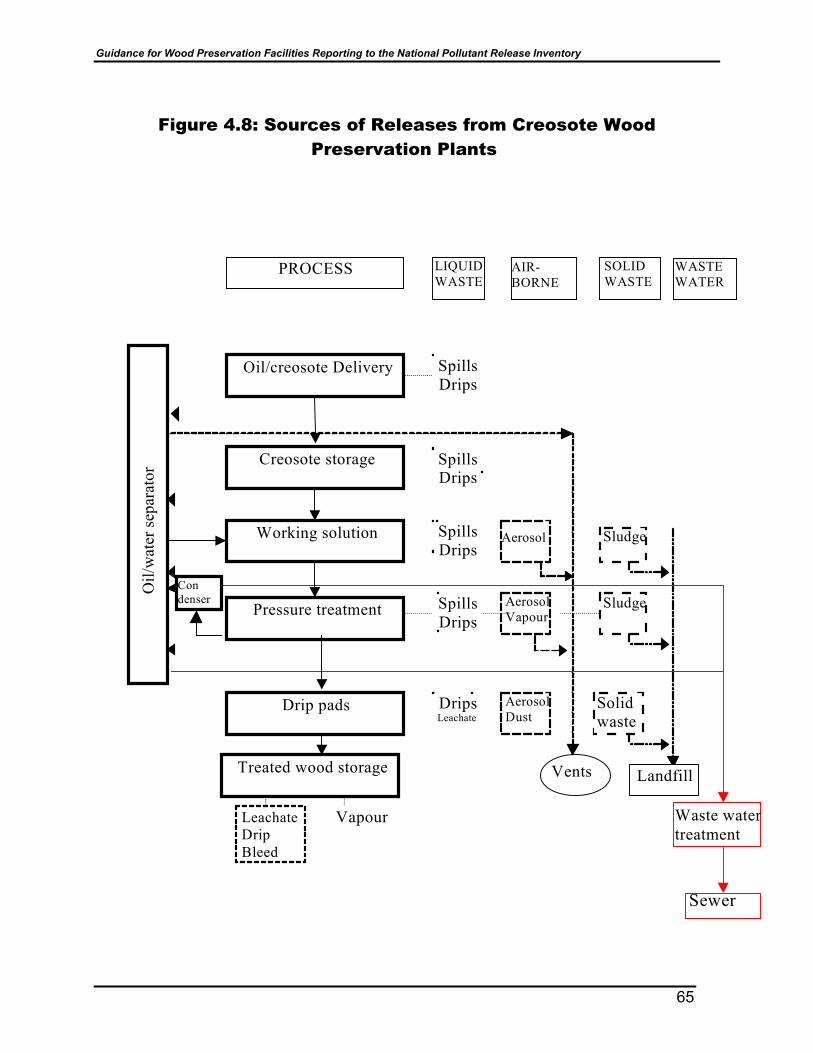
Guidance for Wood Preservation Facilities Reporting to the National Pollutant Release Inventory
65
Figure 4.8: Sources of Releases from Creosote WoodPreservation Plants
SpillsDrips
SpillsDrips
SpillsDrips
SpillsDrips
LIQUID WASTE
Vapour
DripsLeachate
Leachate Drip Bleed
Aerosol
AerosolVapour
Vents
AerosolDust
Sludge
Sludge
SOLID WASTE
Landfill
Solid waste
WASTE WATER
Waste water treatment
Sewer
Oil/creosote Delivery
Creosote storage
Working solution
Pressure treatment
Oil/
wat
er se
para
tor
Con denser
PROCESS
Treated wood storage
Drip pads
AIR-BORNE
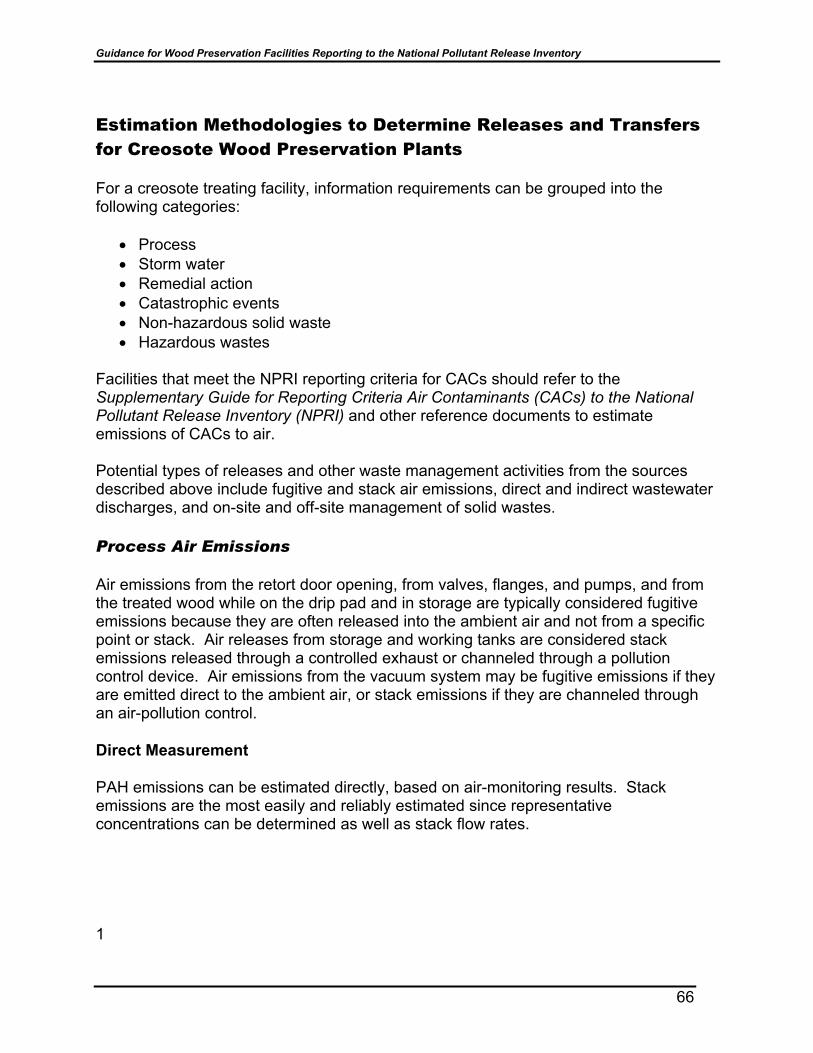
Guidance for Wood Preservation Facilities Reporting to the National Pollutant Release Inventory
66
Estimation Methodologies to Determine Releases and Transfersfor Creosote Wood Preservation Plants
For a creosote treating facility, information requirements can be grouped into thefollowing categories:
• Process• Storm water• Remedial action• Catastrophic events• Non-hazardous solid waste• Hazardous wastes
Facilities that meet the NPRI reporting criteria for CACs should refer to theSupplementary Guide for Reporting Criteria Air Contaminants (CACs) to the NationalPollutant Release Inventory (NPRI) and other reference documents to estimateemissions of CACs to air. Potential types of releases and other waste management activities from the sourcesdescribed above include fugitive and stack air emissions, direct and indirect wastewaterdischarges, and on-site and off-site management of solid wastes. Process Air Emissions Air emissions from the retort door opening, from valves, flanges, and pumps, and fromthe treated wood while on the drip pad and in storage are typically considered fugitiveemissions because they are often released into the ambient air and not from a specificpoint or stack. Air releases from storage and working tanks are considered stackemissions released through a controlled exhaust or channeled through a pollutioncontrol device. Air emissions from the vacuum system may be fugitive emissions if theyare emitted direct to the ambient air, or stack emissions if they are channeled throughan air-pollution control. Direct Measurement PAH emissions can be estimated directly, based on air-monitoring results. Stackemissions are the most easily and reliably estimated since representativeconcentrations can be determined as well as stack flow rates. 1

Guidance for Wood Preservation Facilities Reporting to the National Pollutant Release Inventory
67
Example 1: Calculating Air Releases of PAHs Using Stack Monitoring Data Stack testing has determined that PAHs are detected in the stack gases at a facility atconcentrations (g per dry standard cubic metre of gas) as tabulated below. Themoisture content in the stack is typically 10%. The stack gas velocity is typically1.8 m/sec. The diameter of the stack is 0.3 metres. The annual air release of the PAHsfrom the stack of the facility may be estimated as follows. 1. Calculate the volumetric flow of stack gas stream:
Volumetric flow = (gas velocity) x [Pi x (internal stack diameter)2 / 4] = (1.8 m/s) x [3.142 x (0.3m)2 / 4] = 0.13 m3/s
2. Correct the volumetric flow for moisture content in stack gas stream:
Stack gases may contain large amounts of water vapour. The concentration of thechemical in the exhaust is often presented on a ‘dry gas’ basis. For an accuraterelease rate, correct the stack or vent gas flow rate in step 1 for the moisture contentof the facility’s stack gas. This is done as follows:
Corrected dry gas volumetric flow = (volumetric flow) x (1 - fraction of water vapour) = (0.13 m3/s) x (1 - 0.10) = 0.11 m3/s
3. Estimate annual stack emissions to air:
Multiply the dry gas volumetric flow rate by the concentration of PAHs measured inthe stack gases:
R air = C x V x CF x H Where: R air = Annual release of PAHs to air (g/year) C = Stack gas concentration of PAHs (g/dry standard m3) V = Hourly volumetric flow rate of combustion stack gas (m3/hour) CF = Capacity factor, fraction of time that the facility operates on an annual
basis (e.g. 0.85) H = Total hours in a year (8,760 hours/year)
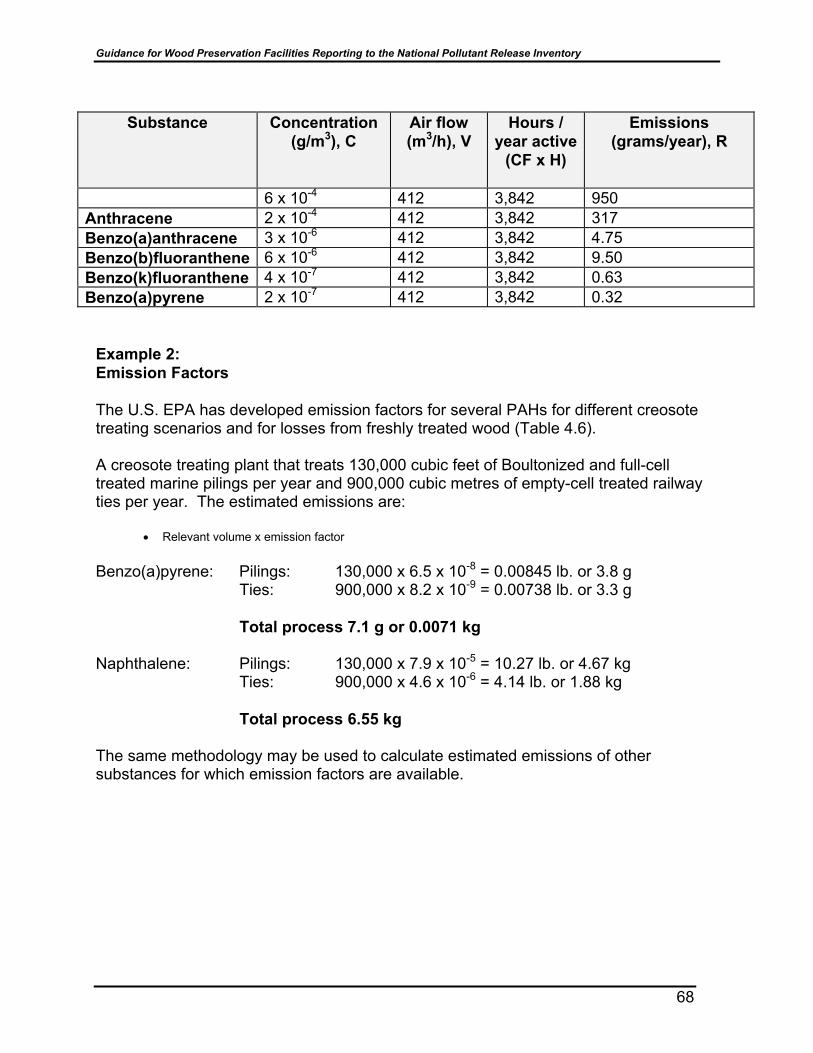
Guidance for Wood Preservation Facilities Reporting to the National Pollutant Release Inventory
68
Substance Concentration (g/m3), C
Air flow (m3/h), V
Hours /year active
(CF x H)
Emissions (grams/year), R
6 x 10⁻⁴ 412 3,842 950 Anthracene 2 x 10⁻⁴ 412 3,842 317 Benzo(a)anthracene 3 x 10⁻⁶ 412 3,842 4.75 Benzo(b)fluoranthene 6 x 10⁻⁶ 412 3,842 9.50 Benzo(k)fluoranthene 4 x 10⁻⁷ 412 3,842 0.63 Benzo(a)pyrene 2 x 10⁻⁷ 412 3,842 0.32
Example 2: Emission Factors The U.S. EPA has developed emission factors for several PAHs for different creosotetreating scenarios and for losses from freshly treated wood (Table 4.6). A creosote treating plant that treats 130,000 cubic feet of Boultonized and full-celltreated marine pilings per year and 900,000 cubic metres of empty-cell treated railwayties per year. The estimated emissions are:
• Relevant volume x emission factor
Benzo(a)pyrene: Pilings: 130,000 x 6.5 x 10-8 = 0.00845 lb. or 3.8 gTies: 900,000 x 8.2 x 10-9 = 0.00738 lb. or 3.3 g
Total process 7.1 g or 0.0071 kg
Naphthalene: Pilings: 130,000 x 7.9 x 10-5 = 10.27 lb. or 4.67 kgTies: 900,000 x 4.6 x 10-6 = 4.14 lb. or 1.88 kg
Total process 6.55 kg
The same methodology may be used to calculate estimated emissions of othersubstances for which emission factors are available.

Guidance for Wood Preservation Facilities Reporting to the National Pollutant Release Inventory
69
Table 4.6: Emission Factors for Wood Treated with Creosote
Emission factors in kg emitted per cubic metre (pounds per cubic foot inbrackets) of wood treated with creosote with and without Boultonizingconditioning and surface emissions to air during storage (g/m2) (MRI 1999)
Emission Factors
Substance
Total treatmentwith Boultonizing
kg/m3
(lb./ft.3)
Total treatmentwithout
Boultonizingkg/m3
(lb./ft.3)
Emissions fromfreshly treated
woodg/m2
(lb./1000 ft.2)Anthracene 2.1 x 10⁻⁶
(1.3 x 10⁻⁷)2.6 x 10⁻⁷
(1.6 x 10⁻⁸)0.488(0.10)
Naphthalene 1.3 x 10⁻³
(7.9 x 10⁻⁵)7.3 x 10⁻⁵
(4.6 x 10⁻⁶)30.7(6.3)
Total VOC** 0.093(5.8 x 10⁻³)
0.012(7.4 x 10⁻⁴)
ND*
Benzo(a)anthracene 2.1 x 10⁻⁶
(1.3 x 10⁻⁷)2.6 x 10⁻⁷
(1.6 x 10⁻⁸)ND*
Benzo(b)fluoranthene 2.1 x 10⁻⁶
(1.3 x 10⁻⁷)2.6 x 10⁻⁷
(1.6 x 10⁻⁸)ND*
Benzo(k)fluoranthene 7.7 x 10⁻⁷
(4.8 x 10⁻⁸)9.6 x 10⁻⁸
(6.0 x 10⁻⁹)ND*
Benzo(a)pyrene 1.0 x 10⁻⁷
(6.5 x 10⁻⁸)1.3 x 10⁻⁷
(8.2 x 10⁻⁹)ND*
Fluoranthene 1.1 x 10⁻⁵
(6.8 x 10⁻⁷)1.4 x 10⁻⁶
(8.6 x 10⁻⁸)0.488(0.10)
Fluorene 6.2 x 10⁻⁵
(3.9 x 10⁻⁶)1.2 x 10⁻⁶
(7.8 x 10⁻⁸)8.30(1.7)
Phenanthrene 3.0 x 10⁻⁵
(1.9 x 10⁻⁶)4.5 x 10⁻⁶
(2.8 x 10⁻⁷)10.74(2.2)
Pyrene 9.3 x 10⁻⁶
(5.8 x 10⁻⁷)1.2 x 10⁻⁶
(7.3 x 10⁻⁸)0.100(0.02)
Chrysene 1.1 x 10⁻⁶
(6.7 x 10⁻⁸)1.3 x 10⁻⁷
(8.4 x 10⁻⁹)ND*
All PAHs; fugitive leaching losses in storage: No emission factors available.* Not Determined** Refer to the Supplementary Guide for Reporting Criteria Air Contaminants (CACs) to the National
Pollutant Release Inventory (NPRI) and other reference documents to estimates emissions of theother CACs to air.

Guidance for Wood Preservation Facilities Reporting to the National Pollutant Release Inventory
70
Example 3
Estimate the PAH emissions from stored railway ties in 90 stacks, 8.5-feet wide, 30-feetlong and 20-feet high. Assume emissions are from the outer stack surface area only(MRI 2000).
The total exposed area is from the top (8.5 ft. x 30 ft. or 255 ft.2), two ends: (2 x 8.5 ft. x20 ft. or 340 ft.2) and two sides: (2 x 20 ft. x 30 ft. or 1,200 ft.2) for a total surface areaper stack of 1,795 ft.2 or a total surface area of 90 x 1,795 or 161,550 ft.2.
The estimated emissions to air are as follows:
Naphthalene: 161,550 ft.2 x 6.3/1000 psf = 1,018 lb. or 463 kg
Anthracene: 161,550 ft.2 x 0.488/1000 psf = 78.8 lb. or 35.8 kg
Fluoranthene: 161,550 ft.2 x 0.10/1000 psf = 16.15 lb. or 7.34 kg
Phenanthrene: 161,550 ft.2 x 2.2/1000 psf = 355 lb. or 161.5 kg
The same methodology may be used to calculate estimated emissions of othersubstances where emission factors for freshly treated wood are available.
Wastewater Discharges
Example 1
A facility discharges its wastewater via storm sewers to a local sewage-treatment plant.The reportable PAHs are sampled and analyzed. The total flow for the year was5,520 m3 and the naphthalene concentration averaged 0.5 mg/L, the anthraceneconcentration 0.14 mg/L, and the benzo(a)pyrene concentration 0.02 mg/L.
The amount of naphthalene discharged is:
= (5,520 m3/year, total flow) x (103 L/m3) x (0.5 mg/L concentration) x (10-6 kg/mg)= 2.76 kg
The amount of anthracene discharged is:
= (5,520 m3/year, total flow) x (103 L/m3) x (0.14 mg/L concentration) x (10-6 kg/mg)= 0.77 kg
The amount of benzo(a)pyrene discharged is:

Guidance for Wood Preservation Facilities Reporting to the National Pollutant Release Inventory
71
= (5,520 m3/year, total flow) x (103 L/m3) x (0.02 mg/L concentration) x (10-6 kg/mg)= 0.110 kg or 110 g
Releases Caused by Remedial Action
Remedial action can include a number of activities including disposal of contaminatedsoils, recovery and treatment of contaminated groundwater, or other one-time, non-routine clean-ups.
If groundwater near the plant has been contaminated, it is usually pumped out of theground, treated and released where the amount released is a function of theconcentration and volume of water discharge meeting provincial and federal limits.Remediation of contaminated soil may result in the off-site transfer of contaminated soil.Releases are determined by applying the results from soil sample analysis of therelevant PAHs in the samples to the total amount of soil involved.
Example 1
Groundwater in the amount of 250,000 imperial gallons was recovered, treated, anddischarged with concentrations of naphthalene, pyrene and benzo(a)pyrene of0.15 mg/L, 0.10 mg/L and 0.03 mg/L, respectively. The amount released is calculatedas:
250,000 gallons x 4.54 L/gal. x concentration mg/L x 10-6 kg/mg
This results in releases of 0.170, 0.113 and 0.034 kg (170, 113 and 34 g) per year ofnaphthalene, pyrene and benzo(a)pyrene, respectively.
Example 2
Twenty thousand pounds (9,090 kg) of contaminated soil were removed as a result ofremedial activities on soil containing PAH concentrations above current CCMEguidelines for industrial sites. The actual concentrations of PAHs in the soil are asshown in the table below.
The releases in kilograms can be calculated as follows:
Weight of soil (kg) x concentration (mg/kg) x 10-6 (kg/mg)
Substance Soil Concentrationmg/kg
Releaseskg (g)
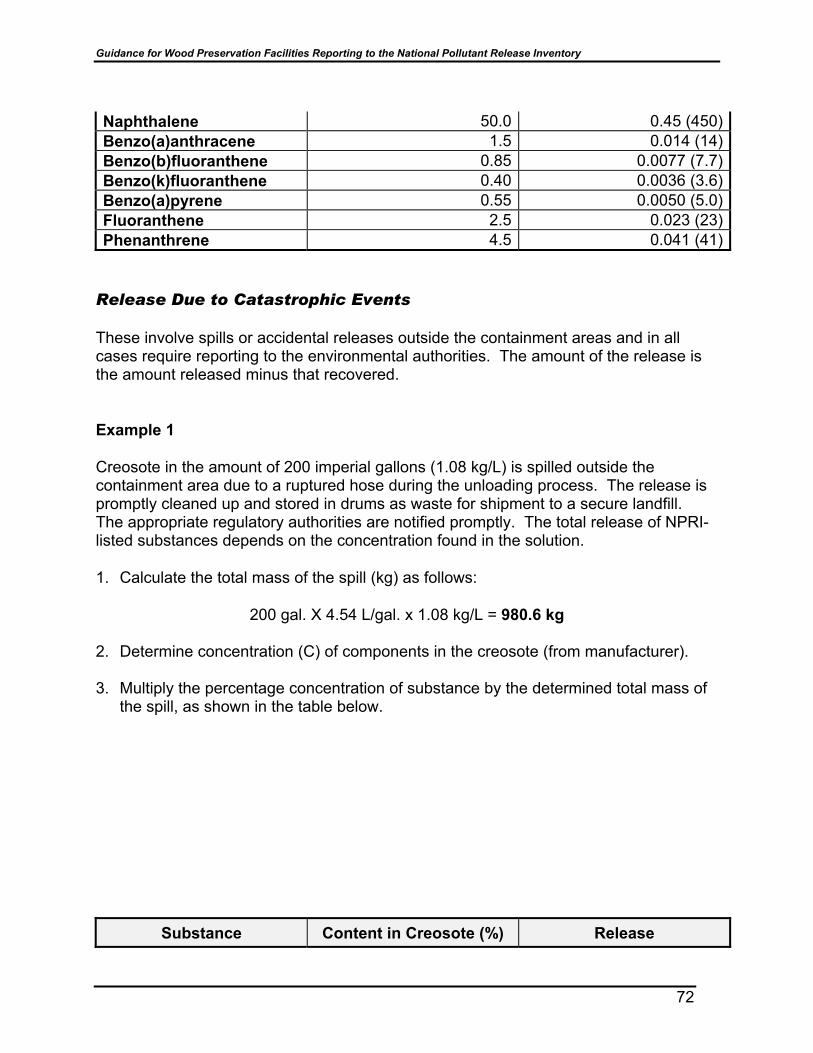
Guidance for Wood Preservation Facilities Reporting to the National Pollutant Release Inventory
72
Naphthalene 50.0 0.45 (450)Benzo(a)anthracene 1.5 0.014 (14)Benzo(b)fluoranthene 0.85 0.0077 (7.7)Benzo(k)fluoranthene 0.40 0.0036 (3.6)Benzo(a)pyrene 0.55 0.0050 (5.0)Fluoranthene 2.5 0.023 (23)Phenanthrene 4.5 0.041 (41)
Release Due to Catastrophic Events
These involve spills or accidental releases outside the containment areas and in allcases require reporting to the environmental authorities. The amount of the release isthe amount released minus that recovered.
Example 1
Creosote in the amount of 200 imperial gallons (1.08 kg/L) is spilled outside thecontainment area due to a ruptured hose during the unloading process. The release ispromptly cleaned up and stored in drums as waste for shipment to a secure landfill.The appropriate regulatory authorities are notified promptly. The total release of NPRI-listed substances depends on the concentration found in the solution.
1. Calculate the total mass of the spill (kg) as follows:
200 gal. X 4.54 L/gal. x 1.08 kg/L = 980.6 kg
2. Determine concentration (C) of components in the creosote (from manufacturer).
3. Multiply the percentage concentration of substance by the determined total mass ofthe spill, as shown in the table below.
Substance Content in Creosote (%) Release

Guidance for Wood Preservation Facilities Reporting to the National Pollutant Release Inventory
73
Anthracene 2.0 19.6 kgNaphthalene 3.0 29.4 kgBiphenyl 0.8 7.84 kgBenzo(a)anthracene 0.9 8.82 kgBenzo(g,h,i)perylene 0.04 0.392 kgBenzo(a)pyrene 0.17 1.67 kgFluoranthene 10 98.1 kgPhenanthrene 21 205.9 kgPyrene 8.5 83.4 kgChrysene 3.0 29.4 kg
Transfers in Solid Hazardous Waste
For solid hazardous waste, a determination of the total quantity of waste and theconcentration of the PAH components must be made. Hazardous waste manifests areused to determine the amount of hazardous waste that was shipped off site. In addition,a waste analysis should be performed to determine the concentration of PAHs in thewaste. This analysis should then be used to determine the actual transfer to landfill.
Example:
A facility sent 10 45-gallon drums of waste to a secure landfill. The total quantity ofwaste disposed was 3,520 kg, containing naphthalene (300 mg/kg), anthracene (130mg/kg), biphenyl (98 mg/kg), phenanthrene (450 mg/kg), benzo(a)fluoranthene (2mg/kg), pyrene (34 mg/kg), and benzo(a)pyrene (3.5 mg/kg). Therefore, the actualquantities in the waste are as follows:
3,520 kg x 300 mg/kg x 10-6 kg/mg = 1.06 kg naphthalene3,520 kg x 130 mg/kg x 10-6 kg/mg = 0.46 kg anthracene3,520 kg x 98 mg/kg x 10-6 kg/mg = 0.344 kg biphenyl3,520 kg x 450 mg/kg x 10-6 kg/mg = 1.58 kg phenanthrene3,520 kg x 2 mg/kg x 10-6 kg/mg = 0.007 kg benzo(a)fluorene3,520 kg x 34 mg/kg x 10-6 kg/mg = 0.120 kg pyrene3,520 kg x 3.5 mg/kg x 10-6 kg/mg = 0.012 kg benzo(a)pyrene
The facility had additional manifests for the soils disposed of during remedial action.However, these releases have already been accounted for in that section.
Summary of NPRI Reporting Steps — Creosote Wood PreservationFacilities
1. Gather information on sources of releases to air, soil, groundwater, storm water, andoff-site releases.

Guidance for Wood Preservation Facilities Reporting to the National Pollutant Release Inventory
74
2. Determine reporting thresholds for NPRI reportable substances from CanadaGazette Part I Notice for the year being reported..
3. Estimate quantities released on site or transferred off-site, based on monitoring data,engineering calculations or emission factors.
Sample Release Summary Form
Substance Type of Release Release Kg Released
Naphthalene Process Fugitive aerosol and vapourProcess Fugitive losses to
groundwaterProcess Fugitive losses to soilStorage Fugitive vapour and
leachateStorm water Release to sewerCatastrophicreleases
Release to soil/groundwater
Hazardous waste Solid waste transferred tohazardous waste site
Benzo(a)pyrene Process Stack emissions to airProcess Fugitive aerosol and vapourProcess Fugitive losses to soilStorage Fugitive vapour and
leachateStorm water Release to sewerCatastrophicreleases
Release to soil/groundwater
Hazardous waste Solid waste transferred tohazardous waste site

Guidance for Wood Preservation Facilities Reporting to the National Pollutant Release Inventory
75
IV-G: Pentachlorophenol Wood Preservation Facilities
Process Description
Wood preserving using PCP employs either a pressure process or a thermal process toimpregnate the wood with the preservative chemical. In the first instance, hydraulicpressure is used to force the preservative into the wood. In the second instance, theeffects of heating and cooling are used to induce preservative movement into the wood.
However, before the wood can be preserved, it must be seasoned or dried to ensurethat preservative penetration requirements can be met. Seasoning or drying may bedone by air seasoning or kiln drying, and, at pressure treatment plants, by eitherBoulton drying or steam conditioning. In these two processes a combination of heatand vacuum is used to remove moisture from the wood in the pressure retort.
PCP can be purchased in liquid solution, dry flake or block form. The PCP solutionused for wood preservation is typically dissolved in a petroleum solvent and containsbetween 5 and 10% technical-grade PCP by weight.
The pressure-treatment process is carried out in horizontal pressure retorts or cylinders.Properly seasoned wood is placed in the retort and then the retort door is sealed. If theRueping process is used, the retort is first pressurized with air. The retort is then filledwith the preservative chemical while maintaining the initial air pressure in the retort bybleeding air through a vent line into the preservative tank. If the Lowery process isused, the retort is filled with oil while atmospheric pressure is maintained in the vessel.
When the retort is full of preservative the pressure is increased until the desiredinjection has been achieved. The maximum allowable pressure is 200 psi (1,380 kPa).The pressure is then reduced and, if desired, the temperature of the oil can be quicklyraised to create an expansion bath. The preservative is then returned to thepreservative tank. A vacuum is then applied to the retort to recover excess preservativefrom the cells of the wood.
After the recovered preservative is pumped from the retort a final steam bath may beapplied. After the retort has been drained the door is opened and the treated wood isremoved from the retort. Quality control testing is then completed and the material iseither shipped or moved to storage to await shipment.
The thermal-treating process is carried out in open tanks. In some cases the full lengthof the wood member is immersed in the preservative, while in other cases only the buttend of the material is treated.
The seasoned wood is placed in the thermal-treating chamber and the tanks are filledwith hot preservative. After completion of the hot-bath period, the hot preservative iseither replaced by cold preservative (cold bath) or the preservative in the tank is allowed

Guidance for Wood Preservation Facilities Reporting to the National Pollutant Release Inventory
76
to cool (cooling bath). This cycle may be repeated if required. A final expansion bathwith hot preservative may be applied. The oil is then removed from the tanks and thetreated wood is taken out. Quality control testing is then completed and the material iseither shipped or moved to storage to await shipment.
At a facility used for wood preservation using PCP, the probable NPRI reportablesubstances are shown in Table 4.7.
Table 4.7 Probable Reportable Substances with CAS Numbers—PreservationFacilities Using Pentachlorophenol
Compound CAS Registry Number1
Criteria air contaminants (including oxides of nitrogen(expressed as NOx), sulphur dioxide (SO2), carbonmonoxide (CO), volatile organic compounds (VOCs),total particulate matter (TPM), particulate matter with adiameter = 2.5 microns (PM2.5), and particulate matterwith a diameter = 10 microns (PM10))
Refer to the CanadaGazette Part I Notice forthe year being reported.
Hexachlorobenzene2 118-74-1
Polychlorinated dibenzo-p-dioxins and Polychlorinateddibenzofurans2
*
1 CAS Registry Number denotes the Chemical Abstracts Service Registry Number, as appropriate2 This class of substances is restricted to certain congeners. Consult the Canada Gazette Part I Notice
for the year being reported for the relevant list of congeners.* No single CAS number applies to their NPRI listing.
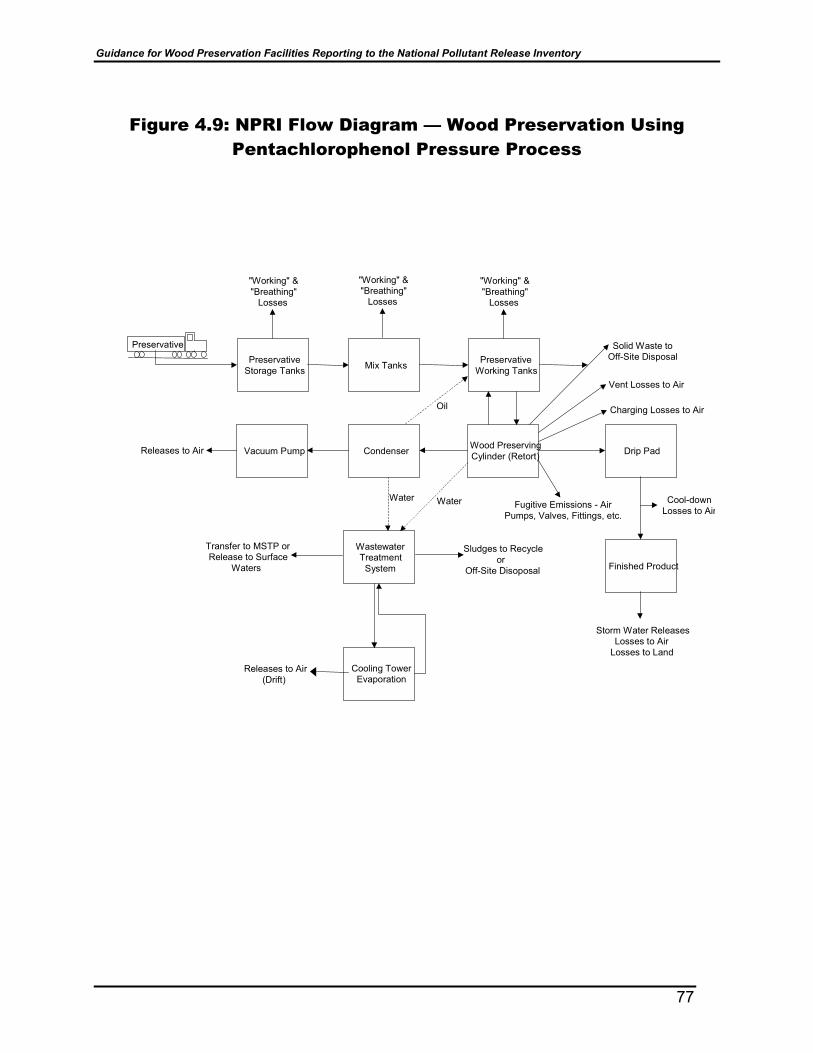
Guidance for Wood Preservation Facilities Reporting to the National Pollutant Release Inventory
77
Figure 4.9: NPRI Flow Diagram — Wood Preservation UsingPentachlorophenol Pressure Process
Cooling TowerEvaporation
WastewaterTreatment
System
Vacuum Pump Wood PreservingCylinder (Retort)
PreservativeWorking Tanks
Condenser
PreservativeStorage Tanks
"Working" &"Breathing"
Losses
"Working" &"Breathing"
Losses
Releases to Air
Transfer to MSTP orRelease to Surface
Waters
Sludges to Recycleor
Off-Site Disoposal
Solid Waste toOff-Site Disposal
Charging Losses to Air
Cool-downLosses to Air
Vent Losses to Air
Fugitive Emissions - AirPumps, Valves, Fittings, etc.
Storm Water ReleasesLosses to Air
Losses to Land
Preservative
Mix Tanks
"Working" &"Breathing"
Losses
Drip Pad
Finished Product
Oil
WaterWater
Releases to Air(Drift)
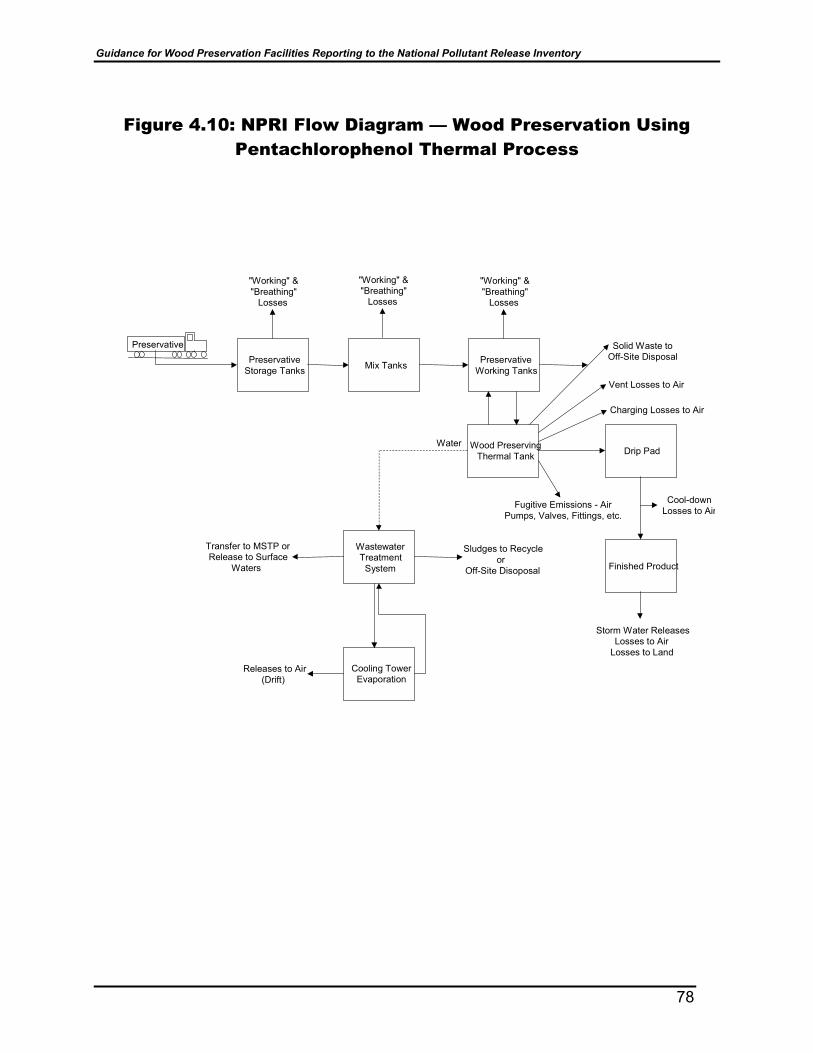
Guidance for Wood Preservation Facilities Reporting to the National Pollutant Release Inventory
78
Figure 4.10: NPRI Flow Diagram — Wood Preservation UsingPentachlorophenol Thermal Process
Cooling TowerEvaporation
WastewaterTreatment
System
Wood PreservingThermal Tank
PreservativeWorking Tanks
PreservativeStorage Tanks
"Working" &"Breathing"
Losses
"Working" &"Breathing"
Losses
Transfer to MSTP orRelease to Surface
Waters
Sludges to Recycleor
Off-Site Disoposal
Solid Waste toOff-Site Disposal
Charging Losses to Air
Cool-downLosses to Air
Vent Losses to Air
Fugitive Emissions - AirPumps, Valves, Fittings, etc.
Storm Water ReleasesLosses to Air
Losses to Land
Preservative
Mix Tanks
"Working" &"Breathing"
Losses
Drip Pad
Finished Product
Water
Releases to Air(Drift)

Guidance for Wood Preservation Facilities Reporting to the National Pollutant Release Inventory
79
Sources of Releases and Transfers of NPRI-Listed Substances
A facility using PCP must account for all releases and transfers of an NPRI-listedsubstance. Releases and transfers of NPRI-listed substances can occur fromnumerous sources and activities at a wood preserving plant, as shown in Figures 4.9and 4.10. Additionally, facilities should also consider any releases to air of criteria aircontaminants from their plant processes and operations – including oxides of nitrogen(expressed as NOx), sulphur dioxide (SO2), carbon monoxide (CO), volatile organiccompounds (VOCs), total particulate matter (TPM), particulate matter with a diameter =2.5 microns (PM2.5), and particulate matter with a diameter = 10 microns (PM10).
Two types of activities lead to releases to the air from tanks and vessels containing thewood preserving chemicals. The first activity is the receipt and storage of oils in tanksand the mixing of chemicals or oils to be used for wood preserving. The second activityis the transfer of oils, air, steam, and wood to and from the wood preserving tanks andvessels.
Emissions of NPRI-listed substances from the tanks used to store or mix the solutionsused in wood-treating operations may be broken into working losses and breathinglosses. As tanks are filled or refilled, a volume of air equal to the volume of theincoming liquid may be expelled to the atmosphere. This is a working loss. Breathinglosses occur in an unheated tank as a result of changing ambient temperatures thatcause the volume of the air in the void space of the tank to change, thereby causing arelease. Breathing losses are essentially independent of the volume of the liquidthroughput. Please note that as based on the experience of PCP representatives in theU.S. and the results of subsidiary calculations in the release estimates computed by thespreadsheets, a conservative factor of 1.5 is applied to the working losses. In addition,working losses are calculated from the receipt, storage, and mixing of chemicals inunheated tanks, to account for breathing losses from these tanks.
Additional air emissions from the wood-preserving process systems are related to theworking losses caused by the displacement of air from the tanks and vessels by themovement of oils and wood, the use of initial air pressure, the use of steam, and the useof vacuum cycles. As wood-preserving cylinders or thermal tanks are filled, the oildisplaces the air in the vessel. At a thermal tank, this is considered a release. At apressure cylinder, the air is vented back into the oil tank. If initial air pressure is used,an expansion of the compressed air in the tank vapour space may cause an emission.When the preservative is pumped from the treating cylinder back to the tank, anotheremission may occur from the oil tank.
The application of steam to treating cylinders may also result in an emission of air fromthe treating cylinder because air is initially bled from the cylinder as steam is introduced.At the end of the steaming cycle, there may be another emission as the steam is blownout into the atmosphere.

Guidance for Wood Preservation Facilities Reporting to the National Pollutant Release Inventory
80
If a vacuum is pulled on the treating cylinder, the non-condensable air in the cylinder willbe emitted from the vacuum device (i.e. pump or jet). When a treating cylinder isopened to remove treated material and to insert untreated material, emissions may bereleased from the open cylinder. If freshly treated wood is at an elevated temperaturewhen it is removed from the treating cylinder or thermal tank, emissions will result whenthe wood cools to ambient temperature. There may be minor emissions of NPRI-listedsubstances during the storage of the finished product prior to shipment.
The U.S. EPA has indicated in its guidance document, Estimating Chemical Releasesfrom Wood Preserving Operations, EPA 560/4-88-004P (February 1988), that nosignificant emissions of PCP are expected to occur from routine wastewatermanagement and evaporation at a wood preserving facility. Since the vapour pressuresof HCB, dioxins and furans are lower than the vapour pressure of PCP, it is expectedthat their water concentrations will be lower by many orders of magnitude. This alsosuggests that any potential air emissions of these substances from the management ofroutine wastewater are not expected to be significant. However, if water containingNPRI-listed substances is used in cooling towers, releases from cooling tower drift couldbe significant. Computations for potential releases from cooling tower drift are includedin the release estimating spreadsheets.
There may also be fugitive air emissions from miscellaneous sources such as flanges,valves, pumps, and sampling taps. These emissions are expected to be very smallbecause of the low vapour pressure of the NPRI-listed substances at PCP woodpreserving facilities; however, the spreadsheets include an estimation of theseemissions.
Several other sources of releases may exist at a wood treating plant. Releases mayoccur as a result of remedial or waste-treatment activities at the site. Releases tosurface water can occur in storm water run-off and from discharges of processwastewater into streams or water bodies. Releases to land could occur from a spill thatwas not removed from the site, from on-site disposal of wastes containing an NPRIsubstance, or from contaminated storm water that percolates into the ground. Transfersof an NPRI substance to other locations will occur in the shipment of waste products tooff-site locations for treatment, recycling, or disposal. These transfers can be in theform of wastewater discharged to a municipal sewage-treatment plant, or solid and/orhazardous wastes shipped to recycling/disposal facilities.

Guidance for Wood Preservation Facilities Reporting to the National Pollutant Release Inventory
81
Methods Used for Release and Transfer Estimations
After the identification of release and transfer points, the facility must develop a meansto quantify those releases and transfers. Currently NPRI does not require a facility toobtain analytical data if that data is not already available. However, the spreadsheetsaccompanying this Guide allow for the use of actual release and transfer data, ifavailable.
The methods used to estimate the quantity of the releases of NPRI-listed substances inthis document are based on the guidance documents that are listed as references. Allof these release-estimation or release-calculation methodologies require an estimate ofthe total volume or mass of a release or transfer as well as the concentration of theNPRI-listed substance in that volume or mass. The following sections will explain themethodologies used to calculate the releases and transfers and will also describe theprocedures used to estimate the required data if measured data is unavailable. Themethodologies include engineering calculations based on the chemical and physicalproperties of the NPRI-listed substances, and PCP product chemistry data. Additionaldocumentation and details of the estimation methods are found in the appendices to thissection of the Guide.
The releases of HCB, dioxins and furans to the air in vapour form will be calculatedusing standard engineering estimating techniques. These techniques are based on theconcentration of the substances in technical grade PCP and the molecular weights andvapour pressures of the substances. Table 4.8 presents the average dioxin, furan andHCB concentrations in technical PCP as reported by PCP manufacturers. This tablealso includes information on the chemical and physical properties of these substances.Not all of the dioxins and furans in PCP are of the 2,3,7,8-substituted compoundcategory listed by the NPRI. The percent of 2,3,7,8-substituted compounds in eachcongener group was reported by Environment Canada (EC, 1999).
The PCP data provided by the manufacturers did not indicate the presence of tetra- orpenta-substituted dioxins and furans. The total hexa- and hepta-substituted dioxin/furanconcentrations were adjusted by the factors published in the Environment Canadareference noted above. Each of the 2,3,7,8-substituted congeners has a toxicequivalency factor (TEF) that relates its estimated toxicity to that of 2,3,7,8-TCDD. Themass, in grams, of a specific congener multiplied by its TEF produces a ToxicEquivalent (TEQ) value. The Guide for Reporting to the National Pollutant ReleaseInventory should be consulted to obtain these weighting factors for the year beingreported.
Releases to other environmental media will be estimated as based on PCP productchemistry data. Facilities that meet the NPRI reporting criteria for CACs should refer tothe Supplementary Guide for Reporting Criteria Air Contaminants (CACs) to theNational Pollutant Release Inventory (NPRI) and other reference documents to estimateemissions of CACs to air.

Guidance for Wood Preservation Facilities Reporting to the National Pollutant Release Inventory
82
Table 4.8: Information Used to Calculate Releases or Transfers fromPentachlorophenol Wood Preserving Facilities
Chemical orCongener
Group
MW VP@25°Cmm Hg
Average TotalReported
Concentrationin TechnicalPCP (ppm)
Fraction2,3,7,8-
Substituted
2,3,7,8-SubstitutedCongener
Concentra-tion in
TechnicalPCP (ppm)
ToxicEquivalent
Factor(TEF)**
PCP* 266.00 1.90E-04 9.99E+05 N/A N/A N/A4CDD 321.98 1.50E-09 0.00E+00 0.00E+00 15CDD 356.42 4.40E-10 0.00E+00 0.00E+00 0.56CDD 390.87 4.10E-11 1.412E+00 0.59 8.33E-01 0.17CDD 425.31 5.60E-12 2.68E+01 0.76 2.04E+01 0.018CDD 460.76 8.25E-13 7.33E+02 1.0 7.33E+02 0.0014CDF 305.98 1.50E-08 0.00E+00 0.00E+00 0.15CDF 340.42 2.15E-09 0.00E+00 0.00E+00 0.56CDF 374.87 2.35E-10 6.633E+00 0.13 8.62E-01 0.17CDF 409.31 7.10E-11 5.6549E+01 0.27 1.53E+01 0.018CDF 444.76 3.75E-12 2.11E+02 1.0 2.11E+02 0.001HCB 284.80 1.09E-05 5.00E+01 N/A N/A N/A
* Technical PCP may contain low levels of other chlorinated phenols.** TEF values should be obtained from the Guide for Reporting to the National Pollutant Release
Inventory for the year being reported.
Releases to the Air from Closed Tanks and Vessels
The movement of a liquid or air into a tank or vessel containing NPRI-listed substanceswill result in an air emission from that tank. The volume of air emitted will be equal tothe volume of the material that is added to the tank. The concentration of the NPRI-listed substance emitted is dependent on the following:
1. The concentration of the NPRI substance in the liquid in the tank;
2. Physical characteristics (vapour pressure and molecular weight) of the NPRI-listed substance;
3. The concentration and physical characteristics of other chemicals in the tankliquid; and
4. The length of time that the air has been in the tank.

Guidance for Wood Preservation Facilities Reporting to the National Pollutant Release Inventory
83
Air emissions associated with the transfer of chemicals into tanks are called “workinglosses”. Because of the time required to reach equilibrium between the liquid andvapour phases in a tank, the concentrations found in the vapour emissions are not thesame in all instances. The equation for calculating working losses from a tank is foundin several of the reference guidance documents, including the document entitledEstimating Releases and Waste Treatment Efficiencies for the Toxic Chemical ReleaseInventory Form (U.S. EPA 1987). The application of the equation to wood preservingfacilities is presented in Appendix 1 and also found in the printed output files from theNPRI calculation workbook.
Releases from unheated tanks also occur as a result of diurnal heating and coolingcycles that cause the air in the vapour space to alternately contract and expand. Air isdrawn into the tank during the cooling cycle and then expelled from the tank during theheating cycle. This loss is referred to as the “breathing loss”. It is generally acceptedthat there are no significant “breathing losses” from heated tanks. Breathing losses areindependent of the volume of liquid throughput and as explained in Appendix 1, theworking-loss estimates are conservative to account for breathing losses.
Releases to the Air from Open-Topped Tanks
A “spill” evaporation model is presented in a U.S. EPA guidance document (U.S. EPA1988). As stated in that document, this evaporation model can be used to estimate theevaporation rate from open-topped tanks. The derivation of specific forms of theequations in the evaporation model for application to wood preserving facilities ispresented in Appendix 2 and is also found in the printed output files from the NPRIcalculation workbook.
Releases to the Air from Piping, Valves, Flanges and AssociatedEquipment
Any minor releases from process piping and associated equipment due to gasketleakage or similar conditions will typically occur as drips of preservative solution.Although these releases are typically cleaned up on a frequent basis, some estimate ofpotential fugitive air emissions from this source should be included in the releasecalculations. A conservative estimate will be based on the assumption that this minorprocess drippage results in a liquid wetted surface area of 100 square feet on acontinuous basis. The estimating methodology employed for open tanks will be used toestimate releases from this area.
Releases to the Air from Treated Wood During Cool-Down and Storage
A study of the volatilization of PCP from treated wood is presented in the Proceedings,American Wood Preservers Association (AWPA 1981). The study provides amethodology that can be used to estimate PCP releases to the air from freshly treated

Guidance for Wood Preservation Facilities Reporting to the National Pollutant Release Inventory
84
wood at various temperatures. That method is used in conjunction with treating plantoperating data to estimate PCP releases into the air during the cool-down periodimmediately following the treatment cycle and during subsequent storage prior toshipment. Specific details regarding this method are described in Appendix 3 and arealso found in the printed output from the NPRI calculation workbook.
Releases to Air from the Management of Water ContainingPentachlorophenol
In Estimating Chemical Releases from Wood Preserving Operations (U.S. EPA 1988),the U.S. EPA states that significant evaporative losses of PCP are not expected tooccur as a result of routine wastewater evaporation. Based on this U.S. EPA guidance,it is assumed that no significant materials will be evaporated from water effluentcontaining PCP. This is supported by the fact that the vapour pressures of dioxins,furans and HCB are all less than the vapour pressure of PCP and thus aqueousconcentrations would be many orders of magnitude lower.
If wastewater containing the NPRI-listed substances is used in a cooling tower, releasesof these substances will occur as drift losses from the cooling tower. The calculation ofpotential releases from use in a cooling tower is found in Appendix 4. Significantreleases to the air are not expected from other routine wastewater-managementactivities.
Releases to Surface Water from Point-Source Discharges and StormWater Run-off
Releases to surface waters from point-source discharges occur when wastewater,storm water, or recovered groundwater containing NPRI-listed substances aredischarged to surface water. If facilities do not possess analytical data available fordioxins, furans or HCB, the concentrations of these substances can be estimated basedon the analytical results of other parameters.
The methodology used to calculate releases to surface water is shown in Appendix 5and is also found in the printed output files from the NPRI calculation workbook.
On-Site Releases to Land
On-site releases to land can occur as a result of a spill that is not removed from the siteor as a result of the on-site disposal of wastes containing an NPRI substance at thefacility. Releases to land are estimated based on the quantity of release and theconcentration of the NPRI-listed substance in the release. In addition, some releases toland may occur as a result of the infiltration of contaminated storm water. The stormwater calculations in the worksheet determine releases to surface water from a run-offcoefficient and any available analytical data. Releases to land are estimated based on

Guidance for Wood Preservation Facilities Reporting to the National Pollutant Release Inventory
85
the quantity of rainfall and the fraction that does not exit the site as run-off. Details ofthe storm water computations are found in Appendix 5.
Transfers of NPRI-Listed Substances
The amount of NPRI-listed substances transferred to off-site locations must bedetermined for reporting to the NPRI. The calculation for off-site transfers requires ameasurement of the amount of material transferred and the concentration of the NPRI-listed substance in the waste. These transfers may occur in solid or hazardous wastesshipped off site or in wastewater discharged to a municipal sewage-treatment plant(MSTP) for treatment. The methods used to calculate transfers to off-site locations areshown in Appendix 6 and are also provided in the printed output files from the NPRIcalculation workbook.
Automated Release and Transfer Calculations for the NPRI Reports
The CD-ROM provided by the NPRI contains an interactive spreadsheet in Microsoft®Excel97 format that will request data to be inputted before performing calculations forestimating releases and transfers of dioxins, furans and HCB from wood preservingfacilities for reporting to the NPRI. The instructions for completing the estimatingspreadsheets and entering the necessary data into the NPRI reporting software arefound in Appendix 8.

Guidance for Wood Preservation Facilities Reporting to the National Pollutant Release Inventory
86
References
American Wood Preservers Association (AWPA). 1981. The Relative Amount ofPentachlorophenol Volatilization from Treated Wood, by L. L. Ingram, Jr., G. D.McGinnis, and L. R. Gjovik. Bethesda, MD (now Granbury, TX).
Betts, W.D. 1990. Information about coal-tar creosote for wood preservation.International Tar Conference. Tar Industries Service, Mill Lane, Wingerworth,Chesterfield, UK.
Canada Gazette Part I (CG). Notice with Respect to Substances in the NationalPollutant Release Inventory for 2000, 2001, and 2002. Department of theEnvironment.
Chemical Engineers Handbook (CEH). 1973. Fifth Edition, under editorial direction ofRobert H. Perry and Cecil H. Chilton. New York, NY: McGraw-Hill BookCompany.
Carroll-Hatch. 1994. Value Assessment of the Canadian Pressure Treated WoodIndustry. Canadian Forest Service, SSC Contract 4Y002-0187/01-SQ.
Environment Canada (EC). 2003. Criteria Air Contaminants (CACs) Technical SourceGuide for Reporting to the National Pollutant Release Inventory (NPRI) – 2002.
Environment Canada (EC). 2001. Guide for Reporting to the National PollutantRelease Inventory – 2000.
Environment Canada (EC). 2002. Guide for Reporting to the National PollutantRelease Inventory – 2001.
Environment Canada (EC). 2003. Guide for Reporting to the National PollutantRelease Inventory – 2002.
Environment Canada. 2000b. Recommendations for the Design and Operation of WoodPreservation Facilities. Jointly prepared by Environment Canada and theCanadian Institute of Treated Wood (CITW).<www.ec.gc.ca/sop/english/wp.htm>
Environment Canada (EC). 2003. Supplementary Guide for Reporting Criteria AirContaminants (CACs) to the National Pollutant Release Inventory (NPRI) – 2002.
Environment Canada (EC). 2000a. Supplementary Guide for Reporting to the NationalPollutant Release Inventory – Alternate Thresholds – 2000.

Guidance for Wood Preservation Facilities Reporting to the National Pollutant Release Inventory
87
Environment Canada. 2000a. Strategic Options for the Management of CEPA-ToxicSubstances for the Wood Preservation Sector, Volume I, II, and III, Hull, QCwww.ec.gc.ca/sop/english/wp.htm
Environmental Protection Agency (EPA). 1987. Estimating Releases and WasteTreatment Efficiencies for the Toxic Chemical Release Inventory Form.EPA560/4-88-002. Washington, D.C.: Office of Pesticides and ToxicSubstances.
Environmental Protection Agency (EPA). 1988. Title III Section 313 Release ReportingGuidance: Estimating Chemical Releases from Wood Preserving Operations.EPA560/4-88-004p. Washington, D.C.: Office of Pesticides and ToxicSubstances.
Environmental Protection Agency (EPA). 1994. Air Emission Models for Water andWastewater. Appendix C. EPA-453/C-94-080A. Research Triangle Park, NC:Office of Air Quality Planning and Standards.
Environmental Protection Agency (EPA). 1995. Compilation of Air Pollutant EmissionFactors. Volume 1, Fifth Edition with supplements. Research Triangle Park, NC:Office of Air Quality Planning and Standards.
Environmental Protection Agency (EPA). 2000a. “Draft Exposure and Human HealthReassessment of 2,3,7,8-Tetrachlorodibenzo-p-dioxin (TCDD) and RelatedCompounds” in Draft Dioxin Reassessment. Washington, D.C.: National Centerfor Environmental Assessment.
Environmental Protection Agency (EPA). 2000b. Emergency Planning and CommunityRight-to-Know Act – Section 313: Guidance for Reporting Toxic ChemicalsWithin the Dioxin and Dioxin-like Compounds Category. Draft. EPA-745-B-00-00X. Washington, D.C.: Office of Information Analysis and Access.
Environmental Protection Agency (EPA). 2000c. Toxic Chemical Release InventoryReporting Forms and Instructions, Revised 1999 Version. EPA745-B-00-001.Washington, D.C.: Office of Information Analysis and Access.
Midwest Research Institute (MRI). 1999. Emission factor documentation for AP-42,Section 10.8 Wood Preserving. Midwest Research Institute Project No. 4945 forthe U.S. Environmental Protection Agency, Office of Air Quality Planning andStandards, Emission Factor and Inventory Group.
National Pollutant Inventory (NPI) – Australia. 1999. Emission estimation techniquemanual for timber and wood product manufacturing. Australia.
North Atlantic Treaty Organization/Committee on the Challenges of Modern Society(NATO/CCMS). 1998. “Pilot Study on Internal Information Exchange on Dioxins

Guidance for Wood Preservation Facilities Reporting to the National Pollutant Release Inventory
88
and Related Compounds”. International Toxicity Equivalency Factor (I-TEF).Method of Risk Assessment for Complex Mixtures of Dioxins and RelatedCompounds. Report No. 176. 26 pp.
The Marley Cooling Tower Company. 1983. Cooling Tower Fundamentals. Edited byJohn C. Hensley. Mission, KS.
Verschueren, Karel. 1983. Handbook of Environmental Data on Organic Chemicals.New York, NY: Van/Vostrand Reinhold Company.
World Health Organization (WHO). 1998. Executive Summary, Assessment of theHealth Risk of Dioxins: Re-evaluation of the Tolerable Daily Intake (TDI).Geneva, Switzerland: World Health Organization – European Centre forEnvironment and Health.

Guidance for Wood Preservation Facilities Reporting to the National Pollutant Release Inventory
89
Appendices
Appendix 1: Pentachlorophenol Wood Preservation Facilities – Calculation of Workingand Breathing Losses from Fixed Roof Tanks at Wood PreservingFacilities Using Pentachlorophenol
Appendix 2: Pentachlorophenol Wood Preservation Facilities – Calculation of theEmissions from Open-topped Tanks at Wood Preserving Facilities UsingPentachlorophenol
Appendix 3: Pentachlorophenol Wood Preservation Facilities – Estimation of Emissionsfrom Wood Treated with Pentachlorophenol
Appendix 4: Pentachlorophenol Wood Preservation Facilities – Calculation of AirReleases from the Management of Water Containing Pentachlorophenol
Appendix 5: Pentachlorophenol Wood Preservation Facilities – Wastewater,Groundwater and Storm Water Releases
Appendix 6: Pentachlorophenol Wood Preservation Facilities – Calculation of Transfersto Off-Site Locations
Appendix 7: Pentachlorophenol Wood Preservation Facilities – Estimated VapourPressures
Appendix 8: User’s Guide for the Calculation of Releases for Pentachlorophenol WoodPreservation Facilities Reporting to the NPRI
Exhibit 1: Data Input Sheets for Pentachlorophenol Wood PreservationFacilities
Exhibit 2: Calculation of Dioxin/Furan Combined TEQ Concentrationsfor Pentachlorophenol Wood Preservation Facilities
Guidance for Wood Preservation Facilities Reporting to the National Pollutant Release Inventory
90
APPENDIX 1Pentachlorophenol Wood Preservation Facilities
Calculation of Working and Breathing Losses from Fixed Roof Tanks at WoodPreserving Facilities Using Pentachlorophenol
There are two types of activities that cause emissions from tanks and vessels at woodpreserving facilities. The first activity is the receipt, storage, and mixing of oils andchemicals in tanks to be used for wood preserving. The second activity is the transferof oils, air, steam, and wood to and from the wood preserving tanks and vessels duringthe wood preserving process.
Emissions of NPRI substances from the tanks used to store or mix the solutions used inwood treating operations may be broken into working losses and breathing losses. Astanks are filled or refilled, a volume of air equal to the volume of the incoming liquid isexpelled to the atmosphere. This is referred to as a working loss. Breathing lossesoccur in an unheated tank as a result of diurnal temperature changes that cause thevolume of the air in the void space of the tank to change, thereby causing a release.Breathing losses are generally independent of the volume of the liquid throughput.
The release estimating methodology employed in this Guide accounts for breathinglosses by inflating the calculated working losses by a conservative factor of 1.5, whichwas derived from subsidiary calculations based on historic results of breathing versusworking losses from a variety of wood preserving operations. The releases (working andbreathing) of the NPRI substances due to the receipt, storage, and mixing of the oils arecalculated on the worksheet “Tanks” in the NPRI calculation workbook, using theequations developed below.
The movement of oils and wood, the use of compressed air and steam, and the use ofvacuum cycles during the wood treating process, relate additional air emissions fromthe wood preserving systems to the working losses caused by the displacement of airfrom the tanks and vessels. As wood preserving cylinders are filled, the oil displacesair, which is then vented back into the oil tank. If initial air pressure is used, theexpansion of the compressed air in the tank vapour space results in an emission. Whenthe preservative is pumped from the treating cylinder back to the tank, another emissionoccurs. All of these emissions occur from the treating tanks.
The use of steam in the treating cylinder will also result in an emission, because air isbled from the treating cylinder as steam is introduced. At the end of the steaming cycle,there will be another emission as the steam is blown into the atmosphere.
If a vacuum is pulled on the treating cylinder, the non-condensable air in the cylinderand vacuum receiver will be emitted from the vacuum device (i.e., pump or jet). When atreating cylinder is emptied and filled with wood, an emission may occur from the opencylinder. If the freshly treated wood is at an elevated temperature when it is removed
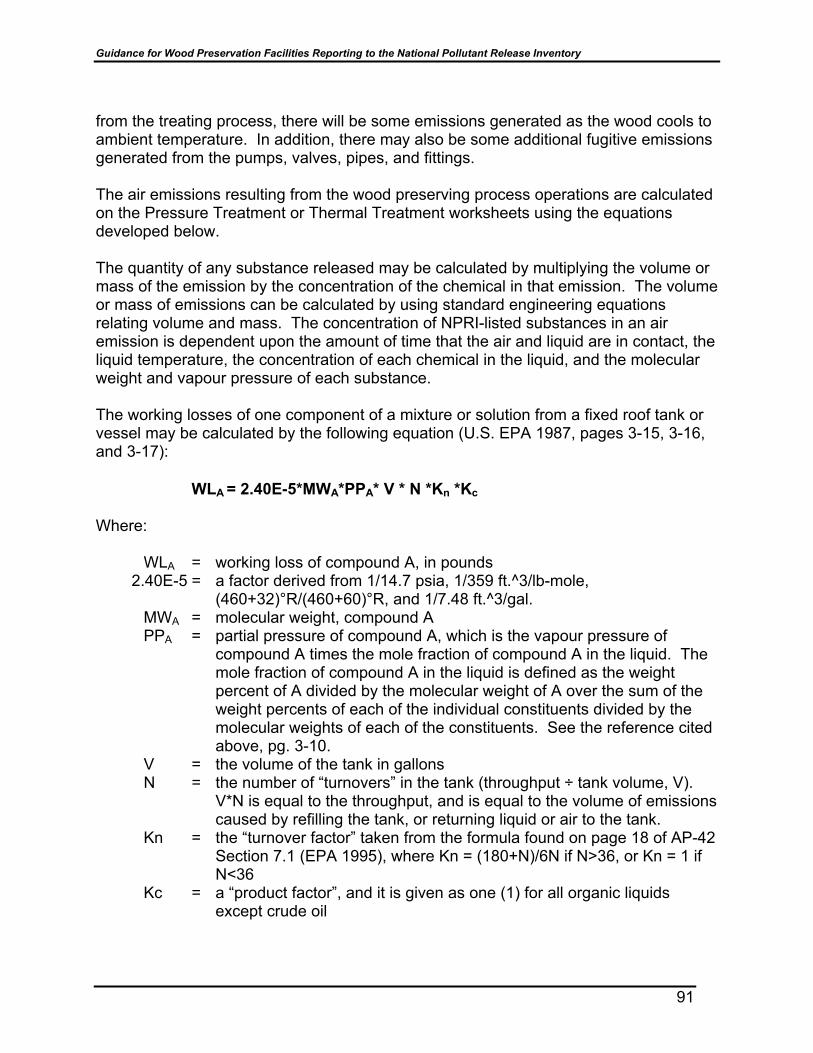
Guidance for Wood Preservation Facilities Reporting to the National Pollutant Release Inventory
91
from the treating process, there will be some emissions generated as the wood cools toambient temperature. In addition, there may also be some additional fugitive emissionsgenerated from the pumps, valves, pipes, and fittings.
The air emissions resulting from the wood preserving process operations are calculatedon the Pressure Treatment or Thermal Treatment worksheets using the equationsdeveloped below.
The quantity of any substance released may be calculated by multiplying the volume ormass of the emission by the concentration of the chemical in that emission. The volumeor mass of emissions can be calculated by using standard engineering equationsrelating volume and mass. The concentration of NPRI-listed substances in an airemission is dependent upon the amount of time that the air and liquid are in contact, theliquid temperature, the concentration of each chemical in the liquid, and the molecularweight and vapour pressure of each substance.
The working losses of one component of a mixture or solution from a fixed roof tank orvessel may be calculated by the following equation (U.S. EPA 1987, pages 3-15, 3-16,and 3-17):
WLA = 2.40E-5*MWA*PPA* V * N *Kn *Kc
Where:
WLA = working loss of compound A, in pounds 2.40E-5 = a factor derived from 1/14.7 psia, 1/359 ft.^3/lb-mole,
(460+32)°R/(460+60)°R, and 1/7.48 ft.^3/gal.MWA = molecular weight, compound APPA = partial pressure of compound A, which is the vapour pressure of
compound A times the mole fraction of compound A in the liquid. Themole fraction of compound A in the liquid is defined as the weightpercent of A divided by the molecular weight of A over the sum of theweight percents of each of the individual constituents divided by themolecular weights of each of the constituents. See the reference citedabove, pg. 3-10.
V = the volume of the tank in gallonsN = the number of “turnovers” in the tank (throughput ÷ tank volume, V).
V*N is equal to the throughput, and is equal to the volume of emissionscaused by refilling the tank, or returning liquid or air to the tank.
Kn = the “turnover factor” taken from the formula found on page 18 of AP-42Section 7.1 (EPA 1995), where Kn = (180+N)/6N if N>36, or Kn = 1 ifN<36
Kc = a “product factor”, and it is given as one (1) for all organic liquidsexcept crude oil

Guidance for Wood Preservation Facilities Reporting to the National Pollutant Release Inventory
92
The working-loss equation may be re-written to allow the calculation of emissions fromany compound at varying temperatures, with volume in cubic feet, as:
WLA = 0.09323*MWA* VPA* MFLA * VOL * Kn / (460 + T)
Where:
MLA = working loss of compound A, poundsMWA = molecular weight, compound AVPA = vapour pressure, compound A at temperature TMFLA = mole fraction of compound A in the liquidVOL = volume of air emissions, cubic feetKn = turnover factorT = temperature, °F
In this form, the emissions of any compound from any tank may be calculated if theinformation listed above is available or can be estimated.
Molecular Weight
The molecular weight of the NPRI-listed substances can be found in standard chemicalhandbooks and other readily available sources.
Vapour Pressure
The vapour pressure of most NPRI-listed substances is available at one temperature instandard chemical references. An exception to this is the dioxins/furans, for many ofwhich there are little or no actual vapour pressure measurements available in theliterature. Vulcan Chemicals, a manufacturer of PCP, provides the vapour pressure ofPCP at five temperatures. The vapour pressures of dioxins and furans are reported at25°C in an U.S. EPA document (EPA 2000a). The known PCP vapour pressures maybe fitted to Antoine’s Equation (CEH 1973) using linear regression, with the followingresults:
Pentachlorophenol: log (10) VP = 8.50555 - (7486.43/T),
Where VP is in psia, and T = °R = °F + 460, or VP, psia = 10^(8.50555-(7486.43/T))
Please note that there is no readily available data on the variations in vapour pressurewith temperature for most of the dioxins, furans or for hexachlorobenzene. For thesesubstances, it has been assumed that the relative rate of change of vapour pressureswith temperature will be similar to that of PCP. The molecular weights and the meltingand boiling points of these materials suggest this is a reasonable approach, given the

Guidance for Wood Preservation Facilities Reporting to the National Pollutant Release Inventory
93
lack of actual data. The resulting equations for estimating the vapour pressure of thedioxins, furans and HCB are given in the table following.
Vapour Pressure Equations
Hexachlorodibenzodioxin (6CDD): VP, psia = 10^(1.84038-(7486.43/T))Heptachlorodibenzodioxin (7CDD): VP, psia = 10^(0.97578-(7486.43/T))Octachlorodibenzodioxin (8CDD): VP, psia = 10^(0.14405-(7486.43/T))Hexachlorodibenzofuran (6CDF): VP, psia = 10^(2.59866-(7486.43/T))Heptachlorodibenzofuran (7CDF): VP, psia = 10^(2.07885-(7486.43/T))Octachlorodibenzofuran (8CDF): VP, psia = 10^(0.80162-(7486.43/T))Hexachlorobenzene (HCB): VP, psia = 10^(7.26462-(7486.43/T))
Graphs for these vapour pressure equations are found in Appendix 7.
Mole Fraction in the Liquid
As discussed above, the mole fraction in the liquid (MFL) of a chemical is required tocalculate the losses using the working loss equation. The method of calculating theMFL is described in Estimating Releases and Waste Treatment Efficiencies for theToxic Chemical Release Inventory Form (U.S. EPA 1988) and is illustrated below.
The mole fraction in the liquid of Compound A in a mixture containing compounds A, B,C, and D through N, is defined as:
MFL = mole fraction, liquid, AMWA = molecular weight, compound A
Wt.%A MWA
MFLA = Wt. %A + Wt. %B + Wt. %C + Wt. %D + … Wt. %N MWA MWB MWC MWD MWN
The MFLs for dioxins, furans and HCB are calculated by the spreadsheet using thesemethods and based on the concentration of PCP reported in the concentrate and thetreating solution, and the concentrations of dioxins/furans and HCB in PCP as shown inTable 4.9. An estimated molecular weight of 130 is used for the remaining petroleumoil. These values are used in the calculations of releases of dioxins, furans and HCB tothe air.
Volume of Air Emissions
Guidance for Wood Preservation Facilities Reporting to the National Pollutant Release Inventory
94
The volume of air released is calculated using data on the number of charges treated,the treating process used, and the amount of preservatives used. These volumes arecalculated and shown in the output sheets “Tanks”, “Pressure” and “Thermal”.Turnover Factor
Turnover factors are calculated based on the total liquid volume passed through thetanks divided by the volume of the tanks. These factors are shown on the output sheets“Tanks”, “Pressure” and “Thermal”.
Temperature
The temperature of the various air emissions are based on input temperature data andon assumptions explained in the output sheets “Pressure” and “Thermal”.
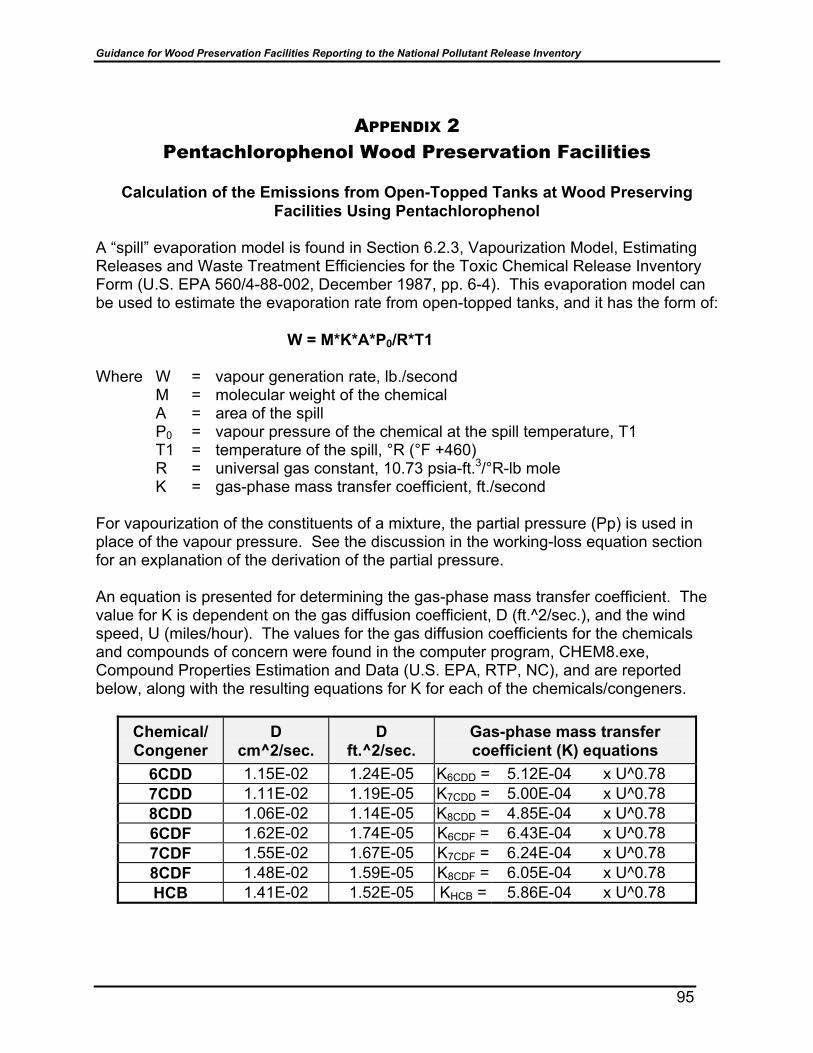
Guidance for Wood Preservation Facilities Reporting to the National Pollutant Release Inventory
95
APPENDIX 2Pentachlorophenol Wood Preservation Facilities
Calculation of the Emissions from Open-Topped Tanks at Wood PreservingFacilities Using Pentachlorophenol
A “spill” evaporation model is found in Section 6.2.3, Vapourization Model, EstimatingReleases and Waste Treatment Efficiencies for the Toxic Chemical Release InventoryForm (U.S. EPA 560/4-88-002, December 1987, pp. 6-4). This evaporation model canbe used to estimate the evaporation rate from open-topped tanks, and it has the form of:
W = M*K*A*P0/R*T1
Where W = vapour generation rate, lb./second M = molecular weight of the chemical
A = area of the spillP0 = vapour pressure of the chemical at the spill temperature, T1T1 = temperature of the spill, °R (°F +460)R = universal gas constant, 10.73 psia-ft.3/°R-lb moleK = gas-phase mass transfer coefficient, ft./second
For vapourization of the constituents of a mixture, the partial pressure (Pp) is used inplace of the vapour pressure. See the discussion in the working-loss equation sectionfor an explanation of the derivation of the partial pressure.
An equation is presented for determining the gas-phase mass transfer coefficient. Thevalue for K is dependent on the gas diffusion coefficient, D (ft.^2/sec.), and the windspeed, U (miles/hour). The values for the gas diffusion coefficients for the chemicalsand compounds of concern were found in the computer program, CHEM8.exe,Compound Properties Estimation and Data (U.S. EPA, RTP, NC), and are reportedbelow, along with the resulting equations for K for each of the chemicals/congeners.
Chemical/Congener
Dcm^2/sec.
Dft.^2/sec.
Gas-phase mass transfercoefficient (K) equations
6CDD 1.15E-02 1.24E-05 K6CDD = 5.12E-04 x U^0.787CDD 1.11E-02 1.19E-05 K7CDD = 5.00E-04 x U^0.788CDD 1.06E-02 1.14E-05 K8CDD = 4.85E-04 x U^0.786CDF 1.62E-02 1.74E-05 K6CDF = 6.43E-04 x U^0.787CDF 1.55E-02 1.67E-05 K7CDF = 6.24E-04 x U^0.788CDF 1.48E-02 1.59E-05 K8CDF = 6.05E-04 x U^0.78HCB 1.41E-02 1.52E-05 KHCB = 5.86E-04 x U^0.78
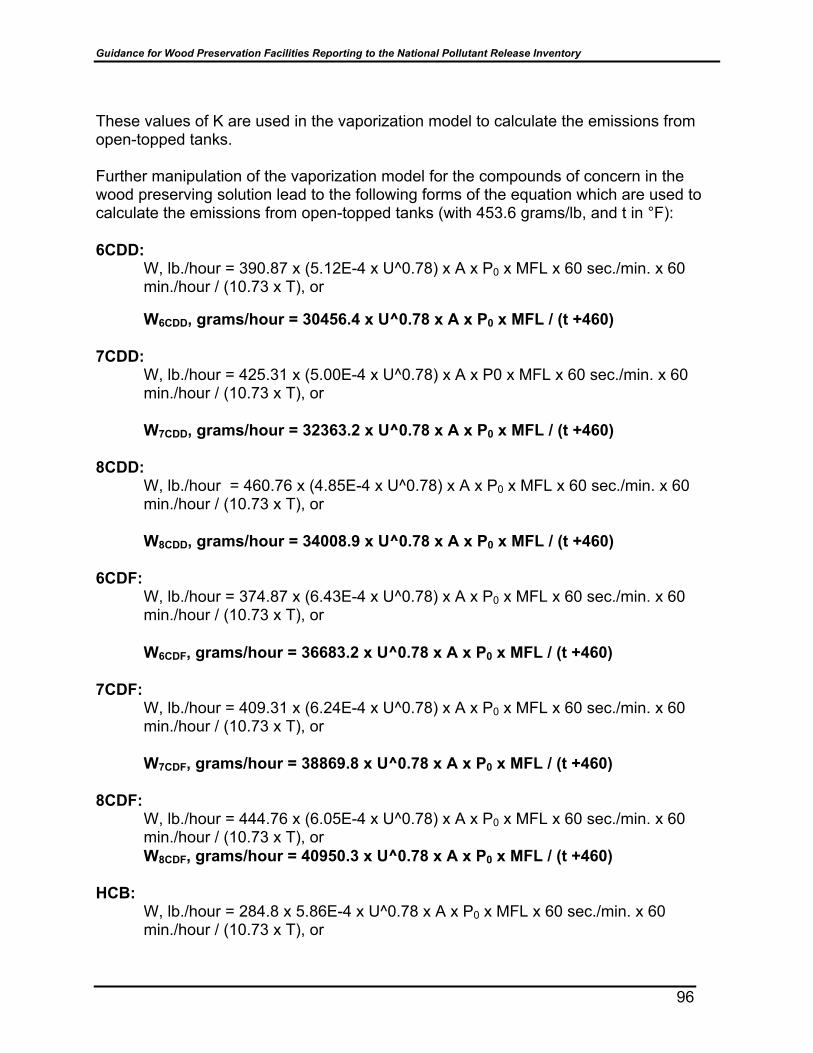
Guidance for Wood Preservation Facilities Reporting to the National Pollutant Release Inventory
96
These values of K are used in the vaporization model to calculate the emissions fromopen-topped tanks.
Further manipulation of the vaporization model for the compounds of concern in thewood preserving solution lead to the following forms of the equation which are used tocalculate the emissions from open-topped tanks (with 453.6 grams/lb, and t in °F):
6CDD:W, lb./hour = 390.87 x (5.12E-4 x U^0.78) x A x P0 x MFL x 60 sec./min. x 60min./hour / (10.73 x T), or
W6CDD, grams/hour = 30456.4 x U^0.78 x A x P0 x MFL / (t +460)
7CDD:W, lb./hour = 425.31 x (5.00E-4 x U^0.78) x A x P0 x MFL x 60 sec./min. x 60min./hour / (10.73 x T), or
W7CDD, grams/hour = 32363.2 x U^0.78 x A x P0 x MFL / (t +460)
8CDD:W, lb./hour = 460.76 x (4.85E-4 x U^0.78) x A x P0 x MFL x 60 sec./min. x 60min./hour / (10.73 x T), or
W8CDD, grams/hour = 34008.9 x U^0.78 x A x P0 x MFL / (t +460)
6CDF:W, lb./hour = 374.87 x (6.43E-4 x U^0.78) x A x P0 x MFL x 60 sec./min. x 60min./hour / (10.73 x T), or
W6CDF, grams/hour = 36683.2 x U^0.78 x A x P0 x MFL / (t +460)
7CDF:W, lb./hour = 409.31 x (6.24E-4 x U^0.78) x A x P0 x MFL x 60 sec./min. x 60min./hour / (10.73 x T), or
W7CDF, grams/hour = 38869.8 x U^0.78 x A x P0 x MFL / (t +460)
8CDF:W, lb./hour = 444.76 x (6.05E-4 x U^0.78) x A x P0 x MFL x 60 sec./min. x 60min./hour / (10.73 x T), orW8CDF, grams/hour = 40950.3 x U^0.78 x A x P0 x MFL / (t +460)
HCB:W, lb./hour = 284.8 x 5.86E-4 x U^0.78 x A x P0 x MFL x 60 sec./min. x 60min./hour / (10.73 x T), or
Guidance for Wood Preservation Facilities Reporting to the National Pollutant Release Inventory
97
WHCB, grams/hour = 25398.8 x U^0.78 x A x P0 x MFL / (t + 460)
Annual open-surface evaporation releases are estimated by multiplying the calculatedemission factors by the hours/year that the tanks were open with an oil layer in the tank.This same estimating methodology will be used to estimate potential releases fromminor process drippage. A continuously exposed surface area of 100 square feet ofpreservative solution at ambient temperature will be used for this estimate.

Guidance for Wood Preservation Facilities Reporting to the National Pollutant Release Inventory
98
APPENDIX 3Pentachlorophenol Wood Preservation Facilities
Estimation of Emissions from Wood Treated with Pentachlorophenol
Freshly treated wood will have fugitive air emissions of minor amounts of NPRI-listedsubstances. The spreadsheets calculate potential emissions during two separate timeintervals. For wood preserving processes conducted at elevated temperatures, thespreadsheets calculate emissions during the “cool-down” period during which thematerial returns to ambient temperature. The “Pressure” and “Thermal” spreadsheetsperform these calculations. Ambient temperature emissions that may occur duringextended storage prior to shipment are calculated on the “Tanks” spreadsheet. Themethodology for both emission computations is similar.
A study of the volatilization of pentachlorophenol (PCP) from treated wood is presentedin the Proceedings, American Wood Preservers Association (AWPA 1981). The studypresents an equation for the concentration of PCP in air versus temperature, from anairflow rate of one litre per minute over a board with 90 square inches of surface areathat had been treated with PCP dissolved in a heavy oil meeting AWPA P-9, Type AStandards. That equation is:
ln C = -9,277 x (1/T) + 34.35 (Equation 1) with T = temperature in °K
The concentration, C, found in Equation 1 above has units of µg/m3, and is based on atest flow of one litre per minute over a 90-square-inch surface area. This can berewritten to solve for an emission rate (ER), in units of lb./ft.2-hour, by multiplying theconcentration (µg/m3/board) x (1 g/1,000,000µg) x (1 m3/1,000 litres) x flow rate (l litreper minute) x (1 board/90 in.2) x (144 in2/1 ft.2) x (60 min./hour) x (1lb./454 g). Thisyields the following equation:
ER = 2.11E-10 x C (Equation 2) with ER = lb./ft.2-hourand C = µg/m3
Dioxin, furan and HCB releases during cool-down are estimated by applying the ratio ofvapour pressures and molecular weights of the D/Fs and HCB to PCP at eachtemperature to determine a relative C for use in Equation 1, as shown below:
CD/F = CPCP x (VPD/F @T/VPPCP @T) x (MWD/F/MWPCP) x (MFLD/F/MFLPCP)
CHCB = CPCP x (VPHCB @T/VPPCP @T) x (MWHCB/MWPCP) x (MFLHCB/MFLPCP)
The amount of dioxin, furan and HCB released are calculated by multiplying theEmission Rate times the total surface area of the wood times the length of time that thewood is at a temperature above ambient temperature. It is assumed that the wood willtake approximately six hours to cool from the temperature it is at the end of treatment to
Guidance for Wood Preservation Facilities Reporting to the National Pollutant Release Inventory
99
the average ambient temperature. The temperature during that period will be assumedto drop evenly with time from the initial temperature, such that the hourly drop is equalto the difference between the final temperature and the ambient temperature divided bysix. Average temperatures during each of the cool-down-period hours are calculatedbased upon this drop rate, and PCP concentrations are calculated based upon thoseaverage hourly temperatures using Equation 1. From this, an average concentrationover the six-hour cool-down period can be calculated, and an emission rate can bedetermined using Equation 2. For the purposes of these calculations, it is assumed thatthe initial temperature will equal the “charge changing” temperature, as determinedusing the assumptions listed in the Changing Charges section of the applicableworksheet.
In the absence of actual data concerning the surface area of the wood treated, anestimate will be made based on an average diameter of nine inches. This diameterapproximates the mid-point diameter of the average sized utility pole treated in Canada.This size estimate results in a surface area of 2.36 ft.2/lf., or a specific surface area of5.36 ft.2/ft.3. This value will be applied to the total cubic feet of wood treated during theyear.
The actual emission of dioxins, furans and HCB is then calculated by multiplying theemission rate times the square footage of surface area treated and the hours ofexposure, as shown below:
Release = ER x (5.36 x Annual Production, ft.3) x 6 hours
The long-term storage emissions are calculated based on the average treated woodinventory present during the year, and the computations are based on the emission rateat ambient temperature times the computed wood surface area times 8,760 hours peryear.

Guidance for Wood Preservation Facilities Reporting to the National Pollutant Release Inventory
100
APPENDIX 4Pentachlorophenol Wood Preservation Facilities
Calculation of Air Releases from the Management of Water ContainingPentachlorophenol
If contaminated water is used in cooling tower systems, consideration must be given toair releases of NPRI substances due to this activity. These releases are considered tobe fugitive air releases, and will be added to the other fugitive air releases calculated inother sections. For wastewater evaporation, Estimating Chemical Releases From WoodPreserving Operations (U.S. EPA 1988) states that 0% pentachlorophenol (PCP) isevaporated. Given this, and the extremely low vapour pressures of dioxins/furans andhexachlorobenzene (HCB), no significant evaporation of these materials is expected.
U.S. EPA guidance at Section 13.4, AP-42 (U.S. EPA 1995), on emissions from wetcooling towers, addresses the emissions from the “drift” losses from these towers. Driftlosses are estimated to be 0.02% of the cooling water flow. Using equations fromCooling Tower Fundamentals (Marley 1983), the releases to the air in the drift lossesmay be calculated. In the following equations, E is the total amount of water evaporated(gallons/year); R is the cooling range, in °F (assumed to be 15°); C is the concentrationfactor (assumed to be 5, based on a mid-range blow down rate); and Q is the totalamount of water circulated through the system (gallons per year).
From the Marley reference:
The evaporation rate, E, in gallons per year (gpy), may be estimated as:
E = Q x R x 0.0008.
Given the amount of water evaporated and the cooling range, the totalrecirculated volume, Q, in gallons per year, may be calculated as:
Q = E ÷ (0.0008 x R).
The drift loss, D, gpy, may be estimated as: D = Q x 0.0002.
With a concentration factor of five (5) and no evaporative chemical losses, theconcentration of pollutants in the cooling water will be five times the concentration in themake-up water.
Using available analytical data, or estimates if data is not available, estimates of theemissions of the NPRI-listed substances in the drift losses from the cooling tower canbe made. The estimated emissions of dioxins, furans and HCB from this source will bebased upon their respective concentrations in technical grade PCP.

Guidance for Wood Preservation Facilities Reporting to the National Pollutant Release Inventory
101
APPENDIX 5Pentachlorophenol Wood Preservation Facilities
Wastewater, Groundwater and Storm Water Releases
Releases to surface waters are calculated as storm water releases and point-sourcereleases on three worksheets in the program.
Storm Water Releases
For PCP wood treating facilities, the NPRI-listed substances typically found in technicalgrade pentachlorophenol (PCP) are dioxins, furans and hexachlorobenzene (HBC).Please note that if facilities possess actual monitoring data for these substances, thespreadsheets will calculate emissions accordingly as based on other parameters suchas PCP or Oil & Grease. In addition, dioxin, furan and HCB release estimates will bebased on that data using default assumptions.
Outfall Data and Run-off CoefficientsTo determine the amount of run-off generated by a facility, the size of the area drainedby each of the outfalls and a run-off coefficient must be determined. Run-off coefficientslisted below are the average of the ranges presented in a U.S. EPA guidance document(EPA 2000c). The weighted average run-off coefficient for a drainage area is calculatedas the sum of the percentage of the area employed for each type of use times the run-off coefficient for that type of use.
Type of Use Run-off Coefficient
% Heavy Industrial Use (RC = 0.75)
% Light Industrial Use (RC = 0.65)
% Paved and/or Roofed (RC = 0.90)
% Railroad Yard Areas (RC = 0.30)
% Unimproved Areas (RC = 0.20)
Estimation of Chemical Releases in Storm WaterAvailable analytical results for dioxin, furans and hexachlorobenzene should be used byfacilities, if available. If data on these substances are not available, release estimateswill be based on the results for PCP or Oil & Grease, if available. If PCP data isavailable, it will then be used to estimate dioxin, furan and HCB concentrations asbased on PCP product chemistry. Furthermore, if PCP is not monitored one-tenth ofthe value of the Oil & Grease result will be used as the PCP concentration, with an
Guidance for Wood Preservation Facilities Reporting to the National Pollutant Release Inventory
102
assumption that the other nine-tenths are associated with the petroleum solvent usedfor PCP. Typically, oils used for PCP solutions will have a maximum solubility for PCPof about 10%. The concentration of dioxins, furans and HCB will be estimated usingPCP product chemistry data as applied to the PCP concentration estimate. Releasesare then calculated by multiplying the concentrations in each discharge by the massflow of that discharge.
Please note that the quantity of rainfall that does not leave the facility as run-off mustinfiltrate into the ground. An estimate of on-site releases will then be based on theconcentrations calculated above, multiplied by the mass of rainfall that does not leavethe site as run-off.
Point-Source Releases
Releases of NPRI-listed substances in point-source discharges are calculated bymultiplying the concentration of the chemical by the mass flow of the discharge. Effortswill be made to estimate their concentrations if dioxins, furans and HCB analytical datais not available.
In addition, if analytical data is not available for process wastewater, conservatively highdefault values will be used for PCP concentrations, as based on industry experience.For raw wastewater (after oil/water gravity separation), the assigned Oil & Greasedefault value will be 2,500 ppm. The Oil & Grease is assumed to be 10% PCP and 90%P9 oil. If the water is chemically flocculated the Oil & Grease can be assumed to bereduced to 250 ppm. This 250-ppm is then assumed to contain 25 ppm PCP. If thewater has been biologically treated, the PCP content is assumed to be 5 ppm. If thewater is treated by filtration through activated carbon, the PCP content is estimated as1.25 ppm.
Dioxins, furans and HCB concentrations will be estimated from the PCP concentrationsusing product chemistry data. The process wastewater release will be calculated usingthese concentrations times the total mass of the annual wastewater discharge.
Guidance for Wood Preservation Facilities Reporting to the National Pollutant Release Inventory
103
APPENDIX 6Pentachlorophenol Wood Preservation Facilities
Calculation of Transfers to Off-Site Locations
Transfers of NPRI-listed substances to off-site locations are calculated by multiplyingthe weight of waste material transferred off site by the concentration of the NPRI-listedsubstance estimated or measured in the waste. These calculations are straightforwardand are shown in the worksheets covering these activities. If concentration data ondioxin, furan and hexachlorobenzene are not available, estimates will be determined asbased on the concentration of technical grade pentachlorophenol (PCP), using the PCPproduct chemistry data found in Table 4.8.

Guidance for Wood Preservation Facilities Reporting to the National Pollutant Release Inventory
104
APPENDIX 7Pentachlorophenol Wood Preservation Facilities
Estimated Vapour Pressures
Actual test data on the vapour pressure of dioxins, furans and hexachlorobenzene(HCB) at varying temperatures were not found in the available literature. As discussedin Appendix 1, the vapour pressure of the congeners of dioxins and furans at 25°C werefound in an U.S. EPA reference (U.S. EPA 2000a), and the vapour pressure of HCB at25°C was found in another published reference (CEH 1973). The physical properties ofdioxins, furans and HCB suggest that the slope of the vapour pressure versustemperature line for these compounds should be similar to that of PCP. Based on thisassumption, equations to estimate the change in vapour pressure with temperaturewere developed for dioxins, furans and HCB. Charts of estimated vapour pressures arefound in this appendix.

Guidance for Wood Preservation Facilities Reporting to the National Pollutant Release Inventory
105
Estimated Vapour Pressure Chart for Pentachlorophenol (PCP)
1.00E-08
1.00E-07
1.00E-06
1.00E-05
1.00E-04
1.00E-03
1.00E-02
0.0015 0.0016 0.0017 0.0018 0.0019 0.002 0.0021
1/Temperature, 1/°R
Vapo
r Pre
ssur
e, p
sia
VP, psia = 10^(8.50555 - (7486.43/T))
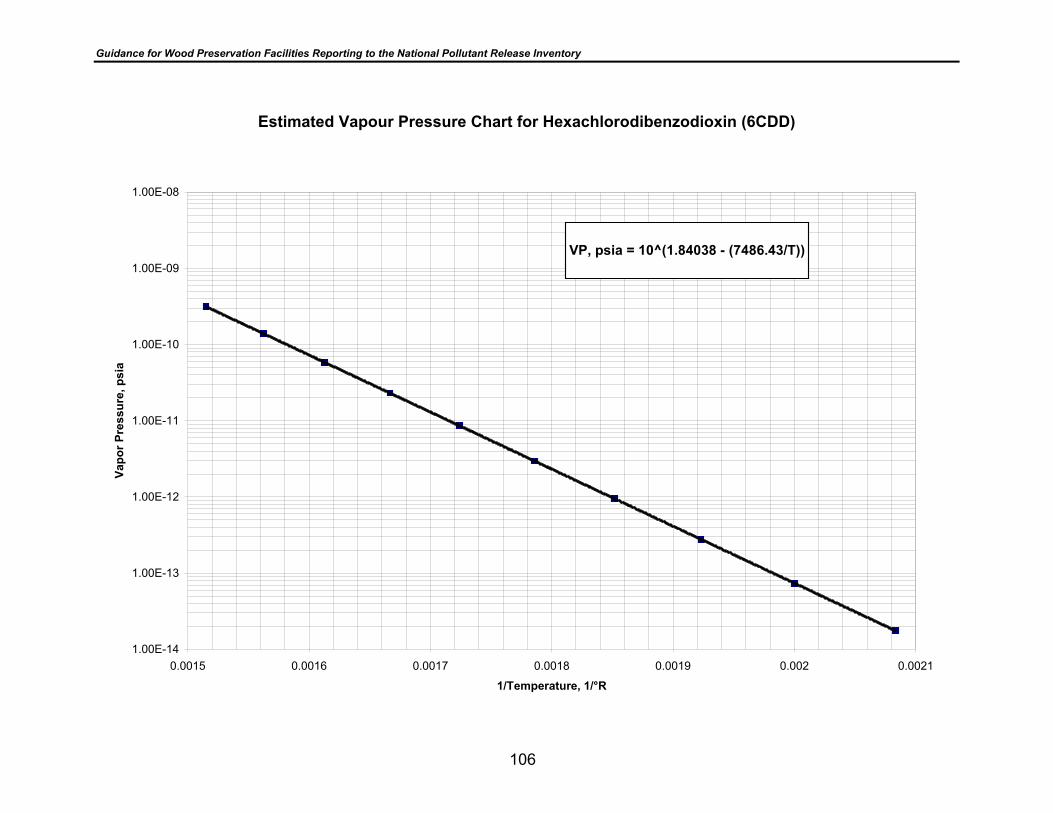
Guidance for Wood Preservation Facilities Reporting to the National Pollutant Release Inventory
106
Estimated Vapour Pressure Chart for Hexachlorodibenzodioxin (6CDD)
1.00E-14
1.00E-13
1.00E-12
1.00E-11
1.00E-10
1.00E-09
1.00E-08
0.0015 0.0016 0.0017 0.0018 0.0019 0.002 0.0021
1/Temperature, 1/°R
Vapo
r Pre
ssur
e, p
sia
VP, psia = 10^(1.84038 - (7486.43/T))
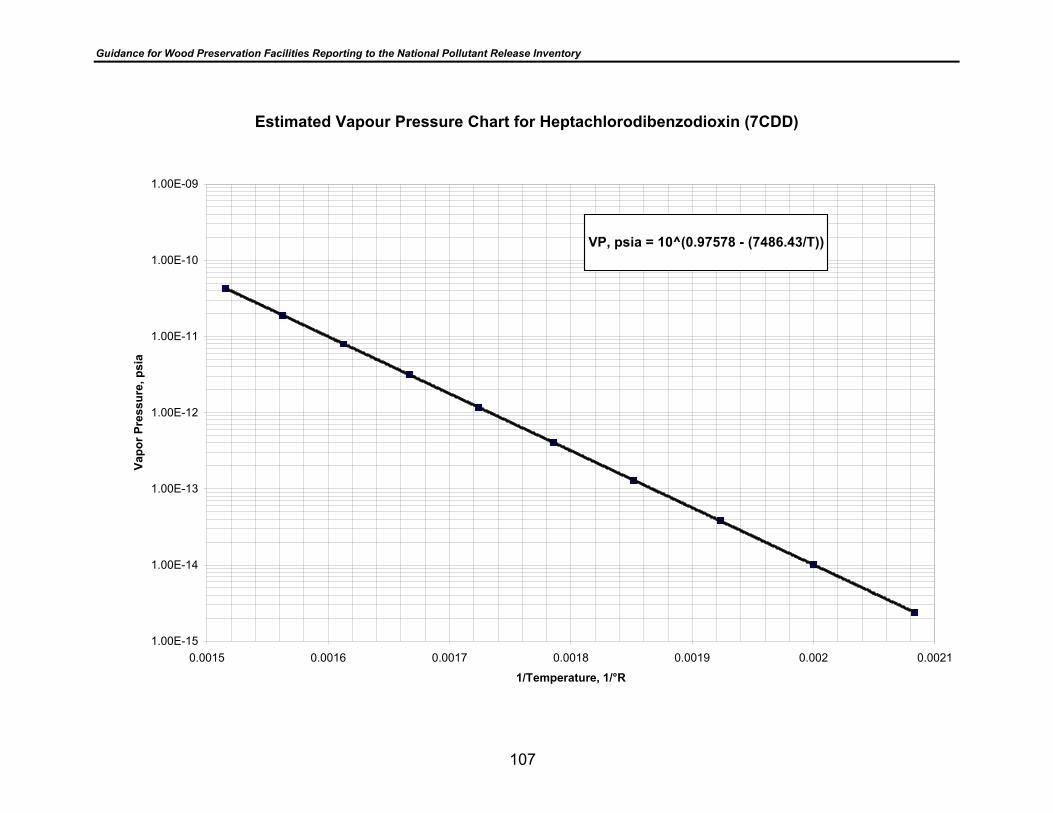
Guidance for Wood Preservation Facilities Reporting to the National Pollutant Release Inventory
107
Estimated Vapour Pressure Chart for Heptachlorodibenzodioxin (7CDD)
1.00E-15
1.00E-14
1.00E-13
1.00E-12
1.00E-11
1.00E-10
1.00E-09
0.0015 0.0016 0.0017 0.0018 0.0019 0.002 0.0021
1/Temperature, 1/°R
Vapo
r Pre
ssur
e, p
sia
VP, psia = 10^(0.97578 - (7486.43/T))

Guidance for Wood Preservation Facilities Reporting to the National Pollutant Release Inventory
108
Estimated Vapour Pressure Chart for Octachlorodibenzodioxin (8CDD)
1.00E-16
1.00E-15
1.00E-14
1.00E-13
1.00E-12
1.00E-11
1.00E-10
0.0015 0.0016 0.0017 0.0018 0.0019 0.002 0.0021
1/Temperature, 1/°R
Vapo
r Pre
ssur
e, p
sia
VP, psia = 10^(0.14405 - (7486.43/T))
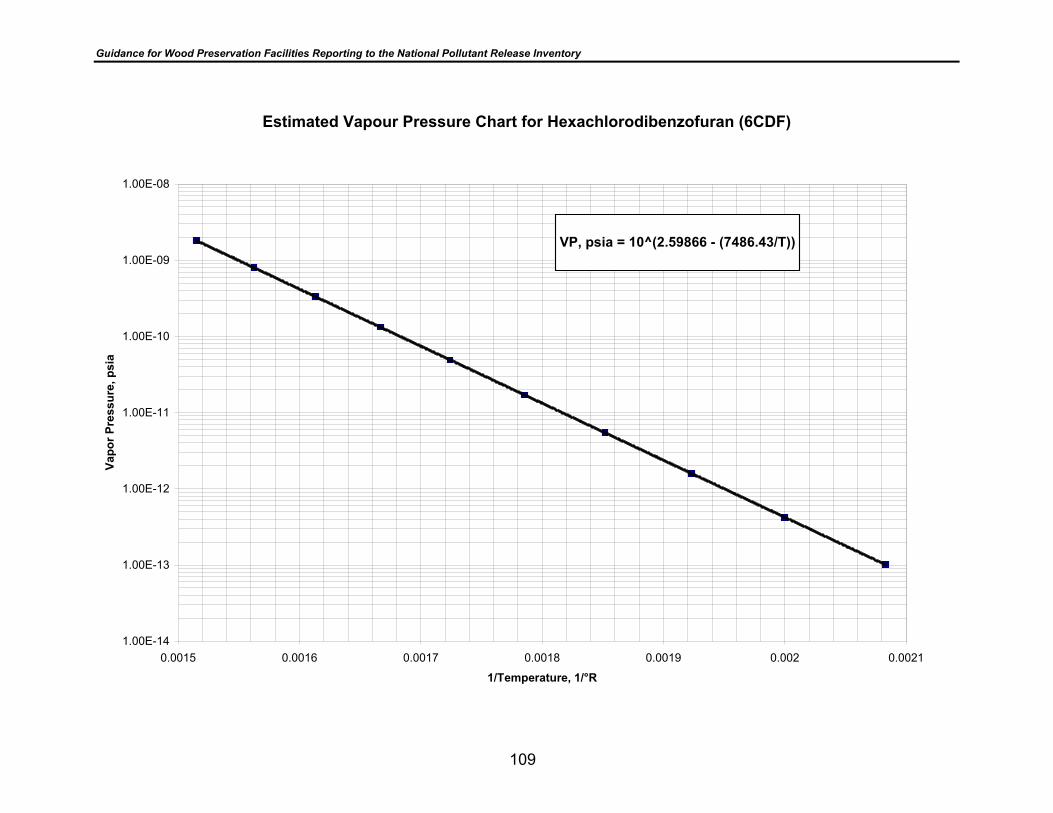
Guidance for Wood Preservation Facilities Reporting to the National Pollutant Release Inventory
109
Estimated Vapour Pressure Chart for Hexachlorodibenzofuran (6CDF)
1.00E-14
1.00E-13
1.00E-12
1.00E-11
1.00E-10
1.00E-09
1.00E-08
0.0015 0.0016 0.0017 0.0018 0.0019 0.002 0.0021
1/Temperature, 1/°R
Vapo
r Pre
ssur
e, p
sia
VP, psia = 10^(2.59866 - (7486.43/T))

Guidance for Wood Preservation Facilities Reporting to the National Pollutant Release Inventory
110
Estimated Vapour Pressure Chart for Heptachlorodibenzofuran (7CDF)
1.00E-14
1.00E-13
1.00E-12
1.00E-11
1.00E-10
1.00E-09
1.00E-08
0.0015 0.0016 0.0017 0.0018 0.0019 0.002 0.0021
1/Temperature, 1/°R
Vapo
r Pre
ssur
e, p
sia
VP, psia = 10^(2.07885 - (7486.43/T))

Guidance for Wood Preservation Facilities Reporting to the National Pollutant Release Inventory
111
Estimated Vapour Pressure Chart for Octachlorodibenzofuran (8CDF)
1.00E-16
1.00E-15
1.00E-14
1.00E-13
1.00E-12
1.00E-11
1.00E-10
0.0015 0.0016 0.0017 0.0018 0.0019 0.002 0.0021
1/Temperature, 1/°R
Vapo
r Pre
ssur
e, p
sia
VP, psia = 10^(0.80162 - (7486.43/T))

Guidance for Wood Preservation Facilities Reporting to the National Pollutant Release Inventory
112
Estimated Vapour Pressure Chart for Hexachlorobenzene (HCB)
1.00E-09
1.00E-08
1.00E-07
1.00E-06
1.00E-05
1.00E-04
1.00E-03
0.0015 0.0016 0.0017 0.0018 0.0019 0.002 0.0021
1/Temperature, 1/°R
Vapo
r Pre
ssur
e, p
sia
VP, psia = 10^(7.26462 - (7486.43/T))

Guidance for Wood Preservation Facilities Reporting to the National Pollutant Release Inventory
113
APPENDIX 8User’s Guide for the Calculation of Releases for
Pentachlorophenol Wood Preservation Facilities Reporting tothe NPRI
Table of Contents
Introduction
Information Needs for Data Entry
Getting Started
General Usage
Printing
Checking for Errors
Specific Use• Home• Tanks• Pressure• Thermal• Storm_Water• On_Site• Wastewater• Groundwater• Off_Site
Determination of Total Release/Transfers from the Facility Completion of the NPRI Report Exhibit 1: Data Input Sheets Exhibit 2: Dioxin/Furan Combined TEQ Concentrations

Guidance for Wood Preservation Facilities Reporting to the National Pollutant Release Inventory
114
Introduction The Microsoft® Excel 97 workbook file, PCPNPRI.xls, found on the disk provided withthis documentation was developed to assist pentachlorophenol (PCP) wood treaters incalculating the releases of dioxins/furans (D/F) and hexachlorobenzene (HCB) forreporting to the National Pollutant Release Inventory (NPRI). The workbook is set up to guide the user through the determination and calculationprocess by systematically requesting information concerning facility operations,preservative usage, annual production, waste generation, waste treatment, and wastedisposal. This User’s Guide was prepared to assist PCP wood treaters in completingthe necessary data entry and to answer questions that may arise during the use of thespreadsheets. In order for the PCPNPRI workbook to correctly complete the release computations, theuser must have the necessary data to complete the questions asked within each of thedata-entry worksheets that apply to the facility. Failure to provide adequate, accuratedata may result in incorrect determinations and calculations, and therefore, inaccuratereporting.
Information Needs for Data Entry Exhibit 1 of this appendix contains copies of all of the data entry sheets used in thespreadsheets. It would be useful to complete these sheets in pencil prior to actuallybeginning the use of the spreadsheets. To utilize the spreadsheets that make up thisworkbook, the user will need to gather the applicable items of the information shownbelow. The data entry sheets in Exhibit 1 will provide specifics regarding the format andunits of measure that should be used for this data. A. Facility Information
• Facility name• Reporting year
B. General
• Average ambient temperature and wind speed• Amount of dry PCP used• Amount of petroleum solvent used to dissolve the PCP• Numbers of dry PCP mix tanks• Total volume of the dry PCP mix tanks• Total liquid surface area of the dry PCP mix tanks• Average mix concentrations and temperatures, number of mixes, and duration per
mix• Total amount of liquid PCP concentrate used, and PCP content (%)• Total amount of petroleum solvent mixed with liquid concentrate

Guidance for Wood Preservation Facilities Reporting to the National Pollutant Release Inventory
115
• Number of liquid concentrate mix tanks• Total volume of the liquid concentrate mix tanks• Total liquid surface area of the liquid concentrate mix tanks• Average mix concentrations and temperatures, number of mixes, and duration per
mix• Total amount of purchased ready-to-use (RTU) treating solution used, and PCP
content (%)• Number of concentrate, P9-oil, and treating-solution storage tanks• Total volumes of each of the above categories of tanks• Average temperatures of each category of tank• Average treating-solution strength in storage and work tanks, in percent• Average volume of treated inventory stored on site, ft.3 or m3
C. Pressure Treaters
• Size of treating cylinders, diameter and length• Average wood content per charge, each cylinder• Total number of charges, steam conditioned, each cylinder• Total number of charges, Boulton dried, each cylinder• Total number of charges, kiln dried/air dried, each cylinder• Vacuum surge tank volume, each cylinder• Average length of initial steam• Average initial air pressure, psi, Boulton or steam conditioned• Average initial air pressure, psi, and kiln or air-dried• Total volume of all treating, or work, tanks used for the pressure-treatment
process• Average temperature of all treating, or work, tanks used for pressure treatment• Average treating solution strength used for pressure treatment, in percent• Number of charges given expansion baths• Average length of expansion baths• Average expansion bath temperature• Number of charges final steamed• Average length of final steam• Number of final vacuums applied• Average length of final vacuum• Previous year production (total ft.3 or m3 treated with PCP)
D. Thermal Treaters
• Treating tank dimensions (or liquid surface area and average volume used to filleach tank to treating depth)
• Total number of charges, each tank• Volume of wood treated per charge, each tank• Total number of hot baths, each tank, per year• Average hot bath temperature, each tank

Guidance for Wood Preservation Facilities Reporting to the National Pollutant Release Inventory
116
• Average hot bath time, per bath, each tank• Total number of cold baths, each tank, per year• Average cold bath temperature, each tank• Average cold bath time, per bath, each tank• Total number of expansion baths, each tank, per year• Average expansion bath temperature, each tank• Average expansion bath time, per bath, each tank• Total volume of all work tanks used for thermal treatment, in percent• Average temperature of all work tanks that are used for thermal treatment• Average treatment-solution strength used for thermal treatment• Previous year production (just the volume of wood actually treated, if only butt
treating), ft.3 or m3
E. Storm Water
Total annual rainfall at the site Total number of storm water outfalls (discharges) Size of area draining through each outfall Types of uses of each area Actual discharge volume, each area (if known) Analytical results, each outfall, if available Receiving water body name, each outfall (if applicable)
F. On-Site Waste Disposal
• Waste description• Amount of waste disposed of on site• Source of the release or treatment, storage, or disposal method• Analytical results or estimates of constituent concentrations in each waste
G. Wastewater
• Wastewater treatment system information (treatment steps)• Amount of wastewater generated• Amount discharged to stream• Amount discharged to municipal sewage-treatment plant (MSTP)• Amount evaporated in thermal tanks• Amount sent to cooling tower• Amount sent to reuse• Amount sent off site for disposal (not MSTP)• Receiving water body name, if applicable• MSTP information (name, address)• Analytical results
H. Groundwater
• Groundwater recovery system information, including treatment steps• Total amount of remedial action water managed

Guidance for Wood Preservation Facilities Reporting to the National Pollutant Release Inventory
117
• Amount discharged to MSTP• Amount discharged to surface waters• Amount shipped off site for treatment (not MSTP)• Receiving water body name, if applicable• Receiving MSTP name, if applicable• Analytical results
I. Wastes Shipped Off Site Containing NPRI-listed Substances (Hazardousand Non-Hazardous)• Waste descriptions, quantities, and treatment, storage or disposal methods• TSD facility information (name, address, code)• Analytical results or estimates of constituent concentrations in each waste
Getting Started Copy the file PCPNPRI.xls onto your computer’s hard drive. (Do not attempt to use theworkbook directly off of the disk provided. This will cause the program to be unable tosave the information entered by the user.) The file is in Microsoft® Excel 97 format, so itmay be preferable to copy the file into your default Microsoft® Excel directory. Open thefile using Microsoft® Excel (97 or higher). The file will open to the Home worksheet. Apop-up question may appear concerning the enabling of macros. If this appears onyour system, be sure to select “Enable Macros”.
General Usage In all of the worksheets in this workbook, the user is asked to provide answers toquestions at the beginning of the worksheets. Answers are to be entered in the yellowboxes that follow the questions. These blocks are the only blocks that allow data entry,in order to prevent the inadvertent deletion or over-typing of the calculation equationsand logical formulas that are used throughout the sheets. In most cases, answers will need to be typed in. In some cases, pull-down boxes willoffer the user a choice of acceptable answers. To the extent possible, data validationchecks have been used to prevent the entry of suspect or bad data. However, it is theresponsibility of the user to ensure that all data entered is correct. Generally, all yellow blocks that can be answered by the user, should be. However,there are many places where there are several options for data entry, depending uponthe data available. In those instances, the user will be directed to complete only certainboxes. The user of the calculation workbook will need to inform data gatherers of thespecific needs of each section, and will need to clarify the appropriate information wheninformation on more than one option is provided. In all cases, the user should follow theinstructions found in the specific worksheet sections that follow and in the worksheetsthemselves. If any uncertainties exist, the user should contact the program developer.

Guidance for Wood Preservation Facilities Reporting to the National Pollutant Release Inventory
118
In addition, in some cases multiple responses are allowed, such as where data isrequested on wastes shipped off site. In this case, the user is given the opportunity toreport on up to eight different wastes. In all cases such as this, the user should proceedin logical order from 1 to the maximum number needed (i.e., the user should enter thedata for the first waste in Waste 1 and the data for the second waste in Waste 2, andnot complete information on Waste 1 and then skip to Waste 4 if only two wastes weregenerated.) Also, in many worksheets, the user will be requested to provide the average results ofavailable analytical data for each item reported on. Generally, each worksheet will haveindividual instructions that specify what the user should and should not answer. Insome cases, the user will be asked to estimate chemical concentrations, while in othersthe user will be specifically instructed not to offer estimates. In no cases should theuser enter symbols or any other non-numeric values to indicate a result which has beenreported as being below the lower detection limit (LDL) for a chemical or compound. Ifthe user’s only available data reports that a subject chemical was not detected at thelower detection limit, then the user should follow the guidance specific to thatworksheet. The user may use the TAB key to move through the worksheets, since this key movesonly between data entry blocks. Hyperlinks (shown as blue underlined text, such as“Click here”) are used throughout the workbook to quickly move the user to other areasin the workbook. When directed to use a hyperlink, the user should simply use themouse to move the cursor over the link and click. At the end of the data-entry section in each worksheet, instructions are provided whichstate how the user should proceed. Normally, the user is directed to print eachworksheet as soon as the data has been entered, and then to click a hyperlink that willtake the user to the next worksheet.
Printing After completing the data entry process in each worksheet, the user will be informed asto how many printed pages to expect, and will be instructed to preview how the sheetswill print out on the printer in use. This is done by selecting “File”, “Print Preview” fromthe main Microsoft Excel menu, and then examining the preview of each page to beprinted. All of the worksheets have been formatted to print only specific areas, on a set numberof pages. Margins and page breaks have been designed so that differing printers’reformatting should not affect the printout. However, in the event that the number ofpages shown in Print Preview does not agree with the number stated in the instructions,the user may need to adjust the setup. In most cases, the only action that should beneeded would be to reduce the scale, from 100% downward to whatever scale allows

Guidance for Wood Preservation Facilities Reporting to the National Pollutant Release Inventory
119
the worksheet to print on the correct number of pages. This is done in Print Preview byselecting “Setup...” from the main Print Preview menu, and changing the scaling on thetab marked “Page”.
Checking for Errors Following the completion of data entry, the user is instructed to preview and then printeach worksheet. Any errors in data entry should cause answers of “ERROR”,“#VALUE!”, or “#DIV/0!”. If any of these statements are found in a printout of any sheetwithin this workbook, the user must re-check all data entered to ensure that: 1. All yellow blocks required to be filled in have been, and 2. All entries are correct. If the cause cannot be identified, the user should contact the program developer.
Specific Use The following sections will guide the user through each worksheet found within thePCPNPRI workbook. • Home: The workbook will open to the Home worksheet each time the program is opened. Besure to select “Enable Macros” if a pop-up question concerning this is shown. Onsubsequent re-entry into the program, the user will have to pick the worksheet that theywant to work on from the worksheet tabs at the bottom of the sheet. The Home worksheet is the central worksheet for all release and transfer calculationworksheets. Part 1 of this worksheet requests the facility name and reporting year.Part 2 contains questions which, when answered by clicking on the “Yes” or “No” foundat the end of the questions, take the user either to a calculation worksheet or to the nextquestion. • Tanks: If the user answers “Yes” to question 1 on the Home worksheet, the user is sent to thebeginning of the Tanks worksheet. The Tanks worksheet is used to calculate thefollowing dioxin/furan and hexachlorobenzene releases: 1) to the air from storage, work,or mix tanks, due to breathing, working, and evaporative losses resulting from thereceipt, storage, and mixing of oils and chemicals used in the process; and 2) to the airfrom treated inventory. The releases from the use of the treating solutions in the wood preserving processesare calculated on subsequent worksheets.

Guidance for Wood Preservation Facilities Reporting to the National Pollutant Release Inventory
120
The first information requested concerns the units of measure that will be used in thisand other worksheets. The user is asked four questions, each of which has selectableanswers in a pull-down box. The user is then asked to provide meteorological information, specifically the averageannual ambient temperature and wind speed, for the facility’s location. This informationmay be obtained from local or national weather service offices. This information isneeded for calculations on the Tanks worksheet, and is carried forward to each of theprocess-related worksheets that will be discussed later. This information must befurnished. The next section applies only to facilities that mix treating solutions using dry flake, orblock, PCP. If applicable, the user must enter the total amounts of PCP and solvent oilsused in this mixing during the reporting year. For facilities that conducted all of their dryPCP mixing operations in treating cylinders or treating tanks during the treating process,no further information is required. Facilities that utilized dedicated mixing tanks mustreport the total number, total volume, and total liquid surface area of all dry PCP mixtanks used at the facility. These facilities must also report the average mixconcentration, in percent PCP, the average mix temperature, the total number of mixesand the average time per mix, whether the tank was closed during mixing, and whetherthe tank was closed when mixing was not being done. The next section requests information about concentrate storage tanks. This sectionshould only be filled out if concentrate is stored at the facility unmixed. Informationalneeds include the total number, total volume, and average temperature for allconcentrate storage tanks at the facility. The next section applies to facilities that purchase pre-mixed, or ready-to-use, treatingsolutions. Here, the user is asked to provide the total amount used during the year andthe average PCP concentration in the solutions used. Next, if P9 oils are stored on site, unmixed, then the user is asked to provide informationon the total number, total volume, and average temperatures of the tanks used. The next section requests information on the total number of tanks used to storetreating solutions at the facility, including storage and treating, or work, tanks, their totalvolume, their average temperature, and the average treating solution strength, inpercent PCP. Finally, the user is asked to enter the average volume of treated inventory stored at thefacility during the year. Following the completion of the data-entry phase, the user is instructed to print theworksheet. After printing is complete, the user is returned to the Home page by clickingon the hyperlink at the bottom of the page.

Guidance for Wood Preservation Facilities Reporting to the National Pollutant Release Inventory
121
• Pressure: If the user answers “Yes” to question 2 on the Home worksheet, the user is sent to thebeginning of the Pressure worksheet. This worksheet is used to calculate emissionsfrom operations involving the pressure treatment of wood. The first information needed is related to the treating cylinders used for treatment ofwood with PCP. The user is provided with a block to enter facility-specific nomenclatureor identification information on each of the cylinders being reported on. This block is notrequired to be filled in, and is there solely for the user’s tracking purposes. The usermust provide sizes, average wood contents, and number of charges (reported as thenumber of charges steam conditioned, Boulton dried, or kiln/air dried) for each treatingcylinder (up to five total) for the year. Additionally, the user must provide the averagelength of initial steaming and the initial air pressures used, reported as an average ofthe times and pressures used at each cylinder, and the vacuum surge tank volumes, ifpresent. Please note that a charge should not be reported in more than one place. Forinstance, if kiln-dried wood is Boultonized, it should not be reported as both a kiln-driedcharge and a Boultonized charge. It should only be reported as a Boultonized charge.As a check, the total number of charges times the average charge volume should equalthe total production for the year. The next section requests information on the treating, or work, tanks used for pressure-treating operations. For those facilities that also have thermal-treating operations, onlythose tanks used in the pressure-treating process should be considered whencalculating the total tank volume, average tank temperature, and average treating-solution strength. If expansion baths are used, the user must fill out the next section. Information to beprovided includes the number of charges given expansion baths, when the bath occurs,the length of the bath, and the average temperature. In the next section, the user should provide information on any final steaming that isconducted in the treating cylinders, to include the average length, number of charges,and when the steam is applied. Once these blocks have been filled in, the user isasked to provide the number and average length of final vacuums. The last data requested on this sheet concerns previous-year pressure-treatmentproduction, which is used to arrive at a total facility production ratio on a laterworksheet. At a facility with both pressure- and thermal-treatment systems, this valueshould consider only the amount of wood that was pressure treated during the previousyear.

Guidance for Wood Preservation Facilities Reporting to the National Pollutant Release Inventory
122
Following the completion of the data entry phase, the user is instructed to print theworksheet. After printing is complete, the user is returned to the Home page by clickingon the hyperlink at the bottom of the page. • Thermal: If the user answers “Yes” to question 3 on the Home worksheet, the user is sent to thebeginning of the Thermal worksheet. This worksheet is used to calculate emissionsfrom operations involving thermal or dip treatment. The first section is used to provide information on the thermal-treating tanks. Thissection is set up to allow several different ways to report tank dimension information,since the average treating-liquid depth, and not the actual height of the tank, is needed.The worksheet is formatted to prevent the entry of data on more than one tank type percolumn. The user should either provide: the tank diameter and average depth of liquidused during treating for vertical cylindrical tanks; the length, width and average liquiddepth for rectangular tanks; or the surface area and average volume needed to fill thetank to the desired depth for any other shaped tank (to include horizontal semi-cylindrical tanks). Next, the user is asked to provide production information, to include the number ofcharges treated, the average volume of wood treated per charge, the total number ofhot, cold and expansion baths applied per treating tank for the year, averagetemperatures of each, and the length of time per bath for each. Please note that theuser is asked for the average volume of wood treated per charge, and not the totalvolume of wood processed. Volumetric determinations in the case of butt treatmentsshould therefore be based upon the size of the pole and the length treated. Additionally, if the facility uses a cooling bath in place of a cold bath, the user mustbreak the total treatment time into that which is considered the hot bath and that whichis the cool-down period, and enter those times in the boxes for hot and cold bath times.The cold-bath temperature in this case should be reported on the average temperatureof the oil during the cool-down period, or cooling bath. The next section requests information on the work tanks used for thermal-treatingoperations. These include the hot-oil and cold-oil tanks and any other storage tanksactually used for the transfer of oil during the treating process. For facilities that alsopressure treat, include only those tanks associated with the thermal-treating operationwhen calculating the total tank volume, average tank temperature, and average treating-solution strength. Finally, the user is asked to provide information on previous-year thermal-treatmentproduction, based on the amount of wood that was treated. This information is used toarrive at a total facility production ratio on a later worksheet. At a facility with both

Guidance for Wood Preservation Facilities Reporting to the National Pollutant Release Inventory
123
pressure- and thermal-treatment systems, this value should consider only the volume ofwood that was thermally treated during the previous year. Following the completion of the data-entry phase, the user is instructed to print theworksheet. After printing is complete, the user is returned to the Home page by clickingon the hyperlink at the bottom of the page. • Storm_Water:This worksheet will estimate releases of the NPRI-listed substances in storm water run-off to surface waters, MSTPs, and/or land.
The first step is to determine if a facility is required to calculate releases in storm water.Where a facility does not have any storm water data available, that facility is notrequired to determine or report on the releases from storm water because it has nobasis for estimating the chemical concentrations in storm water run-off.
The first question asks whether the facility has monitoring data available. If the useranswers “Yes,” he is instructed to proceed to the analytical data entry section. If “No,”the user is instructed to stop, to print the worksheet, and is then returned to the “Home”worksheet by clicking on the hyperlink that will appear with a “No” answer.
If analytical data is available, it should be entered in the next section by outfall number.Data is to be entered as parts-per-million (or mg/L). The data that should be entered isdependent upon what data is available. Normally, most PCP wood treating facilities arerequired to monitor for PCP. Conversely, most facilities are not specifically required tomonitor for HCB, dioxins or furans for the purposes of reporting to the NPRI. However,Oil & Grease data is commonly monitored and can be used here.
If a facility has data on HCB, it should be entered where available. If a facility hasanalytical data on dioxins/furans, the user is asked to report a combined ToxicEquivalent (TEQ) concentration for all of the dioxins/furans. The user may calculate thetotal TEQ concentration using the workbook, TEQCONC.xls, which is found on thediskette supplied with this Guide, or using the manual computation table found inExhibit 2. The instructions for completing this task are found in that exhibit.
If analytical data is not available for dioxins, furans or HCB, they may be estimatedbased on other data. The concentrations of dioxins, furans and HCB in technical gradePCP have been used in earlier worksheets within this workbook. An evaluation ofrelative solubilities suggests that product chemistry data can be used to estimatereleases of the micro-contaminants. Therefore, an estimate of D/F and HCBconcentrations in storm water run-off can be made based on PCP content. If the facilityonly has data on Oil & Grease, an estimate of the PCP content will be made based onthe assumption that PCP represents approximately 10% of the total Oil & Greasemeasurements.

Guidance for Wood Preservation Facilities Reporting to the National Pollutant Release Inventory
124
Therefore, if positive data is available, report it for each chemical or chemical category.Where positive data is not available, leave the block empty. Where the only availabledata for PCP, HCB or Oil & Grease reports the chemical below the laboratory’s lowerdetection limit (LDL), enter a value equal to zero. Since laboratory lower detection limitsmay be well above the expected D/F concentration, the user is instructed to leave theD/F TEQ concentration block blank if all available D/F results are reported to be belowthe LDL. In this case, the program will estimate D/F concentrations by congener basedupon the input PCP or Oil & Grease values. Do not enter answers of “Less than 10”,“<10”, “ND”, or use any other non-numeric characters.The next information requested is used to determine how much storm water run-offoccurred during the reporting year. First, the user must provide the total amount ofrainfall received during the year. This amount may come from facility rain-gaugerecords, or from local or national weather service stations.
In the Outfall Data and Run-off Coefficients section, the user is asked if the storm wateris released to surface waters, MSTPs, or released to land (i.e., no storm water leavesthe property in surface flows). Next, the user must enter the approximate drainage areafor each of the outfalls. If the actual discharge volume is known for any outfall, it isentered in the next blocks. At those outfalls for which no actual discharge-volume dataexists, the user must assign percentages to each land area description or type of usethat applies to that area. The user is given five of the land area descriptions/usagetypes that are found in the U.S. EPA TRI Instructions Manual from which to choose toassign percentages. These are heavy industrial, light industrial, paved and/or roofed,railroad yard, and unimproved areas. The total of percentages entered in each columnmust equal 100%. Facilities with monitoring data that have no actual storm waterdischarge off site should enter area and usage information for the entire site underOutfall 1.
The following example shows how a facility should determine the information needed forthe Outfall Data and Run-off Coefficients section.
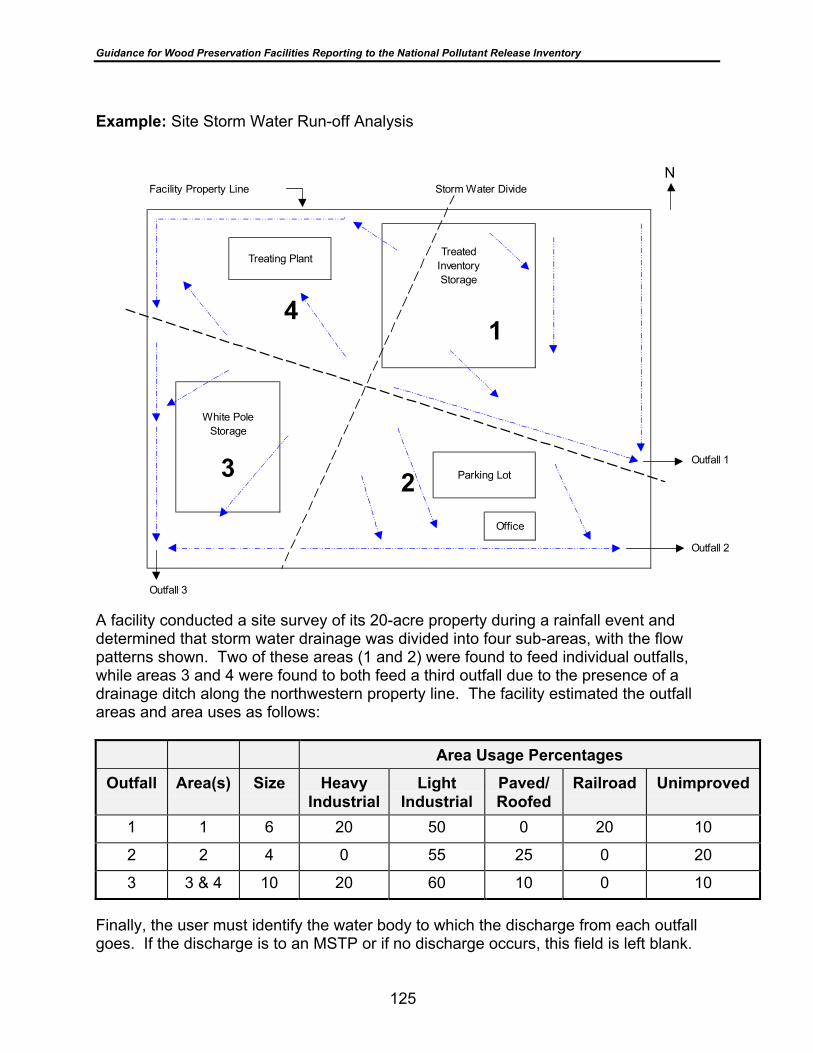
Guidance for Wood Preservation Facilities Reporting to the National Pollutant Release Inventory
125
Example: Site Storm Water Run-off Analysis
NFacility Property Line Storm Water Divide
4
Outfall 1
2
Outfall 2
Outfall 3
Treating Plant TreatedInventoryStorage
1
White PoleStorage
3
Office
Parking Lot
A facility conducted a site survey of its 20-acre property during a rainfall event anddetermined that storm water drainage was divided into four sub-areas, with the flowpatterns shown. Two of these areas (1 and 2) were found to feed individual outfalls,while areas 3 and 4 were found to both feed a third outfall due to the presence of adrainage ditch along the northwestern property line. The facility estimated the outfallareas and area uses as follows:
Area Usage Percentages
Outfall Area(s) Size HeavyIndustrial
LightIndustrial
Paved/Roofed
Railroad Unimproved
1 1 6 20 50 0 20 10
2 2 4 0 55 25 0 20
3 3 & 4 10 20 60 10 0 10
Finally, the user must identify the water body to which the discharge from each outfallgoes. If the discharge is to an MSTP or if no discharge occurs, this field is left blank.
Guidance for Wood Preservation Facilities Reporting to the National Pollutant Release Inventory
126
If storm water data is available from which to estimate D/F and HCB concentrations, theprogram will calculate the quantity contained in storm water that percolates directly intothe ground. This release will be reported as an on-site release to land. This release willbe added to any other on-site releases on the summary release sheets at the end of theworkbook.
Once all of the information above has been entered, the user is instructed to print theworksheet, and then is returned to the Home sheet by clicking on the hyperlink at thebottom of the page.
0 On_Site:
If the user answers “Yes” to question 5 on the Home worksheet, the user is taken to theOn_Site worksheet. This worksheet is used to calculate releases to land on site fromon-site disposal of wastes in landfills or land treatment areas, from spills or leaks, orfrom other sources.
The first section requires the user to enter waste descriptions and waste quantities, andto select the source of the release or the disposal method for each waste from a pull-down box which has the five choices available for reporting in Section B12.4 of theNPRI report. Next, the user is asked to provide contaminant concentrations in eachwaste, using analytical data where available, following the instructions on the worksheetwhere it is not.
As explained earlier, if positive analytical data on D/Fs is available, the user is asked toprovide only the combined TEQ concentration. This value may be calculated using theinstructions found in Exhibit 2.
Following the completion of the data-entry phase, the user is instructed to print theworksheet. After printing is complete, the user is returned to the Home page by clickingon the hyperlink at the bottom of the page.
• Wastewater: If the user answers “Yes” to question 6 on the Home worksheet, the user is taken to theWastewater worksheet. This worksheet is used to calculate the amounts of NPRI-listedsubstances treated on site and/or released or transferred from the site as a result ofwastewater management. The first question requests that the user describe any wastewater treatment bychoosing from a list of treatment methods and putting them in the order in which theyoccur. This is important because the spreadsheet has conservative defaultconcentrations used in later calculations that are dependent upon the answers to thisquestion.

Guidance for Wood Preservation Facilities Reporting to the National Pollutant Release Inventory
127
The next section requests information on the total amount of wastewater generated atthe facility and the volumetric units, and then requires the user to identify all of thedispositions of this amount, using the same units of volume. Please note that the totalof the individual wastewater volumes must equal the total volume generated. The user is then asked to supply the name of the water body which wastewater aredischarged to, if directly released, or the name of the MSTP that receives the waters, ifapplicable. Normally, this information is available within a facility’s discharge permits. The user is next asked to provide information on contaminant concentrations in thewastewater. Information is requested only on the discharge, or effluent, wastewater.Effluent wastewater are considered to be those that are discharged, evaporated inthermal-evaporation tanks, sent to a cooling tower, reused on site, or sent off site fortreatment at other than an MSTP. Effluent concentrations are used to calculate allreleases and/or transfers of NPRI-listed substances from the wastewater stream. If positive data for PCP, Oil & Grease, or HCB exists, it should be entered. If theavailable data for PCP, Oil & Grease, or HCB reports concentrations below the LDL, theuser should enter zero. As explained earlier, if positive analytical data on D/Fs isavailable, the user is asked to provide only the combined TEQ concentration. Thisvalue may be calculated using the instructions found in Exhibit 2. If all available dioxinsand furans data are reported as being ND at the LDL, the D/F TEQ concentration blockshould be left blank. If no data is available, the spreadsheets will use conservativedefault concentrations based upon experience at wood preserving facilities. For thisreason, the user is instructed NOT to offer estimates of any chemicals for the effluentstream. Following the completion of the data entry phase, the user is instructed to print theworksheet. After printing is complete, the user is returned to the Home page by clickingon the hyperlink at the bottom of the page. • Groundwater: If the user answers “Yes” to question 7 on the Home worksheet, the user is taken to theGroundwater worksheet, which is used to calculate the amounts of NPRI-listedsubstances released in wastes generated by corrective actions involving groundwaterrecovery. The first question requests that the user describe any groundwater treatment bychoosing from a list of treatment methods and putting them in the order in which theyoccur. The next section requests information on the total amount of groundwater recoveredand/or treated at the facility, and then requires the user to identify all of the dispositions

Guidance for Wood Preservation Facilities Reporting to the National Pollutant Release Inventory
128
of this amount. Please note that the total of the individual wastewater volumes mustequal the total volume entered above. The user is then asked to supply the name of the water body that the groundwater isdischarged to, if directly released, or information on any MSTP that receives the waters,if applicable. Normally, this information is available within a facility’s discharge permits. The user is next asked to provide information on contaminant concentrations in theeffluent groundwater. Effluent groundwater is considered to be those that aredischarged. Effluent concentrations are used to calculate all releases and/or transfersof NPRI chemical from the groundwater stream. The user shall enter positive analytical results for each chemical or chemical category,where available. As explained earlier, if positive analytical data on D/Fs is available, theuser is asked to provide only the combined TEQ concentration. This value may becalculated using the instructions found in Exhibit 2. If all analytical results for PCP,HCB, or Oil & Grease report the chemical as being below the laboratory’s lowerdetection limit, the user should enter zero. If all D/F results are reported below the LDL,leave the D/F concentration block blank. Following the completion of the data-entry phase, the user is instructed to print theworksheet. After printing is completed, the user is returned to the Home page byclicking on the hyperlink at the bottom of the page. • Off_Site: If the user answers “Yes” to question 8 on the Home worksheet, the user is taken to theOff_Site worksheet. This worksheet is used to calculate the amounts of NPRI-listedsubstances that were transferred off site in hazardous and non-hazardous wasteshipments. Up to eight shipments may be reported on this sheet. Multiple shipments ofthe same waste to the same facility for disposal using the same treatment or recyclingmethod may be combined and reported as one shipment. The first section requires the user to select a waste description from a pull-down boxlist; enter a quantity of the waste shipped, in pounds; and select a treatment, storage, ordisposal method. Next, the user is asked to provide information on the receiving facility,for comparison to the list of facilities that will be present in the NPRI software database. Finally, the user is asked to provide contaminant concentrations for each waste. Aswas done on earlier sheets, the user is asked to report analytical results whereavailable, entering zero for any chemical or compound, except dioxins/furans, which hasbeen reported as being below the laboratory’s lower detection limit. As explainedearlier, if positive analytical data on D/Fs is available, the user is asked to provide onlythe combined TEQ concentration. This value may be calculated using the instructionsfound in Exhibit 2. If data is not available on a specific contaminant, the correspondingblock should be left blank. Where no data is available on PCP, Oil & Grease, and either

Guidance for Wood Preservation Facilities Reporting to the National Pollutant Release Inventory
129
HCB or D/Fs, the user must estimate PCP concentration. For assistance in estimatingthe PCP content, contact your environmental consultant or your preservative supplier. Following the completion of the data-entry phase, the user is instructed to print theworksheet. After printing is complete, the user is returned to the Home page by clickingon the hyperlink at the bottom of the page.
Determination of Total Release/Transfers from the Facility After answering all eight questions on the Home worksheet and completing all of thecalculation worksheets that are applicable to the facility, the user is instructed to click ona link that goes to the Results worksheet. The Results worksheet combines all releaseand transfer amounts calculated on the individual calculation worksheets, and groupsthem into sections that correspond to those found within the NPRI report. At the beginning of each page, the chemical being dealt with is listed. Next, the releasereporting sections from the NPRI report are outlined, with the corresponding release ortransfer amount to be input in the report displayed to the right. The first release reporting section is labeled “B12.0, On-Site Releases to theEnvironment”. This section shows the total stack/point source, storage/handling, andfugitive air releases that are reportable in sections B12.1.a, B12.1.b, and B12.1.c. The next section deals with releases to surface waters, reportable in Section B12.3.a.Since the NPRI report requires the reporting of releases based upon which water bodythey go to, releases from each storm water outfall, process-wastewater discharge,and/or treated-groundwater discharge are shown. Please note that all releases to thesame receiving water body should be combined for reporting. The automated NPRI software has a list of water bodies from which you will be requiredto choose for each release. The first step should be to search for the water body nameprovided by the user and shown on the PCPNPRI Results worksheet in this list. If thename cannot be found, the user should consider which downstream water body theimmediate, non-listed, water body drains to. If this water body is listed, the user shouldreport all releases to the initial water body as releases to the subsequent, listed, waterbody. If the user cannot determine a subsequent receiving water body, or if thesubsequent water body is also not listed, the user may add the initial water body to thelist of water bodies. Refer to the Guide for Reporting to the National Pollutant ReleaseInventory – 2000 for instructions on how to do this. The next section shows the releases to land on site that were calculated in the earlierworksheets, On_Site and Storm_Water. Each release is totaled according to itsdisposal method or source of release.

Guidance for Wood Preservation Facilities Reporting to the National Pollutant Release Inventory
130
Finally, the total releases of each substance are shown for reporting in section B12.5.This value is calculated by adding the total air releases, the total releases to surfacewaters, and the total releases to land on site. Section B22 concerns transfers of the substances off site for disposal. This section hasnine subsections that deal with how the waste was disposed of. The total quantitytransferred off site for disposal is shown for reporting in section B22.2. The next section is set up similarly, but concerns transfers off site for recycling. Tendifferent recycling methods are reportable in section B25, and the amount transferred toeach method is shown on the Results sheet. The final section concerns the facility’s production ratio. Here, calculated reporting-yearproductions are compared to user-input previous year values to arrive at an overallproduction ratio. This ratio is reportable in section B40.0 of the NPRI report.
Completion of the NPRI Report Most of the release values needed for completing the release reporting sections of theNPRI report may be found on the Results worksheet, as explained earlier. However,the user will need to consult the Off_Site worksheet (and possibly the Storm_Water,Wastewater, and Groundwater worksheets if the facility discharges to more than oneMSTP) to be able to differentiate transfers to each off-site facility, as required in theapplicable section of the NPRI software. The NPRI reporting software will not accept data entries lower than 0.001 grams. Thespreadsheets perform release calculations to a higher precision than 0.001 grams, andthis precision is maintained in the printed output files. The results sheet sums all of thereleases to each reportable category and then rounds to the nearest 0.001gram. Forsome plants, the estimated releases in some categories will be reported as zerobecause the estimated total release was less than 0.0005 grams. Throughout the NPRI Report, the user will be asked to enter a “Basis of Estimate” code.For the calculations performed by this workbook, PCP wood treaters should only needto enter one of the two codes that are applicable. If the releases calculated by aworksheet are from actual analytical data for dioxins/furans and HCB, the user shouldchoose the code “M”, for monitoring or direct measurement. If a code “M” is used, a“Detail Code” of “AL” should also be entered. For estimates not based on actualdioxin/furan and HCB analytical data, the basis of the estimate code should be “O” forengineering estimate. No detail code is applicable in this instance.
Guidance for Wood Preservation Facilities Reporting to the National Pollutant Release Inventory
131
Exhibit 1
Data Input Sheets for Pentachlorophenol Wood PreservationFacilities

Guidance for Wood Preservation Facilities Reporting to the National Pollutant Release Inventory
132
Facility: Reporting Year:
UNITS OF MEASUREPlease enter the temperature scale which will be used on all worksheets:
Please enter the tank volume unit which will be used on all worksheets:
Please enter the liquid volume unit which will be used on all worksheets:
Please enter the surface area unit which will be used on all worksheets:
METEOROLOGICAL INFORMATION (Contact your local weather office for this information)
Annual Average Ambient Temperature:
Annual Average Wind Speed: mph or kph (circle one)
DRY PENTA SYSTEM DATA (Skip this part if dry penta is not used.)
Amount of dry penta dissolved in the reporting year:
Amount of solvent/P-9 oil used to dissolve the dry penta:
Dry Penta Mix Tanks
Total number of dry penta mix tanks used:
Total Volume of all dry penta mix tanks:
Total liquid surface area of all dry penta mix tanks:
Mix Information
Average mix concentration, % Are the mix tanks closed during mixing?
Average mixing temperature: Are the mix tanks closed after mixing?
Number of mixes during year: Average time per mix, hours:
LIQUID PENTA CONCENTRATE DATA (Skip this part if liquid concentrate is not used)
Amount of liquid PCP concentrate used in the reporting year:
Nominal PCP content in the concentrate: %
Amount of P-9 oil mixed with concentrate to make treating solution:
Liquid Concentrate Mix Tanks
Total number of liquid concentrate mix tanks used:
Total Volume of all liquid concentrate mix tanks:
Total liquid surface area of all liquid concentrate mix tanks:
Mix Information
Average mix concentration, % Are the mix tanks closed during mixing?
Average mixing temperature: Are the mix tanks closed after mixing?
Number of mixes during year: Average time per mix, hours:

Guidance for Wood Preservation Facilities Reporting to the National Pollutant Release Inventory
133
Facility: Reporting Year:
Concentrate Storage Tank Information
Total number of Concentrate storage tanks at the facility:
Total volume of all Concentrate storage tanks at the facility:
Average concentrate storage tank temperature:
READY-TO-USE PCP SOLUTION DATA (Skip this part if R-T-U is not used.)
Amount of Ready-to-Use PCP solution used during the year:
Average nominal PCP solution strength, % PCP:
P9 OIL STORAGE TANK DATA:
Total number of P9 oil storage tanks at the facility:
Total volume of P9 oil storage tanks at the facility:
Average P9 oil storage tank temperature:
TREATING SOLUTION TANK DATA:
Total number of treating solution storage/work tanks at the facility:
Total volume of treating solution storage/work tanks at the facility:
Average treating solution storage/work tank temperature:
Average treating solution strength, % PCP:
TREATED INVENTORY DATA:
Average amount of treated inventory stored during the year: ft^3 or m^3 (circle one)
PRESSURE TREATING INFORMATION
PCP Treating Cylinders #1 #2 #3 #4 #5
Vac surge tank volume units Avg. length of initial steam cycle, hours
Average initial air, KD/AD, psig Average initial air, Boulton/steam, psig
Number of charges steam conditioned
Number of charges Boulton dried
Number of charges kiln dried/air dried
Diameter, ft
Length, ft
Avg. Wood Content, ft^3/charge
Facility Nomenclature or ID number
Vacuum surge tank volume
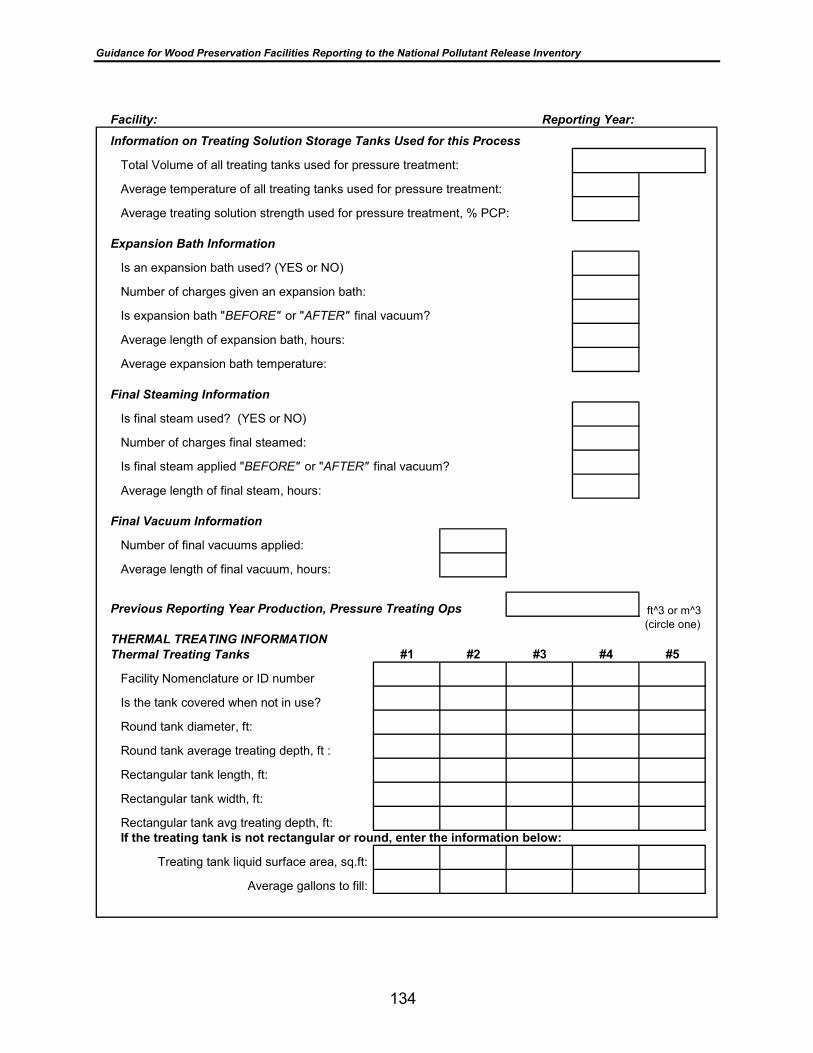
Guidance for Wood Preservation Facilities Reporting to the National Pollutant Release Inventory
134
Facility: Reporting Year:
Information on Treating Solution Storage Tanks Used for this Process
Total Volume of all treating tanks used for pressure treatment:
Average temperature of all treating tanks used for pressure treatment:
Average treating solution strength used for pressure treatment, % PCP:
Expansion Bath Information
Is an expansion bath used? (YES or NO)
Number of charges given an expansion bath:
Is expansion bath "BEFORE" or "AFTER" final vacuum?
Average length of expansion bath, hours:
Average expansion bath temperature:
Final Steaming Information
Is final steam used? (YES or NO)
Number of charges final steamed:
Is final steam applied "BEFORE" or "AFTER" final vacuum?
Average length of final steam, hours:
Final Vacuum Information
Number of final vacuums applied:
Average length of final vacuum, hours:
Previous Reporting Year Production, Pressure Treating Ops
THERMAL TREATING INFORMATIONThermal Treating Tanks #1 #2 #3 #4 #5
Is the tank covered when not in use?
Round tank diameter, ft:
Round tank average treating depth, ft :
Rectangular tank length, ft:
Rectangular tank width, ft:
Rectangular tank avg treating depth, ft:
Treating tank liquid surface area, sq.ft:
Average gallons to fill:
Facility Nomenclature or ID number
If the treating tank is not rectangular or round, enter the information below:
ft^3 or m^3(circle one)
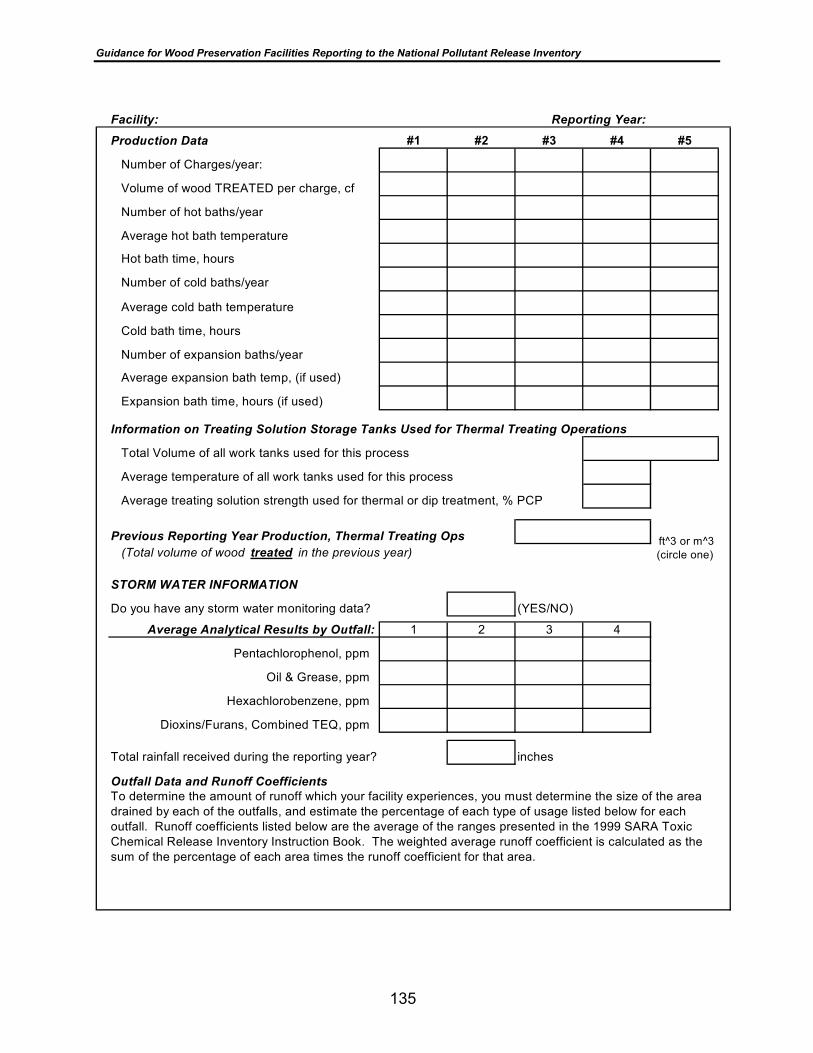
Guidance for Wood Preservation Facilities Reporting to the National Pollutant Release Inventory
135
Facility: Reporting Year:
Production Data #1 #2 #3 #4 #5
Number of Charges/year:
Number of hot baths/year
Average hot bath temperature
Hot bath time, hours
Number of cold baths/year
Average cold bath temperature
Cold bath time, hours
Number of expansion baths/year
Average expansion bath temp, (if used)
Expansion bath time, hours (if used)
Information on Treating Solution Storage Tanks Used for Thermal Treating Operations
Total Volume of all work tanks used for this process
Average temperature of all work tanks used for this process
Average treating solution strength used for thermal or dip treatment, % PCP
Previous Reporting Year Production, Thermal Treating Ops(Total volume of wood treated in the previous year)
STORM WATER INFORMATION
Do you have any storm water monitoring data? (YES/NO)
Average Analytical Results by Outfall: 1 2 3 4
Pentachlorophenol, ppm
Oil & Grease, ppm
Hexachlorobenzene, ppm
Dioxins/Furans, Combined TEQ, ppm
Total rainfall received during the reporting year? inches
Volume of wood TREATED per charge, cf
Outfall Data and Runoff CoefficientsTo determine the amount of runoff which your facility experiences, you must determine the size of the area drained by each of the outfalls, and estimate the percentage of each type of usage listed below for each outfall. Runoff coefficients listed below are the average of the ranges presented in the 1999 SARA Toxic Chemical Release Inventory Instruction Book. The weighted average runoff coefficient is calculated as the sum of the percentage of each area times the runoff coefficient for that area.
ft^3 or m^3(circle one)

Guidance for Wood Preservation Facilities Reporting to the National Pollutant Release Inventory
136
Facility: Reporting Year:
Outfall Number: 1 2 3 4
Releases to: Surface Water, MSTP, No offsite
Outfall Drainage Area, acres
Actual Discharge Volume , Imp gals, if known
% Heavy Industrial Use (RC=0.75)
% Light Industrial Use (RC=0.65)
% Paved and/or Roofed (RC=0.90)
% Railroad Yard Areas (RC=0.30)
% Unimproved Areas (RC=0.20)
Receiving Stream or Water Body Name, if applicableOutfall 1: Outfall 2:
Outfall 3: Outfall 4:
RELEASES DUE TO ON-SITE WASTE DISPOSAL, LEAKS OR SPILLSWaste Description and Quantity
WasteNumber Waste Description
1
2
3
4
Contaminant Concentrations in the Wastes
WasteNumber
1
2
3
4
PCP Concentration in waste, ppm
Oil & Grease concentration, ppm
Hexachlorobenzene concentration, ppm
Combined D/Fs TEQ concentration,
ppm
Quantity,lbs
TSD Method or Source of Release (Landfill, land treatment, leaks,
spills, other)
Enter the contaminant concentrations in each waste below. Where data is available, enter the chemical-specific results only. If you have more than one set of data for a chemical, enter the average concentration. If a result is reported as being below the lower detection limit, enter zero (except for Dioxins/Furans). If analytical data is unavailable, estimate only the PCP concentration in the wastes. Please convert all concentrations to parts-per-million (ppm, mg/L or mg/kg). If converting percents, multiply the percent by 10,000. For example, a waste with 6% PCP has a concentration equal to 6*10000, or 60,000 ppm.

Guidance for Wood Preservation Facilities Reporting to the National Pollutant Release Inventory
137
Facility: Reporting Year:
WASTEWATER INFORMATIONWastewater Treatment System
A. Oil/Water Separation B. Filtration C. FlocculationD. Biological Treatment E. Activated Carbon
Process Wastewater Generation
Amount discharged to stream:
Amount discharged to MSTP:
Amount evaporated in thermal tanks:
Amount sent to Cooling Tower:
Amount sent to Reuse:
Amount sent off-site for disposal (not MSTP):
If discharge is to stream or other water body, enter name here:
If discharge is to MSTP, enter name here:
Contaminant Concentrations in Process Wastewater
(YES or NO)
Pentachlorophenol:
Oil & Grease:
Hexachlorobenzene:
Combined D/F TEQ:
GROUNDWATER INFORMATIONGroundwater Treatment System
A. Oil/Water Separation B. Filtration C. FlocculationD. Biological Treatment E. Activated Carbon
Describe your groundwater treatment system by sequentially listing all treatment steps, choosing from the list of choices below.
Concentration, ppm
Do you have monitoring data on the effluent wastewaters?
Amount of process wastewater generated during the reporting year:
Describe your wastewater treatment system by sequentially listing all treatment steps, choosing from the list of choices below.
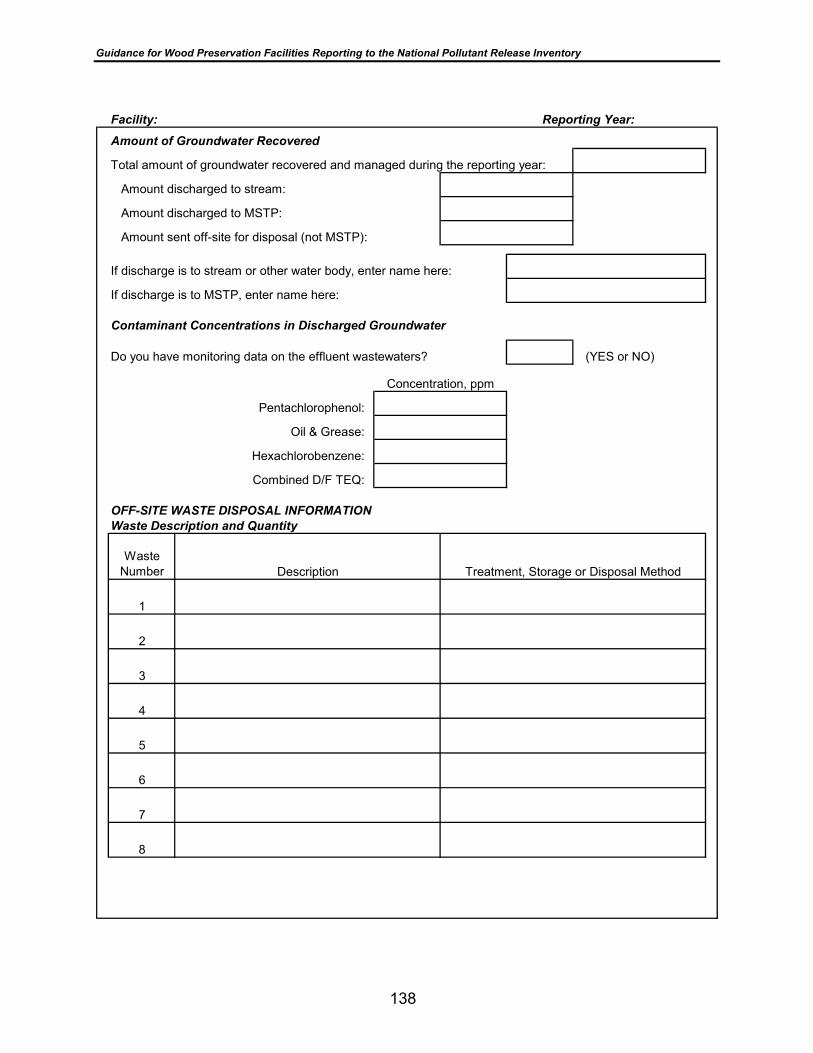
Guidance for Wood Preservation Facilities Reporting to the National Pollutant Release Inventory
138
Facility: Reporting Year:
Amount of Groundwater Recovered
Amount discharged to stream:
Amount discharged to MSTP:
Amount sent off-site for disposal (not MSTP):
If discharge is to stream or other water body, enter name here:
If discharge is to MSTP, enter name here:
Contaminant Concentrations in Discharged Groundwater
(YES or NO)
Pentachlorophenol:
Oil & Grease:
Hexachlorobenzene:
Combined D/F TEQ:
OFF-SITE WASTE DISPOSAL INFORMATIONWaste Description and Quantity
WasteNumber
1
2
3
4
5
6
7
8
Description Treatment, Storage or Disposal Method
Do you have monitoring data on the effluent wastewaters?
Concentration, ppm
Total amount of groundwater recovered and managed during the reporting year:

Guidance for Wood Preservation Facilities Reporting to the National Pollutant Release Inventory
139
Facility: Reporting Year:
Off-Site Facility Information
Prov Postal Code
Contaminant Concentrations in the WastesWaste
Number
1
2
3
4
5
6
7
8
CityStreet AddressCountryCode (if known)
PCP Concentration in waste, ppm
Oil & Grease concentration, ppm
Hexachlorobenzene concentration, ppm
Combined D/F TEQconcentration, ppm
8
7
6
5
4
3
2
1
WasteNumber
Off-Site Facility Name

Guidance for Wood Preservation Facilities Reporting to the National Pollutant Release Inventory
140
Exhibit 2
Calculation of Dioxin/Furan Combined TEQ Concentrationsfor Pentachlorophenol Wood Preservation Facilities
• Using the TEQCONC Workbook: The PCPNPRI workbook allows the entry of dioxin/furan analytical results as acombined total TEQ concentration only. In order to assist the user with the conversionof reported laboratory results to this total dioxin/furan TEQ concentration, a secondworkbook, titled TEQCONC, may be found on the diskette that accompanies this Guide. This workbook is composed of five worksheets, named to correspond to the worksheetsfound in the PCPNPRI workbook. The user should select the tab corresponding to thesheet for which positive data is available (i.e., if positive analytical data is available forD/F concentrations in wastewater, the user should select and complete the sheet foundat the Wastewater tab). The Storm_Water, On_Site and Off_Site worksheets of the PCPNPRI workbook allowthe user to report on more than one waste or discharge, thereby requiring more thanone D/F TEQ concentration. The worksheets in this workbook are set up to calculatethe TEQ concentration of D/Fs only one waste at a time. Therefore, you may either enter all of the data required for one waste at a time, printingthe worksheet after completion, then deleting that data and entering the data for thenext waste, continuing this until you have calculated the TEQ concentrations andprinted worksheets for all wastes which need reporting on, or you may choose to makecopies of the applicable worksheet for each of the wastes by following these steps: Step 1: Move your cursor down to the tab for the worksheet being used. Step 2: Right click on the tab to bring up the tab edit menu. Step 3: Choose “Move or Copy...” Step 4: On the Move or Copy screen, from the top: ensure that the
workbook TEQCONC is selected; click on the name of theworksheet which follows the worksheet you are copying to insertthe copied sheet in front of the next worksheet; and select “Make aCopy”.
Step 5: Click OK.

Guidance for Wood Preservation Facilities Reporting to the National Pollutant Release Inventory
141
Following the completion of the steps listed above, you will see a new tab titled with theworksheet's name and a copy number, such as “TEQ_On-Site (2)”. You may use thisnew sheet to report on a second waste. Repeat this as many times as necessary tomake separate sheets in the workbook for each waste that you need to calculate TEQconcentrations for. Note: Each subsequent copy should rename the new tab inincrements of 1, i.e., TEQ_On-Site (3), TEQ_On-Site (4), etc. Upon the completion of each sheet used, the user should print the sheet for the facility’srecords. • Manual Computation
If the user chooses not to use the workbook for these calculations, a worksheet formanual computation of TEQ concentrations is included in this exhibit. (It is also foundas a worksheet titled “TEQ_Manual_Calculation” in the TEQCONC workbook.) Theuser should make as many copies of this sheet as necessary to cover all wastes ordischarges for which the user has positive dioxin/furan analytical data.
When using the manual computation worksheet, the user should first enter thePCPNPRI worksheet name and the waste or discharge number of the waste/dischargefor which the TEQ concentration is being calculated. Then, the user should follow thesteps outlined in the instructions on the worksheet.
An example of a completed manual computation worksheet may be found at the end ofthis exhibit.
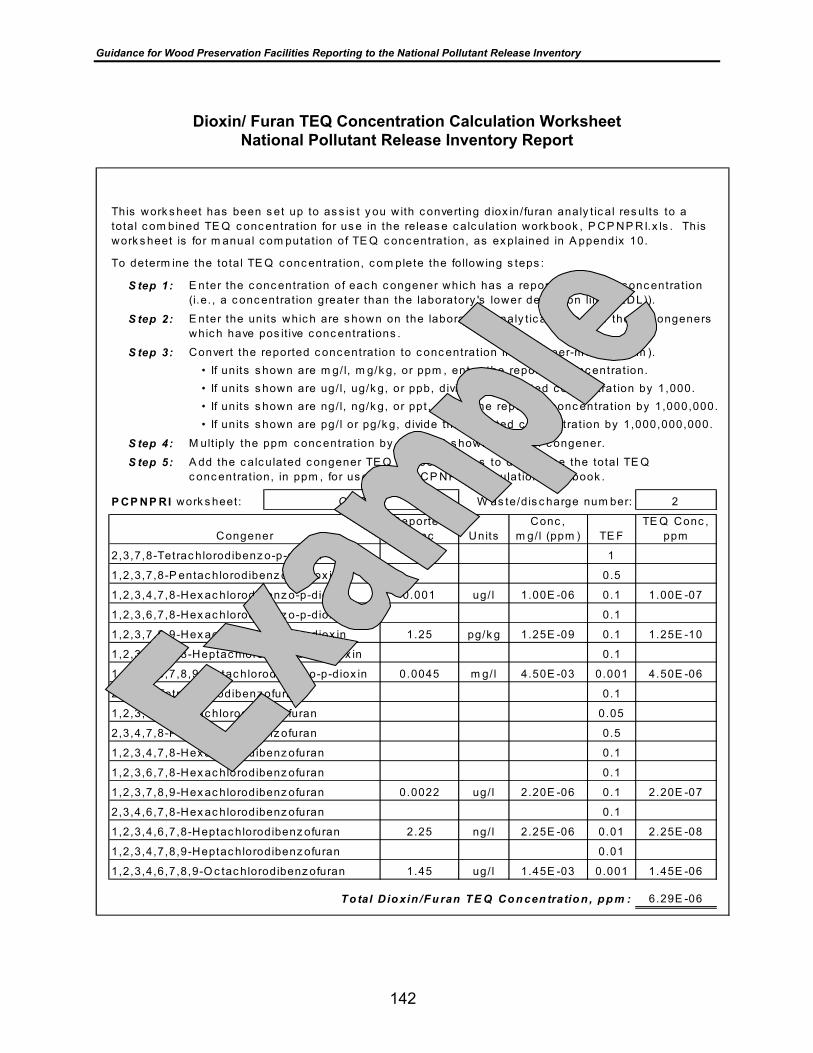
Guidance for Wood Preservation Facilities Reporting to the National Pollutant Release Inventory
142
Dioxin/ Furan TEQ Concentration Calculation WorksheetNational Pollutant Release Inventory Report
S tep 1:
S tep 2:
S tep 3: • If units s hown are m g/ l, m g/k g, or ppm , enter the reported c onc entrat ion.• If units s hown are ug/ l, ug/k g, or ppb, d ivide the reported c onc entrat ion by 1,000.• If units s hown are ng/ l, ng/k g, or ppt , d ivide the reported c onc entrat ion by 1,000,000.• If units s hown are pg/ l or pg/k g, d ivide the reported c onc entrat ion by 1,000,000,000.
S tep 4: M ult ip ly the ppm c onc entrat ion by the TE F s hown for eac h c ongener.
S tep 5:
P CP NP RI work s heet: W as te/dis c harge num ber: 2
ReportedConc Units
Conc ,m g/l (ppm ) TE F
TE Q Conc ,ppm
1
0.5
0.001 ug/ l 1.00E -06 0.1 1.00E -07
0.1
1.25 pg/k g 1.25E -09 0.1 1.25E -10
0.1
0.0045 m g/ l 4.50E -03 0.001 4.50E -06
0.1
0.05
0.5
0.1
0.1
0.0022 ug/ l 2.20E -06 0.1 2.20E -07
0.1
2.25 ng/ l 2.25E -06 0.01 2.25E -08
0.01
1.45 ug/ l 1.45E -03 0.001 1.45E -06
T o tal D io xin /F u ran T E Q Co n cen tratio n , p p m : 6.29E -06
1,2,3,7,8-P entac hlorodibenz o-p-diox in
2,3,7,8-Tetrac hlorodibenz o-p-diox in
Congener
To determ ine the tota l TE Q c onc entrat ion, c om plete the fo llow ing s teps :
O ff-S ite
Convert the reported c onc entrat ion to c onc entrat ion in parts -per-m illion (ppm ).
A dd the c alc ulated c ongener TE Q c onc entrat ions to determ ine the total TE Q c onc entrat ion, in ppm , for us e in the P CP NP RI c alc ulat ion work book .
E nter the c onc entrat ion of eac h c ongener whic h has a reported pos it ive c onc entrat ion (i.e. , a c onc entrat ion greater than the laboratory 's lower detec t ion lim it (LDL)).
E nter the units whic h are s hown on the laboratory analy t ic al report for thos e c ongeners whic h have pos it ive c onc entrat ions .
1,2,3,6,7,8-Hex ac hlorodibenz o-p-diox in
1,2,3,4,7,8-Hex ac hlorodibenz o-p-diox in
2,3,4,7,8-P entac hlorodibenz ofuran
1,2,3,7,8-P entac hlorodibenz ofuran
2,3,7,8-Tetrac hlorodibenz ofuran
1,2,3,4,6,7,8,9-O c tac hlorodibenz o-p-diox in
This work s heet has been s et up to as s is t y ou w ith c onvert ing diox in/furan analy t ic al res ults to a tota l c om bined TE Q c onc entrat ion for us e in the releas e c alc ulat ion work book , P CP NP RI.x ls . This work s heet is for m anual c om putat ion of TE Q c onc entrat ion, as ex plained in A ppendix 10.
1,2,3,4,6,7,8,9-O c tac hlorodibenz ofuran
1,2,3,4,7,8,9-Heptac hlorodibenz ofuran
1,2,3,4,6,7,8-Heptac hlorodibenz ofuran
2,3,4,6,7,8-Hex ac hlorodibenz ofuran
1,2,3,7,8,9-Hex ac hlorodibenz ofuran
1,2,3,6,7,8-Hex ac hlorodibenz ofuran
1,2,3,4,7,8-Hex ac hlorodibenz ofuran
1,2,3,4,6,7,8-Heptac hlorodibenz o-p-diox in
1,2,3,7,8,9-Hex ac hlorodibenz o-p-diox in

Guidance for Wood Preservation Facilities Reporting to the National Pollutant Release Inventory
143
Step 1:
Step 2:
Step 3: • If units shown are mg/l, mg/kg, or ppm, enter the reported concentration.• If units shown are ug/l, ug/kg, or ppb, divide the reported concentration by 1,000.• If units shown are ng/l, ng/kg, or ppt, divide the reported concentration by 1,000,000.• If units shown are pg/l or pg/kg, divide the reported concentration by 1,000,000,000.
Step 4: Multiply the ppm concentration by the TEF shown for each congener.Step 5:
PCPNPRI worksheet: W aste/discharge number:
ReportedConc Units
Conc,mg/l (ppm) TEF
TEQ Conc,ppm
1
0.5
0.1
0.1
0.1
0.01
0.001
0.1
0.05
0.5
0.1
0.1
0.1
0.1
0.01
0.01
0.001
Total Dioxin/Furan TEQ Concentration, ppm:
1,2,3,7,8-Pentachlorodibenzo-p-dioxin
2,3,7,8-Tetrachlorodibenzo-p-dioxin
Congener
To determine the total TEQ concentration, complete the following steps:
Convert the reported concentration to concentration in parts-per-million (ppm).
Add the calculated congener TEQ concentrations to determine the total TEQ concentration, in ppm, for use in the PCPNPRI calculation workbook.
Enter the concentration of each congener which has a reported positive concentration (i.e., a concentration greater than the laboratory's lower detection limit (LDL)).Enter the units which are shown on the laboratory analytical report for those congeners which have positive concentrations.
1,2,3,6,7,8-Hexachlorodibenzo-p-dioxin
1,2,3,4,7,8-Hexachlorodibenzo-p-dioxin
2,3,4,7,8-Pentachlorodibenzofuran
1,2,3,7,8-Pentachlorodibenzofuran
2,3,7,8-Tetrachlorodibenzofuran
1,2,3,4,6,7,8,9-Octachlorodibenzo-p-dioxin
This worksheet has been set up to assist you with converting dioxin/furan analytical results to a total combined TEQ concentration for use in the release calculation workbook, PCPNPRI.xls. This worksheet is for manual computation of TEQ concentration, as explained in Appendix 10.
1,2,3,4,6,7,8,9-Octachlorodibenzofuran
1,2,3,4,7,8,9-Heptachlorodibenzofuran
1,2,3,4,6,7,8-Heptachlorodibenzofuran
2,3,4,6,7,8-Hexachlorodibenzofuran
1,2,3,7,8,9-Hexachlorodibenzofuran
1,2,3,6,7,8-Hexachlorodibenzofuran
1,2,3,4,7,8-Hexachlorodibenzofuran
1,2,3,4,6,7,8-Heptachlorodibenzo-p-dioxin
1,2,3,7,8,9-Hexachlorodibenzo-p-dioxin


