Embed Size (px)
Citation preview

197077/Bord Bia Periscope Study 2009 - Trends in Consumer Food Intelligence
Growing the success of Irish food & horticulture
6
11-019758/Bia Periscope Study 2011 Master/Sept 2011
PERIscope
2
Introduction
PERIscope 6 is Bord Bia‟s biennial study that tracks the Irish, British and Northern Irish consumer.
Data is available from 2001 for the Republic of Ireland, 2003 for Great Britain and 2005 for Northern
Ireland. It provides a detailed perspective on how consumers view food related issues and report their
behaviours. Over the various studies we have held many questions constant to allow tracking over
time; we also include topical issues as they arise in 2011.
This deck is designed to provide a thorough flavour of the PERIscope 6 results. The charts included
represent the study results, but more detailed information is available in the tabular reports.
We hope that by providing you with knowledge of your consumer, you can create actionable
opportunities for marketing and brand development that deliver real competitive advantage.
Please note, there may be discrepancies in some totals due to rounding (e.g. “slightly agree” at 45,
“strongly agree” at 30, “agree” at 76).
For further information about Bord Bia‟s PERIscope 6, please contact Helen King, Senior Business
Analyst: Tel: +353 1 6685155.
All content provided in this pack is also available on the Bord Bia Client portal
https://www.bordbiaperiscope.ie.
11-019758/Bia Periscope Study 2011 Master/Sept 2011
PERIscope
Research Method
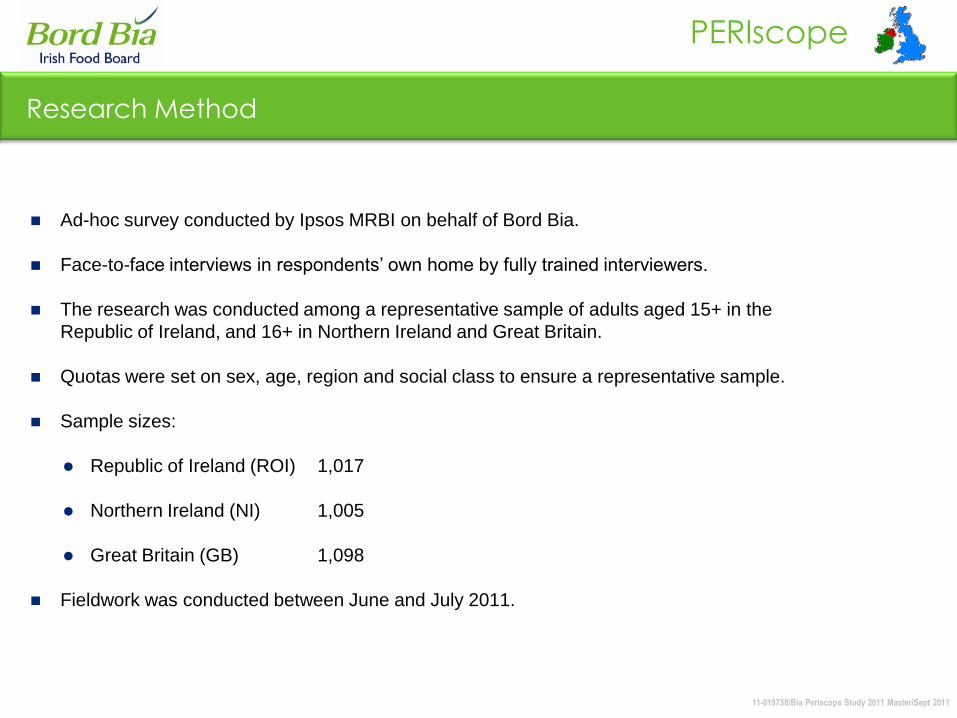
Ad-hoc survey conducted by Ipsos MRBI on behalf of Bord Bia.
Face-to-face interviews in respondents‟ own home by fully trained interviewers.
The research was conducted among a representative sample of adults aged 15+ in the
Republic of Ireland, and 16+ in Northern Ireland and Great Britain.
Quotas were set on sex, age, region and social class to ensure a representative sample.
Sample sizes:
Republic of Ireland (ROI) 1,017
Northern Ireland (NI) 1,005
Great Britain (GB) 1,098
Fieldwork was conducted between June and July 2011.
11-019758/Bia Periscope Study 2011 Master/Sept 2011
PERIscope
4
49 48 49
16 17 15 1318
25
51 52 51
22 1716
27
29
30
1918
18
24
22
181617
17
27
30 27
1314
15
815 18 20
--
ROI NI GB ROI NI GB ROI NI GB
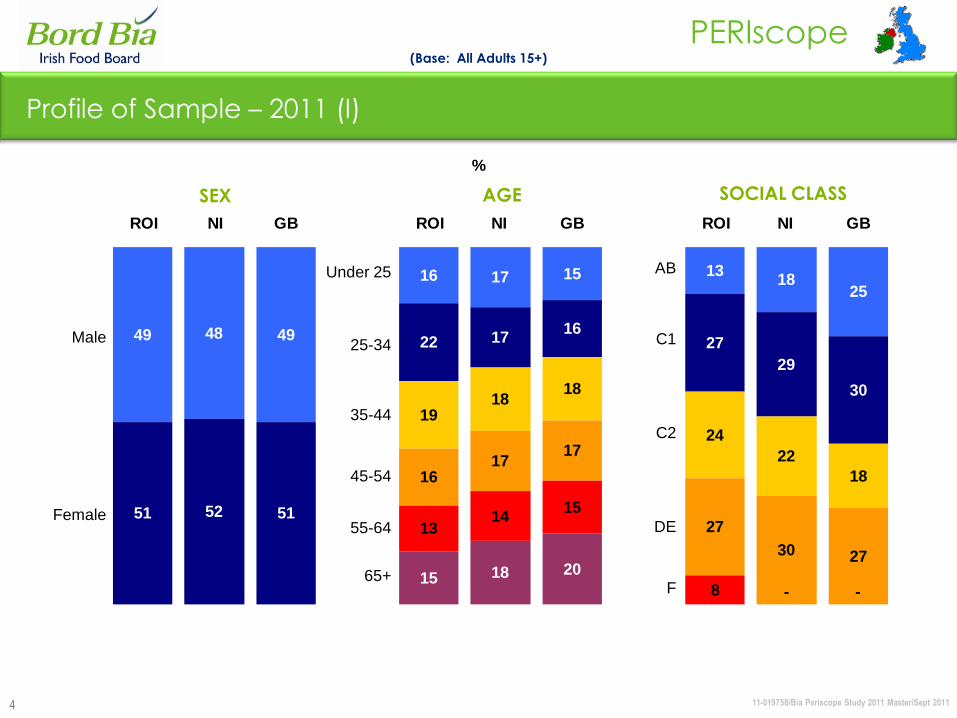
Male
Female
Under 25
25-34
35-44
45-54
55-64
65+
SEX AGE SOCIAL CLASS
Profile of Sample – 2011 (I)
(Base: All Adults 15+)
AB
C1
C2
DE
F
%
11-019758/Bia Periscope Study 2011 Master/Sept 2011
PERIscope
5
34 38 34
1112
12
21 1412
14 1722
96
7
2630
34
10 2123
6052
43
1510 11
ROI NI GB ROI NI GB
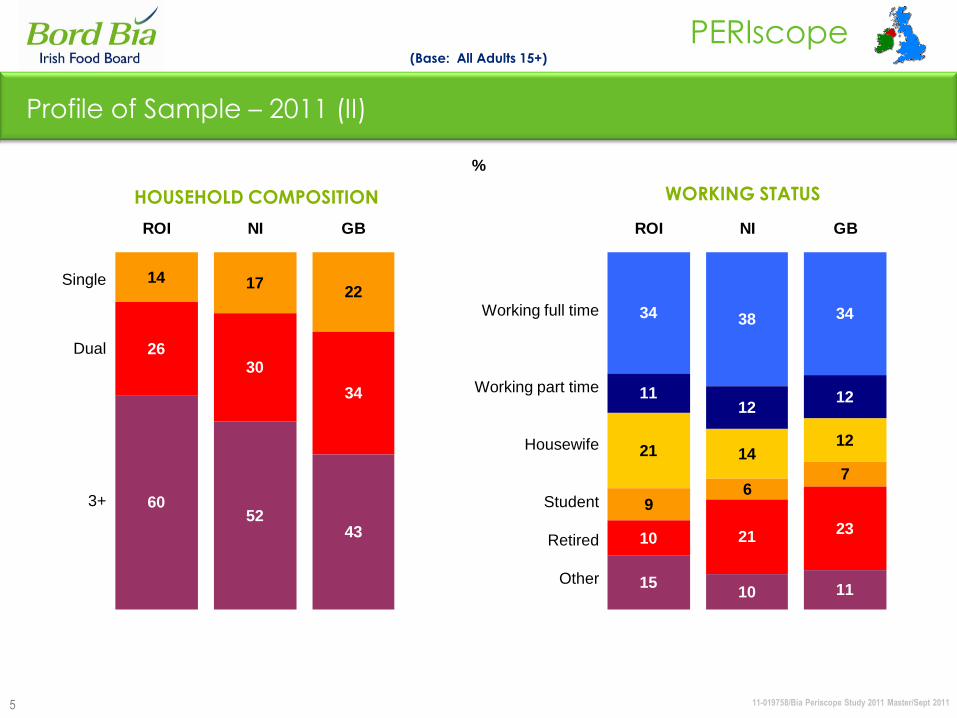
Single
Dual
3+
Working full time
Working part time
Housewife
Student
Retired
Other
HOUSEHOLD COMPOSITION WORKING STATUS
Profile of Sample – 2011 (II)
(Base: All Adults 15+)
%
11-019758/Bia Periscope Study 2011 Master/Sept 2011
PERIscope
6
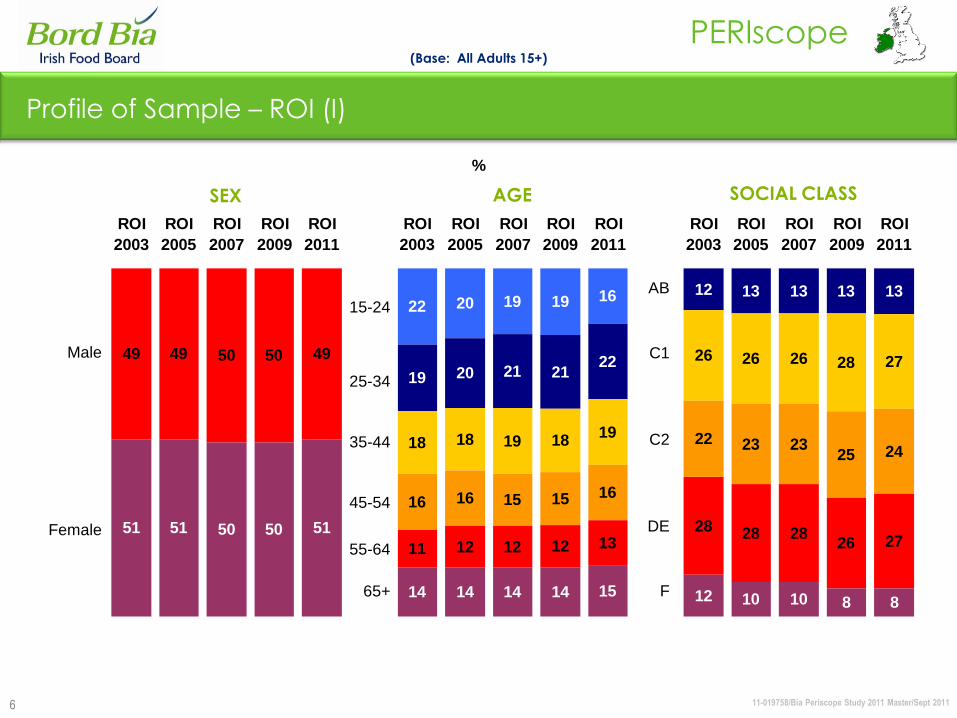
Profile of Sample – ROI (I)
(Base: All Adults 15+)
22 20 19 19 16
19 20 2122
12 13 13 13 13
18 1819
26 26 26 28 27
16 16 15 15 16
22 23 2325 24
49 49 50 50 49
11 12 12 1328 28 28
26 2751 51 50 50 51
14 14 14 15 12 10 10 8 8
21
18 19
12
14
ROI
2003
ROI
2005
ROI
2007
ROI
2009
ROI
2011
ROI
2003
ROI
2005
ROI
2007
ROI
2009
ROI
2011
ROI
2003
ROI
2005
ROI
2007
ROI
2009
ROI
2011
Male
Female
15-24
25-34
35-44
45-54
55-64
65+
SEX AGE SOCIAL CLASS
AB
C1
C2
DE
F
%
11-019758/Bia Periscope Study 2011 Master/Sept 2011
PERIscope
7
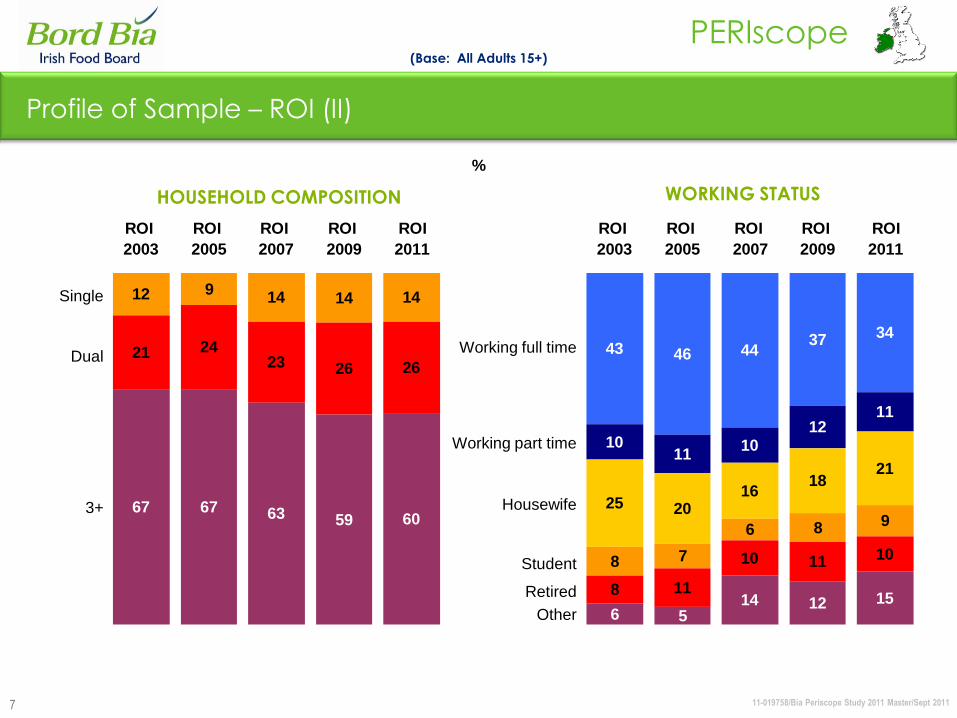
Profile of Sample – ROI (II)
43 46 4437 34
10 1012
11
2516
1821
12 914 14 14
8 7
6 8 9
21 2423 26 26
8
10 11 10
67 67 63 59 60
614 12 15
11
20
11
5
ROI
2003
ROI
2005
ROI
2007
ROI
2009
ROI
2011
ROI
2003
ROI
2005
ROI
2007
ROI
2009
ROI
2011
Single
Dual
3+
Working full time
Working part time
Housewife
Student
Retired
Other
HOUSEHOLD COMPOSITION WORKING STATUS
(Base: All Adults 15+)
%
11-019758/Bia Periscope Study 2011 Master/Sept 2011
PERIscope
8
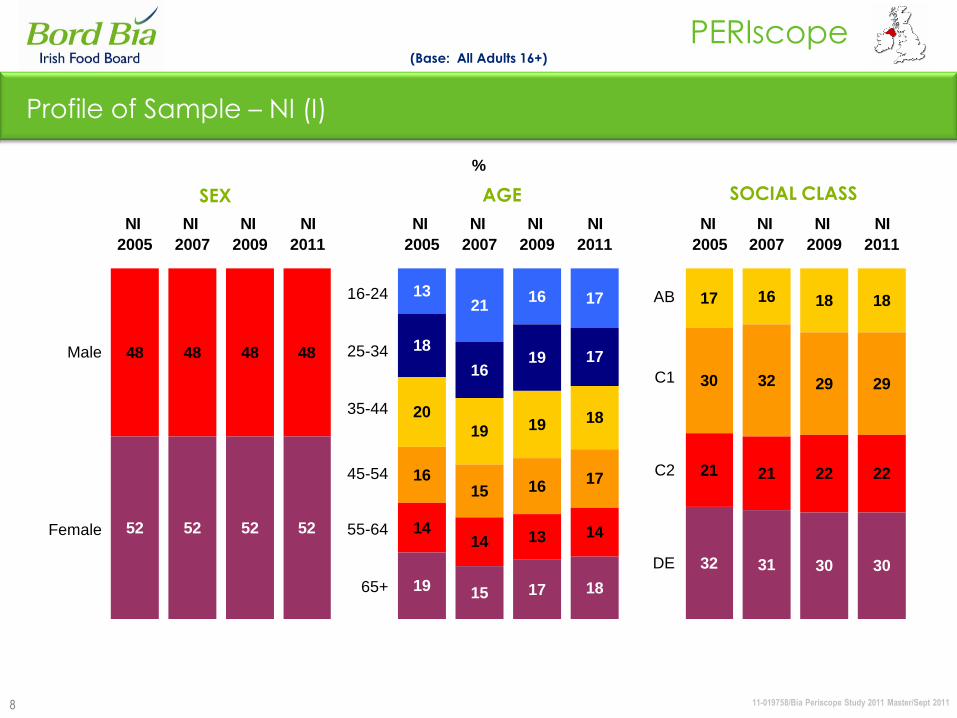
Profile of Sample – NI (I)
1321
16 17
18
1619 17
20
19 19
17 16 18 18
16
30 32 29 29
48 48 48 48
1414 13 14
21 21 22 22
52 52 52 52
19 15 17
32 31 30 30
18
1516 17
18
NI
2005
NI
2007
NI
2009
NI
2011
NI
2005
NI
2007
NI
2009
NI
2011
NI
2005
NI
2007
NI
2009
NI
2011
Male
Female
16-24
25-34
35-44
45-54
55-64
65+
SEX AGE SOCIAL CLASS
AB
C1
C2
DE
(Base: All Adults 16+)
%

11-019758/Bia Periscope Study 2011 Master/Sept 2011
PERIscope
9
Profile of Sample – NI (II)
44 4538 38
11 11
12
13
14
18 18 21 17
35
6 6
3226
2930
2016
2150
5650 52
11 10 10
12
1112
21
10
NI
2005
NI
2007
NI
2009
NI
2011
NI
2005
NI
2007
NI
2009
NI
2011
Single
Dual
3+
Working full time
Working part time
Housewife
Student
Retired
Other
HOUSEHOLD COMPOSITION WORKING STATUS
(Base: All Adults 16+)
%
11-019758/Bia Periscope Study 2011 Master/Sept 2011
PERIscope
10
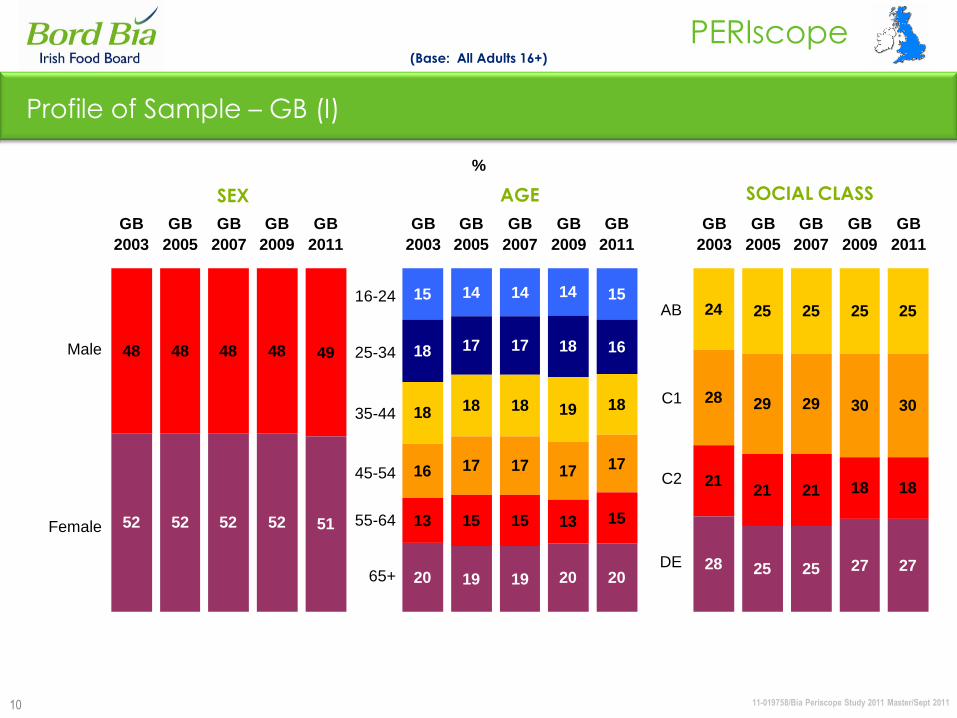
Profile of Sample – GB (I)
(Base: All Adults 16+)
15 14 14 14 15
18 17 18 16
18 19 18
24 25 25 25 25
16 17 17 17 17
28 29 29 30 30
48 48 48 48 49
13 15 13 15
2121 21 18 18
52 52 52 52 51
20 19 20 2028 25 25 27 27
17
18 18
15
19
GB
2003
GB
2005
GB
2007
GB
2009
GB
2011
GB
2003
GB
2005
GB
2007
GB
2009
GB
2011
GB
2003
GB
2005
GB
2007
GB
2009
GB
2011
Male
Female
16-24
25-34
35-44
45-54
55-64
65+
SEX AGE SOCIAL CLASS
AB
C1
C2
DE
%
11-019758/Bia Periscope Study 2011 Master/Sept 2011
PERIscope
11
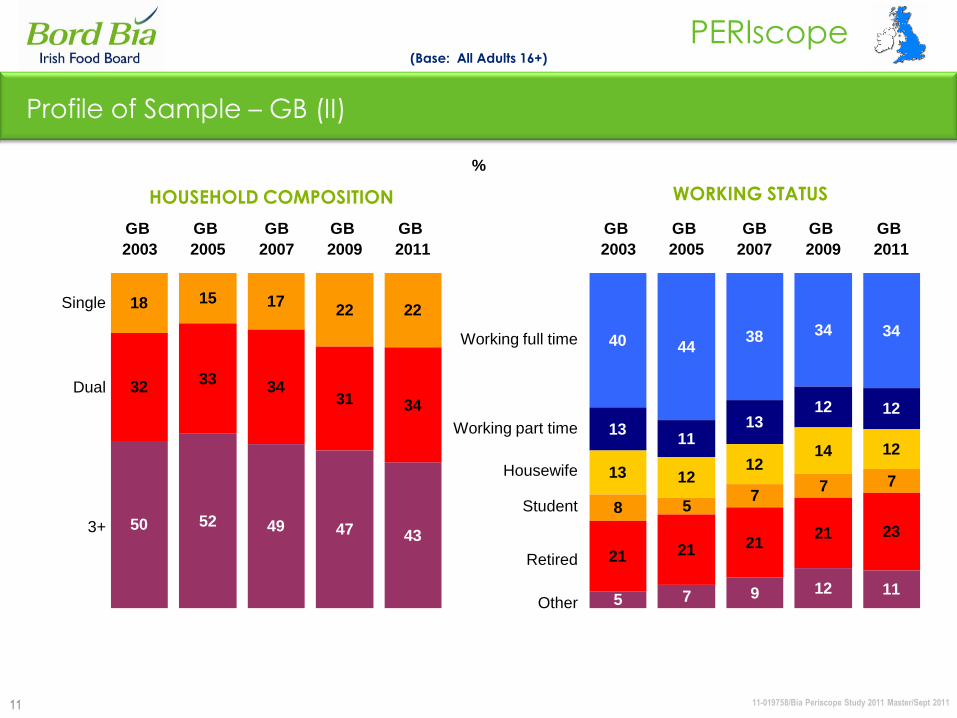
40 4438 34 34
13 1312 12
1312
14 12
18 15 1722 22
8 57
7 7
3233
3431 34
2121
21 2350 52 49 47 43
5 9 12 11
11
12
21
7
GB
2003
GB
2005
GB
2007
GB
2009
GB
2011
GB
2003
GB
2005
GB
2007
GB
2009
GB
2011
Single
Dual
3+
Working full time
Working part time
Housewife
Student
Retired
Other
HOUSEHOLD COMPOSITION WORKING STATUS
(Base: All Adults 16+)
Profile of Sample – GB (II)
%
11-019758/Bia Periscope Study 2011 Master/Sept 2011
PERIscope
12
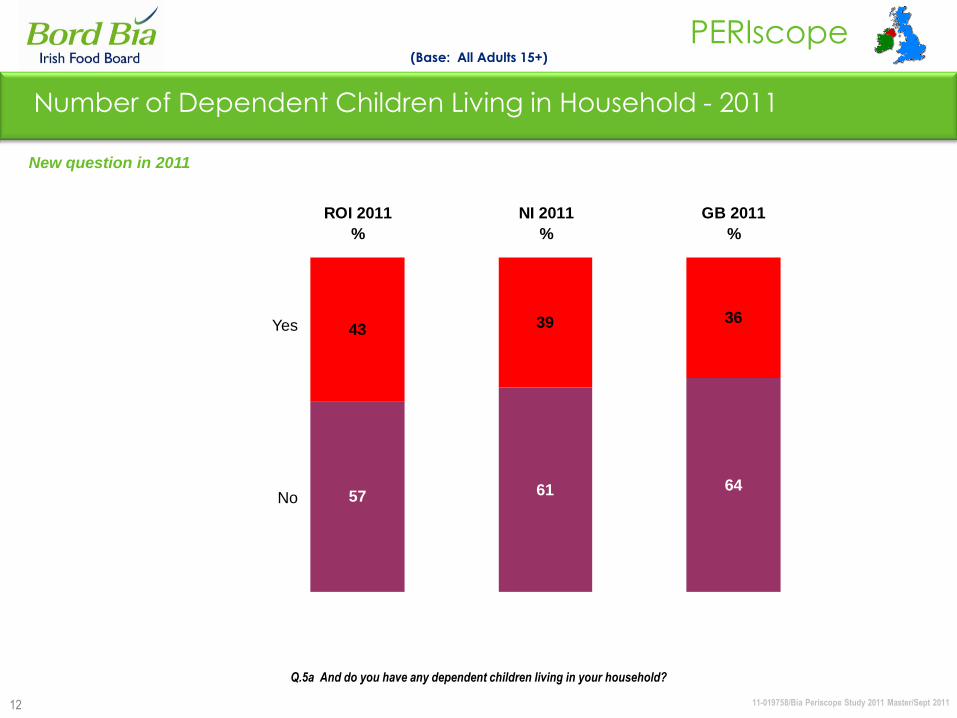
36
64
43 39
6157
ROI 2011
%
NI 2011
%
GB 2011
%
Yes
No
(Base: All Adults 15+)
Number of Dependent Children Living in Household - 2011
New question in 2011
Q.5a And do you have any dependent children living in your household?
11-019758/Bia Periscope Study 2011 Master/Sept 2011
PERIscope
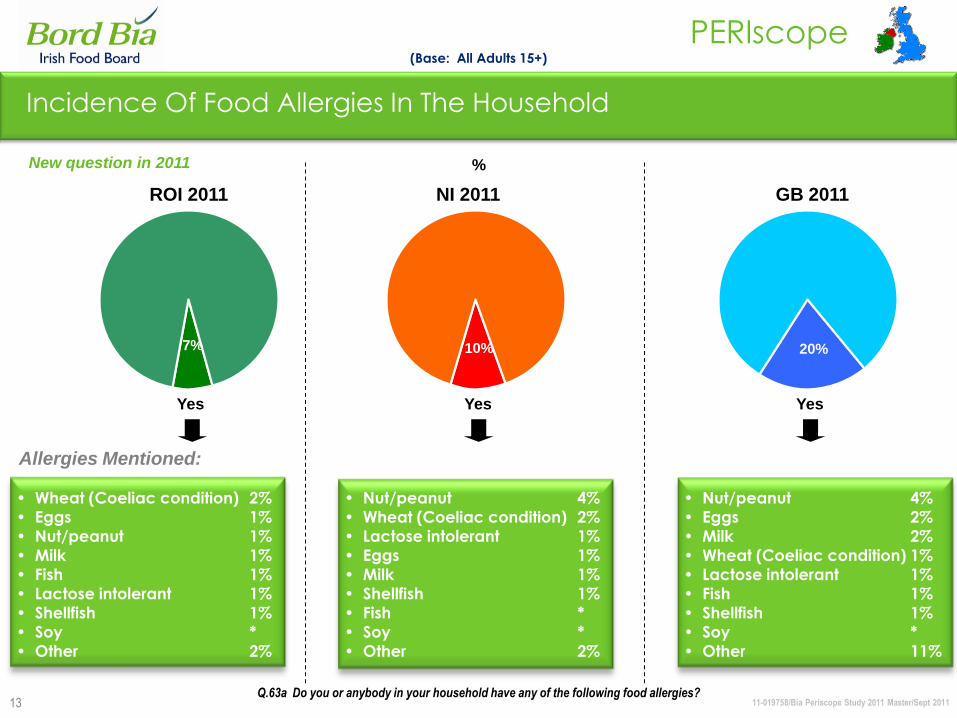
10%
13
Incidence Of Food Allergies In The Household
Yes Yes Yes
• Wheat (Coeliac condition) 2%
• Eggs 1%
• Nut/peanut 1%
• Milk 1%
• Fish 1%
• Lactose intolerant 1%
• Shellfish 1%
• Soy *
• Other 2%
Allergies Mentioned:
(Base: All Adults 15+)
Q.63a Do you or anybody in your household have any of the following food allergies?
%
NI 2011 GB 2011
7% 20%
New question in 2011
ROI 2011
• Nut/peanut 4%
• Wheat (Coeliac condition) 2%
• Lactose intolerant 1%
• Eggs 1%
• Milk 1%
• Shellfish 1%
• Fish *
• Soy *
• Other 2%
• Nut/peanut 4%
• Eggs 2%
• Milk 2%
• Wheat (Coeliac condition) 1%
• Lactose intolerant 1%
• Fish 1%
• Shellfish 1%
• Soy *
• Other 11%
Attitudes Towards Food
11-019758/Bia Periscope Study 2011 Master/Sept 2011
PERIscope
15
Attitudes Towards Food: Summary
ROI has the most positive attitude towards food in terms of the variety of foodstuffs consumed
i.e. fresh fruit and vegetables, high - fibre foods and dairy products.
ROI positions itself as the healthiest market with increasing amounts of people cooking healthily.
Penetration of steamers and woks continue to increase whereas the penetration of deep fat
fryers continue to decline.
NI emerge as the least health conscious region. They are more likely to think that “frozen food is
as good as fresh food” and they are more likely to consume “ready prepared / convenience
meals”.
The „5 a day‟ message is gaining momentum across all three regions. In addition, ROI
consumers are relatively more favourably disposed towards dairy products compared to their NI
and GB counterparts.
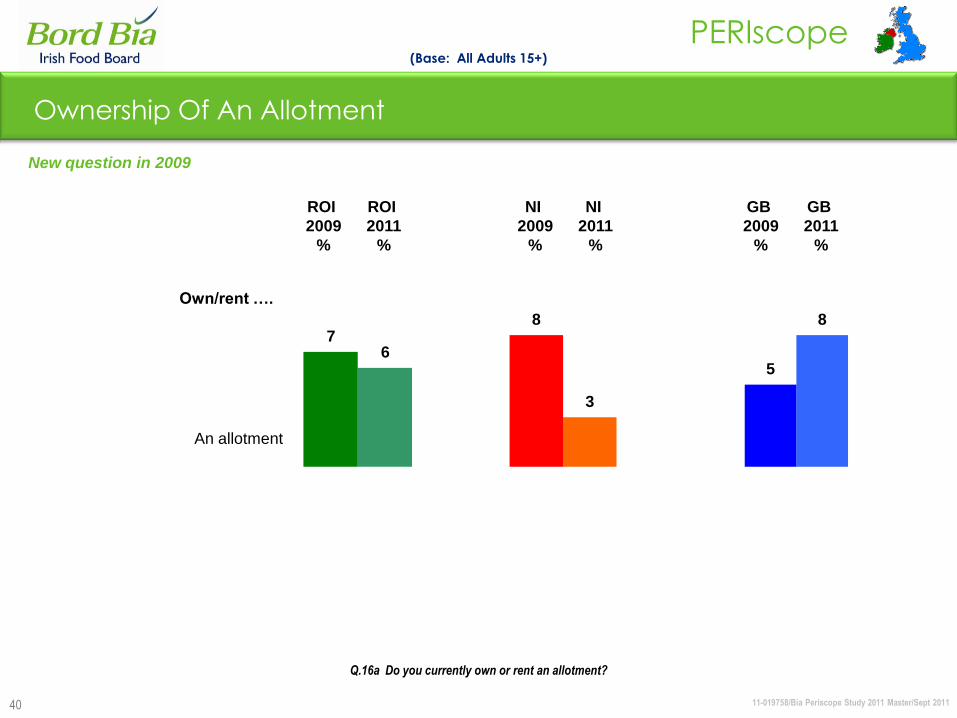
Nearly I in 10 GB residents claim to own / rent an allotment. This figure is lower in ROI and NI.
11-019758/Bia Periscope Study 2011 Master/Sept 2011
PERIscope
16
(Base: All Adults 15+)
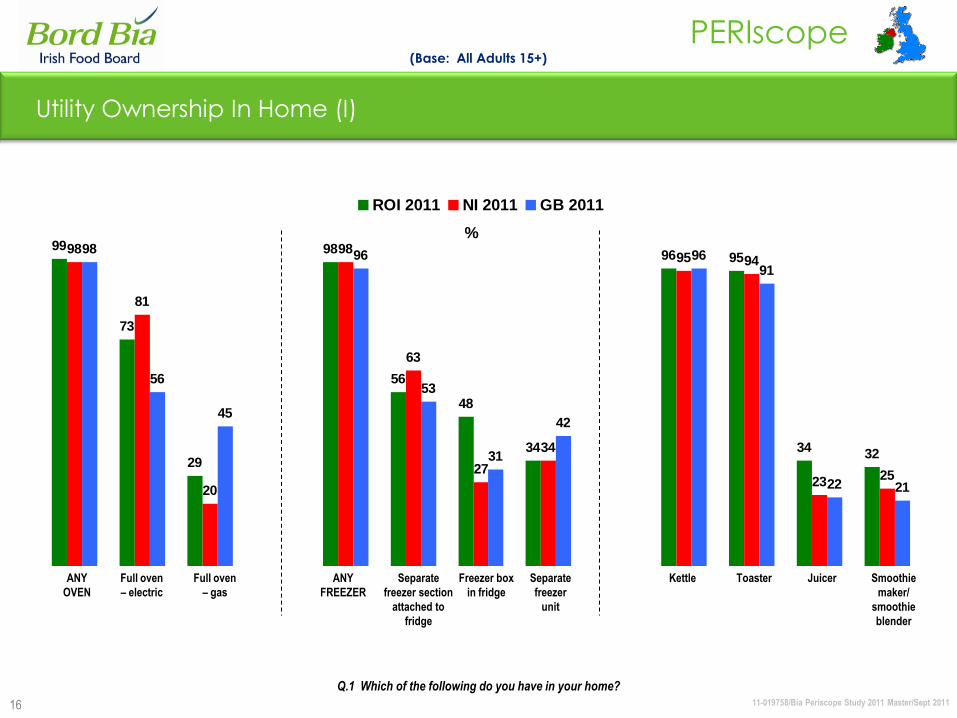
Utility Ownership In Home (I)
Q.1 Which of the following do you have in your home?
99
73
29
98
56
48
34
96 95
3432
98
81
20
98
63
27
34
95 94
2325
98
56
45
96
53
31
42
9691
22 21
ROI 2011 NI 2011 GB 2011
%
ANY
OVEN
Full oven
– electric
Full oven
– gas
ANY
FREEZER
Separate
freezer section
attached to
fridge
Freezer box
in fridge
Separate
freezer
unit
Kettle Toaster Juicer Smoothie
maker/
smoothie
blender
11-019758/Bia Periscope Study 2011 Master/Sept 2011
PERIscope
17
(Base: All Adults 15+)
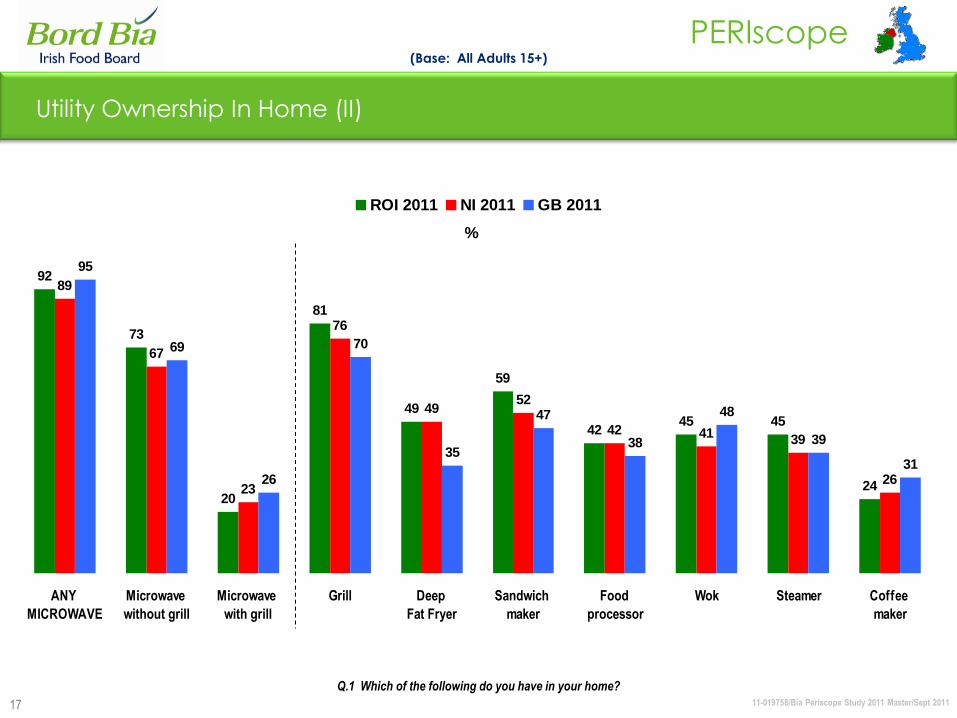
Utility Ownership In Home (II)
92
73
20
81
49
59
4245 45
24
89
67
23
76
4952
42 4139
26
95
69
26
70
35
47
38
48
39
31
ANY
MICROWAVE
Microwave
without grill
Microwave
with grill
Grill Deep
Fat Fryer
Sandwich
maker
Food
processor
Wok Steamer Coffee
maker
ROI 2011 NI 2011 GB 2011
%
Q.1 Which of the following do you have in your home?

11-019758/Bia Periscope Study 2011 Master/Sept 2011
PERIscope
18
(Base: All Adults 15+)
Utility Ownership In Home – ROI (I)
66
34
54
48
28
98
30
97
60
3933
73
26
49 47
35
99
73
31
97
55
46
40
99
73
29
98
56
48
34
97 96
72
96 95
ROI 2003 ROI 2005 ROI 2007 ROI 2009 ROI 2011
%
ANY
OVEN
Full oven
– electric
Full oven
– gas
ANY
FREEZER
Separate
freezer section
attached to fridge
Freezer box
in fridge
Separate
freezer
unit
Q.1 Which of the following do you have in your home?

11-019758/Bia Periscope Study 2011 Master/Sept 2011
PERIscope
19
(Base: All Adults 15+)
Utility Ownership In Home – ROI (II)
94
84
61
24
96
88
68
21
94
88
60
28
96 96
3431
91
69
24
96 95
34 32
92
73
20
n/a
96
n/an/an/a
95
n/a
93
n/a
ROI 2003 ROI 2005 ROI 2007 ROI 2009 ROI 2011
%
Kettle Toaster Juicer Smoothie
maker/
smoothie
blender
ANY
MICROWAVE
Microwave
without
grill
Microwave
with
grill
Q.1 Which of the following do you have in your home?
11-019758/Bia Periscope Study 2011 Master/Sept 2011
PERIscope
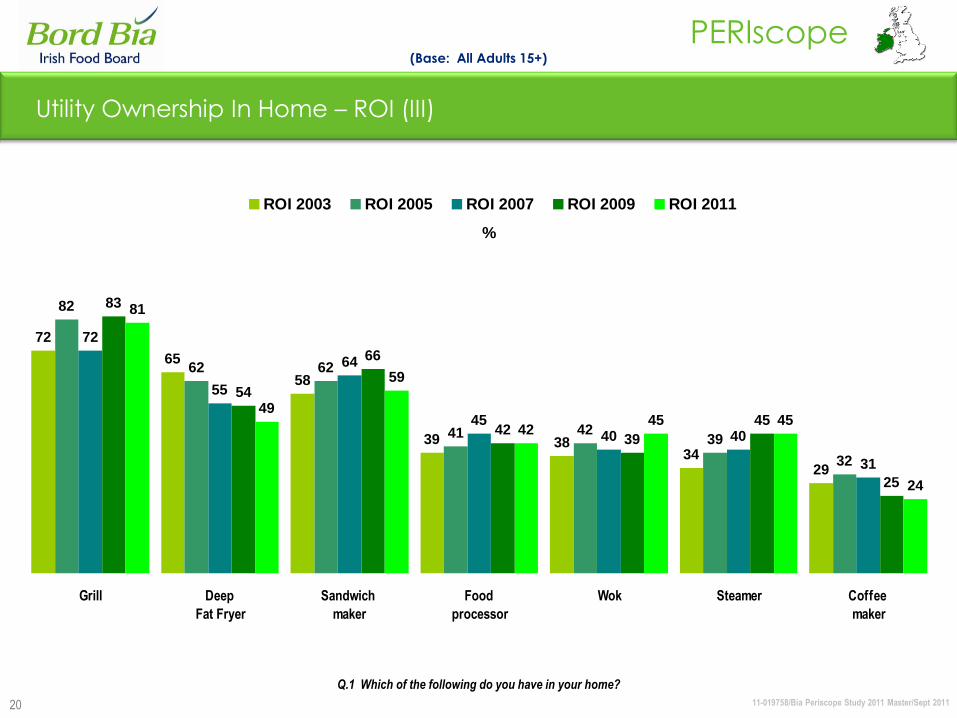
72
65
58
39 3834
29
82
62 62
41 4239
32
72
55
64
4540 40
31
83
54
66
4239
45
25
81
49
59
4245 45
24
Grill Deep
Fat Fryer
Sandwich
maker
Food
processor
Wok Steamer Coffee
maker
ROI 2003 ROI 2005 ROI 2007 ROI 2009 ROI 2011
20
(Base: All Adults 15+)
Utility Ownership In Home – ROI (III)
%
Q.1 Which of the following do you have in your home?
11-019758/Bia Periscope Study 2011 Master/Sept 2011
PERIscope
21
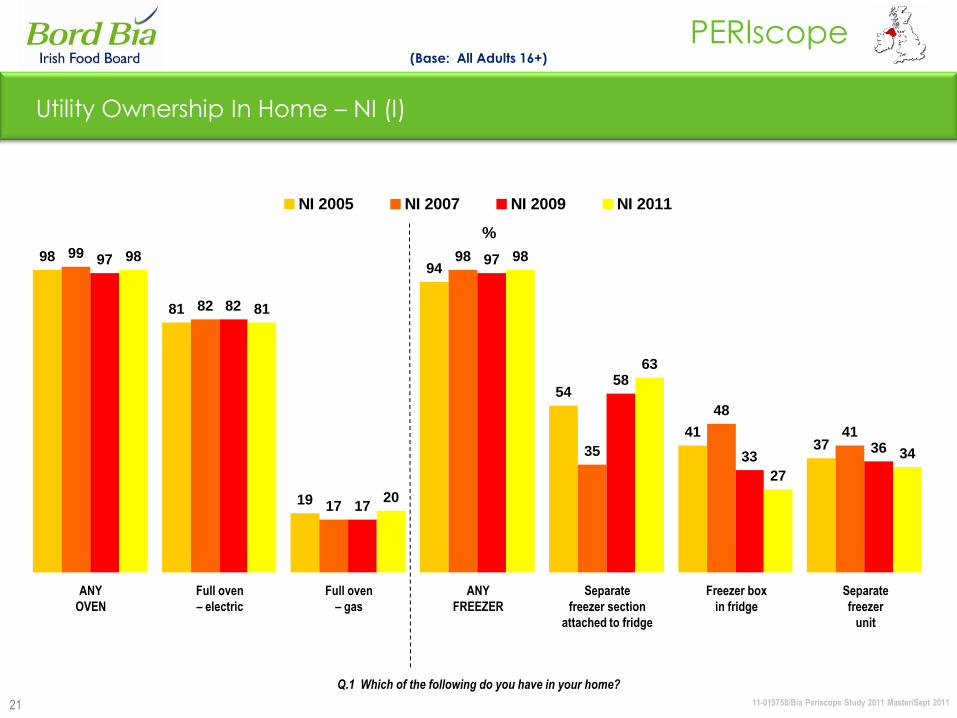
(Base: All Adults 16+)
Utility Ownership In Home – NI (I)
98
81
19
94
54
4137
99
82
17
98
35
48
41
97
82
17
97
58
3336
98
81
20
98
63
27
34
NI 2005 NI 2007 NI 2009 NI 2011
%
ANY
OVEN
Full oven
– electric
Full oven
– gas
ANY
FREEZER
Separate
freezer section
attached to fridge
Freezer box
in fridge
Separate
freezer
unit
Q.1 Which of the following do you have in your home?
11-019758/Bia Periscope Study 2011 Master/Sept 2011
PERIscope
22
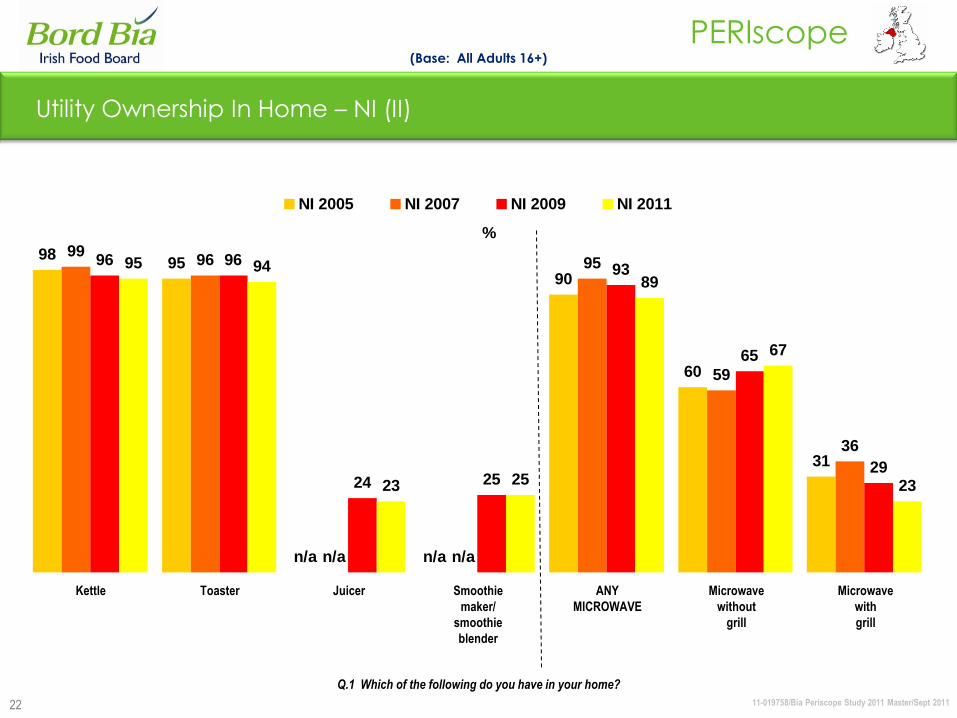
(Base: All Adults 16+)
Utility Ownership In Home – NI (II)
9895
90
60
31
9996 95
59
36
96 96
24 25
93
65
29
95 94
23 25
89
67
23
n/an/a n/an/a
NI 2005 NI 2007 NI 2009 NI 2011
%
Q.1 Which of the following do you have in your home?
Kettle Toaster Juicer Smoothie
maker/
smoothie
blender
ANY
MICROWAVE
Microwave
without
grill
Microwave
with
grill
11-019758/Bia Periscope Study 2011 Master/Sept 2011
PERIscope
23
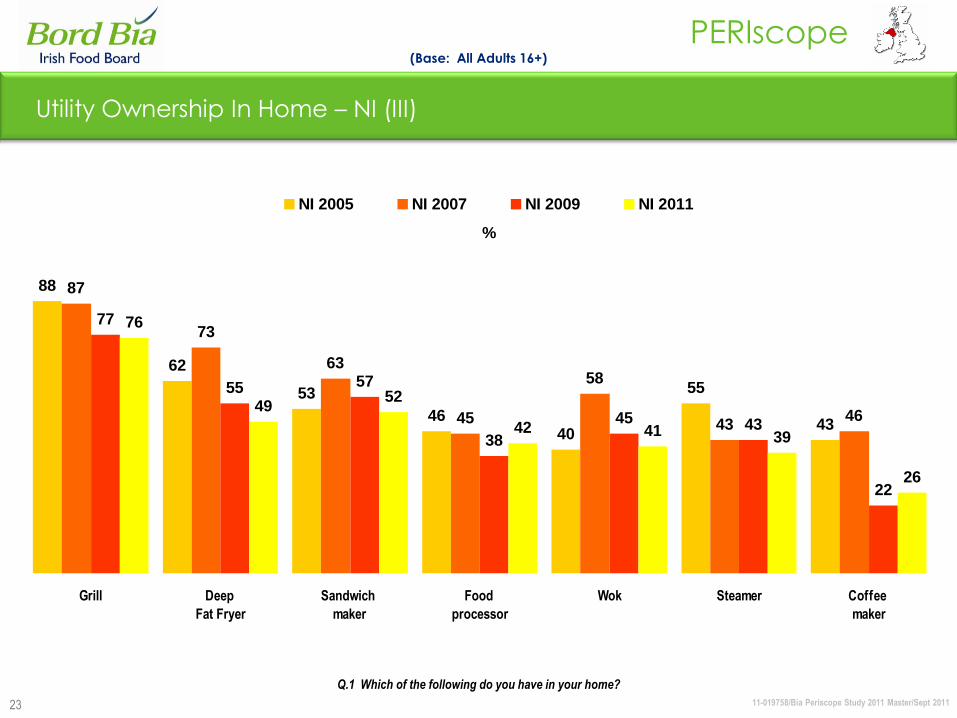
(Base: All Adults 16+)
Utility Ownership In Home – NI (III)
88
62
53
4640
55
43
87
73
63
45
58
4346
77
55 57
38
45 43
22
76
4952
42 41 39
26
Grill Deep
Fat Fryer
Sandwich
maker
Food
processor
Wok Steamer Coffee
maker
NI 2005 NI 2007 NI 2009 NI 2011
%
Q.1 Which of the following do you have in your home?
11-019758/Bia Periscope Study 2011 Master/Sept 2011
PERIscope
24
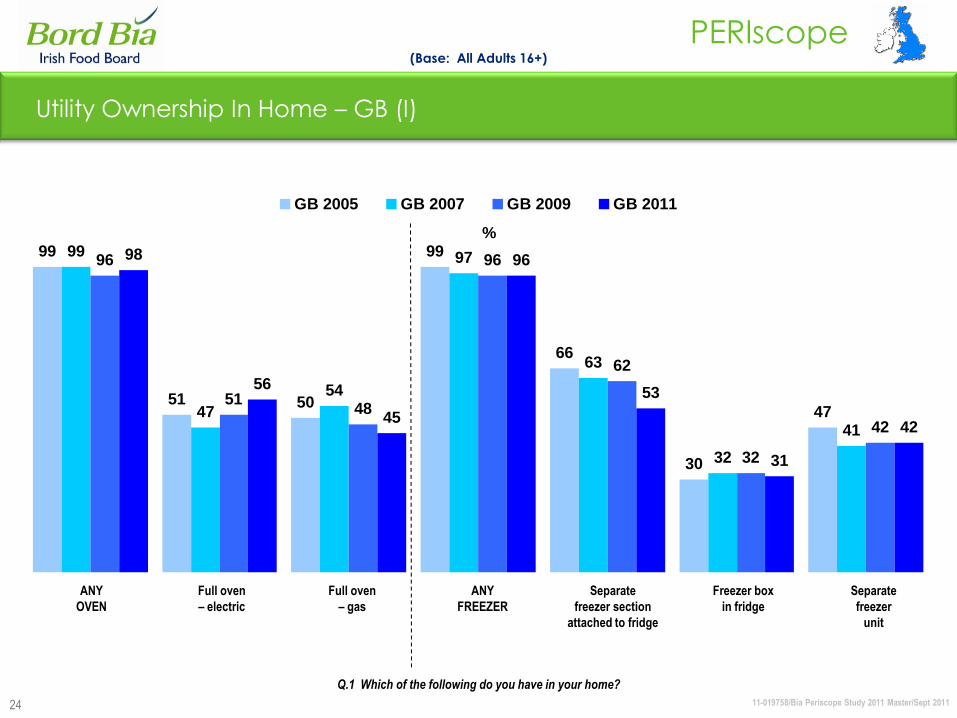
(Base: All Adults 16+)
Utility Ownership In Home – GB (I)
99
51 50
99
66
30
47
99
47
54
97
63
32
41
96
5148
96
62
32
42
98
56
45
96
53
31
42
GB 2005 GB 2007 GB 2009 GB 2011
%
ANY
OVEN
Full oven
– electric
Full oven
– gas
ANY
FREEZER
Separate
freezer section
attached to fridge
Freezer box
in fridge
Separate
freezer
unit
Q.1 Which of the following do you have in your home?
11-019758/Bia Periscope Study 2011 Master/Sept 2011
PERIscope
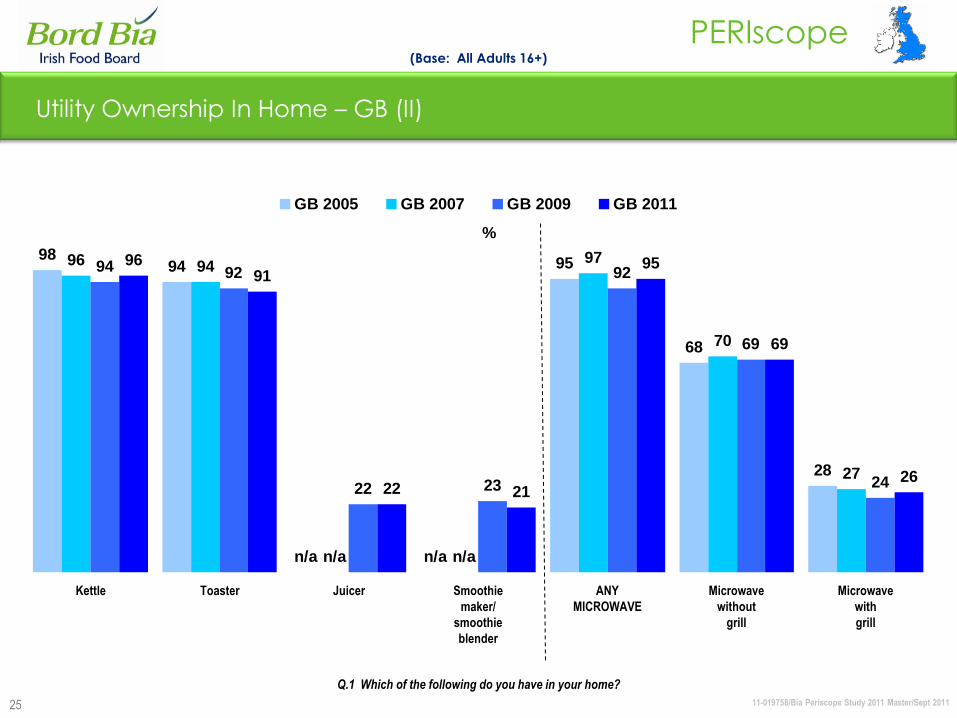
25
(Base: All Adults 16+)
Utility Ownership In Home – GB (II)
9894 95
68
28
96 9497
70
27
94 92
22 23
92
69
24
9691
22 21
95
69
26
n/an/a n/an/a
GB 2005 GB 2007 GB 2009 GB 2011
%
Q.1 Which of the following do you have in your home?
Kettle Toaster Juicer Smoothie
maker/
smoothie
blender
ANY
MICROWAVE
Microwave
without
grill
Microwave
with
grill
11-019758/Bia Periscope Study 2011 Master/Sept 2011
PERIscope
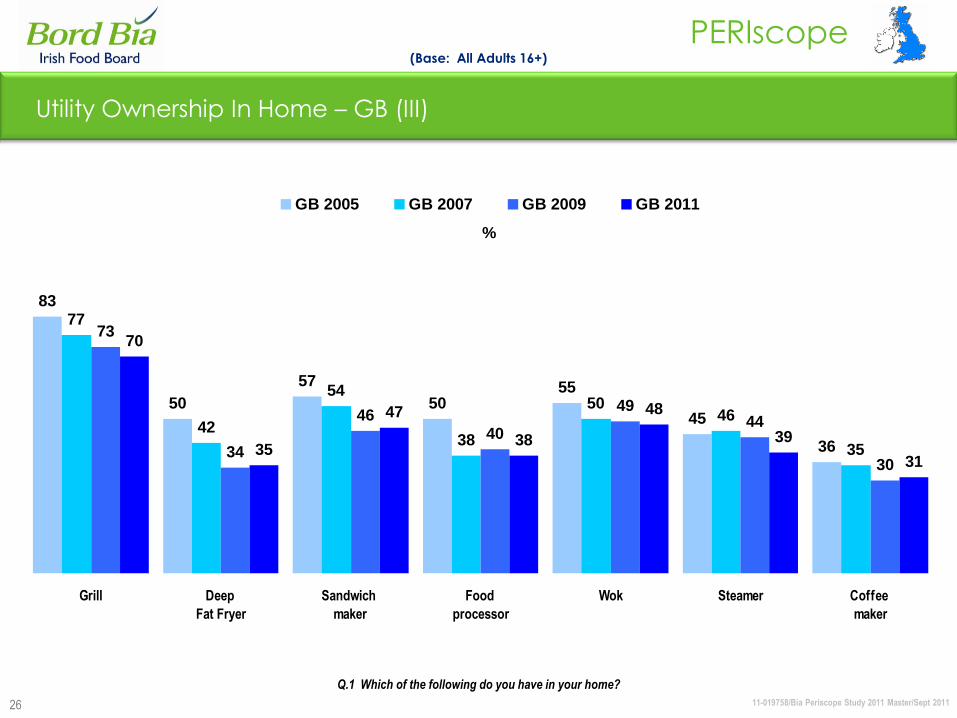
26
(Base: All Adults 16+)
Utility Ownership In Home – GB (III)
83
50
57
5055
45
36
77
42
54
38
5046
35
73
34
4640
4944
30
70
35
47
38
48
39
31
Grill Deep
Fat Fryer
Sandwich
maker
Food
processor
Wok Steamer Coffee
maker
GB 2005 GB 2007 GB 2009 GB 2011
%
Q.1 Which of the following do you have in your home?
11-019758/Bia Periscope Study 2011 Master/Sept 2011
PERIscope
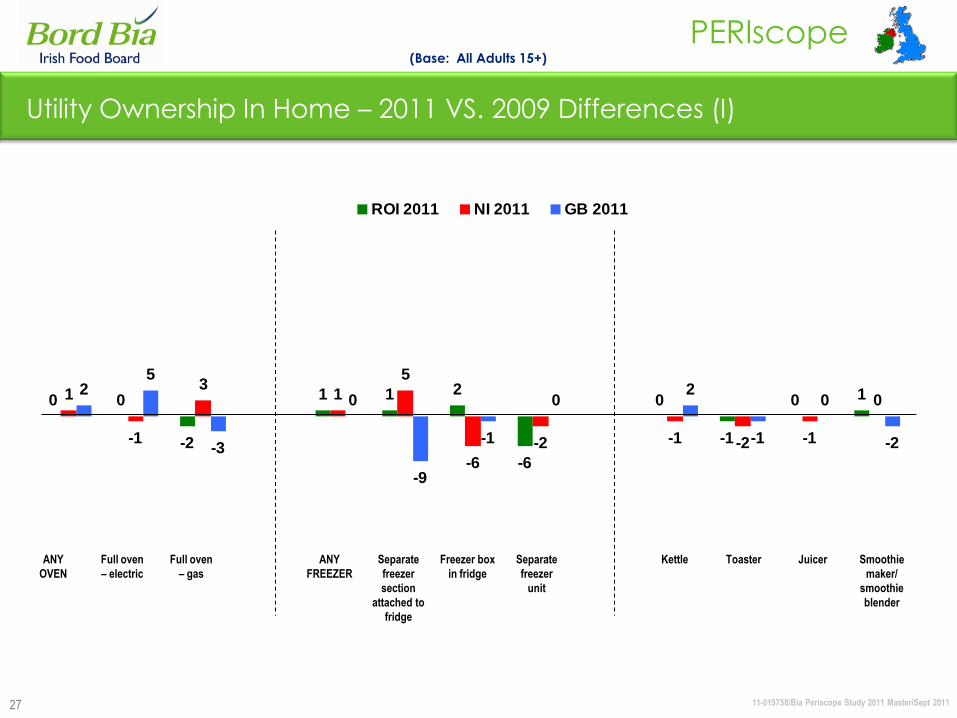
27
0 0
-2
1 1 2
-6
0
-1
0 11
-1
31
5
-6
-2 -1 -2 -1
02
5
-3
0
-9
-1
02
-1
0
-2
ROI 2011 NI 2011 GB 2011
Utility Ownership In Home – 2011 VS. 2009 Differences (I)
(Base: All Adults 15+)
ANY
OVEN
Full oven
– electric
Full oven
– gas
ANY
FREEZER
Separate
freezer
section
attached to
fridge
Freezer box
in fridge
Separate
freezer
unit
Kettle Toaster Juicer Smoothie
maker/
smoothie
blender
11-019758/Bia Periscope Study 2011 Master/Sept 2011
PERIscope
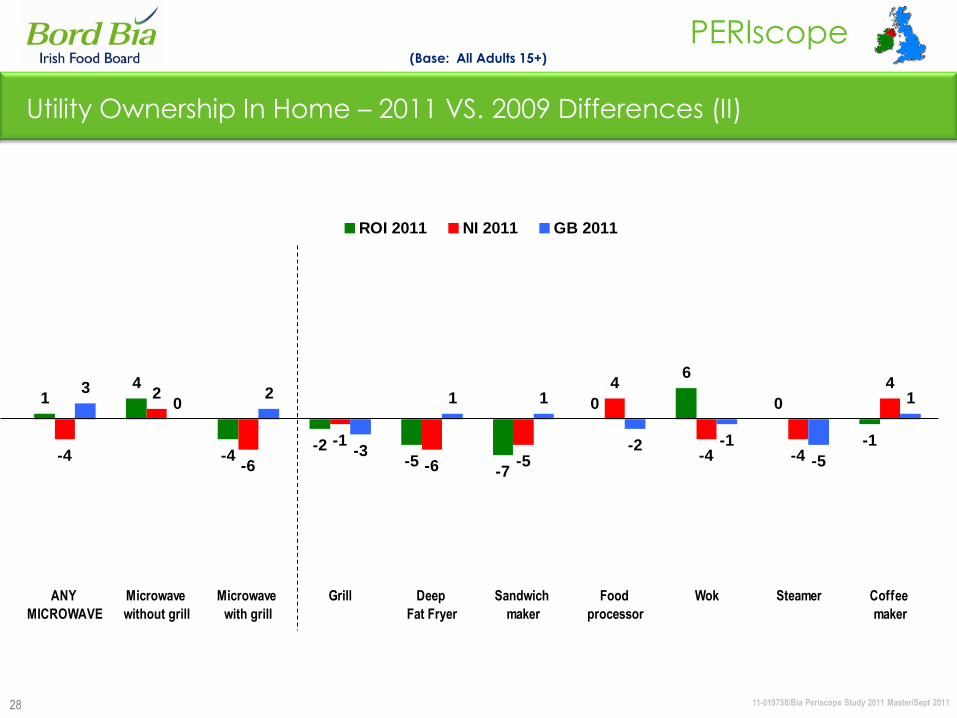
28
14
-4-2
-5-7
0
6
0
-1-4
2
-6
-1
-6 -5
4
-4 -4
430
2
-3
1 1
-2 -1
-5
1
ANY
MICROWAVE
Microwave
without grill
Microwave
with grill
Grill Deep
Fat Fryer
Sandwich
maker
Food
processor
Wok Steamer Coffee
maker
ROI 2011 NI 2011 GB 2011
Utility Ownership In Home – 2011 VS. 2009 Differences (II)
(Base: All Adults 15+)
11-019758/Bia Periscope Study 2011 Master/Sept 2011
PERIscope
29
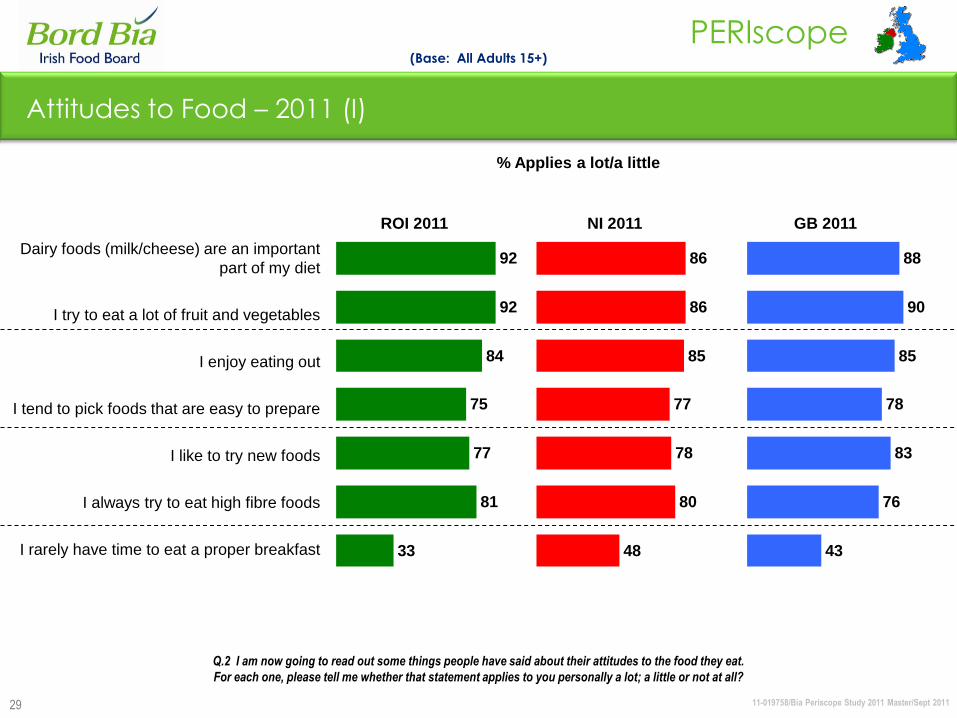
Attitudes to Food – 2011 (I)
92
92
84
75
77
81
33
% Applies a lot/a little
(Base: All Adults 15+)
Dairy foods (milk/cheese) are an important
part of my diet
I try to eat a lot of fruit and vegetables
I enjoy eating out
I tend to pick foods that are easy to prepare
I like to try new foods
I always try to eat high fibre foods
I rarely have time to eat a proper breakfast
Q.2 I am now going to read out some things people have said about their attitudes to the food they eat.
For each one, please tell me whether that statement applies to you personally a lot; a little or not at all?
ROI 2011
86
86
85
77
78
80
48
NI 2011
88
90
85
78
83
76
43
GB 2011
11-019758/Bia Periscope Study 2011 Master/Sept 2011
PERIscope
30
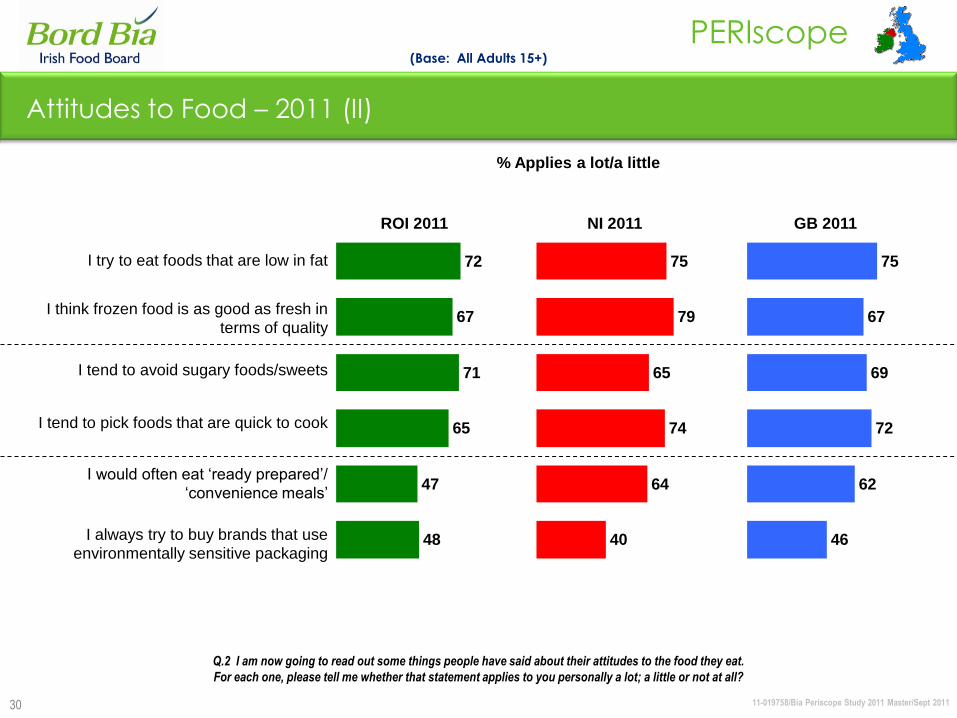
Attitudes to Food – 2011 (II)
(Base: All Adults 15+)
Q.2 I am now going to read out some things people have said about their attitudes to the food they eat.
For each one, please tell me whether that statement applies to you personally a lot; a little or not at all?
% Applies a lot/a little
ROI 2011 NI 2011 GB 2011
72
67
71
65
47
48
75
79
65
74
64
40
75
67
69
72
62
46
I try to eat foods that are low in fat
I think frozen food is as good as fresh in
terms of quality
I tend to avoid sugary foods/sweets
I tend to pick foods that are quick to cook
I would often eat „ready prepared‟/
„convenience meals‟
I always try to buy brands that use
environmentally sensitive packaging
11-019758/Bia Periscope Study 2011 Master/Sept 2011
PERIscope
31
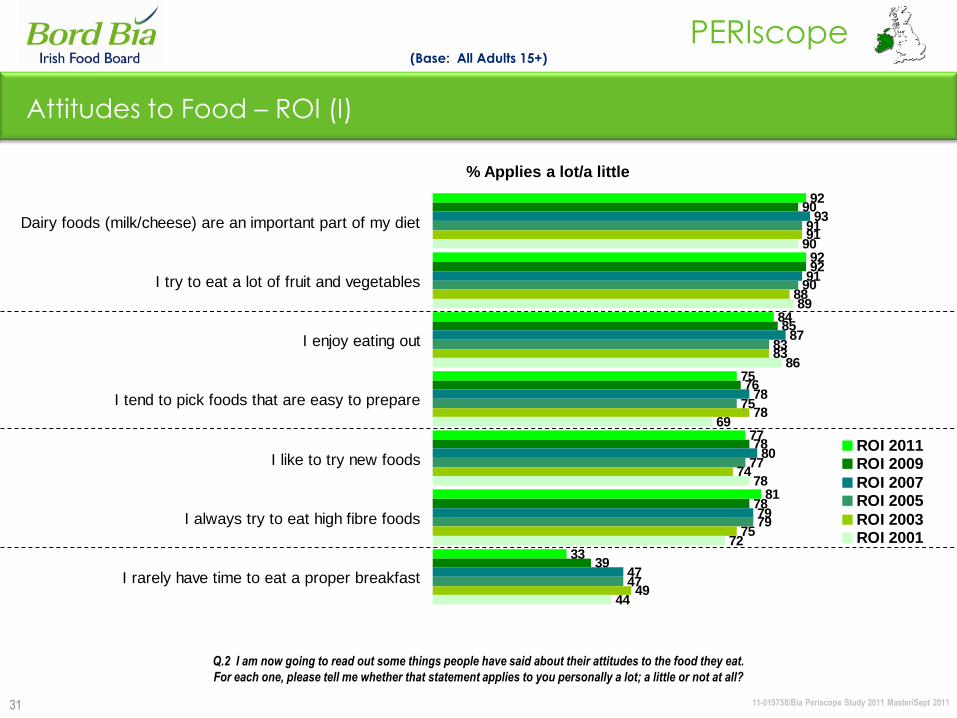
Attitudes to Food – ROI (I)
% Applies a lot/a little
92
92
84
75
77
81
33
90
92
85
76
78
78
39
93
91
87
78
80
79
47
91
90
83
75
77
79
47
91
88
83
78
74
75
49
90
89
86
69
78
72
44
Dairy foods (milk/cheese) are an important part of my diet
I try to eat a lot of fruit and vegetables
I enjoy eating out
I tend to pick foods that are easy to prepare
I like to try new foods
I always try to eat high fibre foods
I rarely have time to eat a proper breakfast
ROI 2011ROI 2009
ROI 2007ROI 2005
ROI 2003ROI 2001
(Base: All Adults 15+)
Q.2 I am now going to read out some things people have said about their attitudes to the food they eat.
For each one, please tell me whether that statement applies to you personally a lot; a little or not at all?
11-019758/Bia Periscope Study 2011 Master/Sept 2011
PERIscope
32
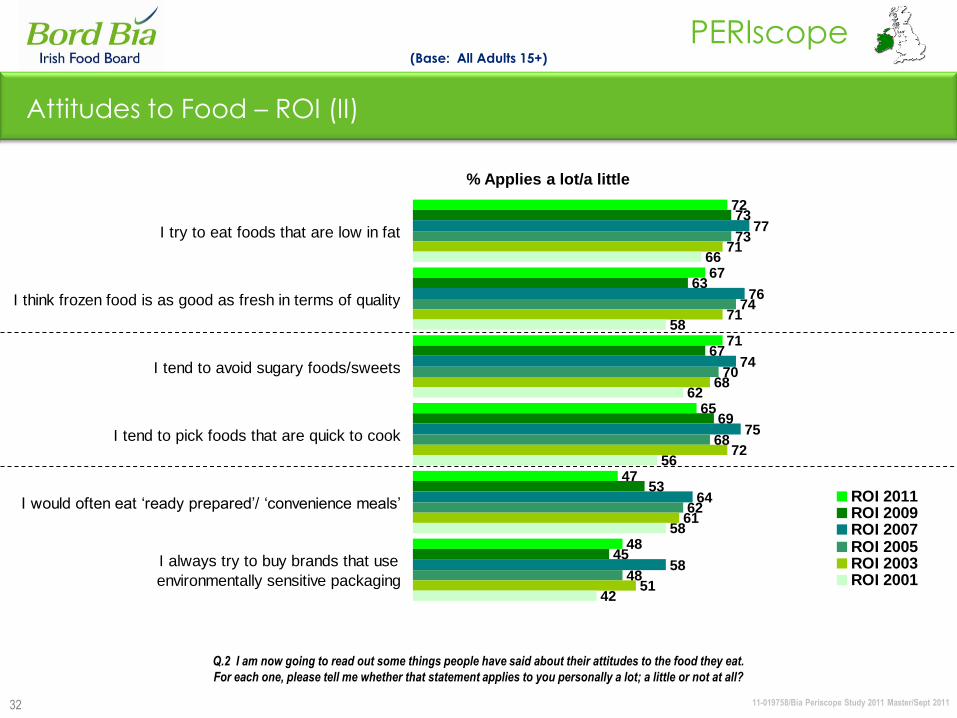
Attitudes to Food – ROI (II)
72
67
71
65
47
48
73
63
67
69
53
45
77
76
74
75
64
58
73
74
70
68
62
48
71
71
68
72
61
51
66
58
62
56
58
42
I try to eat foods that are low in fat
I think frozen food is as good as fresh in terms of quality
I tend to avoid sugary foods/sweets
I tend to pick foods that are quick to cook
I would often eat „ready prepared‟/ „convenience meals‟
I always try to buy brands that use
environmentally sensitive packaging
ROI 2011ROI 2009ROI 2007ROI 2005ROI 2003ROI 2001
(Base: All Adults 15+)
% Applies a lot/a little
Q.2 I am now going to read out some things people have said about their attitudes to the food they eat.
For each one, please tell me whether that statement applies to you personally a lot; a little or not at all?
11-019758/Bia Periscope Study 2011 Master/Sept 2011
PERIscope
33
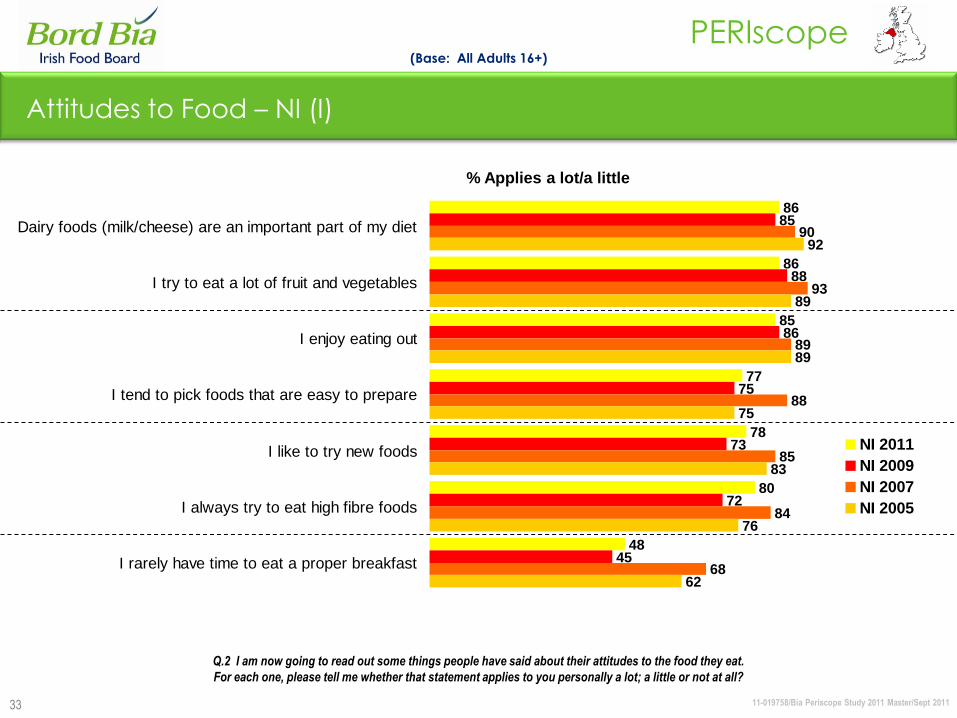
Attitudes to Food – NI (I)
% Applies a lot/a little
86
86
85
77
78
80
48
85
88
86
75
73
72
45
90
93
89
88
85
84
68
92
89
89
75
83
76
62
Dairy foods (milk/cheese) are an important part of my diet
I try to eat a lot of fruit and vegetables
I enjoy eating out
I tend to pick foods that are easy to prepare
I like to try new foods
I always try to eat high fibre foods
I rarely have time to eat a proper breakfast
NI 2011
NI 2009
NI 2007
NI 2005
(Base: All Adults 16+)
Q.2 I am now going to read out some things people have said about their attitudes to the food they eat.
For each one, please tell me whether that statement applies to you personally a lot; a little or not at all?
11-019758/Bia Periscope Study 2011 Master/Sept 2011
PERIscope
34
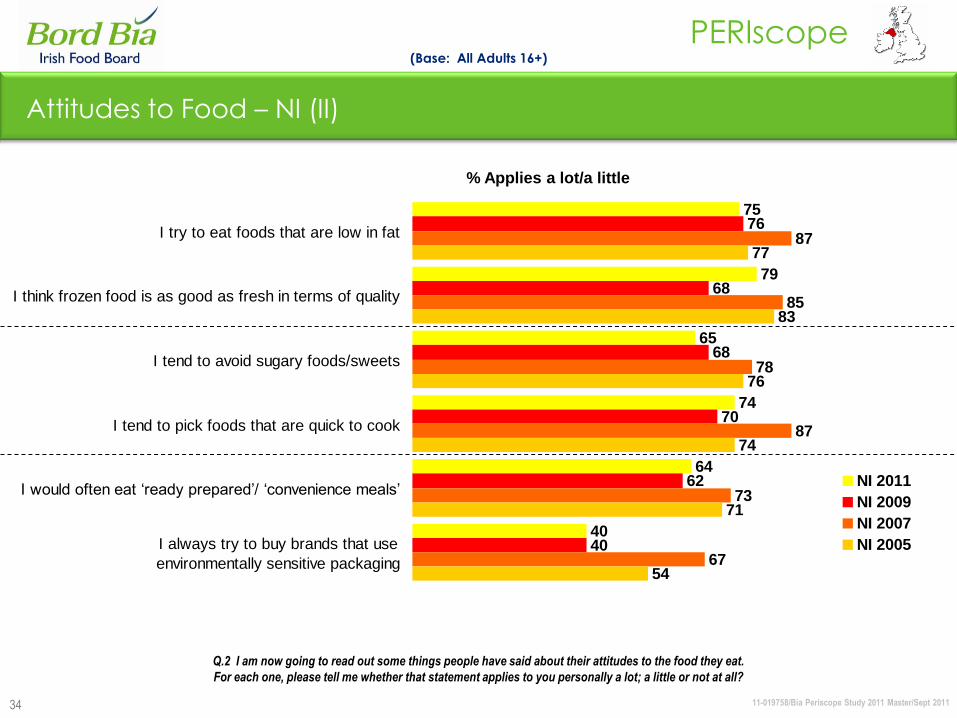
Attitudes to Food – NI (II)
75
79
65
74
64
40
76
68
68
70
62
40
87
85
78
87
73
67
77
83
76
74
71
54
I try to eat foods that are low in fat
I think frozen food is as good as fresh in terms of quality
I tend to avoid sugary foods/sweets
I tend to pick foods that are quick to cook
I would often eat „ready prepared‟/ „convenience meals‟
I always try to buy brands that use
environmentally sensitive packaging
NI 2011
NI 2009
NI 2007
NI 2005
(Base: All Adults 16+)
% Applies a lot/a little
Q.2 I am now going to read out some things people have said about their attitudes to the food they eat.
For each one, please tell me whether that statement applies to you personally a lot; a little or not at all?
11-019758/Bia Periscope Study 2011 Master/Sept 2011
PERIscope
35
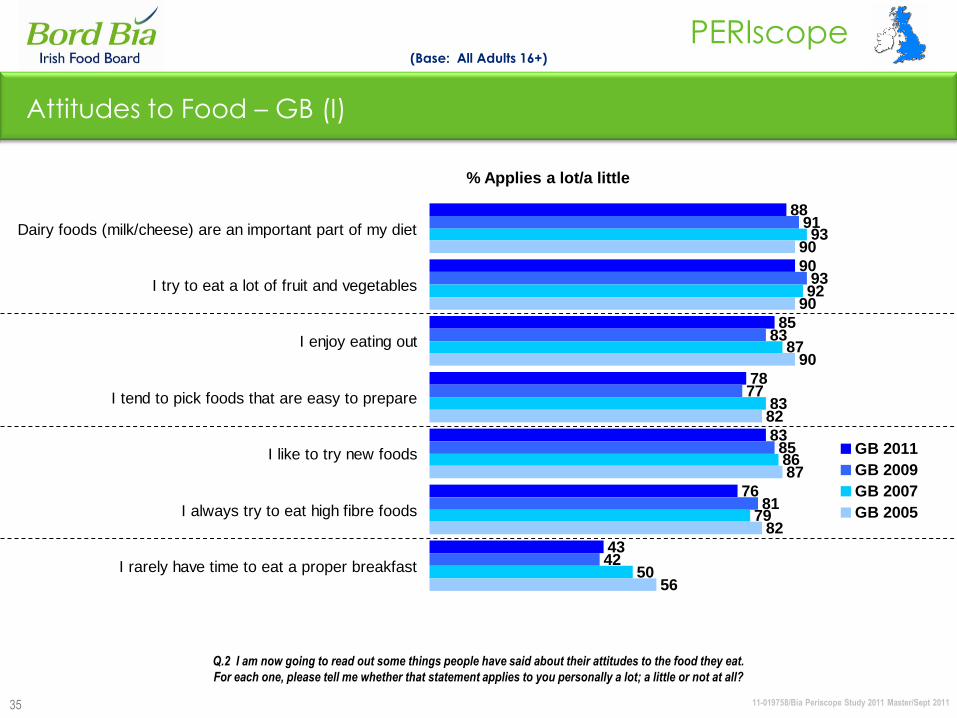
Attitudes to Food – GB (I)
% Applies a lot/a little
88
90
85
78
83
76
43
91
93
83
77
85
81
42
93
92
87
83
86
79
50
90
90
90
82
87
82
56
Dairy foods (milk/cheese) are an important part of my diet
I try to eat a lot of fruit and vegetables
I enjoy eating out
I tend to pick foods that are easy to prepare
I like to try new foods
I always try to eat high fibre foods
I rarely have time to eat a proper breakfast
GB 2011
GB 2009
GB 2007
GB 2005
(Base: All Adults 16+)
Q.2 I am now going to read out some things people have said about their attitudes to the food they eat.
For each one, please tell me whether that statement applies to you personally a lot; a little or not at all?
11-019758/Bia Periscope Study 2011 Master/Sept 2011
PERIscope
36
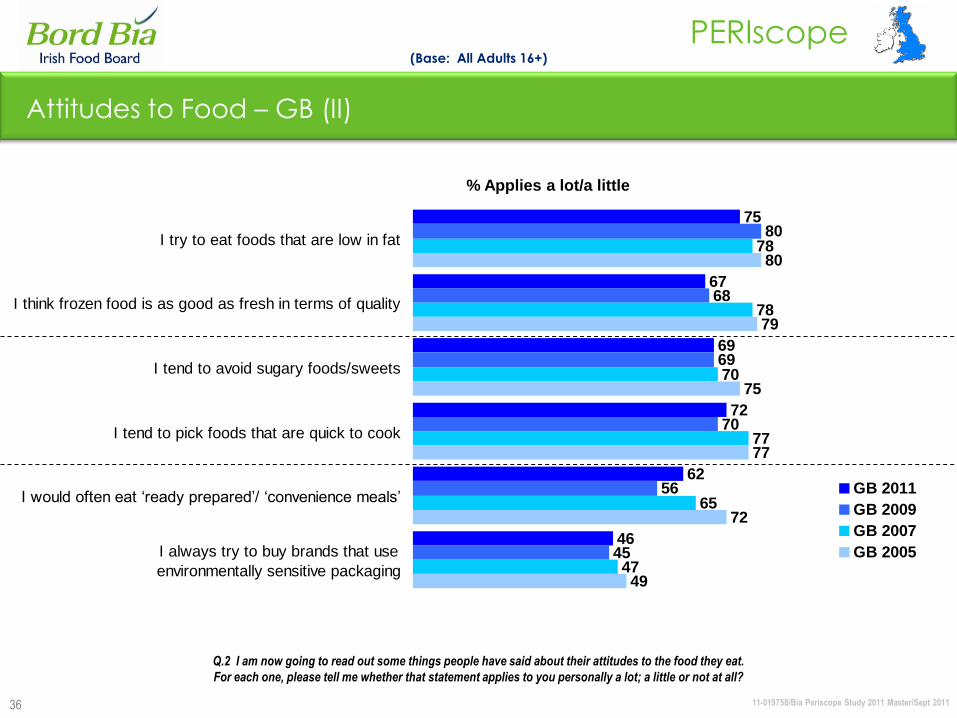
Attitudes to Food – GB (II)
75
67
69
72
62
46
80
68
69
70
56
45
78
78
70
77
65
47
80
79
75
77
72
49
I try to eat foods that are low in fat
I think frozen food is as good as fresh in terms of quality
I tend to avoid sugary foods/sweets
I tend to pick foods that are quick to cook
I would often eat „ready prepared‟/ „convenience meals‟
I always try to buy brands that use
environmentally sensitive packaging
GB 2011
GB 2009
GB 2007
GB 2005
(Base: All Adults 16+)
% Applies a lot/a little
Q.2 I am now going to read out some things people have said about their attitudes to the food they eat.
For each one, please tell me whether that statement applies to you personally a lot; a little or not at all?

11-019758/Bia Periscope Study 2011 Master/Sept 2011
PERIscope
37
5 8 6 6
99
8 6
5555
50 51
24 19
22 24
7 813 12
13 9
910
5552
1622
77
ROI 2009
%
ROI 2011
%
NI 2009
%
NI 2011
%
GB 2009
%
GB 2011
%
Frozen food is always better than
chilled food
Frozen food is usually better than
chilled food
About the same
Chilled food is usually better than
frozen food
Chilled food is always better than
frozen food
(Base: All Adults 15+)
Attitudes to Frozen Vs. Chilled Food – 2011 Vs. 2009
New question in 2009
Q.81 Now I would like you to think about frozen and chilled food. By chilled food I mean food that you find in the chilled cabinet
in a supermarket. Which of these phrases best describes your opinion of frozen food and chilled food?
13%
36%
18%
27%
20%
29%
11-019758/Bia Periscope Study 2011 Master/Sept 2011
PERIscope
38
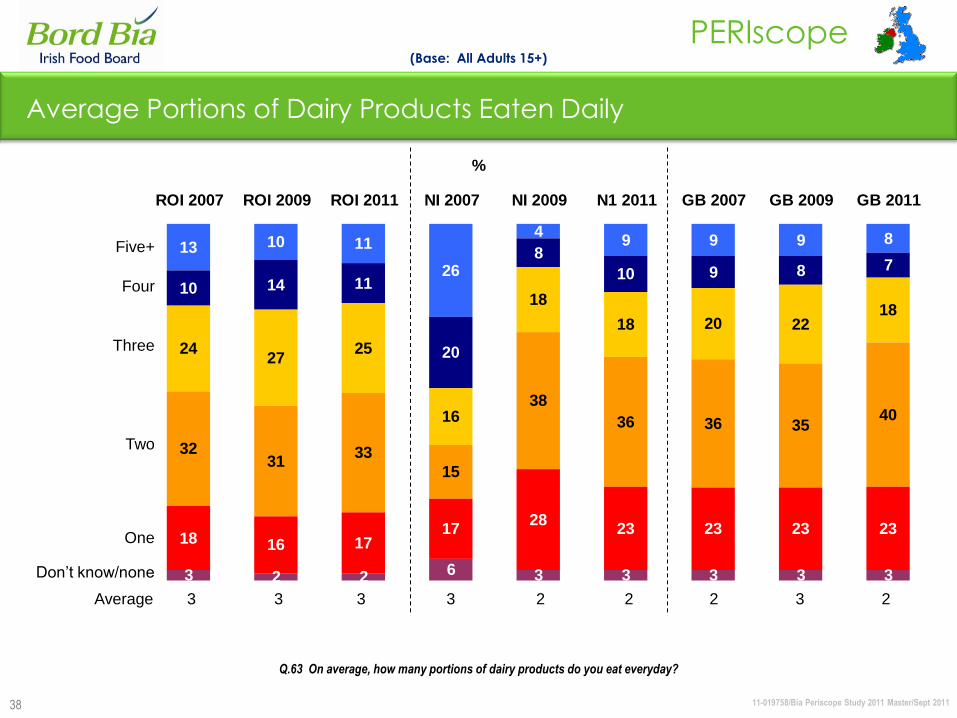
Average Portions of Dairy Products Eaten Daily
(Base: All Adults 15+)
Five+
Four
Three
Two
One
Don‟t know/none
Average 3 3 3 3 2 2 2 3 2
Q.63 On average, how many portions of dairy products do you eat everyday?
%
13 10 11
26
49 9 9 8
10 14 11
20
8
10 9 8 7
2427
25
16
18
18 20 2218
3231
33
15
38
36 36 3540
18 16 1717
2823 23 23 23
3 2 2 6 3 3 3 3 3
ROI 2007 ROI 2009 ROI 2011 NI 2007 NI 2009 N1 2011 GB 2007 GB 2009 GB 2011
11-019758/Bia Periscope Study 2011 Master/Sept 2011
PERIscope
39
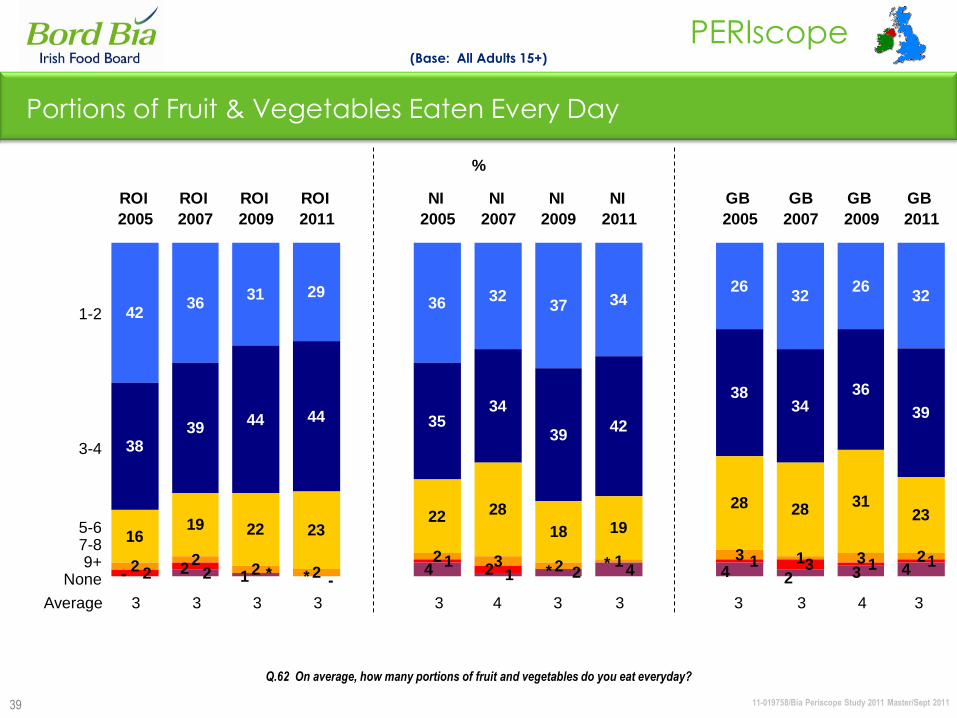
4236
2936 37 34
2632
2632
3839
44 44 3534
3942
3834
36
39
1619 22 23
22 28
18 19
28 2831
23
2 22 2
2 3 2 1 3 1 3 2
3231
1**
22 *131
*21
44-2- 1 324214
ROI
2005
ROI
2007
ROI
2009
ROI
2011
NI
2005
NI
2007
NI
2009
NI
2011
GB
2005
GB
2007
GB
2009
GB
2011
1-2
3-4
5-67-89+
None
%
Portions of Fruit & Vegetables Eaten Every Day
(Base: All Adults 15+)
Average 3 3 3 3 3 4 3 3 3 3 4 3
Q.62 On average, how many portions of fruit and vegetables do you eat everyday?
11-019758/Bia Periscope Study 2011 Master/Sept 2011
PERIscope
40
Ownership Of An Allotment
67
An allotment
Own/rent ….
3
8 8
5
Q.16a Do you currently own or rent an allotment?
New question in 2009
GB
2011
%
ROI
2011
%
NI
2011
%
(Base: All Adults 15+)
GB
2009
%
ROI
2009
%
NI
2009
%
11-019758/Bia Periscope Study 2011 Master/Sept 2011
PERIscope
41
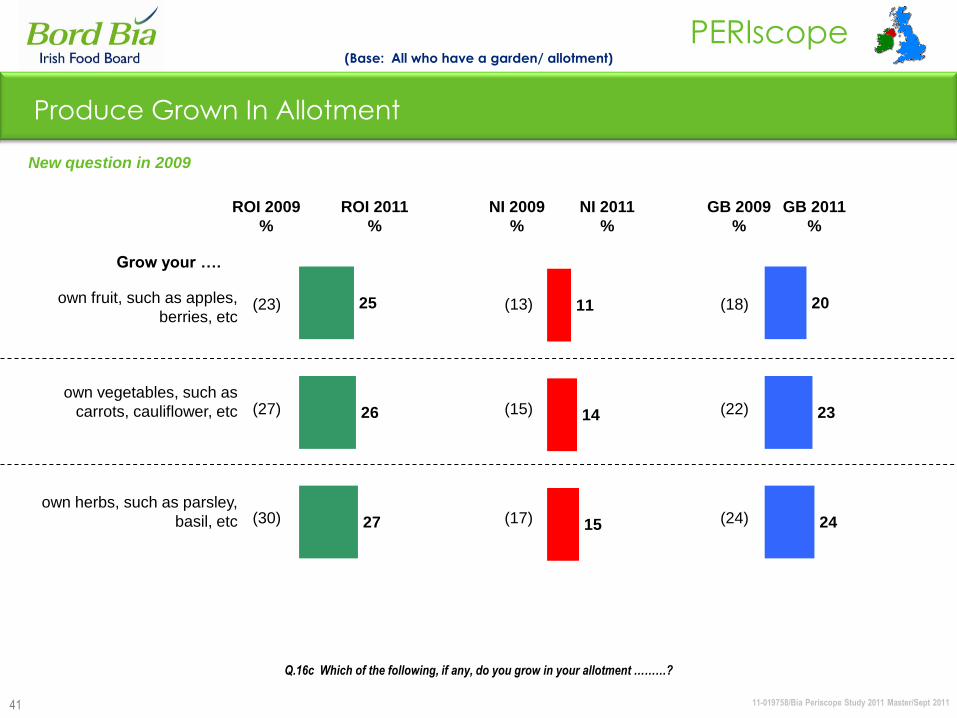
Q.16c Which of the following, if any, do you grow in your allotment ………?
Produce Grown In Allotment
25
26
27
own fruit, such as apples,
berries, etc
own vegetables, such as
carrots, cauliflower, etc
own herbs, such as parsley,
basil, etc
Grow your ….
(Base: All who have a garden/ allotment)
11
14
15
20
23
24
New question in 2009
GB 2011
%
ROI 2011
%
NI 2011
%
GB 2009
%
ROI 2009
%
NI 2009
%
(23)
(27)
(30)
(13)
(15)
(17)
(18)
(22)
(24)

Attitudes Towards Cooking
11-019758/Bia Periscope Study 2011 Master/Sept 2011
PERIscope
43
Attitudes Towards Cooking: Summary
GB has the greatest level of culinary expertise across all three regions, with two thirds of residents claiming that they “would be confident to cook a Sunday roast with all the trimmings/ would enjoy hosting a dinner party where they do all the cooking”
GB has the most positive attitude towards cooking. However, confidence in cooking skills has increased in ROI and NI since 2009.
In addition, a higher proportion of ROI & NI residents are developing their cooking skills even further by attending / taking a cooking class.
The art of cooking is becoming more important in ROI, with the proportion of those cooking a meal from scratch on a daily basis increasing. ROI are also spending more time preparing and cooking the meal.
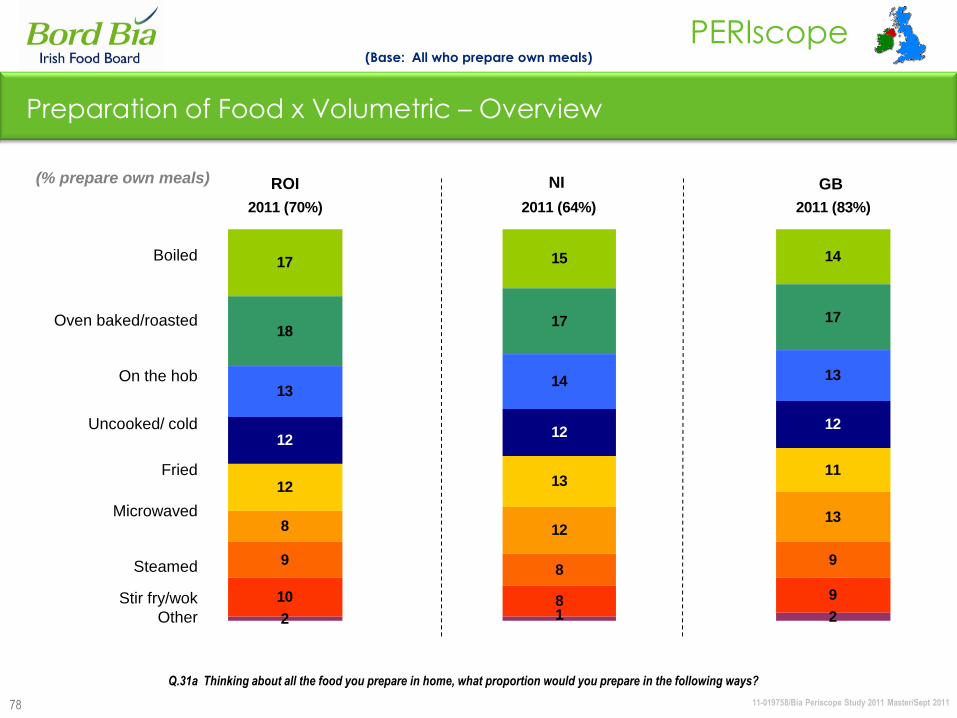
Similar to 2009, the most popular method of preparing food at home would be oven baked/roasted/boiling and on the hob across all three markets.
Convenience meals/ready prepared meals remain popular from a consumption perspective in NI, whereas GB is more likely to always have convenience/ready prepared meals in supply at home.
11-019758/Bia Periscope Study 2011 Master/Sept 2011
PERIscope
44
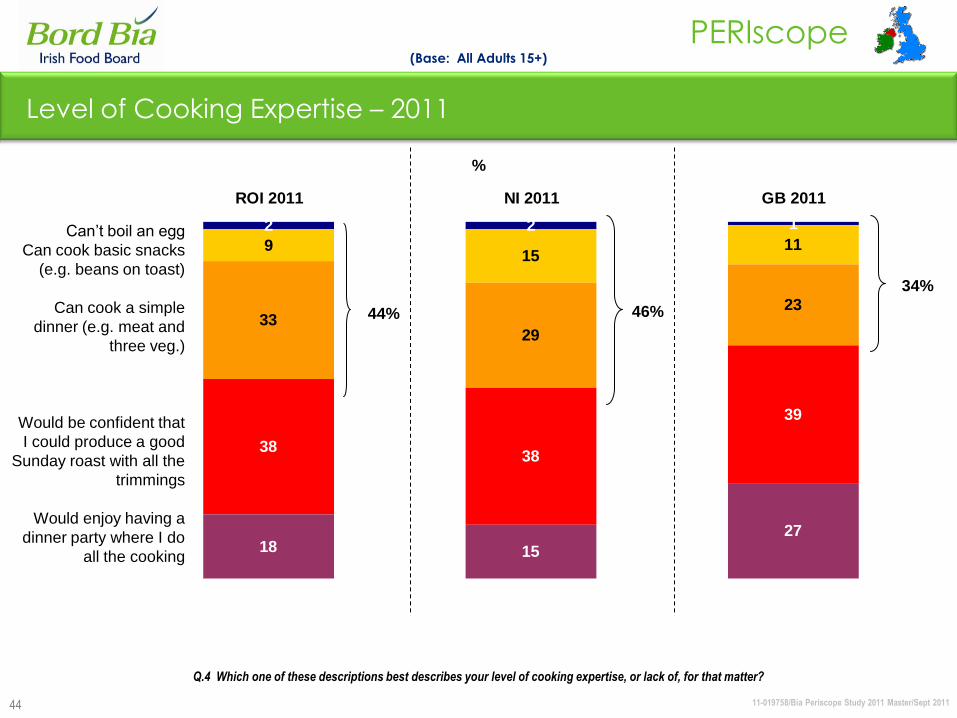
Level of Cooking Expertise – 2011
(Base: All Adults 15+)
2 2 1
915
11
3329
23
3838
39
18 15
27
ROI 2011 NI 2011 GB 2011
Can‟t boil an egg
Can cook basic snacks
(e.g. beans on toast)
Can cook a simple
dinner (e.g. meat and
three veg.)
Would be confident that
I could produce a good
Sunday roast with all the
trimmings
Would enjoy having a
dinner party where I do
all the cooking
%
44% 46%
34%
Q.4 Which one of these descriptions best describes your level of cooking expertise, or lack of, for that matter?
11-019758/Bia Periscope Study 2011 Master/Sept 2011
PERIscope
45
Can‟t boil an egg
Can cook basic snacks
(e.g. beans on toast)
Can cook a simple
dinner (e.g. meat and
three veg.)
Would be confident that
I could produce a good
Sunday roast with all the
trimmings
Would enjoy having a
dinner party where I do
all the cooking
Couldn‟t say
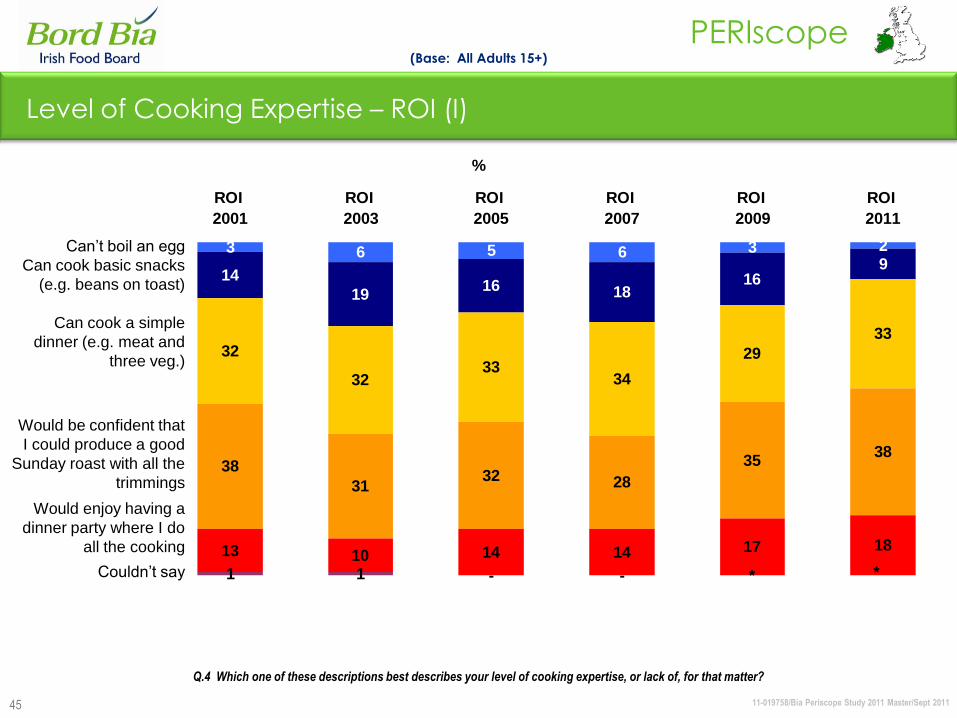
Level of Cooking Expertise – ROI (I)
(Base: All Adults 15+)
%
Q.4 Which one of these descriptions best describes your level of cooking expertise, or lack of, for that matter?
3 6 5 6 3 2
14
1916 18
169
32
3233
34
29
33
38
3132 28
3538
13 10 14 14 17 18
1 1 **--
ROI
2001
ROI
2003
ROI
2005
ROI
2007
ROI
2009
ROI
2011
11-019758/Bia Periscope Study 2011 Master/Sept 2011
PERIscope
46
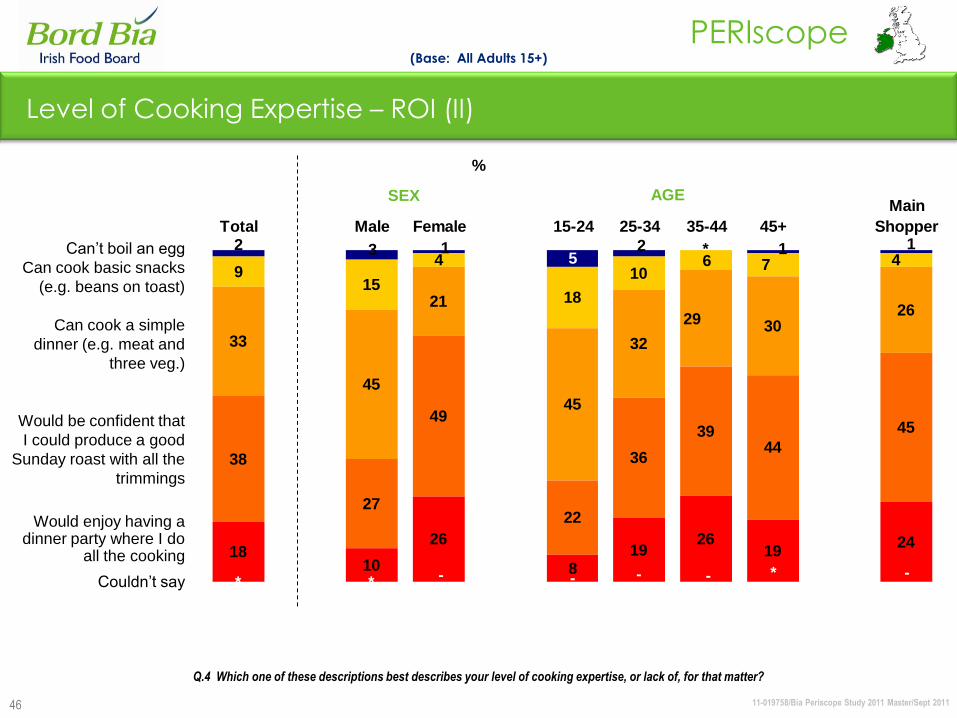
Level of Cooking Expertise – ROI (II)
(Base: All Adults 15+)
Can‟t boil an egg
Can cook basic snacks
(e.g. beans on toast)
Can cook a simple
dinner (e.g. meat and
three veg.)
Would be confident that
I could produce a good
Sunday roast with all the
trimmings
Would enjoy having a dinner party where I do
all the cooking
Couldn‟t say
SEX AGE
%
Q.4 Which one of these descriptions best describes your level of cooking expertise, or lack of, for that matter?
915
4
18
10
33
45
21
45
3230
26
38
27
49
22
36
3944
45
1810
26
819
2619
24
15
32 1*21476
29
-- -*--**
Total Male Female 15-24 25-34 35-44 45+
Main
Shopper
11-019758/Bia Periscope Study 2011 Master/Sept 2011
PERIscope
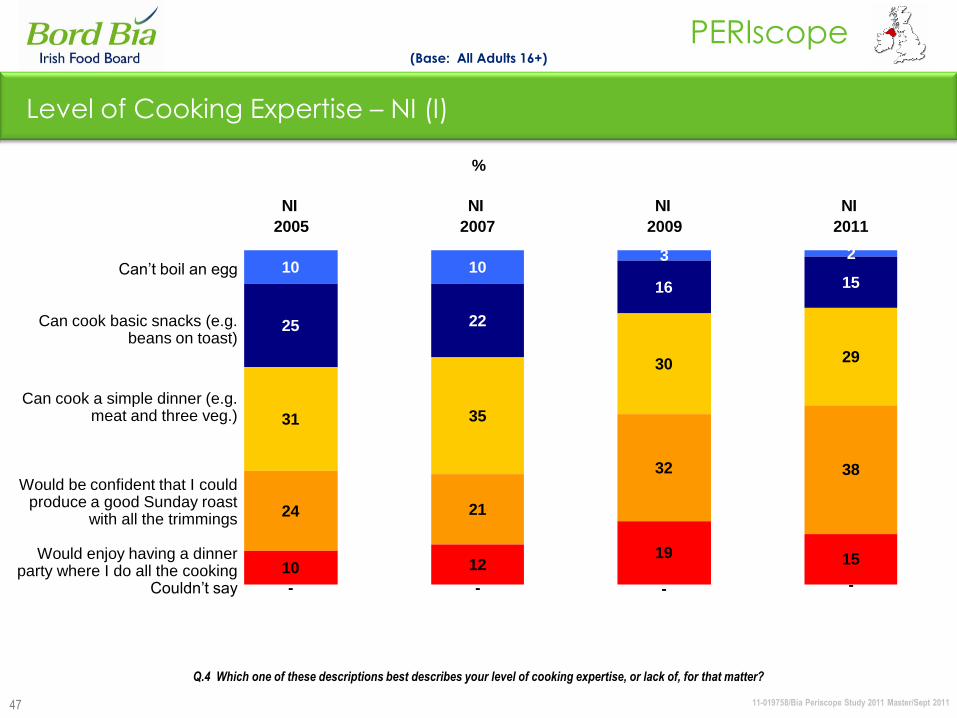
47
10 103 2
25 22
16 15
31 35
30 29
24 21
32 38
10 1219 15
----
NI
2005
NI
2007
NI
2009
NI
2011
Level of Cooking Expertise – NI (I)
(Base: All Adults 16+)
%
Can‟t boil an egg
Can cook basic snacks (e.g. beans on toast)
Can cook a simple dinner (e.g. meat and three veg.)
Would be confident that I could produce a good Sunday roast
with all the trimmings
Would enjoy having a dinner party where I do all the cooking
Couldn‟t say
Q.4 Which one of these descriptions best describes your level of cooking expertise, or lack of, for that matter?
11-019758/Bia Periscope Study 2011 Master/Sept 2011
PERIscope
48
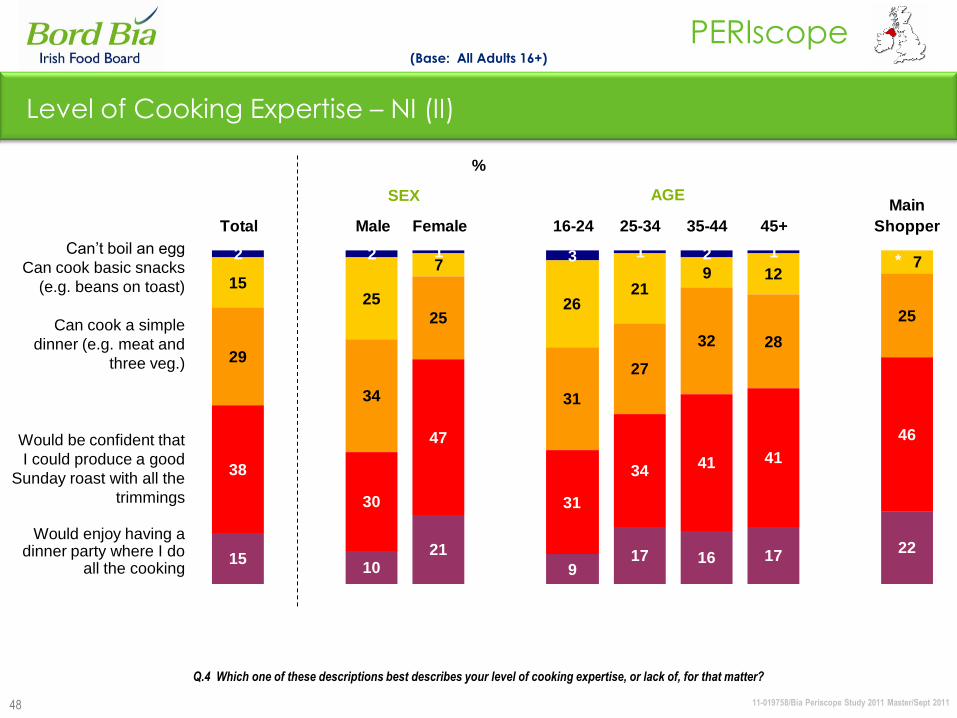
Level of Cooking Expertise – NI (II)
(Base: All Adults 16+)
Q.4 Which one of these descriptions best describes your level of cooking expertise, or lack of, for that matter?
2 2 1 3 1 2 1
1525
7
2621
9 12
29
34
25
31
27
32 28
25
38
30
47
31
3441 41
46
1510
21
917 16 17
22
* 7
Total Male Female 16-24 25-34 35-44 45+
Main
Shopper
Can‟t boil an egg
Can cook basic snacks
(e.g. beans on toast)
Can cook a simple
dinner (e.g. meat and
three veg.)
Would be confident that
I could produce a good
Sunday roast with all the
trimmings
Would enjoy having a dinner party where I do
all the cooking
SEX AGE
%
11-019758/Bia Periscope Study 2011 Master/Sept 2011
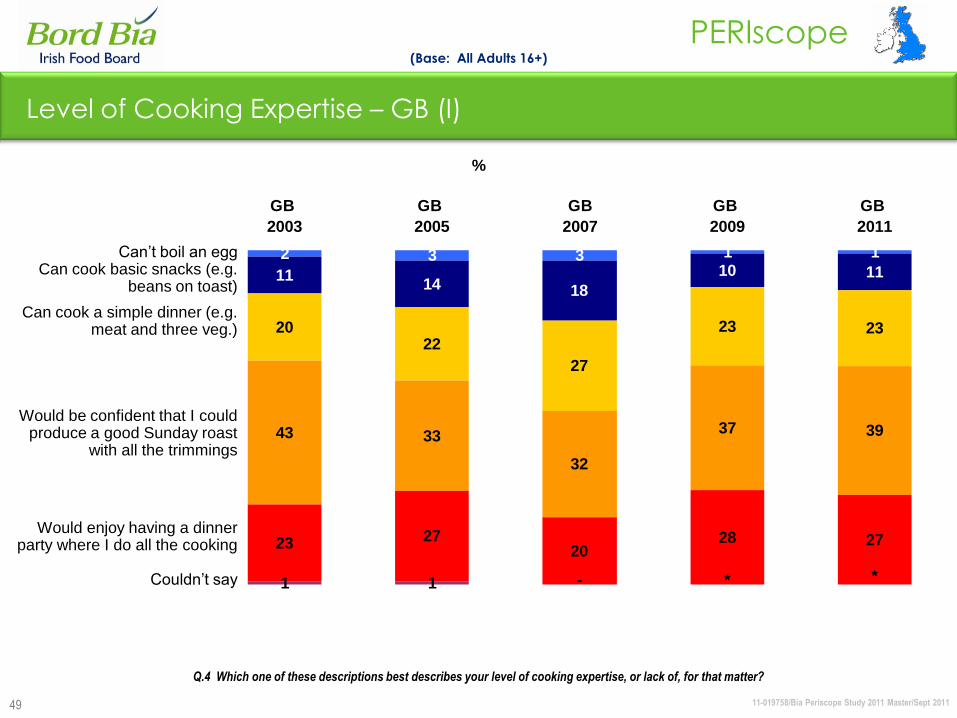
PERIscope
49
Can‟t boil an eggCan cook basic snacks (e.g.
beans on toast)
Can cook a simple dinner (e.g. meat and three veg.)
Would be confident that I could produce a good Sunday roast
with all the trimmings
Would enjoy having a dinner party where I do all the cooking
Couldn‟t say
2 3 3 1 1
1114 18
10 11
2022
27
23 23
43 33
32
37 39
23 2720
28 27
1 1 **-
GB
2003
GB
2005
GB
2007
GB
2009
GB
2011
Level of Cooking Expertise – GB (I)
(Base: All Adults 16+)
%
Q.4 Which one of these descriptions best describes your level of cooking expertise, or lack of, for that matter?
11-019758/Bia Periscope Study 2011 Master/Sept 2011
PERIscope
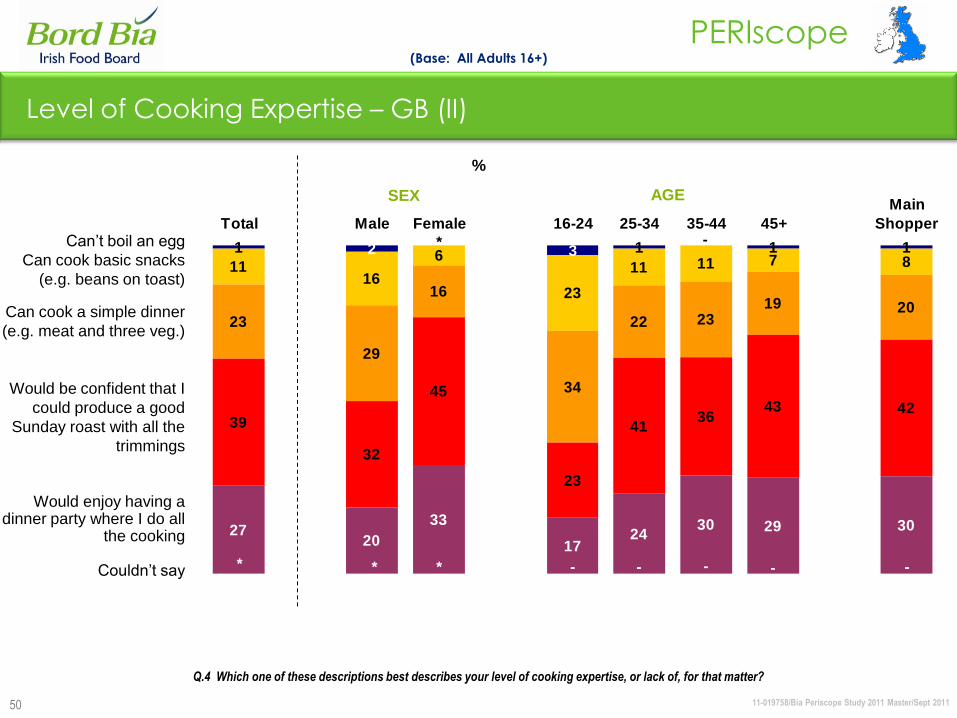
50
Level of Cooking Expertise – GB (II)
(Base: All Adults 16+)
Q.4 Which one of these descriptions best describes your level of cooking expertise, or lack of, for that matter?
1 1 1 1
1116
6
23
11 11 7 8
23
29
16
34
22 2319 20
39
32
45
23
4136
43 42
2720
33
1724
30 29 30
-*2 3
-----***
Total Male Female 16-24 25-34 35-44 45+
Main
ShopperCan‟t boil an egg
Can cook basic snacks
(e.g. beans on toast)
Can cook a simple dinner
(e.g. meat and three veg.)
Would be confident that I
could produce a good
Sunday roast with all the
trimmings
Would enjoy having a dinner party where I do all
the cooking
Couldn‟t say
SEX AGE
%
11-019758/Bia Periscope Study 2011 Master/Sept 2011
PERIscope
51
%
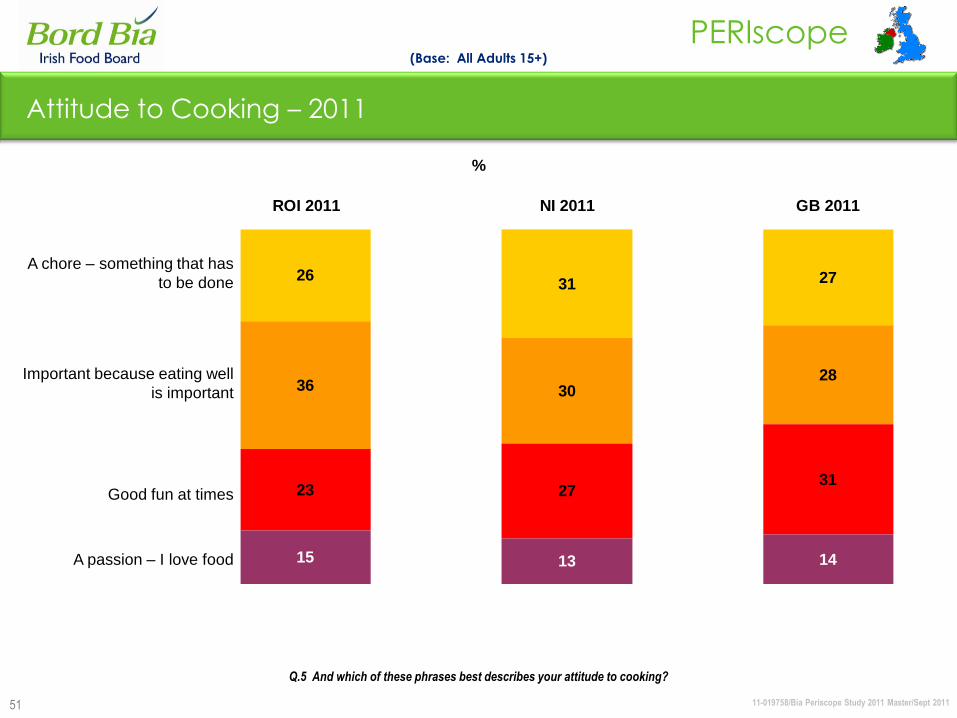
Attitude to Cooking – 2011
(Base: All Adults 15+)
Q.5 And which of these phrases best describes your attitude to cooking?
A chore – something that has
to be done
Important because eating well
is important
Good fun at times
A passion – I love food
2631 27
36 3028
23 2731
15 13 14
ROI 2011 NI 2011 GB 2011

11-019758/Bia Periscope Study 2011 Master/Sept 2011
PERIscope
52
3343 39 40
3126
38
3334 33
3136
2217 20 19
26 23
5 6 6 8 12 15
2 1 1 **-
ROI
2001
ROI
2003
ROI
2005
ROI
2007
ROI
2009
ROI
2011
%
Attitude to Cooking – ROI (I)
23% 26% 27%
(Base: All Adults 15+)
A chore – something that has
to be done
Important because eating well
is important
Good fun at times
A passion – I love food
Don‟t know
Q.5 And which of these phrases best describes your attitude to cooking?
38%27%
38%

11-019758/Bia Periscope Study 2011 Master/Sept 2011
PERIscope
53
2633
19
3427
22 25 20
51
36
34
38
23 34
31
44
38
19
2320
26 31 22
26
21
25
18
15 12 17 13 1722
1117 12
--*----**
Total Male Female 15-24 25-34 35-44 45+
Main
Shopper
Eating
Out
More
Attitude to Cooking – ROI (II)
(Base: All Adults 15+)
%
A chore – something
that has to be done
Important because
eating well is important
Good fun at times
A passion – I love food
Don‟t know
SEX AGE
Q.5 And which of these phrases best describes your attitude to cooking?
11-019758/Bia Periscope Study 2011 Master/Sept 2011
PERIscope
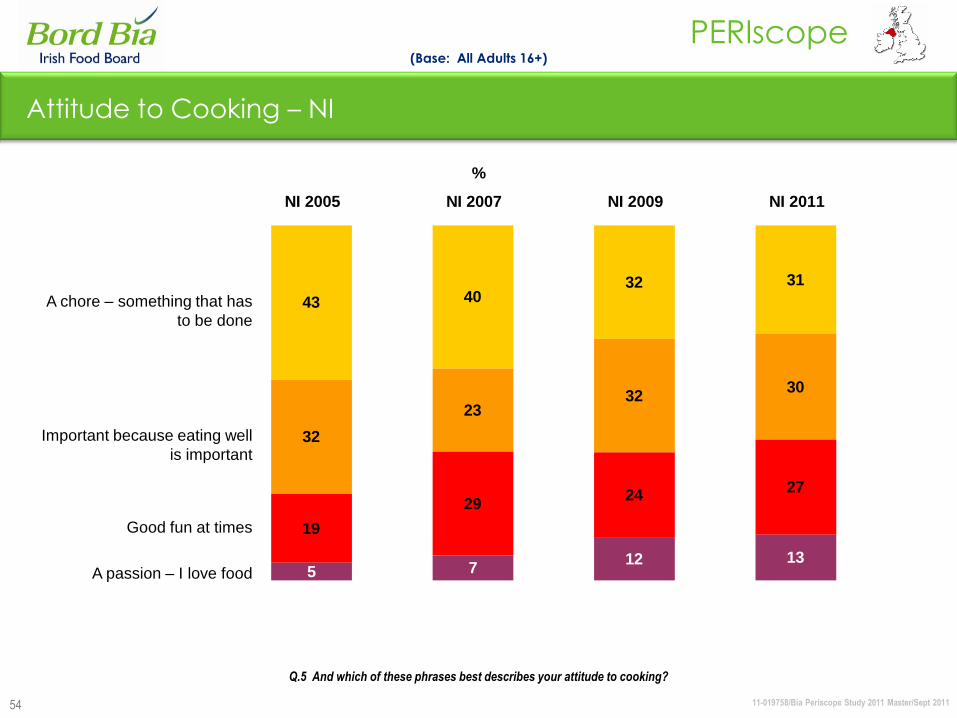
54
Attitude to Cooking – NI
43 4032 31
32
2332
30
19
2924
27
5 712 13
NI 2005 NI 2007 NI 2009 NI 2011
%
(Base: All Adults 16+)
Q.5 And which of these phrases best describes your attitude to cooking?
A chore – something that has
to be done
Important because eating well
is important
Good fun at times
A passion – I love food

11-019758/Bia Periscope Study 2011 Master/Sept 2011
PERIscope
55
3140
22
34 3227 30
23
44
30
25
34
3128
33 29
29
23
2724
30
2524 27 28
31
24
13 11 15 1115 13 13 17
9
Total Male Female 16-24 25-34 35-44 45+
Main
Shopper
Eating
Out More
Attitude to Cooking – NI (II)
(Base: All Adults 16+)
%
A chore – something
that has to be done
Important because
eating well is important
Good fun at times
A passion – I love food
SEX AGE
Q.5 And which of these phrases best describes your attitude to cooking?
11-019758/Bia Periscope Study 2011 Master/Sept 2011
PERIscope
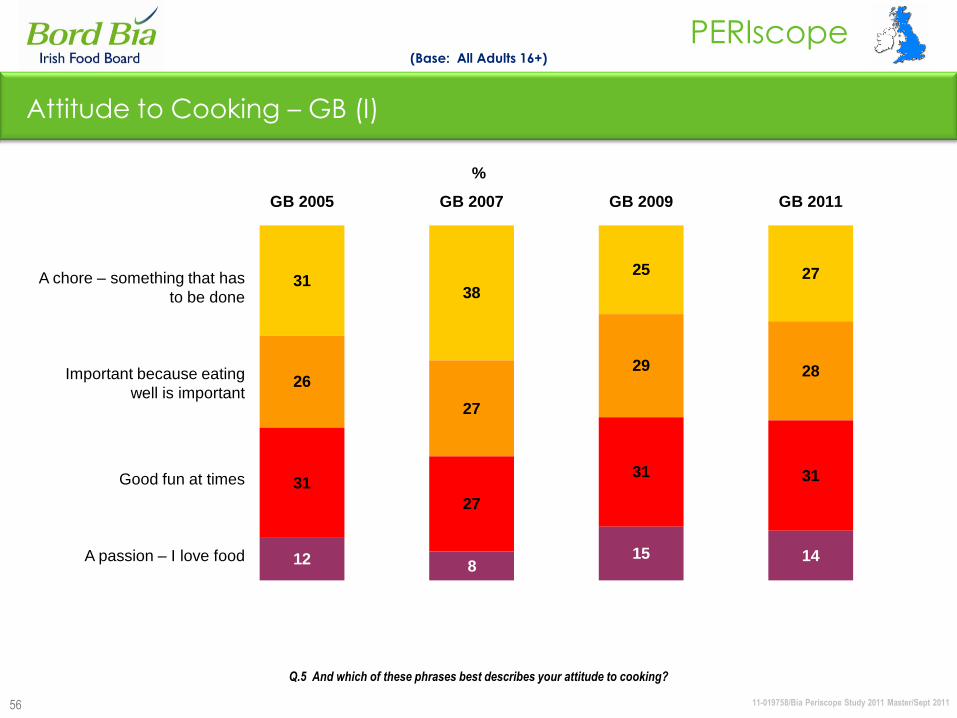
56
Attitude to Cooking – GB (I)
%
A chore – something that has
to be done
Important because eating
well is important
Good fun at times
A passion – I love food
3138
25 27
26
27
29 28
31
27
31 31
12 815 14
GB 2005 GB 2007 GB 2009 GB 2011
Q.5 And which of these phrases best describes your attitude to cooking?
(Base: All Adults 16+)
11-019758/Bia Periscope Study 2011 Master/Sept 2011
PERIscope
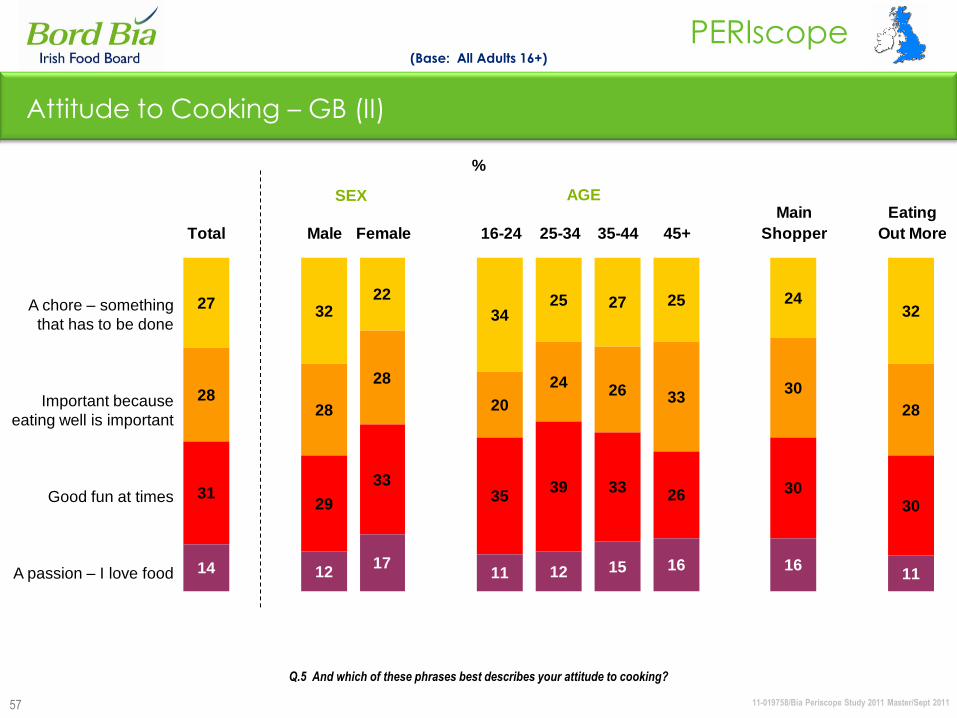
57
2732
22
3425 27 25 24
32
2828
28
20
2426 33
30
28
3129
3335
39 3326 30
30
14 1217
11 12 15 16 1611
Total Male Female 16-24 25-34 35-44 45+
Main
Shopper
Eating
Out More
Attitude to Cooking – GB (II)
(Base: All Adults 16+)
%
A chore – something
that has to be done
Important because
eating well is important
Good fun at times
A passion – I love food
SEX AGE
Q.5 And which of these phrases best describes your attitude to cooking?
11-019758/Bia Periscope Study 2011 Master/Sept 2011
PERIscope
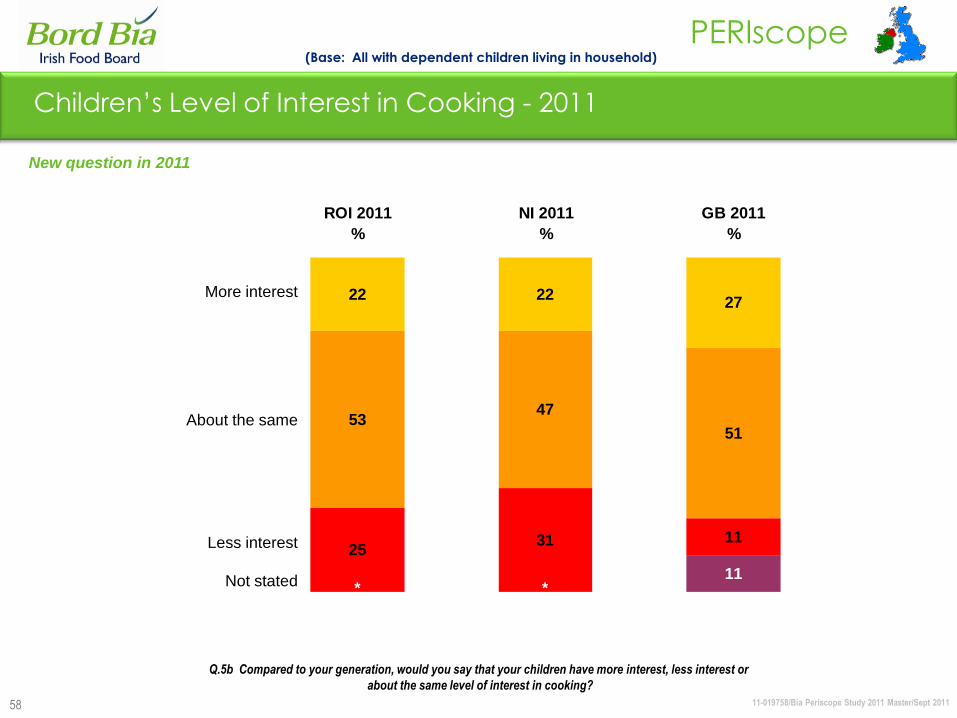
58
27
51
11
11
22 22
5347
2531
**
ROI 2011
%
NI 2011
%
GB 2011
%
More interest
About the same
Less interest
Not stated
(Base: All with dependent children living in household)
Children‟s Level of Interest in Cooking - 2011
New question in 2011
Q.5b Compared to your generation, would you say that your children have more interest, less interest or
about the same level of interest in cooking?
11-019758/Bia Periscope Study 2011 Master/Sept 2011
PERIscope
59
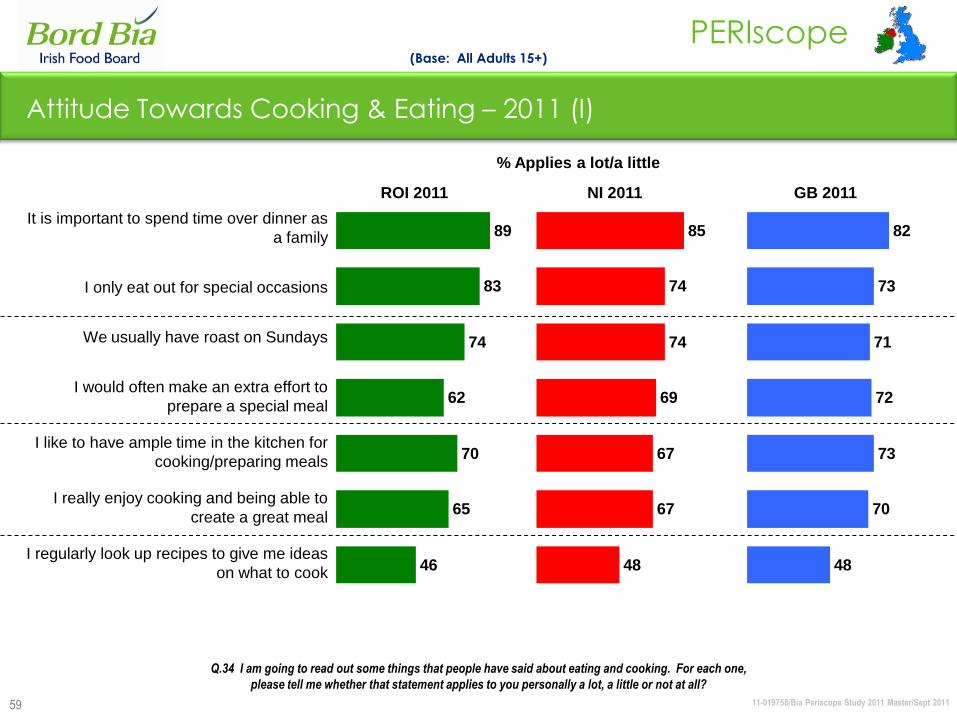
Attitude Towards Cooking & Eating – 2011 (I)
It is important to spend time over dinner as
a family
I only eat out for special occasions
We usually have roast on Sundays
I would often make an extra effort to
prepare a special meal
I like to have ample time in the kitchen for
cooking/preparing meals
I really enjoy cooking and being able to
create a great meal
I regularly look up recipes to give me ideas
on what to cook
Q.34 I am going to read out some things that people have said about eating and cooking. For each one,
please tell me whether that statement applies to you personally a lot, a little or not at all?
(Base: All Adults 15+)
% Applies a lot/a little
ROI 2011 NI 2011 GB 2011
89
83
74
62
70
65
46
85
74
74
69
67
67
48
82
73
71
72
73
70
48

11-019758/Bia Periscope Study 2011 Master/Sept 2011
PERIscope
60
Attitude Towards Cooking & Eating – 2011 (II)
Q.34 I am going to read out some things that people have said about eating and cooking. For each one,
please tell me whether that statement applies to you personally a lot, a little or not at all?
I don‟t like spending too much time on
cooking
I buy hot food from deli counters in
shops/supermarkets
I eat prepared sandwiches/rolls from deli
counters and shops
What I‟m going to have for dinner is very
often a last minute choice
I‟m too busy to cook meals as often as I
would like
We use a lot of ready to eat foods in our
household
Cooking is something I have to do, not
something I enjoy
There was too much time spent
cooking/preparing food in my parents‟ time
It‟s often hard to get everyone in the
household to sit down together for a meal
(Base: All Adults 15+)
% Applies a lot/a little
ROI 2011 NI 2011 GB 2011
59
45
44
51
40
37
55
40
49
57
60
60
55
52
58
56
47
50
59
51
52
59
41
55
55
52
42
11-019758/Bia Periscope Study 2011 Master/Sept 2011
PERIscope
61
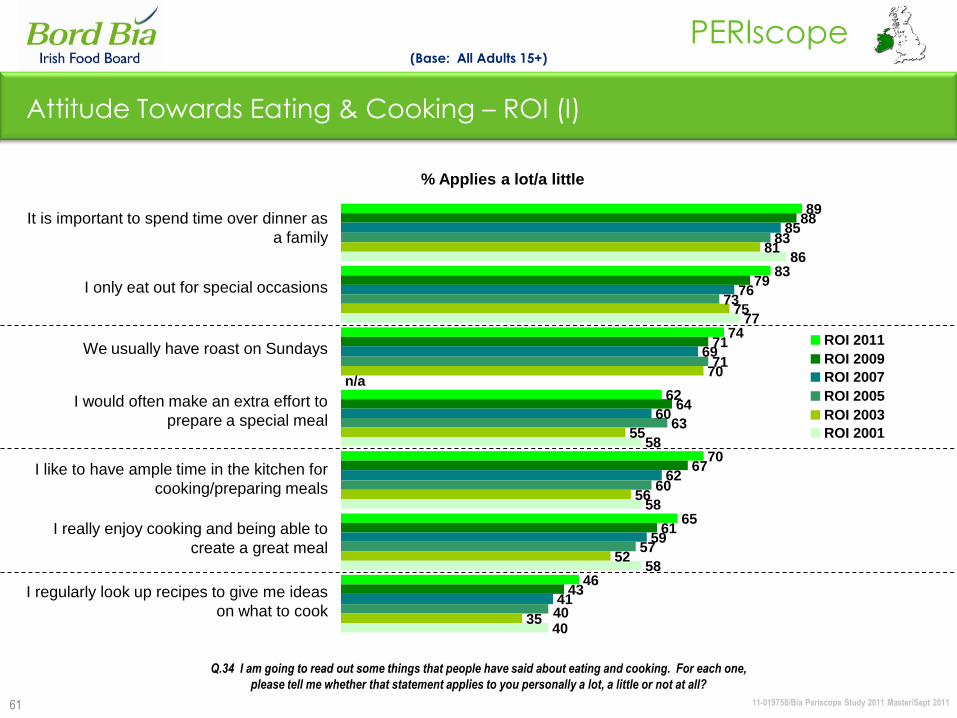
Attitude Towards Eating & Cooking – ROI (I)
Q.34 I am going to read out some things that people have said about eating and cooking. For each one,
please tell me whether that statement applies to you personally a lot, a little or not at all?
(Base: All Adults 15+)
89
83
74
62
70
65
46
88
79
71
64
67
61
43
85
76
69
60
62
59
41
83
73
71
63
60
57
81
75
70
55
56
52
35
86
77
58
58
58
4040
n/a
ROI 2011
ROI 2009
ROI 2007
ROI 2005
ROI 2003
ROI 2001
% Applies a lot/a little
It is important to spend time over dinner as
a family
I only eat out for special occasions
We usually have roast on Sundays
I would often make an extra effort to
prepare a special meal
I like to have ample time in the kitchen for
cooking/preparing meals
I really enjoy cooking and being able to
create a great meal
I regularly look up recipes to give me ideas
on what to cook
11-019758/Bia Periscope Study 2011 Master/Sept 2011
PERIscope
62
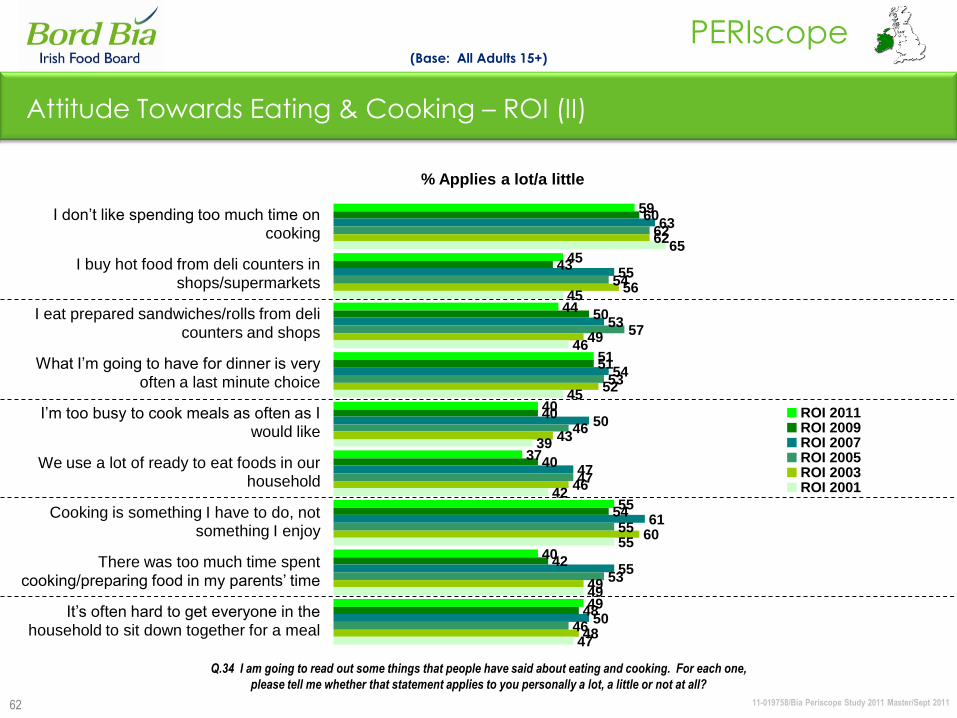
Attitude Towards Eating & Cooking – ROI (II)
Q.34 I am going to read out some things that people have said about eating and cooking. For each one,
please tell me whether that statement applies to you personally a lot, a little or not at all?
(Base: All Adults 15+)
% Applies a lot/a little
I don‟t like spending too much time on cooking
I buy hot food from deli counters in shops/supermarkets
I eat prepared sandwiches/rolls from deli counters and shops
What I‟m going to have for dinner is very often a last minute choice
I‟m too busy to cook meals as often as I would like
We use a lot of ready to eat foods in our household
Cooking is something I have to do, not something I enjoy
There was too much time spent cooking/preparing food in my parents‟ time
It‟s often hard to get everyone in the household to sit down together for a meal
59
45
44
51
40
37
55
40
49
60
43
50
51
40
40
54
42
48
63
55
53
54
50
47
61
55
50
62
54
57
53
46
47
55
53
46
62
56
49
52
43
46
60
49
48
65
45
46
45
39
42
55
49
47
ROI 2011ROI 2009ROI 2007ROI 2005ROI 2003ROI 2001
11-019758/Bia Periscope Study 2011 Master/Sept 2011
PERIscope
63
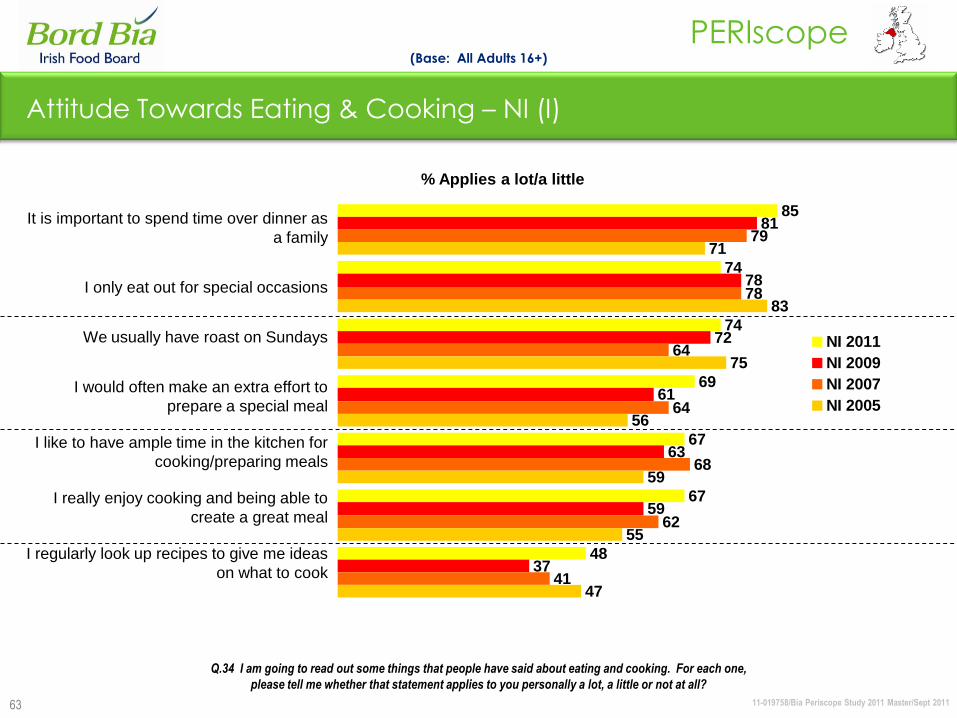
Attitude Towards Eating & Cooking – NI (I)
Q.34 I am going to read out some things that people have said about eating and cooking. For each one,
please tell me whether that statement applies to you personally a lot, a little or not at all?
(Base: All Adults 16+)
85
74
74
69
67
67
48
81
78
72
61
63
59
37
79
78
64
64
68
62
41
71
83
75
56
59
55
47
NI 2011
NI 2009
NI 2007
NI 2005
% Applies a lot/a little
It is important to spend time over dinner as
a family
I only eat out for special occasions
We usually have roast on Sundays
I would often make an extra effort to
prepare a special meal
I like to have ample time in the kitchen for
cooking/preparing meals
I really enjoy cooking and being able to
create a great meal
I regularly look up recipes to give me ideas
on what to cook
11-019758/Bia Periscope Study 2011 Master/Sept 2011
PERIscope
64
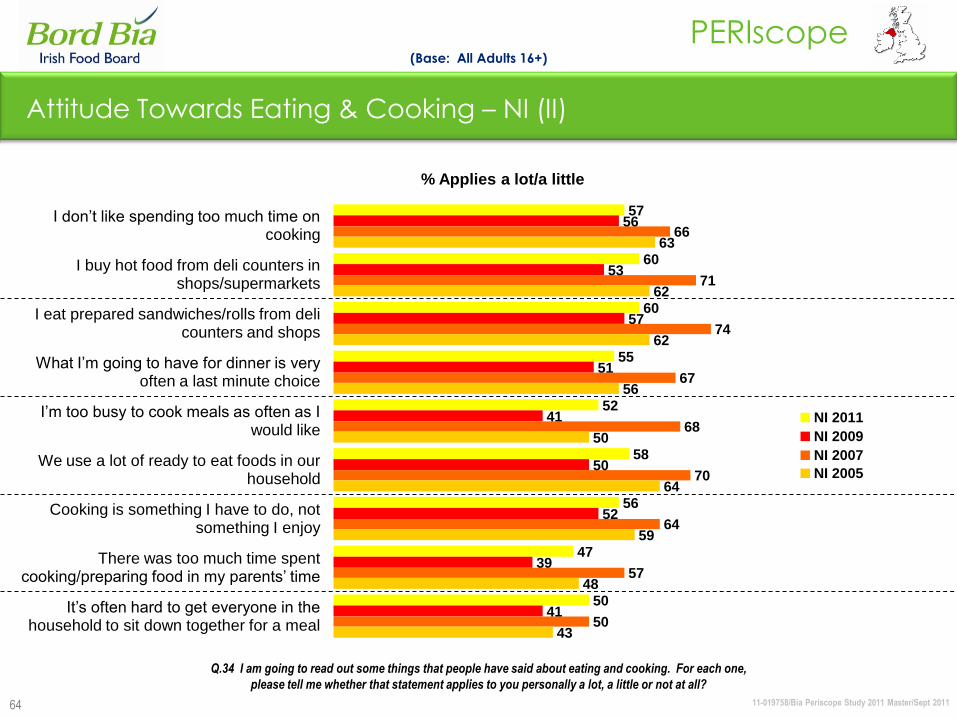
Attitude Towards Eating & Cooking – NI (II)
Q.34 I am going to read out some things that people have said about eating and cooking. For each one,
please tell me whether that statement applies to you personally a lot, a little or not at all?
(Base: All Adults 16+)
% Applies a lot/a little
I don‟t like spending too much time on cooking
I buy hot food from deli counters in shops/supermarkets
I eat prepared sandwiches/rolls from deli counters and shops
What I‟m going to have for dinner is very often a last minute choice
I‟m too busy to cook meals as often as I would like
We use a lot of ready to eat foods in our household
Cooking is something I have to do, not something I enjoy
There was too much time spent cooking/preparing food in my parents‟ time
It‟s often hard to get everyone in the household to sit down together for a meal
57
60
60
55
52
58
56
47
50
56
53
57
51
41
50
52
39
41
66
71
74
67
68
70
64
57
50
63
62
62
56
50
64
59
48
43
NI 2011
NI 2009
NI 2007
NI 2005
11-019758/Bia Periscope Study 2011 Master/Sept 2011
PERIscope
65
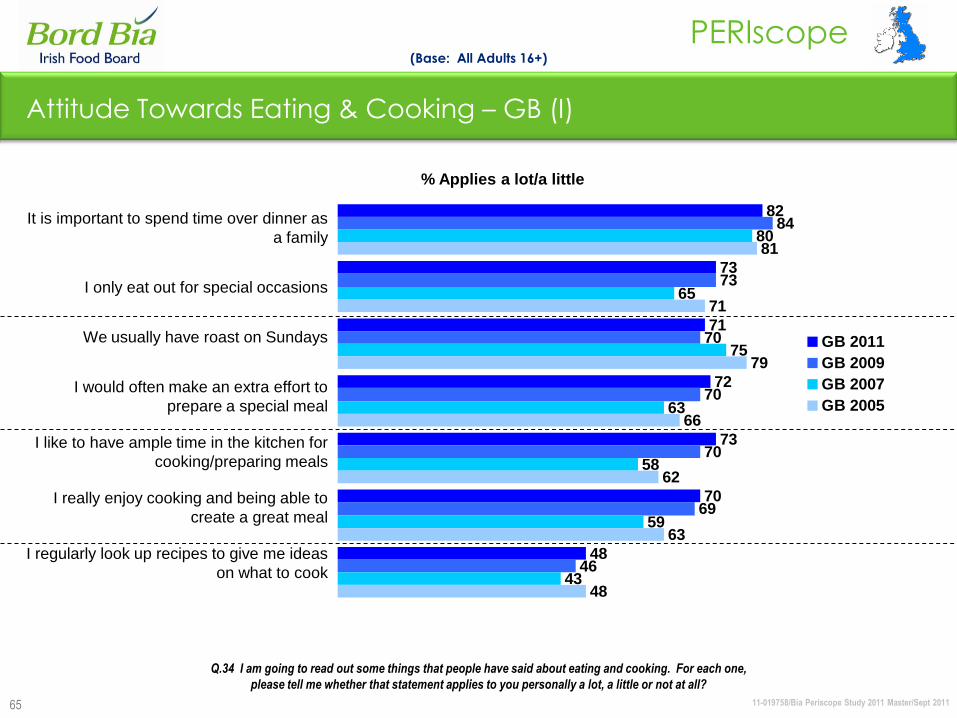
Attitude Towards Eating & Cooking – GB (I)
Q.34 I am going to read out some things that people have said about eating and cooking. For each one,
please tell me whether that statement applies to you personally a lot, a little or not at all?
(Base: All Adults 16+)
82
73
71
72
73
70
48
84
73
70
70
70
69
46
80
65
75
63
58
59
43
81
71
79
66
62
63
48
GB 2011
GB 2009
GB 2007
GB 2005
% Applies a lot/a little
It is important to spend time over dinner as
a family
I only eat out for special occasions
We usually have roast on Sundays
I would often make an extra effort to
prepare a special meal
I like to have ample time in the kitchen for
cooking/preparing meals
I really enjoy cooking and being able to
create a great meal
I regularly look up recipes to give me ideas
on what to cook
11-019758/Bia Periscope Study 2011 Master/Sept 2011
PERIscope
66
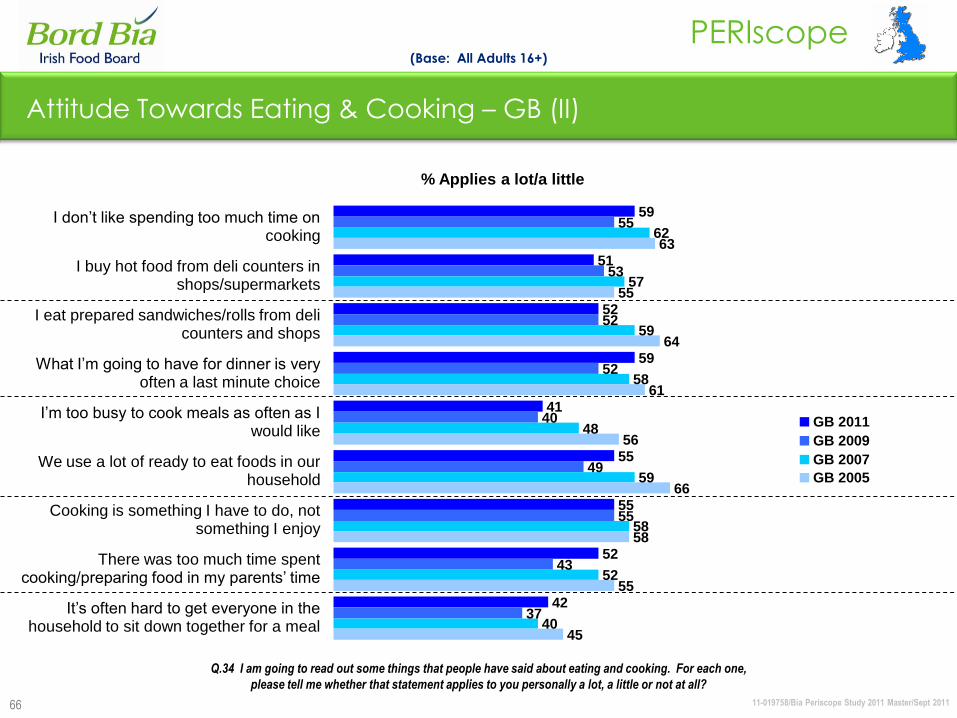
Attitude Towards Eating & Cooking – GB (II)
Q.34 I am going to read out some things that people have said about eating and cooking. For each one,
please tell me whether that statement applies to you personally a lot, a little or not at all?
(Base: All Adults 16+)
59
51
52
59
41
55
55
52
42
55
53
52
52
40
49
55
43
37
62
57
59
58
48
59
58
52
40
63
55
64
61
56
66
58
55
45
GB 2011
GB 2009
GB 2007
GB 2005
% Applies a lot/a little
I don‟t like spending too much time on cooking
I buy hot food from deli counters in shops/supermarkets
I eat prepared sandwiches/rolls from deli counters and shops
What I‟m going to have for dinner is very often a last minute choice
I‟m too busy to cook meals as often as I would like
We use a lot of ready to eat foods in our household
Cooking is something I have to do, not something I enjoy
There was too much time spent cooking/preparing food in my parents‟ time
It‟s often hard to get everyone in the household to sit down together for a meal

11-019758/Bia Periscope Study 2011 Master/Sept 2011
PERIscope
67
Incidence Of Attending/Taking Cooking Classes In Past 3 Years – 2011
• Female
• 16-24 yrs
• Entertain more at home
nowadays
• 16-24 yrs
• Not mainly/jointly
responsible for grocery
shopping
• Students
• 3+ household
• Female
• 15-24 yrs
• AB‟s
• Entertain more at home nowadays
• Students
Higher Amongst:
(Base: All Adults 15+)
Q.6 Have you taken any cooking lessons, attended demonstrations or taken part in any cookery courses in the past three years?
New question in 2009
Yes Yes Yes
ROI 2011 NI 2011 GB 2011
12% 10% 5%
( ) = 2009 figures
(9%) (7%) (5%)
11-019758/Bia Periscope Study 2011 Master/Sept 2011
PERIscope
68
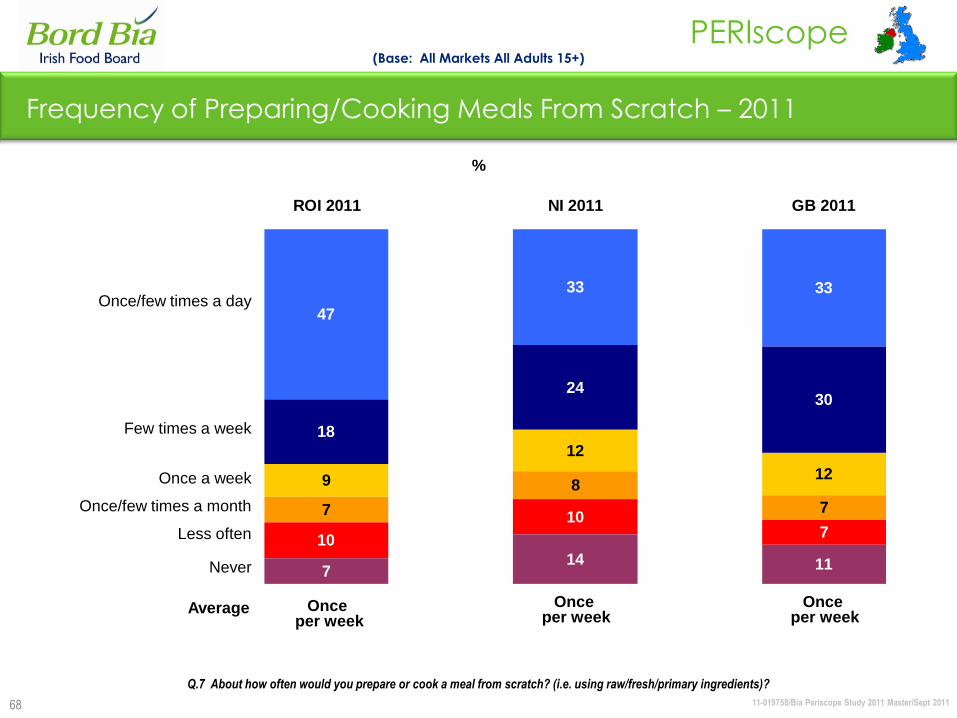
Frequency of Preparing/Cooking Meals From Scratch – 2011
Average Onceper week
Onceper week
Onceper week
(Base: All Markets All Adults 15+)
Once/few times a day
Few times a week
Once a week
Once/few times a month
Less often
Never
%
Q.7 About how often would you prepare or cook a meal from scratch? (i.e. using raw/fresh/primary ingredients)?
47
33 33
18
2430
9
12
12
7
8
7
10
107
714 11
ROI 2011 NI 2011 GB 2011
11-019758/Bia Periscope Study 2011 Master/Sept 2011
PERIscope
69
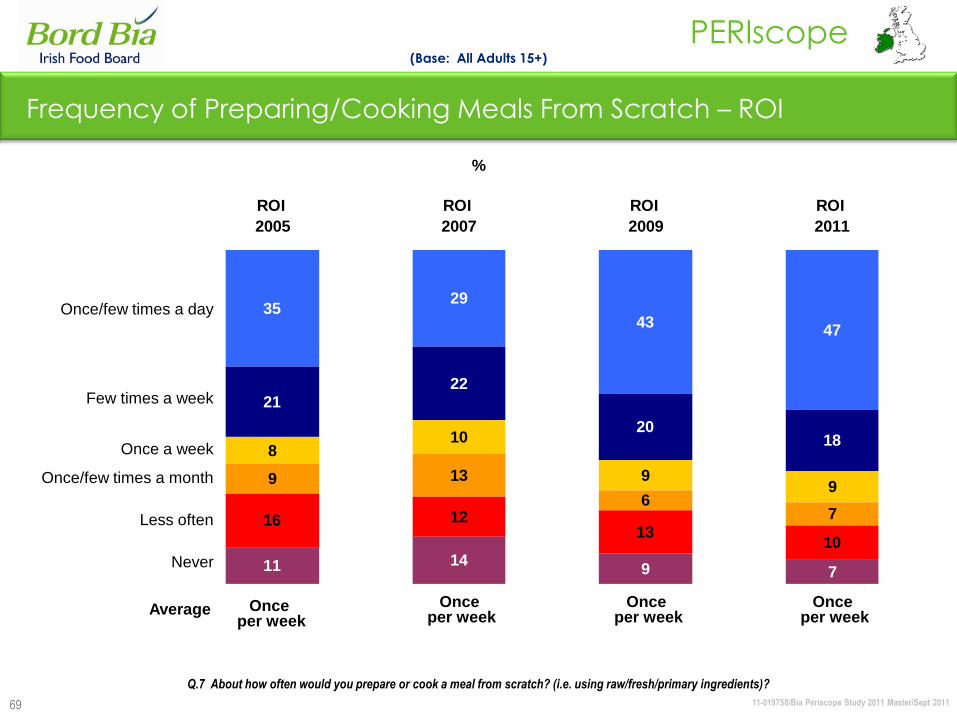
3529
4347
2122
2018
810
99
9 13
6716 12
1310
11 149 7
ROI
2005
ROI
2007
ROI
2009
ROI
2011
Frequency of Preparing/Cooking Meals From Scratch – ROI
Average Onceper week
Onceper week
Onceper week
(Base: All Adults 15+)
Once/few times a day
Few times a week
Once a week
Once/few times a month
Less often
Never
%
Q.7 About how often would you prepare or cook a meal from scratch? (i.e. using raw/fresh/primary ingredients)?
Onceper week
11-019758/Bia Periscope Study 2011 Master/Sept 2011
PERIscope
70
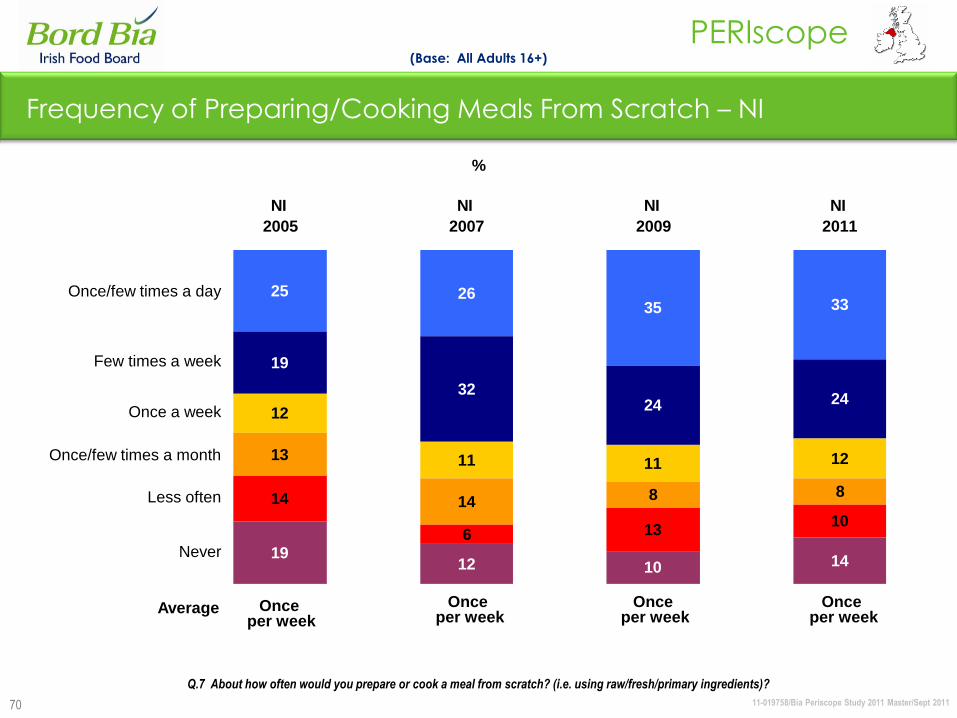
25 2635 33
19
3224 24
12
11 11 1213
14 8 814
6 1310
1912 10 14
NI
2005
NI
2007
NI
2009
NI
2011
Frequency of Preparing/Cooking Meals From Scratch – NI
Average Onceper week
Onceper week
Onceper week
(Base: All Adults 16+)
Once/few times a day
Few times a week
Once a week
Once/few times a month
Less often
Never
%
Q.7 About how often would you prepare or cook a meal from scratch? (i.e. using raw/fresh/primary ingredients)?
Onceper week
11-019758/Bia Periscope Study 2011 Master/Sept 2011
PERIscope
71
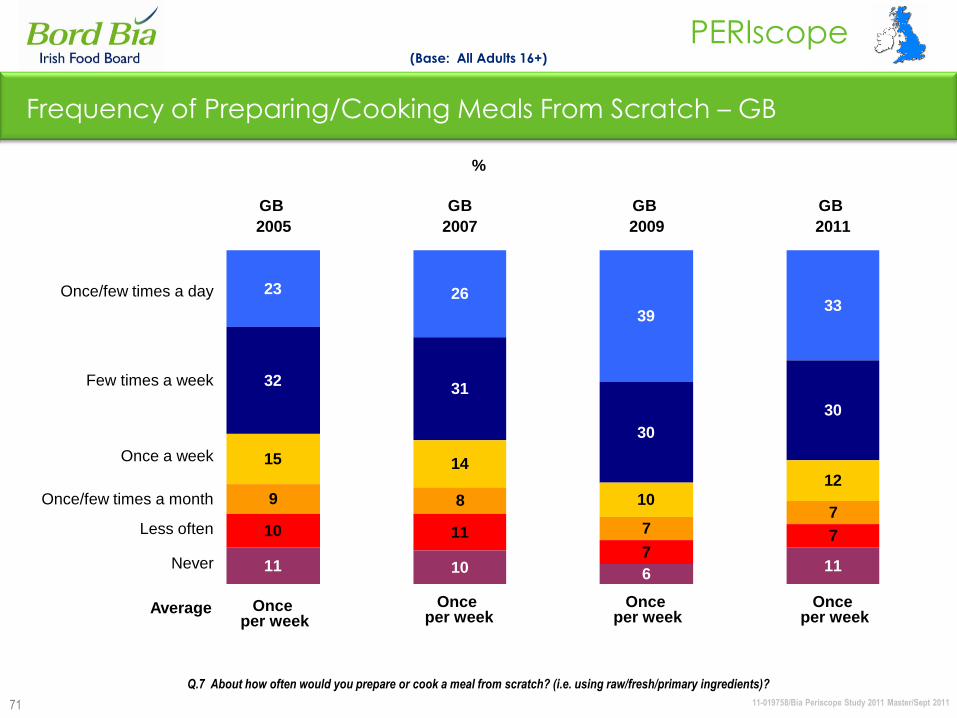
23 26
3933
3231
30
30
15 14
10
129 8
77
10 11
77
11 10 611
GB
2005
GB
2007
GB
2009
GB
2011
Frequency of Preparing/Cooking Meals From Scratch – GB
Average Onceper week
Onceper week
Onceper week
(Base: All Adults 16+)
Once/few times a day
Few times a week
Once a week
Once/few times a month
Less often
Never
%
Q.7 About how often would you prepare or cook a meal from scratch? (i.e. using raw/fresh/primary ingredients)?
Onceper week

11-019758/Bia Periscope Study 2011 Master/Sept 2011
PERIscope
72
Frequency Of Cooking Meals From Scratch Compared To 12 Months Ago – 2011
(Base: All Adults 15+)
7
15
17
7
1616
ROI 2011 NI 2011 GB 2011
More often
Less often
Q.8 Thinking back to 12 months ago, would you say that you are preparing /cooking meals from scratch?
(i.e. using raw/ fresh/primary ingredients) more often, less often or about the same?
New question in 2009
11-019758/Bia Periscope Study 2011 Master/Sept 2011
PERIscope
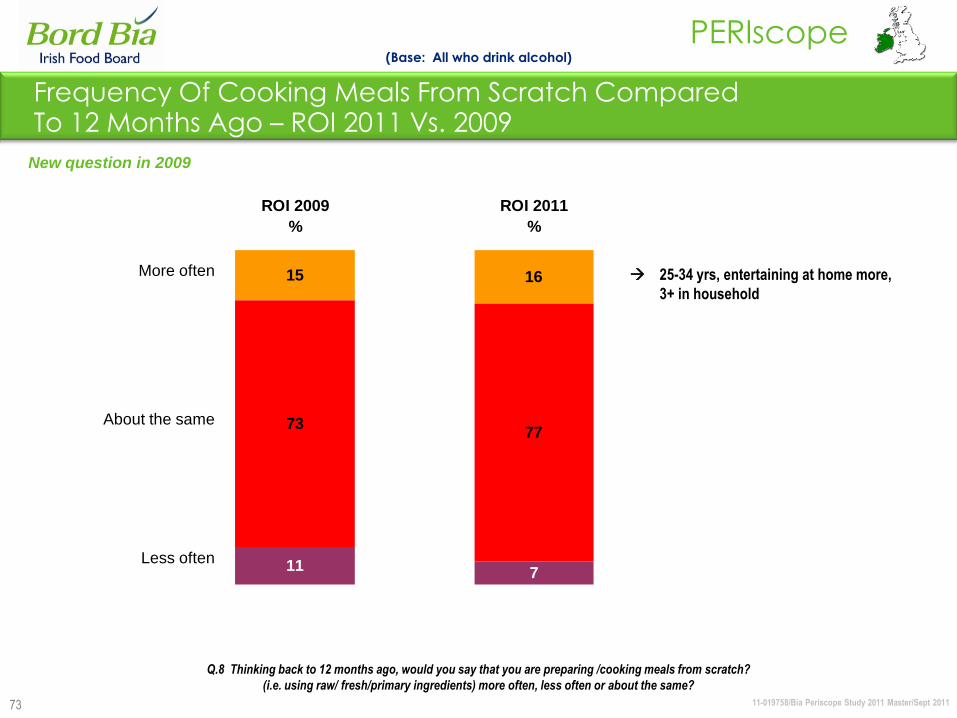
73
15 16
7377
11 7
ROI 2009
%
ROI 2011
%
More often
About the same
Less often
(Base: All who drink alcohol)
Frequency Of Cooking Meals From Scratch Compared To 12 Months Ago – ROI 2011 Vs. 2009
New question in 2009
Q.8 Thinking back to 12 months ago, would you say that you are preparing /cooking meals from scratch?
(i.e. using raw/ fresh/primary ingredients) more often, less often or about the same?
25-34 yrs, entertaining at home more,
3+ in household
11-019758/Bia Periscope Study 2011 Master/Sept 2011
PERIscope
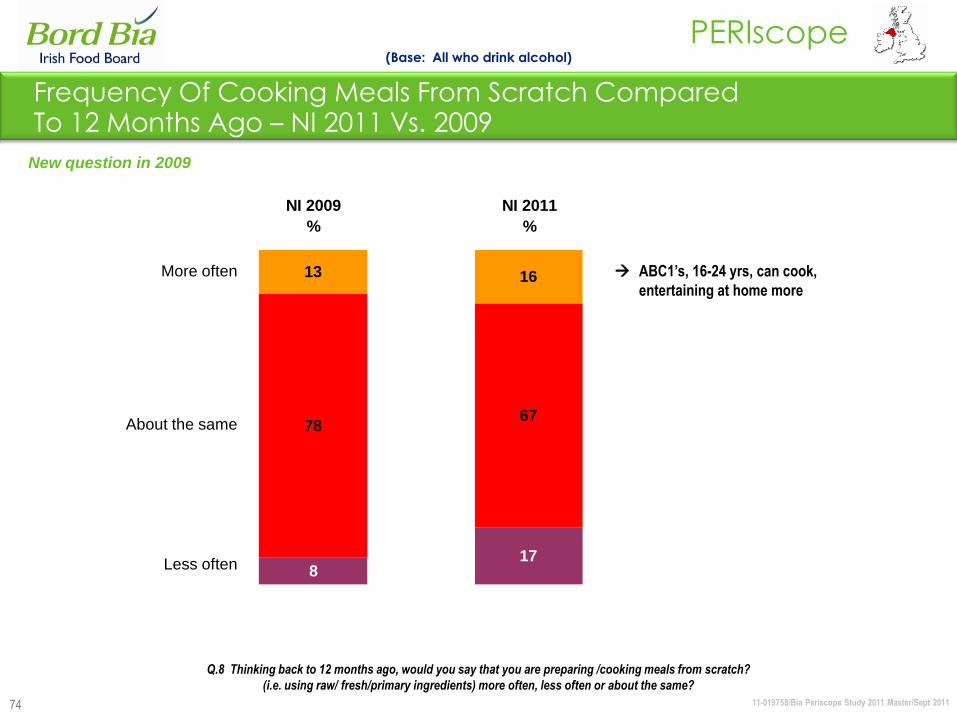
74
13 16
7867
817
NI 2009
%
NI 2011
%
More often
About the same
Less often
(Base: All who drink alcohol)
Frequency Of Cooking Meals From Scratch Compared To 12 Months Ago – NI 2011 Vs. 2009
New question in 2009
Q.8 Thinking back to 12 months ago, would you say that you are preparing /cooking meals from scratch?
(i.e. using raw/ fresh/primary ingredients) more often, less often or about the same?
ABC1’s, 16-24 yrs, can cook,
entertaining at home more
11-019758/Bia Periscope Study 2011 Master/Sept 2011
PERIscope
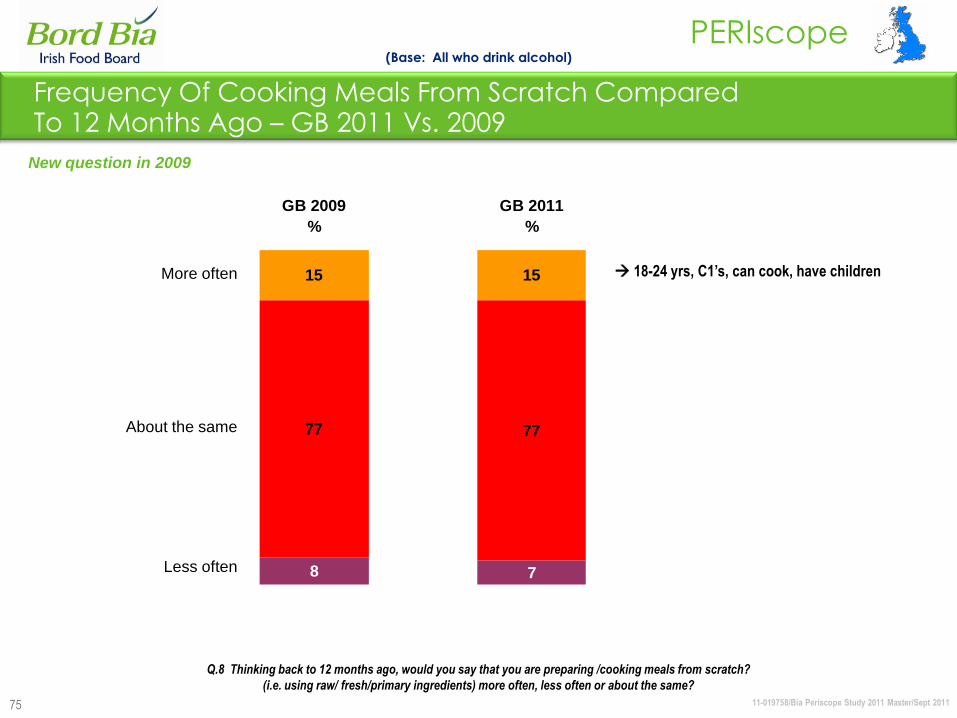
75
15 15
77 77
8 7
GB 2009
%
GB 2011
%
More often
About the same
Less often
(Base: All who drink alcohol)
Frequency Of Cooking Meals From Scratch Compared To 12 Months Ago – GB 2011 Vs. 2009
New question in 2009
Q.8 Thinking back to 12 months ago, would you say that you are preparing /cooking meals from scratch?
(i.e. using raw/ fresh/primary ingredients) more often, less often or about the same?
18-24 yrs, C1’s, can cook, have children
11-019758/Bia Periscope Study 2011 Master/Sept 2011
PERIscope
76
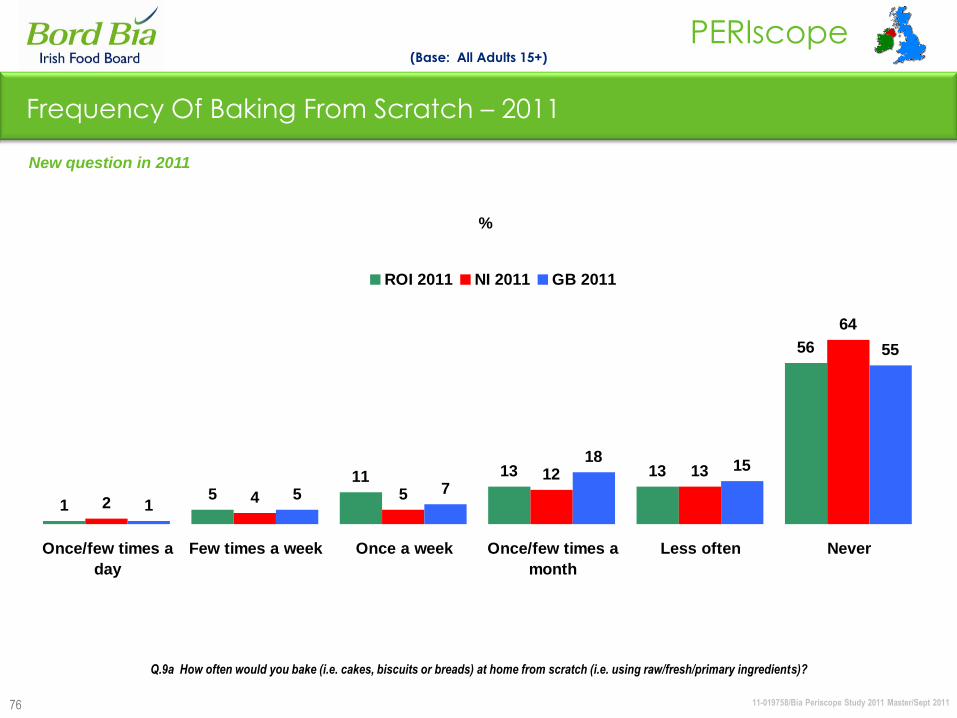
Frequency Of Baking From Scratch – 2011
15
11 13 13
56
2 4 5
12 13
64
15 7
1815
55
Once/few times a
day
Few times a week Once a week Once/few times a
month
Less often Never
ROI 2011 NI 2011 GB 2011
(Base: All Adults 15+)
%
New question in 2011
Q.9a How often would you bake (i.e. cakes, biscuits or breads) at home from scratch (i.e. using raw/fresh/primary ingredients)?
11-019758/Bia Periscope Study 2011 Master/Sept 2011
PERIscope
77
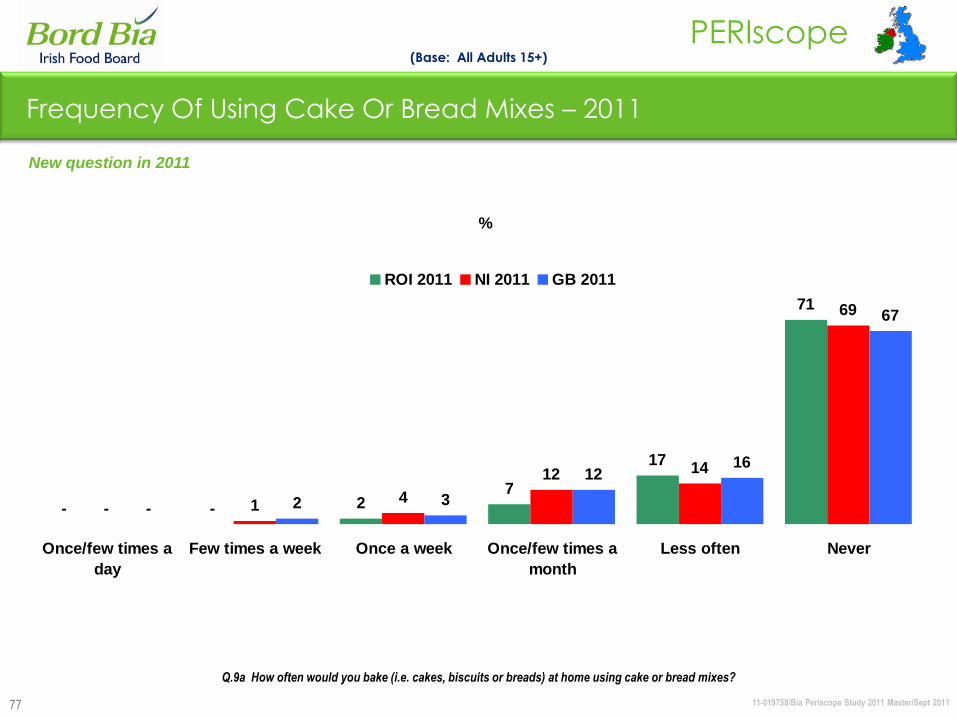
Frequency Of Using Cake Or Bread Mixes – 2011
(Base: All Adults 15+)
%
New question in 2011
Q.9a How often would you bake (i.e. cakes, biscuits or breads) at home using cake or bread mixes?
27
17
71
14
12 14
69
2 3
1216
67
-- - -
Once/few times a
day
Few times a week Once a week Once/few times a
month
Less often Never
ROI 2011 NI 2011 GB 2011
11-019758/Bia Periscope Study 2011 Master/Sept 2011
PERIscope
78
141517
171718
131413
1212
12
111312
13128
98
9
9810
22 1
2011 (83%)2011 (64%)2011 (70%)
Preparation of Food x Volumetric – Overview
ROI NI GB
(Base: All who prepare own meals)
Boiled
Oven baked/roasted
On the hob
Uncooked/ cold
Fried
Microwaved
Steamed
Stir fry/wok
Other
Q.31a Thinking about all the food you prepare in home, what proportion would you prepare in the following ways?
(% prepare own meals)

11-019758/Bia Periscope Study 2011 Master/Sept 2011
PERIscope
79
87
89
59
62
64
40
45
48
80
91
49
56
59
34
43
42
ROI 2011
ROI 2009
Preparation of Food in Home – ROI
(Base: All who prepare own meals)
Boiled
Oven baked/roasted
Uncooked/ cold
Fried
On the hob
Microwaved
Steamed
Stir fry/wok
%
Q.31a Thinking about all the food you prepare in home, what proportion would you prepare in the following ways?
11-019758/Bia Periscope Study 2011 Master/Sept 2011
PERIscope
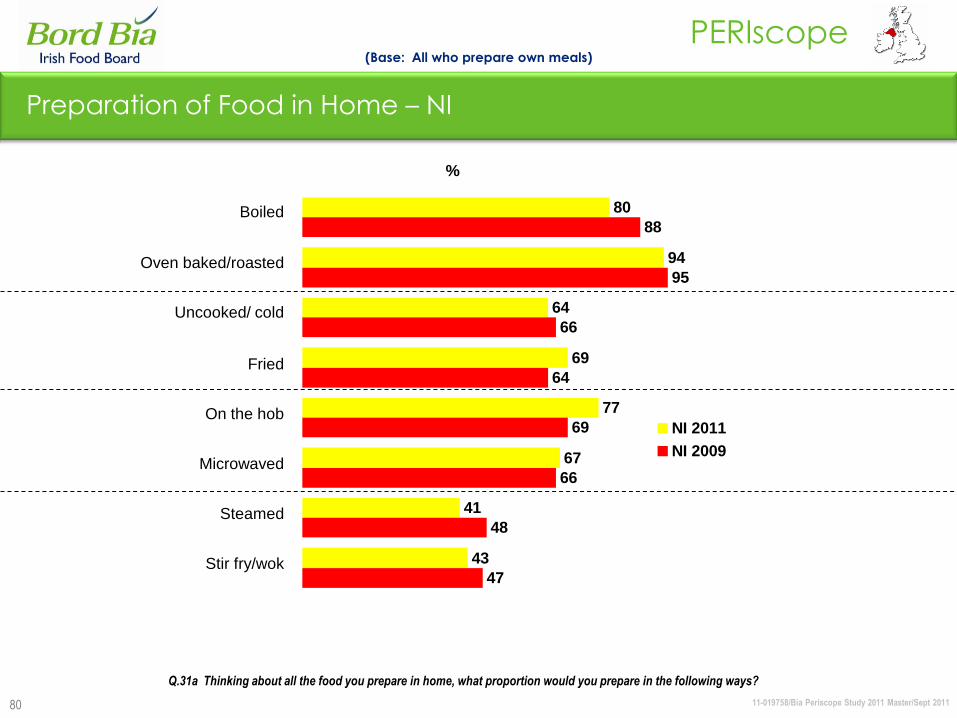
80
80
94
64
69
77
67
41
43
88
95
66
64
69
66
48
47
NI 2011
NI 2009
Preparation of Food in Home – NI
(Base: All who prepare own meals)
Boiled
Oven baked/roasted
Uncooked/ cold
Fried
On the hob
Microwaved
Steamed
Stir fry/wok
%
Q.31a Thinking about all the food you prepare in home, what proportion would you prepare in the following ways?
11-019758/Bia Periscope Study 2011 Master/Sept 2011
PERIscope
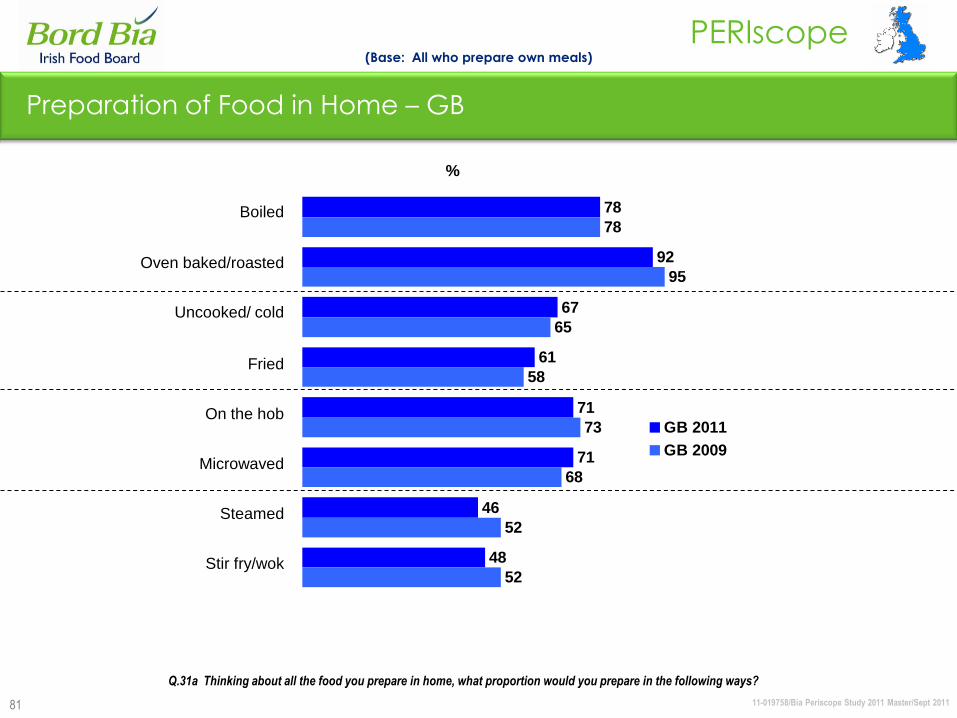
81
Preparation of Food in Home – GB
(Base: All who prepare own meals)
Boiled
Oven baked/roasted
Uncooked/ cold
Fried
On the hob
Microwaved
Steamed
Stir fry/wok
%
Q.31a Thinking about all the food you prepare in home, what proportion would you prepare in the following ways?
78
92
67
61
71
71
46
48
78
95
65
58
73
68
52
52
GB 2011
GB 2009
11-019758/Bia Periscope Study 2011 Master/Sept 2011
PERIscope
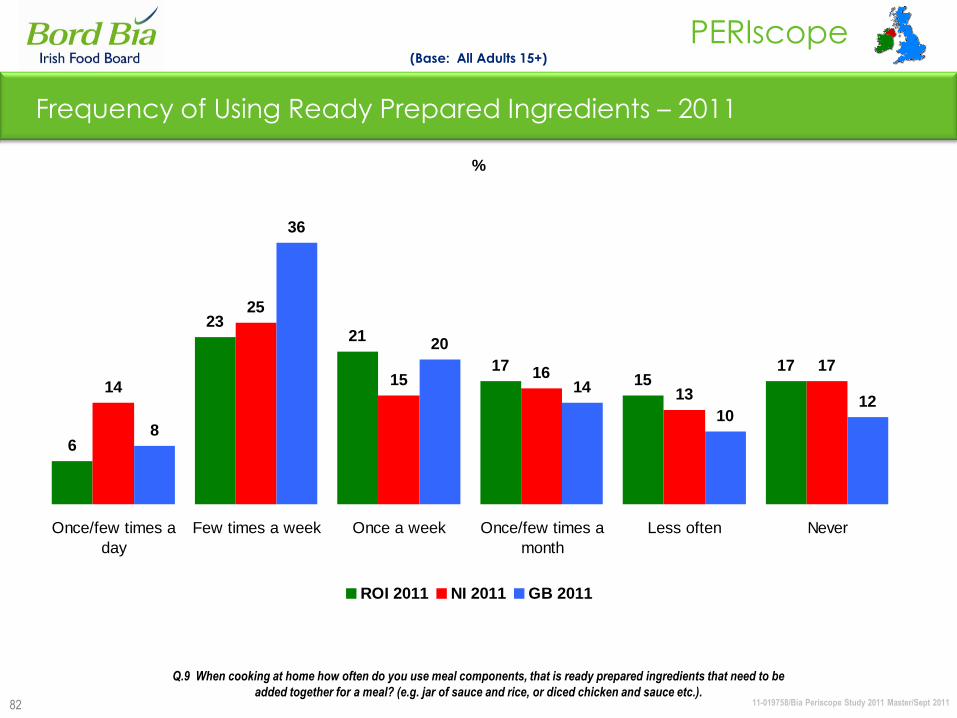
82
6
2321
1715
17
14
25
15 16
13
17
8
36
20
14
1012
Once/few times a
day
Few times a week Once a week Once/few times a
month
Less often Never
ROI 2011 NI 2011 GB 2011
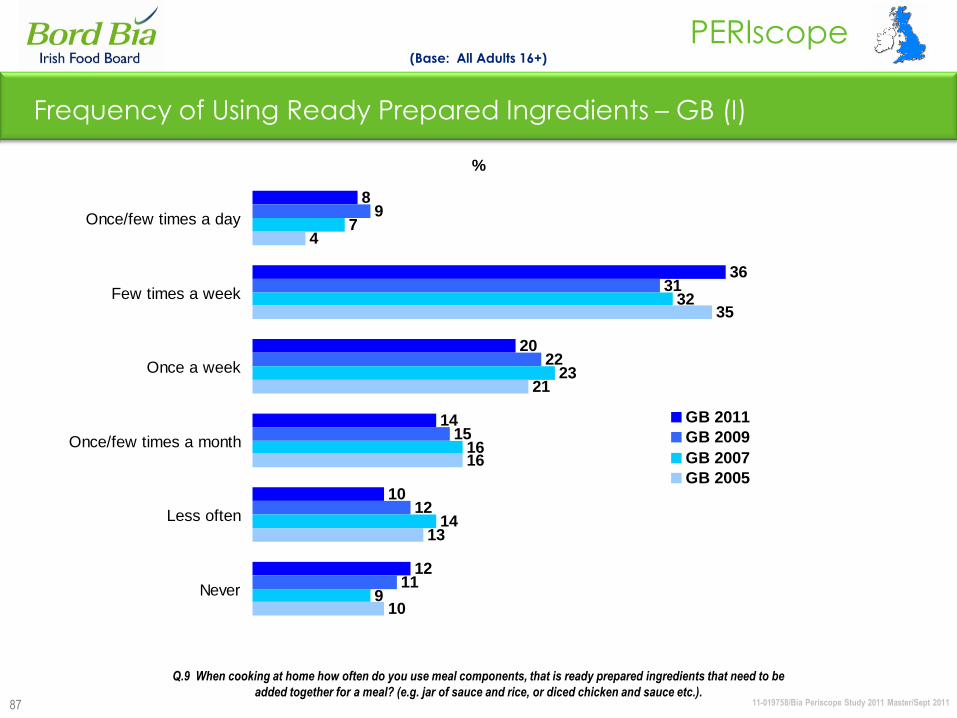
Frequency of Using Ready Prepared Ingredients – 2011
(Base: All Adults 15+)
%
Q.9 When cooking at home how often do you use meal components, that is ready prepared ingredients that need to be
added together for a meal? (e.g. jar of sauce and rice, or diced chicken and sauce etc.).
11-019758/Bia Periscope Study 2011 Master/Sept 2011
PERIscope
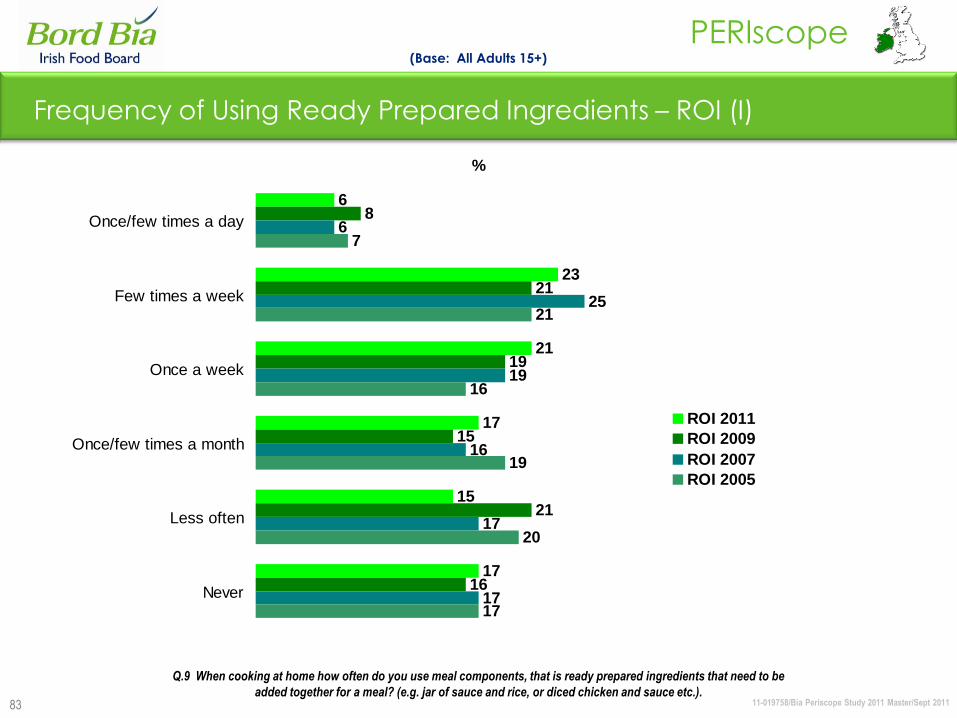
83
6
23
21
17
15
17
8
21
19
15
21
16
6
25
19
16
17
17
7
21
16
19
20
17
Once/few times a day
Few times a week
Once a week
Once/few times a month
Less often
Never
ROI 2011
ROI 2009
ROI 2007
ROI 2005
Frequency of Using Ready Prepared Ingredients – ROI (I)
(Base: All Adults 15+)
%
Q.9 When cooking at home how often do you use meal components, that is ready prepared ingredients that need to be
added together for a meal? (e.g. jar of sauce and rice, or diced chicken and sauce etc.).
11-019758/Bia Periscope Study 2011 Master/Sept 2011
PERIscope
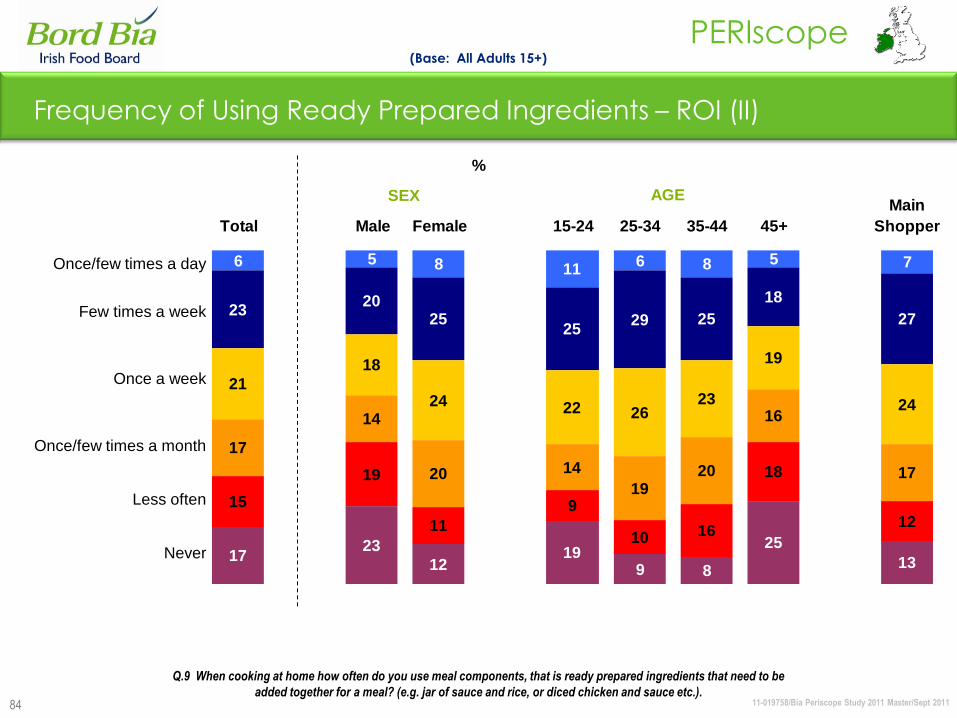
84
SEX AGE
%
Frequency of Using Ready Prepared Ingredients – ROI (II)
(Base: All Adults 15+)
Once/few times a day
Few times a week
Once a week
Once/few times a month
Less often
Never
Q.9 When cooking at home how often do you use meal components, that is ready prepared ingredients that need to be
added together for a meal? (e.g. jar of sauce and rice, or diced chicken and sauce etc.).
6 5 8 116 8 5 7
2320
2525
29 25
18
27
21
18
24 22 2623
19
24
17
14
20 14
1920
16
17
15
19
11
9
10 16
18
12
1723
1219
9 8
25
13
Total Male Female 15-24 25-34 35-44 45+
Main
Shopper

11-019758/Bia Periscope Study 2011 Master/Sept 2011
PERIscope
85
14
25
15
16
13
17
11
30
18
13
11
17
4
22
32
22
8
12
5
22
18
16
15
24
Once/few times a day
Few times a week
Once a week
Once/few times a month
Less often
Never
NI 2011
NI 2009
NI 2007
NI 2005
Frequency of Using Ready Prepared Ingredients – NI (I)
(Base: All Adults 16+)
%
Q.9 When cooking at home how often do you use meal components, that is ready prepared ingredients that need to be
added together for a meal? (e.g. jar of sauce and rice, or diced chicken and sauce etc.).
11-019758/Bia Periscope Study 2011 Master/Sept 2011
PERIscope
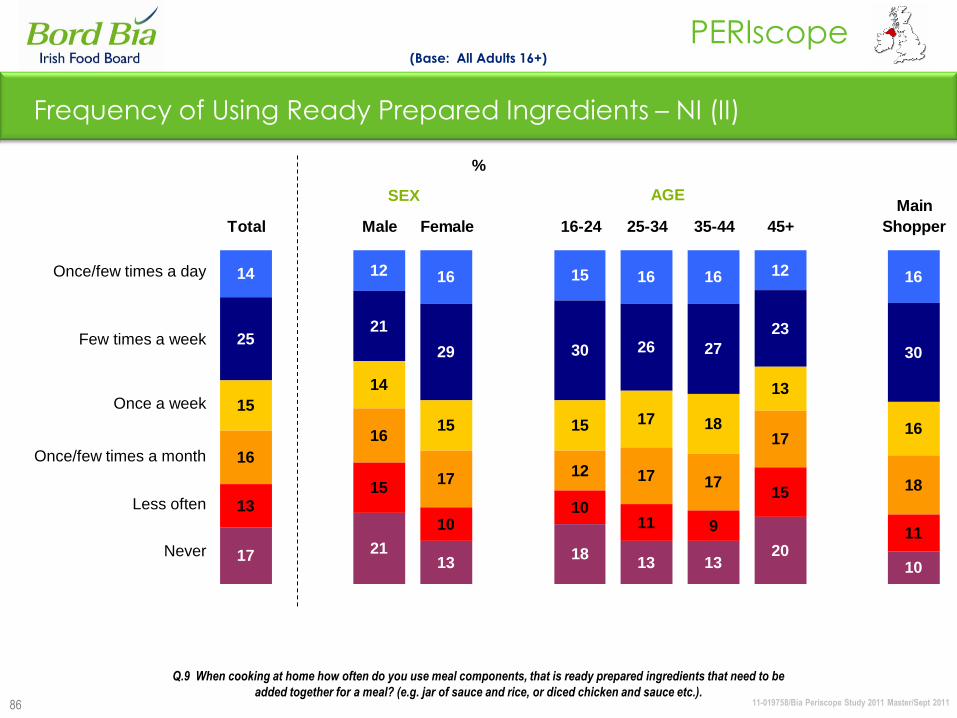
86
14 12 16 15 16 16 12 16
2521
29 30 26 27
23
30
15
14
15 15 17 18
13
16
16
16
1712 17 17
17
18
1315
1010
11 9
15
11
17 2113
1813 13
2010
Total Male Female 16-24 25-34 35-44 45+
Main
Shopper
SEX AGE
%
Frequency of Using Ready Prepared Ingredients – NI (II)
(Base: All Adults 16+)
Once/few times a day
Few times a week
Once a week
Once/few times a month
Less often
Never
Q.9 When cooking at home how often do you use meal components, that is ready prepared ingredients that need to be
added together for a meal? (e.g. jar of sauce and rice, or diced chicken and sauce etc.).
11-019758/Bia Periscope Study 2011 Master/Sept 2011
PERIscope
87
8
36
20
14
10
12
9
31
22
15
12
11
7
32
23
16
14
9
4
35
21
16
13
10
Once/few times a day
Few times a week
Once a week
Once/few times a month
Less often
Never
GB 2011
GB 2009
GB 2007
GB 2005
Frequency of Using Ready Prepared Ingredients – GB (I)
(Base: All Adults 16+)
%
Q.9 When cooking at home how often do you use meal components, that is ready prepared ingredients that need to be
added together for a meal? (e.g. jar of sauce and rice, or diced chicken and sauce etc.).

11-019758/Bia Periscope Study 2011 Master/Sept 2011
PERIscope
88
8 8 9 7 8 11 8 8
36 3239 39
45 39
3138
2017
23 2016 23
20
20
14
15
1410
1213
17
15
1013
79
97
119
12 14 10 149 7
13 10
Total Male Female 16-24 25-34 35-44 45+
Main
Shopper
SEX AGE
%
Frequency of Using Ready Prepared Ingredients – GB (II)
(Base: All Adults 16+)
Once/few times a day
Few times a week
Once a week
Once/few times a month
Less often
Never
Q.9 When cooking at home how often do you use meal components, that is ready prepared ingredients that need to be
added together for a meal? (e.g. jar of sauce and rice, or diced chicken and sauce etc.).
11-019758/Bia Periscope Study 2011 Master/Sept 2011
PERIscope
89
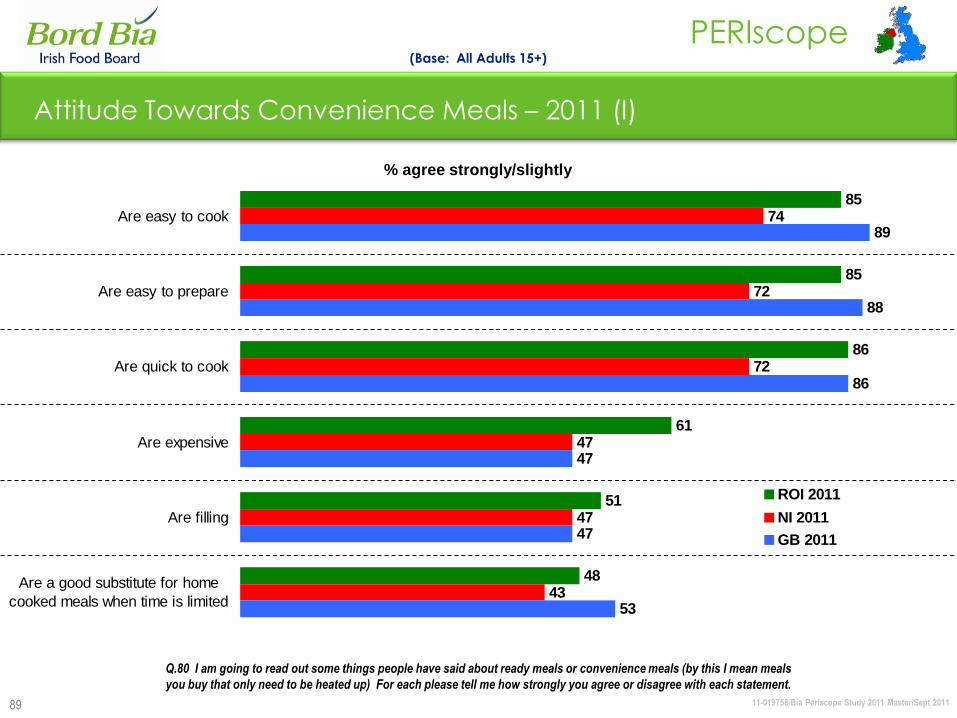
Attitude Towards Convenience Meals – 2011 (I)
(Base: All Adults 15+)
% agree strongly/slightly
Q.80 I am going to read out some things people have said about ready meals or convenience meals (by this I mean meals
you buy that only need to be heated up) For each please tell me how strongly you agree or disagree with each statement.
85
85
86
61
51
48
74
72
72
47
47
43
89
88
86
47
47
53
Are easy to cook
Are easy to prepare
Are quick to cook
Are expensive
Are filling
Are a good substitute for home
cooked meals when time is limited
ROI 2011
NI 2011
GB 2011
11-019758/Bia Periscope Study 2011 Master/Sept 2011
PERIscope
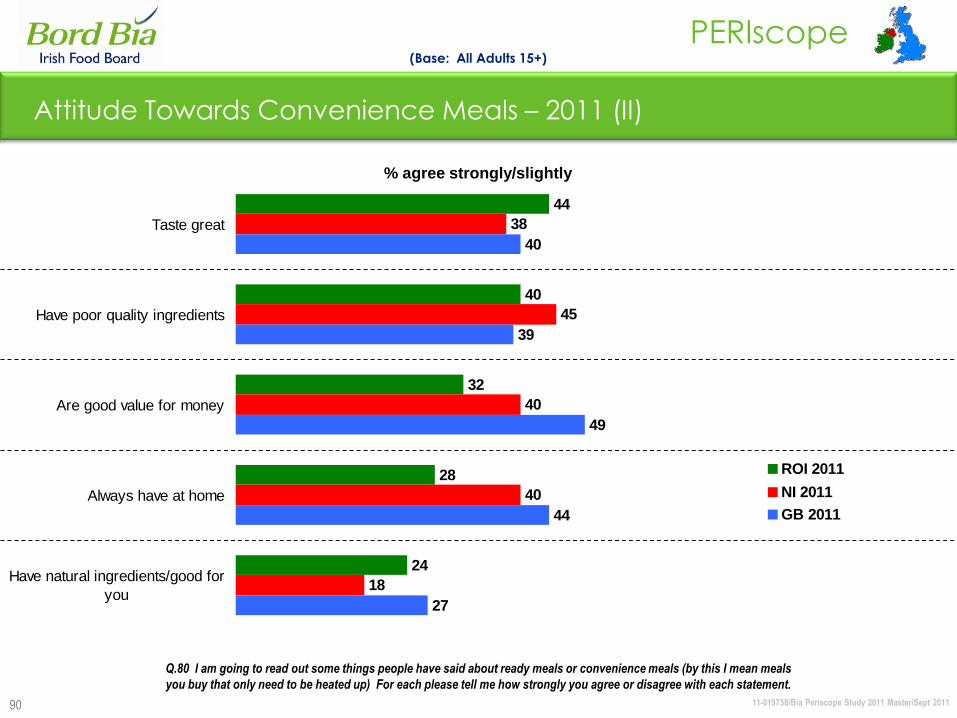
90
44
40
32
28
24
38
45
40
40
18
40
39
49
44
27
Taste great
Have poor quality ingredients
Are good value for money
Always have at home
Have natural ingredients/good for
you
ROI 2011
NI 2011
GB 2011
Attitude Towards Convenience Meals – 2011 (II)
(Base: All Adults 15+)
% agree strongly/slightly
Q.80 I am going to read out some things people have said about ready meals or convenience meals (by this I mean meals
you buy that only need to be heated up) For each please tell me how strongly you agree or disagree with each statement.

11-019758/Bia Periscope Study 2011 Master/Sept 2011
PERIscope
91
Attitude Towards Convenience Meals – ROI (I)
(Base: All Adults 15+)
% agree strongly/slightly
Q.80 I am going to read out some things people have said about ready meals or convenience meals (by this I mean meals
you buy that only need to be heated up) For each please tell me how strongly you agree or disagree with each statement.
85
85
86
61
51
48
75
78
77
63
45
41
80
80
80
68
50
86
84
85
63
48
53
87
72
52
47
n/a
85
86
Are easy to cook
Are easy to prepare
Are quick to cook
Are expensive
Are filling
Are a good substitute for home
cooked meals when time is limited
ROI 2011ROI 2009ROI 2007ROI 2005ROI 2003
11-019758/Bia Periscope Study 2011 Master/Sept 2011
PERIscope
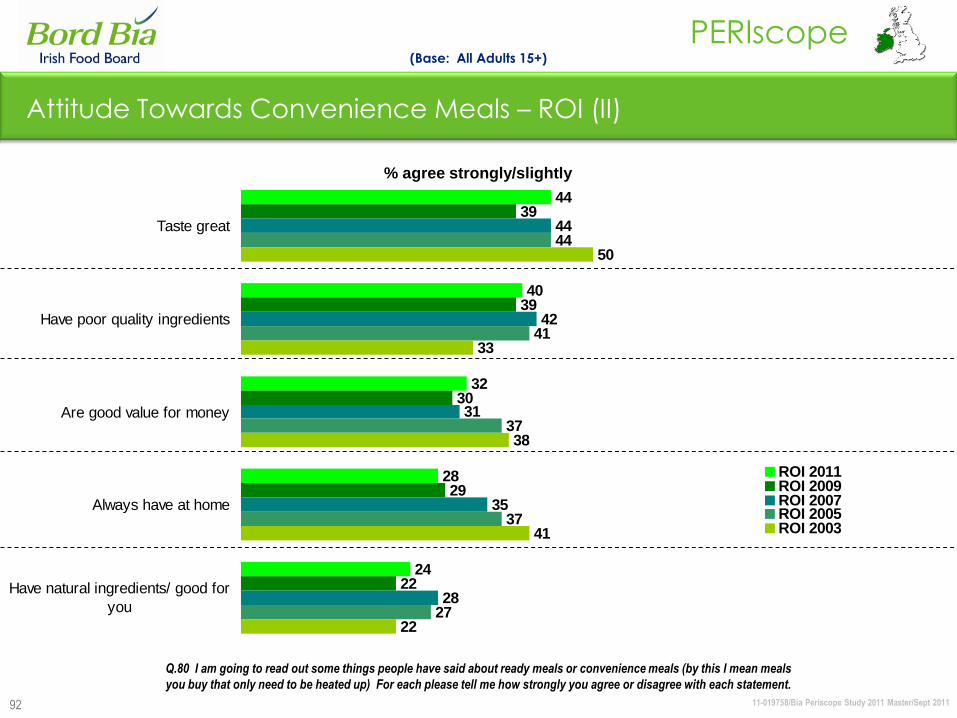
92
44
40
32
28
24
39
39
30
29
22
44
42
31
35
28
44
41
37
37
27
50
33
38
41
22
Taste great
Have poor quality ingredients
Are good value for money
Always have at home
Have natural ingredients/ good for
you
ROI 2011ROI 2009ROI 2007ROI 2005ROI 2003
Attitude Towards Convenience Meals – ROI (II)
(Base: All Adults 15+)
% agree strongly/slightly
Q.80 I am going to read out some things people have said about ready meals or convenience meals (by this I mean meals
you buy that only need to be heated up) For each please tell me how strongly you agree or disagree with each statement.
11-019758/Bia Periscope Study 2011 Master/Sept 2011
PERIscope
93
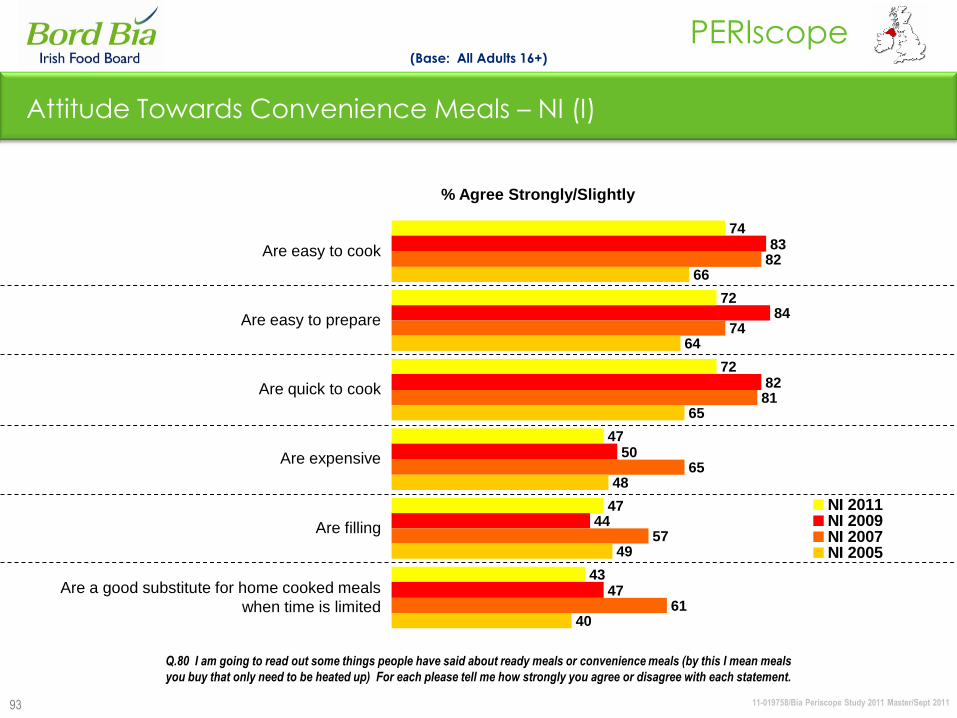
Attitude Towards Convenience Meals – NI (I)
74
72
72
47
47
43
83
84
82
50
44
47
82
74
81
65
57
61
66
64
65
48
49
40
NI 2011NI 2009NI 2007NI 2005
Are easy to cook
Are easy to prepare
Are quick to cook
Are expensive
Are filling
Are a good substitute for home cooked meals
when time is limited
% Agree Strongly/Slightly
(Base: All Adults 16+)
Q.80 I am going to read out some things people have said about ready meals or convenience meals (by this I mean meals
you buy that only need to be heated up) For each please tell me how strongly you agree or disagree with each statement.

11-019758/Bia Periscope Study 2011 Master/Sept 2011
PERIscope
94
Attitude Towards Convenience Meals – NI (II)
Taste great
Have poor quality ingredients
Are good value for money
Always have at home
Have natural ingredients/good for you
% Agree Strongly/Slightly
(Base: All Adults 16+)
Q.80 I am going to read out some things people have said about ready meals or convenience meals (by this I mean meals
you buy that only need to be heated up) For each please tell me how strongly you agree or disagree with each statement.
38
45
40
40
18
35
39
40
40
21
49
31
58
58
37
38
36
36
36
25
NI 2011NI 2009NI 2007NI 2005
11-019758/Bia Periscope Study 2011 Master/Sept 2011
PERIscope
95
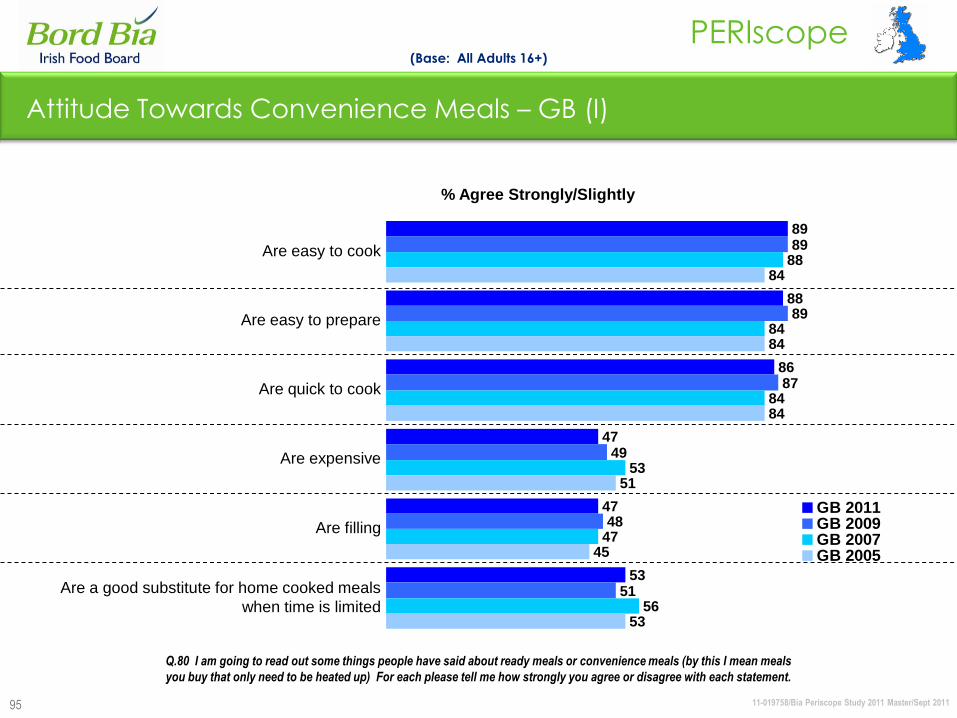
Attitude Towards Convenience Meals – GB (I)
89
88
86
47
47
53
89
89
87
49
48
51
88
84
84
53
47
56
84
84
84
51
45
53
GB 2011GB 2009GB 2007GB 2005
% Agree Strongly/Slightly
(Base: All Adults 16+)
Q.80 I am going to read out some things people have said about ready meals or convenience meals (by this I mean meals
you buy that only need to be heated up) For each please tell me how strongly you agree or disagree with each statement.
Are easy to cook
Are easy to prepare
Are quick to cook
Are expensive
Are filling
Are a good substitute for home cooked meals
when time is limited
11-019758/Bia Periscope Study 2011 Master/Sept 2011
PERIscope
96
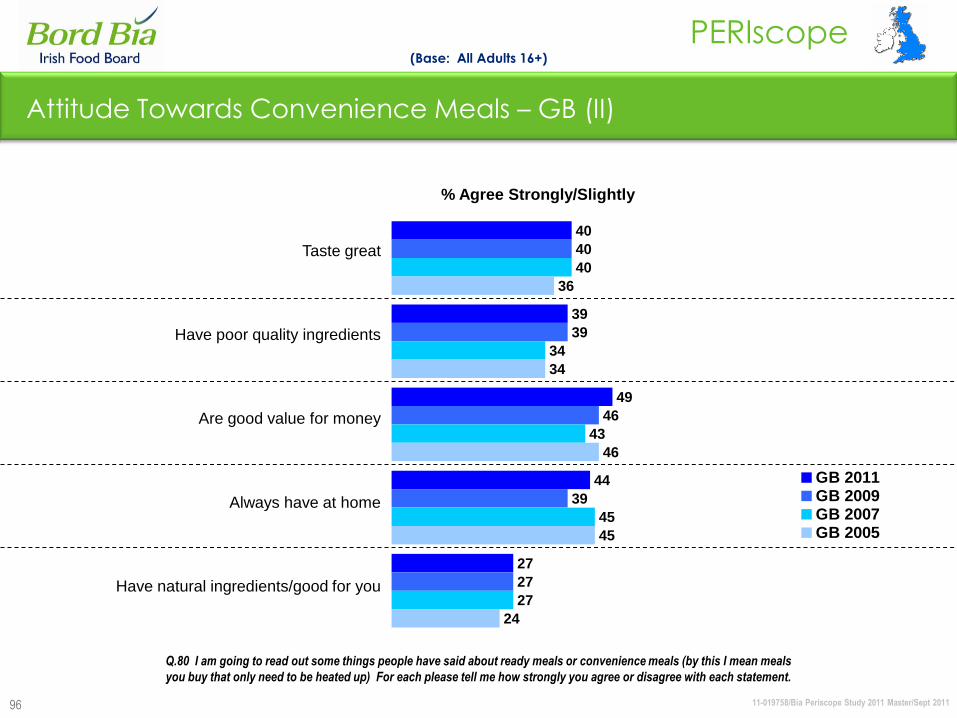
Attitude Towards Convenience Meals – GB (II)
40
39
49
44
27
40
39
46
39
27
40
34
43
45
27
36
34
46
45
24
GB 2011GB 2009GB 2007GB 2005
% Agree Strongly/Slightly
(Base: All Adults 16+)
Q.80 I am going to read out some things people have said about ready meals or convenience meals (by this I mean meals
you buy that only need to be heated up) For each please tell me how strongly you agree or disagree with each statement.
Taste great
Have poor quality ingredients
Are good value for money
Always have at home
Have natural ingredients/good for you
11-019758/Bia Periscope Study 2011 Master/Sept 2011
PERIscope
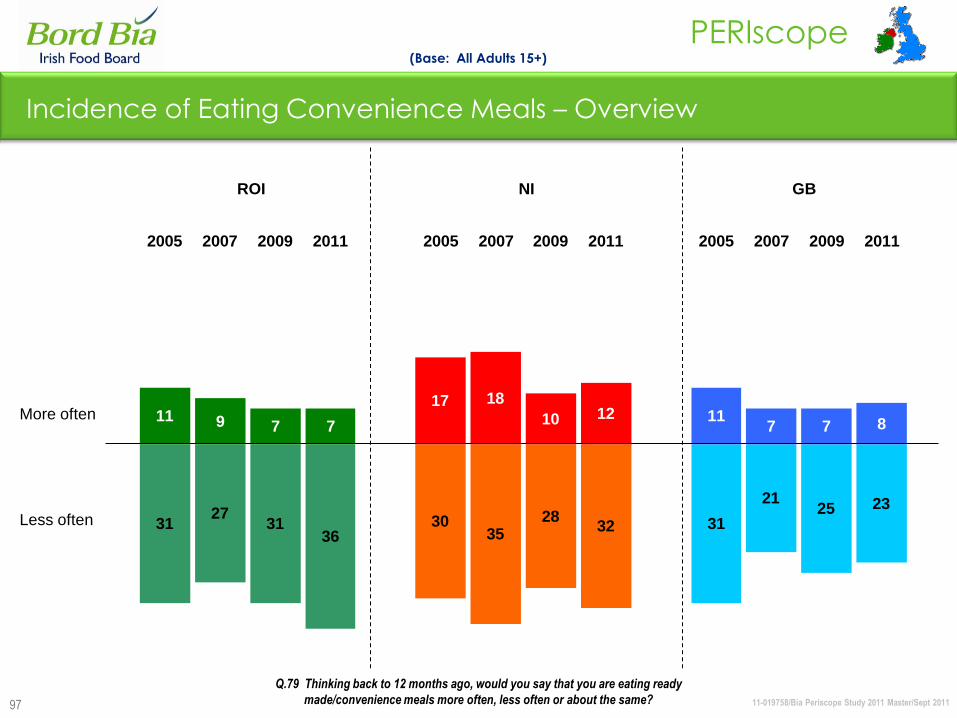
97
3127
31 3035
28 31
2125
11 9 7
17 18
10 117 7
23
3236
812
7
2005 2007 2009 2011 2005 2007 2009 2011 2005 2007 2009 2011
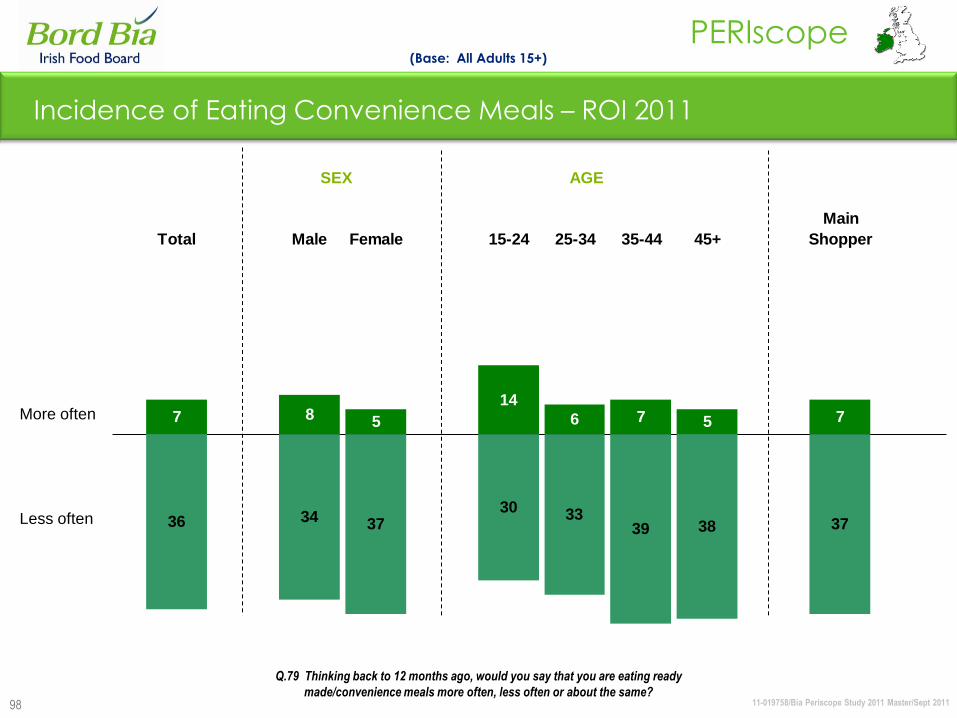
Incidence of Eating Convenience Meals – Overview
More often
Less often
ROI NI GB
(Base: All Adults 15+)
Q.79 Thinking back to 12 months ago, would you say that you are eating ready
made/convenience meals more often, less often or about the same?
11-019758/Bia Periscope Study 2011 Master/Sept 2011
PERIscope
98
Incidence of Eating Convenience Meals – ROI 2011
SEX AGE
(Base: All Adults 15+)
More often
Less often
Q.79 Thinking back to 12 months ago, would you say that you are eating ready
made/convenience meals more often, less often or about the same?
36 34 3730 33
39 38 37
7 8 5
14
6 7 5 7
Total Male Female 15-24 25-34 35-44 45+
Main
Shopper

11-019758/Bia Periscope Study 2011 Master/Sept 2011
PERIscope
99
Incidence of Eating Convenience Meals – NI 2011
(Base: All Adults 16+)
32 30 33 30 3034 32 34
12 13 1016 17
10 9 11
Total Male Female 16-24 25-34 35-44 45+
Main
Shopper
SEX AGE
More often
Less often
Q.79 Thinking back to 12 months ago, would you say that you are eating ready
made/convenience meals more often, less often or about the same?

11-019758/Bia Periscope Study 2011 Master/Sept 2011
PERIscope
100
Incidence of Eating Convenience Meals – GB 2011
(Base: All Adults 16+)
SEX AGE
More often
Less often
Q.79 Thinking back to 12 months ago, would you say that you are eating ready
made/convenience meals more often, less often or about the same?
23 23 23 2124
29
22 24
8 8 814
116 6 8
Total Male Female 16-24 25-34 35-44 45+
Main
Shopper
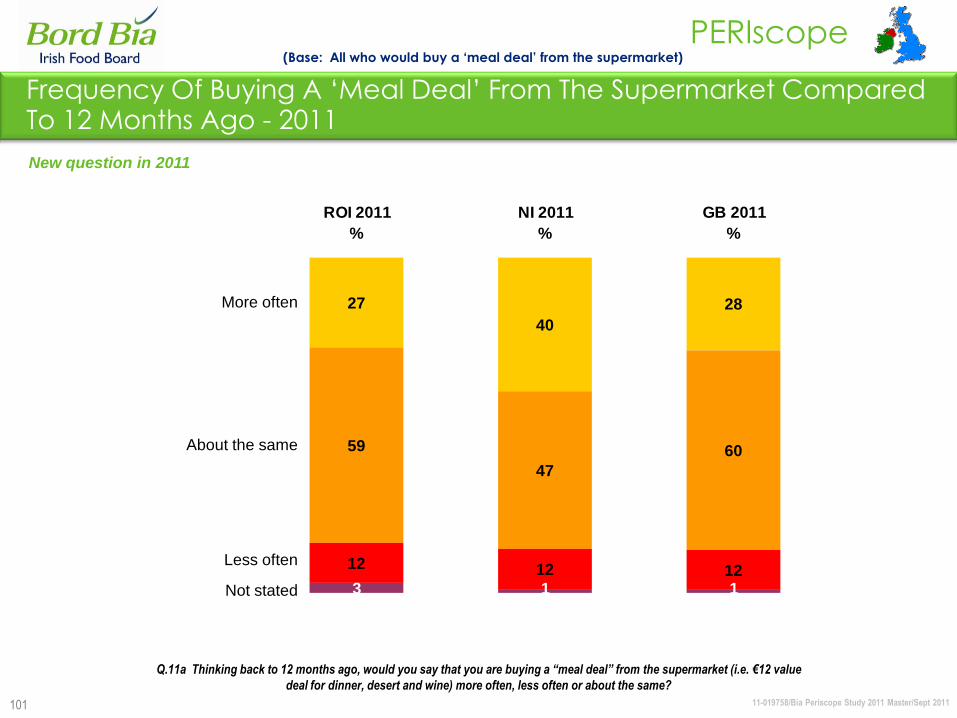
11-019758/Bia Periscope Study 2011 Master/Sept 2011
PERIscope
101
28
60
123 1 1
27
40
59
47
12 12
ROI 2011
%
NI 2011
%
GB 2011
%
More often
About the same
Less often
Not stated
(Base: All who would buy a „meal deal‟ from the supermarket)
Frequency Of Buying A „Meal Deal‟ From The Supermarket Compared To 12 Months Ago - 2011
New question in 2011
Q.11a Thinking back to 12 months ago, would you say that you are buying a “meal deal” from the supermarket (i.e. €12 value
deal for dinner, desert and wine) more often, less often or about the same?
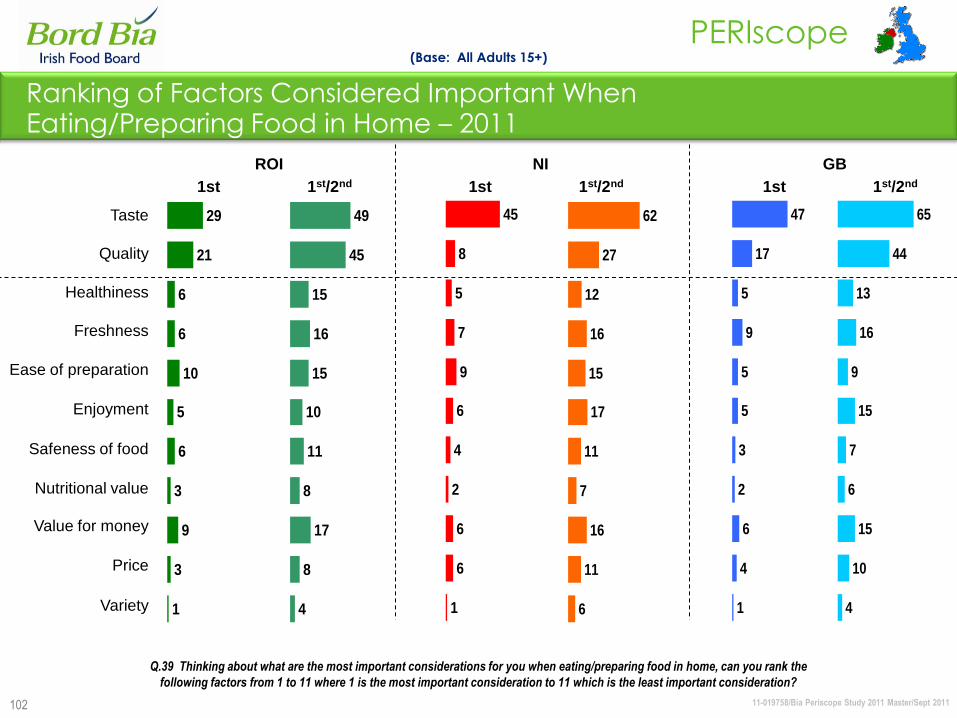
11-019758/Bia Periscope Study 2011 Master/Sept 2011
PERIscope
102
29
21
6
6
10
5
6
3
9
3
1
Ranking of Factors Considered Important When Eating/Preparing Food in Home – 2011
1st 1st/2nd
Taste
Quality
Healthiness
Freshness
Ease of preparation
Enjoyment
Safeness of food
Nutritional value
Value for money
Price
Variety
(Base: All Adults 15+)
Q.39 Thinking about what are the most important considerations for you when eating/preparing food in home, can you rank the
following factors from 1 to 11 where 1 is the most important consideration to 11 which is the least important consideration?
49
45
15
16
15
10
11
8
17
8
4
45
8
5
7
9
6
4
2
6
6
1
62
27
12
16
15
17
11
7
16
11
6
47
17
5
9
5
5
3
2
6
4
1
65
44
13
16
9
15
7
6
15
10
4
ROI
1st 1st/2nd
NI
1st 1st/2nd
GB
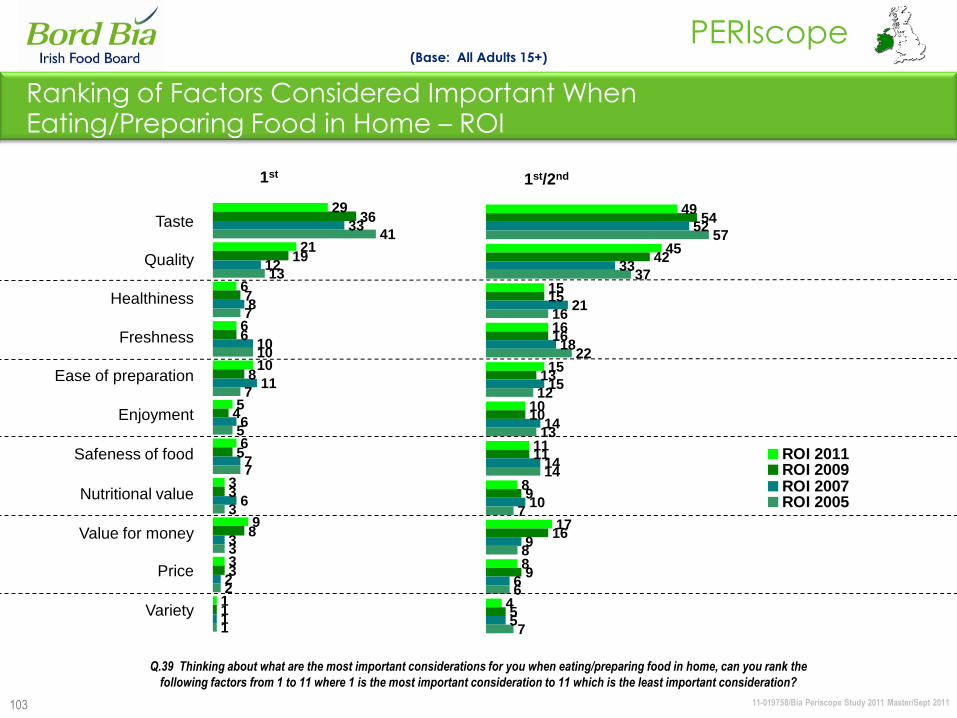
11-019758/Bia Periscope Study 2011 Master/Sept 2011
PERIscope
103
Ranking of Factors Considered Important When Eating/Preparing Food in Home – ROI
(Base: All Adults 15+)
29
21
6
6
10
5
6
3
9
3
1
36
19
7
6
8
4
5
3
8
3
1
33
12
8
10
11
6
7
6
3
2
1
41
13
7
10
7
5
7
3
3
2
1
Taste
Quality
Healthiness
Freshness
Ease of preparation
Enjoyment
Safeness of food
Nutritional value
Value for money
Price
Variety
1st 1st/2nd
49
45
15
16
15
10
11
8
17
8
4
54
42
15
16
13
10
11
9
16
9
5
52
33
21
18
15
14
14
10
9
6
5
57
37
16
22
12
13
14
7
8
6
7
ROI 2011ROI 2009ROI 2007ROI 2005
Q.39 Thinking about what are the most important considerations for you when eating/preparing food in home, can you rank the
following factors from 1 to 11 where 1 is the most important consideration to 11 which is the least important consideration?
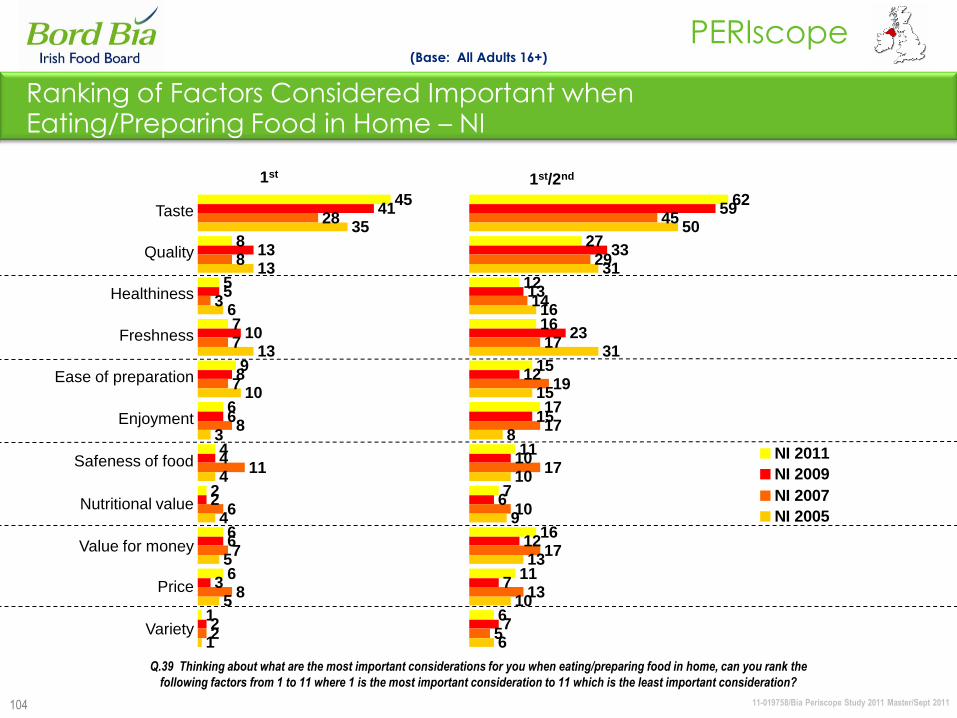
11-019758/Bia Periscope Study 2011 Master/Sept 2011
PERIscope
104
Ranking of Factors Considered Important when Eating/Preparing Food in Home – NI
45
8
5
7
9
6
4
2
6
6
1
41
13
5
10
8
6
4
2
6
3
2
28
8
3
7
7
8
11
6
7
8
2
35
13
6
13
10
3
4
4
5
5
1
(Base: All Adults 16+)
62
27
12
16
15
17
11
7
16
11
6
59
33
13
23
12
15
10
6
12
7
7
45
29
14
17
19
17
17
10
17
13
5
50
31
16
31
15
8
10
9
13
10
6
NI 2011
NI 2009
NI 2007
NI 2005
Q.39 Thinking about what are the most important considerations for you when eating/preparing food in home, can you rank the
following factors from 1 to 11 where 1 is the most important consideration to 11 which is the least important consideration?
Taste
Quality
Healthiness
Freshness
Ease of preparation
Enjoyment
Safeness of food
Nutritional value
Value for money
Price
Variety
1st 1st/2nd
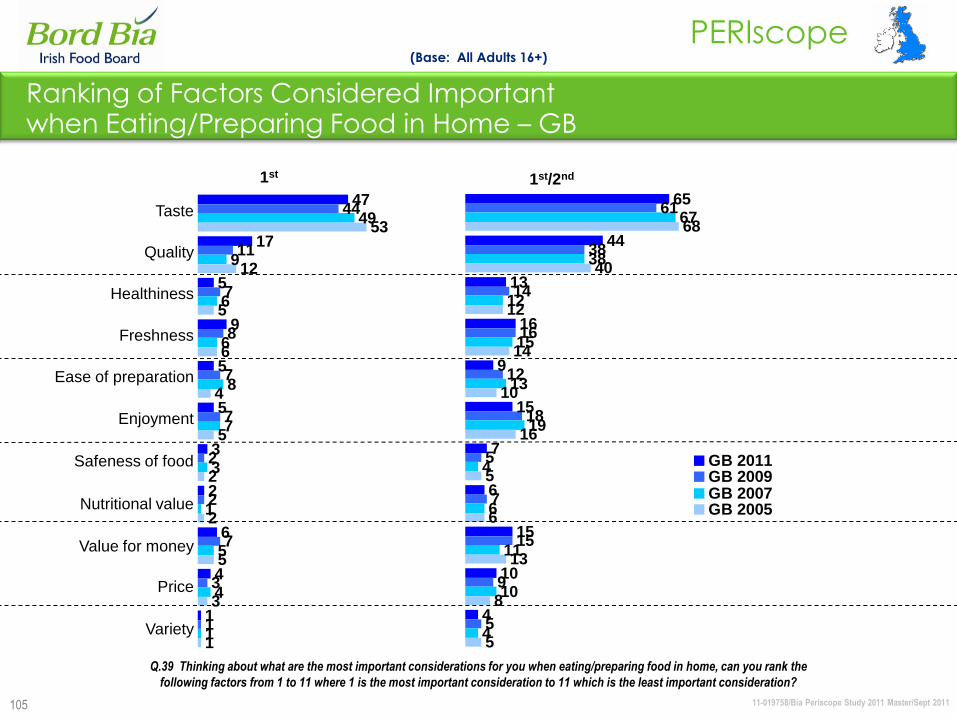
11-019758/Bia Periscope Study 2011 Master/Sept 2011
PERIscope
105
Ranking of Factors Considered Important when Eating/Preparing Food in Home – GB
47
17
5
9
5
5
3
2
6
4
1
44
11
7
8
7
7
2
2
7
3
1
49
9
6
6
8
7
3
1
5
4
1
53
12
5
6
4
5
2
2
5
3
1
(Base: All Adults 16+)
65
44
13
16
9
15
7
6
15
10
4
61
38
14
16
12
18
5
7
15
9
5
67
38
12
15
13
19
4
6
11
10
4
68
40
12
14
10
16
5
6
13
8
5
GB 2011GB 2009GB 2007GB 2005
Q.39 Thinking about what are the most important considerations for you when eating/preparing food in home, can you rank the
following factors from 1 to 11 where 1 is the most important consideration to 11 which is the least important consideration?
Taste
Quality
Healthiness
Freshness
Ease of preparation
Enjoyment
Safeness of food
Nutritional value
Value for money
Price
Variety
1st 1st/2nd
11-019758/Bia Periscope Study 2011 Master/Sept 2011
PERIscope
106
Food Behaviours At Lunch Time
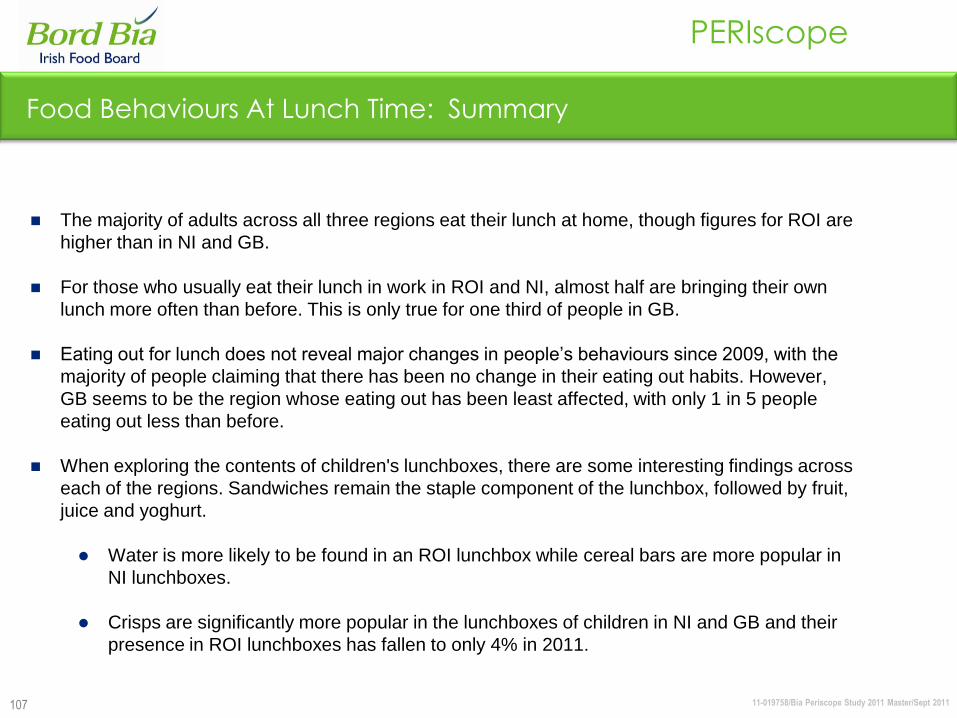
11-019758/Bia Periscope Study 2011 Master/Sept 2011
PERIscope
107
Food Behaviours At Lunch Time: Summary
The majority of adults across all three regions eat their lunch at home, though figures for ROI are
higher than in NI and GB.
For those who usually eat their lunch in work in ROI and NI, almost half are bringing their own
lunch more often than before. This is only true for one third of people in GB.
Eating out for lunch does not reveal major changes in people‟s behaviours since 2009, with the
majority of people claiming that there has been no change in their eating out habits. However,
GB seems to be the region whose eating out has been least affected, with only 1 in 5 people
eating out less than before.
When exploring the contents of children's lunchboxes, there are some interesting findings across
each of the regions. Sandwiches remain the staple component of the lunchbox, followed by fruit,
juice and yoghurt.
Water is more likely to be found in an ROI lunchbox while cereal bars are more popular in
NI lunchboxes.
Crisps are significantly more popular in the lunchboxes of children in NI and GB and their
presence in ROI lunchboxes has fallen to only 4% in 2011.
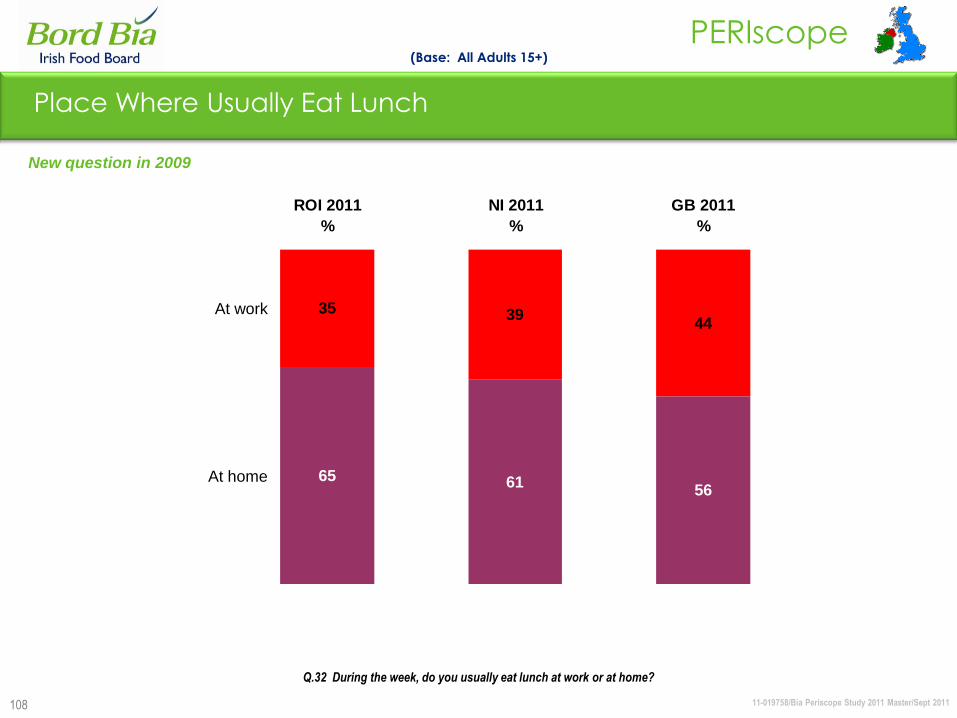
11-019758/Bia Periscope Study 2011 Master/Sept 2011
PERIscope
108
44
56
35 39
6165
ROI 2011
%
NI 2011
%
GB 2011
%
At work
At home
(Base: All Adults 15+)
Place Where Usually Eat Lunch
New question in 2009
Q.32 During the week, do you usually eat lunch at work or at home?
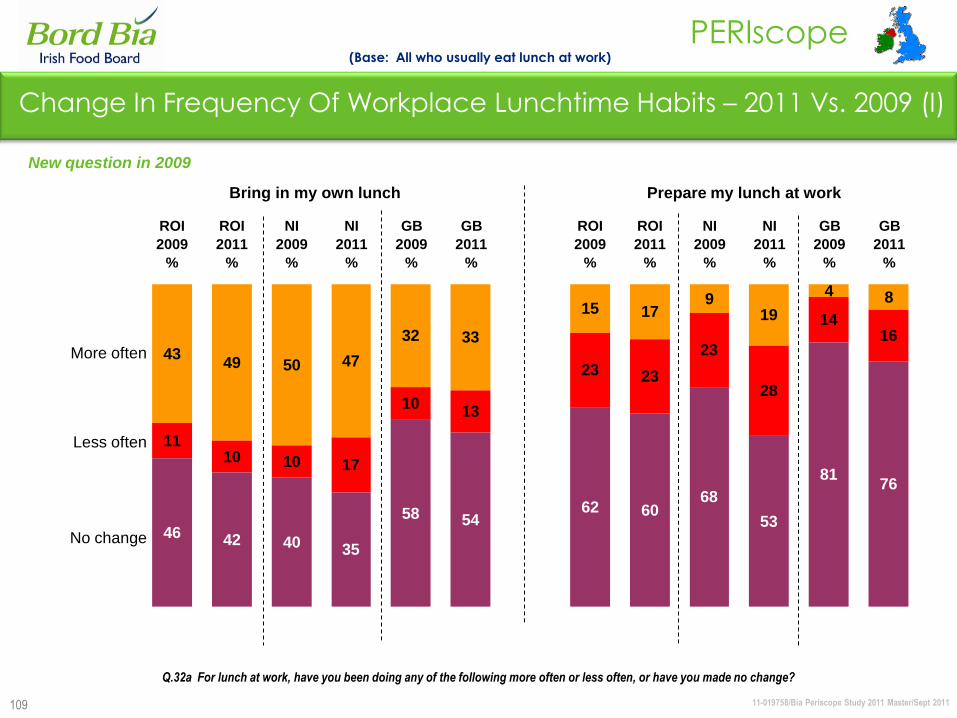
11-019758/Bia Periscope Study 2011 Master/Sept 2011
PERIscope
109
50 47
15 179
19
4 8
10 17
23 23
23
28
1416
40 35
62 6068
53
8176
4349
32 33
1310
1110
58 54
4246
ROI
2009
%
ROI
2011
%
NI
2009
%
NI
2011
%
GB
2009
%
GB
2011
%
ROI
2009
%
ROI
2011
%
NI
2009
%
NI
2011
%
GB
2009
%
GB
2011
%
More often
Less often
No change
(Base: All who usually eat lunch at work)
Change In Frequency Of Workplace Lunchtime Habits – 2011 Vs. 2009 (I)
New question in 2009
Q.32a For lunch at work, have you been doing any of the following more often or less often, or have you made no change?
Bring in my own lunch Prepare my lunch at work
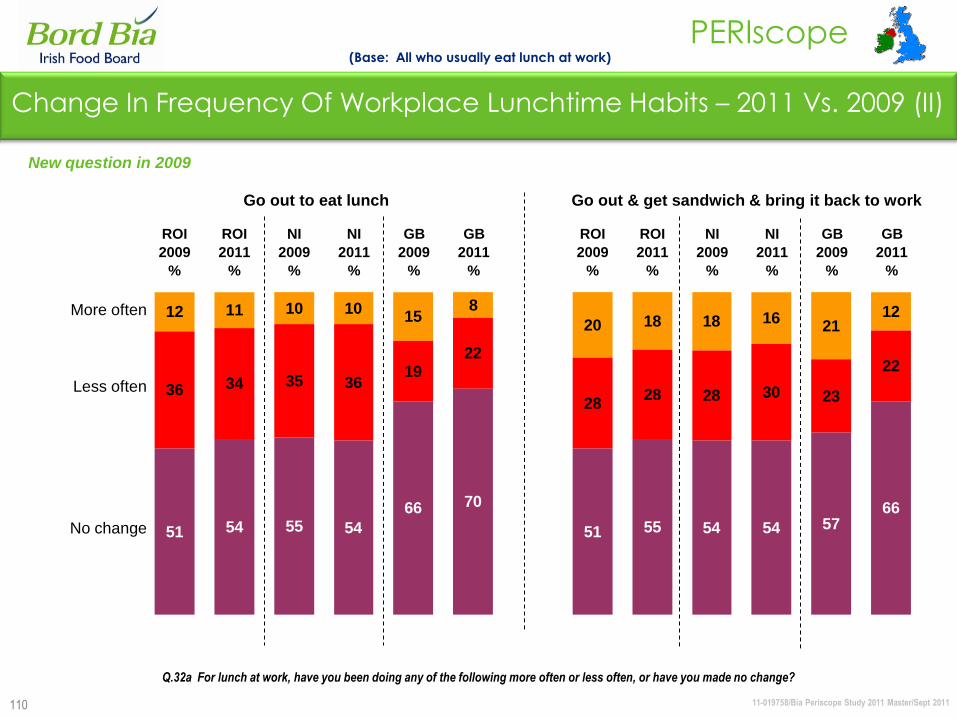
11-019758/Bia Periscope Study 2011 Master/Sept 2011
PERIscope
110
10 1020 18 18 16
2112
35 36
2828 28 30 23
22
55 54 51 55 54 54 5766
8151112
343619
22
51 54
7066
ROI
2009
%
ROI
2011
%
NI
2009
%
NI
2011
%
GB
2009
%
GB
2011
%
ROI
2009
%
ROI
2011
%
NI
2009
%
NI
2011
%
GB
2009
%
GB
2011
%
More often
Less often
No change
(Base: All who usually eat lunch at work)
Change In Frequency Of Workplace Lunchtime Habits – 2011 Vs. 2009 (II)
New question in 2009
Q.32a For lunch at work, have you been doing any of the following more often or less often, or have you made no change?
Go out to eat lunch Go out & get sandwich & bring it back to work
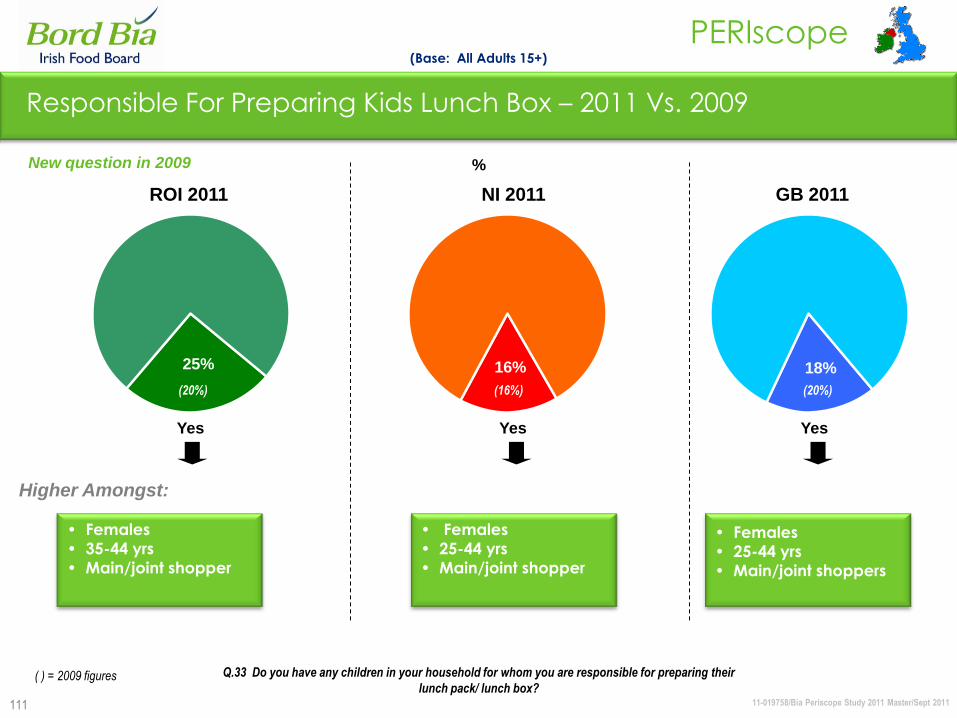
11-019758/Bia Periscope Study 2011 Master/Sept 2011
PERIscope
111
Responsible For Preparing Kids Lunch Box – 2011 Vs. 2009
Yes Yes Yes
• Females
• 25-44 yrs
• Main/joint shopper
• Females
• 25-44 yrs
• Main/joint shoppers
• Females
• 35-44 yrs
• Main/joint shopper
Higher Amongst:
(Base: All Adults 15+)
Q.33 Do you have any children in your household for whom you are responsible for preparing their
lunch pack/ lunch box?
New question in 2009 %
ROI 2011 NI 2011 GB 2011
25% 16% 18%
( ) = 2009 figures
(20%) (16%) (20%)
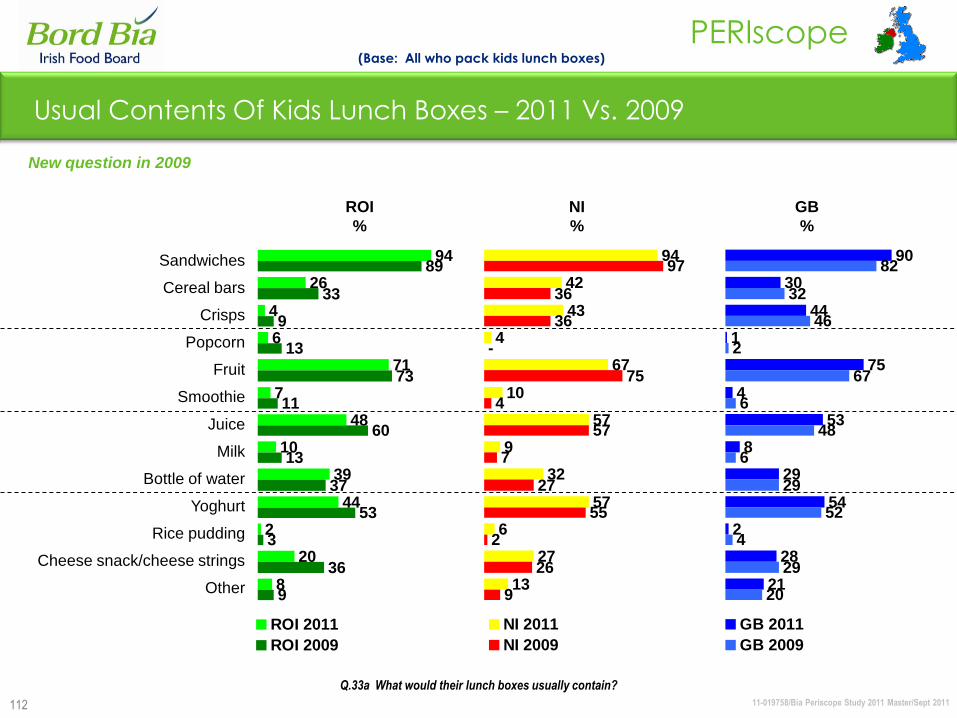
11-019758/Bia Periscope Study 2011 Master/Sept 2011
PERIscope
112
Usual Contents Of Kids Lunch Boxes – 2011 Vs. 2009
94
26
4
6
71
7
48
10
39
44
2
20
8
89
33
9
13
73
11
60
13
37
53
3
36
9
ROI 2011
ROI 2009
(Base: All who pack kids lunch boxes)
Q.33a What would their lunch boxes usually contain?
Sandwiches
Cereal bars
Crisps
Popcorn
Fruit
Smoothie
Juice
Milk
Bottle of water
Yoghurt
Rice pudding
Cheese snack/cheese strings
Other
New question in 2009
GB
%
ROI
%
NI
%
94
42
43
4
67
10
57
9
32
57
6
27
13
97
36
36
75
4
57
7
27
55
2
26
9
-
NI 2011
NI 2009
90
30
44
1
75
4
53
8
29
54
2
28
21
82
32
46
67
6
48
6
29
52
4
29
20
2
GB 2011
GB 2009

Eating in Home
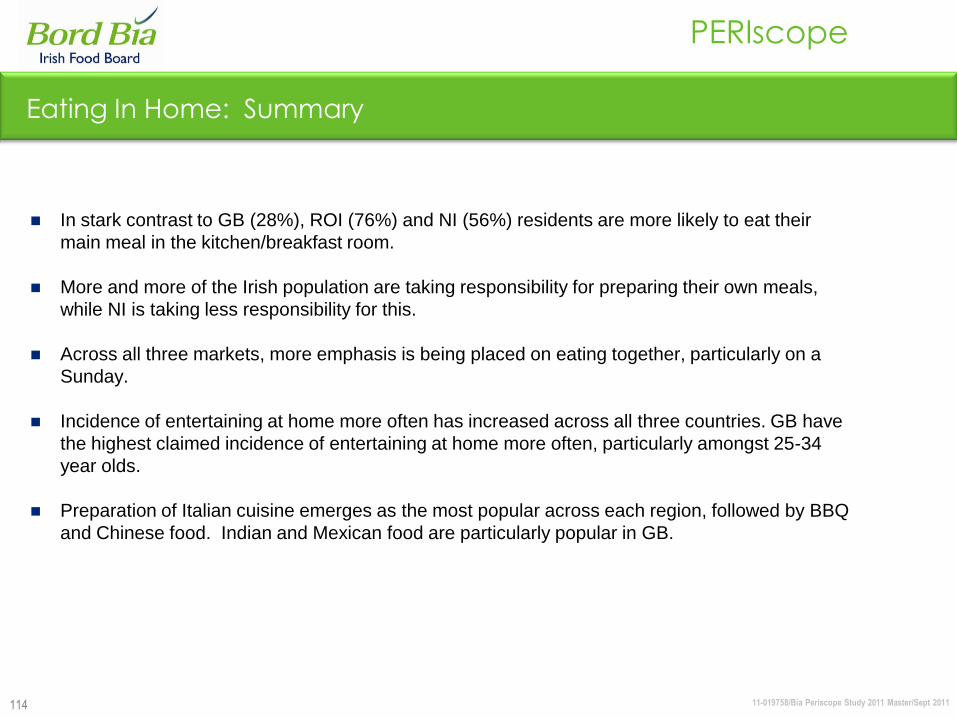
11-019758/Bia Periscope Study 2011 Master/Sept 2011
PERIscope
114
Eating In Home: Summary
In stark contrast to GB (28%), ROI (76%) and NI (56%) residents are more likely to eat their
main meal in the kitchen/breakfast room.
More and more of the Irish population are taking responsibility for preparing their own meals,
while NI is taking less responsibility for this.
Across all three markets, more emphasis is being placed on eating together, particularly on a
Sunday.
Incidence of entertaining at home more often has increased across all three countries. GB have
the highest claimed incidence of entertaining at home more often, particularly amongst 25-34
year olds.
Preparation of Italian cuisine emerges as the most popular across each region, followed by BBQ
and Chinese food. Indian and Mexican food are particularly popular in GB.
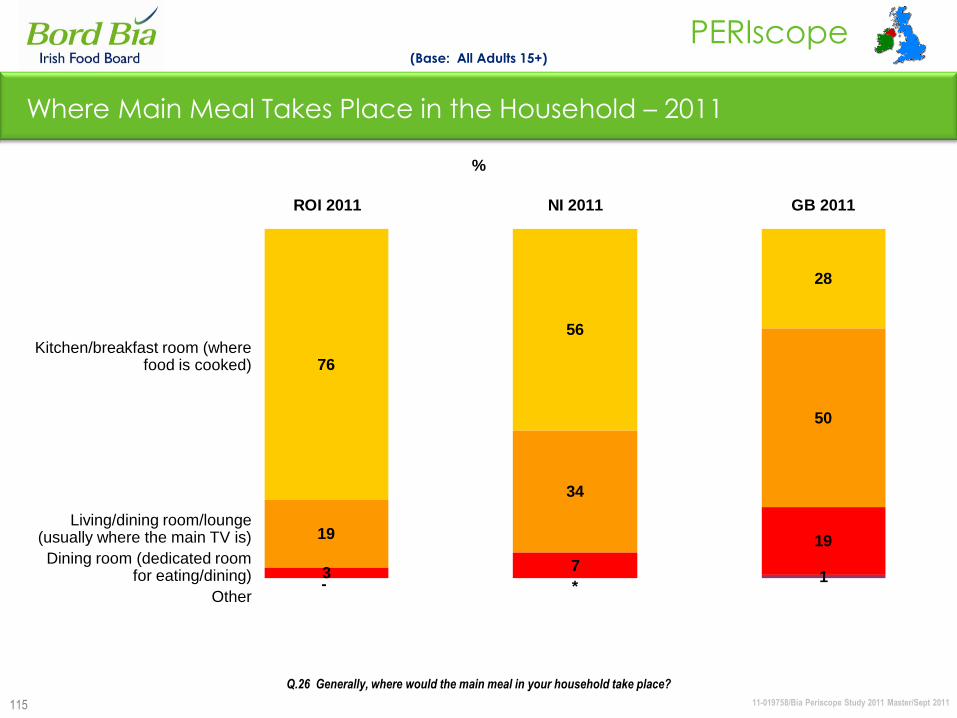
11-019758/Bia Periscope Study 2011 Master/Sept 2011
PERIscope
115
76
56
28
19
34
50
3 7
19
1- *
ROI 2011 NI 2011 GB 2011
Kitchen/breakfast room (where food is cooked)
Living/dining room/lounge (usually where the main TV is)
Dining room (dedicated room for eating/dining)
Other
%
Where Main Meal Takes Place in the Household – 2011
(Base: All Adults 15+)
Q.26 Generally, where would the main meal in your household take place?
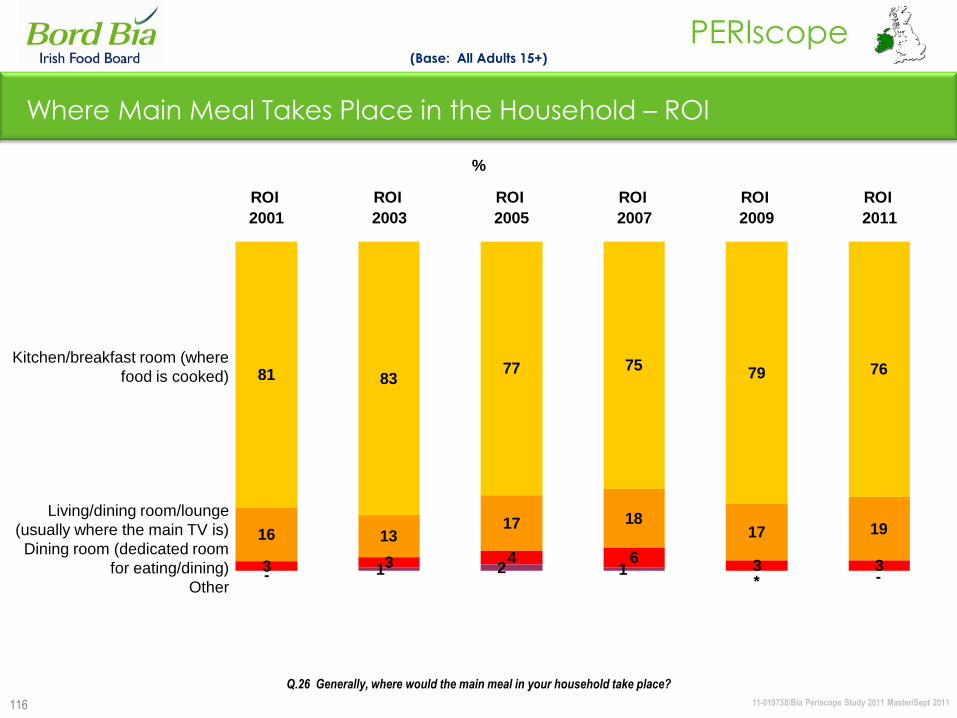
11-019758/Bia Periscope Study 2011 Master/Sept 2011
PERIscope
116
81 8377 75
79 76
16 1317 18
17 19
3 3 4 63 3
-*121-
ROI
2001
ROI
2003
ROI
2005
ROI
2007
ROI
2009
ROI
2011
Where Main Meal Takes Place in the Household – ROI
Kitchen/breakfast room (where
food is cooked)
Living/dining room/lounge
(usually where the main TV is)
Dining room (dedicated room
for eating/dining)
Other
%
Q.26 Generally, where would the main meal in your household take place?
(Base: All Adults 15+)
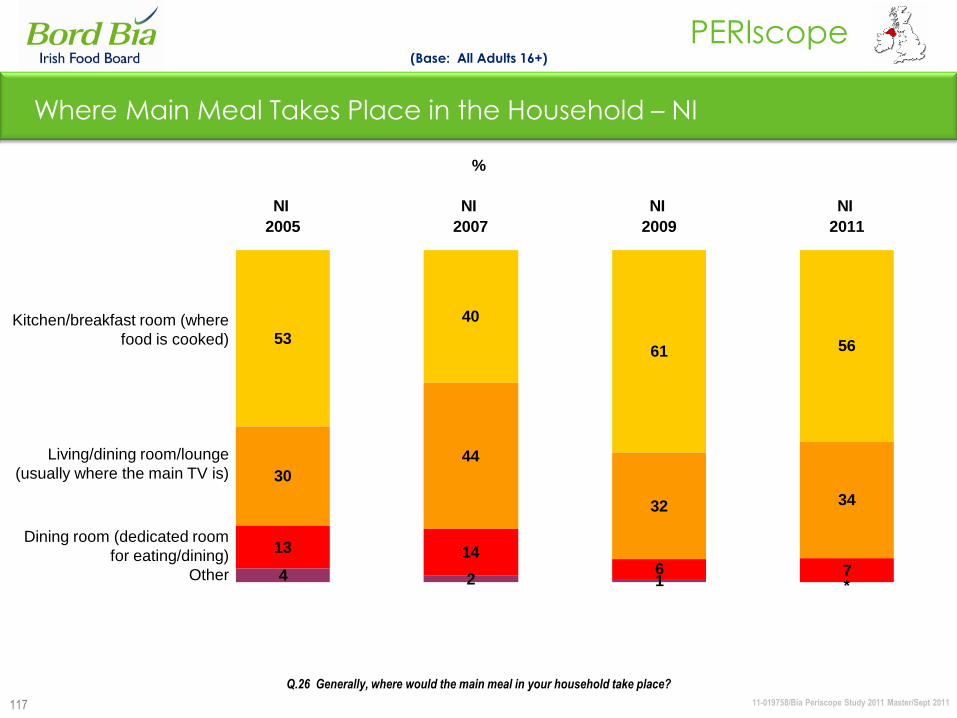
11-019758/Bia Periscope Study 2011 Master/Sept 2011
PERIscope
117
53
40
61 56
30
44
32 34
13 146 74 2 1 *
NI
2005
NI
2007
NI
2009
NI
2011
Where Main Meal Takes Place in the Household – NI
%
Q.26 Generally, where would the main meal in your household take place?
(Base: All Adults 16+)
Kitchen/breakfast room (where
food is cooked)
Living/dining room/lounge
(usually where the main TV is)
Dining room (dedicated room
for eating/dining)
Other
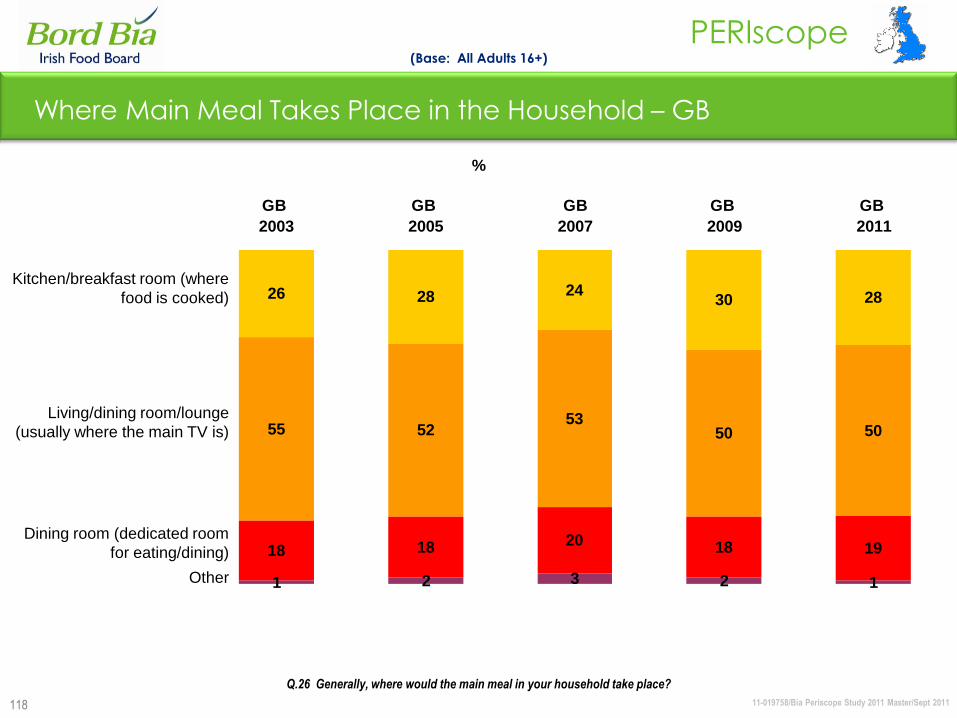
11-019758/Bia Periscope Study 2011 Master/Sept 2011
PERIscope
118
26 28 2430 28
55 5253
50 50
18 18 20 18 19
1 2 3 2 1
GB
2003
GB
2005
GB
2007
GB
2009
GB
2011
Where Main Meal Takes Place in the Household – GB
%
Q.26 Generally, where would the main meal in your household take place?
(Base: All Adults 16+)
Kitchen/breakfast room (where
food is cooked)
Living/dining room/lounge
(usually where the main TV is)
Dining room (dedicated room
for eating/dining)
Other

11-019758/Bia Periscope Study 2011 Master/Sept 2011
PERIscope
119
5142
55
19
22
28
2833
16
2 2 1
ROI 2011 NI 2011 GB 2011
Always prepare own meal
Sometimes prepare own meal
Someone else prepares meal
Other/couldn‟t say
%
(Base: All Adults 15+)
Responsibility for Meal Preparation in the Home – 2011
Q.31 Thinking in general about meals that involve some preparation, do you always prepare your own meals, sometimes prepare
your own meals or does someone else usually do the meal preparation in your household?
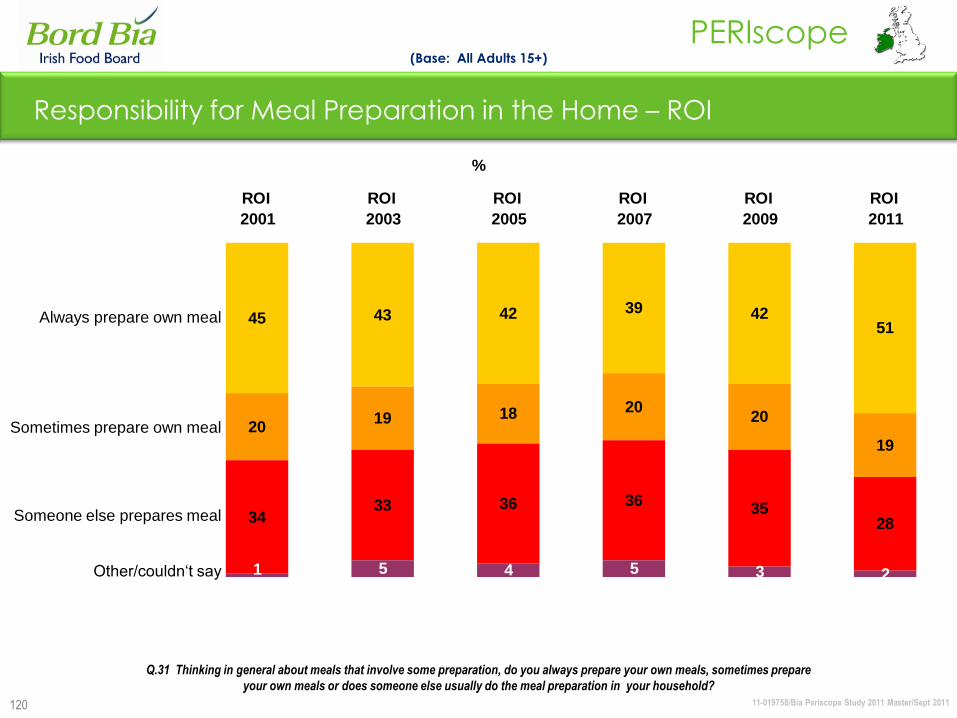
11-019758/Bia Periscope Study 2011 Master/Sept 2011
PERIscope
120
Responsibility for Meal Preparation in the Home – ROI
(Base: All Adults 15+)
Always prepare own meal
Sometimes prepare own meal
Someone else prepares meal
Other/couldn„t say
Q.31 Thinking in general about meals that involve some preparation, do you always prepare your own meals, sometimes prepare
your own meals or does someone else usually do the meal preparation in your household?
45 43 42 39 4251
2019 18 20
20
19
3433 36 36
3528
5 4 5 3 21
ROI
2001
ROI
2003
ROI
2005
ROI
2007
ROI
2009
ROI
2011
%
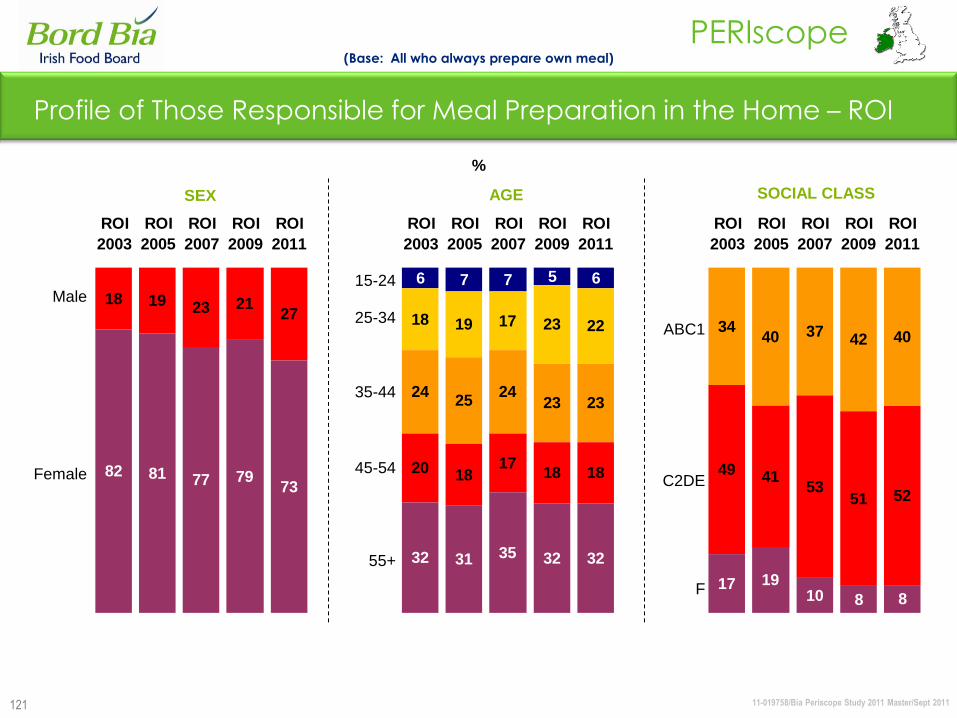
11-019758/Bia Periscope Study 2011 Master/Sept 2011
PERIscope
121
6 7 5 6
18 17 23 22
2425
2423 23
3440 37
42 40
18 19 23 2127
20 1718 18 49 41
5351 52
82 81 77 7973
32 35 32 32
17 1910 8 8
7
19
18
31
ROI
2003
ROI
2005
ROI
2007
ROI
2009
ROI
2011
ROI
2003
ROI
2005
ROI
2007
ROI
2009
ROI
2011
ROI
2003
ROI
2005
ROI
2007
ROI
2009
ROI
2011
Male
Female
15-24
25-34
35-44
45-54
55+
SEX AGE SOCIAL CLASS
ABC1
C2DE
F
%
Profile of Those Responsible for Meal Preparation in the Home – ROI
(Base: All who always prepare own meal)
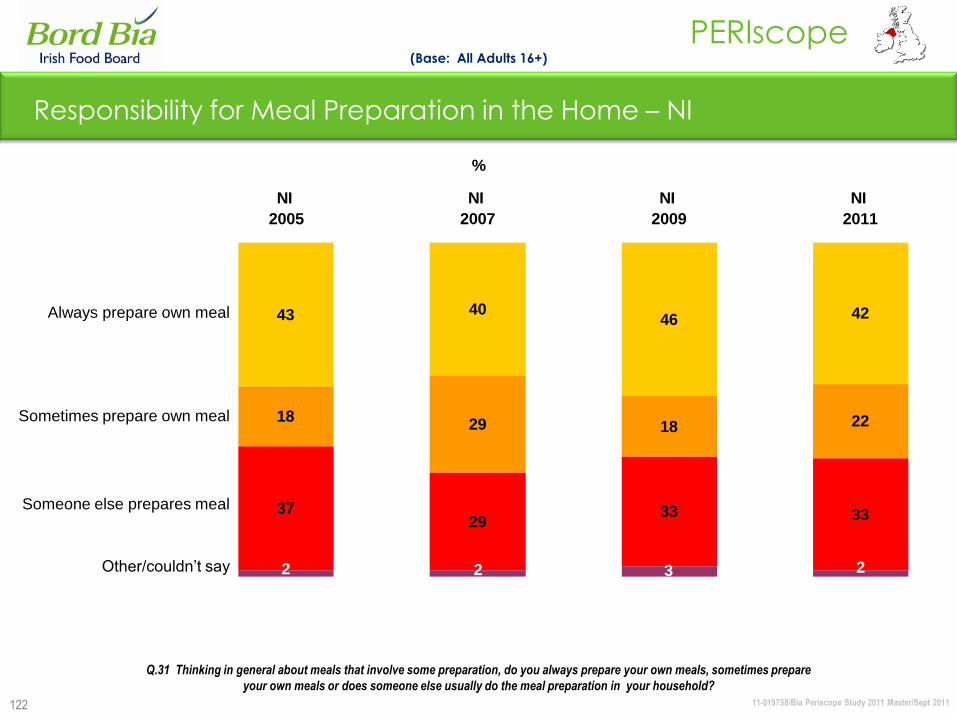
11-019758/Bia Periscope Study 2011 Master/Sept 2011
PERIscope
122
Responsibility for Meal Preparation in the Home – NI
(Base: All Adults 16+)
Always prepare own meal
Sometimes prepare own meal
Someone else prepares meal
Other/couldn‟t say
Q.31 Thinking in general about meals that involve some preparation, do you always prepare your own meals, sometimes prepare
your own meals or does someone else usually do the meal preparation in your household?
%
43 4046 42
1829 18 22
3729
33 33
2 232
NI
2005
NI
2007
NI
2009
NI
2011
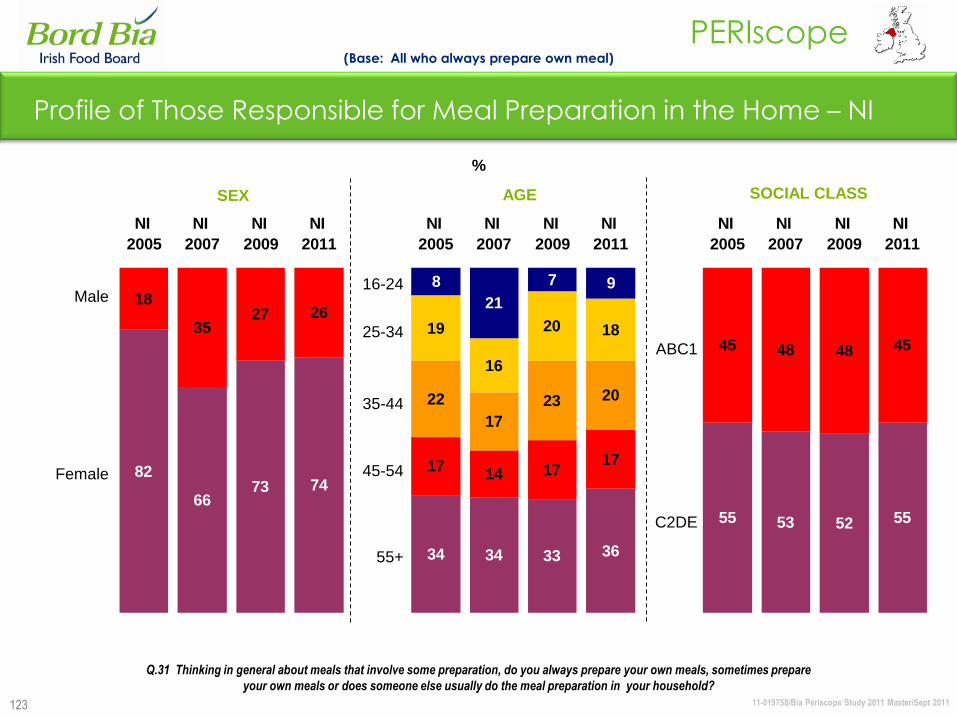
11-019758/Bia Periscope Study 2011 Master/Sept 2011
PERIscope
123
8
21
7
20
22
17
23 20
18
3527 26
1714 17
45 48 48 45
82
6673 74
34 34 33
55 53 52 55
9
16
19 18
17
36
NI
2005
NI
2007
NI
2009
NI
2011
NI
2005
NI
2007
NI
2009
NI
2011
NI
2005
NI
2007
NI
2009
NI
2011
Male
Female
16-24
25-34
35-44
45-54
55+
SEX AGE SOCIAL CLASS
ABC1
C2DE
%
Profile of Those Responsible for Meal Preparation in the Home – NI
(Base: All who always prepare own meal)
Q.31 Thinking in general about meals that involve some preparation, do you always prepare your own meals, sometimes prepare
your own meals or does someone else usually do the meal preparation in your household?
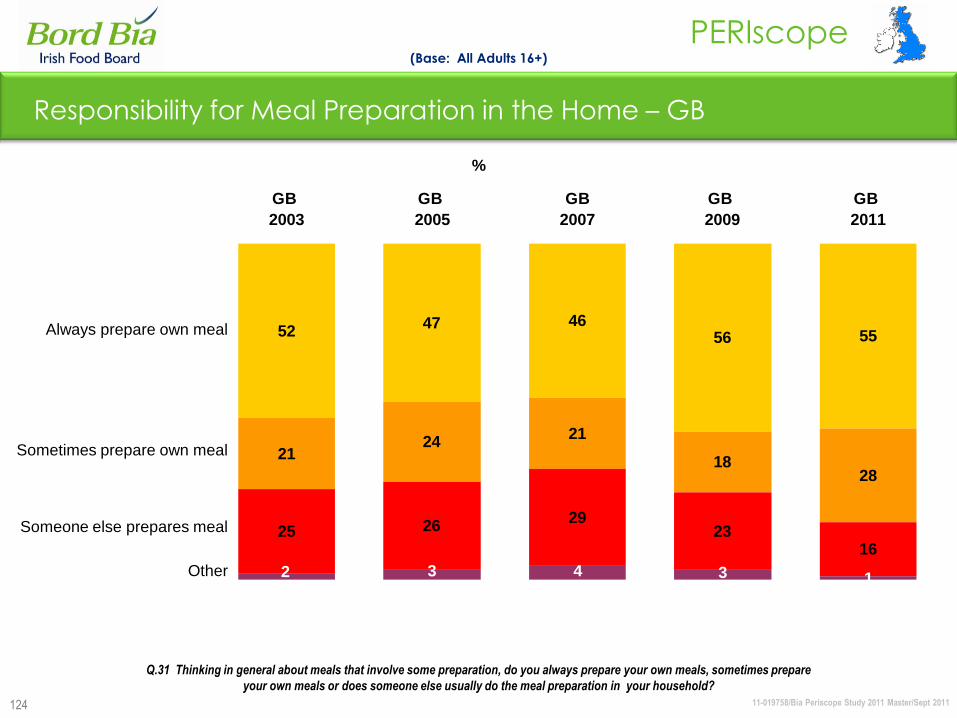
11-019758/Bia Periscope Study 2011 Master/Sept 2011
PERIscope
124
5247 46
56 55
2124
21
1828
25 2629
2316
12 343
GB
2003
GB
2005
GB
2007
GB
2009
GB
2011
Responsibility for Meal Preparation in the Home – GB
(Base: All Adults 16+)
Always prepare own meal
Sometimes prepare own meal
Someone else prepares meal
Other
Q.31 Thinking in general about meals that involve some preparation, do you always prepare your own meals, sometimes prepare
your own meals or does someone else usually do the meal preparation in your household?
%
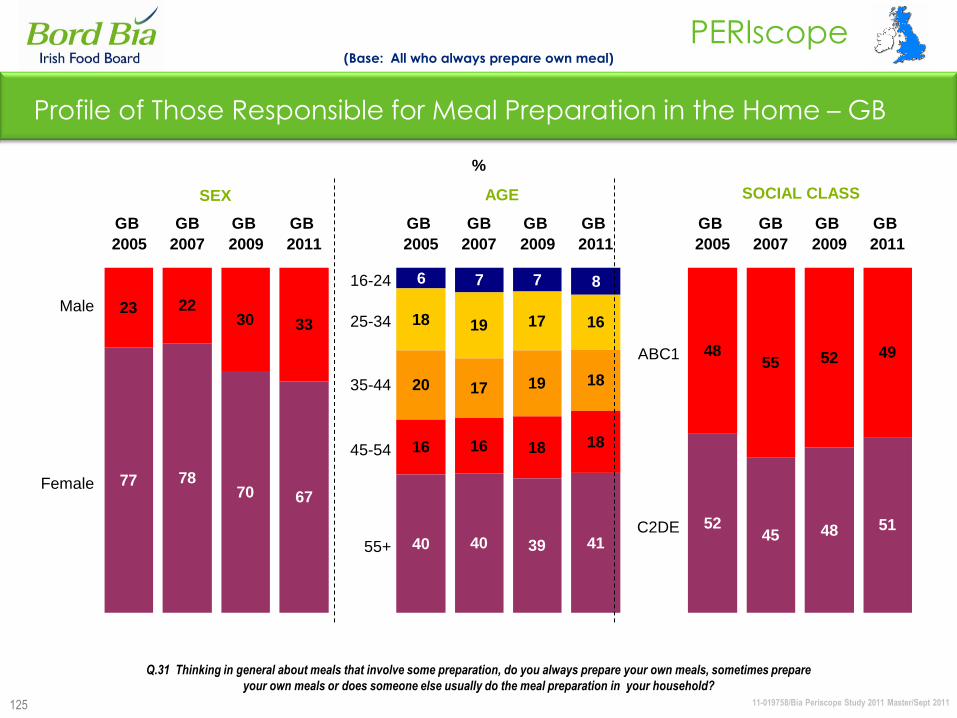
11-019758/Bia Periscope Study 2011 Master/Sept 2011
PERIscope
125
6 7 7
17
20 17 19 18
23 2230 33
16 16 18
4855 52 49
77 7870 67
40 40 39
5245 48 51
8
1918 16
18
41
GB
2005
GB
2007
GB
2009
GB
2011
GB
2005
GB
2007
GB
2009
GB
2011
GB
2005
GB
2007
GB
2009
GB
2011
Male
Female
16-24
25-34
35-44
45-54
55+
SEX AGE SOCIAL CLASS
ABC1
C2DE
%
Profile of Those Responsible for Meal Preparation in the Home – GB
(Base: All who always prepare own meal)
Q.31 Thinking in general about meals that involve some preparation, do you always prepare your own meals, sometimes prepare
your own meals or does someone else usually do the meal preparation in your household?
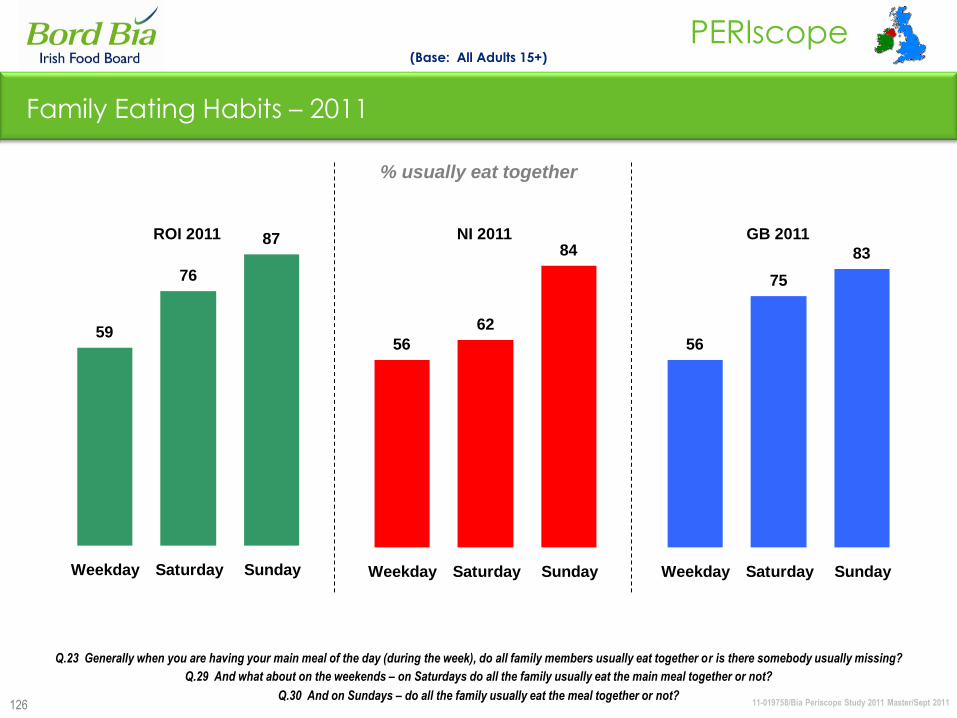
11-019758/Bia Periscope Study 2011 Master/Sept 2011
PERIscope
126
59
76
87
Weekday Saturday Sunday
56
62
84
Weekday Saturday Sunday
56
75
83
Weekday Saturday Sunday
Family Eating Habits – 2011
ROI 2011
% usually eat together
NI 2011 GB 2011
(Base: All Adults 15+)
Q.23 Generally when you are having your main meal of the day (during the week), do all family members usually eat together or is there somebody usually missing?
Q.29 And what about on the weekends – on Saturdays do all the family usually eat the main meal together or not?
Q.30 And on Sundays – do all the family usually eat the meal together or not?
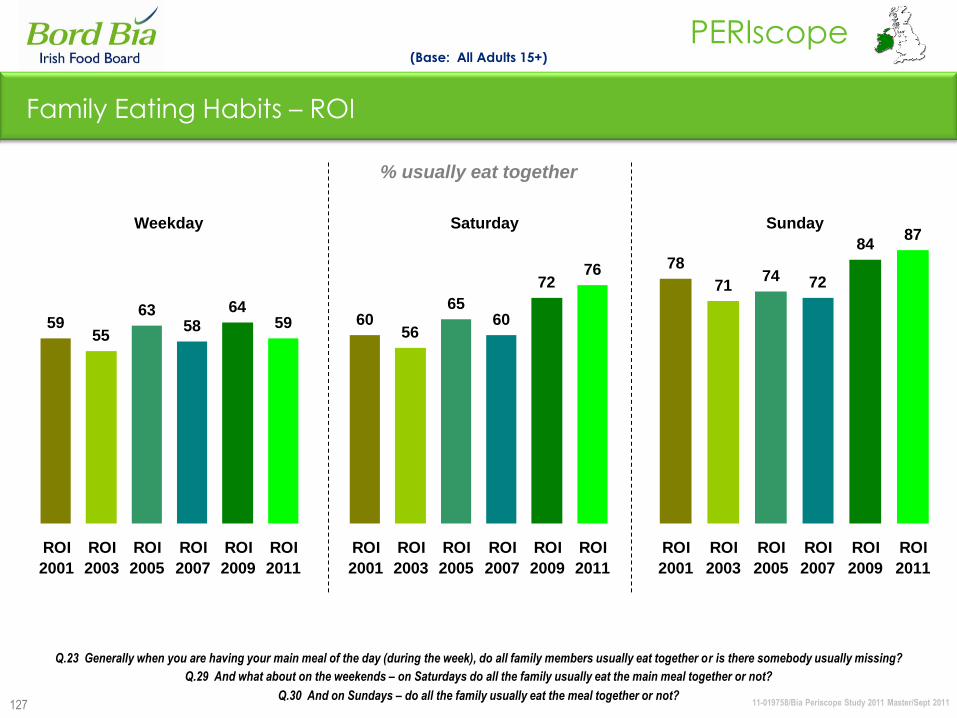
11-019758/Bia Periscope Study 2011 Master/Sept 2011
PERIscope
127
7174 72
8487
78
ROI
2001
ROI
2003
ROI
2005
ROI
2007
ROI
2009
ROI
2011
Family Eating Habits – ROI
Weekday Saturday Sunday
55
6358
645959
ROI
2001
ROI
2003
ROI
2005
ROI
2007
ROI
2009
ROI
2011
(Base: All Adults 15+)
% usually eat together
Q.23 Generally when you are having your main meal of the day (during the week), do all family members usually eat together or is there somebody usually missing?
Q.29 And what about on the weekends – on Saturdays do all the family usually eat the main meal together or not?
Q.30 And on Sundays – do all the family usually eat the meal together or not?
56
6560
7276
60
ROI
2001
ROI
2003
ROI
2005
ROI
2007
ROI
2009
ROI
2011
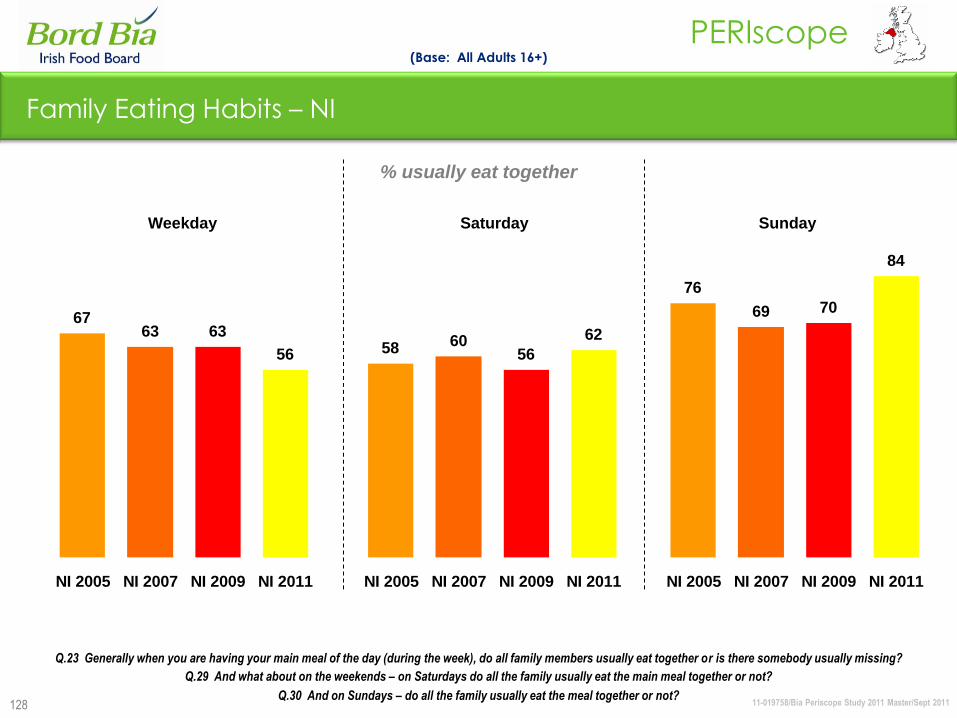
11-019758/Bia Periscope Study 2011 Master/Sept 2011
PERIscope
128
Family Eating Habits – NI
Weekday Saturday Sunday
69 70
84
76
NI 2005 NI 2007 NI 2009 NI 2011
(Base: All Adults 16+)
% usually eat together
Q.23 Generally when you are having your main meal of the day (during the week), do all family members usually eat together or is there somebody usually missing?
Q.29 And what about on the weekends – on Saturdays do all the family usually eat the main meal together or not?
Q.30 And on Sundays – do all the family usually eat the meal together or not?
6056
6258
NI 2005 NI 2007 NI 2009 NI 2011
63 63
56
67
NI 2005 NI 2007 NI 2009 NI 2011
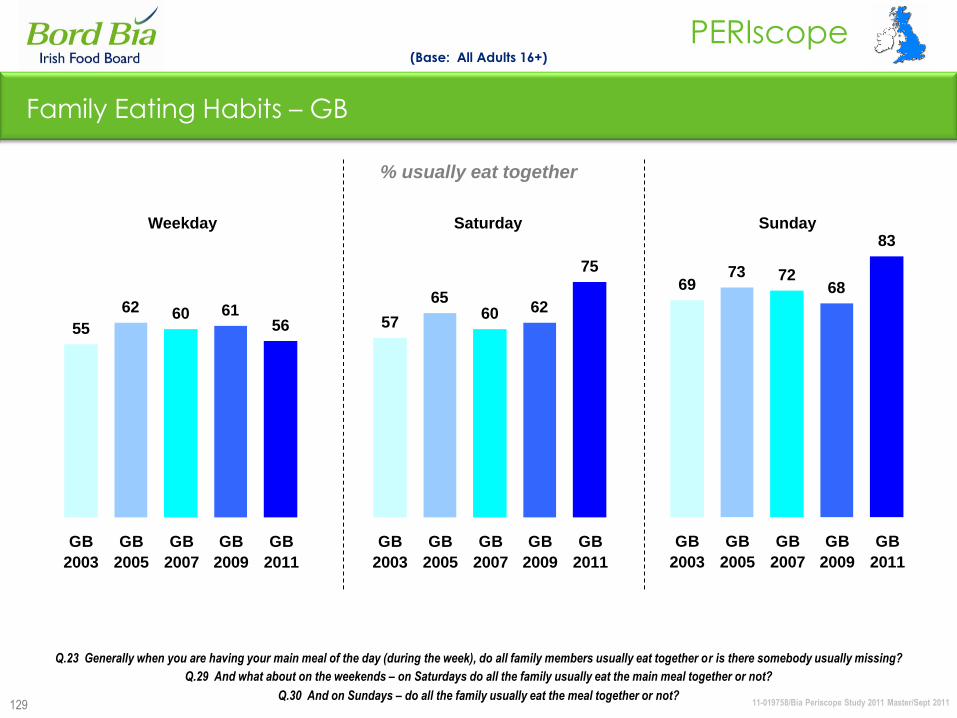
11-019758/Bia Periscope Study 2011 Master/Sept 2011
PERIscope
129
Family Eating Habits – GB
(Base: All Adults 16+)
Weekday Saturday Sunday
62 60 615655
GB
2003
GB
2005
GB
2007
GB
2009
GB
2011
6560 62
75
57
GB
2003
GB
2005
GB
2007
GB
2009
GB
2011
73 7268
83
69
GB
2003
GB
2005
GB
2007
GB
2009
GB
2011
% usually eat together
Q.23 Generally when you are having your main meal of the day (during the week), do all family members usually eat together or is there somebody usually missing?
Q.29 And what about on the weekends – on Saturdays do all the family usually eat the main meal together or not?
Q.30 And on Sundays – do all the family usually eat the meal together or not?

11-019758/Bia Periscope Study 2011 Master/Sept 2011
PERIscope
130
26%
ROI 2011
Members of the Family Missing – 2011
(Base: All Adults 15+)
Q.23 Generally when you are having your main meal of the day (during the week), do all family members
usually eat together or is there somebody usually missing?
21%
Usually
somebody
missing % 25%
GB 2011NI 2011
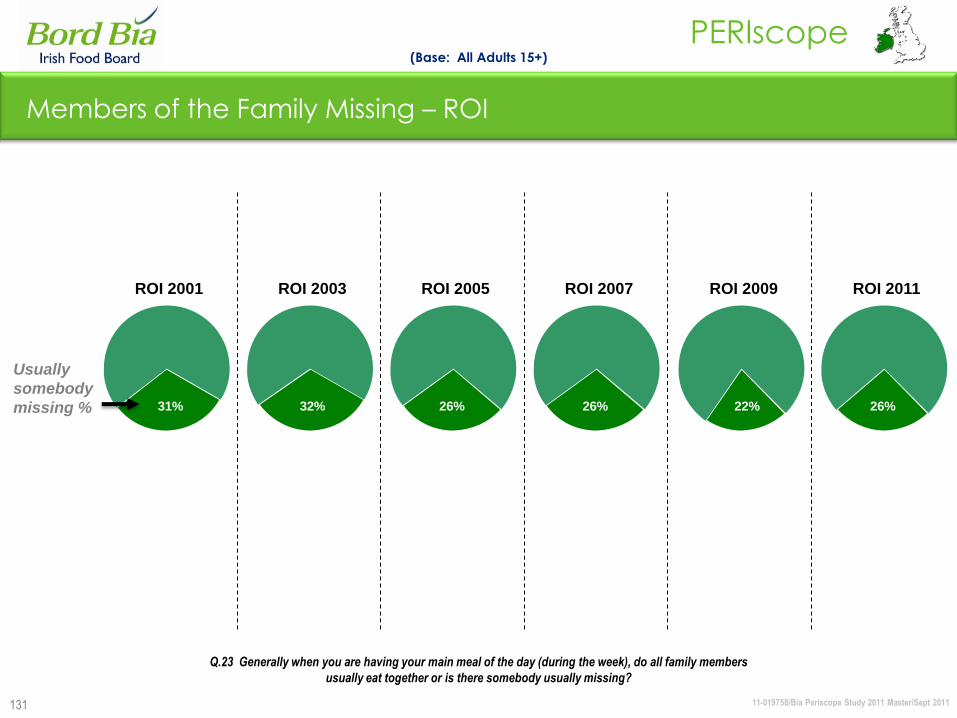
11-019758/Bia Periscope Study 2011 Master/Sept 2011
PERIscope
131
31%
Members of the Family Missing – ROI
(Base: All Adults 15+)
26%32%
ROI 2003ROI 2001
26%
Q.23 Generally when you are having your main meal of the day (during the week), do all family members
usually eat together or is there somebody usually missing?
Usually
somebody
missing % 22% 26%
ROI 2005 ROI 2007 ROI 2009 ROI 2011
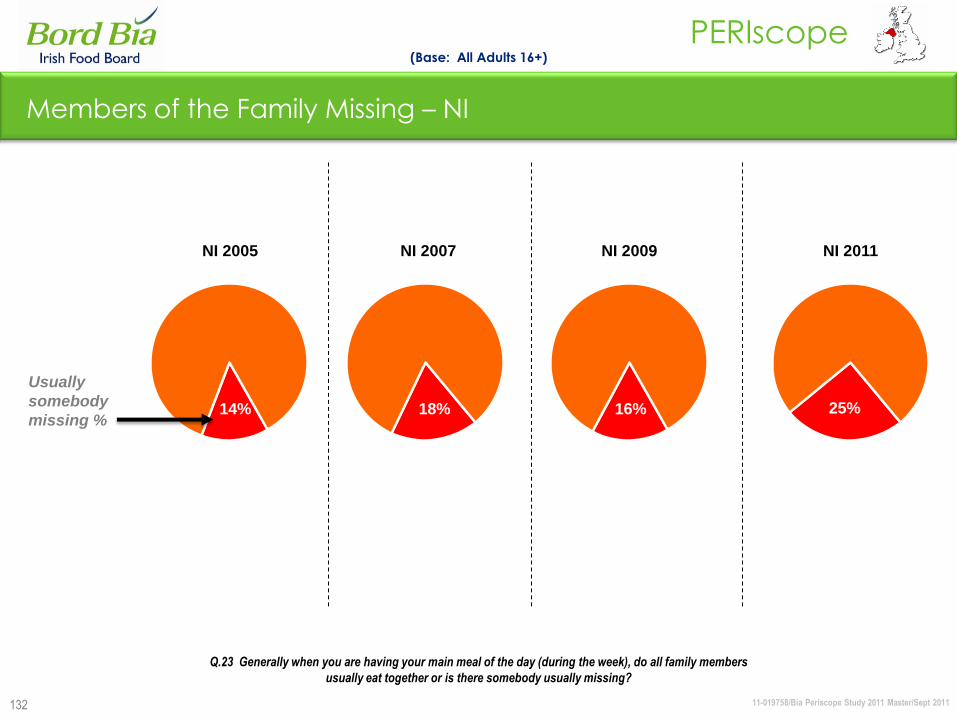
11-019758/Bia Periscope Study 2011 Master/Sept 2011
PERIscope
132
14%
Members of the Family Missing – NI
(Base: All Adults 16+)
18%
Q.23 Generally when you are having your main meal of the day (during the week), do all family members
usually eat together or is there somebody usually missing?
Usually
somebody
missing %16%
NI 2009NI 2007NI 2005
25%
NI 2011
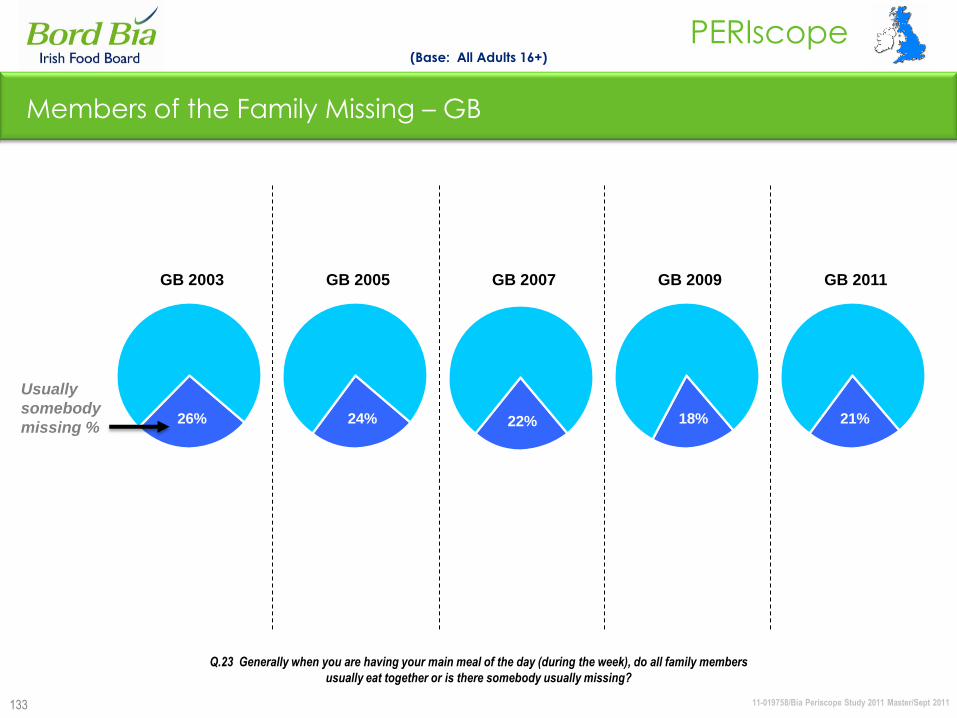
11-019758/Bia Periscope Study 2011 Master/Sept 2011
PERIscope
133
22%24%26%
Members of the Family Missing – GB
(Base: All Adults 16+)
Q.23 Generally when you are having your main meal of the day (during the week), do all family members
usually eat together or is there somebody usually missing?
Usually
somebody
missing %18%
GB 2009GB 2007GB 2005GB 2003
21%
GB 2011
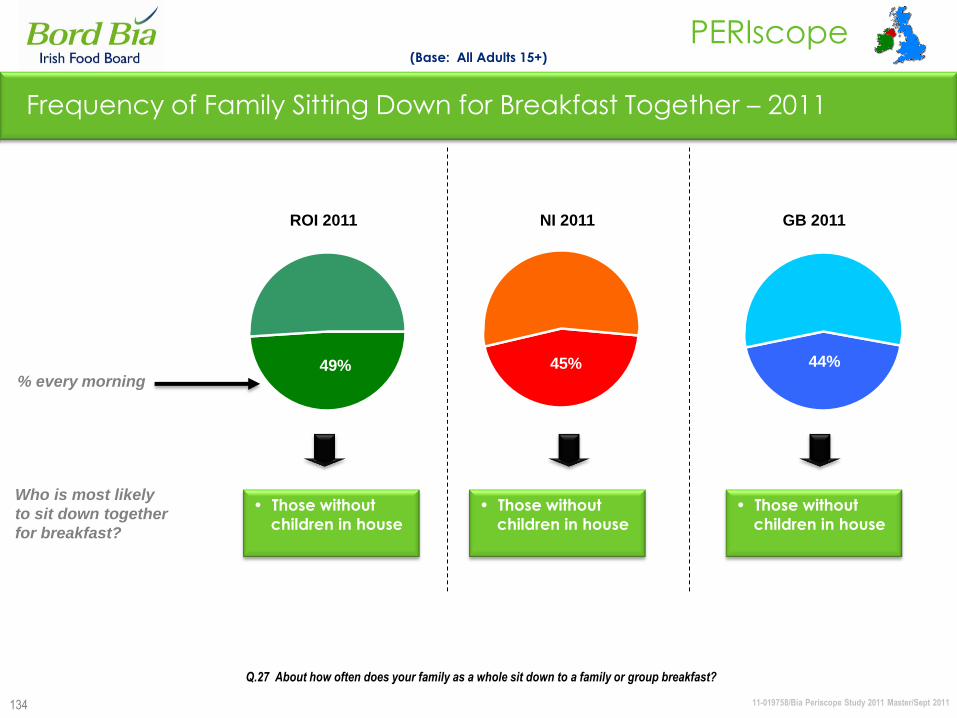
11-019758/Bia Periscope Study 2011 Master/Sept 2011
PERIscope
134
Frequency of Family Sitting Down for Breakfast Together – 2011
% every morning
• Those without
children in house
Who is most likely
to sit down together
for breakfast?
(Base: All Adults 15+)
49% 45% 44%
Q.27 About how often does your family as a whole sit down to a family or group breakfast?
GB 2011NI 2011ROI 2011
• Those without
children in house
• Those without
children in house
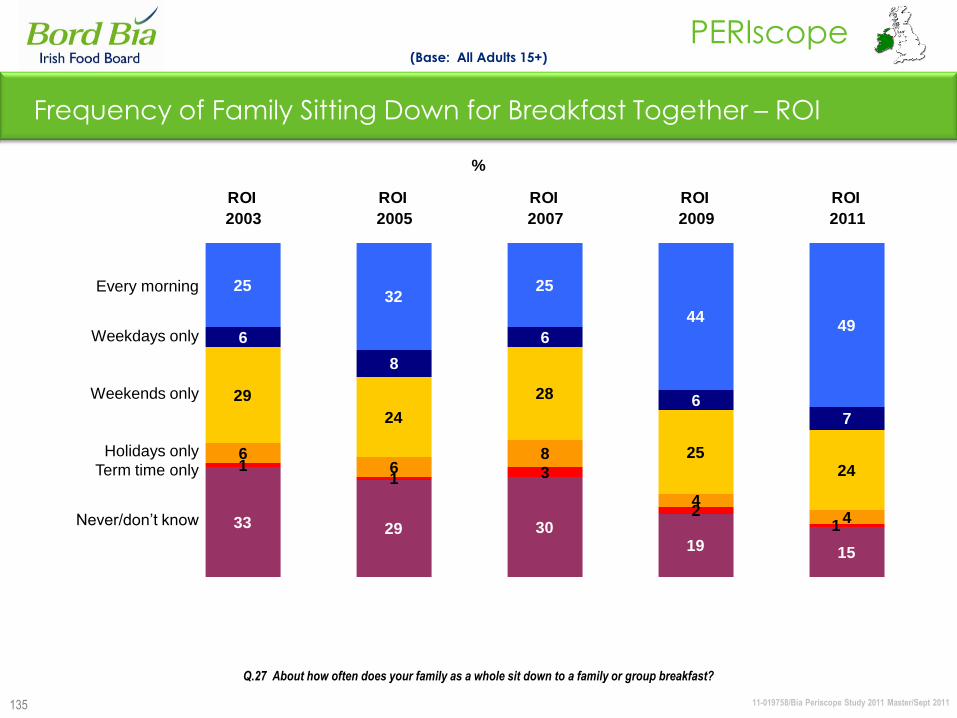
11-019758/Bia Periscope Study 2011 Master/Sept 2011
PERIscope
135
2532
25
4449
6
8
6
67
29
24
28
2524
66
8
44
11 3
233 29 30
19 15
1
ROI
2003
ROI
2005
ROI
2007
ROI
2009
ROI
2011
Every morning
Weekdays only
Weekends only
Holidays only
Term time only
Never/don‟t know
%
Frequency of Family Sitting Down for Breakfast Together – ROI
(Base: All Adults 15+)
Q.27 About how often does your family as a whole sit down to a family or group breakfast?

11-019758/Bia Periscope Study 2011 Master/Sept 2011
PERIscope
136
37
25
47 45
8
7
74
23
32
22
19
54
3
62
21
2530
2026
1
NI
2005
NI
2007
NI
2009
NI
2011
Frequency of Family Sitting Down for Breakfast Together – NI
(Base: All Adults 16+)
Q.27 About how often does your family as a whole sit down to a family or group breakfast?
Every morning
Weekdays only
Weekends only
Holidays only
Term time only
Never/don‟t know
%

11-019758/Bia Periscope Study 2011 Master/Sept 2011
PERIscope
137
19 1823
44 443 85
3 5
18
2527
2223
6
46
44
1
1
5345
38
27 24
*
1
-
GB
2003
GB
2005
GB
2007
GB
2009
GB
2011
Every morning
Weekdays only
Weekends only
Holidays only
Term time only
Never/don‟t know
Frequency of Family Sitting Down for Breakfast Together – GB
(Base: All Adults 16+)
Q.27 About how often does your family as a whole sit down to a family or group breakfast?
%

11-019758/Bia Periscope Study 2011 Master/Sept 2011
PERIscope
138
Frequency of Eating Various Types of Food – 2011
(Base: All grocery shoppers)
Prepared In Home
Italian
BBQ Food
Chinese
Mexican
Indian
French
Thai
Vietnamese
Other Ethnic
% Weekly or more frequently % Every month or more frequently
42
17
14
4
4
3
1
2
27
17
12
5
6
1
2
1
1
40
22
14
8
14
2
2
1
3
*
61
41
31
11
10
10
5
1
3
55
39
37
17
21
7
9
3
1
63
44
38
21
35
9
10
3
4
ROI 2011
NI 2011
GB 2011
Q.56 And how often would you eat each of the following types of foods …?
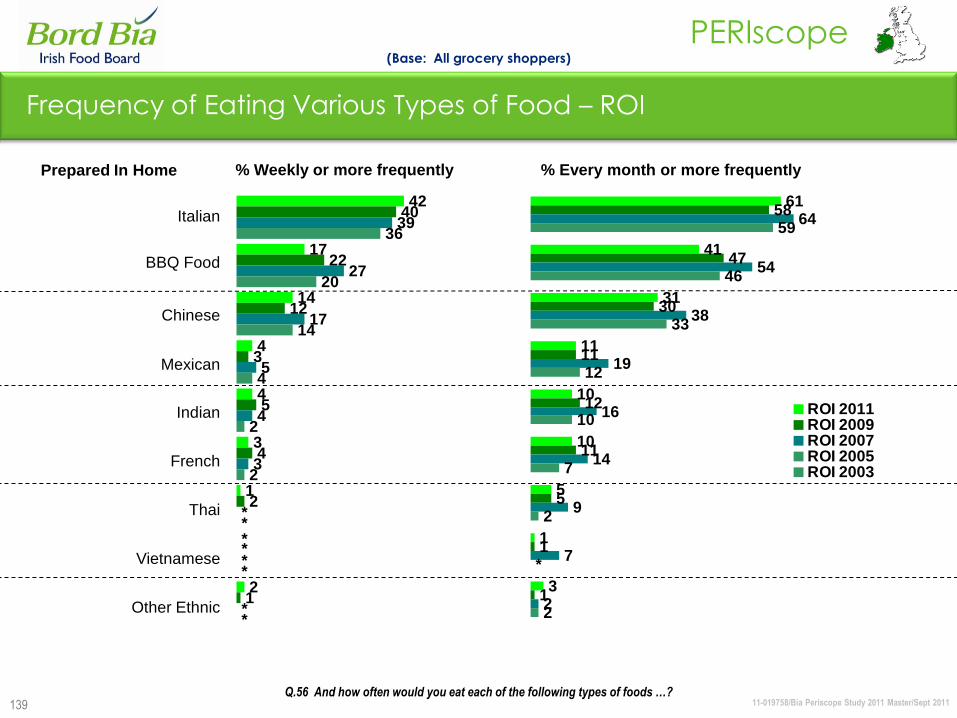
11-019758/Bia Periscope Study 2011 Master/Sept 2011
PERIscope
139
Frequency of Eating Various Types of Food – ROI
(Base: All grocery shoppers)
Prepared In Home
Q.56 And how often would you eat each of the following types of foods …?
% Weekly or more frequently % Every month or more frequently
42
17
14
4
4
3
1
2
40
22
12
3
5
4
2
1
39
27
17
5
4
3
36
20
14
4
2
2
**
*
*
*
*
*
*
Italian
BBQ Food
Chinese
Mexican
Indian
French
Thai
Vietnamese
Other Ethnic
61
41
31
11
10
10
5
1
3
58
47
30
11
12
11
5
1
1
64
54
38
19
16
14
9
7
2
59
46
33
12
10
7
2
2
*
ROI 2011ROI 2009ROI 2007ROI 2005ROI 2003
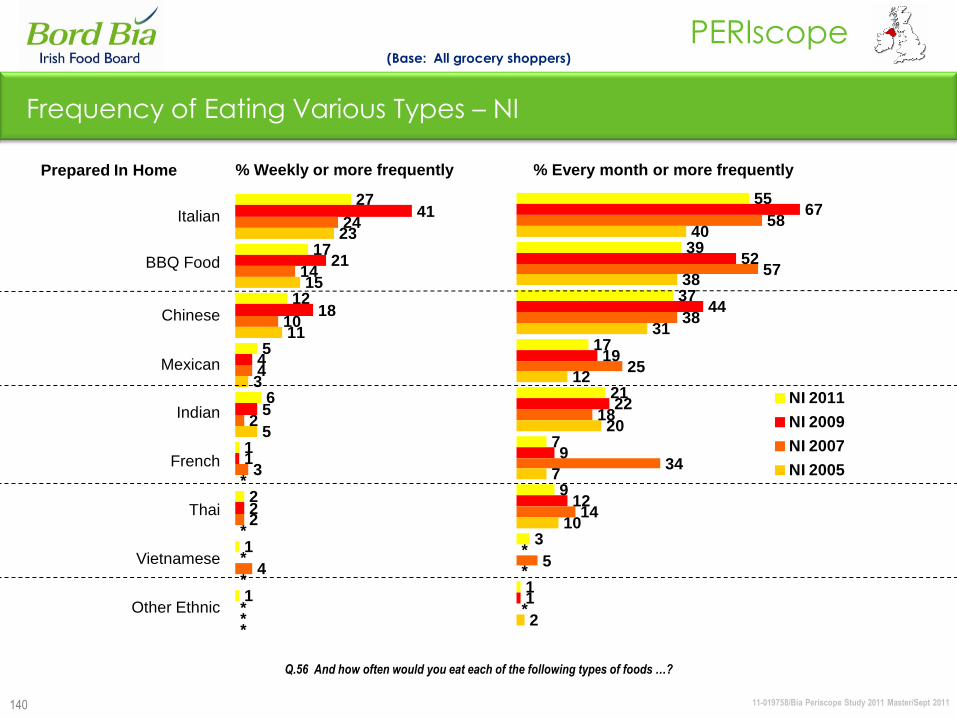
11-019758/Bia Periscope Study 2011 Master/Sept 2011
PERIscope
140
Frequency of Eating Various Types – NI
(Base: All grocery shoppers)
27
17
12
5
6
1
2
1
1
41
21
18
4
5
1
2
24
14
10
4
2
3
2
4
23
15
11
3
5
*
*
**
*
*
*
55
39
37
17
21
7
9
3
1
67
52
44
19
22
9
12
1
58
57
38
25
18
34
14
5
40
38
31
12
20
7
10
2
*
*
*
NI 2011
NI 2009
NI 2007
NI 2005
Q.56 And how often would you eat each of the following types of foods …?
Prepared In Home % Weekly or more frequently % Every month or more frequently
Italian
BBQ Food
Chinese
Mexican
Indian
French
Thai
Vietnamese
Other Ethnic
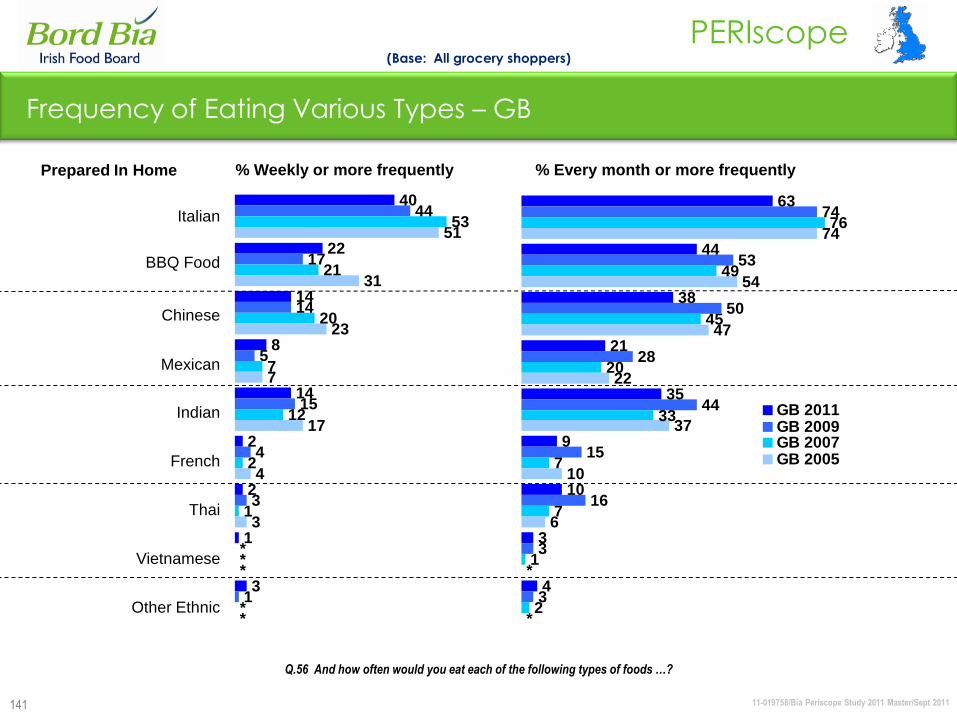
11-019758/Bia Periscope Study 2011 Master/Sept 2011
PERIscope
141
Frequency of Eating Various Types – GB
(Base: All grocery shoppers)
40
22
14
8
14
2
2
1
3
44
17
14
5
15
4
3
1
53
21
20
7
12
2
1
51
31
23
7
17
4
3
**
*
*
*
63
44
38
21
35
9
10
3
4
74
53
50
28
44
15
16
3
3
76
49
45
20
33
7
7
1
2
74
54
47
22
37
10
6
*
*
GB 2011GB 2009GB 2007GB 2005
Q.56 And how often would you eat each of the following types of foods …?
Prepared In Home % Weekly or more frequently % Every month or more frequently
Italian
BBQ Food
Chinese
Mexican
Indian
French
Thai
Vietnamese
Other Ethnic
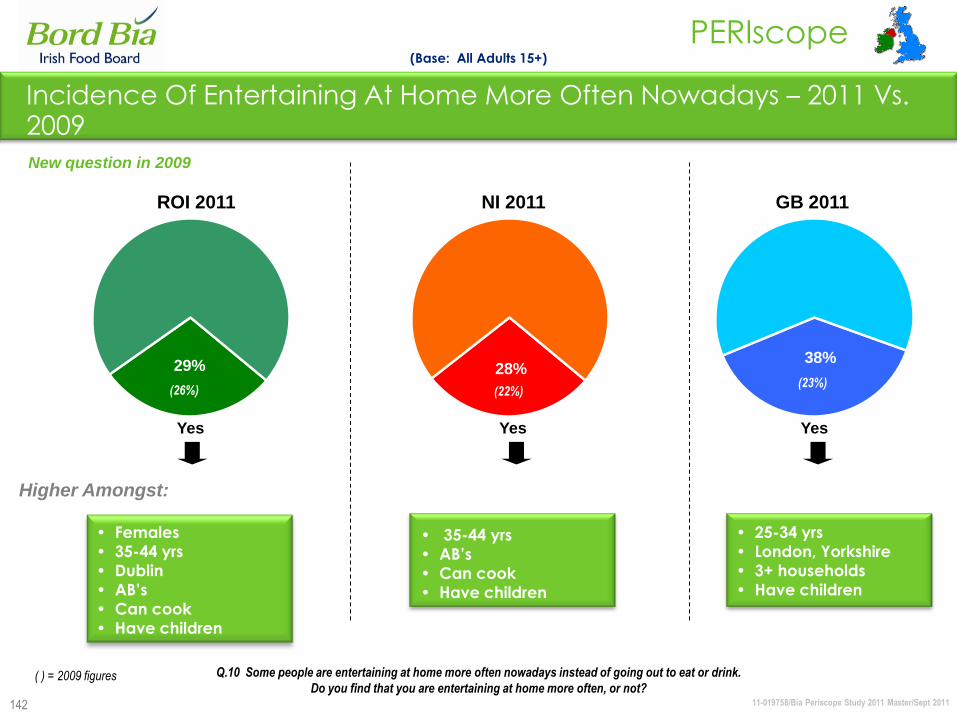
11-019758/Bia Periscope Study 2011 Master/Sept 2011
PERIscope
28%
142
Incidence Of Entertaining At Home More Often Nowadays – 2011 Vs. 2009
Yes Yes Yes
• 35-44 yrs
• AB‟s
• Can cook
• Have children
• 25-34 yrs
• London, Yorkshire
• 3+ households
• Have children
• Females
• 35-44 yrs
• Dublin
• AB‟s
• Can cook
• Have children
Higher Amongst:
(Base: All Adults 15+)
Q.10 Some people are entertaining at home more often nowadays instead of going out to eat or drink.
Do you find that you are entertaining at home more often, or not?
New question in 2009
ROI 2011 NI 2011 GB 2011
29%38%
( ) = 2009 figures
(26%) (22%)(23%)
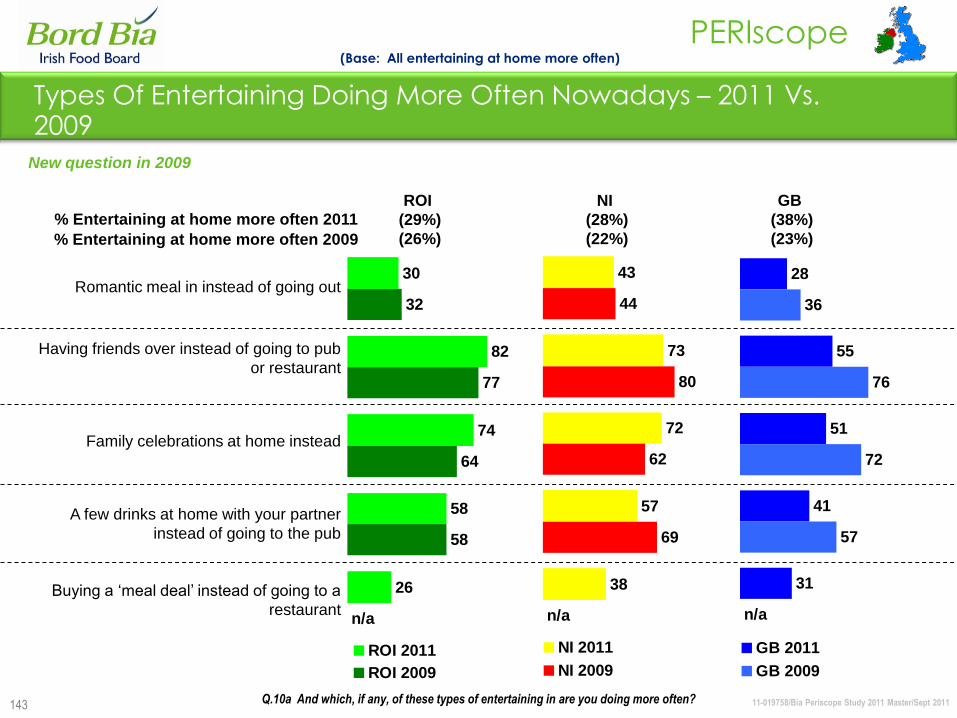
11-019758/Bia Periscope Study 2011 Master/Sept 2011
PERIscope
143
Types Of Entertaining Doing More Often Nowadays – 2011 Vs. 2009
30
82
74
58
26
32
77
64
58
n/a
ROI 2011
ROI 2009
Romantic meal in instead of going out
Having friends over instead of going to pub
or restaurant
Family celebrations at home instead
A few drinks at home with your partner
instead of going to the pub
Buying a „meal deal‟ instead of going to a
restaurant
(Base: All entertaining at home more often)
43
73
72
57
38
44
80
62
69
n/a
NI 2011
NI 2009
28
55
51
41
31
36
76
72
57
n/a
GB 2011
GB 2009
Q.10a And which, if any, of these types of entertaining in are you doing more often?
New question in 2009
GB
(38%)
(23%)
ROI
(29%)
(26%)
NI
(28%)
(22%)
% Entertaining at home more often 2011
% Entertaining at home more often 2009

11-019758/Bia Periscope Study 2011 Master/Sept 2011
PERIscope
144
Ideas To Make Eating In Different To Usual Dinner – 2011 Vs. 2009
66
39
34
22
37
51
55
21
52
25
57
41
29
21
37
52
54
24
49
24
ROI 2011
ROI 2009
I usually …
(Base: All Adults 15+)
49
56
37
31
32
42
44
20
32
21
55
60
37
30
34
46
49
20
35
20
NI 2011
NI 2009
66
52
44
36
37
50
53
23
42
25
71
51
54
35
43
55
60
27
48
34
GB 2011
GB 2009
Q.11 If you decide to eat in instead of going out, but want to make eating in different to your usual dinner,
would you usually do any of the following?
Cook from scratch, make a special meal
Get a takeaway
Try new food, experiment
Buy a „meal deal‟ from the supermarket
Create ambience – table setting, candles, music, etc.
Have wine with your meal/special bottle of wine
Have starter/dessert – more courses
Have an aperitif
Be more careful about the meat or fish you serve
Go to speciality/gourmet shop/buy some special food/ingredients
New question in 2009
GB
%
ROI
%
NI
%

Eating Out of Home
11-019758/Bia Periscope Study 2011 Master/Sept 2011
PERIscope
146
Eating Out Of Home: Summary
Although eating out of home more often during the week is more popular in GB and NI than ROI,
the percentage of people rarely/never eating out has increased steadily since 2007.
Being too tired and meeting up with friends are the key reasons cited to eat out in each region.
Across all three countries, the frequency of weekly visits to a variety of food outlets has declined
for the majority of food outlets since 2009.
The quality of food offered is the most important factor when eating in a premises out of home.
However, a significant decline is noted amongst NI residents.
Chinese food is the most popular food eaten when dining out of home, particularly in NI, followed
by Italian and BBQ food. Indian food is more popular in NI and GB than ROI.
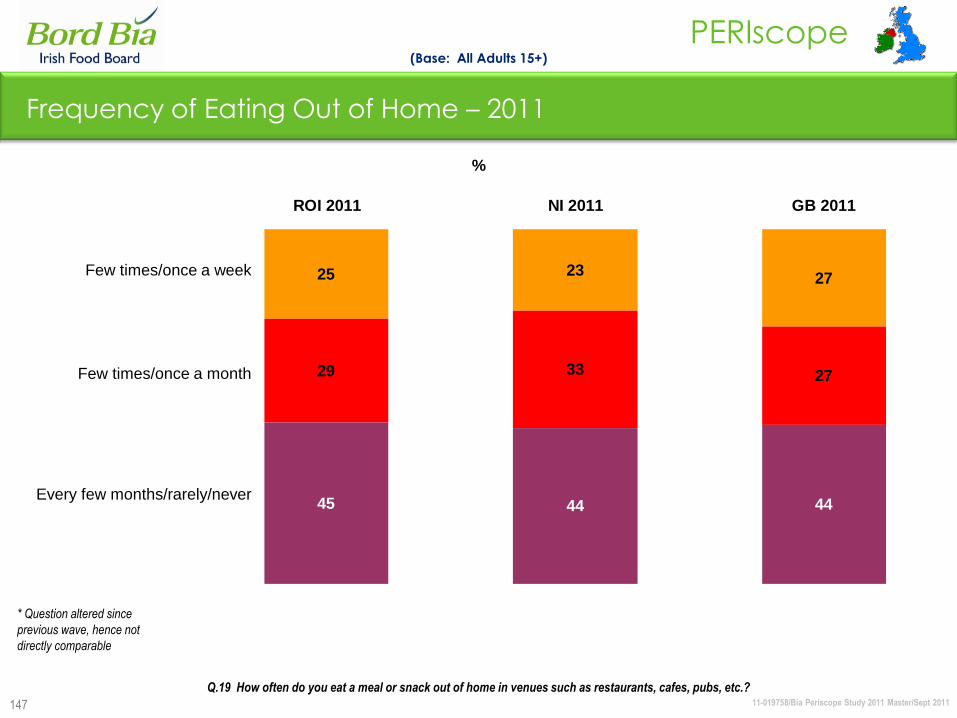
11-019758/Bia Periscope Study 2011 Master/Sept 2011
PERIscope
147
25 2327
29 33 27
45 44 44
ROI 2011 NI 2011 GB 2011
Few times/once a week
Few times/once a month
Every few months/rarely/never
%
(Base: All Adults 15+)
Frequency of Eating Out of Home – 2011
* Question altered since
previous wave, hence not
directly comparable
Q.19 How often do you eat a meal or snack out of home in venues such as restaurants, cafes, pubs, etc.?
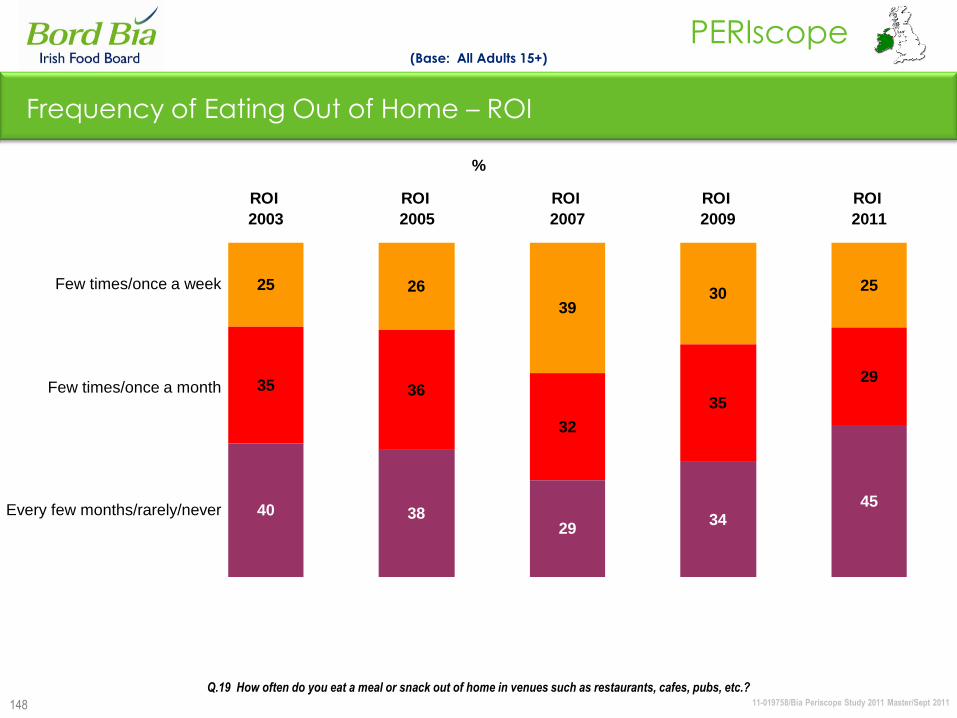
11-019758/Bia Periscope Study 2011 Master/Sept 2011
PERIscope
148
25 26
3930
25
35 36
32
35
29
40 3829
3445
ROI
2003
ROI
2005
ROI
2007
ROI
2009
ROI
2011
Frequency of Eating Out of Home – ROI
(Base: All Adults 15+)
%
Q.19 How often do you eat a meal or snack out of home in venues such as restaurants, cafes, pubs, etc.?
Few times/once a week
Few times/once a month
Every few months/rarely/never
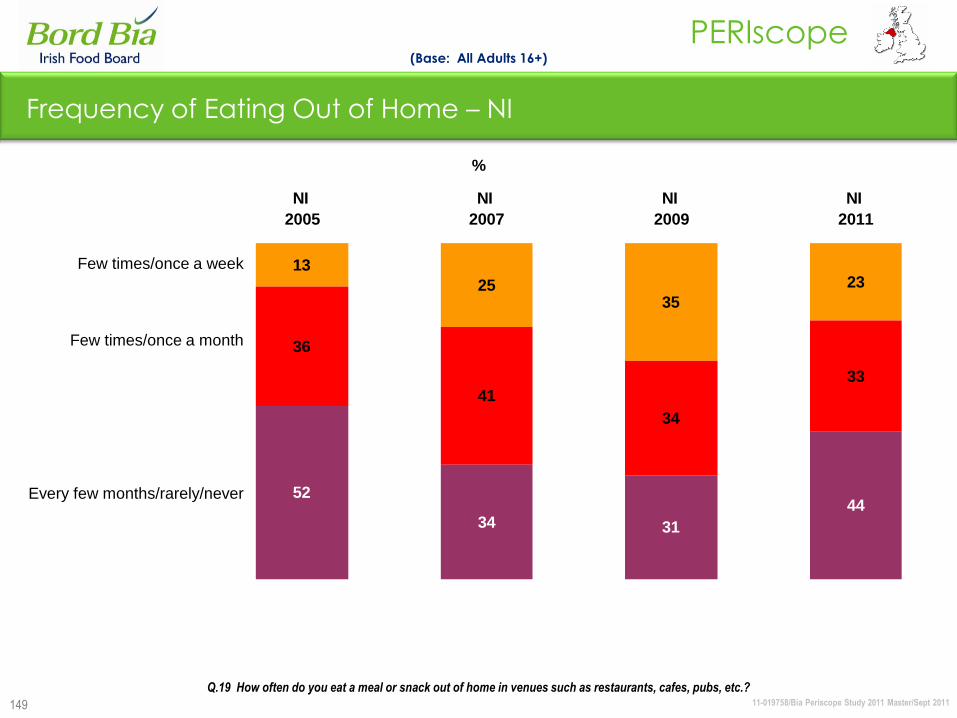
11-019758/Bia Periscope Study 2011 Master/Sept 2011
PERIscope
149
13
2535
23
36
41
34
33
52
34 31
44
NI
2005
NI
2007
NI
2009
NI
2011
Frequency of Eating Out of Home – NI
(Base: All Adults 16+)
%
Q.19 How often do you eat a meal or snack out of home in venues such as restaurants, cafes, pubs, etc.?
Few times/once a week
Few times/once a month
Every few months/rarely/never
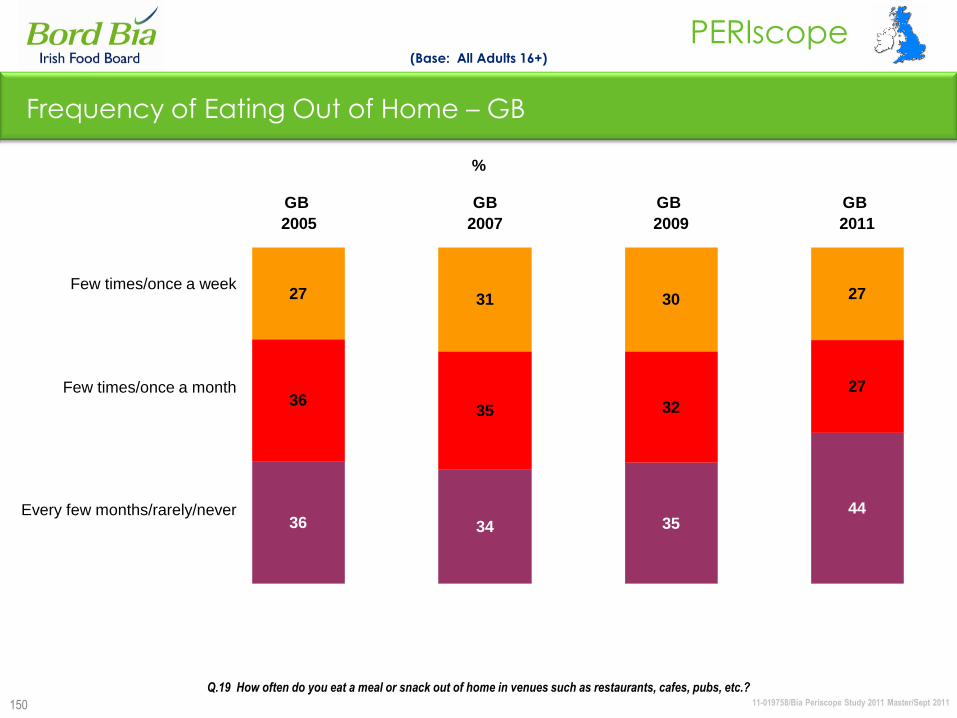
11-019758/Bia Periscope Study 2011 Master/Sept 2011
PERIscope
150
27 31 30 27
3635 32
27
36 34 3544
GB
2005
GB
2007
GB
2009
GB
2011
Frequency of Eating Out of Home – GB
(Base: All Adults 16+)
%
Q.19 How often do you eat a meal or snack out of home in venues such as restaurants, cafes, pubs, etc.?
Few times/once a week
Few times/once a month
Every few months/rarely/never
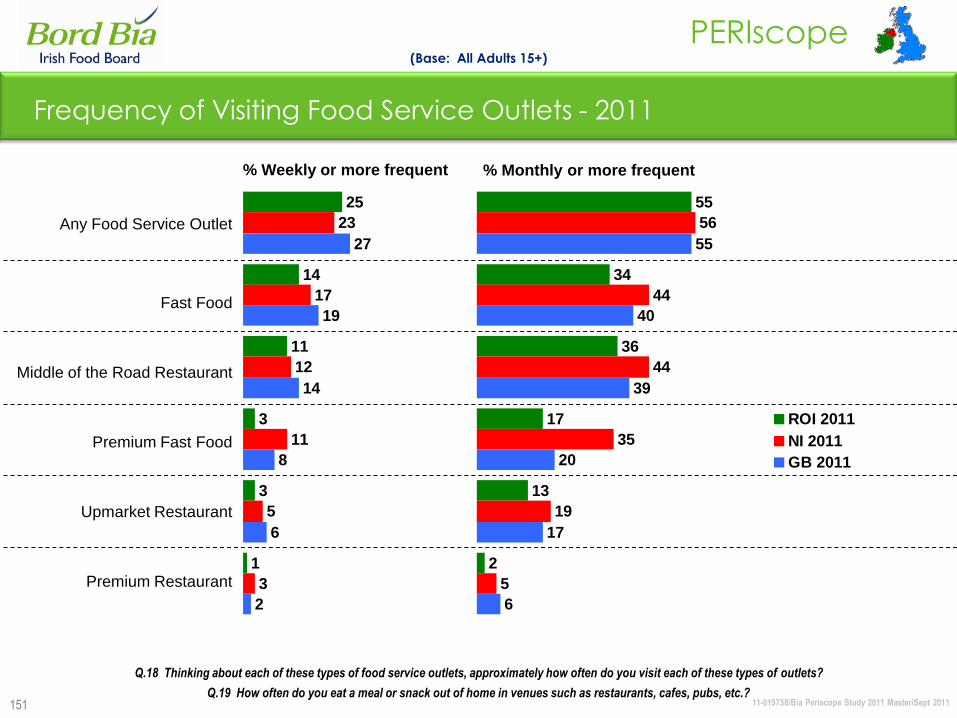
11-019758/Bia Periscope Study 2011 Master/Sept 2011
PERIscope
151
Frequency of Visiting Food Service Outlets - 2011
Any Food Service Outlet
Fast Food
Middle of the Road Restaurant
Premium Fast Food
Upmarket Restaurant
Premium Restaurant
(Base: All Adults 15+)
25
14
11
3
3
1
23
17
12
11
5
3
27
19
14
8
6
2
Q.18 Thinking about each of these types of food service outlets, approximately how often do you visit each of these types of outlets?
% Weekly or more frequent
55
34
36
17
13
2
56
44
44
35
19
5
55
40
39
20
17
6
ROI 2011
NI 2011
GB 2011
% Monthly or more frequent
Q.19 How often do you eat a meal or snack out of home in venues such as restaurants, cafes, pubs, etc.?
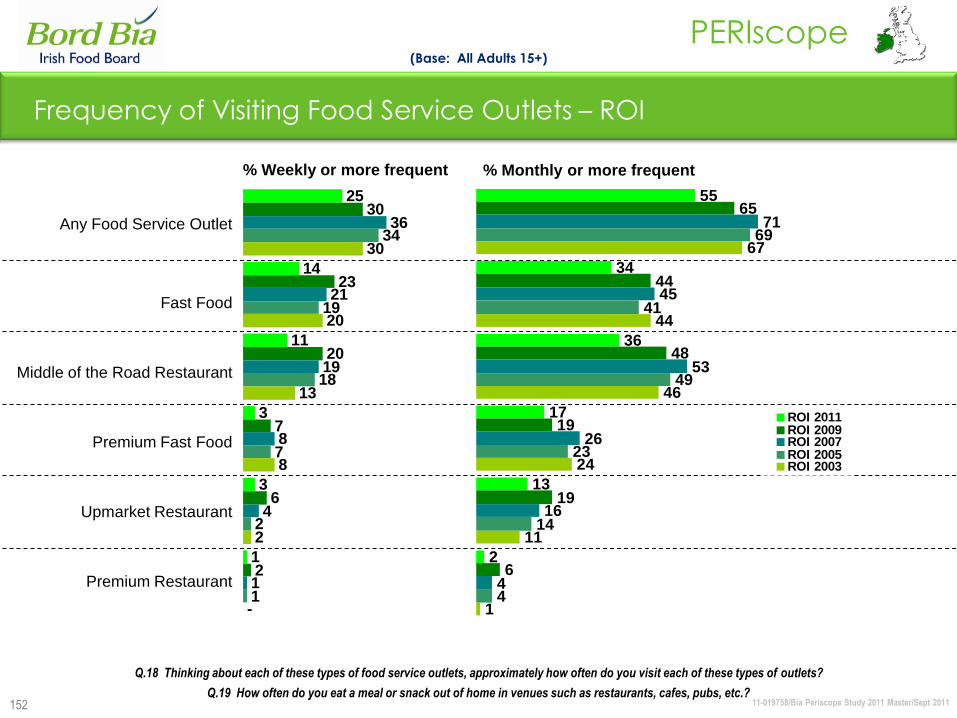
11-019758/Bia Periscope Study 2011 Master/Sept 2011
PERIscope
152
Frequency of Visiting Food Service Outlets – ROI
Any Food Service Outlet
Fast Food
Middle of the Road Restaurant
Premium Fast Food
Upmarket Restaurant
Premium Restaurant
(Base: All Adults 15+)
25
14
11
3
3
1
30
23
20
7
6
2
36
21
19
8
4
1
34
19
18
7
2
1
30
20
13
8
2
-
% Weekly or more frequent % Monthly or more frequent
Q.18 Thinking about each of these types of food service outlets, approximately how often do you visit each of these types of outlets?
Q.19 How often do you eat a meal or snack out of home in venues such as restaurants, cafes, pubs, etc.?
55
34
36
17
13
2
65
44
48
19
19
6
71
45
53
26
16
4
69
41
49
23
14
4
67
44
46
24
11
1
ROI 2011ROI 2009ROI 2007ROI 2005ROI 2003
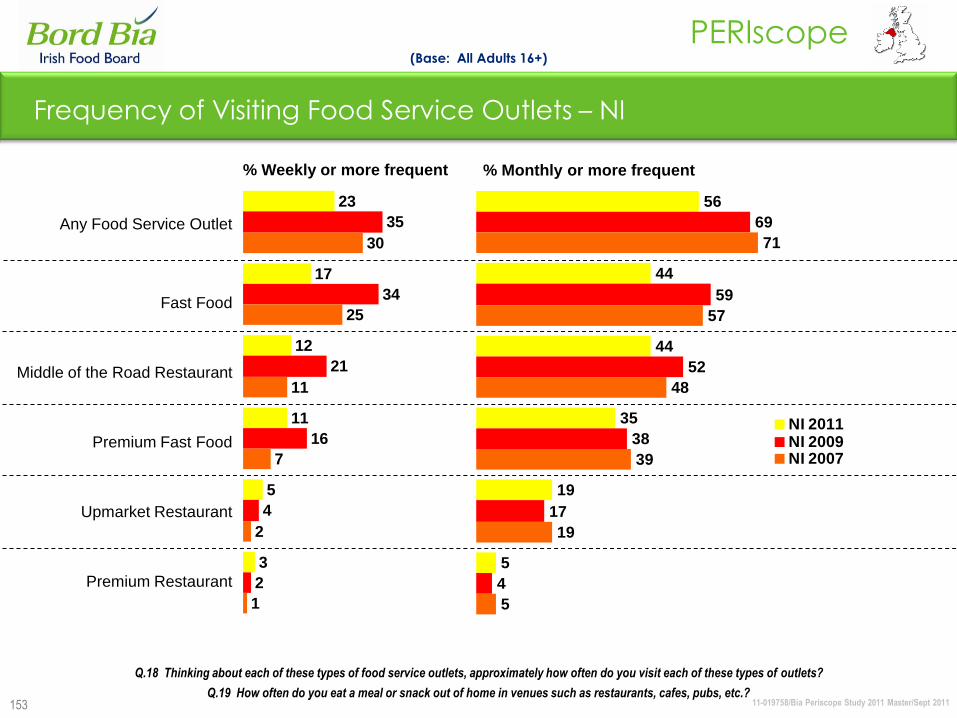
11-019758/Bia Periscope Study 2011 Master/Sept 2011
PERIscope
153
56
44
44
35
19
5
69
59
52
38
17
4
71
57
48
39
19
5
NI 2011NI 2009NI 2007
Frequency of Visiting Food Service Outlets – NI
Any Food Service Outlet
Fast Food
Middle of the Road Restaurant
Premium Fast Food
Upmarket Restaurant
Premium Restaurant
(Base: All Adults 16+)
23
17
12
11
5
3
35
34
21
16
4
2
30
25
11
7
2
1
% Weekly or more frequent % Monthly or more frequent
Q.18 Thinking about each of these types of food service outlets, approximately how often do you visit each of these types of outlets?
Q.19 How often do you eat a meal or snack out of home in venues such as restaurants, cafes, pubs, etc.?
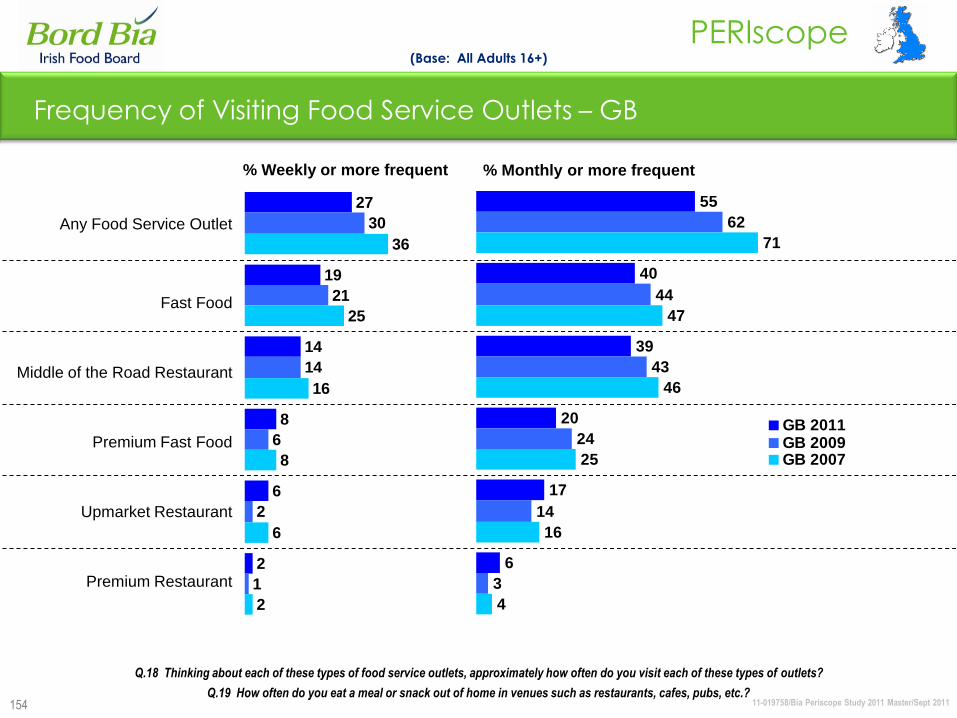
11-019758/Bia Periscope Study 2011 Master/Sept 2011
PERIscope
154
27
19
14
8
6
2
30
21
14
6
2
1
36
25
16
8
6
2
55
40
39
20
17
6
62
44
43
24
14
3
71
47
46
25
16
4
GB 2011GB 2009GB 2007
Frequency of Visiting Food Service Outlets – GB
Any Food Service Outlet
Fast Food
Middle of the Road Restaurant
Premium Fast Food
Upmarket Restaurant
Premium Restaurant
(Base: All Adults 16+)
% Weekly or more frequent % Monthly or more frequent
Q.18 Thinking about each of these types of food service outlets, approximately how often do you visit each of these types of outlets?
Q.19 How often do you eat a meal or snack out of home in venues such as restaurants, cafes, pubs, etc.?
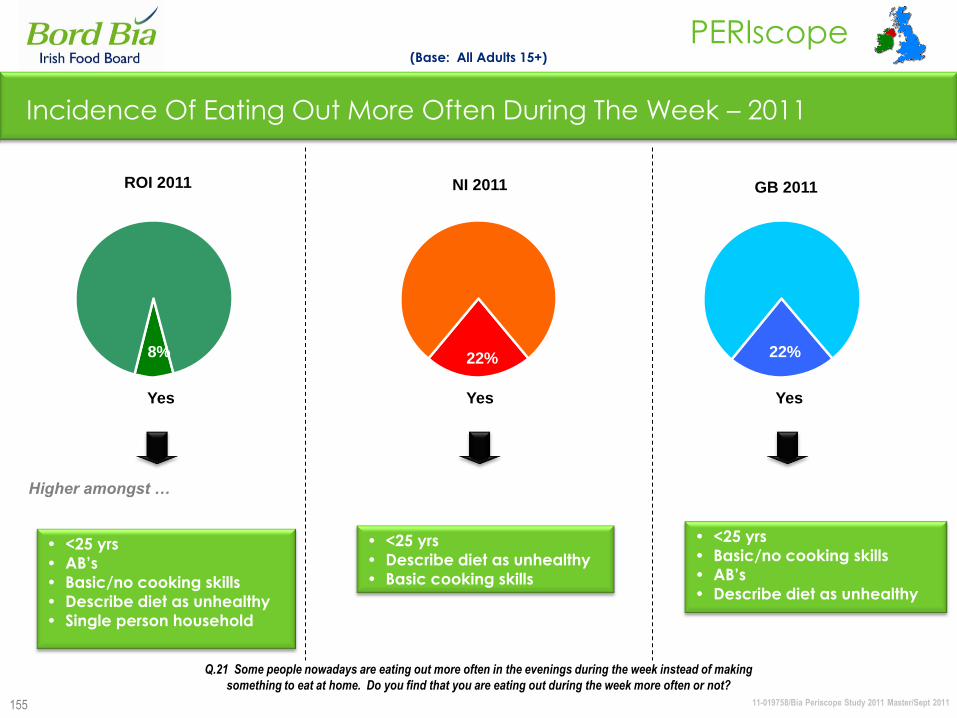
11-019758/Bia Periscope Study 2011 Master/Sept 2011
PERIscope
155
22%
Incidence Of Eating Out More Often During The Week – 2011
(Base: All Adults 15+)
• <25 yrs
• AB‟s
• Basic/no cooking skills
• Describe diet as unhealthy
• Single person household
• <25 yrs
• Describe diet as unhealthy
• Basic cooking skills
8%
• <25 yrs
• Basic/no cooking skills
• AB‟s
• Describe diet as unhealthy
Higher amongst …
ROI 2011 NI 2011 GB 2011
Yes Yes Yes
Q.21 Some people nowadays are eating out more often in the evenings during the week instead of making
something to eat at home. Do you find that you are eating out during the week more often or not?
22%
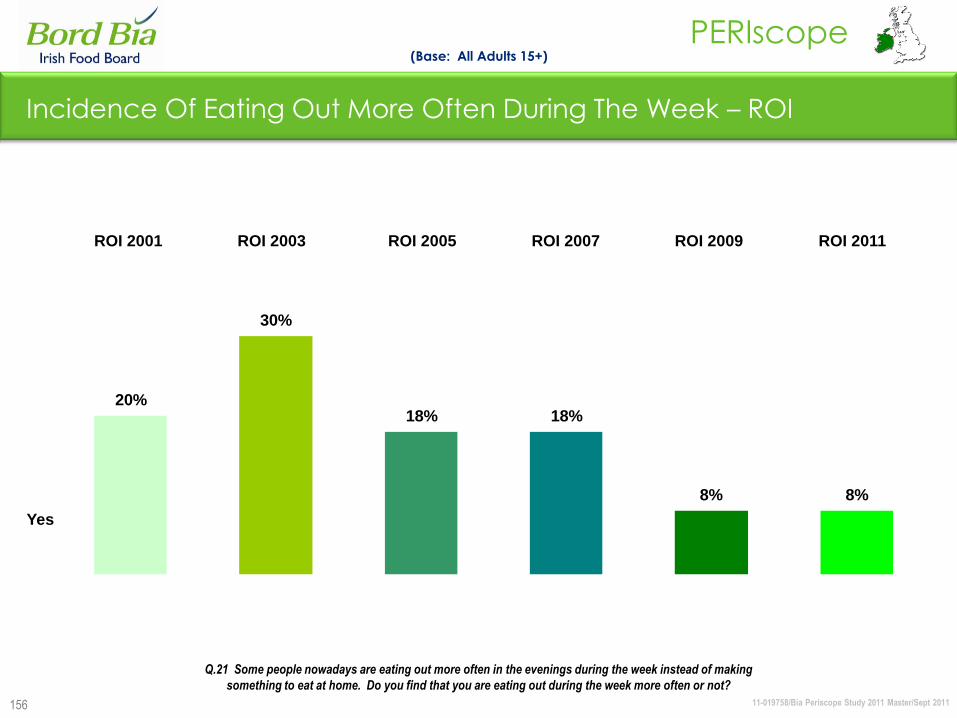
11-019758/Bia Periscope Study 2011 Master/Sept 2011
PERIscope
156
Incidence Of Eating Out More Often During The Week – ROI
18% 18%
8%
20%
30%
8%
(Base: All Adults 15+)
Q.21 Some people nowadays are eating out more often in the evenings during the week instead of making
something to eat at home. Do you find that you are eating out during the week more often or not?
ROI 2001 ROI 2003 ROI 2005 ROI 2007 ROI 2009
Yes
ROI 2011
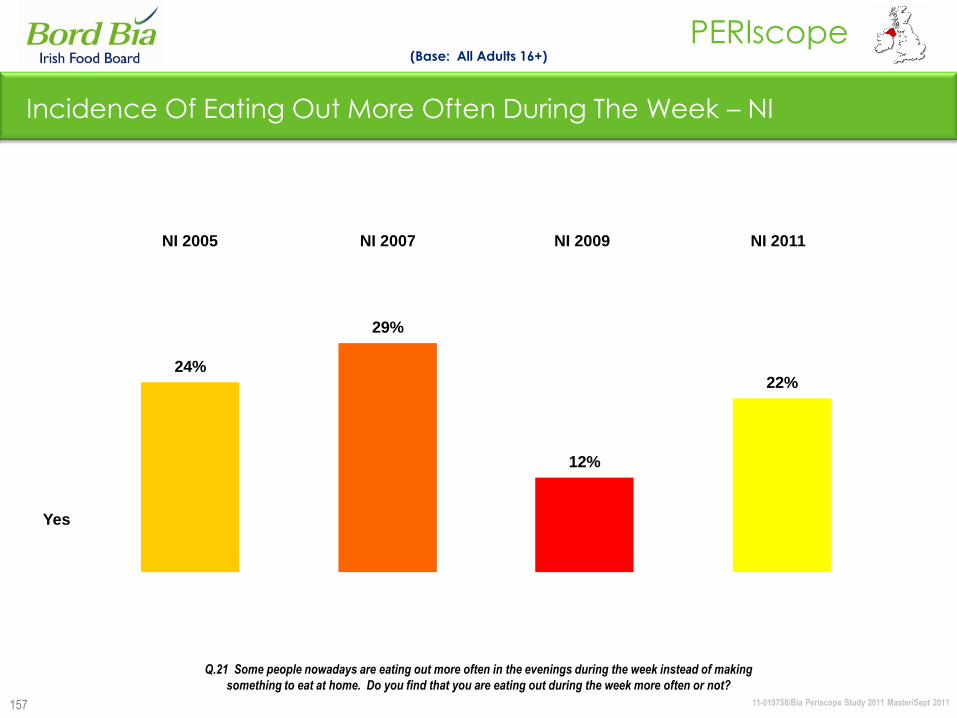
11-019758/Bia Periscope Study 2011 Master/Sept 2011
PERIscope
157
Incidence Of Eating Out More Often During The Week – NI
24%
29%
12%
22%
(Base: All Adults 16+)
Q.21 Some people nowadays are eating out more often in the evenings during the week instead of making
something to eat at home. Do you find that you are eating out during the week more often or not?
NI 2005 NI 2007 NI 2009
Yes
NI 2011
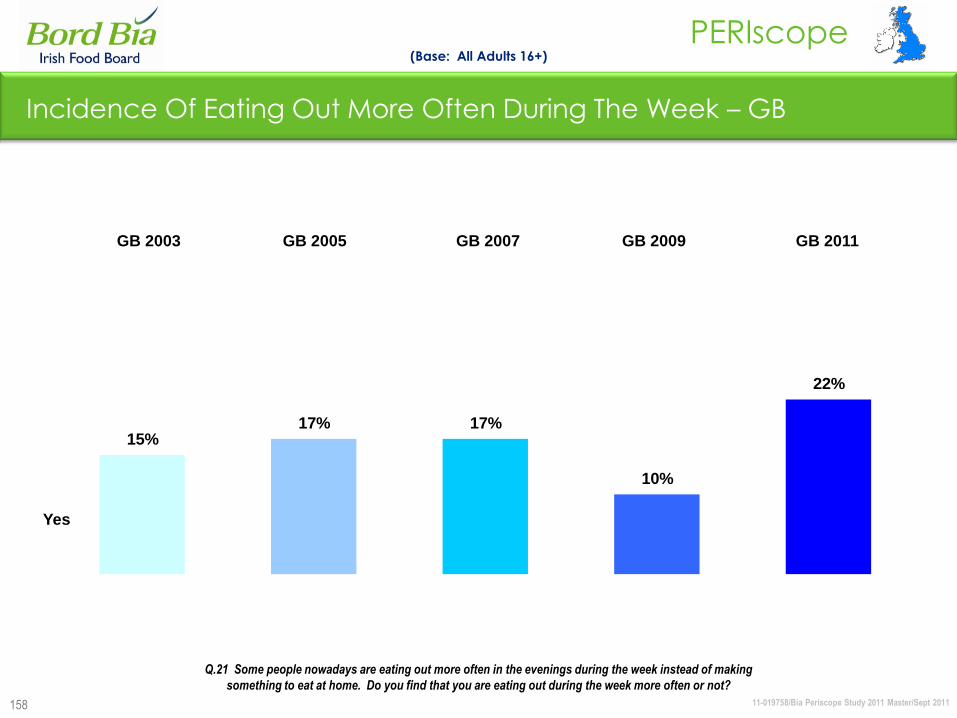
11-019758/Bia Periscope Study 2011 Master/Sept 2011
PERIscope
158
Incidence Of Eating Out More Often During The Week – GB
17%
10%
15%17%
22%
(Base: All Adults 16+)
Q.21 Some people nowadays are eating out more often in the evenings during the week instead of making
something to eat at home. Do you find that you are eating out during the week more often or not?
GB 2003 GB 2005 GB 2007 GB 2009
Yes
GB 2011
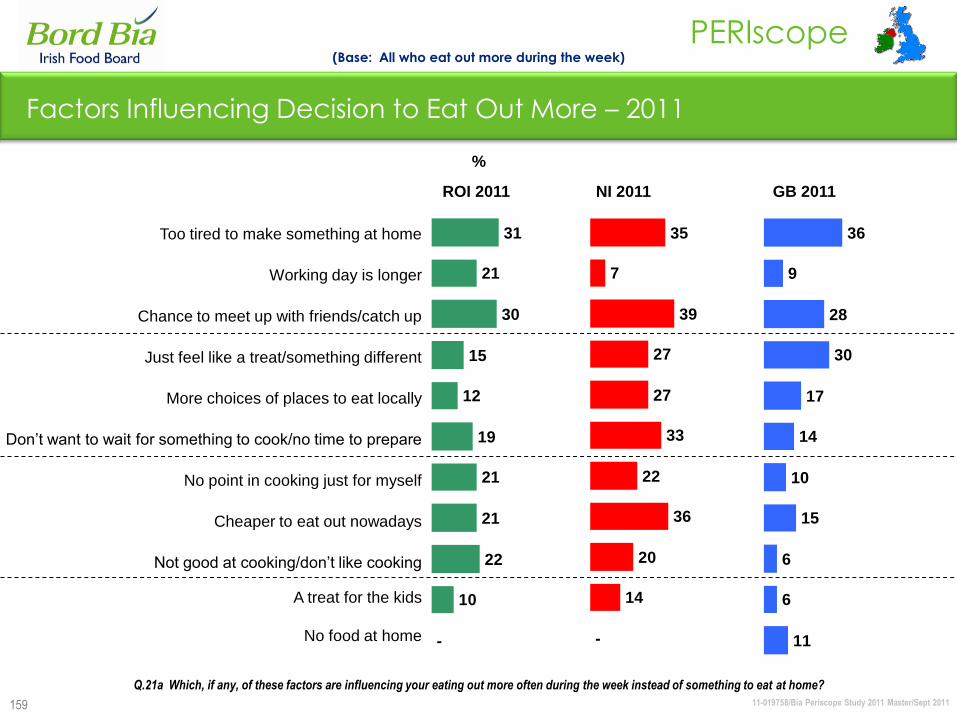
11-019758/Bia Periscope Study 2011 Master/Sept 2011
PERIscope
35
7
39
27
27
33
22
36
20
14
-
159
36
9
28
30
17
14
10
15
6
6
11
31
21
30
15
12
19
21
21
22
10
-
Factors Influencing Decision to Eat Out More – 2011
Too tired to make something at home
Working day is longer
Chance to meet up with friends/catch up
Just feel like a treat/something different
More choices of places to eat locally
Don‟t want to wait for something to cook/no time to prepare
No point in cooking just for myself
Cheaper to eat out nowadays
Not good at cooking/don‟t like cooking
A treat for the kids
No food at home
(Base: All who eat out more during the week)
ROI 2011
%
NI 2011 GB 2011
Q.21a Which, if any, of these factors are influencing your eating out more often during the week instead of something to eat at home?

11-019758/Bia Periscope Study 2011 Master/Sept 2011
PERIscope
160
20
37
40
3
20
9
18
9
6
n/a
32
36
37
18
23
11
18
11
8
n/a
Factors Influencing Decision to Eat Out More OftenDuring The Week – ROI (I)
ROI 2003ROI 2001 ROI 2005
%
Too tired to make something at home
Working day is longer
Chance to meet up with friends/catch up
Just feel like a treat/something different
More choices of places to eat locally
Don‟t want to wait for something to cook/no time to prepare
No point in cooking just for myself
Cheaper to eat out nowadays
Not good at cooking/don‟t like cooking
A treat for the kids
ROI 2007
(Base: All who eat out more during the week)
ROI 2009
38
17
27
36
28
25
12
20
16
8
37
24
34
27
26
24
15
13
13
11
37
14
28
23
14
18
11
17
10
7
Q.21a Which, if any, of these factors are influencing your eating out more often during the week instead of something to eat at home?
(% Eating out more) (20%) (30%) (18%) (18%) (8%) (8%)
31
21
30
15
12
19
21
21
22
10
ROI 2011
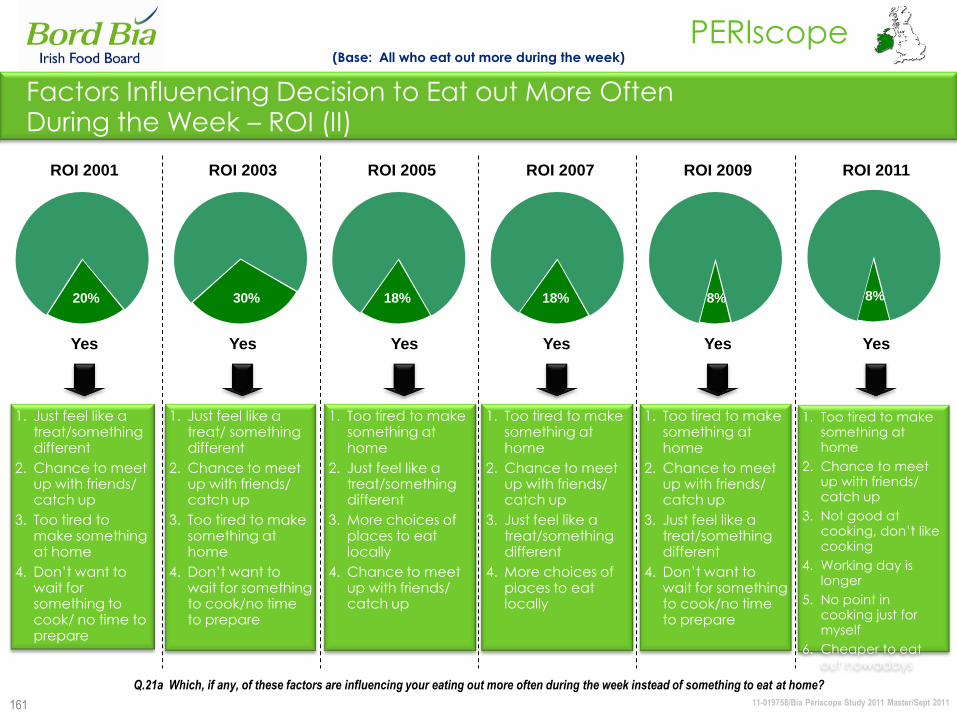
11-019758/Bia Periscope Study 2011 Master/Sept 2011
PERIscope
161
18%
Factors Influencing Decision to Eat out More Often During the Week – ROI (II)
Yes Yes
(Base: All who eat out more during the week)
YesYes
1. Too tired to make something at home
2. Just feel like a treat/something different
3. More choices of places to eat locally
4. Chance to meet up with friends/ catch up
1. Just feel like a treat/ something different
2. Chance to meet up with friends/ catch up
3. Too tired to make something at home
4. Don‟t want to wait for something to cook/no time to prepare
1. Just feel like a treat/something different
2. Chance to meet up with friends/ catch up
3. Too tired to make something at home
4. Don‟t want to wait for something to cook/ no time to prepare
1. Too tired to make something at home
2. Chance to meet up with friends/ catch up
3. Just feel like a treat/something different
4. More choices of places to eat locally
20% 18%30%
ROI 2005ROI 2003ROI 2001 ROI 2007 ROI 2009
Yes
Q.21a Which, if any, of these factors are influencing your eating out more often during the week instead of something to eat at home?
8%
1. Too tired to make something at home
2. Chance to meet up with friends/ catch up
3. Just feel like a treat/something different
4. Don‟t want to wait for something to cook/no time to prepare
8%
ROI 2011
Yes
1. Too tired to make something at home
2. Chance to meet up with friends/ catch up
3. Not good at cooking, don‟t like cooking
4. Working day is longer
5. No point in cooking just for myself
6. Cheaper to eat out nowadays
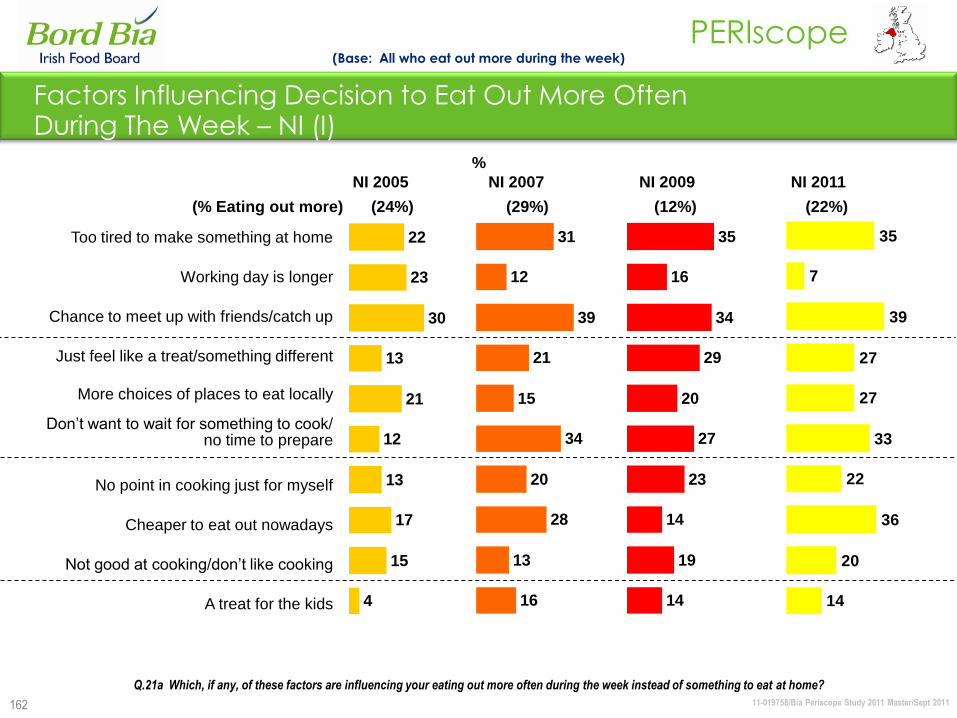
11-019758/Bia Periscope Study 2011 Master/Sept 2011
PERIscope
22
23
30
13
21
12
13
17
15
4
162
31
12
39
21
15
34
20
28
13
16
35
16
34
29
20
27
23
14
19
14
Factors Influencing Decision to Eat Out More Often During The Week – NI (I)
NI 2005
%
Too tired to make something at home
Working day is longer
Chance to meet up with friends/catch up
Just feel like a treat/something different
More choices of places to eat locally
Don‟t want to wait for something to cook/no time to prepare
No point in cooking just for myself
Cheaper to eat out nowadays
Not good at cooking/don‟t like cooking
A treat for the kids
NI 2007
(Base: All who eat out more during the week)
NI 2009
Q.21a Which, if any, of these factors are influencing your eating out more often during the week instead of something to eat at home?
(% Eating out more) (24%) (29%) (12%) (22%)
35
7
39
27
27
33
22
36
20
14
NI 2011
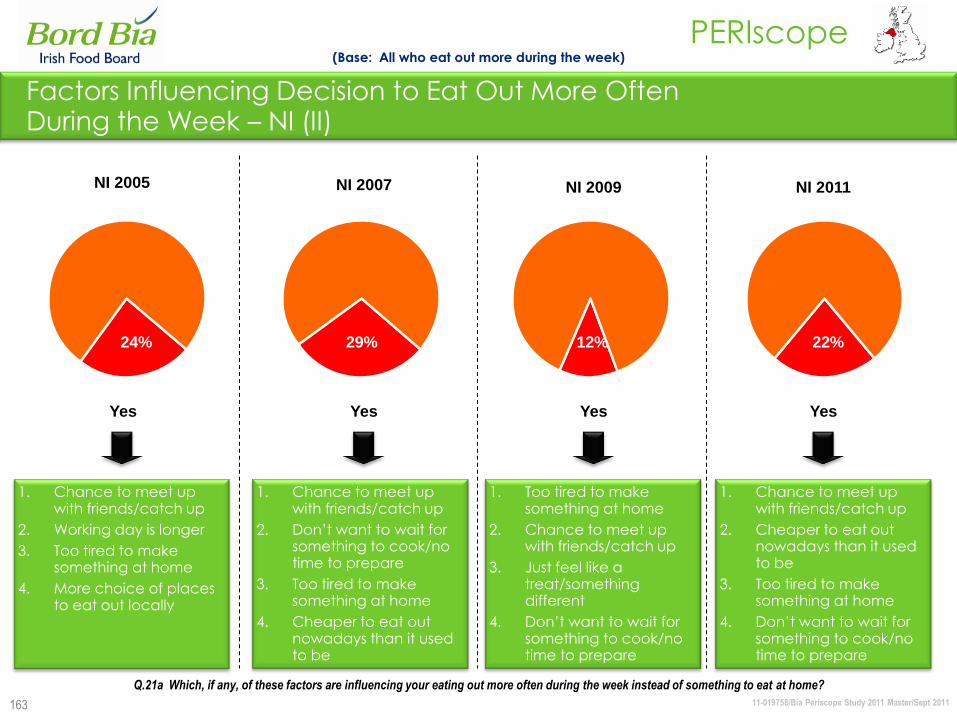
11-019758/Bia Periscope Study 2011 Master/Sept 2011
PERIscope
163
29%
Factors Influencing Decision to Eat Out More Often During the Week – NI (II)
Yes
(Base: All who eat out more during the week)
Yes
1. Chance to meet up with friends/catch up
2. Working day is longer
3. Too tired to make something at home
4. More choice of places to eat out locally
1. Chance to meet up with friends/catch up
2. Don‟t want to wait for something to cook/no time to prepare
3. Too tired to make something at home
4. Cheaper to eat out nowadays than it used to be
24%
Yes
Q.21a Which, if any, of these factors are influencing your eating out more often during the week instead of something to eat at home?
12%
1. Too tired to make something at home
2. Chance to meet up with friends/catch up
3. Just feel like a treat/something different
4. Don‟t want to wait for something to cook/no time to prepare
Yes
22%
NI 2005 NI 2007 NI 2009 NI 2011
1. Chance to meet up with friends/catch up
2. Cheaper to eat out nowadays than it used to be
3. Too tired to make something at home
4. Don‟t want to wait for something to cook/no time to prepare
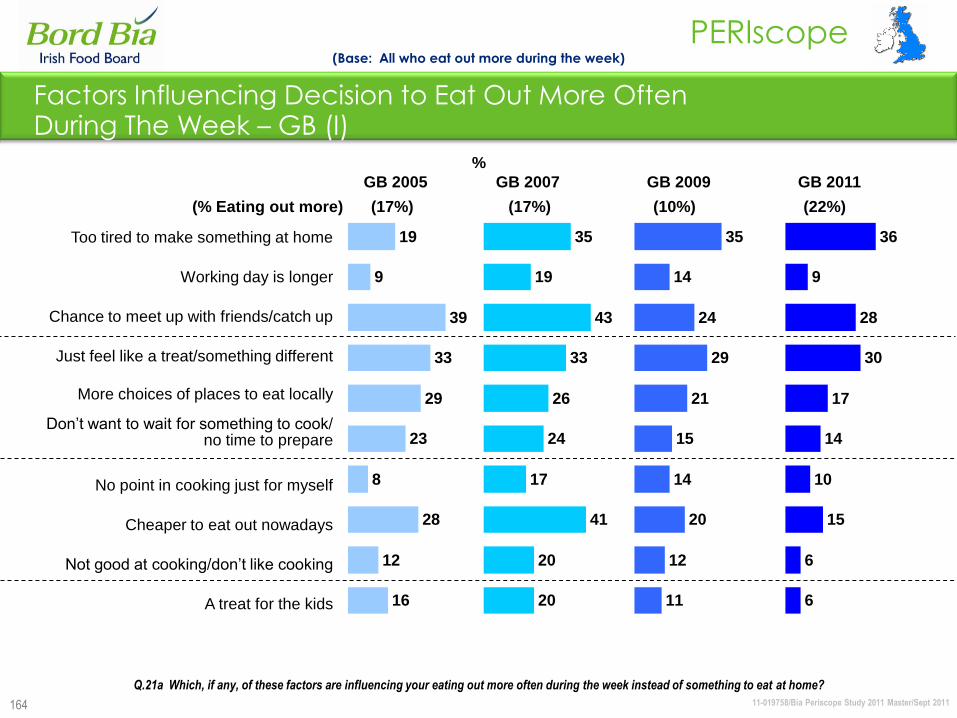
11-019758/Bia Periscope Study 2011 Master/Sept 2011
PERIscope
164
19
9
39
33
29
23
8
28
12
16
Factors Influencing Decision to Eat Out More Often During The Week – GB (I)
GB 2005
%
Too tired to make something at home
Working day is longer
Chance to meet up with friends/catch up
Just feel like a treat/something different
More choices of places to eat locally
Don‟t want to wait for something to cook/no time to prepare
No point in cooking just for myself
Cheaper to eat out nowadays
Not good at cooking/don‟t like cooking
A treat for the kids
GB 2007
(Base: All who eat out more during the week)
GB 2009
Q.21a Which, if any, of these factors are influencing your eating out more often during the week instead of something to eat at home?
(% Eating out more) (17%) (17%) (10%) (22%)
35
19
43
33
26
24
17
41
20
20
35
14
24
29
21
15
14
20
12
11
36
9
28
30
17
14
10
15
6
6
GB 2011
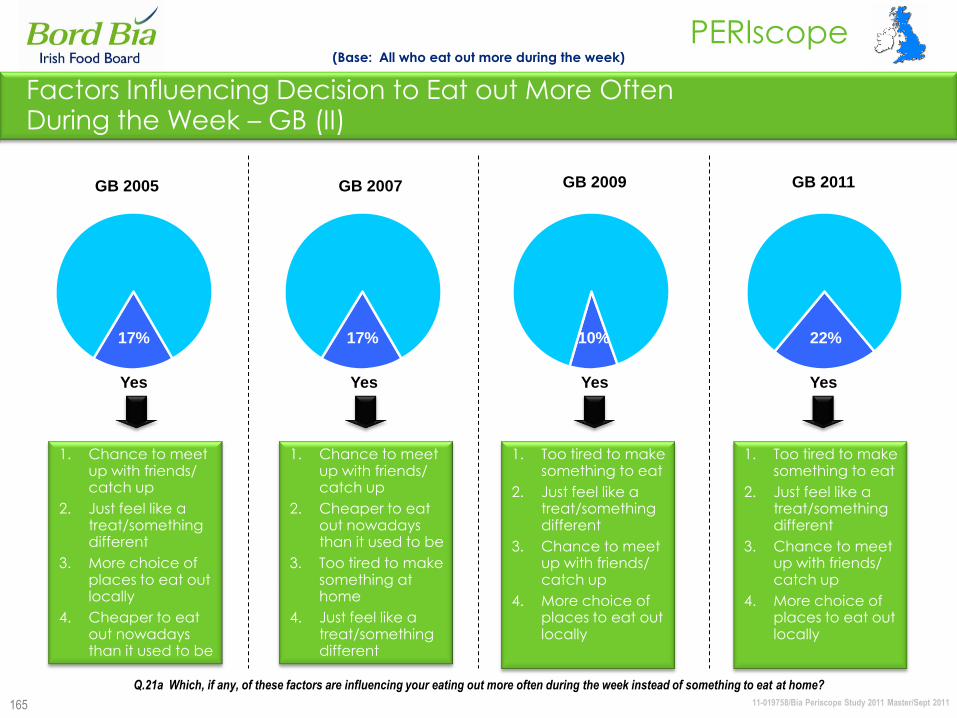
11-019758/Bia Periscope Study 2011 Master/Sept 2011
PERIscope
17%17% 10% 22%
165
Factors Influencing Decision to Eat out More Often During the Week – GB (II)
1. Chance to meet up with friends/ catch up
2. Just feel like a treat/something different
3. More choice of places to eat out locally
4. Cheaper to eat out nowadays than it used to be
1. Chance to meet up with friends/ catch up
2. Cheaper to eat out nowadays than it used to be
3. Too tired to make something at home
4. Just feel like a treat/something different
Yes Yes Yes
(Base: All who eat out more during the week)
Q.21a Which, if any, of these factors are influencing your eating out more often during the week instead of something to eat at home?
1. Too tired to make something to eat
2. Just feel like a treat/something different
3. Chance to meet up with friends/ catch up
4. More choice of places to eat out locally
GB 2007GB 2005 GB 2009 GB 2011
Yes
1. Too tired to make something to eat
2. Just feel like a treat/something different
3. Chance to meet up with friends/ catch up
4. More choice of places to eat out locally
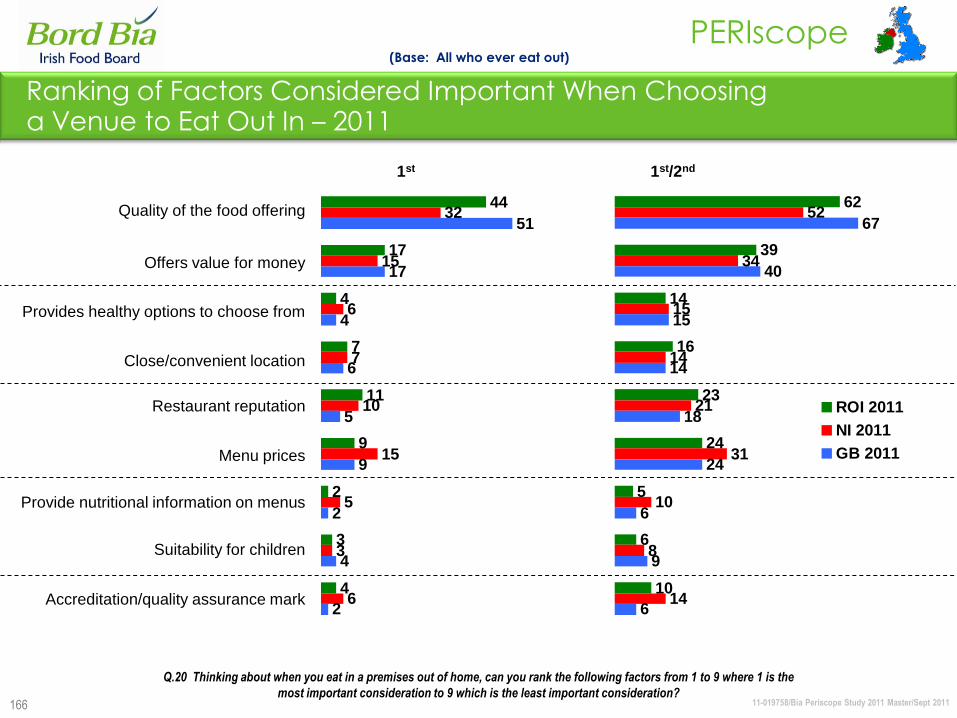
11-019758/Bia Periscope Study 2011 Master/Sept 2011
PERIscope
166
Ranking of Factors Considered Important When Choosing a Venue to Eat Out In – 2011
Quality of the food offering
Offers value for money
Provides healthy options to choose from
Close/convenient location
Restaurant reputation
Menu prices
Provide nutritional information on menus
Suitability for children
Accreditation/quality assurance mark
1st 1st/2nd
(Base: All who ever eat out)
44
17
4
7
11
9
2
3
4
32
15
6
7
10
15
5
3
6
51
17
4
6
5
9
2
4
2
62
39
14
16
23
24
5
6
10
52
34
15
14
21
31
10
8
14
67
40
15
14
18
24
6
9
6
ROI 2011
NI 2011
GB 2011
Q.20 Thinking about when you eat in a premises out of home, can you rank the following factors from 1 to 9 where 1 is the
most important consideration to 9 which is the least important consideration?
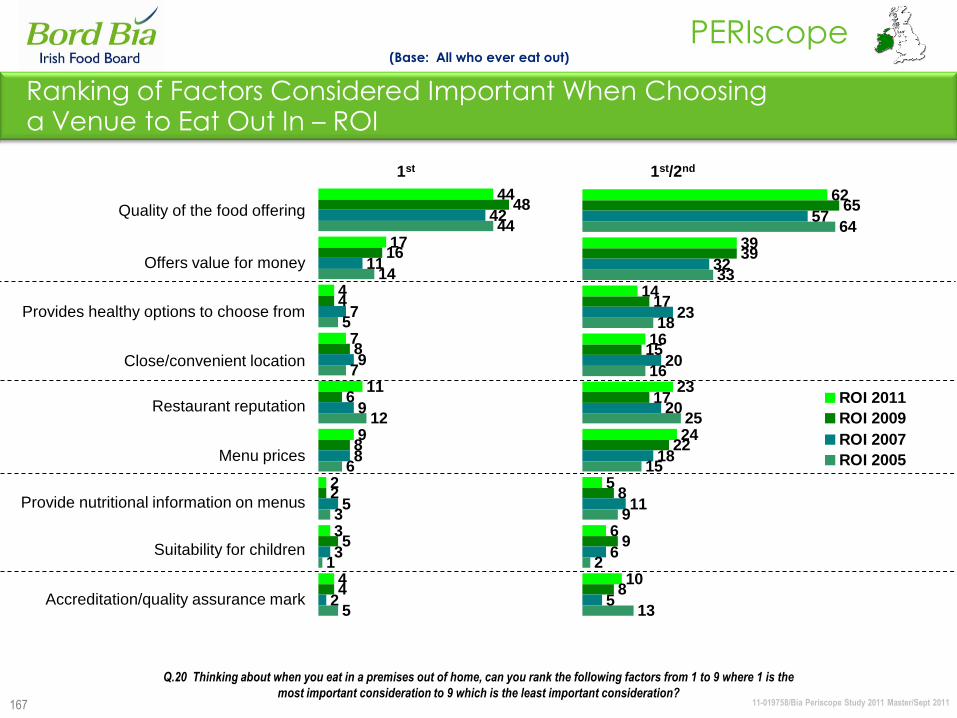
11-019758/Bia Periscope Study 2011 Master/Sept 2011
PERIscope
167
Ranking of Factors Considered Important When Choosing a Venue to Eat Out In – ROI
Quality of the food offering
Offers value for money
Provides healthy options to choose from
Close/convenient location
Restaurant reputation
Menu prices
Provide nutritional information on menus
Suitability for children
Accreditation/quality assurance mark
1st 1st/2nd
(Base: All who ever eat out)
Q.20 Thinking about when you eat in a premises out of home, can you rank the following factors from 1 to 9 where 1 is the
most important consideration to 9 which is the least important consideration?
62
39
14
16
23
24
5
6
10
65
39
17
15
17
22
8
9
8
57
32
23
20
20
18
11
6
5
64
33
18
16
25
15
9
2
13
ROI 2011
ROI 2009
ROI 2007
ROI 2005
44
17
4
7
11
9
2
3
4
48
16
4
8
6
8
2
5
4
42
11
7
9
9
8
5
3
2
44
14
5
7
12
6
3
1
5
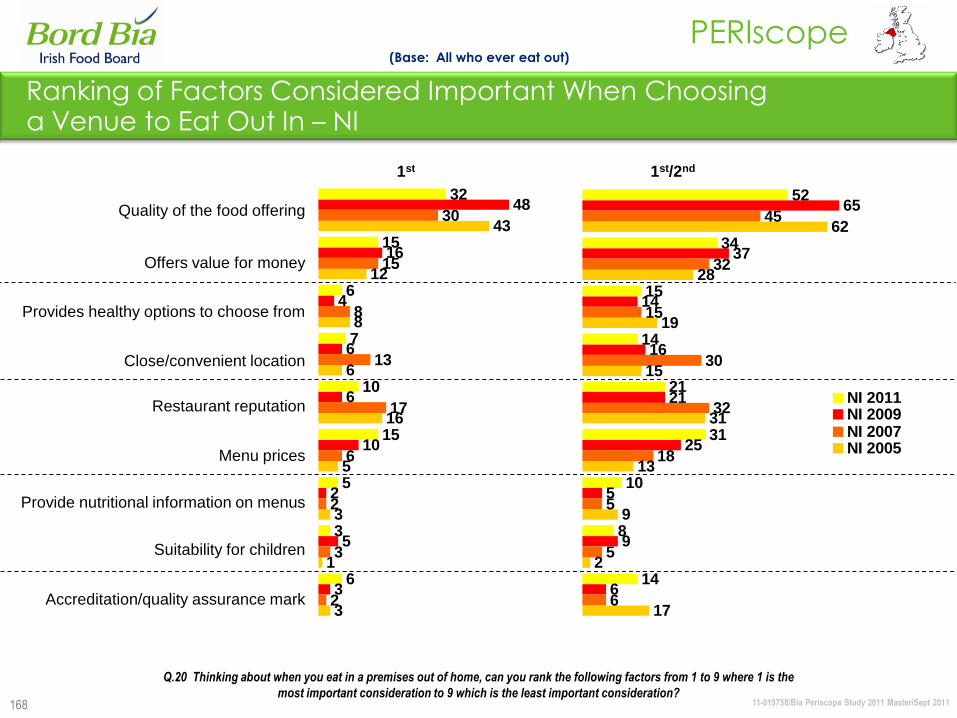
11-019758/Bia Periscope Study 2011 Master/Sept 2011
PERIscope
168
Ranking of Factors Considered Important When Choosing a Venue to Eat Out In – NI
Quality of the food offering
Offers value for money
Provides healthy options to choose from
Close/convenient location
Restaurant reputation
Menu prices
Provide nutritional information on menus
Suitability for children
Accreditation/quality assurance mark
1st 1st/2nd
(Base: All who ever eat out)
Q.20 Thinking about when you eat in a premises out of home, can you rank the following factors from 1 to 9 where 1 is the
most important consideration to 9 which is the least important consideration?
52
34
15
14
21
31
10
8
14
65
37
14
16
21
25
5
9
6
45
32
15
30
32
18
5
5
6
62
28
19
15
31
13
9
2
17
NI 2011NI 2009NI 2007NI 2005
32
15
6
7
10
15
5
3
6
48
16
4
6
6
10
2
5
3
30
15
8
13
17
6
2
3
2
43
12
8
6
16
5
3
1
3
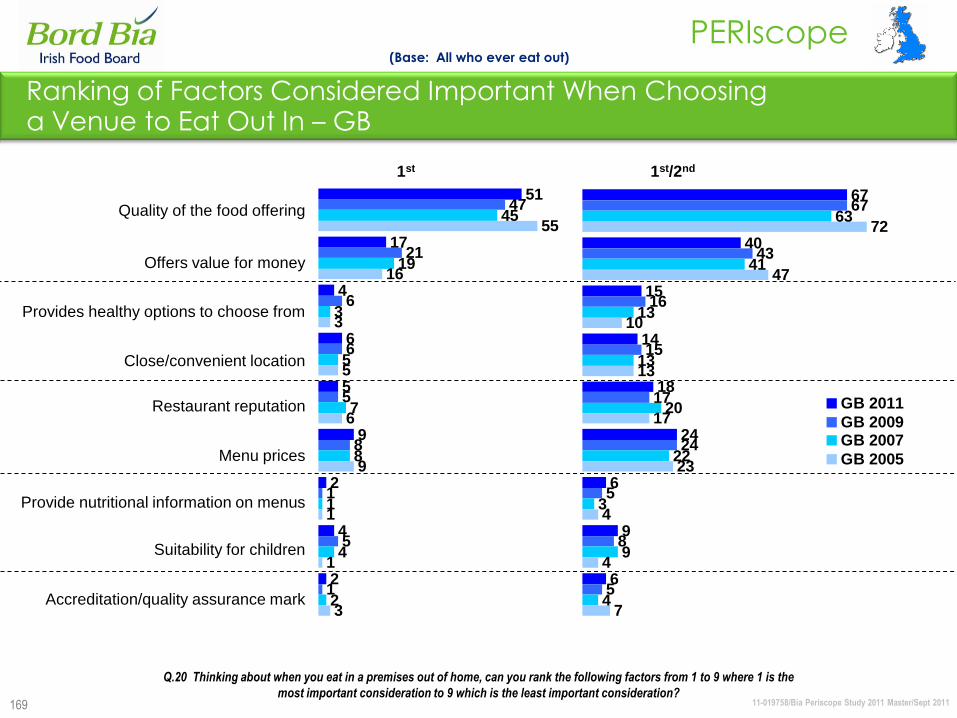
11-019758/Bia Periscope Study 2011 Master/Sept 2011
PERIscope
169
Ranking of Factors Considered Important When Choosing a Venue to Eat Out In – GB
Quality of the food offering
Offers value for money
Provides healthy options to choose from
Close/convenient location
Restaurant reputation
Menu prices
Provide nutritional information on menus
Suitability for children
Accreditation/quality assurance mark
1st 1st/2nd
(Base: All who ever eat out)
Q.20 Thinking about when you eat in a premises out of home, can you rank the following factors from 1 to 9 where 1 is the
most important consideration to 9 which is the least important consideration?
67
40
15
14
18
24
6
9
6
67
43
16
15
17
24
5
8
5
63
41
13
13
20
22
3
9
4
72
47
10
13
17
23
4
4
7
GB 2011
GB 2009GB 2007
GB 2005
51
17
4
6
5
9
2
4
2
47
21
6
6
5
8
1
5
1
45
19
3
5
7
8
1
4
2
55
16
3
5
6
9
1
1
3
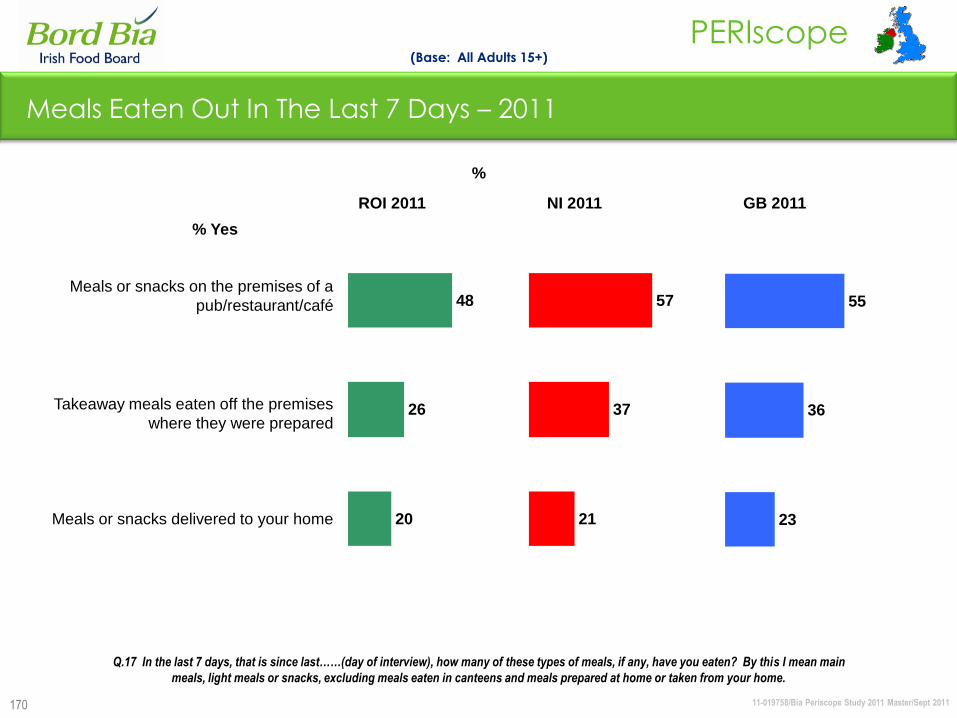
11-019758/Bia Periscope Study 2011 Master/Sept 2011
PERIscope
170
48
26
20
Meals Eaten Out In The Last 7 Days – 2011
Meals or snacks on the premises of a
pub/restaurant/café
Takeaway meals eaten off the premises
where they were prepared
Meals or snacks delivered to your home
(Base: All Adults 15+)
ROI 2011
%
NI 2011 GB 2011
Q.17 In the last 7 days, that is since last……(day of interview), how many of these types of meals, if any, have you eaten? By this I mean main
meals, light meals or snacks, excluding meals eaten in canteens and meals prepared at home or taken from your home.
% Yes
57
37
21
55
36
23

11-019758/Bia Periscope Study 2011 Master/Sept 2011
PERIscope
171
20%26%
(50%)
48%
Meals Eaten Out in the Last 7 Days – ROI
Meals or Snacks
on the Premises of
a Pub/Restaurant/Cafe
Incidence last 7 days
Takeaway Meals Eaten
Off the Premises Where
They Were Prepared
Meals or Snacks
Delivered to
Your Home
Frequency in 2011
(no. of times – excl. zero)
2.0 2.2 2.2
(63%)ROI 2007
(Base: All Adults 15+)
(43%) (24%)
ROI 2005 (50%) (29%) (14%)
Q.17 In the last 7 days, that is since last……(day of interview), how many of these types of meals, if any, have you eaten? By this I mean main
meals, light meals or snacks, excluding meals eaten in canteens and meals prepared at home or taken from your home.
ROI 2003
ROI 2001 (25%) (10%)
(45%) (29%) (15%)
2011 2011 2011
(49%)ROI 2009 (32%) (17%)
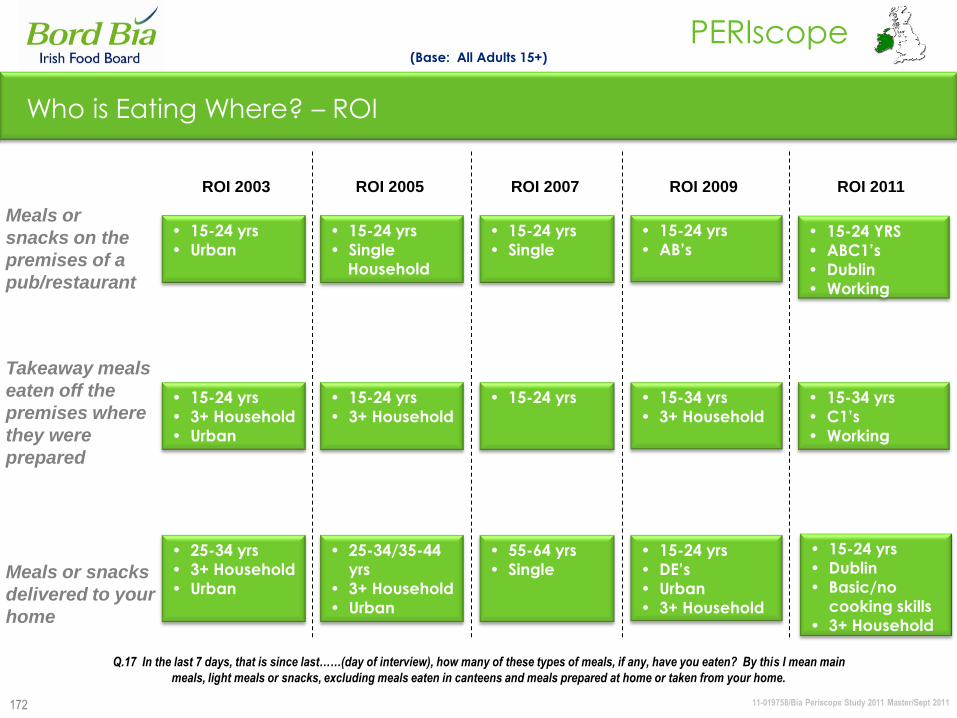
11-019758/Bia Periscope Study 2011 Master/Sept 2011
PERIscope
172
Who is Eating Where? – ROI
Meals or
snacks on the
premises of a
pub/restaurant
Takeaway meals
eaten off the
premises where
they were
prepared
Meals or snacks
delivered to your
home
• 15-24 yrs
• Urban
• 15-24 yrs
• 3+ Household
• Urban
• 25-34 yrs
• 3+ Household
• Urban
ROI 2003
• 15-24 yrs
• Single
Household
• 15-24 yrs
• 3+ Household
• 25-34/35-44
yrs
• 3+ Household
• Urban
ROI 2005
• 15-24 yrs
• Single
• 15-24 yrs
• 55-64 yrs
• Single
ROI 2007
• 15-34 yrs
• 3+ Household
• 15-24 yrs
• DE‟s
• Urban
• 3+ Household
ROI 2009
• 15-24 yrs
• AB‟s
Q.17 In the last 7 days, that is since last……(day of interview), how many of these types of meals, if any, have you eaten? By this I mean main
meals, light meals or snacks, excluding meals eaten in canteens and meals prepared at home or taken from your home.
(Base: All Adults 15+)
• 15-34 yrs
• C1‟s
• Working
• 15-24 yrs
• Dublin
• Basic/no
cooking skills
• 3+ Household
ROI 2011
• 15-24 YRS
• ABC1‟s
• Dublin
• Working
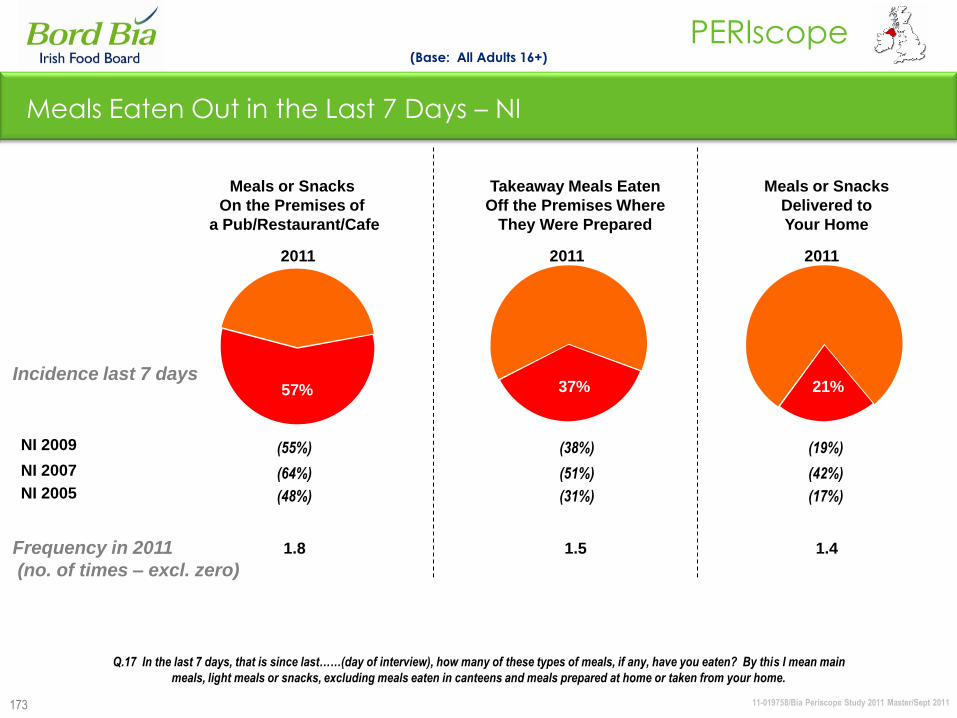
11-019758/Bia Periscope Study 2011 Master/Sept 2011
PERIscope
173
57%
Meals Eaten Out in the Last 7 Days – NI
Meals or Snacks
On the Premises of
a Pub/Restaurant/Cafe
Takeaway Meals Eaten
Off the Premises Where
They Were Prepared
Meals or Snacks
Delivered to
Your Home
1.8 1.5 1.4
(Base: All Adults 16+)
Incidence last 7 days
Frequency in 2011
(no. of times – excl. zero)
(64%)NI 2007 (51%) (42%)
Q.17 In the last 7 days, that is since last……(day of interview), how many of these types of meals, if any, have you eaten? By this I mean main
meals, light meals or snacks, excluding meals eaten in canteens and meals prepared at home or taken from your home.
(48%)NI 2005 (31%) (17%)
37% 21%
(55%)NI 2009 (38%) (19%)
2011 2011 2011
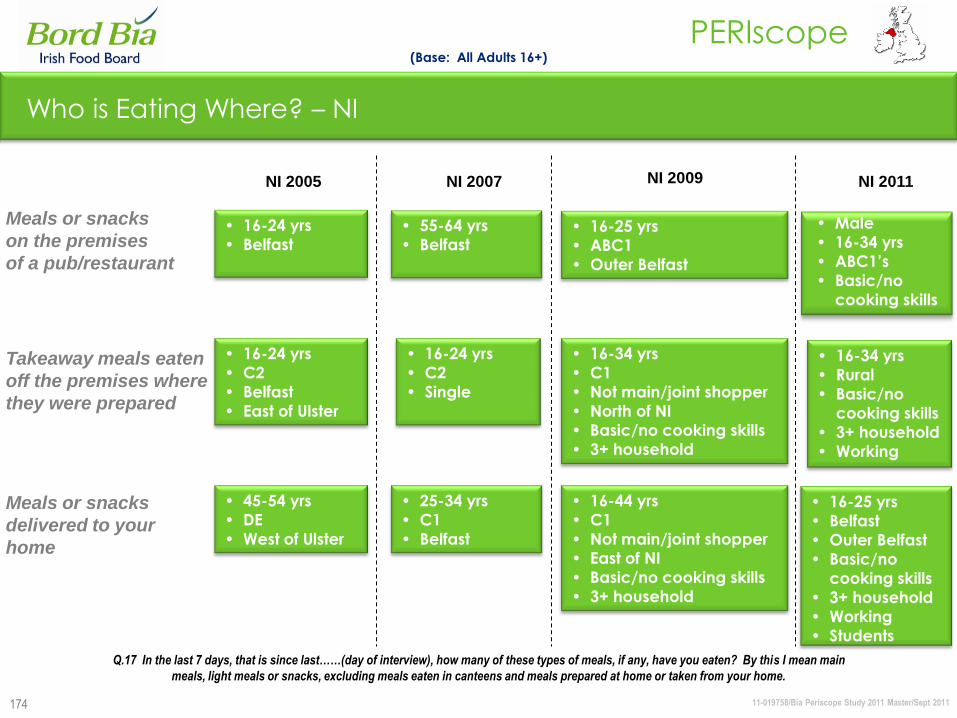
11-019758/Bia Periscope Study 2011 Master/Sept 2011
PERIscope
174
Who is Eating Where? – NI
• 16-24 yrs
• Belfast
• 16-24 yrs
• C2
• Belfast
• East of Ulster
• 45-54 yrs
• DE
• West of Ulster
• 55-64 yrs
• Belfast
• 16-24 yrs
• C2
• Single
• 25-34 yrs
• C1
• Belfast
Meals or snacks
on the premises
of a pub/restaurant
Takeaway meals eaten
off the premises where
they were prepared
Meals or snacks
delivered to your
home
NI 2005 NI 2007 NI 2009
• 16-25 yrs
• ABC1
• Outer Belfast
• 16-34 yrs
• C1
• Not main/joint shopper
• North of NI
• Basic/no cooking skills
• 3+ household
• 16-44 yrs
• C1
• Not main/joint shopper
• East of NI
• Basic/no cooking skills
• 3+ household
Q.17 In the last 7 days, that is since last……(day of interview), how many of these types of meals, if any, have you eaten? By this I mean main
meals, light meals or snacks, excluding meals eaten in canteens and meals prepared at home or taken from your home.
(Base: All Adults 16+)
• Male
• 16-34 yrs
• ABC1‟s
• Basic/no
cooking skills
• 16-34 yrs
• Rural
• Basic/no
cooking skills
• 3+ household
• Working
• 16-25 yrs
• Belfast
• Outer Belfast
• Basic/no
cooking skills
• 3+ household
• Working
• Students
NI 2011
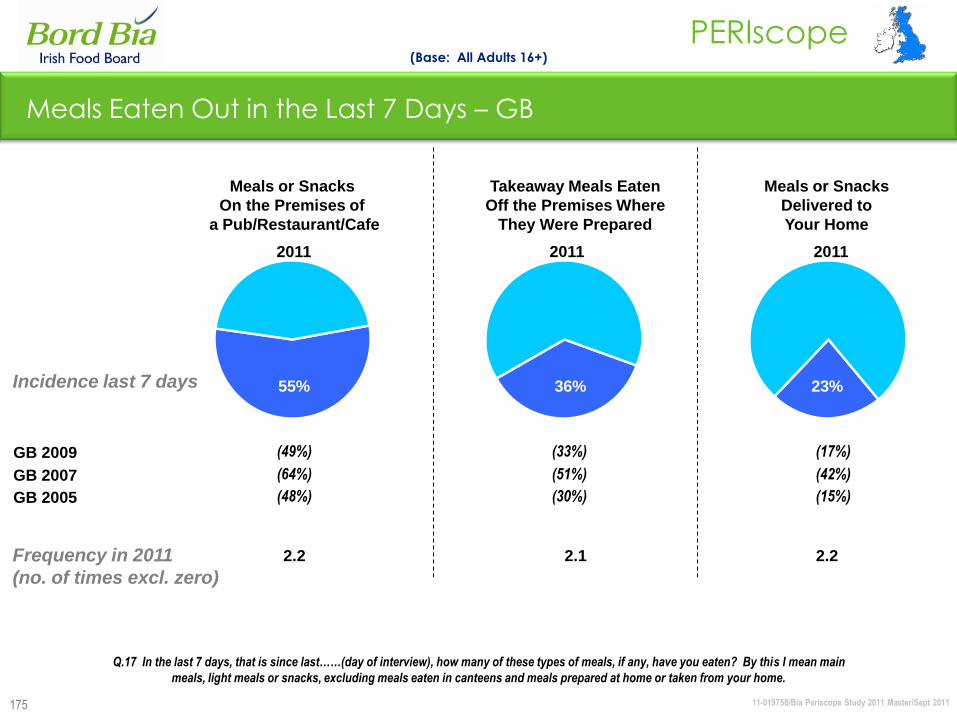
11-019758/Bia Periscope Study 2011 Master/Sept 2011
PERIscope
175
55%
Meals Eaten Out in the Last 7 Days – GB
Meals or Snacks
On the Premises of
a Pub/Restaurant/Cafe
Takeaway Meals Eaten
Off the Premises Where
They Were Prepared
Meals or Snacks
Delivered to
Your Home
2.2 2.1 2.2
(Base: All Adults 16+)
Incidence last 7 days
Frequency in 2011
(no. of times excl. zero)
(64%)GB 2007 (51%) (42%)
36% 23%
Q.17 In the last 7 days, that is since last……(day of interview), how many of these types of meals, if any, have you eaten? By this I mean main
meals, light meals or snacks, excluding meals eaten in canteens and meals prepared at home or taken from your home.
(48%)GB 2005 (30%) (15%)
2011 2011 2011
(49%)GB 2009 (33%) (17%)

11-019758/Bia Periscope Study 2011 Master/Sept 2011
PERIscope
176
Who is Eating Where? – GB
• 15-24
• ABC1
• 15-24
• 3+ Household
• 15-34
• 3+ Household
• 15-24
• Unhealthy
Diet
• 15-24
• London/East
Anglia
• 25-34
• Unhealthy
Diet
• 16-24
• Urban
• 16-24
• Urban
• 55-64
• Married/
Living as
married
GB 2005 GB 2007 GB 2009GB 2003
Meals or snacks
on the premises
of a pub/
restaurant
Takeaway meals
eaten off the
premises where
they were
prepared
Meals or
snacks
delivered to
your home
• 16-24 yrs
• ABC1
• Basic/no
cooking skills
• Male
• 16-34 yrs
• Basic/no
cooking skills
• 3+ household
• Male
• 16-24 yrs
• C1C2
• Basic/no
cooking skills
• Kids
• 3+ household
Q.17 In the last 7 days, that is since last……(day of interview), how many of these types of meals, if any, have you eaten? By this I
mean main meals, light meals or snacks, excluding meals eaten in canteens and meals prepared at home or taken from your home.
(Base: All Adults 16+)
• Male
• 16-44 yrs
• ABC1‟s
• Basic/no
cooking skills
• Working
• Student
• Male• London• 16-44 yrs• Basic/no
cooking skills• 3+ household• Working• Student
• 16-44 yrs• Urban • Yorkshire• London• Basic/no
cooking skills• 3+ household• Kids
GB 2011
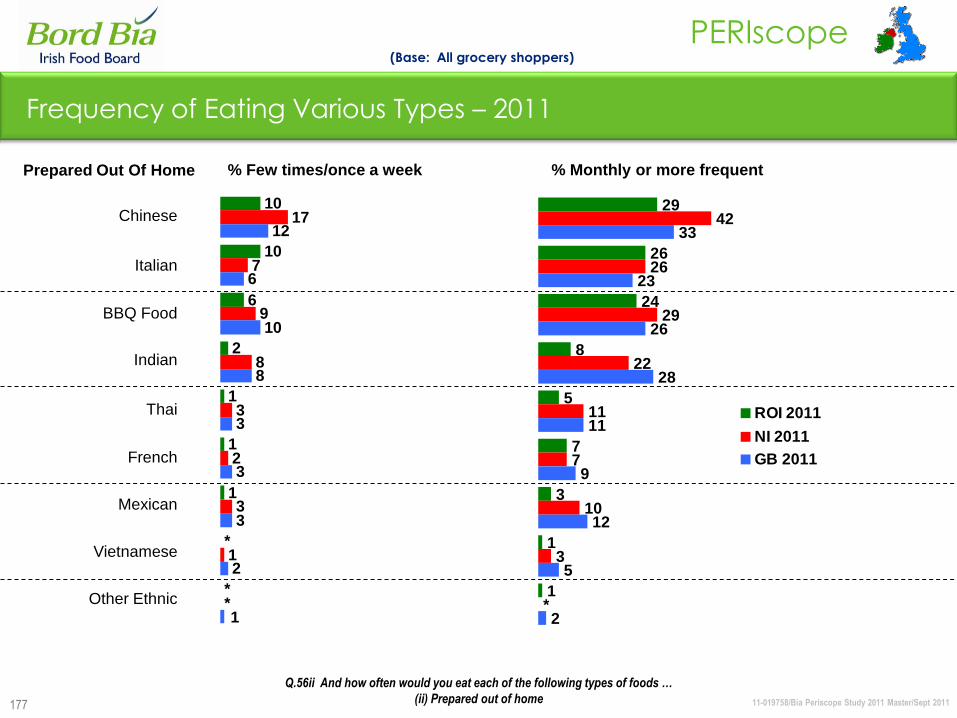
11-019758/Bia Periscope Study 2011 Master/Sept 2011
PERIscope
177
10
10
6
2
1
1
1
17
7
9
8
3
2
3
1
12
6
10
8
3
3
3
2
*
*
*1
Frequency of Eating Various Types – 2011
Chinese
Italian
BBQ Food
Indian
Thai
French
Mexican
Vietnamese
Other Ethnic
(Base: All grocery shoppers)
Prepared Out Of Home % Few times/once a week % Monthly or more frequent
29
26
24
8
5
7
3
1
1
42
26
29
22
11
7
10
3
33
23
26
28
11
9
12
5
2*
ROI 2011
NI 2011
GB 2011
Q.56ii And how often would you eat each of the following types of foods …
(ii) Prepared out of home

11-019758/Bia Periscope Study 2011 Master/Sept 2011
PERIscope
178
10
10
6
2
1
1
1
10
8
8
3
2
4
1
1
19
14
15
4
4
1
3
1
12
8
9
3
1
1
1
1
*
*1**
Frequency of Eating Various Types – ROI
Chinese
Italian
BBQ Food
Indian
Thai
French
Mexican
Vietnamese
Other Ethnic
Prepared Out Of Home % Few times/once a week % Monthly or more frequent
29
26
24
8
5
7
3
1
1
30
24
22
9
6
7
3
1
1
48
37
39
17
15
14
12
7
4
33
26
31
25
5
5
5
1
2
ROI 2011ROI 2009ROI 2007ROI 2005
Q.56ii And how often would you eat each of the following types of foods …
(ii) Prepared out of home
(Base: All grocery shoppers)
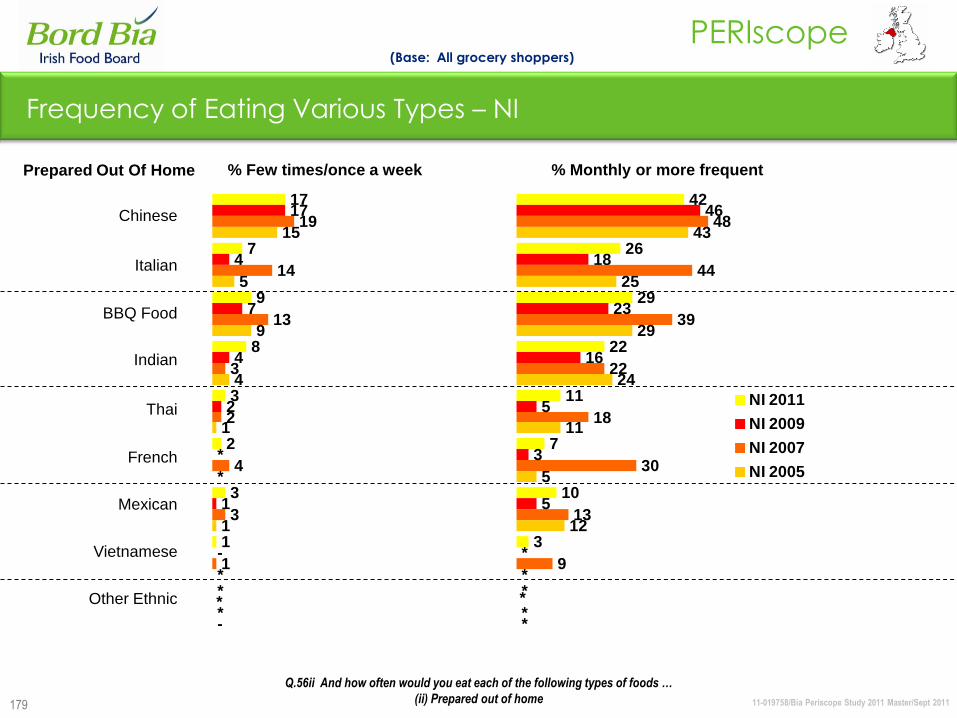
11-019758/Bia Periscope Study 2011 Master/Sept 2011
PERIscope
179
Frequency of Eating Various Types – NI
Prepared Out Of Home
17
7
9
8
3
2
3
1
17
4
7
4
2
1
19
14
13
3
2
4
3
1
15
5
9
4
1
1
*
*
-
**-
*
*
% Few times/once a week % Monthly or more frequent
Chinese
Italian
BBQ Food
Indian
Thai
French
Mexican
Vietnamese
Other Ethnic
42
26
29
22
11
7
10
3
46
18
23
16
5
3
5
48
44
39
22
18
30
13
9
43
25
29
24
11
5
12
*
*
**
*
*
NI 2011
NI 2009
NI 2007
NI 2005
Q.56ii And how often would you eat each of the following types of foods …
(ii) Prepared out of home
(Base: All grocery shoppers)
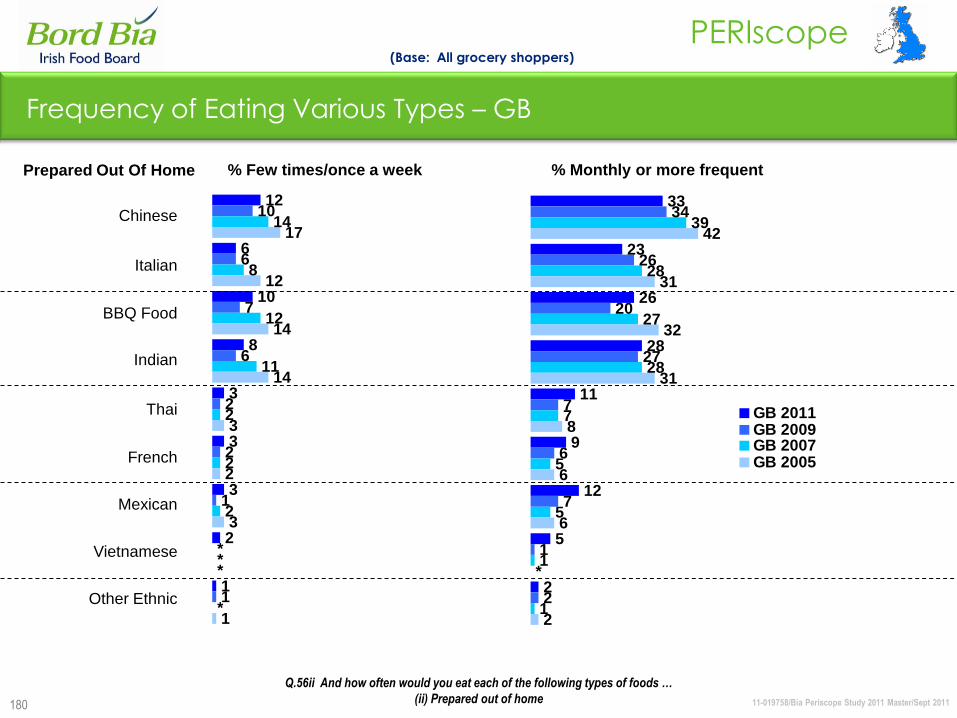
11-019758/Bia Periscope Study 2011 Master/Sept 2011
PERIscope
180
Frequency of Eating Various Types – GB
Prepared Out Of Home
12
6
10
8
3
3
3
2
1
10
6
7
6
2
2
1
1
14
8
12
11
2
2
2
17
12
14
14
3
2
3
*
*
**
1
33
23
26
28
11
9
12
5
2
34
26
20
27
7
6
7
1
2
39
28
27
28
7
5
5
1
1
42
31
32
31
8
6
6
2
*
GB 2011GB 2009GB 2007GB 2005
Chinese
Italian
BBQ Food
Indian
Thai
French
Mexican
Vietnamese
Other Ethnic
% Few times/once a week % Monthly or more frequent
Q.56ii And how often would you eat each of the following types of foods …
(ii) Prepared out of home
(Base: All grocery shoppers)
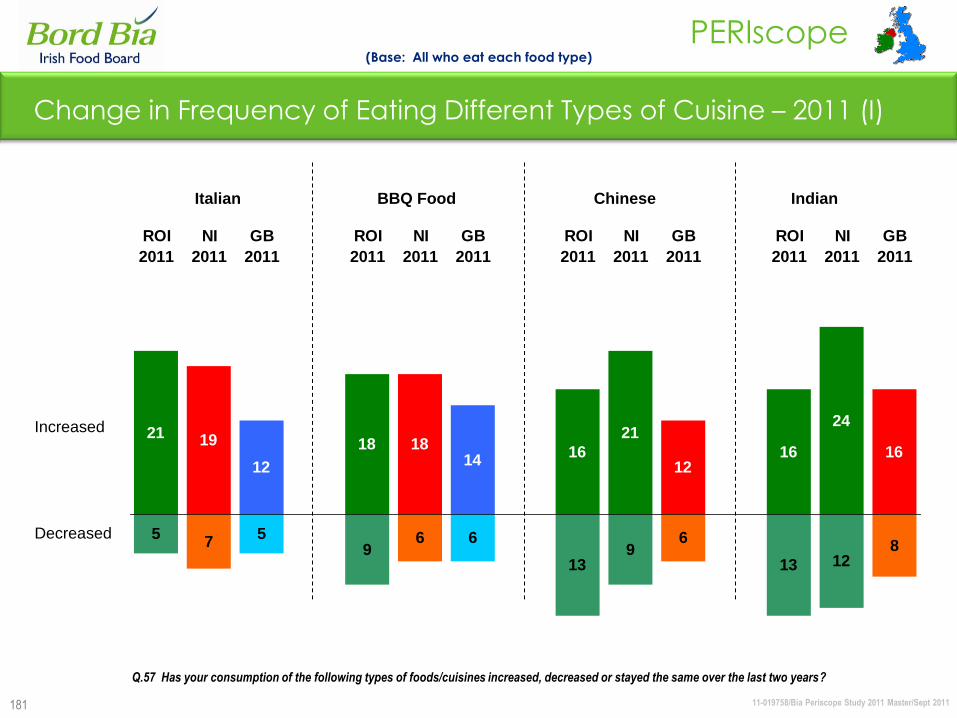
11-019758/Bia Periscope Study 2011 Master/Sept 2011
PERIscope
181
Change in Frequency of Eating Different Types of Cuisine – 2011 (I)
(Base: All who eat each food type)
57
59
6 6
139
6
13 128
21 19
12
18 1814
16
21
1216
24
16
ROI
2011
NI
2011
GB
2011
ROI
2011
NI
2011
GB
2011
ROI
2011
NI
2011
GB
2011
ROI
2011
NI
2011
GB
2011
Increased
Decreased
Italian BBQ Food Chinese Indian
Q.57 Has your consumption of the following types of foods/cuisines increased, decreased or stayed the same over the last two years?

11-019758/Bia Periscope Study 2011 Master/Sept 2011
PERIscope
182
Change in Frequency of Eating Different Types of Cuisine – 2011 (II)
(Base: All who eat each food type)
611
5 8 8 6 713
7 7
20
5
1117
6
18 20
11
2419
9 1118
5
ROI
2011
NI
2011
GB
2011
ROI
2011
NI
2011
GB
2011
ROI
2011
NI
2011
GB
2011
ROI
2011
NI
2011
GB
2011
Increased
Decreased
French Mexican Thai Vietnamese
Q.57 Has your consumption of the following types of foods/cuisines increased, decreased or stayed the same over the last two years?
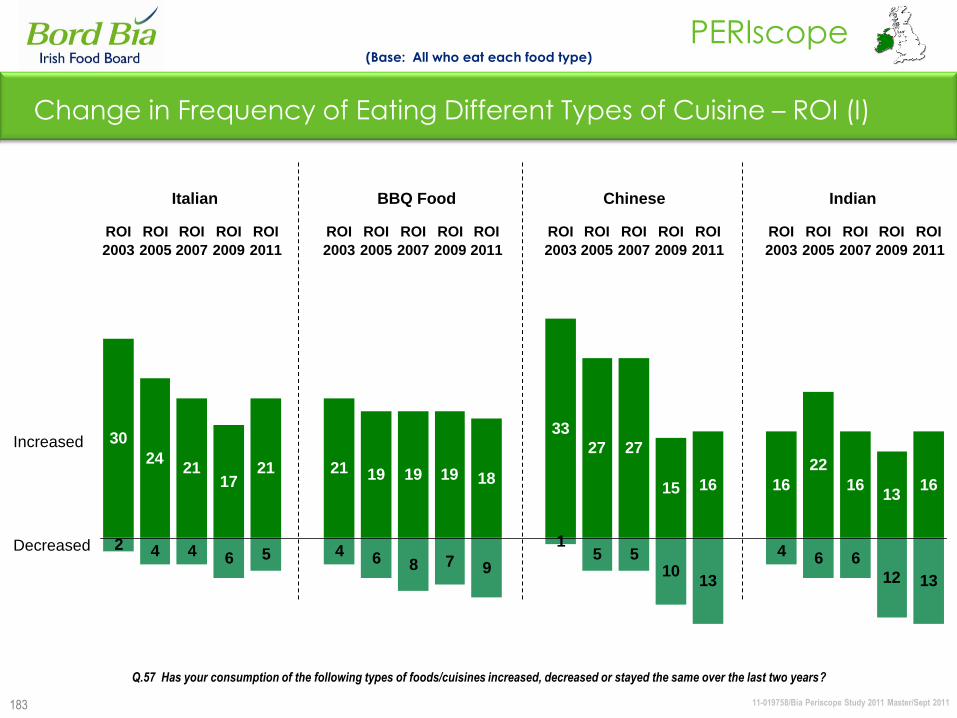
11-019758/Bia Periscope Study 2011 Master/Sept 2011
PERIscope
183
Change in Frequency of Eating Different Types of Cuisine – ROI (I)
(Base: All who eat each food type)
2 4 4 6 5 4 6 8 7 9
15 5
1013
4 6 6
12 13
30
2421
1721 21 19 19 19 18
33
27 27
15 16 16
22
1613
16
ROI
2003
ROI
2005
ROI
2007
ROI
2009
ROI
2011
ROI
2003
ROI
2005
ROI
2007
ROI
2009
ROI
2011
ROI
2003
ROI
2005
ROI
2007
ROI
2009
ROI
2011
ROI
2003
ROI
2005
ROI
2007
ROI
2009
ROI
2011
Increased
Decreased
Italian BBQ Food Chinese Indian
Q.57 Has your consumption of the following types of foods/cuisines increased, decreased or stayed the same over the last two years?
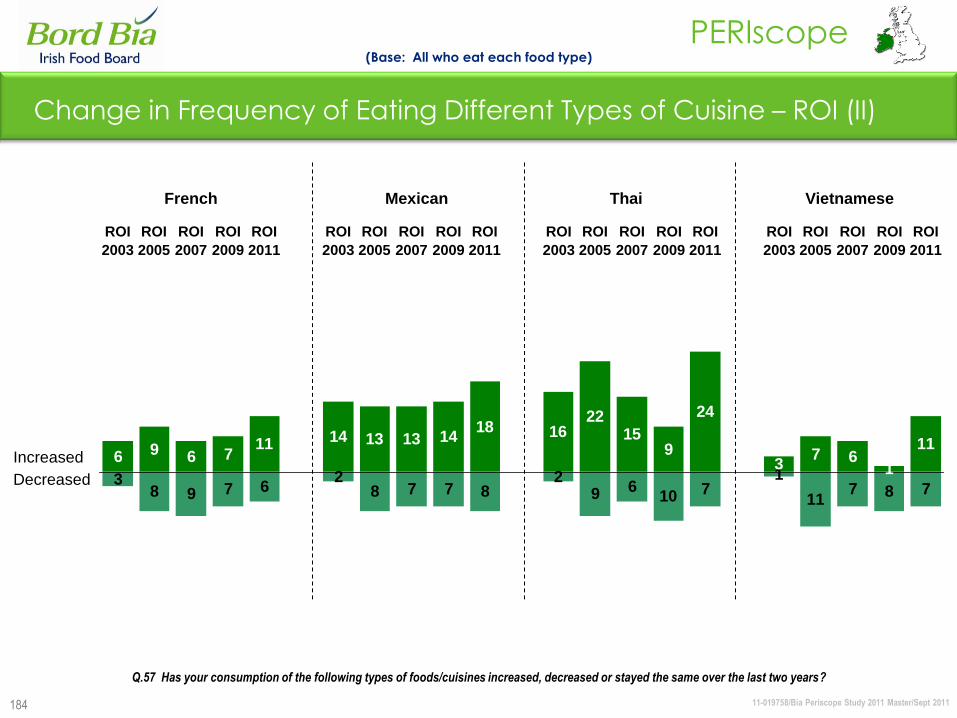
11-019758/Bia Periscope Study 2011 Master/Sept 2011
PERIscope
184
Change in Frequency of Eating Different Types of Cuisine – ROI (II)
(Base: All who eat each food type)
38 9 7 6
28 7 7 8
29 6
10 71
117 8 7
6 9 6 711 14 13 13 14
18 1622
159
24
37 6
1
11
ROI
2003
ROI
2005
ROI
2007
ROI
2009
ROI
2011
ROI
2003
ROI
2005
ROI
2007
ROI
2009
ROI
2011
ROI
2003
ROI
2005
ROI
2007
ROI
2009
ROI
2011
ROI
2003
ROI
2005
ROI
2007
ROI
2009
ROI
2011
Increased
Decreased
French Mexican Thai Vietnamese
Q.57 Has your consumption of the following types of foods/cuisines increased, decreased or stayed the same over the last two years?
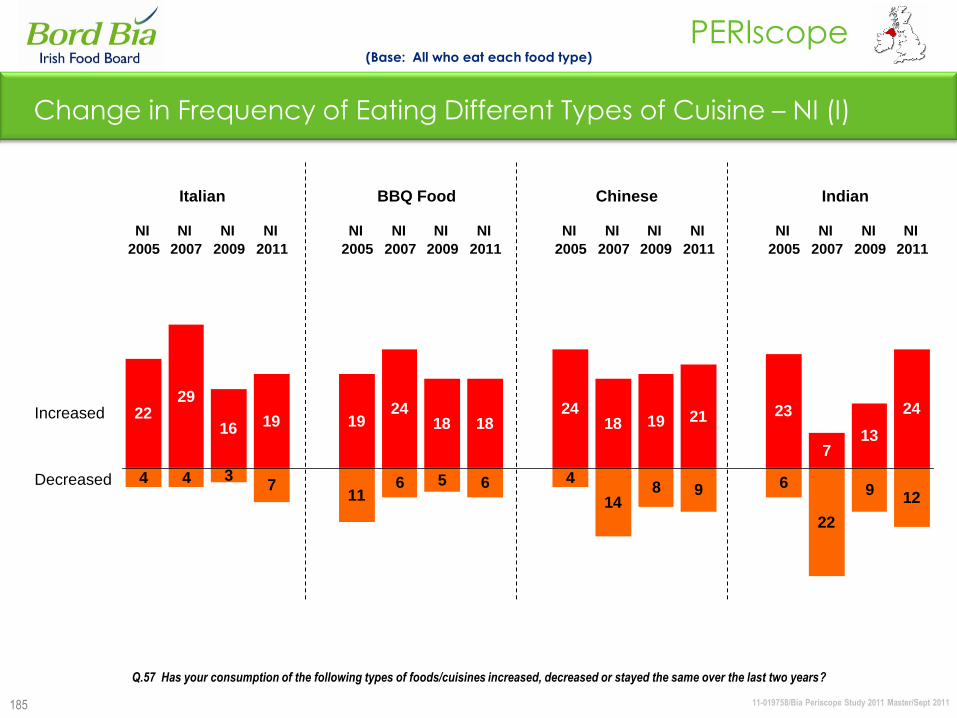
11-019758/Bia Periscope Study 2011 Master/Sept 2011
PERIscope
185
4 4 37
116 5 6 4
148 9 6
22
912
2229
16 19 1924
18 1824
18 19 21 23
713
24
NI
2005
NI
2007
NI
2009
NI
2011
NI
2005
NI
2007
NI
2009
NI
2011
NI
2005
NI
2007
NI
2009
NI
2011
NI
2005
NI
2007
NI
2009
NI
2011
Change in Frequency of Eating Different Types of Cuisine – NI (I)
(Base: All who eat each food type)
Increased
Decreased
Italian BBQ Food Chinese Indian
Q.57 Has your consumption of the following types of foods/cuisines increased, decreased or stayed the same over the last two years?
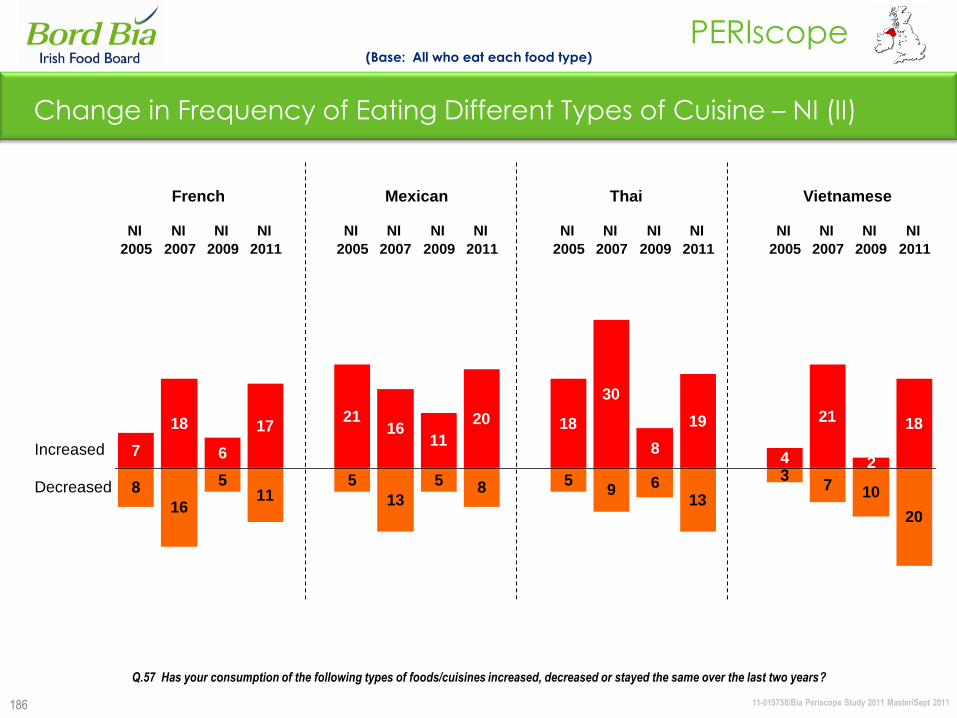
11-019758/Bia Periscope Study 2011 Master/Sept 2011
PERIscope
186
Change in Frequency of Eating Different Types of Cuisine – NI (II)
(Base: All who eat each food type)
Increased
Decreased
French Mexican Thai Vietnamese
8
16
511
5
13
5 8 59 6
13
37 10
20
7
18
6
1721
1611
20 18
30
8
19
4
21
2
18
NI
2005
NI
2007
NI
2009
NI
2011
NI
2005
NI
2007
NI
2009
NI
2011
NI
2005
NI
2007
NI
2009
NI
2011
NI
2005
NI
2007
NI
2009
NI
2011
Q.57 Has your consumption of the following types of foods/cuisines increased, decreased or stayed the same over the last two years?
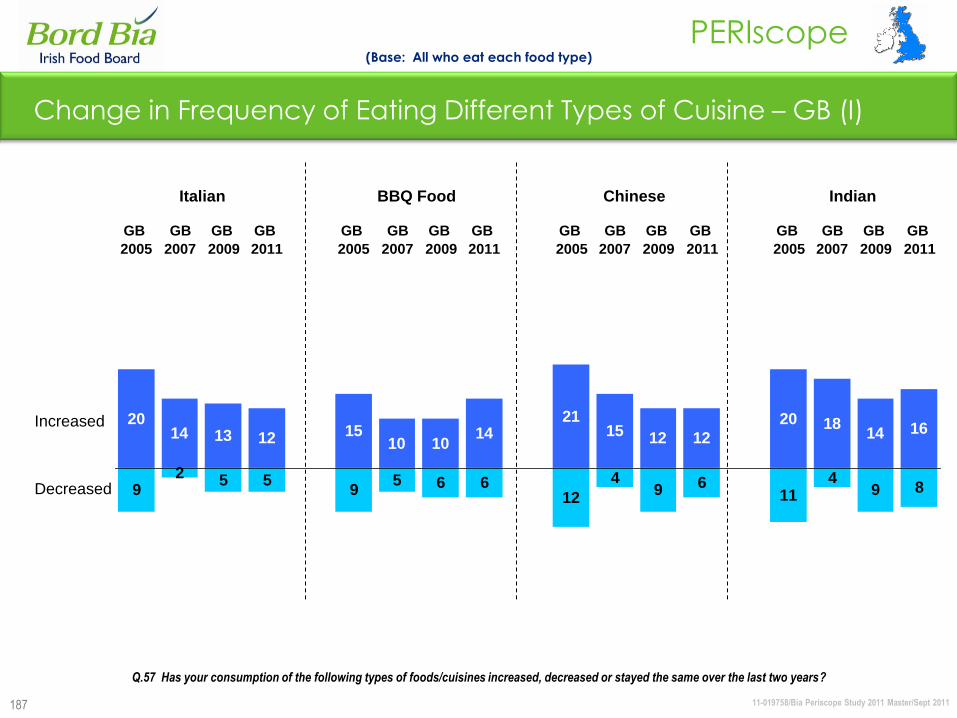
11-019758/Bia Periscope Study 2011 Master/Sept 2011
PERIscope
187
Change in Frequency of Eating Different Types of Cuisine – GB (I)
(Base: All who eat each food type)
92 5 5
95 6 6
12
49 6
114
9 8
2014 13 12 15
10 1014
2115 12 12
20 1814 16
GB
2005
GB
2007
GB
2009
GB
2011
GB
2005
GB
2007
GB
2009
GB
2011
GB
2005
GB
2007
GB
2009
GB
2011
GB
2005
GB
2007
GB
2009
GB
2011
Increased
Decreased
Italian BBQ Food Chinese Indian
Q.57 Has your consumption of the following types of foods/cuisines increased, decreased or stayed the same over the last two years?
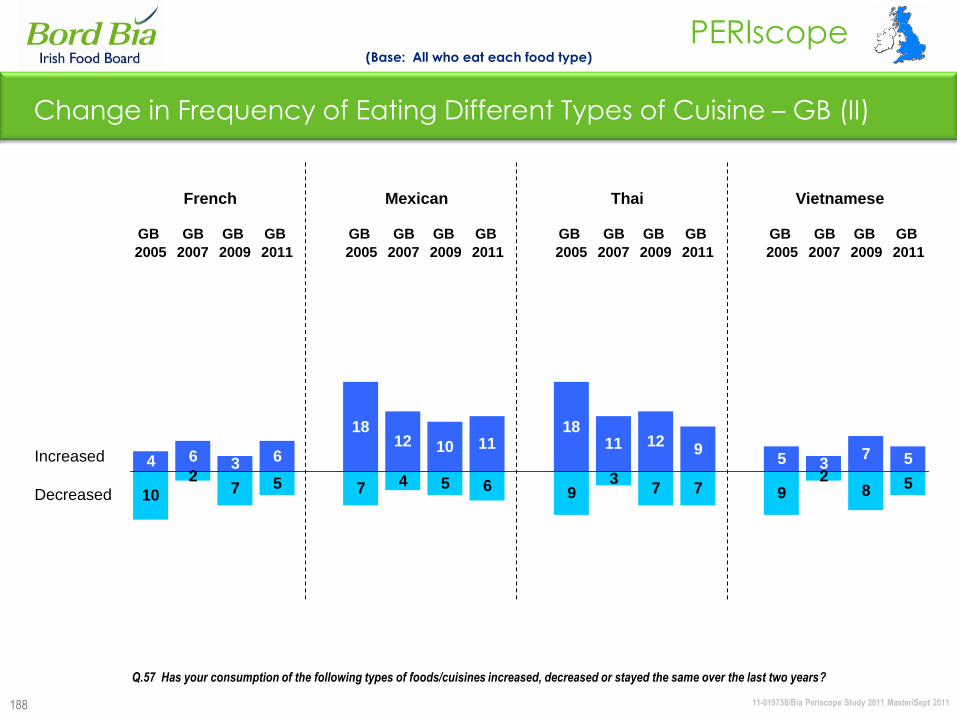
11-019758/Bia Periscope Study 2011 Master/Sept 2011
PERIscope
188
Change in Frequency of Eating Different Types of Cuisine – GB (II)
(Base: All who eat each food type)
Increased
Decreased
French Mexican Thai Vietnamese
10
27 5 7 4 5 6 9
37 7 9
28 5
4 6 3 6
1812 10 11
1811 12
95 3
7 5
GB
2005
GB
2007
GB
2009
GB
2011
GB
2005
GB
2007
GB
2009
GB
2011
GB
2005
GB
2007
GB
2009
GB
2011
GB
2005
GB
2007
GB
2009
GB
2011
Q.57 Has your consumption of the following types of foods/cuisines increased, decreased or stayed the same over the last two years?
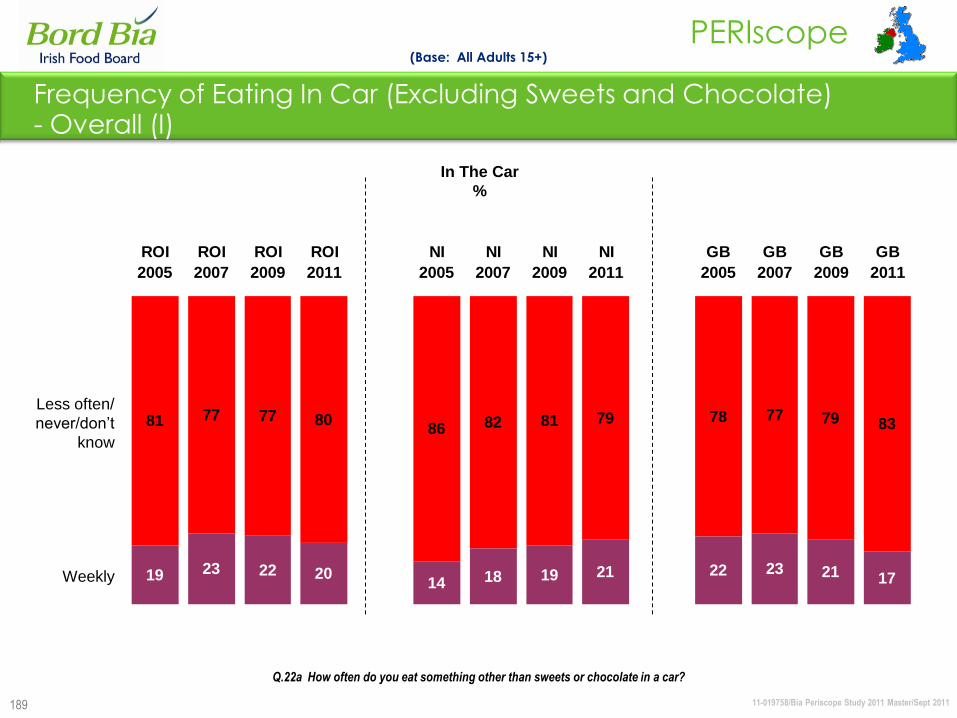
11-019758/Bia Periscope Study 2011 Master/Sept 2011
PERIscope
189
Frequency of Eating In Car (Excluding Sweets and Chocolate) - Overall (I)
81 77 77 8086 82 81 79 78 77 79 83
19 23 22 2014 18 19 21 22 23 21 17
ROI
2005
ROI
2007
ROI
2009
ROI
2011
NI
2005
NI
2007
NI
2009
NI
2011
GB
2005
GB
2007
GB
2009
GB
2011
Less often/
never/don‟t
know
Weekly
(Base: All Adults 15+)
In The Car
%
Q.22a How often do you eat something other than sweets or chocolate in a car?

11-019758/Bia Periscope Study 2011 Master/Sept 2011
PERIscope
190
Less often/
never/ don‟t
know
Weekly
Frequency of Eating At Work (Excluding Sweets and Chocolate)- Overall (II)
(Base: All Adults 15+)
At Work
%
Q.22b How often do you eat something other than sweets or chocolate on the premises where you work?
7368 68 73
68 68 69 73 69 67 69 72
2732 31 27
32 32 31 26 31 33 31 28
ROI
2005
ROI
2007
ROI
2009
ROI
2011
NI
2005
NI
2007
NI
2009
NI
2011
GB
2005
GB
2007
GB
2009
GB
2011
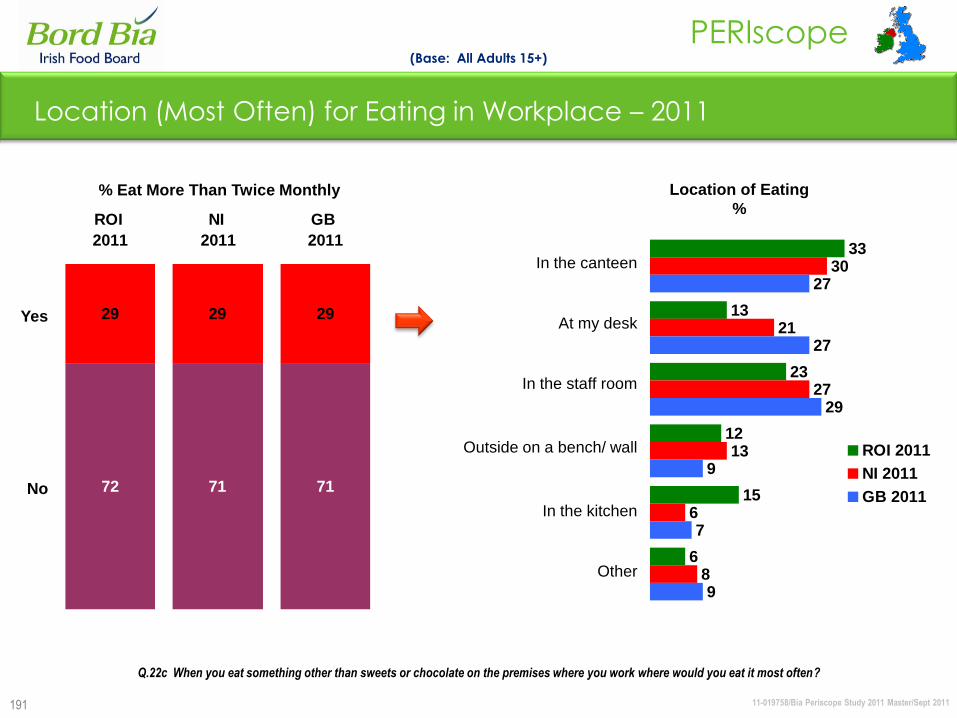
11-019758/Bia Periscope Study 2011 Master/Sept 2011
PERIscope
191
29 29 29
72 71 71
ROI
2011
NI
2011
GB
201133
13
23
12
15
6
30
21
27
13
6
8
27
27
29
9
7
9
ROI 2011
NI 2011
GB 2011
Location (Most Often) for Eating in Workplace – 2011
(Base: All Adults 15+)
% Eat More Than Twice Monthly
In the canteen
At my desk
In the staff room
Outside on a bench/ wall
In the kitchen
Other
Location of Eating
%
Q.22c When you eat something other than sweets or chocolate on the premises where you work where would you eat it most often?
Yes
No
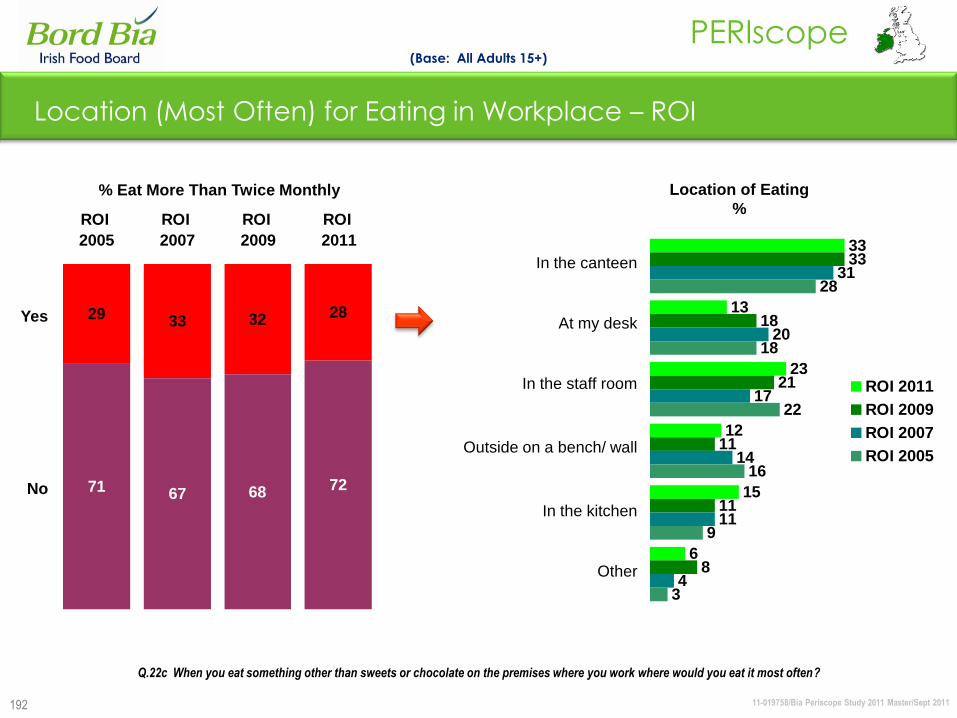
11-019758/Bia Periscope Study 2011 Master/Sept 2011
PERIscope
192
28
72
3229 33
6871 67
ROI
2005
ROI
2007
ROI
2009
ROI
2011 33
13
23
12
15
6
33
18
21
11
11
8
31
20
17
14
11
4
28
18
22
16
9
3
ROI 2011
ROI 2009
ROI 2007
ROI 2005
Location (Most Often) for Eating in Workplace – ROI
(Base: All Adults 15+)
% Eat More Than Twice Monthly
In the canteen
At my desk
In the staff room
Outside on a bench/ wall
In the kitchen
Other
Location of Eating
%
Q.22c When you eat something other than sweets or chocolate on the premises where you work where would you eat it most often?
Yes
No
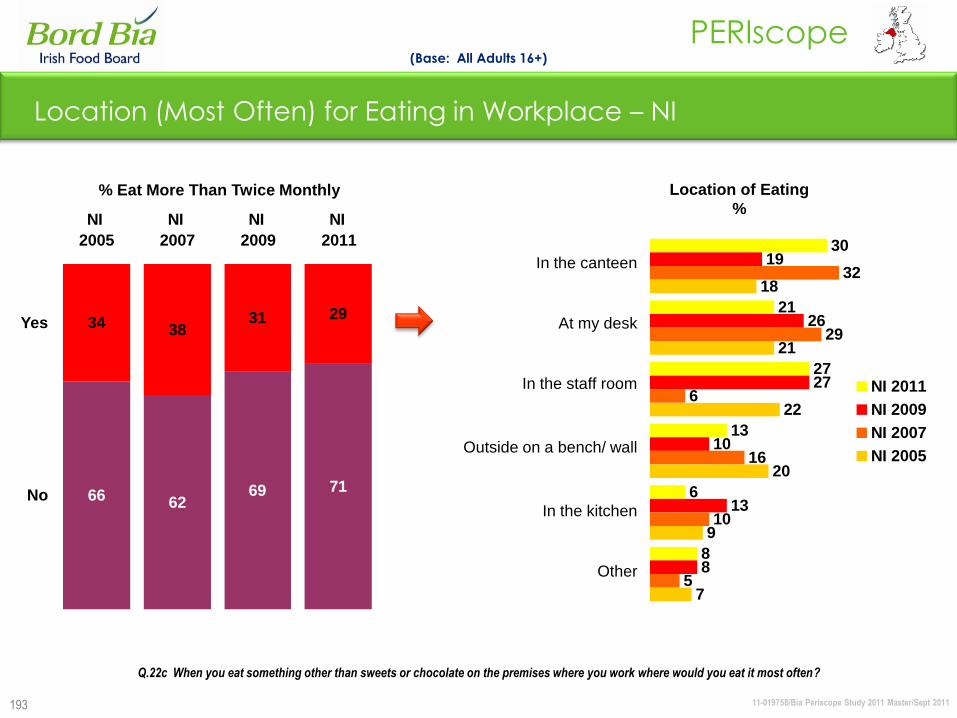
11-019758/Bia Periscope Study 2011 Master/Sept 2011
PERIscope
193
29
71
3134 38
6966 62
NI
2005
NI
2007
NI
2009
NI
2011 30
21
27
13
6
8
19
26
27
10
13
8
32
29
6
16
10
5
18
21
22
20
9
7
NI 2011
NI 2009
NI 2007
NI 2005
Location (Most Often) for Eating in Workplace – NI
(Base: All Adults 16+)
% Eat More Than Twice Monthly
In the canteen
At my desk
In the staff room
Outside on a bench/ wall
In the kitchen
Other
Location of Eating
%
Q.22c When you eat something other than sweets or chocolate on the premises where you work where would you eat it most often?
Yes
No
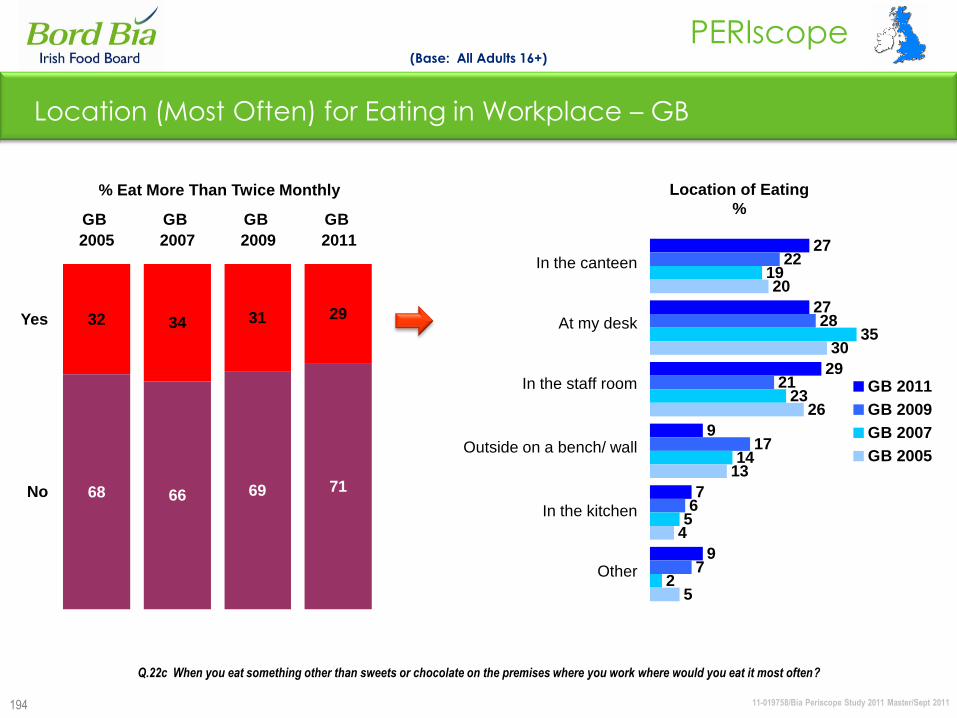
11-019758/Bia Periscope Study 2011 Master/Sept 2011
PERIscope
194
29
71
3132 34
6968 66
GB
2005
GB
2007
GB
2009
GB
2011 27
27
29
9
7
9
22
28
21
17
6
7
19
35
23
14
5
2
20
30
26
13
4
5
GB 2011
GB 2009
GB 2007
GB 2005
Location (Most Often) for Eating in Workplace – GB
(Base: All Adults 16+)
% Eat More Than Twice Monthly
In the canteen
At my desk
In the staff room
Outside on a bench/ wall
In the kitchen
Other
Location of Eating
%
Q.22c When you eat something other than sweets or chocolate on the premises where you work where would you eat it most often?
Yes
No

Health & Wellbeing
11-019758/Bia Periscope Study 2011 Master/Sept 2011
PERIscope
196
Health & Wellbeing: Summary
ROI positions itself as the healthiest region, with more than 4 out of 5 respondents describing their diet as
very/fairly healthy. This trend has increased steadily since 2007.
There is still a divided opinion as to whether respondents should be eating more or less of “bread, cereals,
pasta, rice, potatoes”, “milk & dairy products” and “meat”. Having said that, all regions are aware that they
should consume more “fresh fruit & vegetables”, “fish”, “hi-fibre or wholegrain foods” in order to be more
healthy. While consumption of “salty”, “fatty” or “sugary foods” should be reduced.
ROI see a direct link between eating healthy and being healthy (93%) compared to 78% in NI and 86% in
GB.
There appears to be still quite a bit of confusion surrounding labelling on packs and the various nutritional
claims on them. That said, GB consumers appear to have the greatest overall understanding in terms of
“the nutritional claims on packaging” and “understanding labelling on food”.

11-019758/Bia Periscope Study 2011 Master/Sept 2011
PERIscope
197
30
1218
55
58
61
9
1911
5 9 10
1 1 1***
ROI 2011 NI 2011 GB 2011
Overall Descriptors of Diet – 2011
My Diet is …
79%70%
(Base: All Adults 15+)
Mean 2011 4.1 3.7 3.9
Mean 2009 3.9 3.8 3.9
Mean 2007 3.9 3.8 3.8
Mean 2005 4.0 3.9 3.8
%
Very healthy
Fairly healthy
Not sureFairly unhealthyVery unhealthy
Don‟t know
Q.59 How would you describe your diet overall?
84%
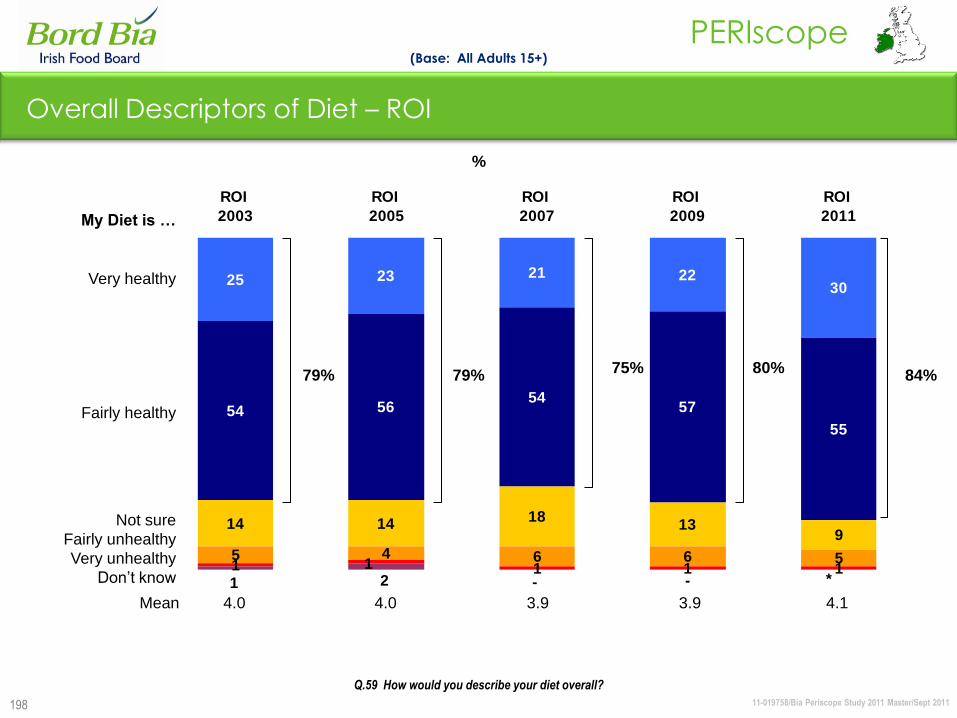
11-019758/Bia Periscope Study 2011 Master/Sept 2011
PERIscope
198
25 23 21 2230
54 5654
57
55
14 1418
139
5 4 6 6 51 1 1 11
*--21
ROI
2003
ROI
2005
ROI
2007
ROI
2009
ROI
2011
Overall Descriptors of Diet – ROI
75%79%79%
(Base: All Adults 15+)
Mean 4.0 4.0 3.9 3.9 4.1
%
Very healthy
Fairly healthy
Not sure
Fairly unhealthy
Very unhealthy
Don‟t know
My Diet is …
Q.59 How would you describe your diet overall?
80% 84%
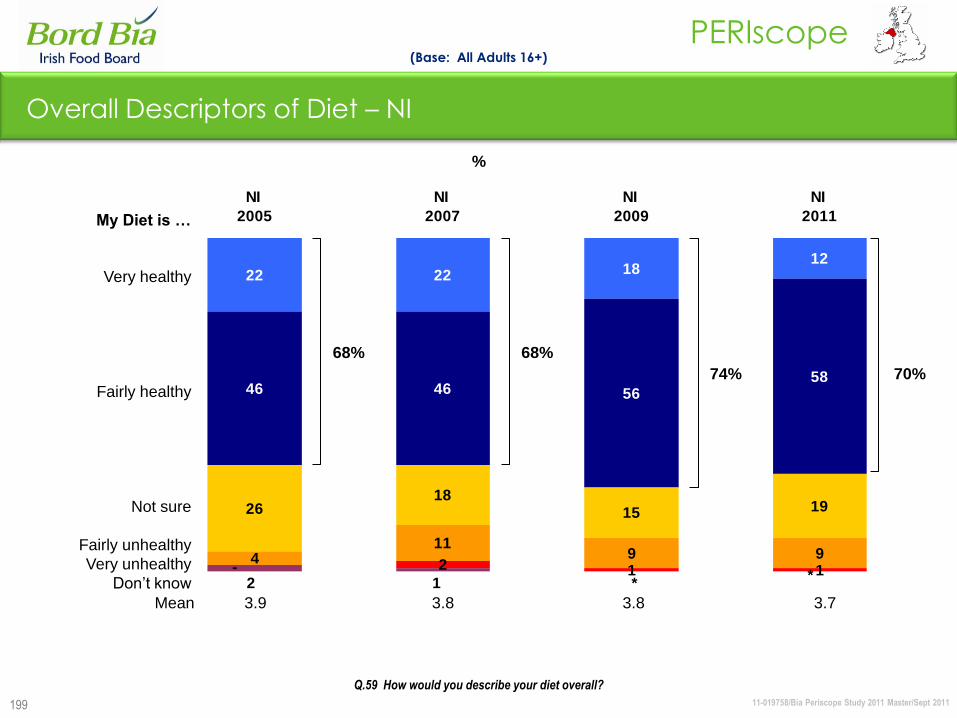
11-019758/Bia Periscope Study 2011 Master/Sept 2011
PERIscope
199
Overall Descriptors of Diet – NI
(Base: All Adults 16+)
%
Very healthy
Fairly healthy
Not sure
Fairly unhealthy
Very unhealthy
Don‟t know
22 22 1812
46 46 5658
2618
15 19
411
9 92 1 1-
**12
NI
2005
NI
2007
NI
2009
NI
2011
Mean 3.9 3.8 3.8 3.7
My Diet is …
Q.59 How would you describe your diet overall?
68% 68%
74% 70%
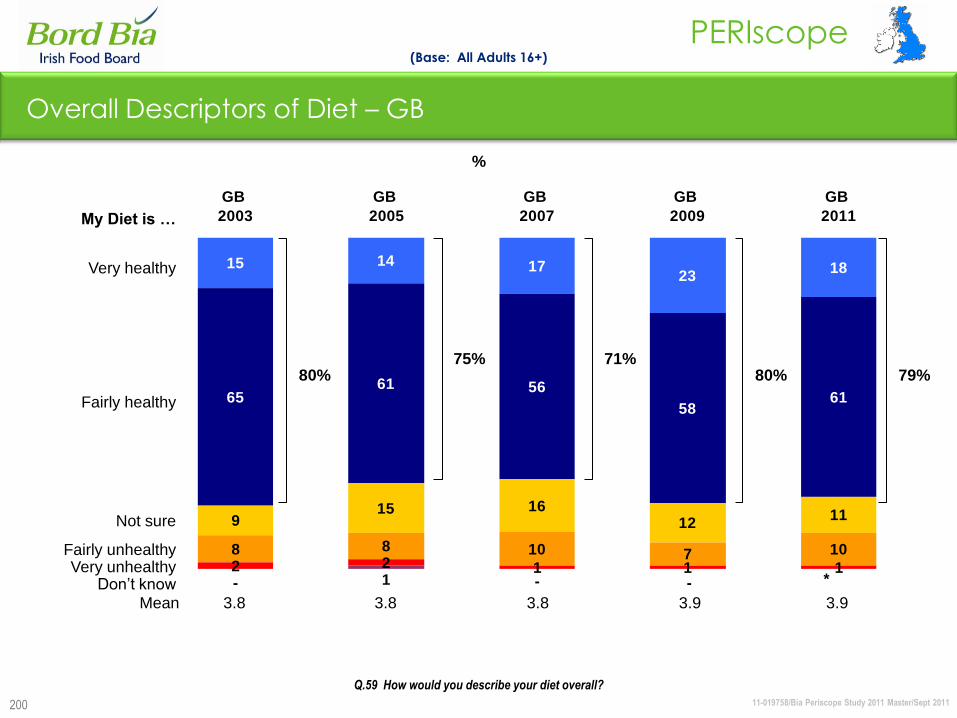
11-019758/Bia Periscope Study 2011 Master/Sept 2011
PERIscope
200
15 14 1723
18
6561 56
5861
915 16
1211
8 8 10 7 102 2 1 1 1
*--1-
GB
2003
GB
2005
GB
2007
GB
2009
GB
2011
Mean 3.8 3.8 3.8 3.9 3.9
%
Very healthy
Fairly healthy
Not sure
Fairly unhealthyVery unhealthy
Don‟t know
Overall Descriptors of Diet – GB
(Base: All Adults 16+)
My Diet is …
Q.59 How would you describe your diet overall?
80%75% 71%
80% 79%
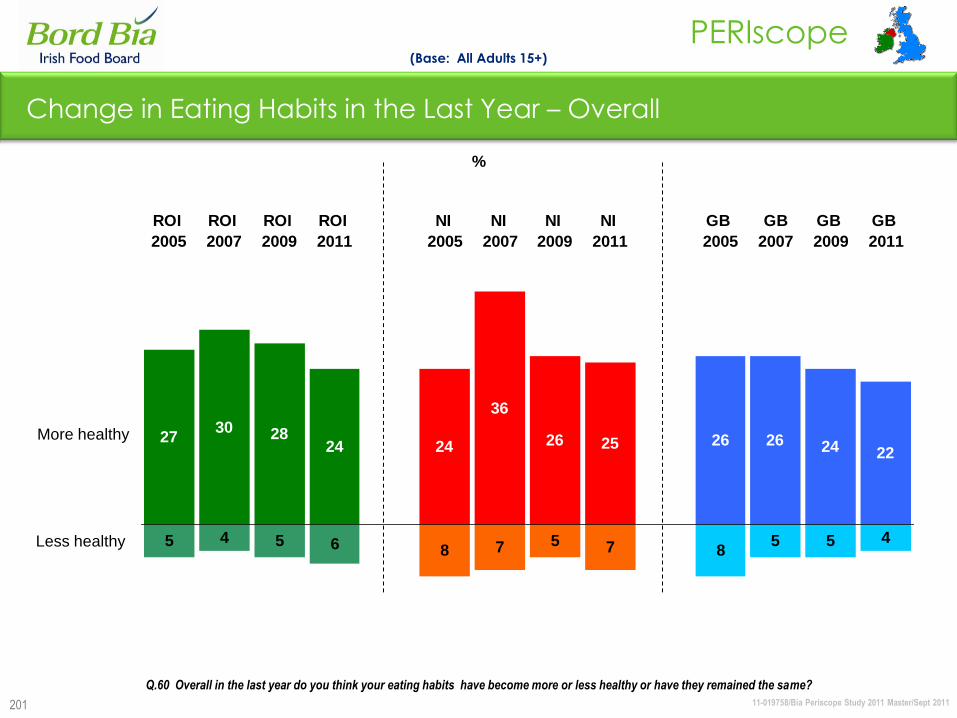
11-019758/Bia Periscope Study 2011 Master/Sept 2011
PERIscope
201
5 4 58 7 5
85 5
2730 28
24
36
26 26 26 24
476
222524
ROI
2005
ROI
2007
ROI
2009
ROI
2011
NI
2005
NI
2007
NI
2009
NI
2011
GB
2005
GB
2007
GB
2009
GB
2011
Change in Eating Habits in the Last Year – Overall
More healthy
Less healthy
(Base: All Adults 15+)
Q.60 Overall in the last year do you think your eating habits have become more or less healthy or have they remained the same?
%
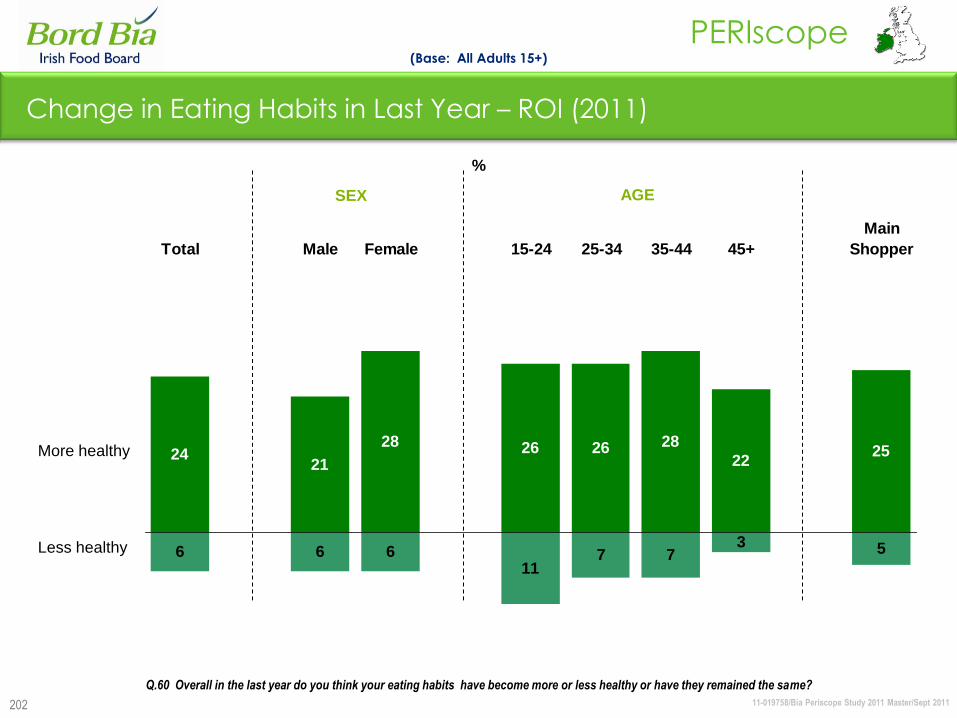
11-019758/Bia Periscope Study 2011 Master/Sept 2011
PERIscope
202
Change in Eating Habits in Last Year – ROI (2011)
6 6 611
7 73 5
2421
28 26 26 28
2225
Total Male Female 15-24 25-34 35-44 45+
Main
Shopper
More healthy
Less healthy
(Base: All Adults 15+)
SEX AGE
%
Q.60 Overall in the last year do you think your eating habits have become more or less healthy or have they remained the same?

11-019758/Bia Periscope Study 2011 Master/Sept 2011
PERIscope
203
Change in Eating Habits in Last Year – NI (2011)
7 8 6 8 8 6 6 6
25 24 25 26 25 23 25 27
Total Male Female 16-24 25-34 35-44 45+
Main
Shopper
More healthy
Less healthy
(Base: All Adults 16+)
SEX AGE
%
Q.60 Overall in the last year do you think your eating habits have become more or less healthy or have they remained the same?
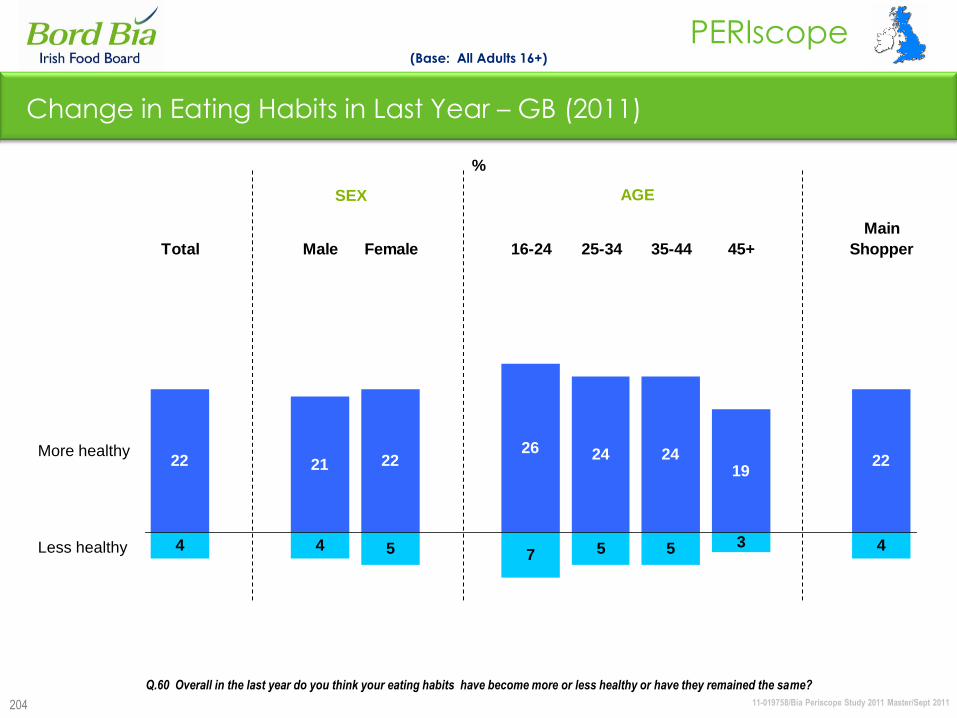
11-019758/Bia Periscope Study 2011 Master/Sept 2011
PERIscope
204
Change in Eating Habits in Last Year – GB (2011)
4 4 5 7 5 5 3 4
22 21 2226 24 24
1922
Total Male Female 16-24 25-34 35-44 45+
Main
Shopper
More healthy
Less healthy
(Base: All Adults 16+)
SEX AGE
%
Q.60 Overall in the last year do you think your eating habits have become more or less healthy or have they remained the same?
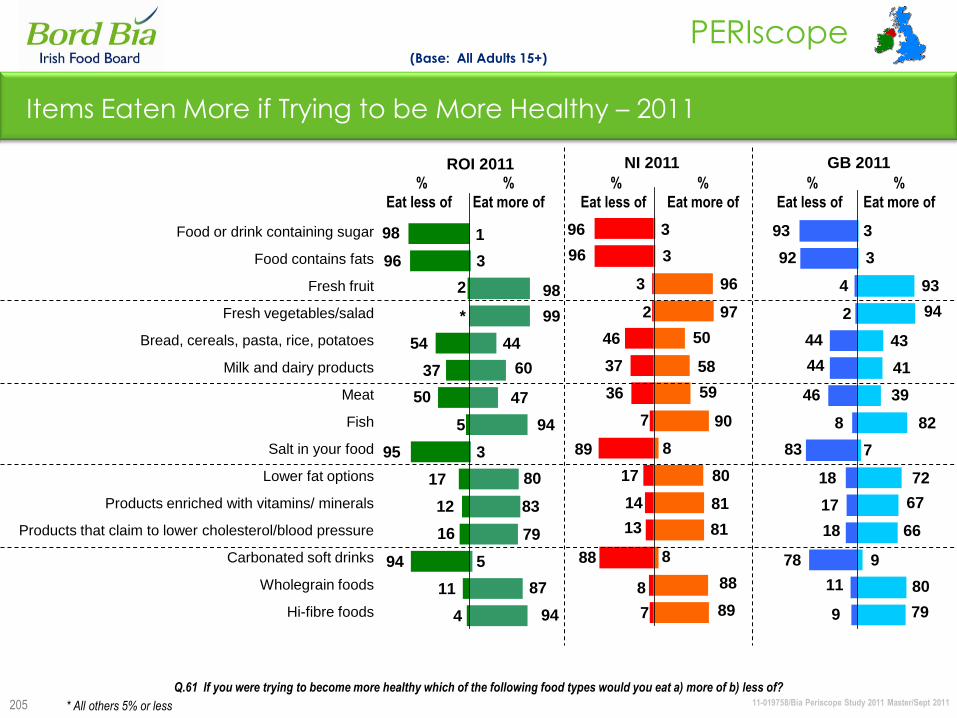
11-019758/Bia Periscope Study 2011 Master/Sept 2011
PERIscope
205
17
12
16
94
95
50
37
54
96
98
2
11
4
5
*
94
47
60
44
99
98
94
87
79
83
80
5
3
1
3
Items Eaten More if Trying to be More Healthy – 2011
Food or drink containing sugar
Food contains fats
Fresh fruit
Fresh vegetables/salad
Bread, cereals, pasta, rice, potatoes
Milk and dairy products
Meat
Fish
Salt in your food
Lower fat options
Products enriched with vitamins/ minerals
Products that claim to lower cholesterol/blood pressure
Carbonated soft drinks
Wholegrain foods
Hi-fibre foods
% %
Eat less of Eat more of
* All others 5% or less
ROI 2011 NI 2011 GB 2011
(Base: All Adults 15+)
46
37
36
89
88
96
96
7
13
14
17
7
8
2
3
89
88
81
81
80
90
59
58
50
96
97
8
8
3
3
78
18
17
18
83
8
46
44
44
92
93
9
11
2
4 93
94
43
41
39
82
72
67
66
80
79
7
9
3
3
Q.61 If you were trying to become more healthy which of the following food types would you eat a) more of b) less of?
% %
Eat less of Eat more of
% %
Eat less of Eat more of
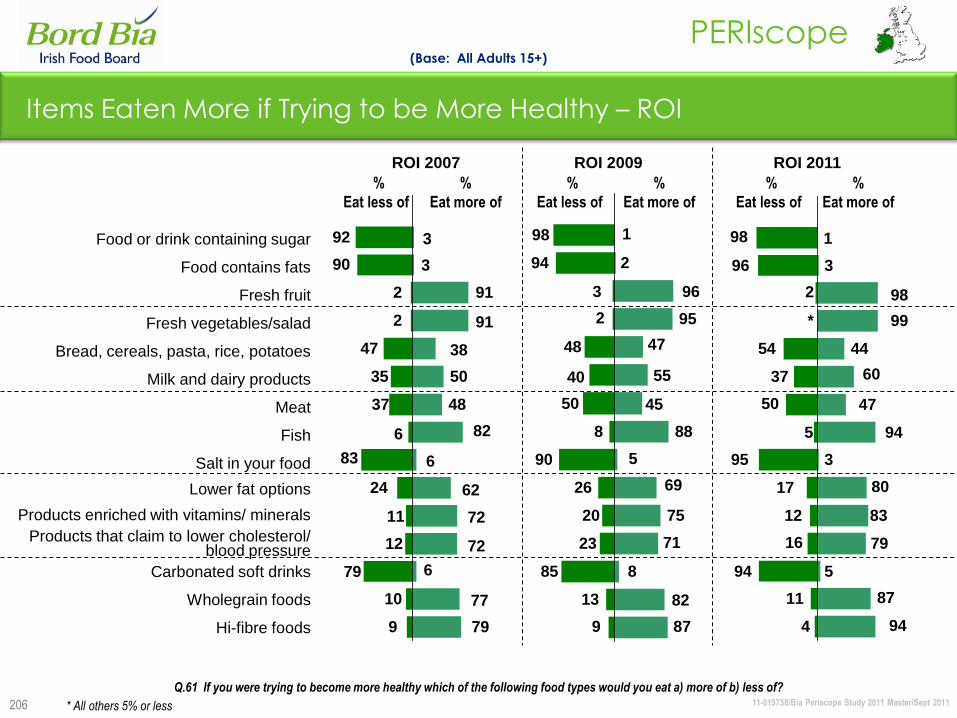
11-019758/Bia Periscope Study 2011 Master/Sept 2011
PERIscope
206
Items Eaten More if Trying to be More Healthy – ROI
Food or drink containing sugar
Food contains fats
Fresh fruit
Fresh vegetables/salad
Bread, cereals, pasta, rice, potatoes
Milk and dairy products
Meat
Fish
Salt in your food
Lower fat options
Products enriched with vitamins/ minerals
Products that claim to lower cholesterol/ blood pressure
Carbonated soft drinks
Wholegrain foods
Hi-fibre foods
* All others 5% or less
ROI 2007 ROI 2009
(Base: All Adults 15+)
Q.61 If you were trying to become more healthy which of the following food types would you eat a) more of b) less of?
9
10
12
11
24
79
83
6
37
35
47
2
2
90
92 3
6
79
77
72
72
62
48
50
38
91
91
3
82
6
% %
Eat less of Eat more of
% %
Eat less of Eat more of
98
94
3
2
48
40
50
90
8
9
13
85
26
20
23
8
87
82
71
75
69
5
88
45
55
47
95
96
2
1
ROI 2011
% %
Eat less of Eat more of
17
12
16
94
95
50
37
54
96
98
2
11
4
5
*
94
47
60
44
99
98
94
87
79
83
80
5
3
1
3
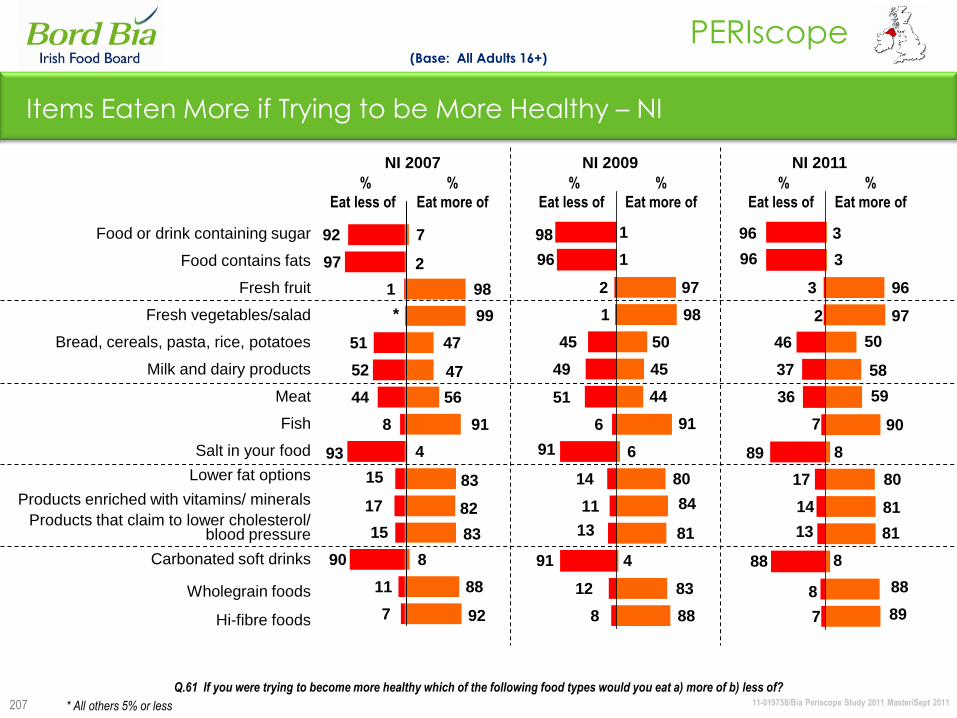
11-019758/Bia Periscope Study 2011 Master/Sept 2011
PERIscope
207
Items Eaten More if Trying to be More Healthy – NI
Food or drink containing sugar
Food contains fats
Fresh fruit
Fresh vegetables/salad
Bread, cereals, pasta, rice, potatoes
Milk and dairy products
Meat
Fish
Salt in your food
Lower fat options
Products enriched with vitamins/ minerals
Products that claim to lower cholesterol/ blood pressure
Carbonated soft drinks
Wholegrain foods
Hi-fibre foods
* All others 5% or less
NI 2007 NI 2009
(Base: All Adults 16+)
Q.61 If you were trying to become more healthy which of the following food types would you eat a) more of b) less of?
7
90
15
17
11
15
93
8
44
52
51
*
1
97
92 7
2
88
92
8
83
82
91
56
47
47
99
98
4
83
% %
Eat less of Eat more of
% %
Eat less of Eat more of
8
12
91
13
11
14
91
6
51
49
45
1
2
96
98
88
83
4
81
84
80
6
91
44
45
50
98
97
1
1
NI 2011
% %
Eat less of Eat more of
46
37
36
89
88
96
96
7
13
14
17
7
8
2
3
89
88
81
81
80
90
59
58
50
96
97
8
8
3
3
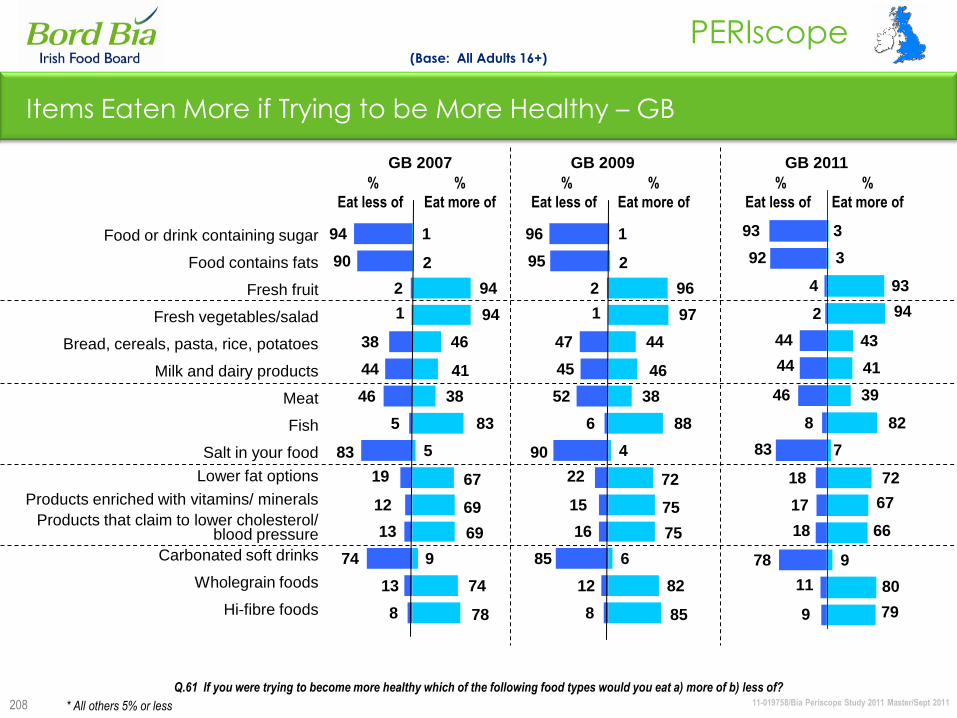
11-019758/Bia Periscope Study 2011 Master/Sept 2011
PERIscope
208
Items Eaten More if Trying to be More Healthy – GB
Food or drink containing sugar
Food contains fats
Fresh fruit
Fresh vegetables/salad
Bread, cereals, pasta, rice, potatoes
Milk and dairy products
Meat
Fish
Salt in your food
Lower fat options
Products enriched with vitamins/ minerals
Products that claim to lower cholesterol/ blood pressure
Carbonated soft drinks
Wholegrain foods
Hi-fibre foods
* All others 5% or less
GB 2007 GB 2009
(Base: All Adults 16+)
Q.61 If you were trying to become more healthy which of the following food types would you eat a) more of b) less of?
8
74
13
12
13
19
83
5
46
44
38
1
2
90
94 1
2
74
78
9
69
69
83
38
41
46
94
94
5
67
8
85
16
15
12
22
90
6
52
45
47
1
2
95
96 1
2
82
85
6
75
75
88
38
46
44
97
96
4
72
% %
Eat less of Eat more of
% %
Eat less of Eat more of
GB 2011
% %
Eat less of Eat more of
78
18
17
18
83
8
46
44
44
92
93
9
11
2
4 93
94
43
41
39
82
72
67
66
80
79
7
9
3
3
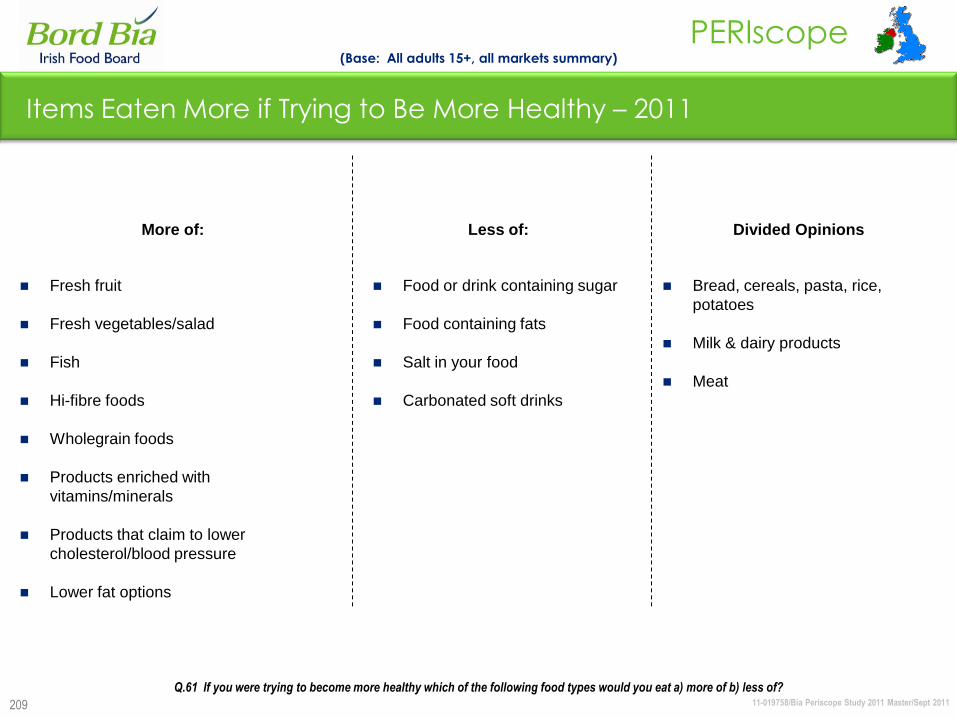
11-019758/Bia Periscope Study 2011 Master/Sept 2011
PERIscope
209
Items Eaten More if Trying to Be More Healthy – 2011
Fresh fruit
Fresh vegetables/salad
Fish
Hi-fibre foods
Wholegrain foods
Products enriched with
vitamins/minerals
Products that claim to lower
cholesterol/blood pressure
Lower fat options
Food or drink containing sugar
Food containing fats
Salt in your food
Carbonated soft drinks
More of: Less of:
Bread, cereals, pasta, rice,
potatoes
Milk & dairy products
Meat
Divided Opinions
(Base: All adults 15+, all markets summary)
Q.61 If you were trying to become more healthy which of the following food types would you eat a) more of b) less of?

11-019758/Bia Periscope Study 2011 Master/Sept 2011
PERIscope
210
Attitude Towards Diet – 2011 (I)
% Agree
Slightly
% Agree
Strongly
To be healthy it is really important to eat properly
A good diet can help your mental health
I think diet and lifestyle are more important than
medication in preventing heart disease
I am conscious of the nutritional benefits of food
I eat to feel good
It doesn‟t matter what I eat, I am fairly healthy
(Base: All Adults 15+)
38
28
30
42
41
42
43
44
40
48
45
39
37
33
33
40
37
35
55
60
54
38
35
17
35
37
30
23
26
9
48
50
44
32
26
15
ROI 2011
NI 2011
GB 2011
Q.3 Now I am going to read out things people have said about their diet and general well-being. Please tell me how much you
agree/disagree with each statement on a scale of 1 to 5 where 5 = Agree Strongly and 1 = Disagree Strongly.
%
Agree
93
78
86
88
81
82
85
70
77
81
71
72
76
70
63
59
48
50
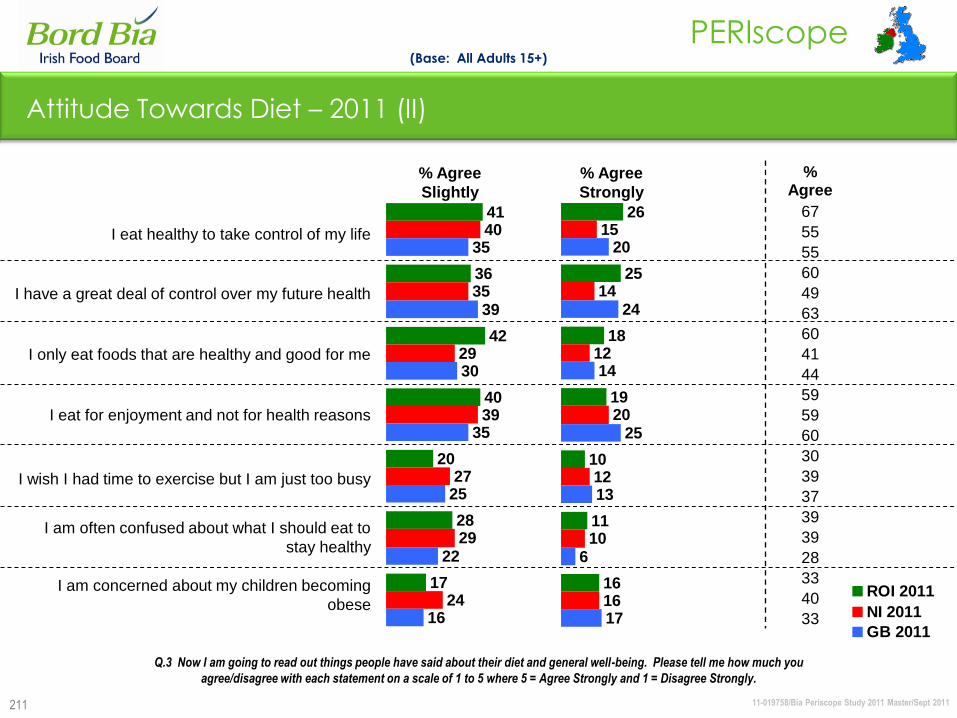
11-019758/Bia Periscope Study 2011 Master/Sept 2011
PERIscope
211
Attitude Towards Diet – 2011 (II)
I eat healthy to take control of my life
I have a great deal of control over my future health
I only eat foods that are healthy and good for me
I eat for enjoyment and not for health reasons
I wish I had time to exercise but I am just too busy
I am often confused about what I should eat to
stay healthy
I am concerned about my children becoming
obese
(Base: All Adults 15+)
41
36
42
40
20
28
17
40
35
29
39
27
29
24
35
39
30
35
25
22
16
Q.3 Now I am going to read out things people have said about their diet and general well-being. Please tell me how much you
agree/disagree with each statement on a scale of 1 to 5 where 5 = Agree Strongly and 1 = Disagree Strongly.
% Agree
Slightly
% Agree
Strongly
26
25
18
19
10
11
16
15
14
12
20
12
10
16
20
24
14
25
13
6
17
ROI 2011
NI 2011
GB 2011
%Agree
67
55
55
60
49
63
60
41
44
59
59
60
30
39
37
39
39
28
33
40
33
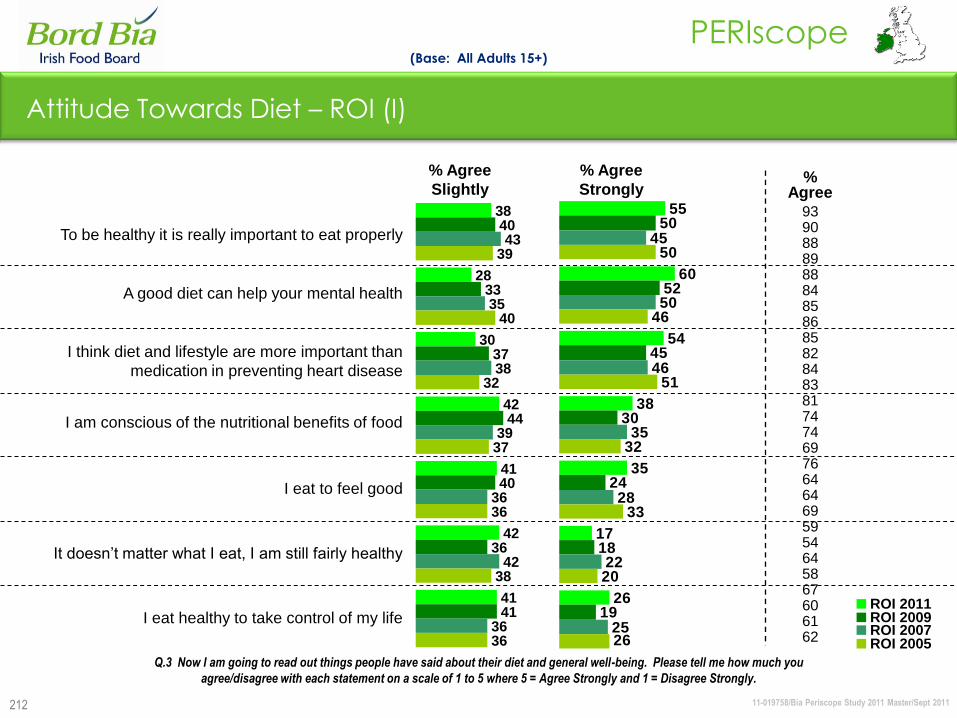
11-019758/Bia Periscope Study 2011 Master/Sept 2011
PERIscope
212
Attitude Towards Diet – ROI (I)
To be healthy it is really important to eat properly
A good diet can help your mental health
I think diet and lifestyle are more important than
medication in preventing heart disease
I am conscious of the nutritional benefits of food
I eat to feel good
It doesn‟t matter what I eat, I am still fairly healthy
I eat healthy to take control of my life
(Base: All Adults 15+)
% Agree
Slightly
% Agree
Strongly
38
28
30
42
41
42
41
40
33
37
44
40
36
41
43
35
38
39
36
42
36
39
40
32
37
36
38
36
55
60
54
38
35
17
26
50
52
45
30
24
18
19
45
50
46
35
28
22
25
50
46
51
32
33
20
26
ROI 2011ROI 2009ROI 2007ROI 2005
Q.3 Now I am going to read out things people have said about their diet and general well-being. Please tell me how much you
agree/disagree with each statement on a scale of 1 to 5 where 5 = Agree Strongly and 1 = Disagree Strongly.
%Agree
93908889888485868582848381747469766464695954645867606162
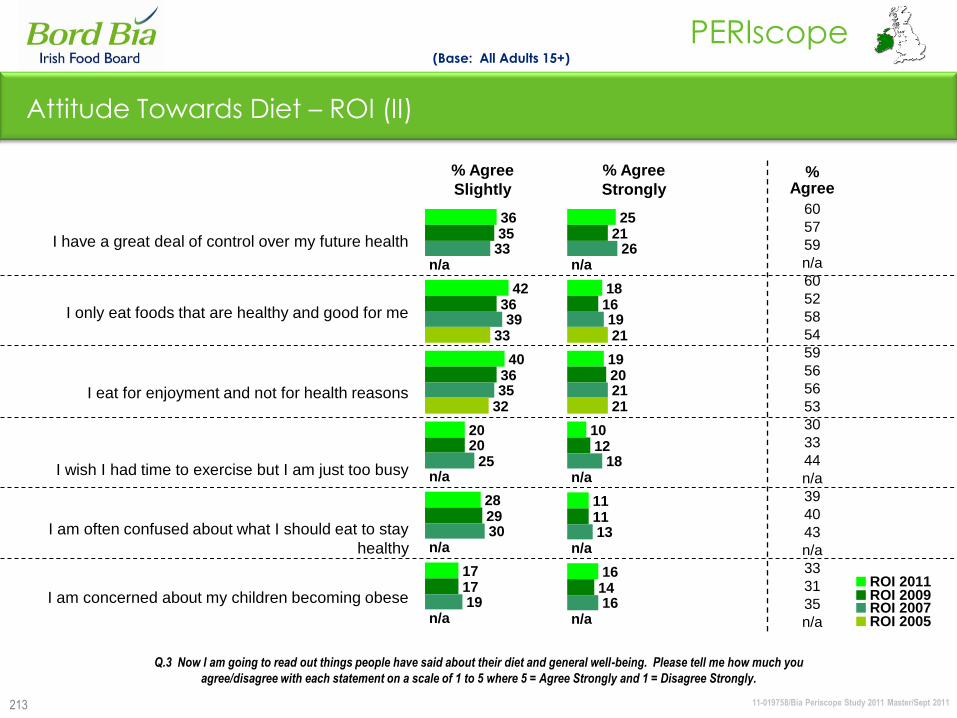
11-019758/Bia Periscope Study 2011 Master/Sept 2011
PERIscope
213
Attitude Towards Diet – ROI (II)
I have a great deal of control over my future health
I only eat foods that are healthy and good for me
I eat for enjoyment and not for health reasons
I wish I had time to exercise but I am just too busy
I am often confused about what I should eat to stay
healthy
I am concerned about my children becoming obese
(Base: All Adults 15+)
% Agree
Slightly
% Agree
Strongly
36
42
40
20
28
17
35
36
36
20
29
17
33
39
35
25
30
19
33
32
n/a
n/a
n/a
n/a
25
18
19
10
11
16
21
16
20
12
11
14
26
19
21
18
13
16
21
21
n/a
n/a
n/a
n/a
ROI 2011ROI 2009ROI 2007ROI 2005
Q.3 Now I am going to read out things people have said about their diet and general well-being. Please tell me how much you
agree/disagree with each statement on a scale of 1 to 5 where 5 = Agree Strongly and 1 = Disagree Strongly.
%Agree
60
57
59
n/a
60
52
58
54
59
56
56
53
30
33
44
n/a
39
40
43
n/a
33
31
35
n/a
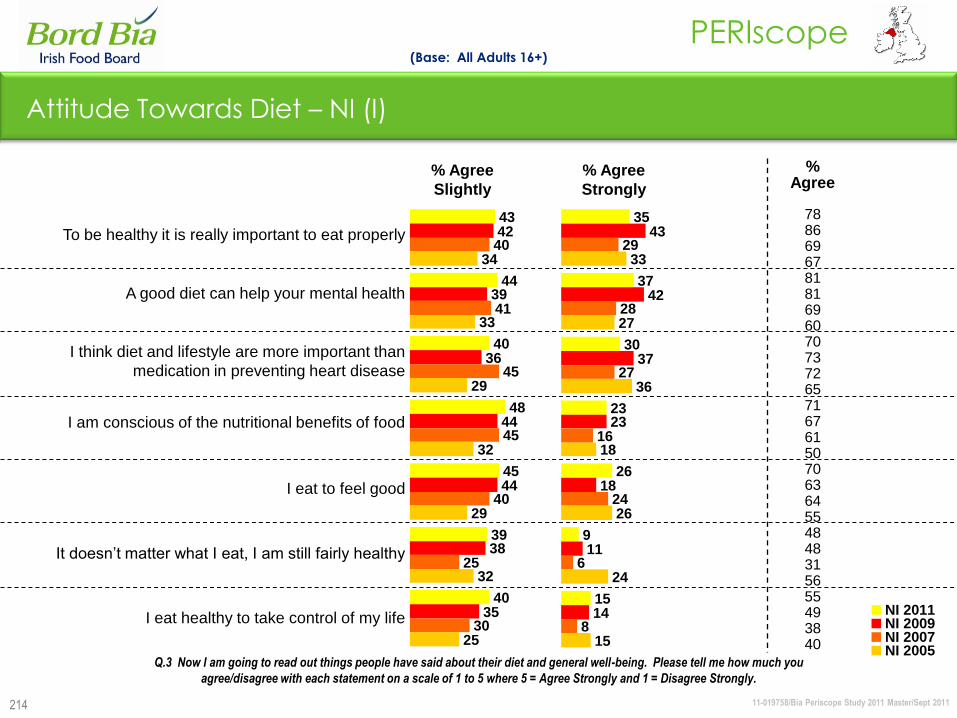
11-019758/Bia Periscope Study 2011 Master/Sept 2011
PERIscope
214
43
44
40
48
45
39
40
42
39
36
44
44
38
35
40
41
45
45
40
25
30
34
33
29
32
29
32
25
Attitude Towards Diet – NI (I)
(Base: All Adults 16+)
Q.3 Now I am going to read out things people have said about their diet and general well-being. Please tell me how much you
agree/disagree with each statement on a scale of 1 to 5 where 5 = Agree Strongly and 1 = Disagree Strongly.
To be healthy it is really important to eat properly
A good diet can help your mental health
I think diet and lifestyle are more important than
medication in preventing heart disease
I am conscious of the nutritional benefits of food
I eat to feel good
It doesn‟t matter what I eat, I am still fairly healthy
I eat healthy to take control of my life
% Agree
Slightly
% Agree
Strongly
35
37
30
23
26
9
15
43
42
37
23
18
11
14
29
28
27
16
24
6
8
33
27
36
18
26
24
15
NI 2011NI 2009NI 2007NI 2005
%Agree
78866967818169607073726571676150706364554848315655493840
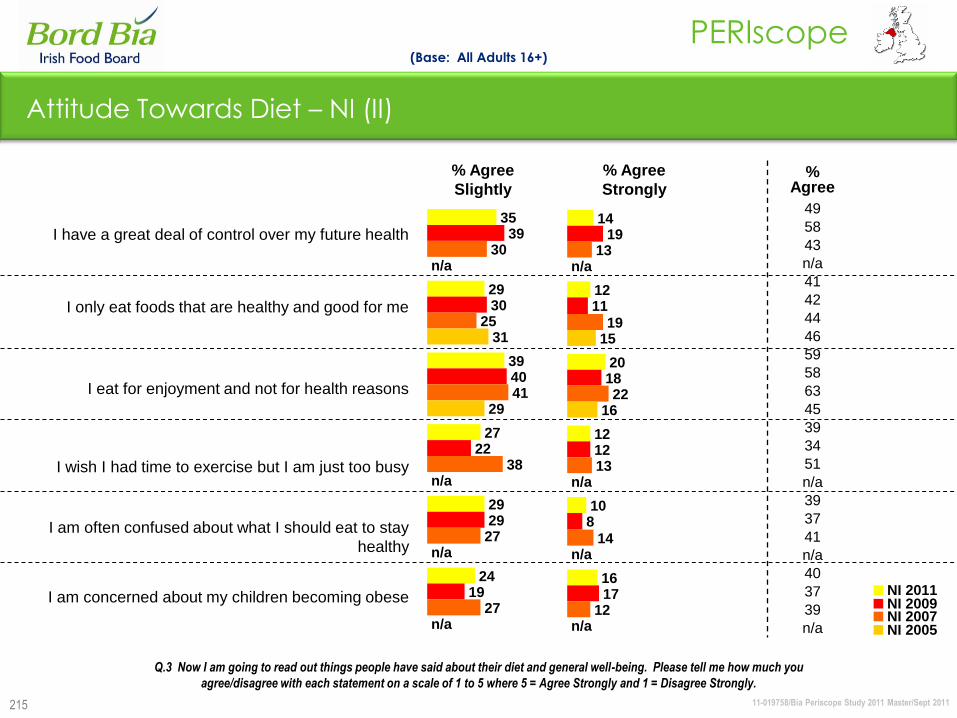
11-019758/Bia Periscope Study 2011 Master/Sept 2011
PERIscope
35
29
39
27
29
24
39
30
40
22
29
19
30
25
41
38
27
27
31
29
n/a
n/a
n/a
n/a
215
Attitude Towards Diet – NI (II)
(Base: All Adults 16+)
Q.3 Now I am going to read out things people have said about their diet and general well-being. Please tell me how much you
agree/disagree with each statement on a scale of 1 to 5 where 5 = Agree Strongly and 1 = Disagree Strongly.
I have a great deal of control over my future health
I only eat foods that are healthy and good for me
I eat for enjoyment and not for health reasons
I wish I had time to exercise but I am just too busy
I am often confused about what I should eat to stay
healthy
I am concerned about my children becoming obese
% Agree
Slightly
% Agree
Strongly
14
12
20
12
10
16
19
11
18
12
8
17
13
19
22
13
14
12
15
16
n/a
n/a
n/a
n/a
NI 2011NI 2009NI 2007NI 2005
%Agree
49
58
43
n/a
41
42
44
46
59
58
63
45
39
34
51
n/a
39
37
41
n/a
40
37
39
n/a
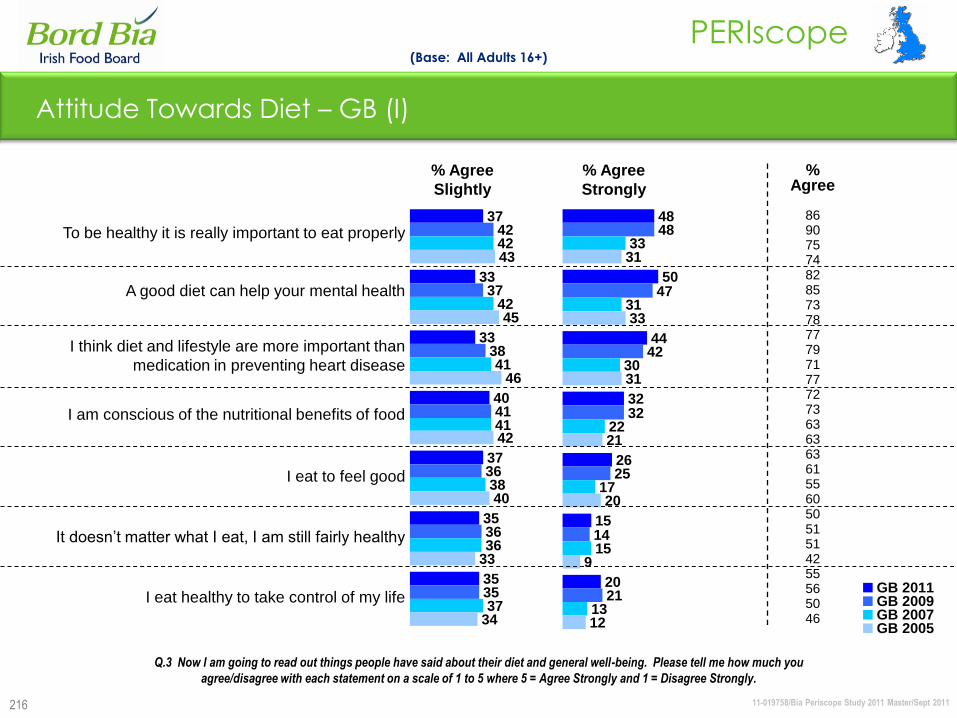
11-019758/Bia Periscope Study 2011 Master/Sept 2011
PERIscope
216
Attitude Towards Diet – GB (I)
(Base: All Adults 16+)
Q.3 Now I am going to read out things people have said about their diet and general well-being. Please tell me how much you
agree/disagree with each statement on a scale of 1 to 5 where 5 = Agree Strongly and 1 = Disagree Strongly.
37
33
33
40
37
35
35
42
37
38
41
36
36
35
42
42
41
41
38
36
37
43
45
46
42
40
33
34
To be healthy it is really important to eat properly
A good diet can help your mental health
I think diet and lifestyle are more important than
medication in preventing heart disease
I am conscious of the nutritional benefits of food
I eat to feel good
It doesn‟t matter what I eat, I am still fairly healthy
I eat healthy to take control of my life
% Agree
Slightly
% Agree
Strongly
48
50
44
32
26
15
20
48
47
42
32
25
14
21
33
31
30
22
17
15
13
31
33
31
21
20
9
12
GB 2011GB 2009GB 2007GB 2005
%Agree
86907574828573787779717772736363636155605051514255565046

11-019758/Bia Periscope Study 2011 Master/Sept 2011
PERIscope
217
Attitude Towards Diet – GB (II)
(Base: All Adults 16+)
Q.3 Now I am going to read out things people have said about their diet and general well-being. Please tell me how much you
agree/disagree with each statement on a scale of 1 to 5 where 5 = Agree Strongly and 1 = Disagree Strongly.
I have a great deal of control over my future health
I only eat foods that are healthy and good for me
I eat for enjoyment and not for health reasons
I wish I had time to exercise but I am just too busy
I am often confused about what I should eat to stay
healthy
I am concerned about my children becoming obese
% Agree
Slightly
% Agree
Strongly
24
14
25
13
6
17
22
17
24
14
9
17
16
11
19
12
7
13
9
15
n/a
n/a
n/a
n/a
GB 2011GB 2009GB 2007GB 2005
%
Agree
63
61
54
n/a
44
46
45
42
60
57
57
54
37
36
42
n/a
28
29
31
n/a
33
32
35
n/a
39
30
35
25
22
16
39
29
33
22
20
15
38
34
38
30
24
22
33
39
n/a
n/a
n/a
n/a
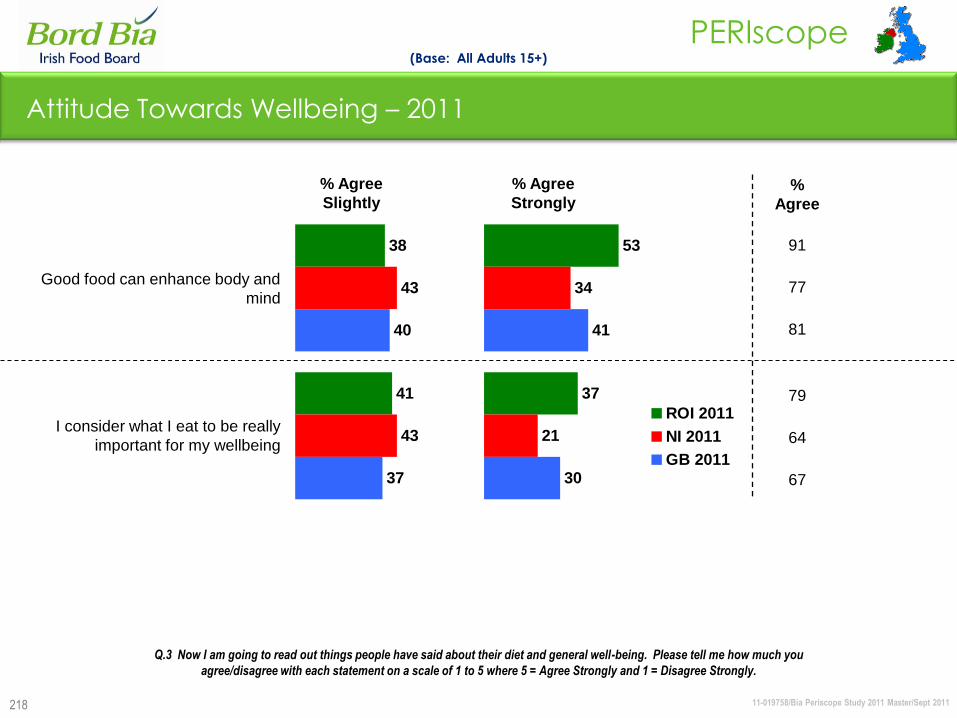
11-019758/Bia Periscope Study 2011 Master/Sept 2011
PERIscope
218
Attitude Towards Wellbeing – 2011
Good food can enhance body and
mind
I consider what I eat to be really
important for my wellbeing
(Base: All Adults 15+)
% Agree
Slightly
% Agree
Strongly
38
41
43
43
40
37
Q.3 Now I am going to read out things people have said about their diet and general well-being. Please tell me how much you
agree/disagree with each statement on a scale of 1 to 5 where 5 = Agree Strongly and 1 = Disagree Strongly.
53
37
34
21
41
30
ROI 2011
NI 2011
GB 2011
%
Agree
91
77
81
79
64
67
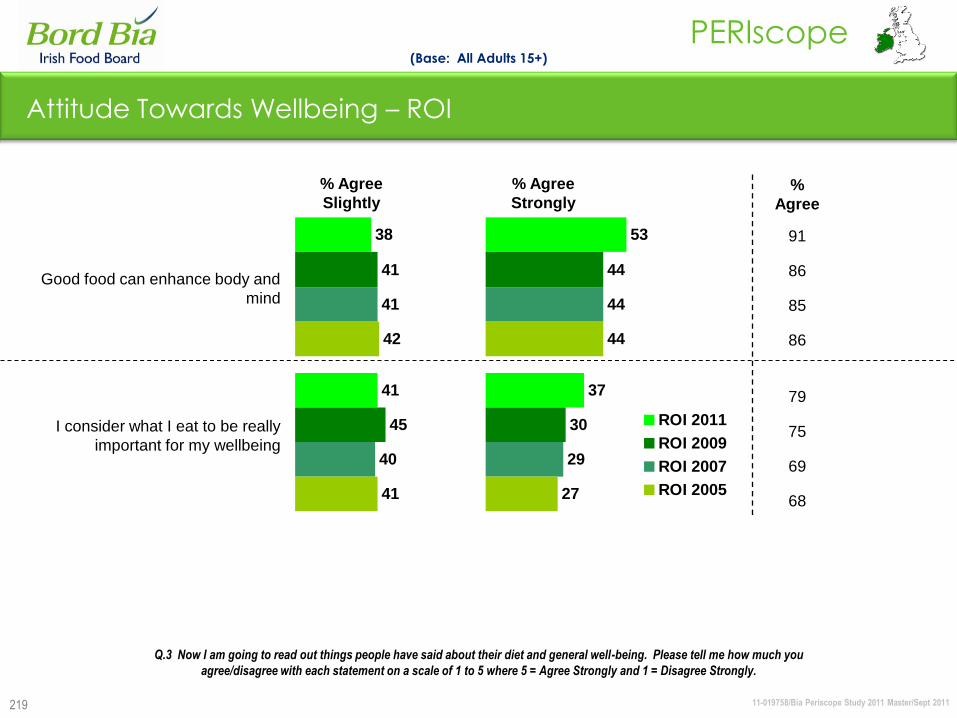
11-019758/Bia Periscope Study 2011 Master/Sept 2011
PERIscope
219
Attitude Towards Wellbeing – ROI
(Base: All Adults 15+)
Q.3 Now I am going to read out things people have said about their diet and general well-being. Please tell me how much you
agree/disagree with each statement on a scale of 1 to 5 where 5 = Agree Strongly and 1 = Disagree Strongly.
Good food can enhance body and
mind
I consider what I eat to be really
important for my wellbeing
38
41
41
45
41
40
42
41
% Agree
Slightly
% Agree
Strongly%
Agree
91
86
85
86
79
75
69
68
53
37
44
30
44
29
44
27
ROI 2011
ROI 2009
ROI 2007
ROI 2005
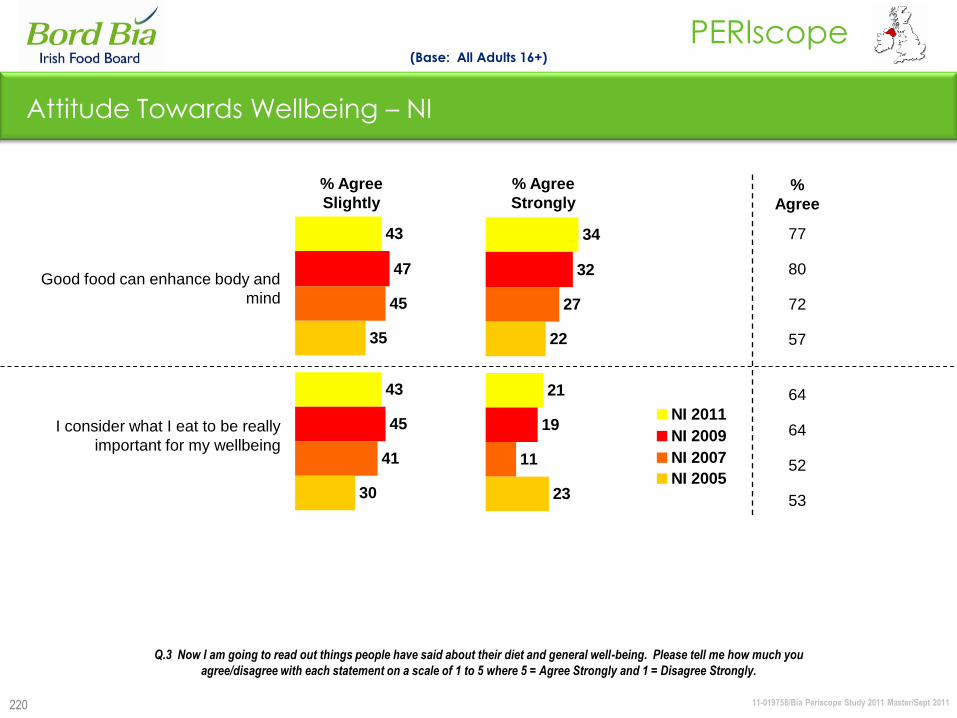
11-019758/Bia Periscope Study 2011 Master/Sept 2011
PERIscope
220
Attitude Towards Wellbeing – NI
(Base: All Adults 16+)
Q.3 Now I am going to read out things people have said about their diet and general well-being. Please tell me how much you
agree/disagree with each statement on a scale of 1 to 5 where 5 = Agree Strongly and 1 = Disagree Strongly.
% Agree
Slightly
% Agree
Strongly%
Agree
77
80
72
57
64
64
52
53
Good food can enhance body and
mind
I consider what I eat to be really
important for my wellbeing
43
43
47
45
45
41
35
30
34
21
32
19
27
11
22
23
NI 2011
NI 2009
NI 2007
NI 2005

11-019758/Bia Periscope Study 2011 Master/Sept 2011
PERIscope
221
Attitude Towards Wellbeing – GB
(Base: All Adults 16+)
Q.3 Now I am going to read out things people have said about their diet and general well-being. Please tell me how much you
agree/disagree with each statement on a scale of 1 to 5 where 5 = Agree Strongly and 1 = Disagree Strongly.
% Agree
Slightly
% Agree
Strongly%
Agree
81
82
69
75
67
69
57
57
Good food can enhance body and
mind
I consider what I eat to be really
important for my wellbeing
40
37
41
39
41
38
46
40
41
30
42
30
28
19
29
17
GB 2011
GB 2009
GB 2007
GB 2005

11-019758/Bia Periscope Study 2011 Master/Sept 2011
PERIscope
222
Attitudes Towards Healthy Options – 2011
Healthier foods are always more expensive than
other foods
I am willing to pay more for healthy food and
beverages as long as they taste good
If the label says “Low Fat” or “Reduced Fat”,
then the product will always be a healthy choice
I would like manufacturers to help me eat
healthy
I find there are never enough healthy food
options when shopping
Choosing healthy food to eat is very limiting and
boring too
% Applies
A Lot
% Applies
A Little
(Base: All Adults 15+)
39
45
45
40
29
34
46
47
51
44
35
37
39
42
43
36
31
31
ROI 2011
NI 2011GB 2011
Q.78 I am going to read out a number of statements people have said about health and nutrition. I would like you to
tell me whether each statement applies to you personally a lot, a little or not at all.
%
Applies
72
76
75
67
68
68
66
70
64
66
66
58
40
46
43
44
53
46
33
22
20
25
10
11
30
21
19
22
11
16
36
26
21
22
12
15

11-019758/Bia Periscope Study 2011 Master/Sept 2011
PERIscope
223
Attitudes Towards Healthy Options – ROI
% Applies
A Lot
% Applies
A Little
(Base: All Adults 15+)
33
22
20
25
10
11
33
22
18
22
10
13
34
33
27
32
20
15
36
28
25
32
17
16
40
25
28
15
16
n/a
39
45
45
40
29
34
40
43
47
38
31
34
39
40
44
37
33
37
39
43
50
37
31
34
36
45
41
31
33
n/a
ROI 2011ROI 2009ROI 2007ROI 2005ROI 2003
Q.78 I am going to read out a number of statements people have said about health and nutrition. I would like you to
tell me whether each statement applies to you personally a lot, a little or not at all.
Healthier foods are always more expensive than
other foods
I am willing to pay more for healthy food and
beverages as long as they taste good
If the label says “Low Fat” or “Reduced Fat”,
then the product will always be a healthy choice
I would like manufacturers to help me eat
healthy
I find there are never enough healthy food
options when shopping
Choosing healthy food to eat is very limiting and
boring too
%Applies
72
7373757667667371n/a6666717570666169696940415348464447525049
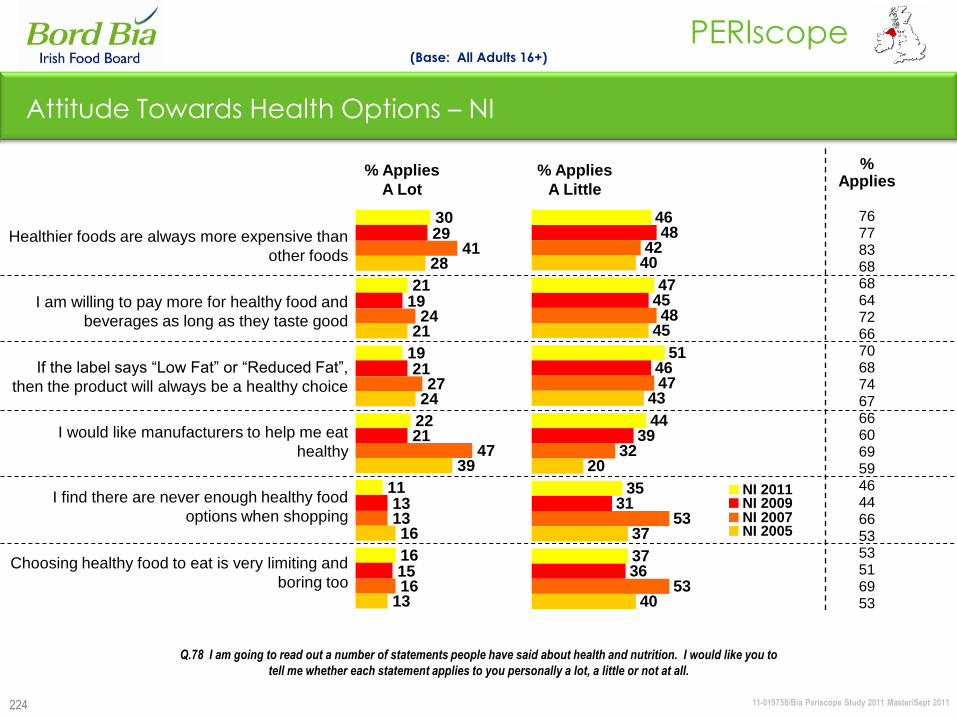
11-019758/Bia Periscope Study 2011 Master/Sept 2011
PERIscope
224
Attitude Towards Health Options – NI
(Base: All Adults 16+)
Q.78 I am going to read out a number of statements people have said about health and nutrition. I would like you to
tell me whether each statement applies to you personally a lot, a little or not at all.
30
21
19
22
11
16
29
19
21
21
13
15
41
24
27
47
13
16
28
21
24
39
16
13
46
47
51
44
35
37
48
45
46
39
31
36
42
48
47
32
53
53
40
45
43
20
37
40
NI 2011NI 2009NI 2007NI 2005
Healthier foods are always more expensive than
other foods
I am willing to pay more for healthy food and
beverages as long as they taste good
If the label says “Low Fat” or “Reduced Fat”,
then the product will always be a healthy choice
I would like manufacturers to help me eat
healthy
I find there are never enough healthy food
options when shopping
Choosing healthy food to eat is very limiting and
boring too
% Applies
A Lot
% Applies
A Little
%Applies
767783686864726670687467666069594644665353516953
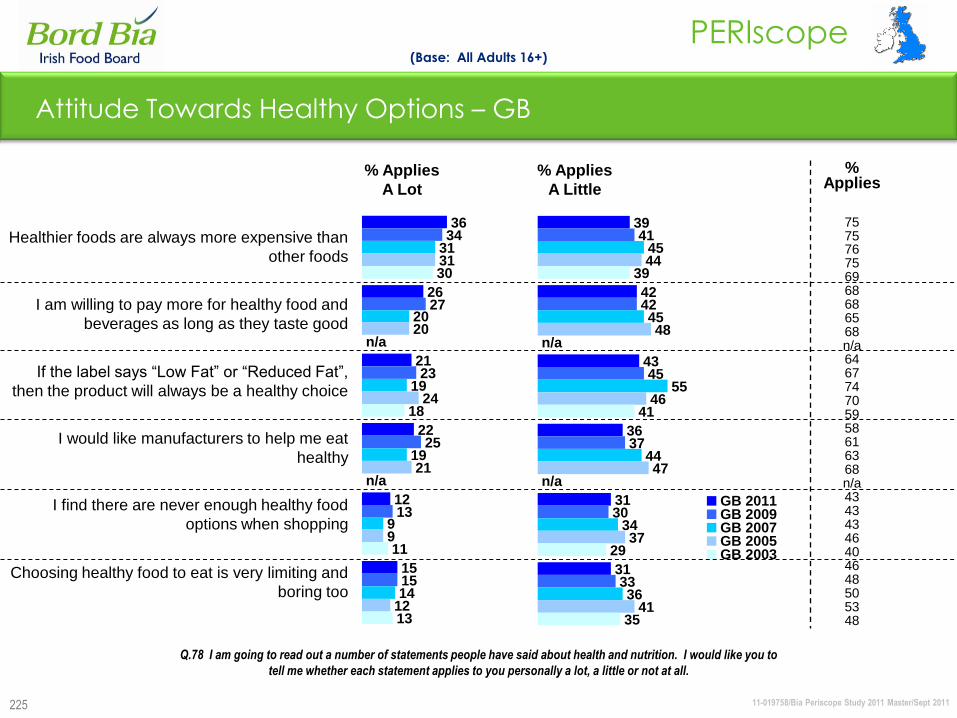
11-019758/Bia Periscope Study 2011 Master/Sept 2011
PERIscope
225
Attitude Towards Healthy Options – GB
(Base: All Adults 16+)
Q.78 I am going to read out a number of statements people have said about health and nutrition. I would like you to
tell me whether each statement applies to you personally a lot, a little or not at all.
36
26
21
22
12
15
34
27
23
25
13
15
31
20
19
19
9
14
31
20
24
21
9
12
30
18
11
13
n/a
n/a
39
42
43
36
31
31
41
42
45
37
30
33
45
45
55
44
34
36
44
48
46
47
37
41
39
41
29
35
n/a
n/a
GB 2011GB 2009GB 2007GB 2005GB 2003
Healthier foods are always more expensive than
other foods
I am willing to pay more for healthy food and
beverages as long as they taste good
If the label says “Low Fat” or “Reduced Fat”,
then the product will always be a healthy choice
I would like manufacturers to help me eat
healthy
I find there are never enough healthy food
options when shopping
Choosing healthy food to eat is very limiting and
boring too
% Applies
A Lot
% Applies
A Little
%Applies
757576756968686568n/a646774705958616368n/a43434346404648505348
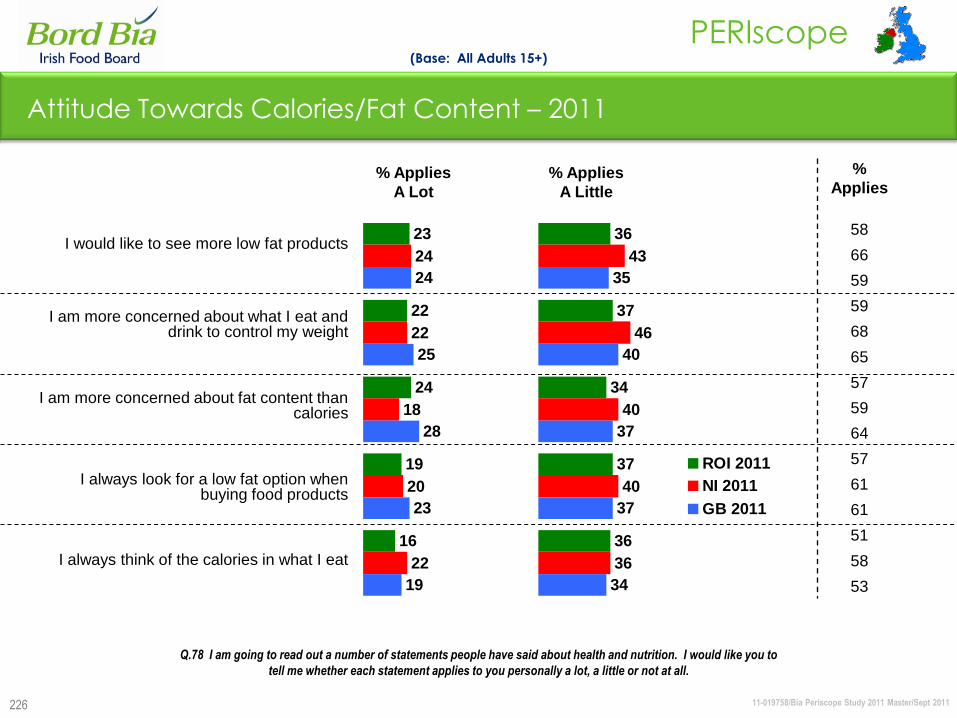
11-019758/Bia Periscope Study 2011 Master/Sept 2011
PERIscope
226
% Applies
A Lot
% Applies
A Little
Attitude Towards Calories/Fat Content – 2011
I would like to see more low fat products
I am more concerned about what I eat and drink to control my weight
I am more concerned about fat content than calories
I always look for a low fat option when buying food products
I always think of the calories in what I eat
(Base: All Adults 15+)
Q.78 I am going to read out a number of statements people have said about health and nutrition. I would like you to
tell me whether each statement applies to you personally a lot, a little or not at all.
36
37
34
37
36
43
46
40
40
36
35
40
37
37
34
ROI 2011
NI 2011
GB 2011
23
22
24
19
16
24
22
18
20
22
24
25
28
23
19
%
Applies
58
66
59
59
68
65
57
59
64
57
61
61
51
58
53
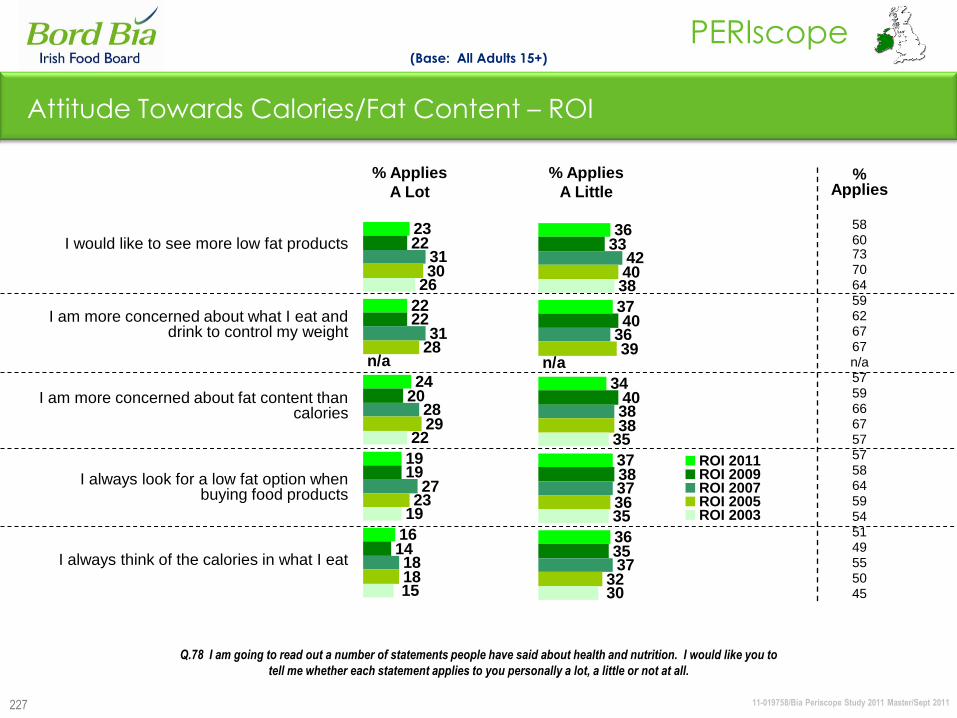
11-019758/Bia Periscope Study 2011 Master/Sept 2011
PERIscope
227
% Applies
A Lot
23
22
24
19
16
22
22
20
19
14
31
31
28
27
18
30
28
29
23
18
26
22
19
n/a
15
36
37
34
37
36
33
40
40
38
35
42
36
38
37
37
40
39
38
36
32
38
35
35
n/a
30
ROI 2011ROI 2009ROI 2007ROI 2005ROI 2003
Attitude Towards Calories/Fat Content – ROI
(Base: All Adults 15+)
Q.78 I am going to read out a number of statements people have said about health and nutrition. I would like you to
tell me whether each statement applies to you personally a lot, a little or not at all.
%Applies
586073706459626767n/a575966675757586459545149555045
I would like to see more low fat products
I am more concerned about what I eat and drink to control my weight
I am more concerned about fat content than calories
I always look for a low fat option when buying food products
I always think of the calories in what I eat
% Applies
A Little
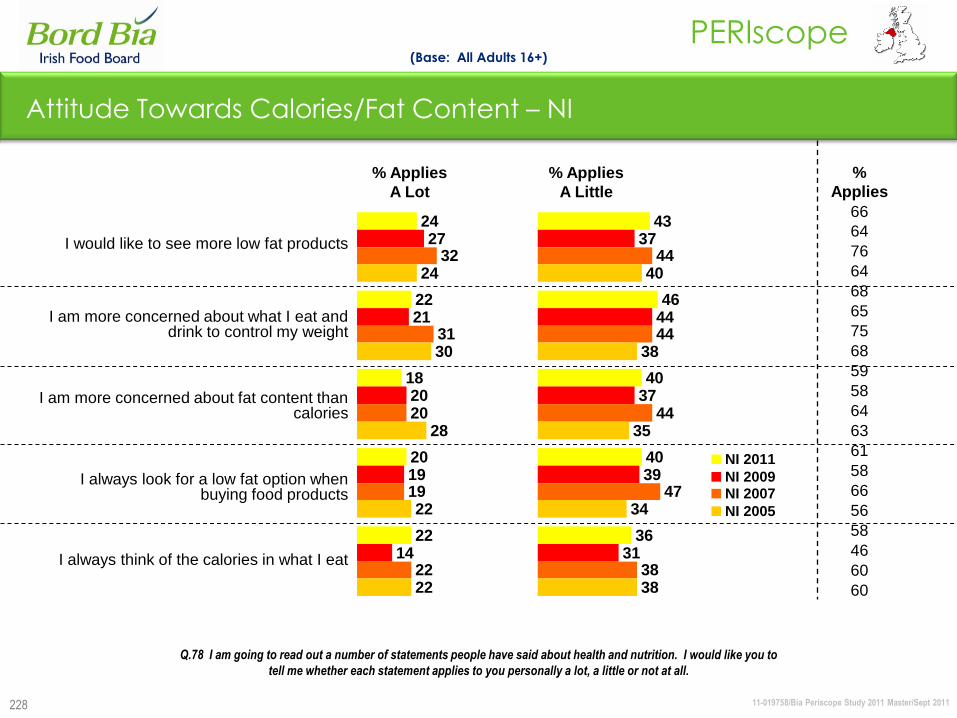
11-019758/Bia Periscope Study 2011 Master/Sept 2011
PERIscope
228
Attitude Towards Calories/Fat Content – NI
(Base: All Adults 16+)
Q.78 I am going to read out a number of statements people have said about health and nutrition. I would like you to
tell me whether each statement applies to you personally a lot, a little or not at all.
24
22
18
20
22
27
21
20
19
14
32
31
20
19
22
24
30
28
22
22
43
46
40
40
36
37
44
37
39
31
44
44
44
47
38
40
38
35
34
38
NI 2011
NI 2009NI 2007
NI 2005
% Applies
A Lot
% Applies
A Little
I would like to see more low fat products
I am more concerned about what I eat and drink to control my weight
I am more concerned about fat content than calories
I always look for a low fat option when buying food products
I always think of the calories in what I eat
%
Applies
66
64
76
64
68
65
75
68
59
58
64
63
61
58
66
56
58
46
60
60
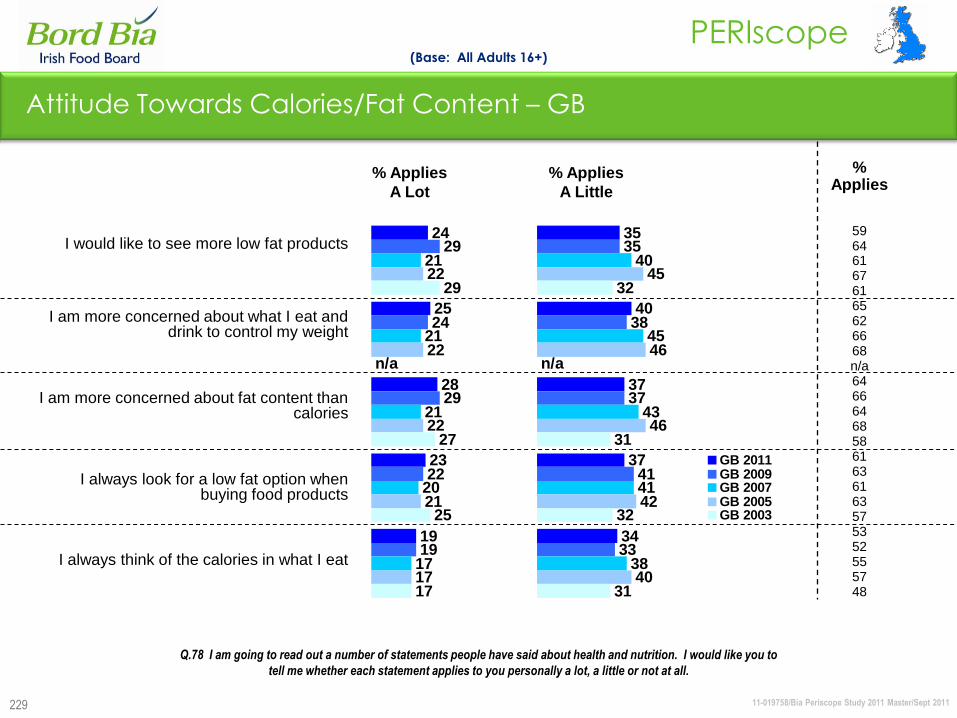
11-019758/Bia Periscope Study 2011 Master/Sept 2011
PERIscope
229
Attitude Towards Calories/Fat Content – GB
(Base: All Adults 16+)
Q.78 I am going to read out a number of statements people have said about health and nutrition. I would like you to
tell me whether each statement applies to you personally a lot, a little or not at all.
35
40
37
37
34
35
38
37
41
33
40
45
43
41
38
45
46
46
42
40
31
32
31
n/a
32
GB 2011GB 2009GB 2007GB 2005GB 2003
% Applies
A Lot
% Applies
A Little
I would like to see more low fat products
I am more concerned about what I eat and drink to control my weight
I am more concerned about fat content than calories
I always look for a low fat option when buying food products
I always think of the calories in what I eat
%Applies
596461676165626668n/a646664685861636163575352555748
24
25
28
23
19
29
24
29
22
19
21
21
21
20
17
22
22
22
21
17
29
27
25
17
n/a
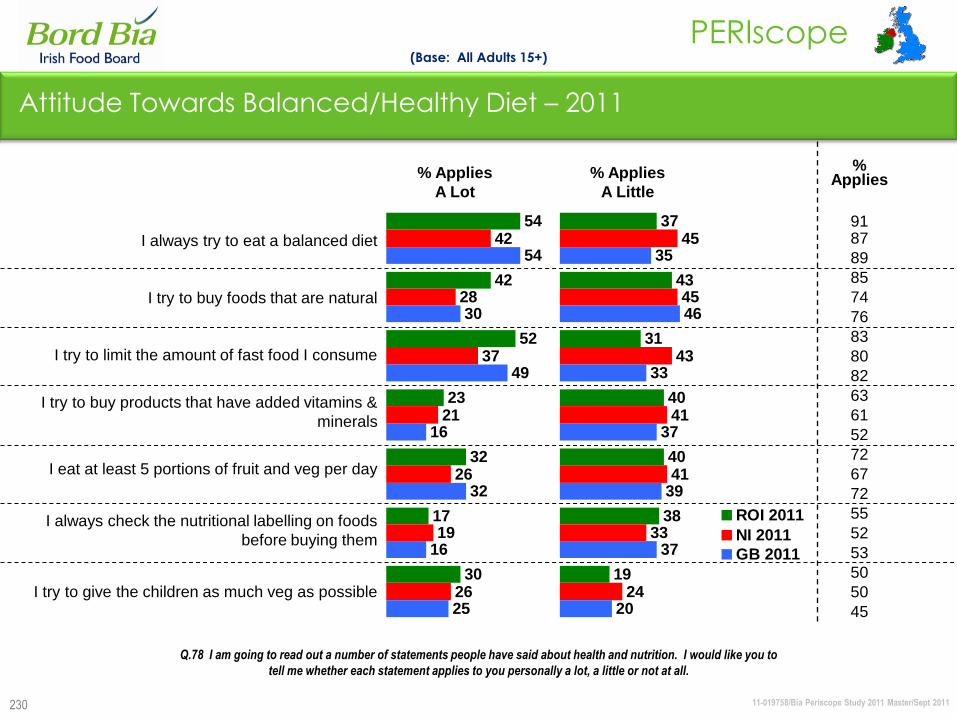
11-019758/Bia Periscope Study 2011 Master/Sept 2011
PERIscope
230
Attitude Towards Balanced/Healthy Diet – 2011
(Base: All Adults 15+)
% Applies
A Lot
% Applies
A Little
54
42
52
23
32
17
30
42
28
37
21
26
19
26
54
30
49
16
32
16
25
37
43
31
40
40
38
19
45
45
43
41
41
33
24
35
46
33
37
39
37
20
ROI 2011
NI 2011
GB 2011
Q.78 I am going to read out a number of statements people have said about health and nutrition. I would like you to
tell me whether each statement applies to you personally a lot, a little or not at all.
%Applies
9187
89
85
74
76
83
80
82
63
61
52
72
67
72
55
52
53
50
50
45
I always try to eat a balanced diet
I try to buy foods that are natural
I try to limit the amount of fast food I consume
I try to buy products that have added vitamins &
minerals
I eat at least 5 portions of fruit and veg per day
I always check the nutritional labelling on foods
before buying them
I try to give the children as much veg as possible
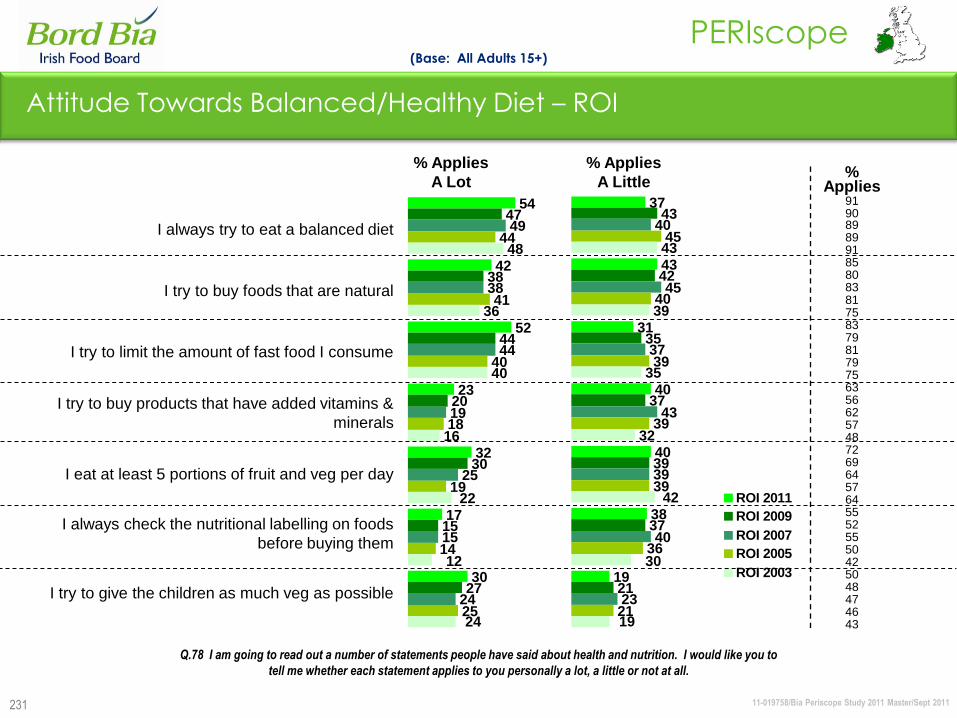
11-019758/Bia Periscope Study 2011 Master/Sept 2011
PERIscope
231
Attitude Towards Balanced/Healthy Diet – ROI
I always try to eat a balanced diet
I try to buy foods that are natural
I try to limit the amount of fast food I consume
I try to buy products that have added vitamins &
minerals
I eat at least 5 portions of fruit and veg per day
I always check the nutritional labelling on foods
before buying them
I try to give the children as much veg as possible
(Base: All Adults 15+)
% Applies
A Lot
% Applies
A Little
54
42
52
23
32
17
30
47
38
44
20
30
15
27
49
38
44
19
25
15
24
44
41
40
18
19
14
25
48
36
40
16
12
24
22
37
43
31
40
40
38
19
43
42
35
37
39
37
21
40
45
37
43
39
40
23
45
40
39
39
39
36
21
43
39
35
32
42
19
30
ROI 2011
ROI 2009
ROI 2007
ROI 2005
ROI 2003
Q.78 I am going to read out a number of statements people have said about health and nutrition. I would like you to
tell me whether each statement applies to you personally a lot, a little or not at all.
%Applies
9190898991858083817583798179756356625748726964576455525550425048474643

11-019758/Bia Periscope Study 2011 Master/Sept 2011
PERIscope
232
Attitude Towards Balanced/Healthy Diet – NI
(Base: All Adults 16+)
42
28
37
21
26
19
26
43
26
37
19
24
13
27
48
38
43
13
35
11
27
34
20
31
14
28
14
17
45
45
43
41
41
33
24
44
49
40
38
41
34
18
43
38
40
42
41
43
20
53
44
38
35
44
36
30
NI 2011NI 2009NI 2007NI 2005
Q.78 I am going to read out a number of statements people have said about health and nutrition. I would like you to
tell me whether each statement applies to you personally a lot, a little or not at all.
%Applies
87879187747576648078836961575549676576725247545050454747
I always try to eat a balanced diet
I try to buy foods that are natural
I try to limit the amount of fast food I consume
I try to buy products that have added vitamins &
minerals
I eat at least 5 portions of fruit and veg per day
I always check the nutritional labelling on foods
before buying them
I try to give the children as much veg as possible
% Applies
A Lot
% Applies
A Little
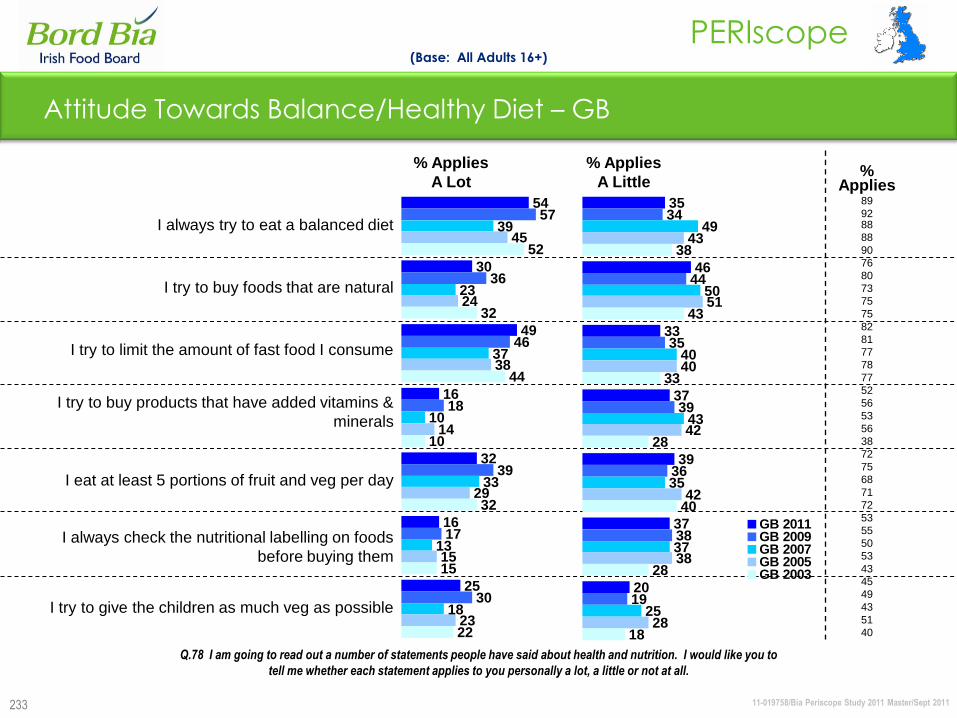
11-019758/Bia Periscope Study 2011 Master/Sept 2011
PERIscope
233
Attitude Towards Balance/Healthy Diet – GB
(Base: All Adults 16+)
54
30
49
16
32
16
25
57
36
46
18
39
17
30
39
23
37
10
33
13
18
45
24
38
14
29
15
23
52
32
44
10
32
15
22
Q.78 I am going to read out a number of statements people have said about health and nutrition. I would like you to
tell me whether each statement applies to you personally a lot, a little or not at all.
I always try to eat a balanced diet
I try to buy foods that are natural
I try to limit the amount of fast food I consume
I try to buy products that have added vitamins &
minerals
I eat at least 5 portions of fruit and veg per day
I always check the nutritional labelling on foods
before buying them
I try to give the children as much veg as possible
% Applies
A Lot
% Applies
A Little%
Applies 89
9288
88
90
76
80
73
75
75
82
81
77
78
77
52
56
53
56
38
72
75
68
71
72
53
55
50
53
43
45
49
43
51
40
35
46
33
37
39
37
20
34
44
35
39
36
38
19
49
50
40
43
35
37
25
43
51
40
42
42
38
28
38
43
33
28
40
28
18
GB 2011GB 2009GB 2007GB 2005GB 2003

11-019758/Bia Periscope Study 2011 Master/Sept 2011
PERIscope
234
Attitude Towards Nutrition and Wellness – 2011
(Base: All Adults 15+)
33
31
18
16
3
26
23
14
15
8
31
23
17
18
6
Q.78 I am going to read out a number of statements people have said about health and nutrition. I would like you to
tell me whether each statement applies to you personally a lot, a little or not at all.
% Applies
A Lot
% Applies
A Little
I eat to feel good and take control of my life
I eat to enrich/enhance mental alertness and spiritual
well being
There are not enough product options for people
who suffer food intolerances
I very rarely nibble between meals
My diet is mainly vegetarian
%Applies
82
78
75
76
70
63
46
43
43
57
50
57
14
23
20
49
45
28
40
11
52
48
30
35
14
44
39
26
39
14
ROI 2011
NI 2011
GB 2011
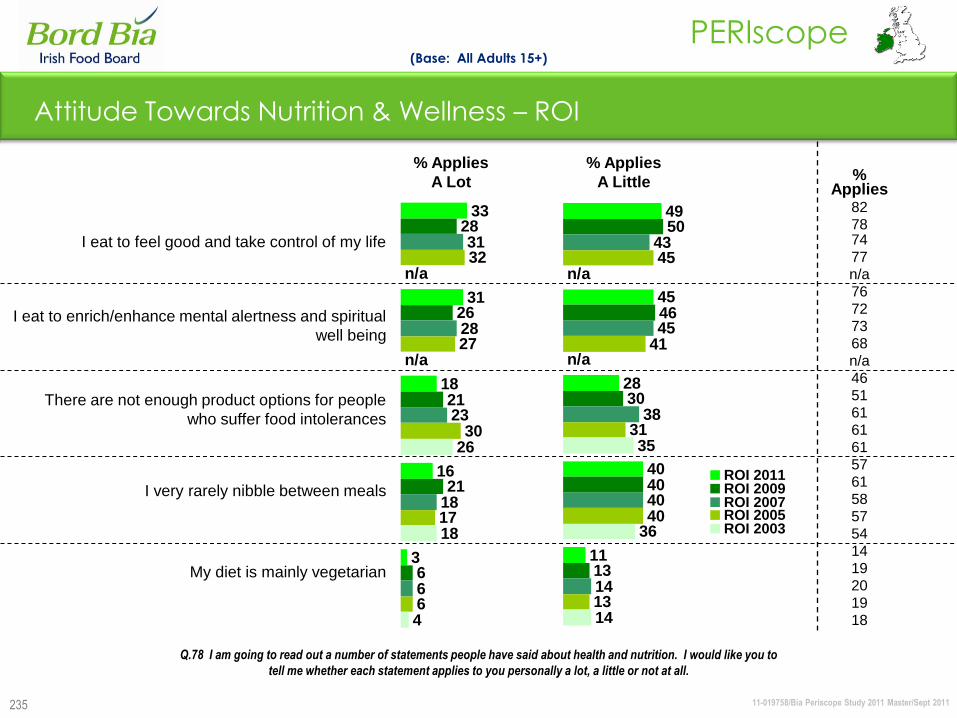
11-019758/Bia Periscope Study 2011 Master/Sept 2011
PERIscope
235
Attitude Towards Nutrition & Wellness – ROI
I eat to feel good and take control of my life
I eat to enrich/enhance mental alertness and spiritual
well being
There are not enough product options for people
who suffer food intolerances
I very rarely nibble between meals
My diet is mainly vegetarian
(Base: All Adults 15+)
33
31
18
16
3
28
26
21
21
6
31
28
23
18
6
32
27
30
17
6
26
18
4
n/a
n/a
49
45
28
40
11
50
46
30
40
13
43
45
38
40
14
45
41
31
40
13
35
36
14
n/a
n/a
ROI 2011ROI 2009ROI 2007ROI 2005ROI 2003
Q.78 I am going to read out a number of statements people have said about health and nutrition. I would like you to
tell me whether each statement applies to you personally a lot, a little or not at all.
% Applies
A Lot
% Applies
A Little %Applies
82
7874
77
n/a
76
72
73
68
n/a
46
51
61
61
61
57
61
58
57
54
14
19
20
19
18
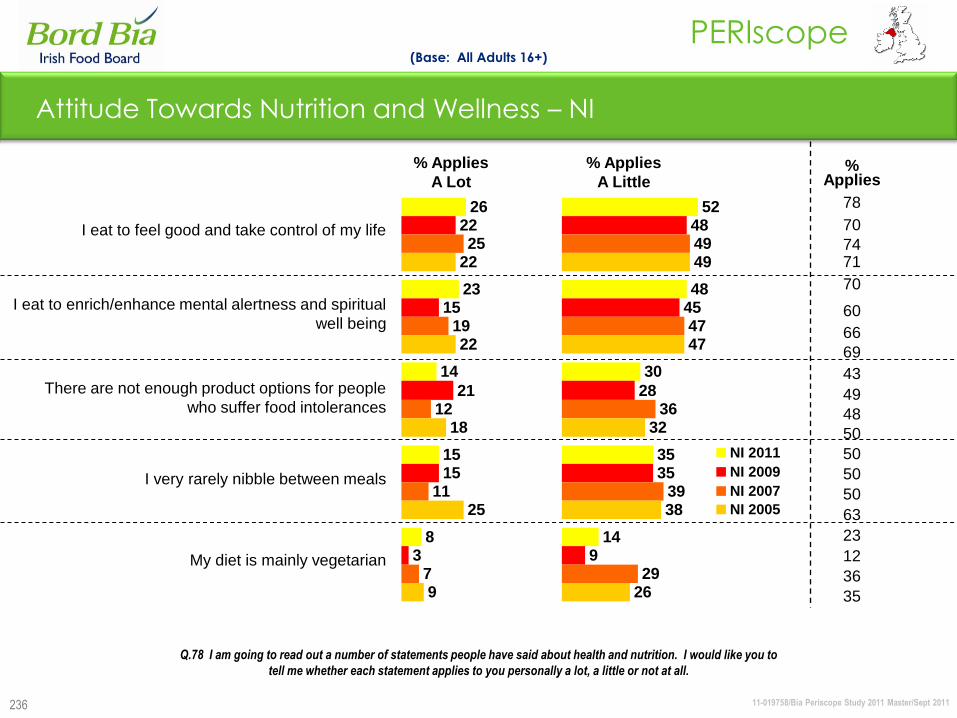
11-019758/Bia Periscope Study 2011 Master/Sept 2011
PERIscope
236
Attitude Towards Nutrition and Wellness – NI
(Base: All Adults 16+)
26
23
14
15
8
22
15
21
15
3
25
19
12
11
7
22
22
18
25
9
52
48
30
35
14
48
45
28
35
9
49
47
36
39
29
49
47
32
38
26
NI 2011
NI 2009
NI 2007
NI 2005
Q.78 I am going to read out a number of statements people have said about health and nutrition. I would like you to
tell me whether each statement applies to you personally a lot, a little or not at all.
% Applies
A Lot
% Applies
A Little
I eat to feel good and take control of my life
I eat to enrich/enhance mental alertness and spiritual
well being
There are not enough product options for people
who suffer food intolerances
I very rarely nibble between meals
My diet is mainly vegetarian
%Applies
78
70
7471
70
60
66
69
43
49
48
50
50
50
50
63
23
12
36
35
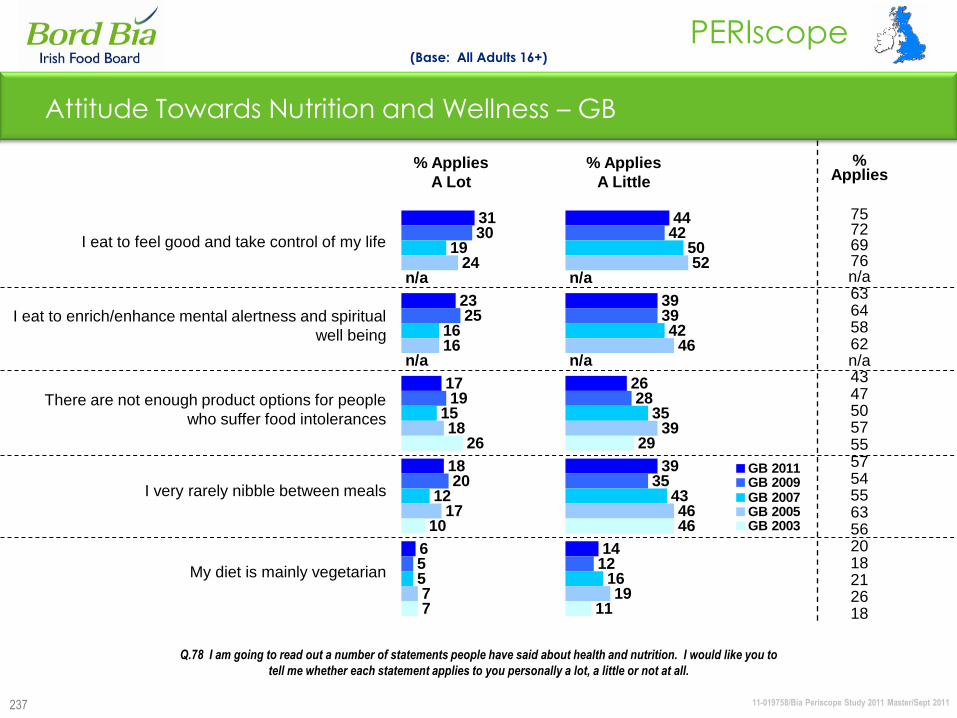
11-019758/Bia Periscope Study 2011 Master/Sept 2011
PERIscope
237
Attitude Towards Nutrition and Wellness – GB
(Base: All Adults 16+)
31
23
17
18
6
30
25
19
20
5
19
16
15
12
5
24
16
18
17
7
26
10
7
n/a
n/a
44
39
26
39
14
42
39
28
35
12
50
42
35
43
16
52
46
39
46
19
29
46
11
n/a
n/a
GB 2011GB 2009GB 2007GB 2005GB 2003
Q.78 I am going to read out a number of statements people have said about health and nutrition. I would like you to
tell me whether each statement applies to you personally a lot, a little or not at all.
I eat to feel good and take control of my life
I eat to enrich/enhance mental alertness and spiritual
well being
There are not enough product options for people
who suffer food intolerances
I very rarely nibble between meals
My diet is mainly vegetarian
% Applies
A Lot
% Applies
A Little
%Applies
75726976n/a63645862n/a434750575557545563562018212618

11-019758/Bia Periscope Study 2011 Master/Sept 2011
PERIscope
238
Attitude Towards Health Products/Labelling – 2011
(Base: All Adults 16+)
47
38
32
51
51
41
39
54
42
36
34
50
ROI 2011
NI 2011
GB 2011
Q.78 I am going to read out a number of statements people have said about health and nutrition. I would like you to
tell me whether each statement applies to you personally a lot, a little or not at all.
% Applies
A Lot
% Applies
A Little
I am confident that the food in the supermarket
is safe
I often find it difficult to understand the
nutritional claims on packaging
I often find it difficult to understand the labelling
on food
I believe that products with claimed health
benefits work
%Applies
94
91
94
60
64
53
56
65
52
65
67
65
46
22
24
13
41
22
26
13
52
17
18
15
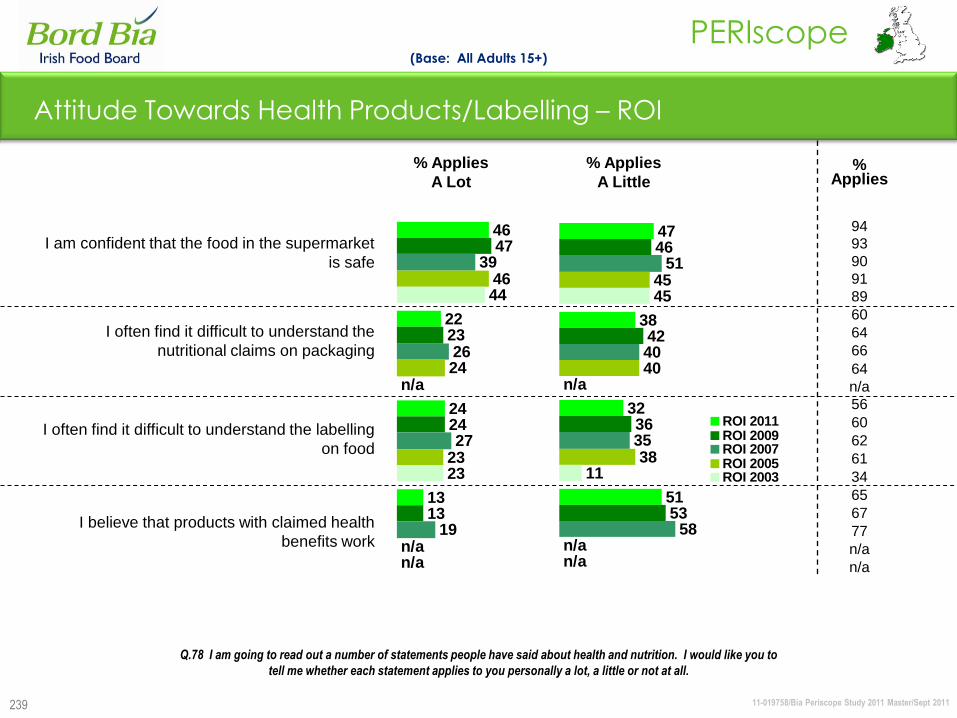
11-019758/Bia Periscope Study 2011 Master/Sept 2011
PERIscope
239
Attitude Towards Health Products/Labelling – ROI
I am confident that the food in the supermarket
is safe
I often find it difficult to understand the
nutritional claims on packaging
I often find it difficult to understand the labelling
on food
I believe that products with claimed health
benefits work
(Base: All Adults 15+)
46
22
24
13
47
23
24
13
39
26
27
19
46
23
44
n/a
24
n/a
23
n/a
47
38
32
51
46
42
36
53
51
40
35
58
45
40
38
45
n/an/a
11
n/a
ROI 2011ROI 2009ROI 2007ROI 2005ROI 2003
Q.78 I am going to read out a number of statements people have said about health and nutrition. I would like you to
tell me whether each statement applies to you personally a lot, a little or not at all.
% Applies
A Lot
% Applies
A Little%
Applies
94
93
90
91
89
60
64
66
64
n/a
56
60
62
61
34
65
67
77
n/a
n/a
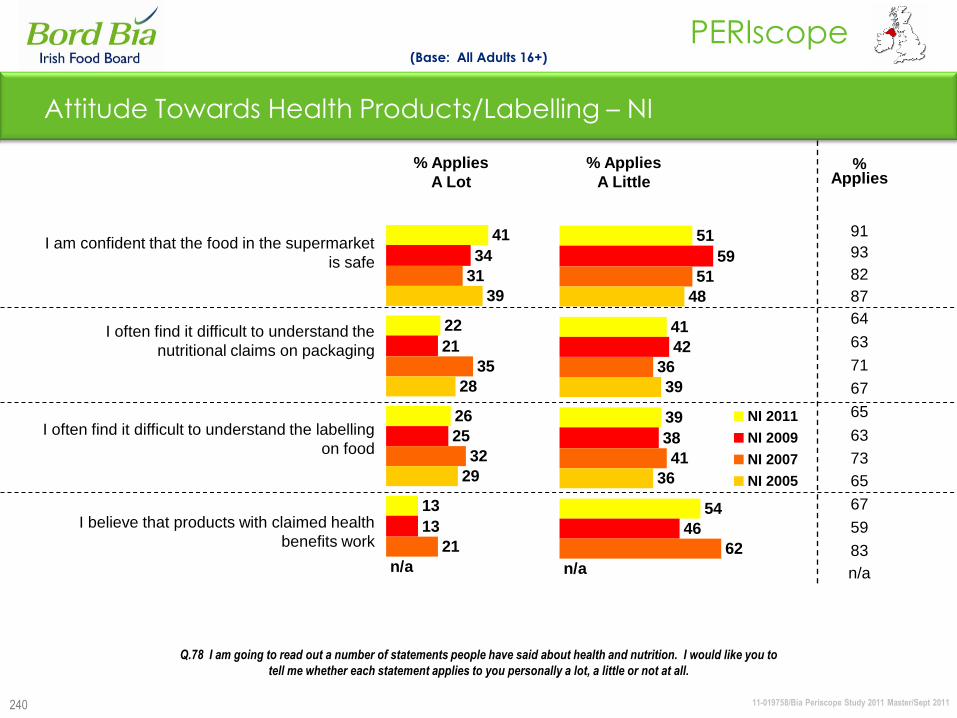
11-019758/Bia Periscope Study 2011 Master/Sept 2011
PERIscope
240
Attitude Towards Health Products/Labelling – NI
(Base: All Adults 16+)
41
22
26
13
34
21
25
13
31
35
32
21
28
29
n/a
39
51
41
39
54
59
42
38
46
51
36
41
62
39
36
48
n/a
NI 2011
NI 2009
NI 2007
NI 2005
Q.78 I am going to read out a number of statements people have said about health and nutrition. I would like you to
tell me whether each statement applies to you personally a lot, a little or not at all.
% Applies
A Lot
% Applies
A Little
I am confident that the food in the supermarket
is safe
I often find it difficult to understand the
nutritional claims on packaging
I often find it difficult to understand the labelling
on food
I believe that products with claimed health
benefits work
%Applies
91
93
82
87
64
63
71
67
65
63
73
65
67
59
83
n/a
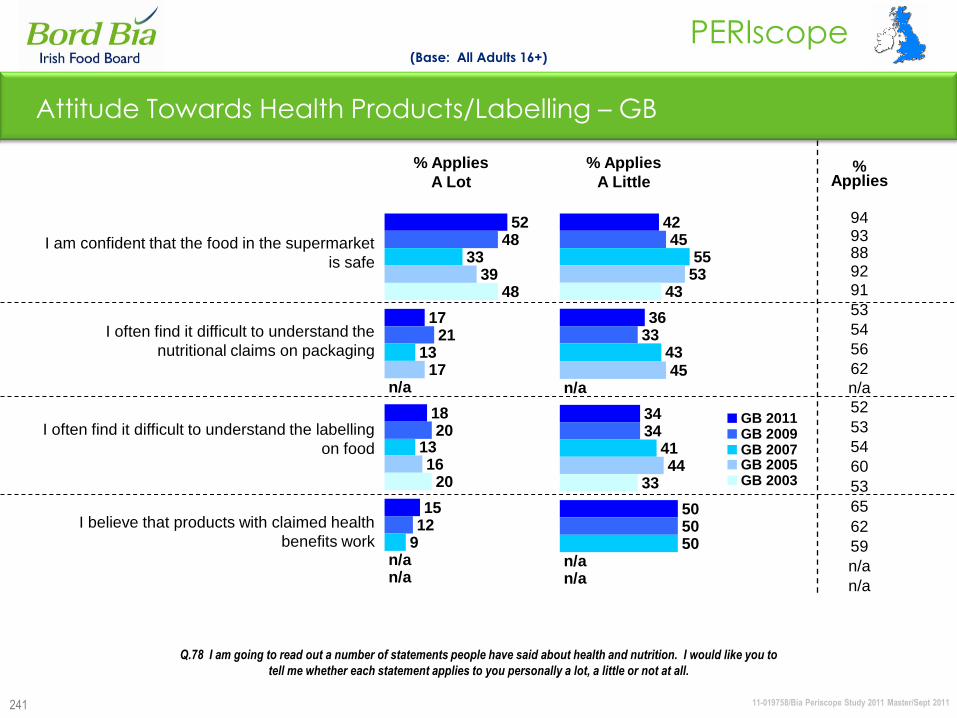
11-019758/Bia Periscope Study 2011 Master/Sept 2011
PERIscope
241
Attitude Towards Health Products/Labelling – GB
(Base: All Adults 16+)
52
17
18
15
48
21
20
12
33
13
13
9
39
17
16
48
20
n/an/a
n/a
42
36
34
50
45
33
34
50
55
43
41
50
53
44
43
n/a
45
n/a
33
n/a
GB 2011GB 2009GB 2007GB 2005GB 2003
Q.78 I am going to read out a number of statements people have said about health and nutrition. I would like you to
tell me whether each statement applies to you personally a lot, a little or not at all.
% Applies
A Lot
% Applies
A Little
I am confident that the food in the supermarket
is safe
I often find it difficult to understand the
nutritional claims on packaging
I often find it difficult to understand the labelling
on food
I believe that products with claimed health
benefits work
%Applies
9493889291
53
54
56
62
n/a
52
53
54
60
53
65
62
59
n/a
n/a

Environmental Issues
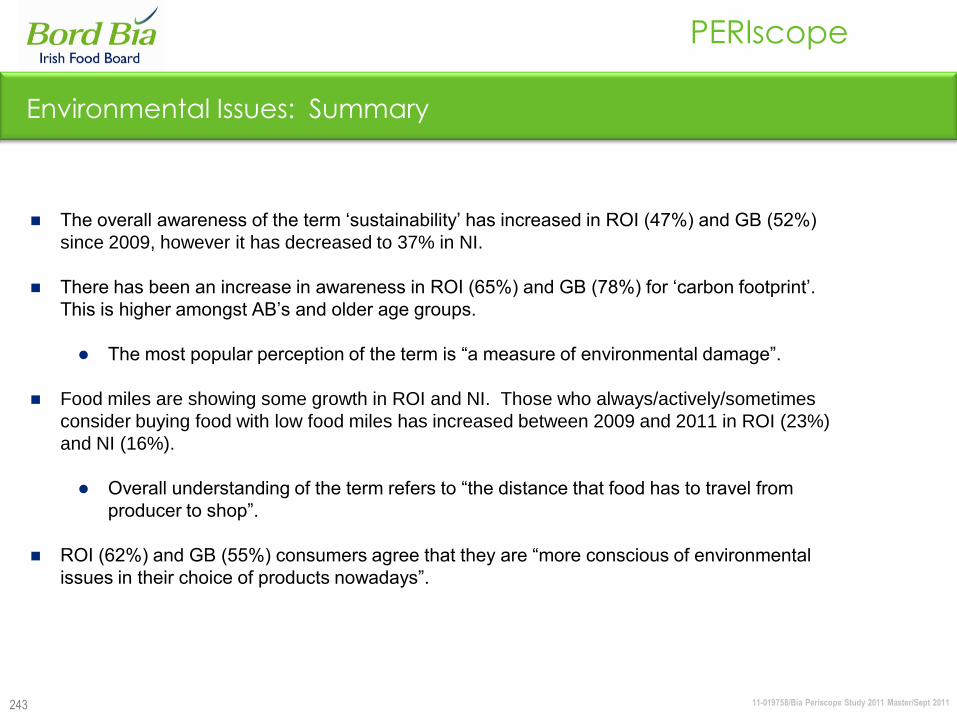
11-019758/Bia Periscope Study 2011 Master/Sept 2011
PERIscope
243
Environmental Issues: Summary
The overall awareness of the term „sustainability‟ has increased in ROI (47%) and GB (52%)
since 2009, however it has decreased to 37% in NI.
There has been an increase in awareness in ROI (65%) and GB (78%) for „carbon footprint‟.
This is higher amongst AB‟s and older age groups.
The most popular perception of the term is “a measure of environmental damage”.
Food miles are showing some growth in ROI and NI. Those who always/actively/sometimes
consider buying food with low food miles has increased between 2009 and 2011 in ROI (23%)
and NI (16%).
Overall understanding of the term refers to “the distance that food has to travel from
producer to shop”.
ROI (62%) and GB (55%) consumers agree that they are “more conscious of environmental
issues in their choice of products nowadays”.
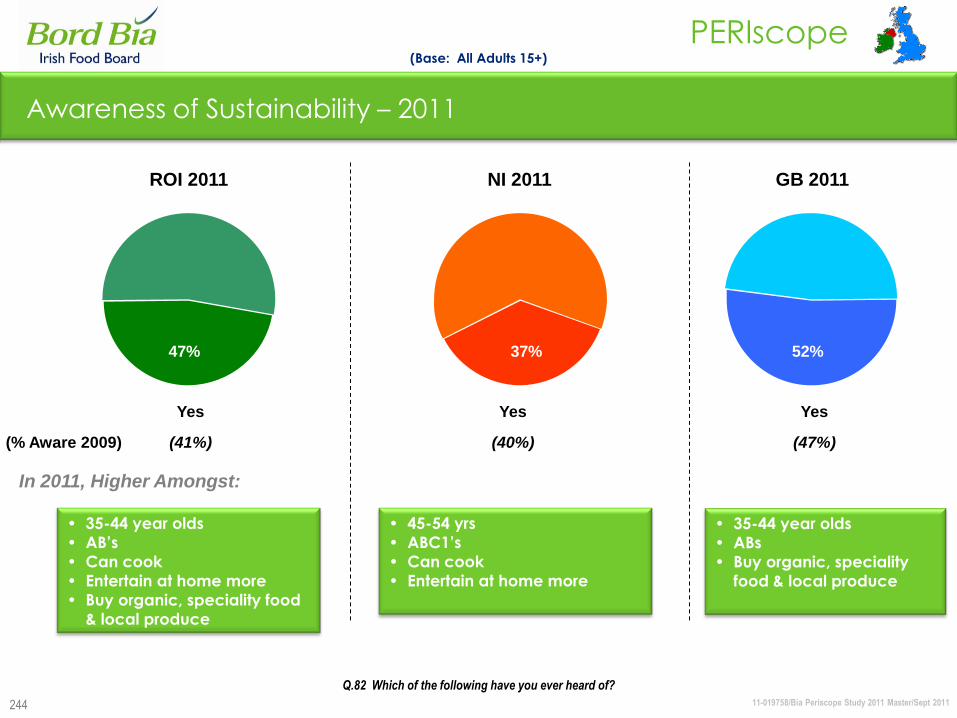
11-019758/Bia Periscope Study 2011 Master/Sept 2011
PERIscope
244
Awareness of Sustainability – 2011
Yes Yes Yes
• 45-54 yrs
• ABC1‟s
• Can cook
• Entertain at home more
• 35-44 year olds
• ABs
• Buy organic, speciality
food & local produce
• 35-44 year olds
• AB‟s
• Can cook
• Entertain at home more
• Buy organic, speciality food
& local produce
In 2011, Higher Amongst:
52%
(Base: All Adults 15+)
Q.82 Which of the following have you ever heard of?
(% Aware 2009) (41%) (40%) (47%)
37%47%
ROI 2011 NI 2011 GB 2011
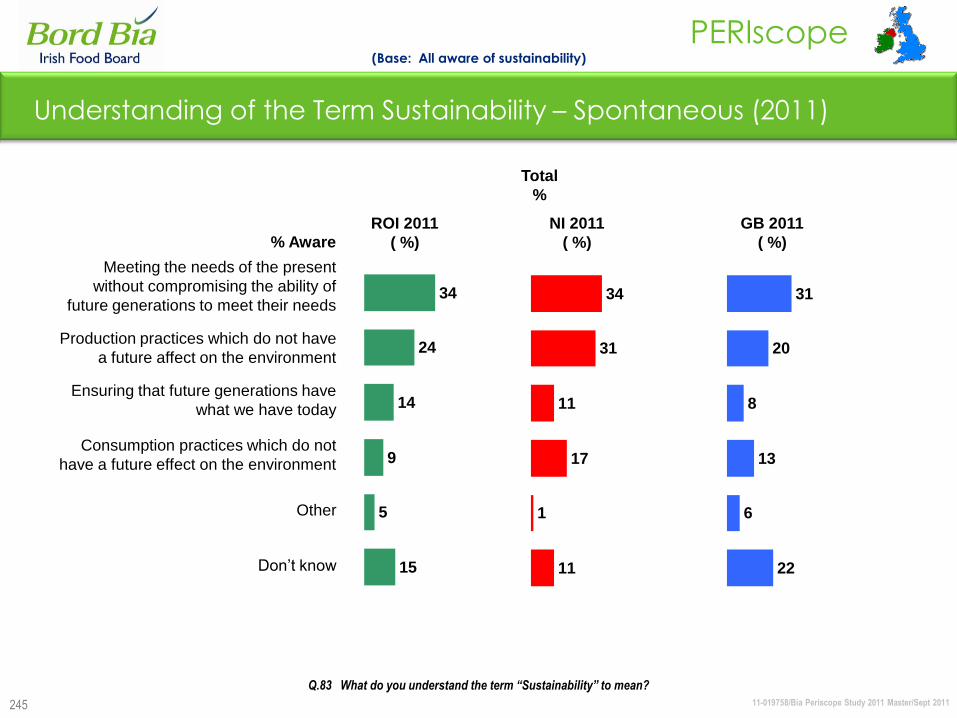
11-019758/Bia Periscope Study 2011 Master/Sept 2011
PERIscope
245
Understanding of the Term Sustainability – Spontaneous (2011)
Total
%
GB 2011
( %)
ROI 2011
( %)
NI 2011
( %)
34
24
14
9
5
15
% Aware
(Base: All aware of sustainability)
34
31
11
17
1
11
31
20
8
13
6
22
Q.83 What do you understand the term “Sustainability” to mean?
Meeting the needs of the present
without compromising the ability of
future generations to meet their needs
Production practices which do not have
a future affect on the environment
Ensuring that future generations have
what we have today
Consumption practices which do not
have a future effect on the environment
Other
Don‟t know
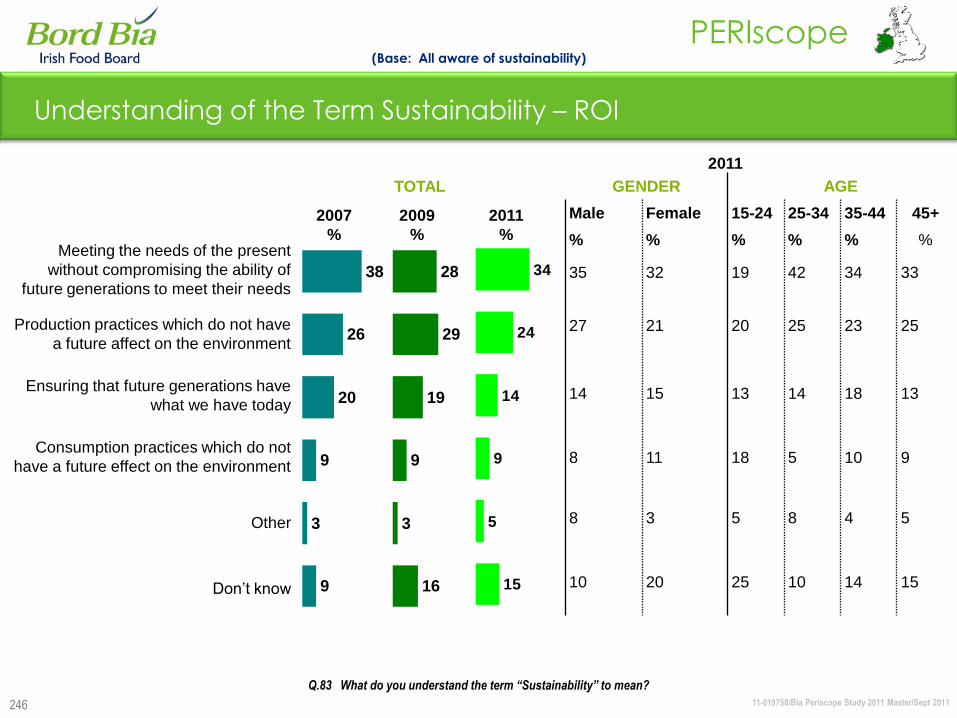
11-019758/Bia Periscope Study 2011 Master/Sept 2011
PERIscope
246
28
29
19
9
3
16
Understanding of the Term Sustainability – ROI
(Base: All aware of sustainability)
Q.83 What do you understand the term “Sustainability” to mean?
GENDER AGE
Male Female 15-24 25-34 35-44 45+
% % % % % %
35 32 19 42 34 33
27 21 20 25 23 25
14 15 13 14 18 13
8 11 18 5 10 9
8 3 5 8 4 5
10 20 25 10 14 15
Meeting the needs of the present
without compromising the ability of
future generations to meet their needs
Production practices which do not have
a future affect on the environment
Ensuring that future generations have
what we have today
Consumption practices which do not
have a future effect on the environment
Other
Don‟t know
38
26
20
9
3
9
2007
%
TOTAL
2009
%
2011
34
24
14
9
5
15
2011
%
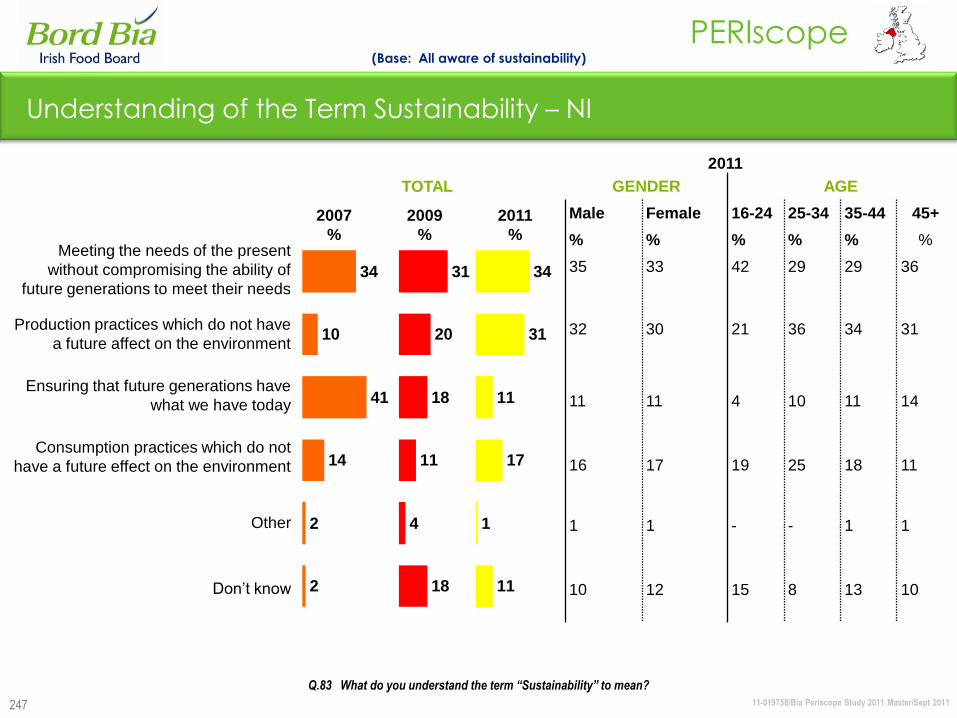
11-019758/Bia Periscope Study 2011 Master/Sept 2011
PERIscope
34
31
11
17
1
11
247
Understanding of the Term Sustainability – NI
(Base: All aware of sustainability)
Q.83 What do you understand the term “Sustainability” to mean?
31
20
18
11
4
18
GENDER AGE
Male Female 16-24 25-34 35-44 45+
% % % % % %
35 33 42 29 29 36
32 30 21 36 34 31
11 11 4 10 11 14
16 17 19 25 18 11
1 1 - - 1 1
10 12 15 8 13 10
Meeting the needs of the present
without compromising the ability of
future generations to meet their needs
Production practices which do not have
a future affect on the environment
Ensuring that future generations have
what we have today
Consumption practices which do not
have a future effect on the environment
Other
Don‟t know
34
10
41
14
2
2
2007
%
TOTAL
2009
%
2011
2011
%
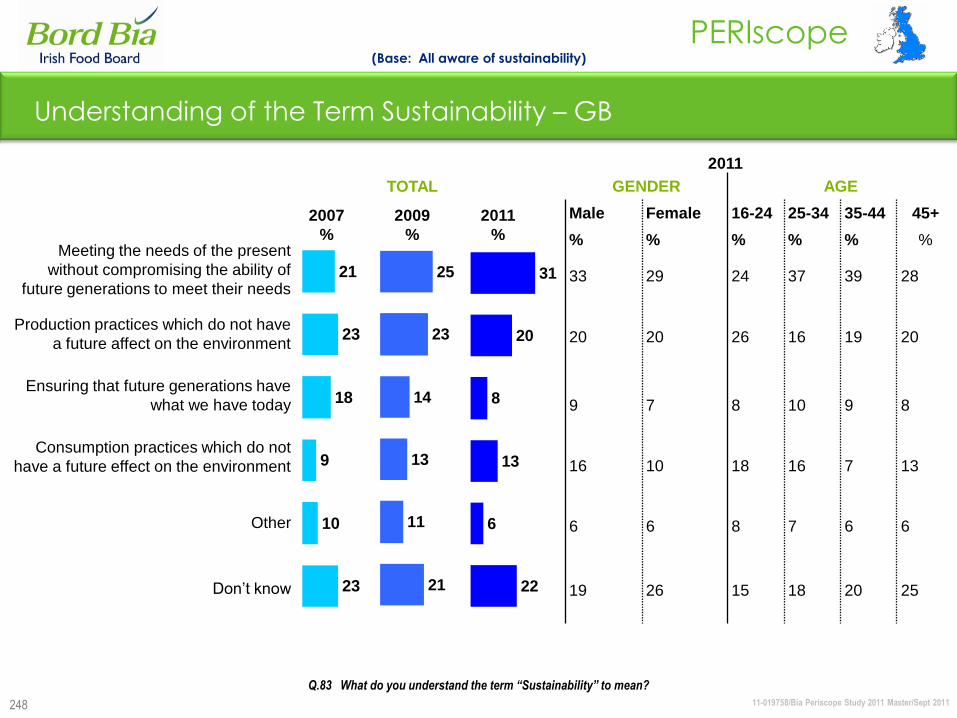
11-019758/Bia Periscope Study 2011 Master/Sept 2011
PERIscope
25
23
14
13
11
21
31
20
8
13
6
22
248
Understanding of the Term Sustainability – GB
(Base: All aware of sustainability)
Q.83 What do you understand the term “Sustainability” to mean?
GENDER AGE
Male Female 16-24 25-34 35-44 45+
% % % % % %
33 29 24 37 39 28
20 20 26 16 19 20
9 7 8 10 9 8
16 10 18 16 7 13
6 6 8 7 6 6
19 26 15 18 20 25
Meeting the needs of the present
without compromising the ability of
future generations to meet their needs
Production practices which do not have
a future affect on the environment
Ensuring that future generations have
what we have today
Consumption practices which do not
have a future effect on the environment
Other
Don‟t know
21
23
18
9
10
23
2007
%
TOTAL
2009
%
2011
2011
%
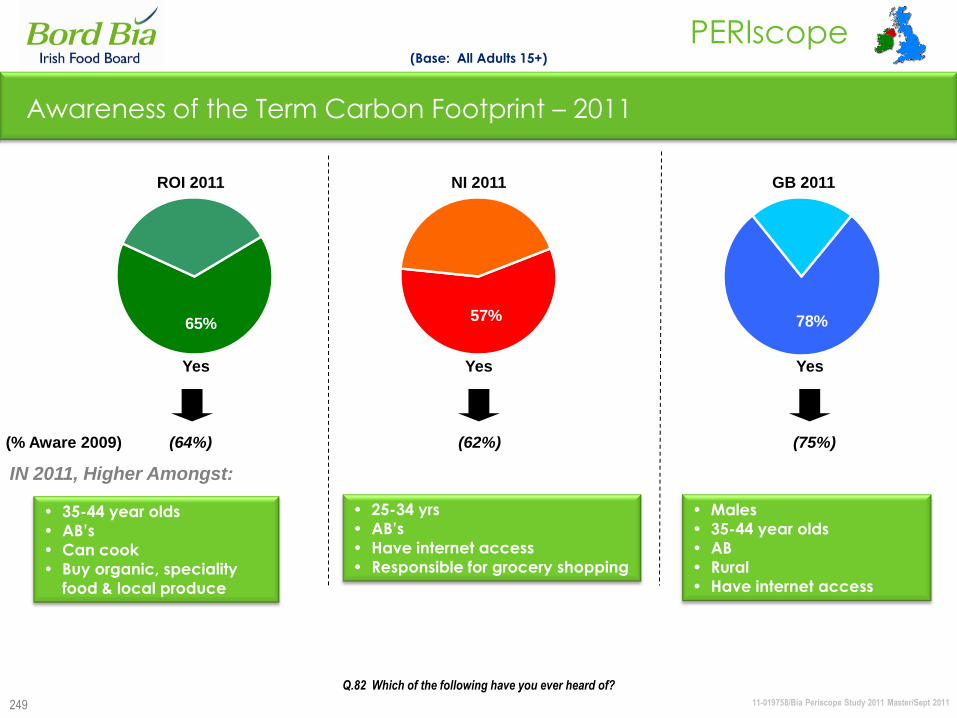
11-019758/Bia Periscope Study 2011 Master/Sept 2011
PERIscope
249
Awareness of the Term Carbon Footprint – 2011
(Base: All Adults 15+)
• 25-34 yrs
• AB‟s
• Have internet access
• Responsible for grocery shopping
• Males
• 35-44 year olds
• AB
• Rural
• Have internet access
• 35-44 year olds
• AB‟s
• Can cook
• Buy organic, speciality
food & local produce
IN 2011, Higher Amongst:
65%57% 78%
Yes Yes Yes
Q.82 Which of the following have you ever heard of?
(% Aware 2009) (64%) (62%) (75%)
GB 2011NI 2011ROI 2011
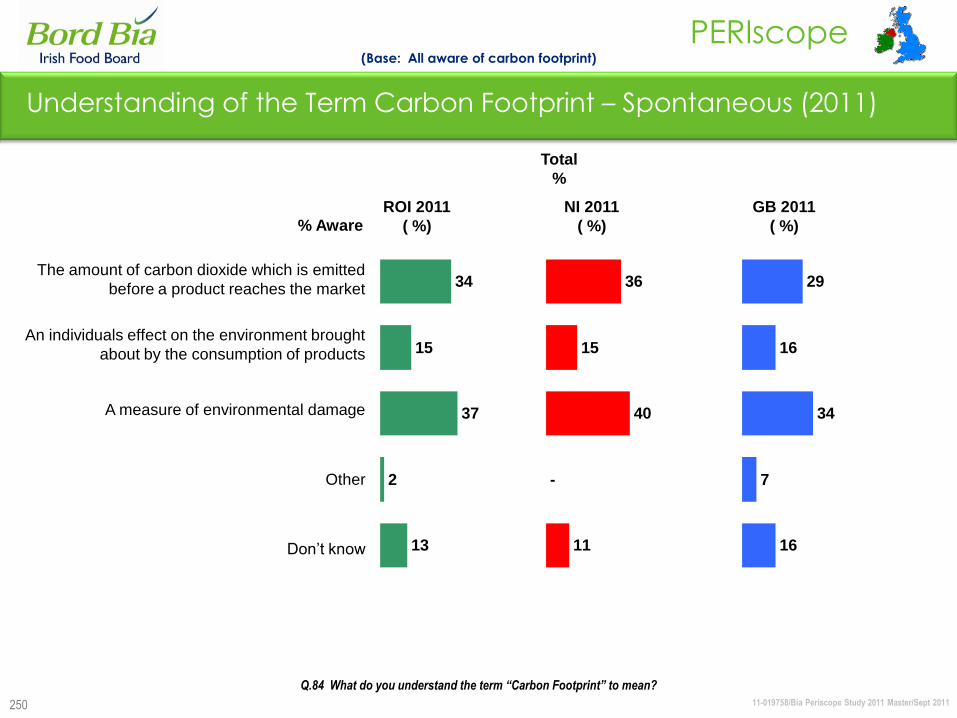
11-019758/Bia Periscope Study 2011 Master/Sept 2011
PERIscope
250
Understanding of the Term Carbon Footprint – Spontaneous (2011)
(Base: All aware of carbon footprint)
The amount of carbon dioxide which is emitted
before a product reaches the market
An individuals effect on the environment brought
about by the consumption of products
A measure of environmental damage
Other
Don‟t know
Total
%
GB 2011
( %)
ROI 2011
( %)
NI 2011
( %)
34
15
37
2
13
% Aware
36
15
40
11
-
29
16
34
7
16
Q.84 What do you understand the term “Carbon Footprint” to mean?

11-019758/Bia Periscope Study 2011 Master/Sept 2011
PERIscope
34
15
37
2
13
251
Understanding of the Term Carbon Footprint – ROI
The amount of carbon dioxide
which is emitted before a
product reaches the market
An individuals effect on the
environment brought about by
the consumption of products
A measure of environmental
damage
Other
Don‟t know
(Base: All aware of Carbon Footprint)
Q.84 What do you understand the term “Carbon Footprint” to mean?
27
16
39
5
14
33
33
27
3
8
2007
%
TOTAL
2009
%
GENDER AGE
Male Female 15-24 25-34 35-44 45+
% % % % % %
35 33 32 38 35 32
14 16 17 16 14 13
40 35 31 34 42 39
3 1 3 1 3 2
10 16 17 10 9 15
2011
2011
%
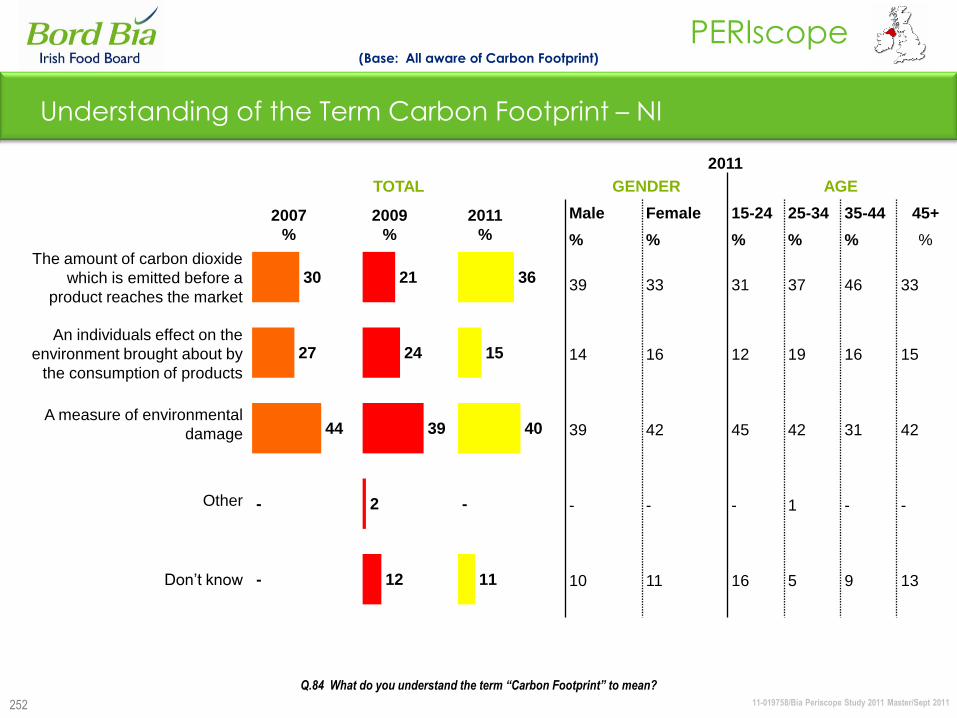
11-019758/Bia Periscope Study 2011 Master/Sept 2011
PERIscope
36
15
40
11
-
252
Understanding of the Term Carbon Footprint – NI
(Base: All aware of Carbon Footprint)
Q.84 What do you understand the term “Carbon Footprint” to mean?
The amount of carbon dioxide
which is emitted before a
product reaches the market
An individuals effect on the
environment brought about by
the consumption of products
A measure of environmental
damage
Other
Don‟t know
21
24
39
2
12
30
27
44
-
-
2007
%
TOTAL
2009
%
GENDER AGE
Male Female 15-24 25-34 35-44 45+
% % % % % %
39 33 31 37 46 33
14 16 12 19 16 15
39 42 45 42 31 42
- - - 1 - -
10 11 16 5 9 13
2011
2011
%
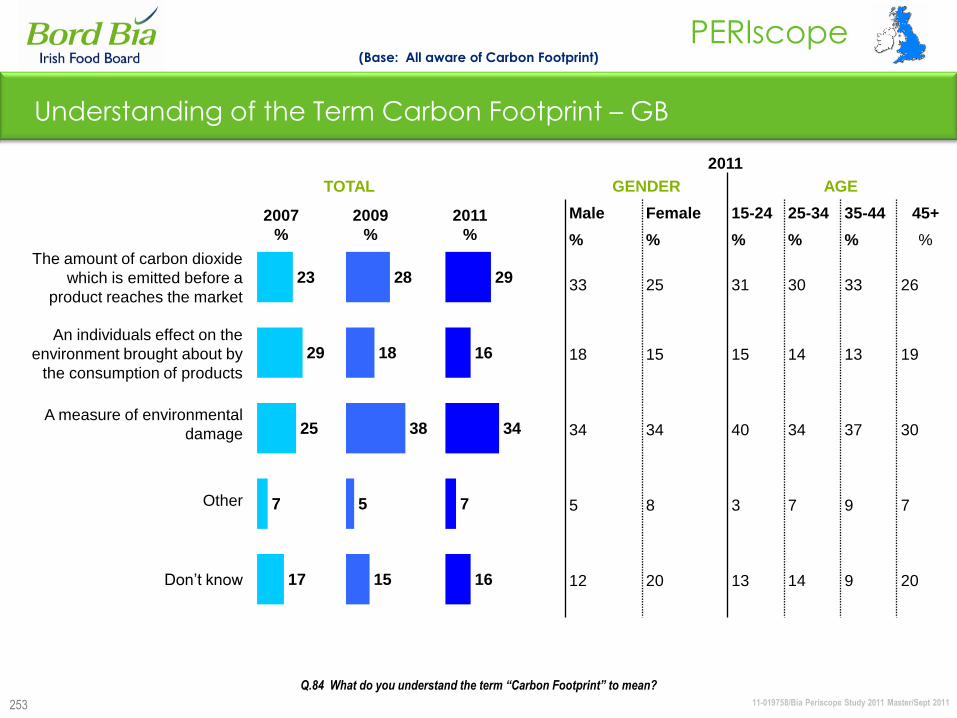
11-019758/Bia Periscope Study 2011 Master/Sept 2011
PERIscope
29
16
34
7
16
23
29
25
7
17
253
Understanding of the Term Carbon Footprint – GB
(Base: All aware of Carbon Footprint)
Q.84 What do you understand the term “Carbon Footprint” to mean?
The amount of carbon dioxide
which is emitted before a
product reaches the market
An individuals effect on the
environment brought about by
the consumption of products
A measure of environmental
damage
Other
Don‟t know
28
18
38
5
15
2007
%
TOTAL
2009
%
GENDER AGE
Male Female 15-24 25-34 35-44 45+
% % % % % %
33 25 31 30 33 26
18 15 15 14 13 19
34 34 40 34 37 30
5 8 3 7 9 7
12 20 13 14 9 20
2011
2011
%
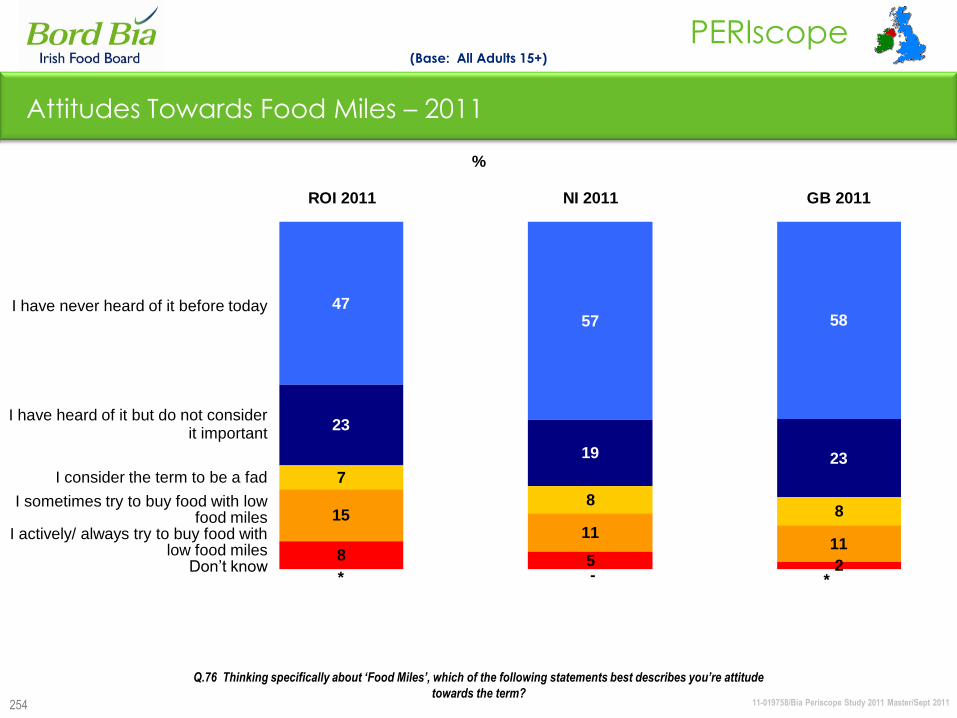
11-019758/Bia Periscope Study 2011 Master/Sept 2011
PERIscope
254
4757 58
23
19 23
7
8815
1111
8 5 2*-*
ROI 2011 NI 2011 GB 2011
(Base: All Adults 15+)
%
I have never heard of it before today
I have heard of it but do not consider it important
I consider the term to be a fad
I sometimes try to buy food with low food miles
I actively/ always try to buy food with low food miles
Don‟t know
Attitudes Towards Food Miles – 2011
Q.76 Thinking specifically about „Food Miles‟, which of the following statements best describes you‟re attitude
towards the term?
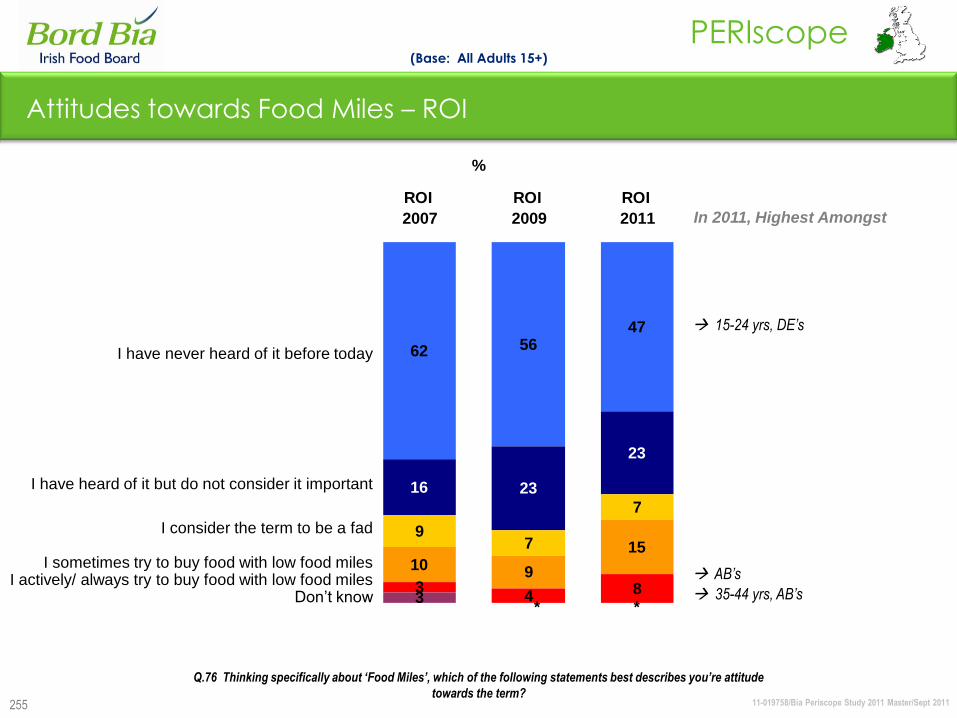
11-019758/Bia Periscope Study 2011 Master/Sept 2011
PERIscope
255
Attitudes towards Food Miles – ROI
(Base: All Adults 15+)
62 5647
16 23
23
97
7
10 9
15
34 8
3**
ROI
2007
ROI
2009
ROI
2011
%
I have never heard of it before today
I have heard of it but do not consider it important
I consider the term to be a fad
I sometimes try to buy food with low food milesI actively/ always try to buy food with low food miles
Don‟t know
In 2011, Highest Amongst
Q.76 Thinking specifically about „Food Miles‟, which of the following statements best describes you‟re attitude
towards the term?
AB’s
15-24 yrs, DE’s
35-44 yrs, AB’s
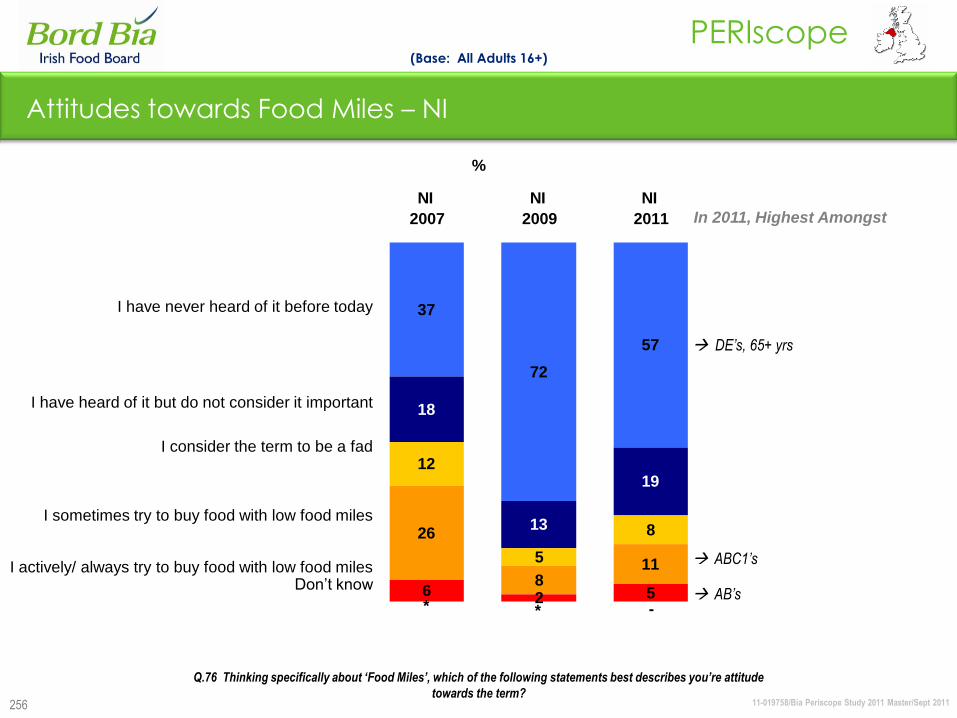
11-019758/Bia Periscope Study 2011 Master/Sept 2011
PERIscope
256
Attitudes towards Food Miles – NI
(Base: All Adults 16+)
37
72
57
18
13
1912
5
826
811
6 2 5-* *
NI
2007
NI
2009
NI
2011
%
I have never heard of it before today
I have heard of it but do not consider it important
I consider the term to be a fad
I sometimes try to buy food with low food miles
I actively/ always try to buy food with low food milesDon‟t know
In 2011, Highest Amongst
Q.76 Thinking specifically about „Food Miles‟, which of the following statements best describes you‟re attitude
towards the term?
DE’s, 65+ yrs
ABC1’s
AB’s
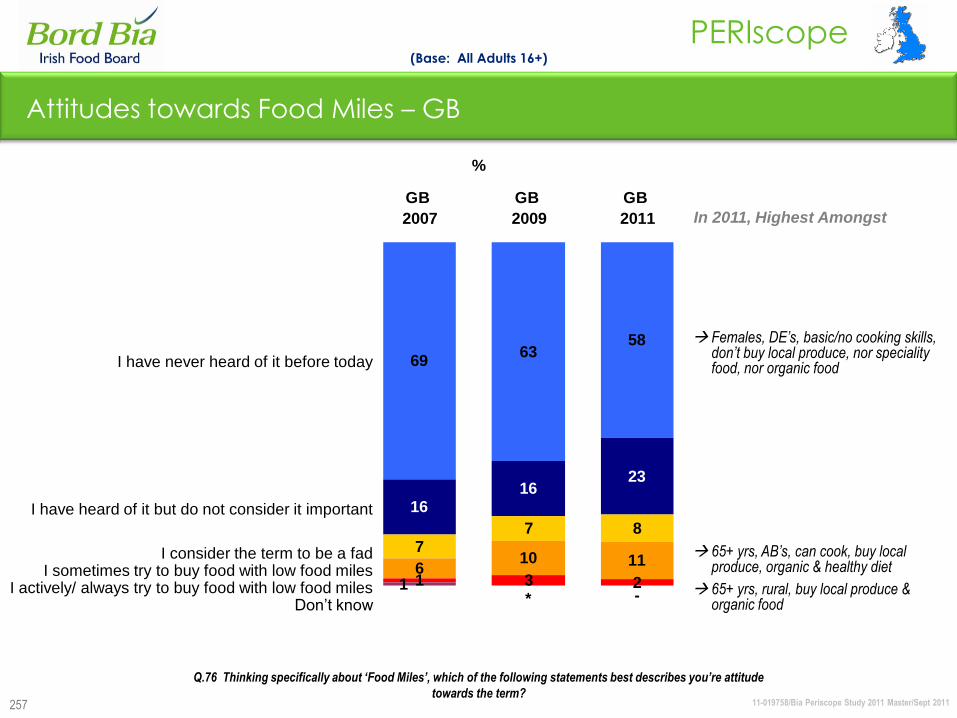
11-019758/Bia Periscope Study 2011 Master/Sept 2011
PERIscope
257
6963
58
1616
23
77 8
610 11
1 3 2-
1*
GB
2007
GB
2009
GB
2011
%
Attitudes towards Food Miles – GB
(Base: All Adults 16+)
Females, DE’s, basic/no cooking skills, don’t buy local produce, nor speciality food, nor organic food
Q.76 Thinking specifically about „Food Miles‟, which of the following statements best describes you‟re attitude
towards the term?
In 2011, Highest Amongst
I have never heard of it before today
I have heard of it but do not consider it important
I consider the term to be a fadI sometimes try to buy food with low food miles
I actively/ always try to buy food with low food milesDon‟t know
65+ yrs, AB’s, can cook, buy local produce, organic & healthy diet
65+ yrs, rural, buy local produce & organic food
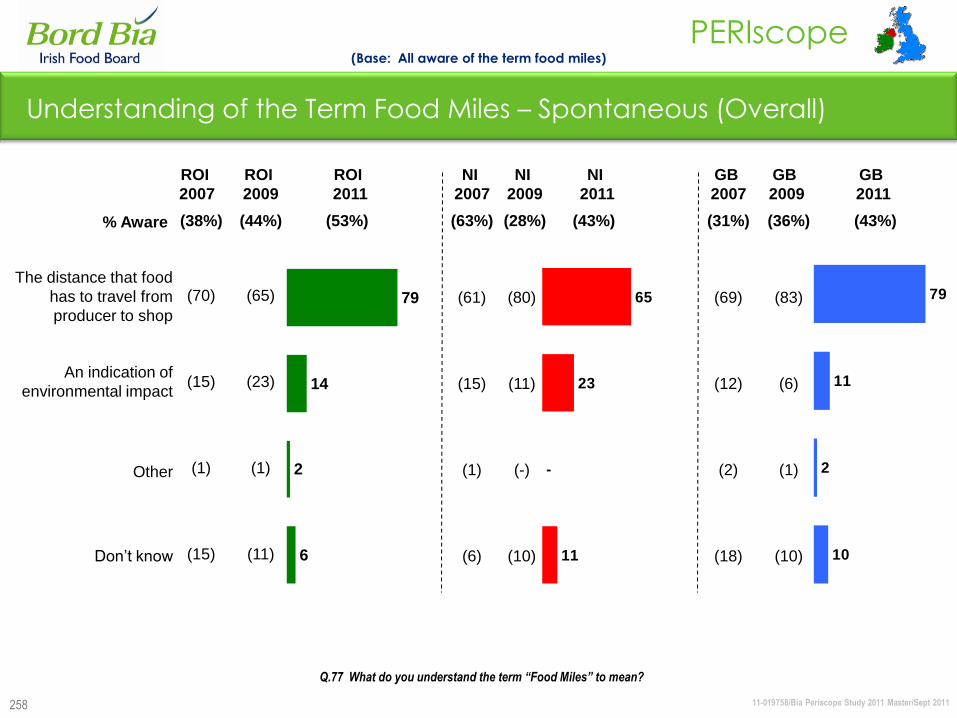
11-019758/Bia Periscope Study 2011 Master/Sept 2011
PERIscope
79
14
2
6
258
79
11
2
10
65
23
11
-
Understanding of the Term Food Miles – Spontaneous (Overall)
% Aware (53%) (43%) (36%)
(Base: All aware of the term food miles)
The distance that food
has to travel from
producer to shop
An indication of
environmental impact
Other
Don‟t know
Q.77 What do you understand the term “Food Miles” to mean?
(70)
(15)
(1)
(15)
(38%)
ROI
2007
(61)
(15)
(1)
(6)
(63%)
NI
2007
(69)
(12)
(2)
(18)
(31%)
GB
2007
(44%)
ROI
2009
(65)
(23)
(1)
(11)
ROI
2011
(28%)
NI
2009
NI
2011
(80)
(11)
(-)
(10)
(83)
(6)
(1)
(10)
GB
2009
(43%)
GB
2011

11-019758/Bia Periscope Study 2011 Master/Sept 2011
PERIscope
259
Statements Regarding Environmental Issues - 2011
(Base: All Adults 15+)
I am more conscious of
environmental issues in my choice
of products today
I prefer to buy from companies that
are aware of the impact of
environmental issues
Q.71 Please tell me how strongly you agree or disagree with the following statements?
% Agree
Slightly
% Agree
Strongly
%
Agree
62
46
55
55
40
49
38
33
32
26
36
32
ROI 2011
NI 2011
GB 2011
24
22
13
13
18
17
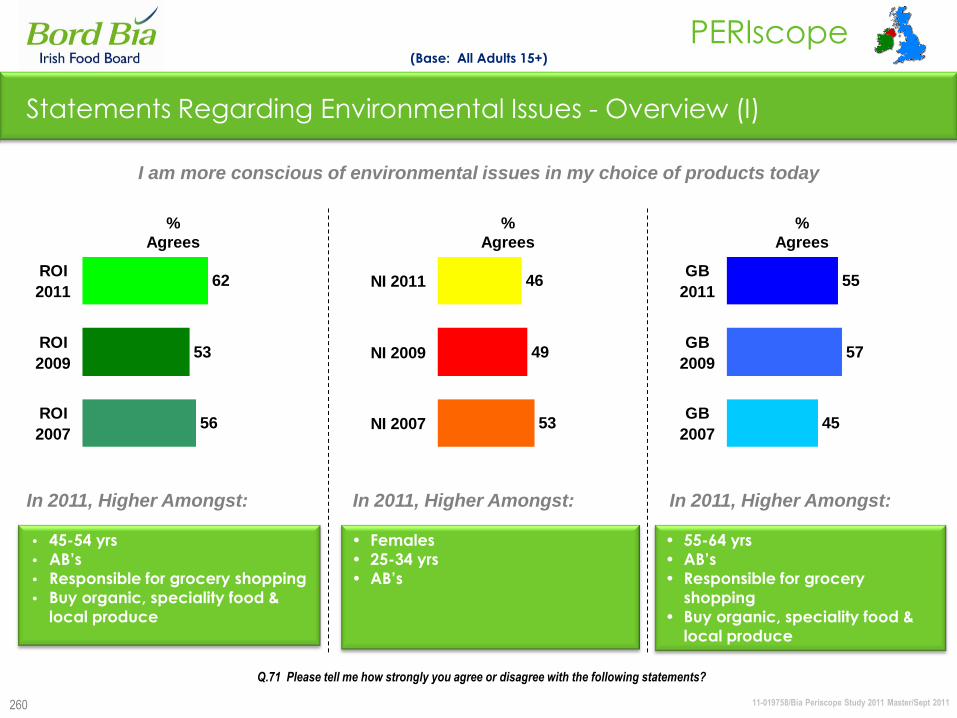
11-019758/Bia Periscope Study 2011 Master/Sept 2011
PERIscope
260
Statements Regarding Environmental Issues - Overview (I)
• 45-54 yrs
• AB‟s
• Responsible for grocery shopping
• Buy organic, speciality food &
local produce
In 2011, Higher Amongst:
I am more conscious of environmental issues in my choice of products today
• Females
• 25-34 yrs
• AB‟s
• 55-64 yrs
• AB‟s
• Responsible for grocery
shopping
• Buy organic, speciality food &
local produce
(Base: All Adults 15+)
Q.71 Please tell me how strongly you agree or disagree with the following statements?
49
53
46NI 2011
NI 2009
NI 2007
53
56
62ROI
2011
ROI
2009
ROI
2007
57
45
55GB
2011
GB
2009
GB
2007
%
Agrees
%
Agrees
%
Agrees
In 2011, Higher Amongst: In 2011, Higher Amongst:
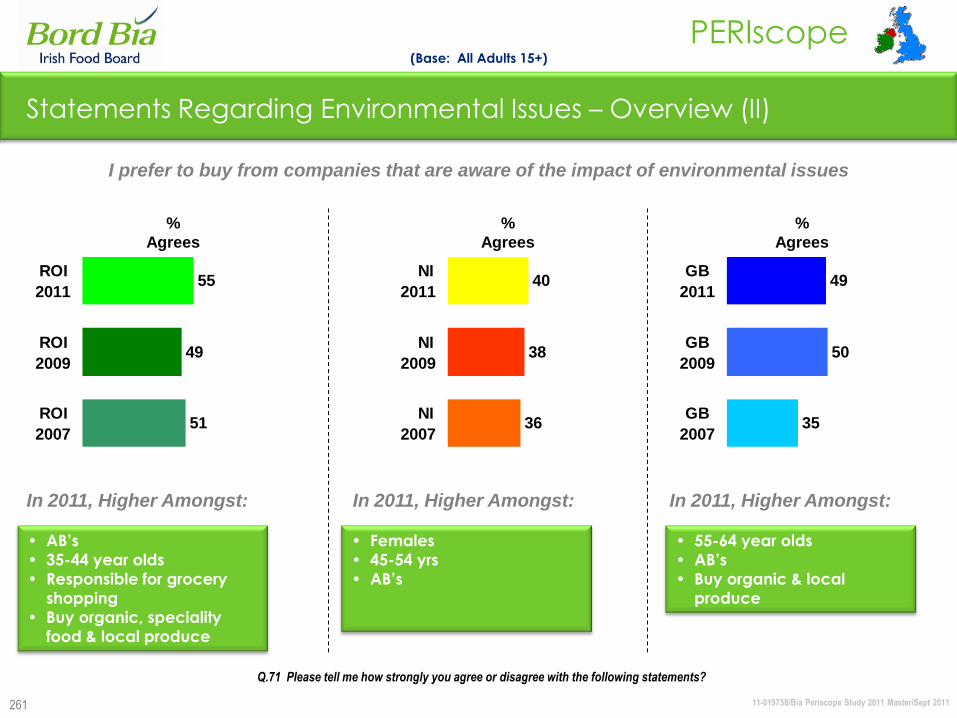
11-019758/Bia Periscope Study 2011 Master/Sept 2011
PERIscope
261
Statements Regarding Environmental Issues – Overview (II)
I prefer to buy from companies that are aware of the impact of environmental issues
• AB‟s
• 35-44 year olds
• Responsible for grocery
shopping
• Buy organic, speciality
food & local produce
• Females
• 45-54 yrs
• AB‟s
• 55-64 year olds
• AB‟s
• Buy organic & local
produce
(Base: All Adults 15+)
Q.71 Please tell me how strongly you agree or disagree with the following statements?
49
51
55ROI
2011
ROI
2009
ROI
2007
50
35
49GB
2011
GB
2009
GB
2007
%
Agrees
%
Agrees
%
Agrees
In 2011, Higher Amongst: In 2011, Higher Amongst: In 2011, Higher Amongst:
38
36
40 NI
2011
NI
2009
NI
2007
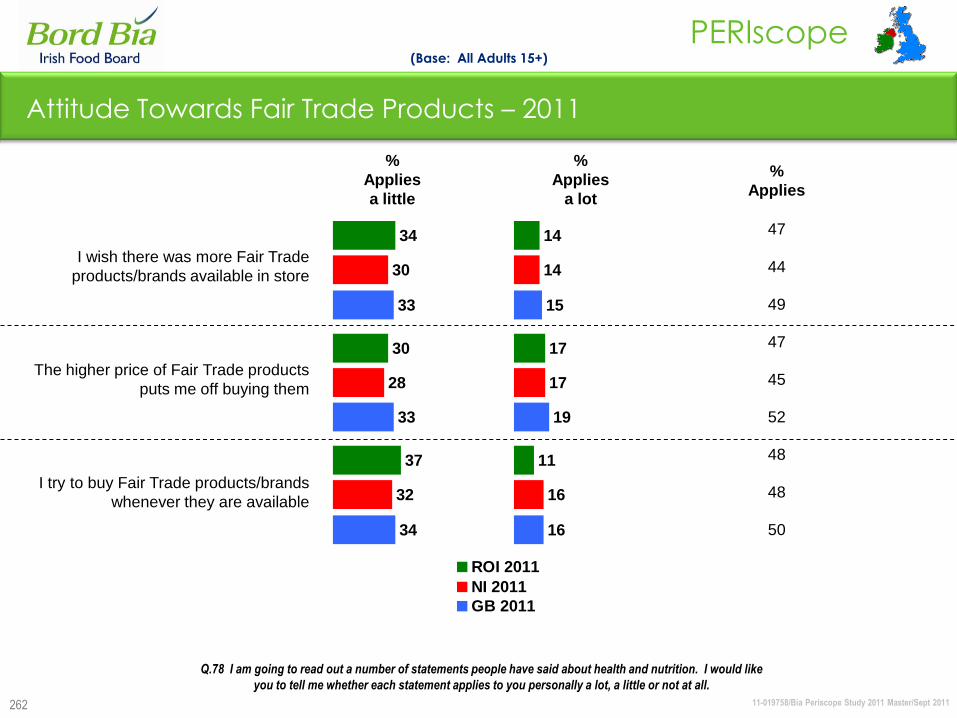
11-019758/Bia Periscope Study 2011 Master/Sept 2011
PERIscope
262
Attitude Towards Fair Trade Products – 2011
(Base: All Adults 15+)
%
Applies
47
44
49
47
45
52
48
48
50
Q.78 I am going to read out a number of statements people have said about health and nutrition. I would like
you to tell me whether each statement applies to you personally a lot, a little or not at all.
%
Applies
a little
%
Applies
a lot
I wish there was more Fair Trade
products/brands available in store
The higher price of Fair Trade products
puts me off buying them
I try to buy Fair Trade products/brands
whenever they are available
34
30
37
30
28
32
33
33
34
ROI 2011
NI 2011
GB 2011
14
17
11
14
17
16
15
19
16
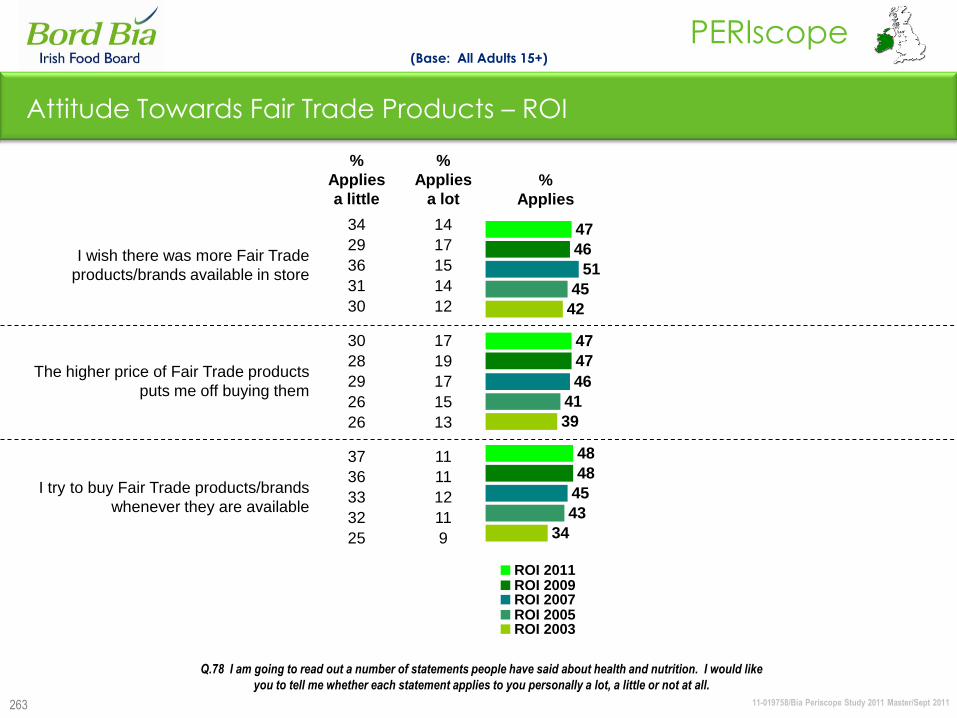
11-019758/Bia Periscope Study 2011 Master/Sept 2011
PERIscope
263
Attitude Towards Fair Trade Products – ROI
(Base: All Adults 15+)
%
Applies
34
39
42
43
41
45
45
46
51
48
47
46
48
47
47
ROI 2011ROI 2009ROI 2007ROI 2005ROI 2003
Q.78 I am going to read out a number of statements people have said about health and nutrition. I would like
you to tell me whether each statement applies to you personally a lot, a little or not at all.
%
Applies
a little
%
Applies
a lot
I wish there was more Fair Trade
products/brands available in store
34 14
29 17
36 15
31 14
30 12
The higher price of Fair Trade products
puts me off buying them
30 17
28 19
29 17
26 15
26 13
I try to buy Fair Trade products/brands
whenever they are available
37 11
36 11
33 12
32 11
25 9
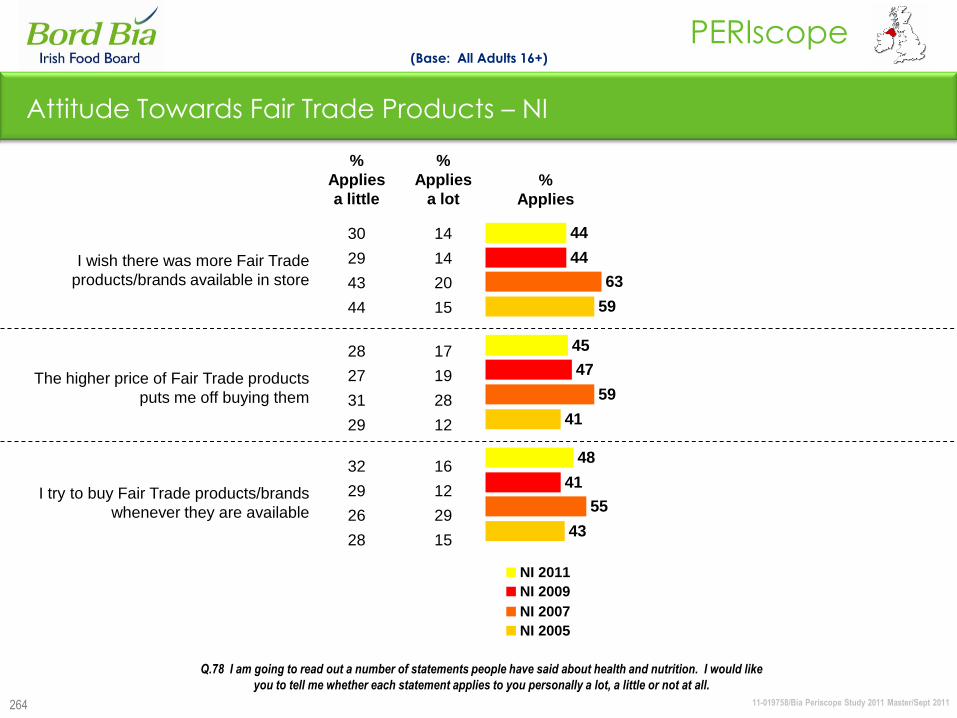
11-019758/Bia Periscope Study 2011 Master/Sept 2011
PERIscope
264
Attitude Towards Fair Trade Products – NI
Q.78 I am going to read out a number of statements people have said about health and nutrition. I would like
you to tell me whether each statement applies to you personally a lot, a little or not at all.
43
41
59
55
59
63
41
47
48
45
44
44
NI 2011
NI 2009
NI 2007
NI 2005
%
Applies
a little
%
Applies
a lot
I wish there was more Fair Trade
products/brands available in store
30 14
29 14
43 20
44 15
The higher price of Fair Trade products
puts me off buying them
28 17
27 19
31 28
29 12
I try to buy Fair Trade products/brands
whenever they are available
32 16
29 12
26 29
28 15
(Base: All Adults 16+)
%
Applies
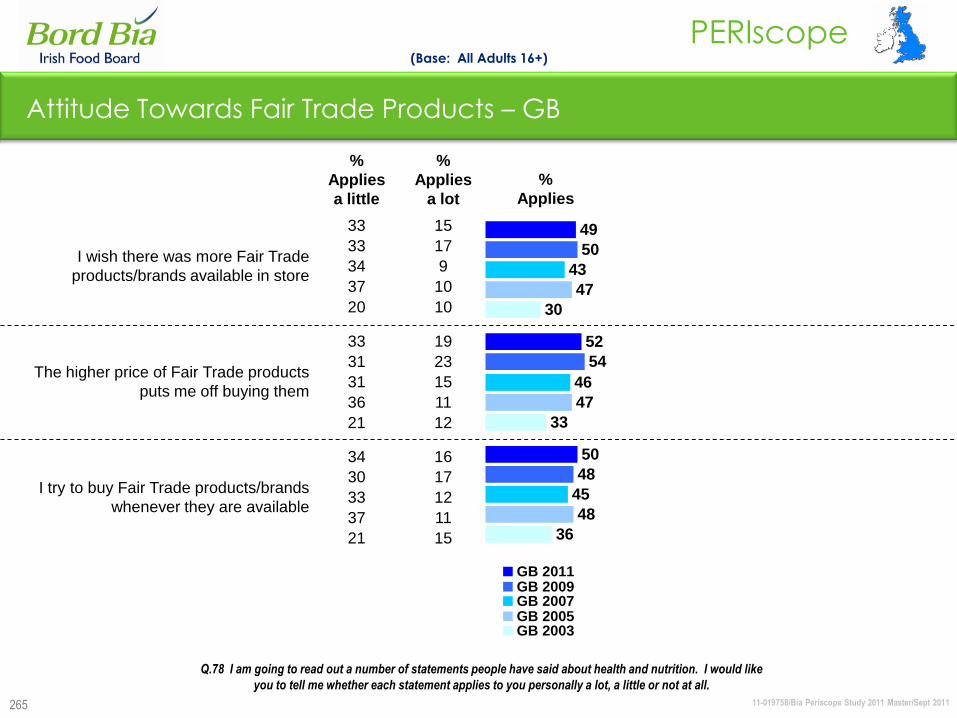
11-019758/Bia Periscope Study 2011 Master/Sept 2011
PERIscope
265
Attitude Towards Fair Trade Products – GB
(Base: All Adults 16+)
%
Applies
36
33
30
48
47
47
45
46
43
48
54
50
50
52
49
GB 2011GB 2009GB 2007GB 2005GB 2003
Q.78 I am going to read out a number of statements people have said about health and nutrition. I would like
you to tell me whether each statement applies to you personally a lot, a little or not at all.
%
Applies
a little
%
Applies
a lot
I wish there was more Fair Trade
products/brands available in store
33 15
33 17
34 9
37 10
20 10
The higher price of Fair Trade products
puts me off buying them
33 19
31 23
31 15
36 11
21 12
I try to buy Fair Trade products/brands
whenever they are available
34 16
30 17
33 12
37 11
21 15

Grocery Shopping
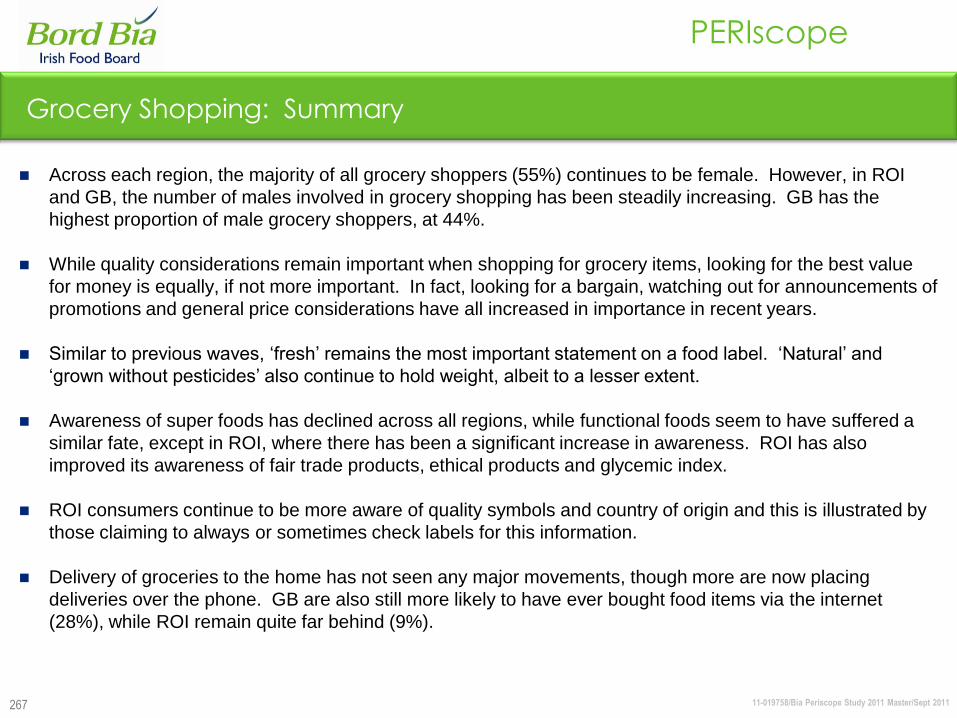
11-019758/Bia Periscope Study 2011 Master/Sept 2011
PERIscope
267
Grocery Shopping: Summary
Across each region, the majority of all grocery shoppers (55%) continues to be female. However, in ROI
and GB, the number of males involved in grocery shopping has been steadily increasing. GB has the
highest proportion of male grocery shoppers, at 44%.
While quality considerations remain important when shopping for grocery items, looking for the best value
for money is equally, if not more important. In fact, looking for a bargain, watching out for announcements of
promotions and general price considerations have all increased in importance in recent years.
Similar to previous waves, „fresh‟ remains the most important statement on a food label. „Natural‟ and
„grown without pesticides‟ also continue to hold weight, albeit to a lesser extent.
Awareness of super foods has declined across all regions, while functional foods seem to have suffered a
similar fate, except in ROI, where there has been a significant increase in awareness. ROI has also
improved its awareness of fair trade products, ethical products and glycemic index.
ROI consumers continue to be more aware of quality symbols and country of origin and this is illustrated by
those claiming to always or sometimes check labels for this information.
Delivery of groceries to the home has not seen any major movements, though more are now placing
deliveries over the phone. GB are also still more likely to have ever bought food items via the internet
(28%), while ROI remain quite far behind (9%).
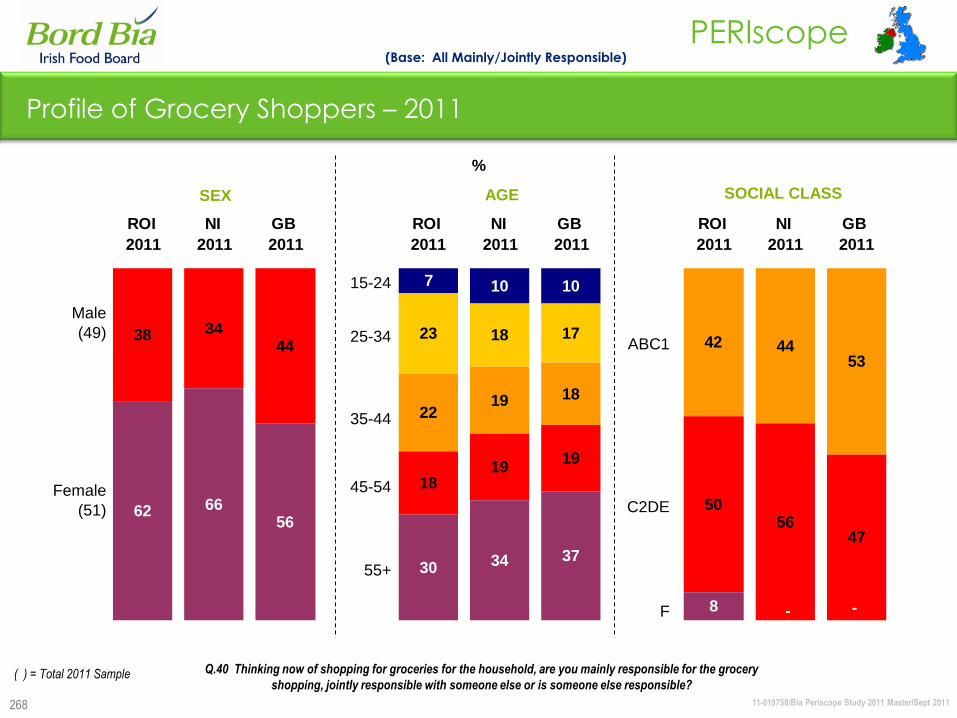
11-019758/Bia Periscope Study 2011 Master/Sept 2011
PERIscope
268
7 10 10
23 18 17
2219 18
42 4453
38 3444
1819
19
5056
47
62 6656
30 34 37
8 --
ROI
2011
NI
2011
GB
2011
ROI
2011
NI
2011
GB
2011
ROI
2011
NI
2011
GB
2011
Male
(49)
Female
(51)
15-24
25-34
35-44
45-54
55+
SEX AGE SOCIAL CLASS
ABC1
C2DE
F
%
(Base: All Mainly/Jointly Responsible)
Profile of Grocery Shoppers – 2011
( ) = Total 2011 Sample Q.40 Thinking now of shopping for groceries for the household, are you mainly responsible for the grocery
shopping, jointly responsible with someone else or is someone else responsible?
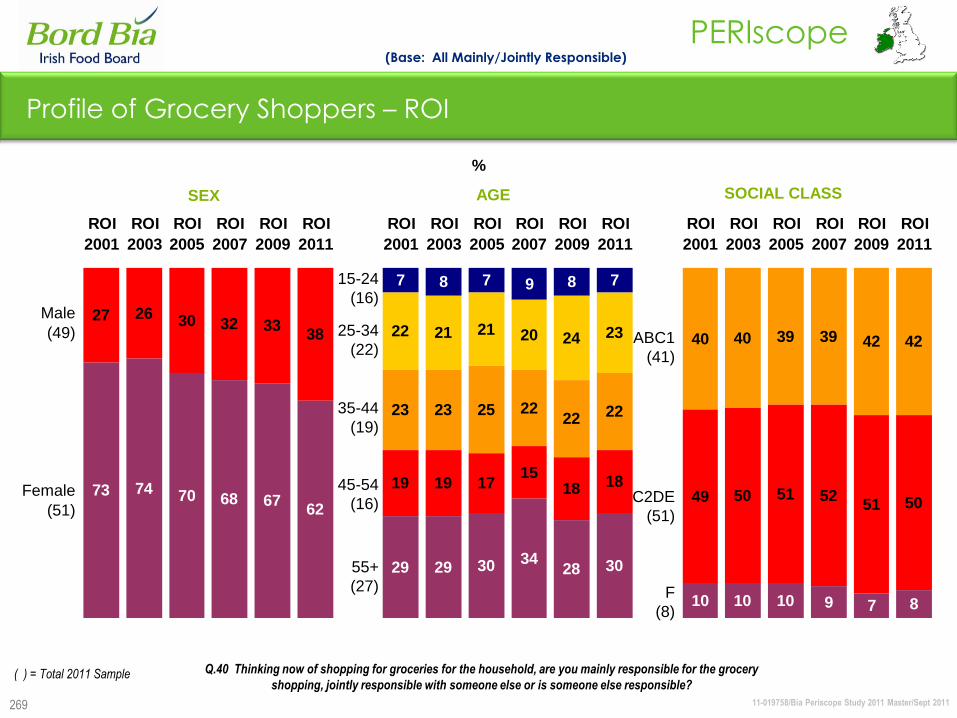
11-019758/Bia Periscope Study 2011 Master/Sept 2011
PERIscope
269
7 8 7 9 8 7
22 21 21 20 24 23
23 23 25 2222 22
40 40 39 39 42 42
27 26 30 32 3338
19 19 1715
18 1849 50 51 52
51 5073 74 70 68 67
62
29 29 30 3428 30
10 10 10 9 7 8
ROI
2001
ROI
2003
ROI
2005
ROI
2007
ROI
2009
ROI
2011
ROI
2001
ROI
2003
ROI
2005
ROI
2007
ROI
2009
ROI
2011
ROI
2001
ROI
2003
ROI
2005
ROI
2007
ROI
2009
ROI
2011
Male
(49)
Female
(51)
15-24
(16)
25-34
(22)
35-44
(19)
45-54
(16)
55+
(27)
SEX AGE SOCIAL CLASS
ABC1
(41)
C2DE
(51)
F
(8)
%
(Base: All Mainly/Jointly Responsible)
Profile of Grocery Shoppers – ROI
( ) = Total 2011 Sample Q.40 Thinking now of shopping for groceries for the household, are you mainly responsible for the grocery
shopping, jointly responsible with someone else or is someone else responsible?
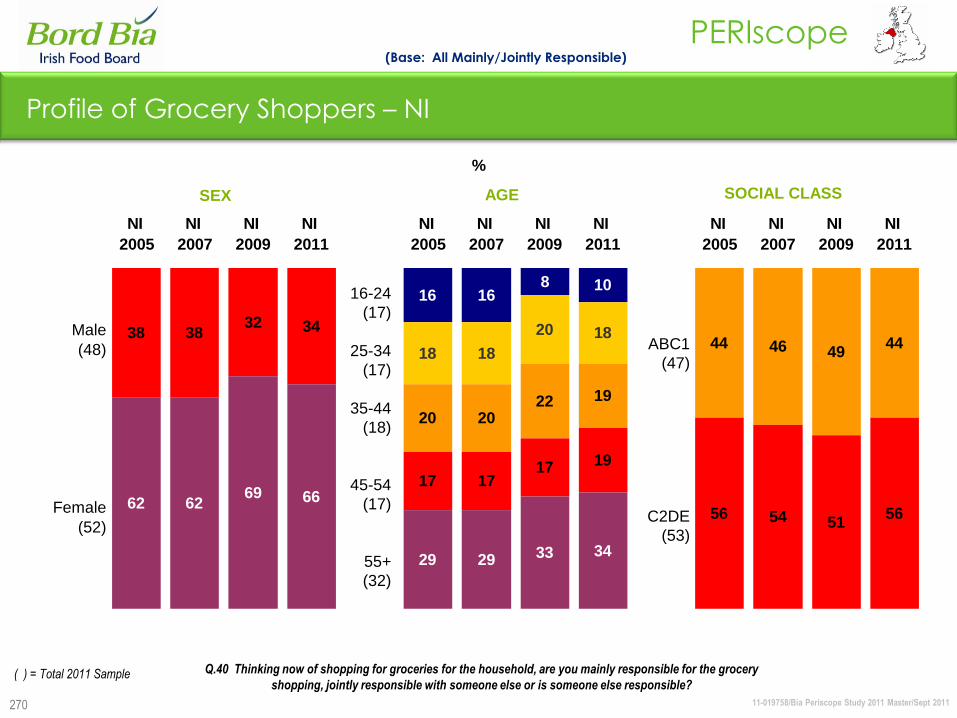
11-019758/Bia Periscope Study 2011 Master/Sept 2011
PERIscope
270
16 168 10
18 18
20 18
20 2022 19
44 46 4944
38 3832 34
17 1717 19
56 54 5156
62 6269 66
29 29 33 34
NI
2005
NI
2007
NI
2009
NI
2011
NI
2005
NI
2007
NI
2009
NI
2011
NI
2005
NI
2007
NI
2009
NI
2011
Male
(48)
Female
(52)
16-24
(17)
25-34
(17)
35-44
(18)
45-54
(17)
55+
(32)
SEX AGE SOCIAL CLASS
ABC1
(47)
C2DE
(53)
%
(Base: All Mainly/Jointly Responsible)
( ) = Total 2011 Sample
Profile of Grocery Shoppers – NI
Q.40 Thinking now of shopping for groceries for the household, are you mainly responsible for the grocery
shopping, jointly responsible with someone else or is someone else responsible?

11-019758/Bia Periscope Study 2011 Master/Sept 2011
PERIscope
271
8 7 7 8 10
19 19 19 19 17
21 19 19 20 18
52 5056 53 53
34 30 3139
44
1616 18 18 19
48 5044 46 47
66 70 6961
56
36 39 37 35 37
GB
2003
GB
2005
GB
2007
GB
2009
GB
2011
GB
2003
GB
2005
GB
2007
GB
2009
GB
2011
GB
2003
GB
2005
GB
2007
GB
2009
GB
2011
Male
(49)
Female
(51)
16-24
(15)
25-34
(16)
35-44
(18)
45-54
(17)
55+
(35)
SEX AGE SOCIAL CLASS
ABC1
(54)
C2DE
(46)
%
(Base: All Mainly/Jointly Responsible)
( ) = Total 2011 Sample
Profile of Grocery Shoppers – GB
Q.40 Thinking now of shopping for groceries for the household, are you mainly responsible for the grocery
shopping, jointly responsible with someone else or is someone else responsible?
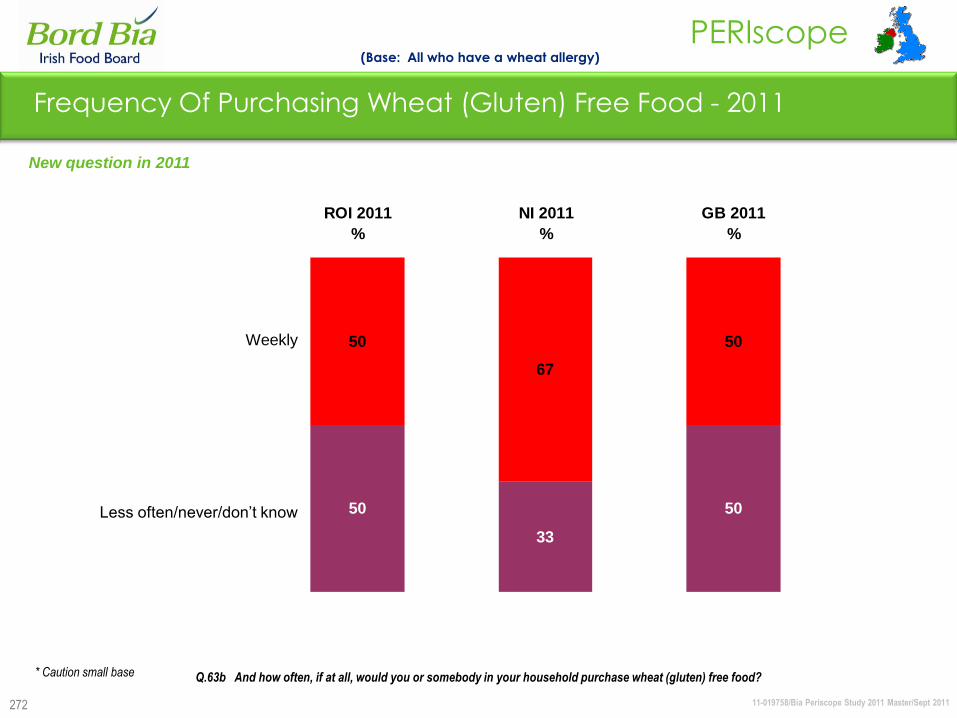
11-019758/Bia Periscope Study 2011 Master/Sept 2011
PERIscope
272
50
50
50
67
33
50
ROI 2011
%
NI 2011
%
GB 2011
%
Weekly
Less often/never/don‟t know
(Base: All who have a wheat allergy)
Frequency Of Purchasing Wheat (Gluten) Free Food - 2011
New question in 2011
Q.63b And how often, if at all, would you or somebody in your household purchase wheat (gluten) free food? * Caution small base
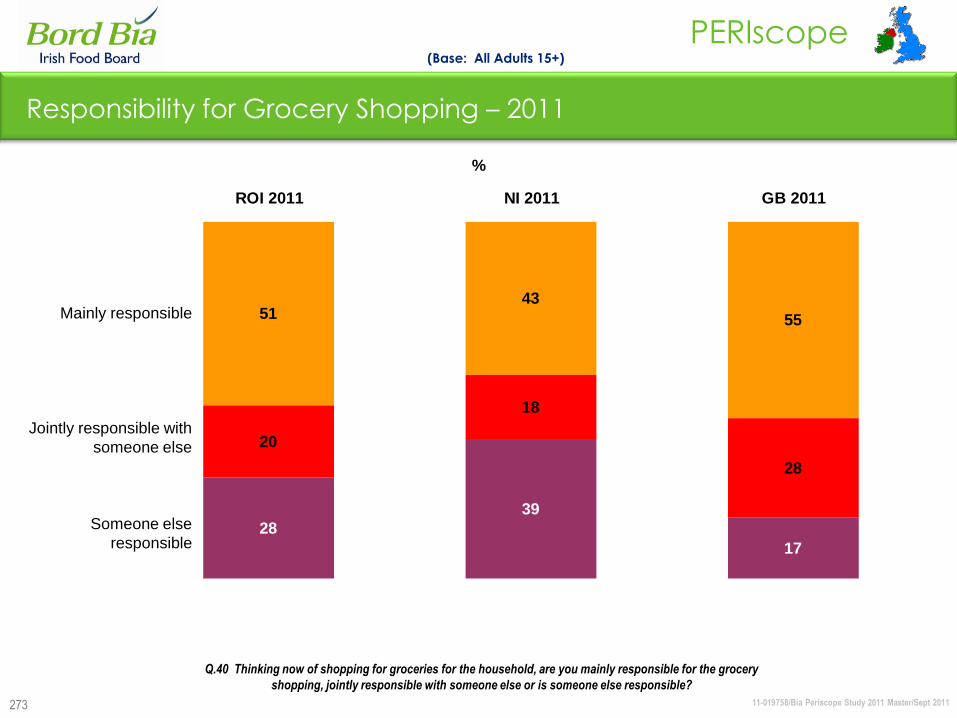
11-019758/Bia Periscope Study 2011 Master/Sept 2011
PERIscope
273
5143
55
20
18
28
28
39
17
ROI 2011 NI 2011 GB 2011
Mainly responsible
Jointly responsible with
someone else
Someone else
responsible
Responsibility for Grocery Shopping – 2011
(Base: All Adults 15+)
Q.40 Thinking now of shopping for groceries for the household, are you mainly responsible for the grocery
shopping, jointly responsible with someone else or is someone else responsible?
%

11-019758/Bia Periscope Study 2011 Master/Sept 2011
PERIscope
274
47 45 43 4146
51
10 12 14 1616
20
43 43 43 4338
28
ROI
2001
ROI
2003
ROI
2005
ROI
2007
ROI
2009
ROI
2011
Mainly responsible
Jointly responsible with someone else
Someone else responsible
(Base: All Adults 15+)
Q.40 Thinking now of shopping for groceries for the household, are you mainly responsible for the grocery
shopping, jointly responsible with someone else or is someone else responsible?
Responsibility for Grocery Shopping – ROI
%
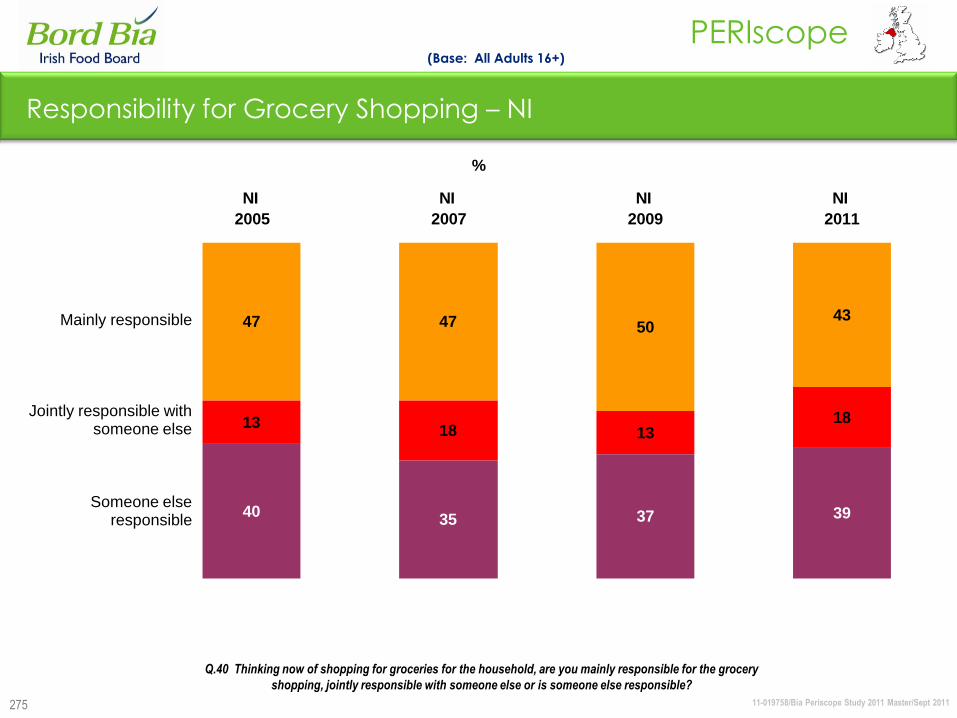
11-019758/Bia Periscope Study 2011 Master/Sept 2011
PERIscope
275
47 47 5043
1318 13
18
4035 37 39
NI
2005
NI
2007
NI
2009
NI
2011
Mainly responsible
Jointly responsible with someone else
Someone else responsible
(Base: All Adults 16+)
Q.40 Thinking now of shopping for groceries for the household, are you mainly responsible for the grocery
shopping, jointly responsible with someone else or is someone else responsible?
Responsibility for Grocery Shopping – NI
%
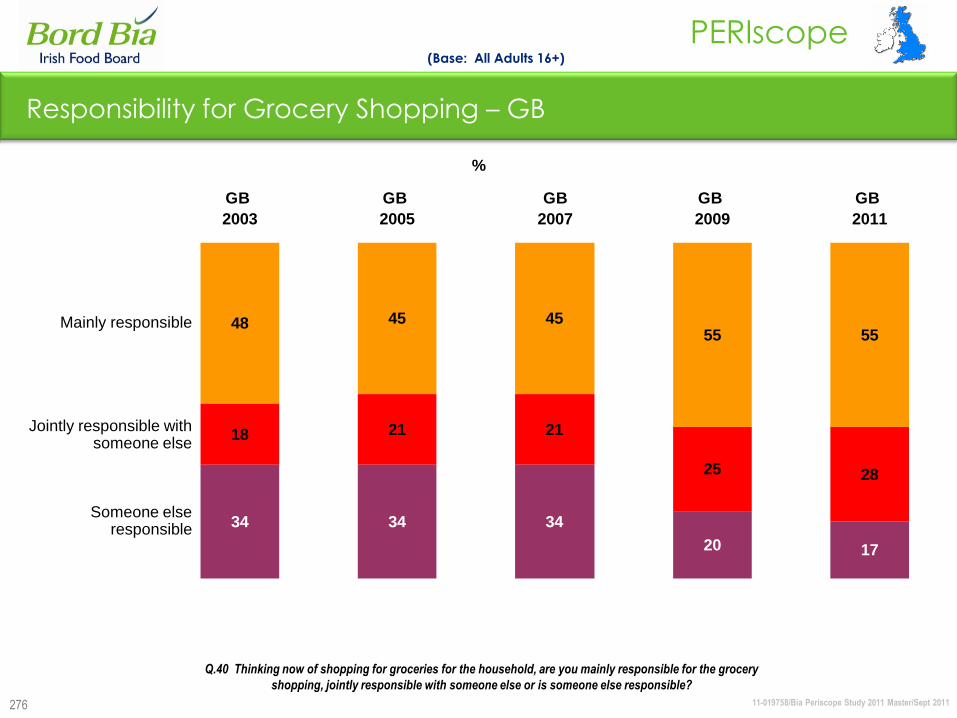
11-019758/Bia Periscope Study 2011 Master/Sept 2011
PERIscope
276
48 45 4555 55
18 21 21
25 28
34 34 34
20 17
GB
2003
GB
2005
GB
2007
GB
2009
GB
2011
Mainly responsible
Jointly responsible with someone else
Someone else responsible
(Base: All Adults 16+)
Q.40 Thinking now of shopping for groceries for the household, are you mainly responsible for the grocery
shopping, jointly responsible with someone else or is someone else responsible?
Responsibility for Grocery Shopping – GB
%
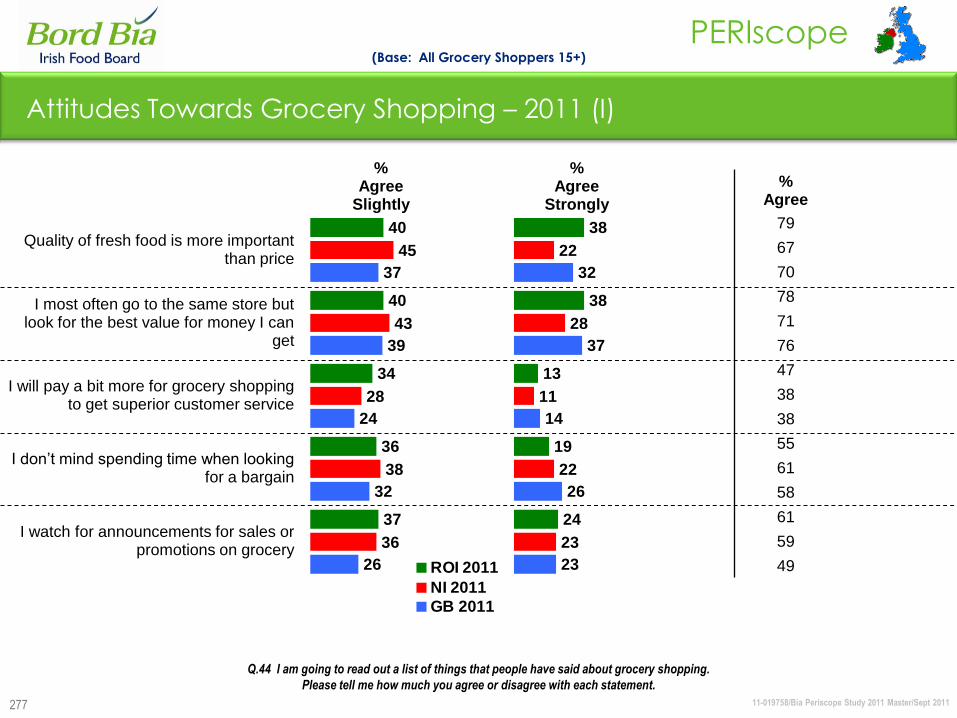
11-019758/Bia Periscope Study 2011 Master/Sept 2011
PERIscope
277
(Base: All Grocery Shoppers 15+)
%Agree
79
67
70
78
71
76
47
38
38
55
61
58
61
59
49
Q.44 I am going to read out a list of things that people have said about grocery shopping.
Please tell me how much you agree or disagree with each statement.
%Agree
Slightly
%Agree
Strongly
Quality of fresh food is more important than price
I most often go to the same store but look for the best value for money I can
get
I will pay a bit more for grocery shopping to get superior customer service
I don‟t mind spending time when looking for a bargain
I watch for announcements for sales or promotions on grocery
Attitudes Towards Grocery Shopping – 2011 (I)
40
40
34
36
37
45
43
28
38
36
37
39
24
32
26 ROI 2011
NI 2011
GB 2011
38
38
13
19
24
22
28
11
22
23
32
37
14
26
23
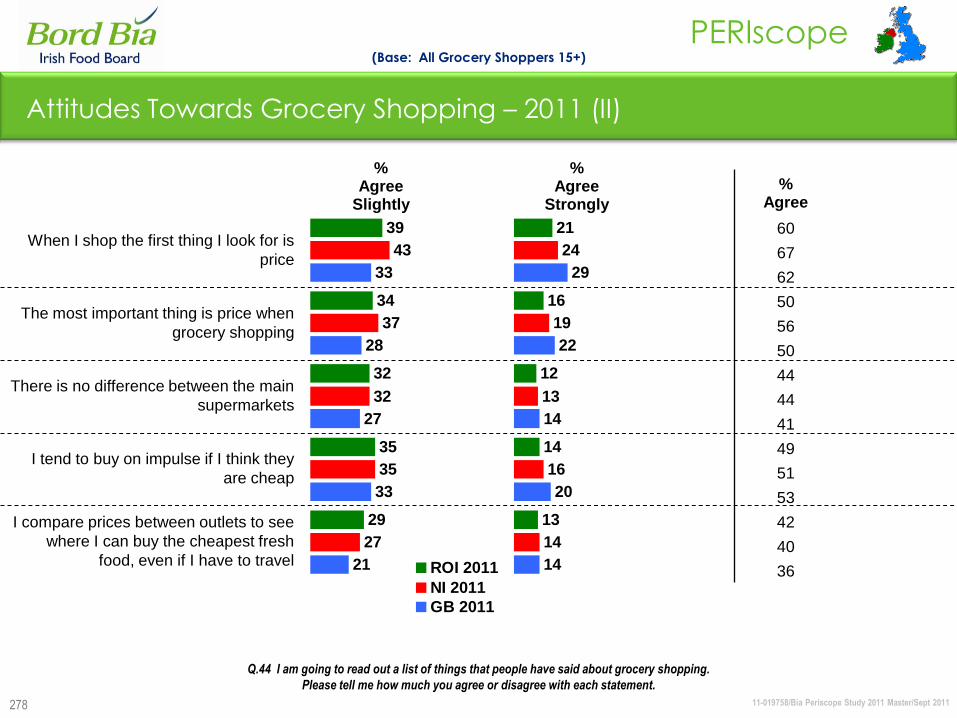
11-019758/Bia Periscope Study 2011 Master/Sept 2011
PERIscope
278
(Base: All Grocery Shoppers 15+)
Q.44 I am going to read out a list of things that people have said about grocery shopping.
Please tell me how much you agree or disagree with each statement.
%Agree
Slightly
%Agree
Strongly
When I shop the first thing I look for is
price
The most important thing is price when
grocery shopping
There is no difference between the main
supermarkets
I tend to buy on impulse if I think they
are cheap
I compare prices between outlets to see
where I can buy the cheapest fresh
food, even if I have to travel
Attitudes Towards Grocery Shopping – 2011 (II)
39
34
32
35
29
43
37
32
35
27
33
28
27
33
21 ROI 2011
NI 2011
GB 2011
21
16
12
14
13
24
19
13
16
14
29
22
14
20
14
%Agree
60
67
62
50
56
50
44
44
41
49
51
53
42
40
36
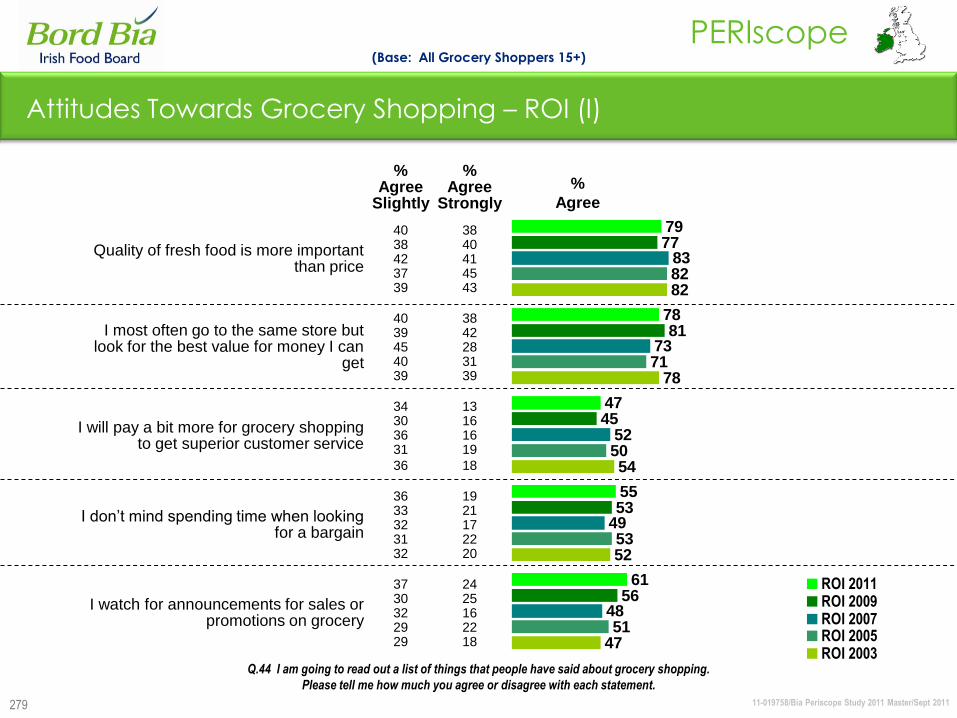
11-019758/Bia Periscope Study 2011 Master/Sept 2011
PERIscope
279
(Base: All Grocery Shoppers 15+)
47
52
54
78
82
51
53
50
71
82
48
49
52
73
83
56
53
45
81
77
61
55
47
78
79
ROI 2011ROI 2009ROI 2007ROI 2005ROI 2003
Q.44 I am going to read out a list of things that people have said about grocery shopping.
Please tell me how much you agree or disagree with each statement.
%Agree
Slightly
%Agree
Strongly
Quality of fresh food is more important than price
40 3838 4042 4137 4539 43
I most often go to the same store but look for the best value for money I can
get
40 3839 4245 2840 3139 39
I will pay a bit more for grocery shopping to get superior customer service
34 1330 1636 1631 19
36 18
I don‟t mind spending time when looking for a bargain
36 1933 2132 1731 2232 20
I watch for announcements for sales or promotions on grocery
37 2430 2532 1629 2229 18
Attitudes Towards Grocery Shopping – ROI (I)
%
Agree
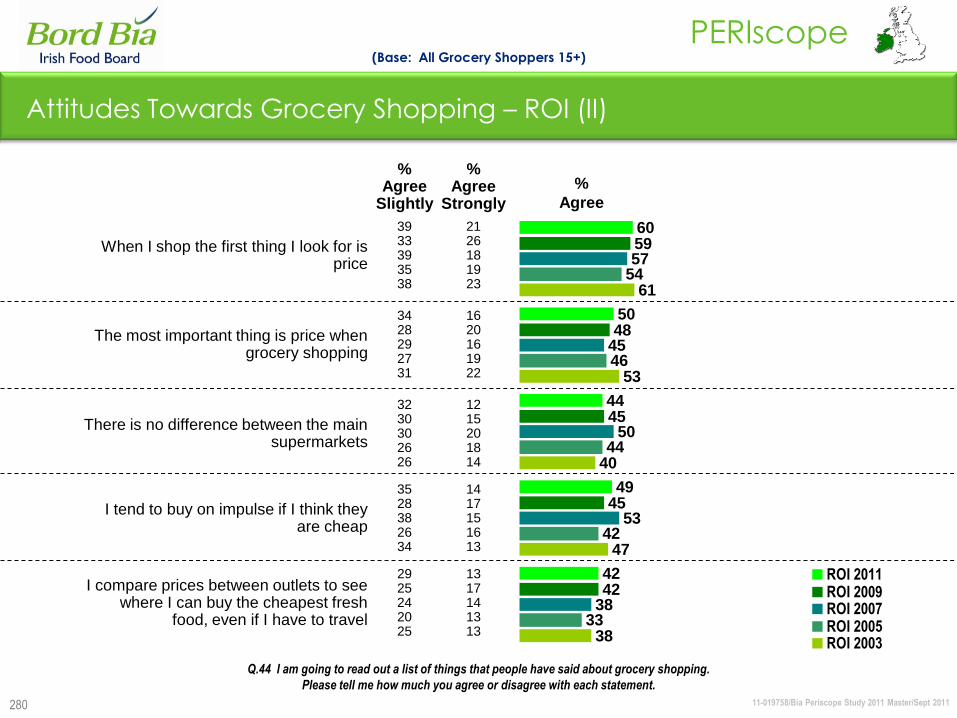
11-019758/Bia Periscope Study 2011 Master/Sept 2011
PERIscope
280
(Base: All Grocery Shoppers 15+)
%
Agree
38
47
40
53
61
33
42
44
46
54
38
53
50
45
57
42
45
45
48
59
42
49
44
50
60
ROI 2011ROI 2009ROI 2007ROI 2005ROI 2003
Q.44 I am going to read out a list of things that people have said about grocery shopping.
Please tell me how much you agree or disagree with each statement.
%Agree
Slightly
%Agree
Strongly
When I shop the first thing I look for is price
39 2133 2639 1835 1938 23
The most important thing is price when grocery shopping
34 1628 2029 1627 1931 22
There is no difference between the main supermarkets
32 1230 1530 2026 1826 14
I tend to buy on impulse if I think they are cheap
35 1428 1738 1526 1634 13
I compare prices between outlets to see where I can buy the cheapest fresh
food, even if I have to travel
29 1325 1724 1420 1325 13
Attitudes Towards Grocery Shopping – ROI (II)
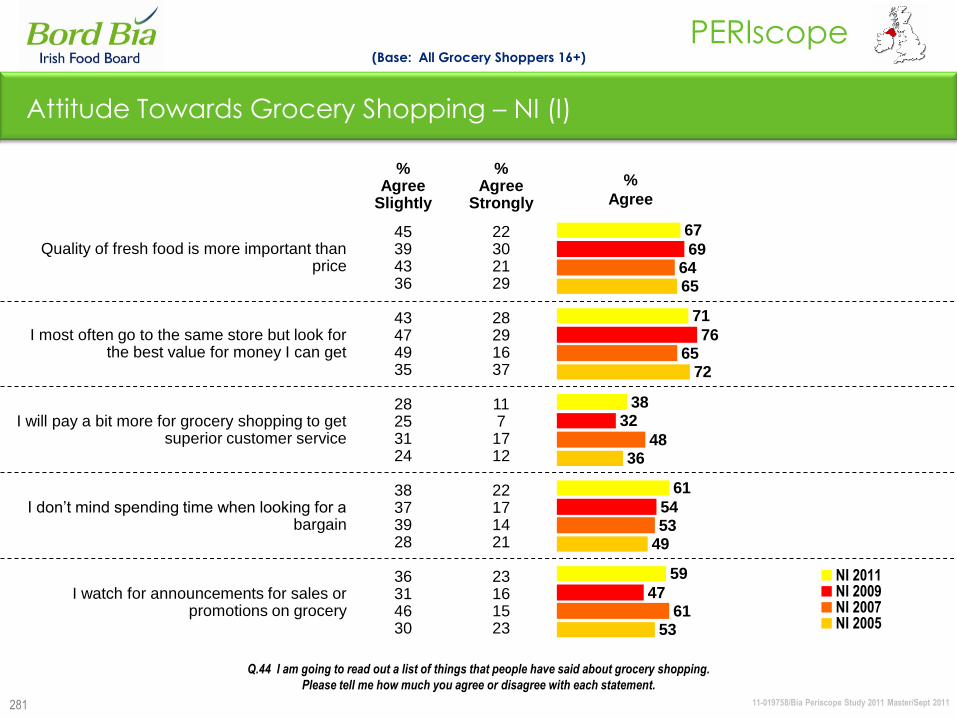
11-019758/Bia Periscope Study 2011 Master/Sept 2011
PERIscope
281
Attitude Towards Grocery Shopping – NI (I)
(Base: All Grocery Shoppers 16+)
%
Agree
Q.44 I am going to read out a list of things that people have said about grocery shopping.
Please tell me how much you agree or disagree with each statement.
%Agree
Slightly
%Agree
Strongly
Quality of fresh food is more important than price
45 2239 3043 2136 29
I most often go to the same store but look for the best value for money I can get
43 2847 2949 1635 37
I will pay a bit more for grocery shopping to get superior customer service
28 1125 731 1724 12
I don‟t mind spending time when looking for a bargain
38 2237 1739 1428 21
I watch for announcements for sales or promotions on grocery
36 2331 1646 1530 23 53
49
36
72
65
61
53
48
65
64
47
54
32
76
69
59
61
38
71
67
NI 2011NI 2009NI 2007NI 2005
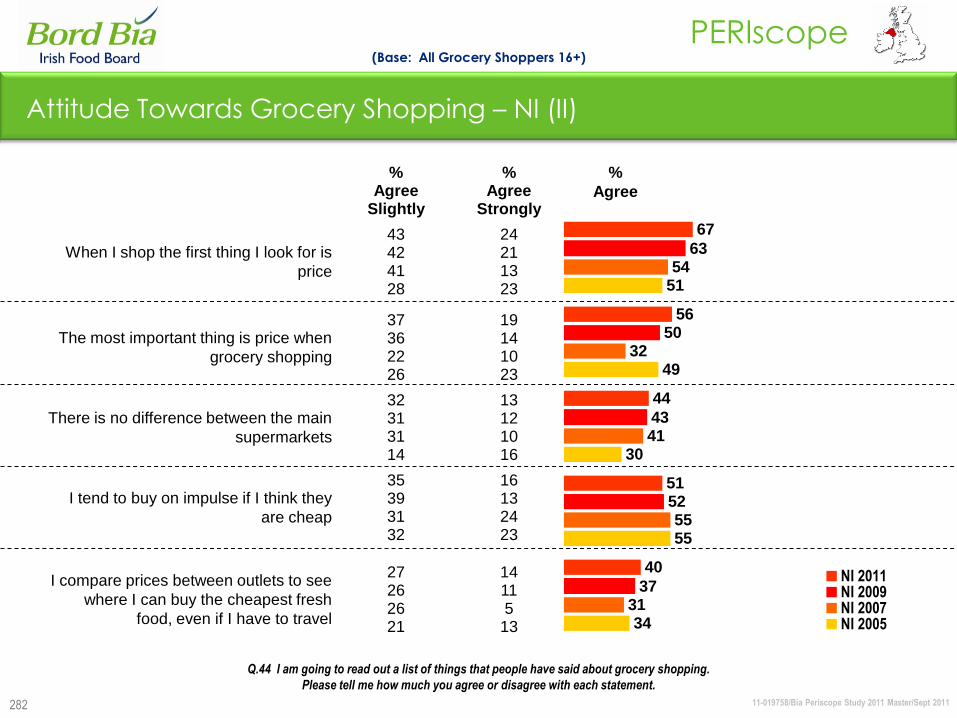
11-019758/Bia Periscope Study 2011 Master/Sept 2011
PERIscope
282
Attitude Towards Grocery Shopping – NI (II)
(Base: All Grocery Shoppers 16+)
Q.44 I am going to read out a list of things that people have said about grocery shopping.
Please tell me how much you agree or disagree with each statement.
%Agree
Slightly
%Agree
Strongly
When I shop the first thing I look for is
price
43 2442 2141 1328 23
The most important thing is price when
grocery shopping
37 1936 1422 1026 23
There is no difference between the main
supermarkets
32 1331 1231 1014 16
I tend to buy on impulse if I think they
are cheap
35 1639 1331 2432 23
I compare prices between outlets to see
where I can buy the cheapest fresh
food, even if I have to travel
27 1426 1126 521 13 34
55
30
49
51
31
55
41
32
54
37
52
43
50
63
40
51
44
56
67
NI 2011NI 2009NI 2007NI 2005
%
Agree
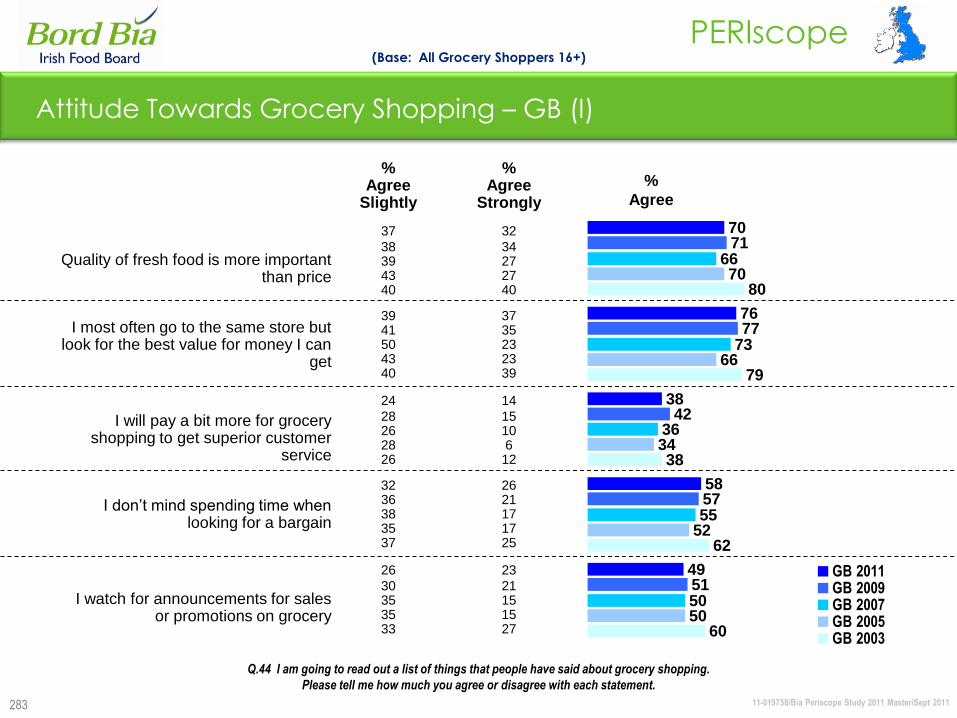
11-019758/Bia Periscope Study 2011 Master/Sept 2011
PERIscope
283
Attitude Towards Grocery Shopping – GB (I)
(Base: All Grocery Shoppers 16+)
60
62
38
79
80
50
52
34
66
70
50
55
36
73
66
51
57
42
77
71
49
58
38
76
70
GB 2011GB 2009GB 2007GB 2005GB 2003
Q.44 I am going to read out a list of things that people have said about grocery shopping.
Please tell me how much you agree or disagree with each statement.
%Agree
Slightly
%Agree
Strongly
37 32
Quality of fresh food is more important than price
38 3439 2743 2740 40
I most often go to the same store but look for the best value for money I can
get
39 3741 3550 2343 2340 39
24 14
I will pay a bit more for grocery shopping to get superior customer
service
28 1526 1028 626 12
I don‟t mind spending time when looking for a bargain
32 2636 2138 1735 1737 25
26 23
I watch for announcements for sales or promotions on grocery
30 2135 1535 1533 27
%
Agree
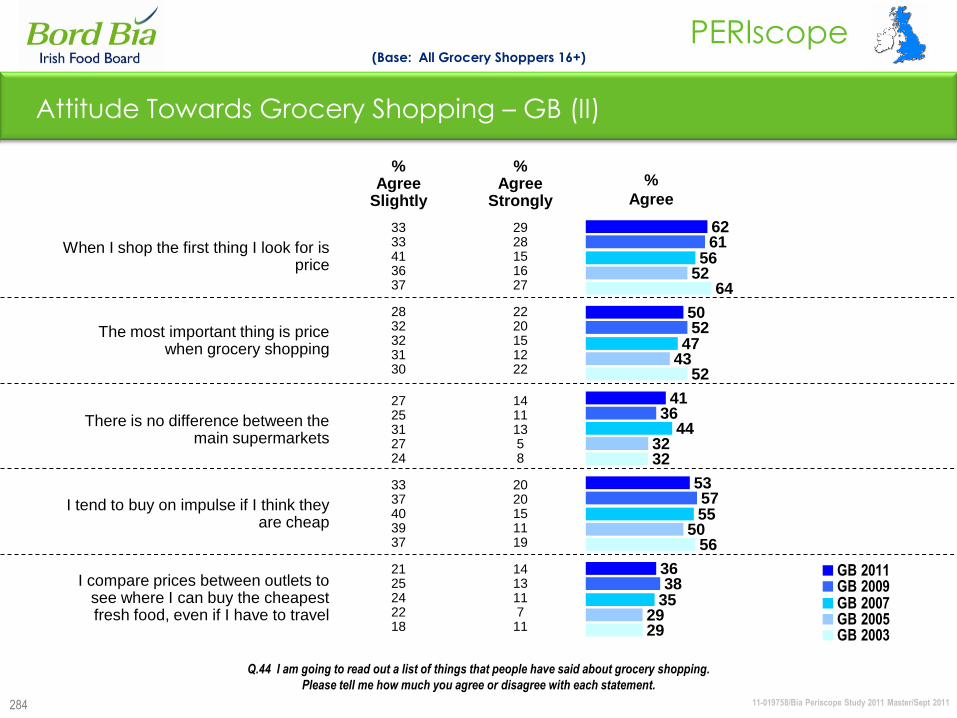
11-019758/Bia Periscope Study 2011 Master/Sept 2011
PERIscope
284
Attitude Towards Grocery Shopping – GB (II)
(Base: All Grocery Shoppers 16+)
Q.44 I am going to read out a list of things that people have said about grocery shopping.
Please tell me how much you agree or disagree with each statement.
%Agree
Slightly
%Agree
Strongly
When I shop the first thing I look for is price
33 2933 2841 1536 1637 27
The most important thing is price when grocery shopping
28 2232 2032 1531 1230 22
There is no difference between the main supermarkets
27 1425 1131 1327 524 8
I tend to buy on impulse if I think they are cheap
33 2037 2040 1539 1137 19
I compare prices between outlets to see where I can buy the cheapest fresh food, even if I have to travel
21 1425 1324 1122 718 11 29
56
32
52
64
29
50
32
43
52
35
55
44
47
56
38
57
36
52
61
36
53
41
50
62
GB 2011GB 2009GB 2007GB 2005GB 2003
%
Agree
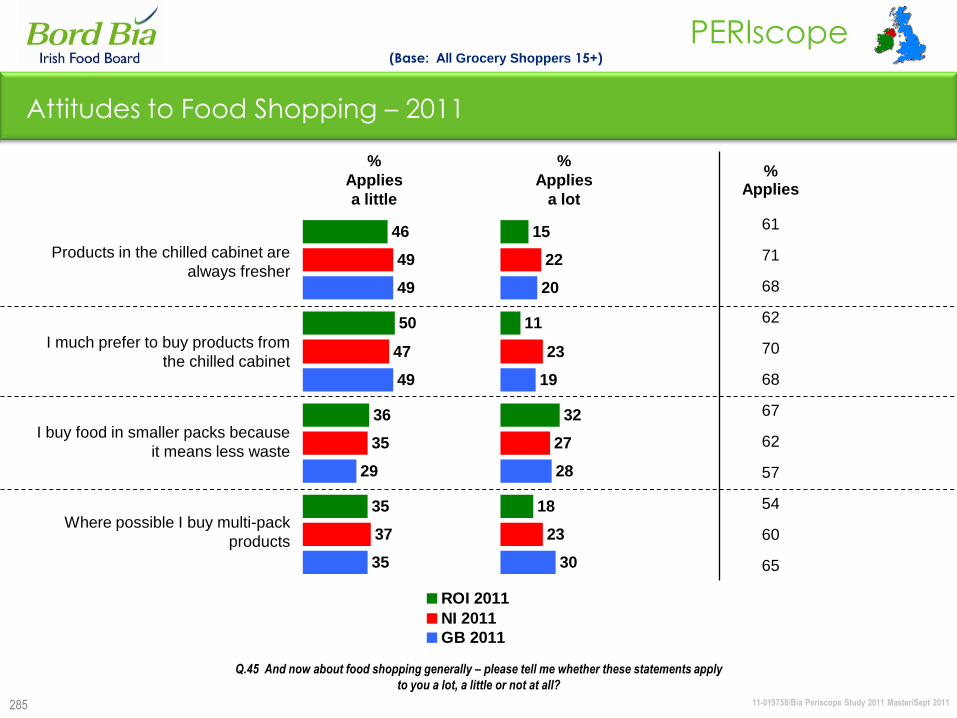
11-019758/Bia Periscope Study 2011 Master/Sept 2011
PERIscope
285
Attitudes to Food Shopping – 2011
(Base: All Grocery Shoppers 15+)
Products in the chilled cabinet are
always fresher
I much prefer to buy products from
the chilled cabinet
I buy food in smaller packs because
it means less waste
Where possible I buy multi-pack
products
%
Applies
a little
%
Applies
a lot
46
50
36
35
49
47
35
37
49
49
29
35
ROI 2011
NI 2011
GB 2011
15
11
32
18
22
23
27
23
20
19
28
30
Q.45 And now about food shopping generally – please tell me whether these statements apply
to you a lot, a little or not at all?
%Applies
61
71
68
62
70
68
67
62
57
54
60
65

11-019758/Bia Periscope Study 2011 Master/Sept 2011
PERIscope
286
%
Applies
%Applies a little
%Applies
a lot
Products in the chilled cabinet are always fresher
46 1545 1745 2842 3051 2331 11
I much prefer to buy products from the chilled cabinet
50 1141 1547 2343 2846 2032 8
I buy food in smaller packs because it means less waste
36 3231 3328 3530 3837 3728 37
Where possible I buy multi-pack products
35 18
33 2636 3033 3335 1332 12
Attitudes Towards Food Shopping – ROI
(*ROI 2007 figures taken from all adults base)
Q.45 And now about food shopping generally – please tell me whether these statements apply
to you a lot, a little or not at all?
44
65
40
42
48
74
66
74
66
68
71
72
66
63
70
73
54
67
62
61
59
65
56
61
ROI 2011ROI 2009ROI 2007ROI 2005ROI 2003ROI 2001
(Base: All Grocery Shoppers 15+)

11-019758/Bia Periscope Study 2011 Master/Sept 2011
PERIscope
287
%Applies a little
%Applies
a lot
Products in the chilled cabinet are
always fresher
49 22
52 21
61 8
49 24
I much prefer to buy products from the
chilled cabinet
47 23
52 20
59 13
53 24
I buy food in smaller packs because it
means less waste
35 27
34 30
49 20
34 26
Where possible I buy multi-pack
products
37 23
44 23
55 19
35 28
Attitudes Towards Food Shopping – NI
(*ROI 2007 figures taken from all adults base)
Q.45 And now about food shopping generally – please tell me whether these statements apply
to you a lot, a little or not at all?
63
60
77
73
74
69
72
69
67
64
72
74
60
62
70
71
NI 2011
NI 2009
NI 2007
NI 2005
(Base: All Grocery Shoppers 16+)
%
Applies
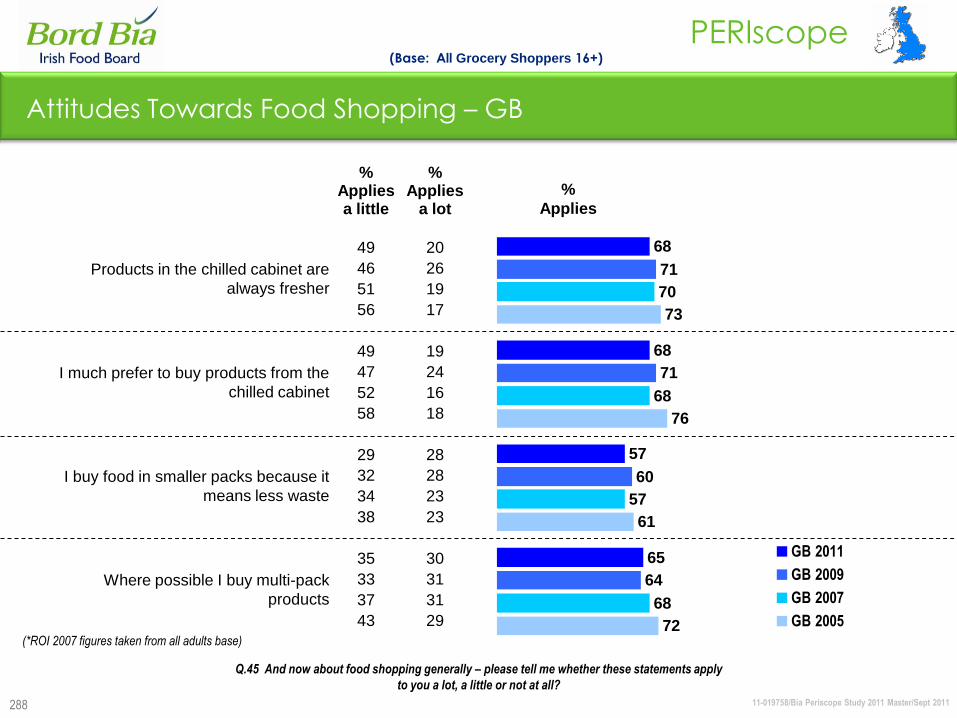
11-019758/Bia Periscope Study 2011 Master/Sept 2011
PERIscope
288
%Applies a little
%Applies
a lot
Products in the chilled cabinet are
always fresher
49 20
46 26
51 19
56 17
I much prefer to buy products from the
chilled cabinet
49 19
47 24
52 16
58 18
I buy food in smaller packs because it
means less waste
29 28
32 28
34 23
38 23
Where possible I buy multi-pack
products
35 30
33 31
37 31
43 29
Attitudes Towards Food Shopping – GB
(*ROI 2007 figures taken from all adults base)
Q.45 And now about food shopping generally – please tell me whether these statements apply
to you a lot, a little or not at all?
72
61
76
73
68
57
68
70
64
60
71
71
65
57
68
68
GB 2011
GB 2009
GB 2007
GB 2005
(Base: All Grocery Shoppers 16+)
%
Applies
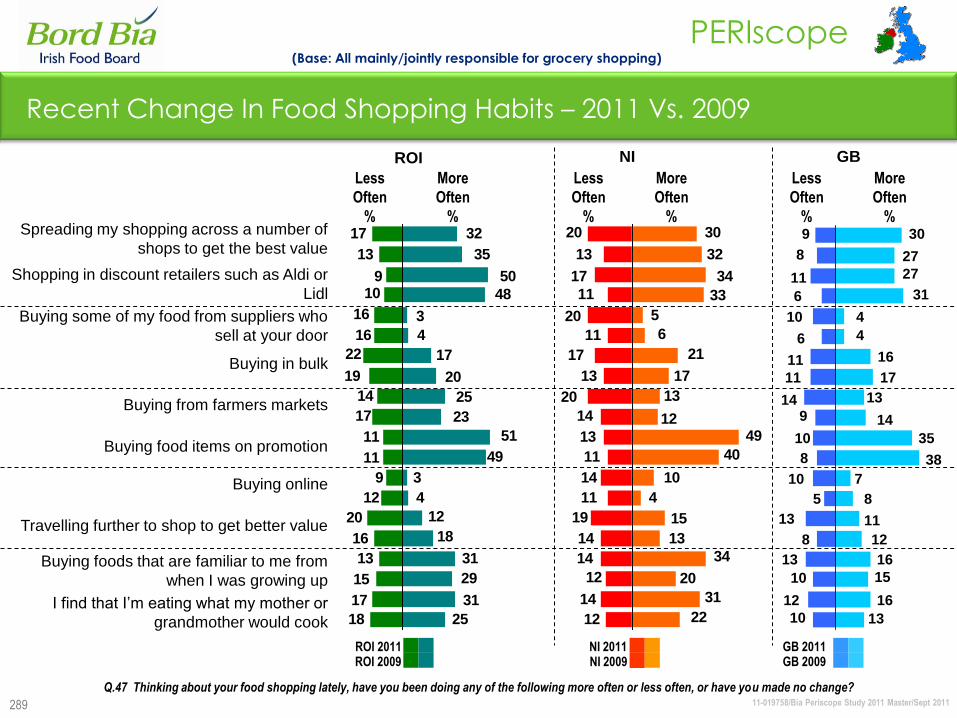
11-019758/Bia Periscope Study 2011 Master/Sept 2011
PERIscope
289
14
14
12
14
12
19
14
11
13
11
14
20
13
17
11
20
11
17
13
20
22
31
20
34
30
32
4
13
15
10
40
49
17
21
6
5
33
34
13
12
Recent Change In Food Shopping Habits – 2011 Vs. 2009
(Base: All mainly/jointly responsible for grocery shopping)
10
12
10
13
8
13
10
8
10
5
914
11
11
6
10
6
11
8
9
13
16
15
16
30
27
8
12
11
7
38
35
17
16
4
4
31
27
13
14
Q.47 Thinking about your food shopping lately, have you been doing any of the following more often or less often, or have you made no change?
Spreading my shopping across a number of
shops to get the best value
Shopping in discount retailers such as Aldi or
Lidl
Buying some of my food from suppliers who
sell at your door
Buying in bulk
Buying from farmers markets
Buying food items on promotion
Buying online
Travelling further to shop to get better value
Buying foods that are familiar to me from
when I was growing up
I find that I‟m eating what my mother or
grandmother would cook
17
14
19
22
16
16
109
13
17
11
11
9
12
16
20
13
15
17
18
3
4
49
51
23
25
20
17
4
3
48
50
35
32
25
31
29
31
18
12
Less
Often
%
More
Often
%
Less
Often
%
More
Often
%
Less
Often
%
More
Often
%
ROI NI GB
ROI 2011ROI 2009
NI 2011NI 2009
GB 2011GB 2009

11-019758/Bia Periscope Study 2011 Master/Sept 2011
PERIscope
290
Importance of Food Labels when Shopping – 2011 (I)
Fresh Natural Grown without pesticides
71
50 5143
32 32
45
30 30
18
35 3037
48
35
29
4233
612
9 12 15
17
18 22
22
3 39 7 5
157 6
15
ROI
2011
NI
2011
GB
2011
ROI
2011
NI
2011
GB
2011
ROI
2011
NI
2011
GB
2011
Very important
Fairly important
Neither/nor
Not at all important
Q.64 When shopping for foods, how important or not are the following statements on labels?
(Base: All Adults 15+)

11-019758/Bia Periscope Study 2011 Master/Sept 2011
PERIscope
291
Importance of Food Labels when Shopping – 2011 (II)
Good source of calcium Helps build strong bones 20% less fat
3529 25
3429 25
37
2530
41
42
37
3741
36
3346 35
16 23
22
19 23
23
22 22
20
7 516
8 616
7 614
ROI
2011
NI
2011
GB
2011
ROI
2011
NI
2011
GB
2011
ROI
2011
NI
2011
GB
2011
Very important
Fairly important
Neither/nor
Not at all important
Q.64 When shopping for foods, how important or not are the following statements on labels?
(Base: All Adults 15+)
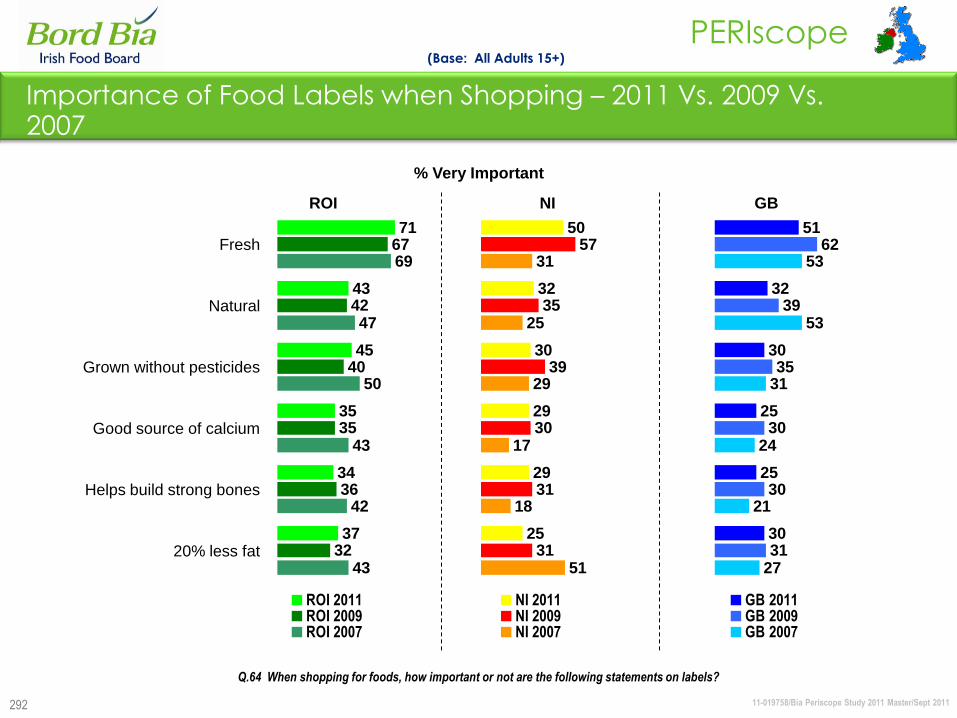
11-019758/Bia Periscope Study 2011 Master/Sept 2011
PERIscope
292
43
42
43
50
47
69
32
36
35
40
42
67
37
34
35
45
43
71
ROI 2011ROI 2009ROI 2007
ROI
Importance of Food Labels when Shopping – 2011 Vs. 2009 Vs. 2007
(Base: All Adults 15+)
NI GB
% Very Important
Fresh
Natural
Grown without pesticides
Good source of calcium
Helps build strong bones
20% less fat51
18
17
29
25
31
31
31
30
39
35
57
25
29
29
30
32
50
NI 2011NI 2009NI 2007
27
21
24
31
53
53
31
30
30
35
39
62
30
25
25
30
32
51
GB 2011GB 2009GB 2007
Q.64 When shopping for foods, how important or not are the following statements on labels?
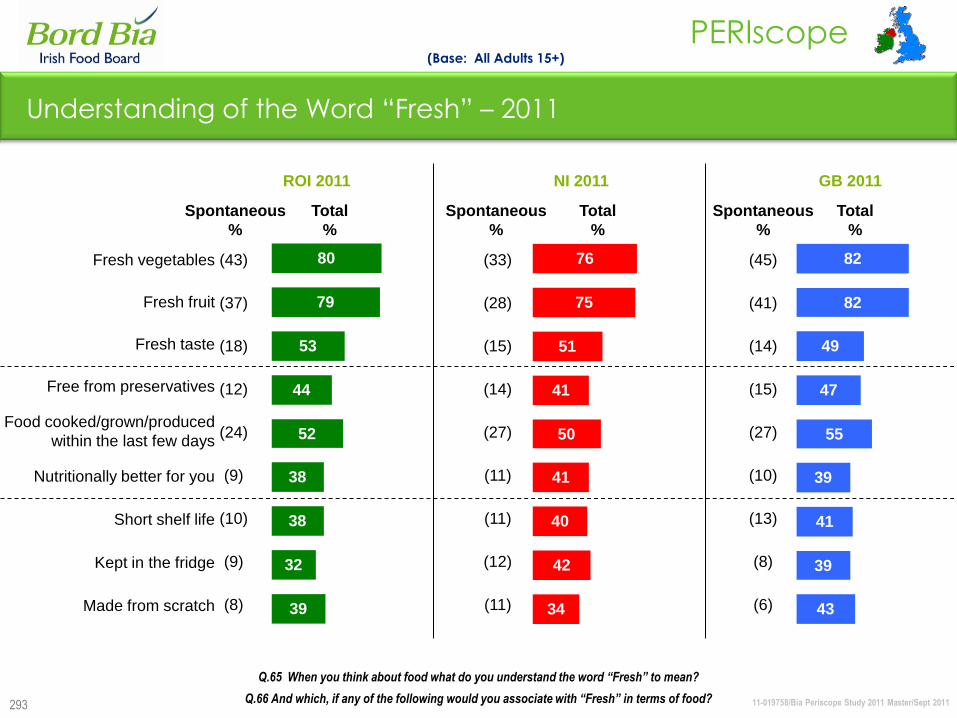
11-019758/Bia Periscope Study 2011 Master/Sept 2011
PERIscope
293
76
75
51
41
50
41
40
42
34
Understanding of the Word “Fresh” – 2011
Fresh vegetables
Fresh fruit
Fresh taste
Free from preservatives
Food cooked/grown/produced
within the last few days
Nutritionally better for you
Short shelf life
Kept in the fridge
Made from scratch
(Base: All Adults 15+)
80
79
53
44
52
38
38
32
39
Q.65 When you think about food what do you understand the word “Fresh” to mean?
Spontaneous
%
Total
%
ROI 2011
Spontaneous
%
Total
%
NI 2011
Spontaneous
%
Total
%
GB 2011
Q.66 And which, if any of the following would you associate with “Fresh” in terms of food?
(43)
(37)
(18)
(12)
(24)
(9)
(10)
(9)
(8)
82
82
49
47
55
39
41
39
43
(33)
(28)
(15)
(14)
(27)
(11)
(11)
(12)
(11)
(45)
(41)
(14)
(15)
(27)
(10)
(13)
(8)
(6)
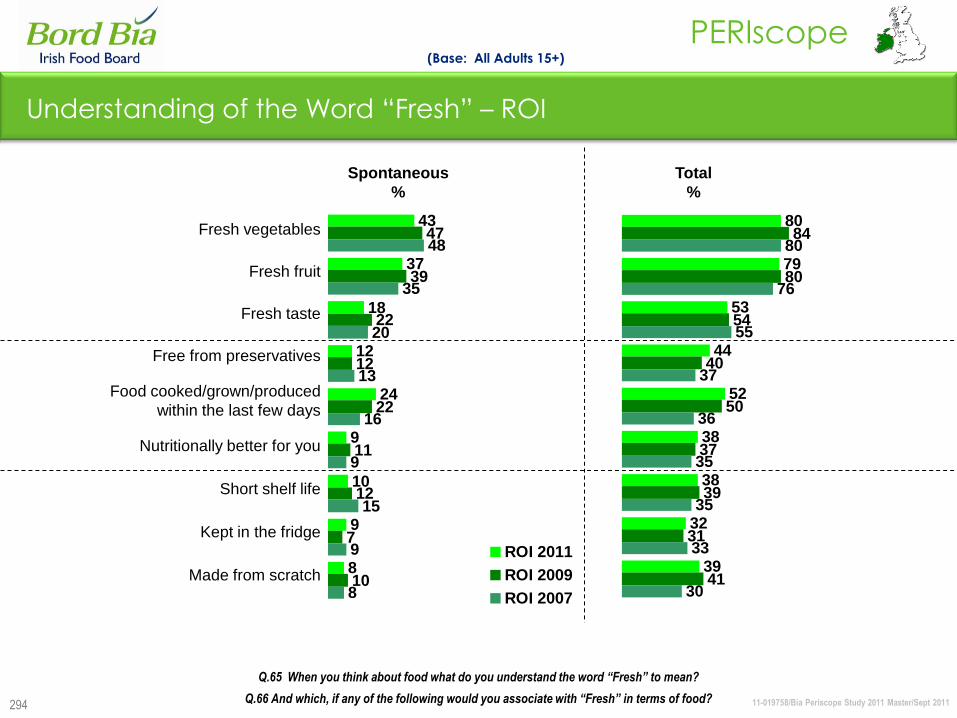
11-019758/Bia Periscope Study 2011 Master/Sept 2011
PERIscope
294
Understanding of the Word “Fresh” – ROI
Fresh vegetables
Fresh fruit
Fresh taste
Free from preservatives
Food cooked/grown/produced
within the last few days
Nutritionally better for you
Short shelf life
Kept in the fridge
Made from scratch
(Base: All Adults 15+)
43
37
18
12
24
9
10
9
8
47
39
22
12
22
11
12
7
10
48
35
20
13
16
9
15
9
8
ROI 2011
ROI 2009
ROI 2007
Q.65 When you think about food what do you understand the word “Fresh” to mean?
Spontaneous
%
Total
%
Q.66 And which, if any of the following would you associate with “Fresh” in terms of food?
80
79
53
44
52
38
38
32
39
84
80
54
40
50
37
39
31
41
80
76
55
37
36
35
35
33
30
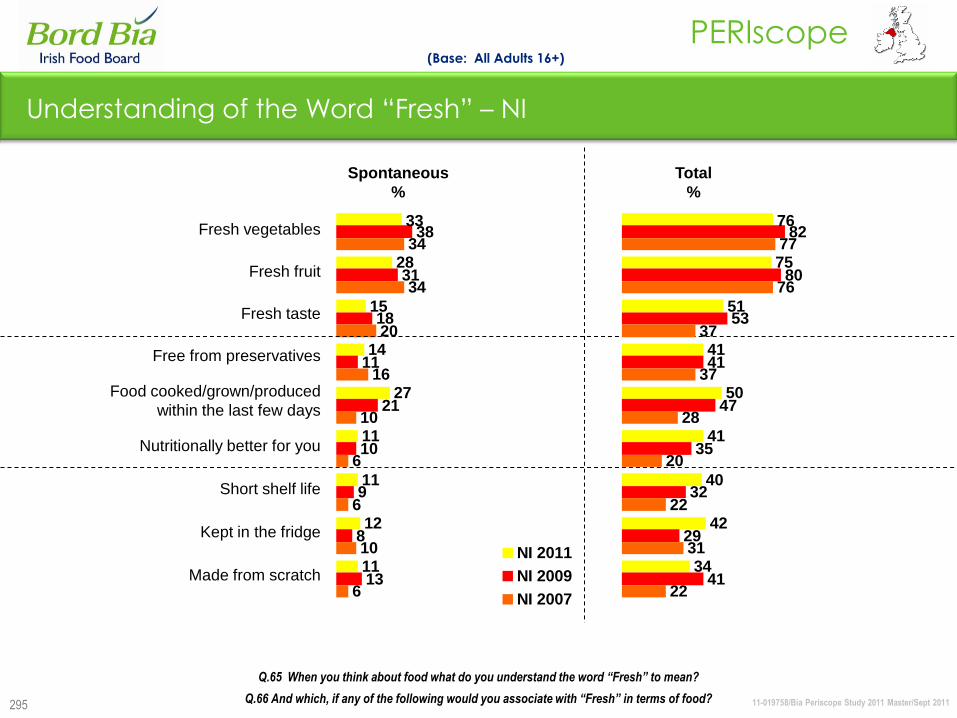
11-019758/Bia Periscope Study 2011 Master/Sept 2011
PERIscope
295
Understanding of the Word “Fresh” – NI
Fresh vegetables
Fresh fruit
Fresh taste
Free from preservatives
Food cooked/grown/produced
within the last few days
Nutritionally better for you
Short shelf life
Kept in the fridge
Made from scratch
(Base: All Adults 16+)
33
28
15
14
27
11
11
12
11
38
31
18
11
21
10
9
8
13
34
34
20
16
10
6
6
10
6
NI 2011
NI 2009
NI 2007
Q.65 When you think about food what do you understand the word “Fresh” to mean?
Spontaneous
%
Total
%
Q.66 And which, if any of the following would you associate with “Fresh” in terms of food?
76
75
51
41
50
41
40
42
34
82
80
53
41
47
35
32
29
41
77
76
37
37
28
20
22
31
22
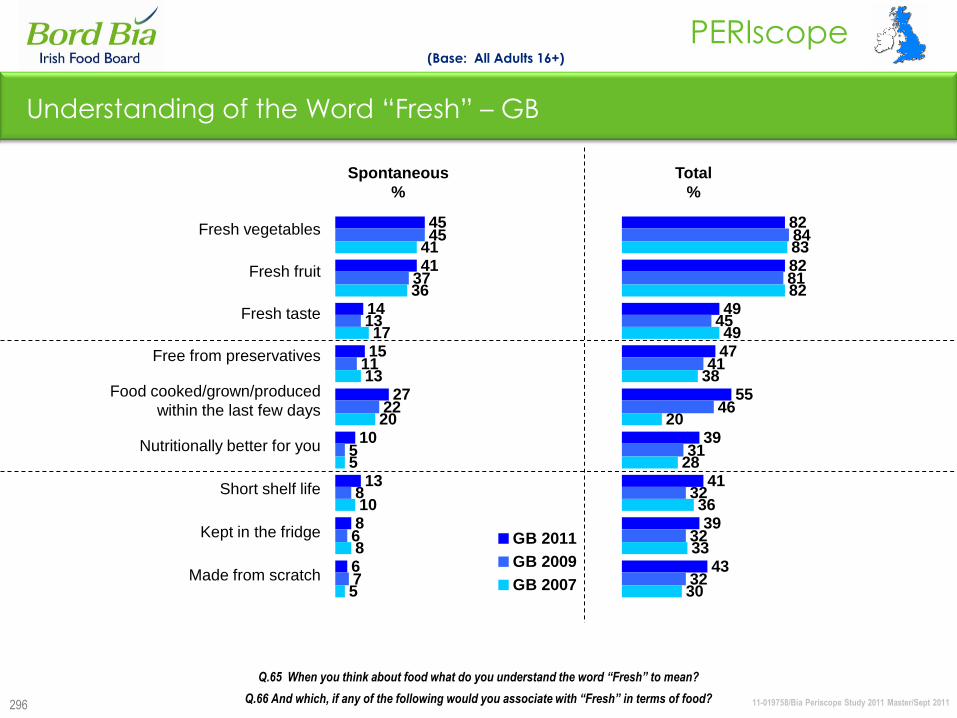
11-019758/Bia Periscope Study 2011 Master/Sept 2011
PERIscope
296
Understanding of the Word “Fresh” – GB
Fresh vegetables
Fresh fruit
Fresh taste
Free from preservatives
Food cooked/grown/produced
within the last few days
Nutritionally better for you
Short shelf life
Kept in the fridge
Made from scratch
(Base: All Adults 16+)
45
41
14
15
27
10
13
8
6
45
37
13
11
22
5
8
6
7
41
36
17
13
20
5
10
8
5
GB 2011
GB 2009
GB 2007
Q.65 When you think about food what do you understand the word “Fresh” to mean?
Spontaneous
%
Total
%
Q.66 And which, if any of the following would you associate with “Fresh” in terms of food?
82
82
49
47
55
39
41
39
43
84
81
45
41
46
31
32
32
32
83
82
49
38
20
28
36
33
30

11-019758/Bia Periscope Study 2011 Master/Sept 2011
PERIscope
297
Understanding of the Word “Natural” – 2011
No artificial ingredients/
preservatives/colours
Natural ingredients
From nature
Natural colour
Not fortified with additional
ingredients
Nutritionally better for you
Produced organically
Produced locally
(Base: All Adults 15+)
Q.67 When you think about food what do you understand the word “Natural” to mean?
Q.68 And which, if any of the following would you associate with “Natural” in terms of food?
ROI 2011 NI 2011 GB 2011
75
74
49
39
37
42
33
37
Spontaneous
%
Total
%
Spontaneous
%
Total
%
Spontaneous
%
Total
%
(43)
(36)
(18)
(7)
(9)
(12)
(10)
(10)
70
68
48
45
45
47
23
32
78
74
47
49
49
38
36
29
(45)
(22)
(19)
(8)
(17)
(10)
(5)
(9)
(48)
(33)
(13)
(13)
(14 )
(8)
(6)
(3)
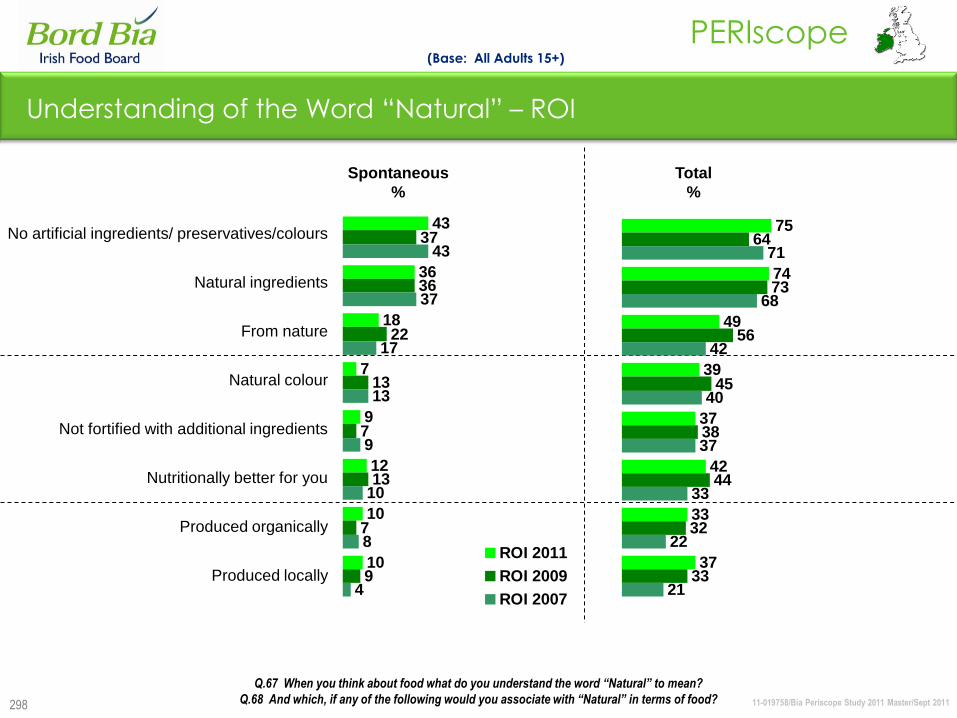
11-019758/Bia Periscope Study 2011 Master/Sept 2011
PERIscope
298
Understanding of the Word “Natural” – ROI
(Base: All Adults 15+)
43
36
18
7
9
12
10
10
37
36
22
13
7
13
7
9
43
37
17
13
9
10
8
4
ROI 2011
ROI 2009
ROI 2007
Spontaneous
%
Total
%
75
74
49
39
37
42
33
37
64
73
56
45
38
44
32
33
71
68
42
40
37
33
22
21
Q.67 When you think about food what do you understand the word “Natural” to mean?
Q.68 And which, if any of the following would you associate with “Natural” in terms of food?
No artificial ingredients/ preservatives/colours
Natural ingredients
From nature
Natural colour
Not fortified with additional ingredients
Nutritionally better for you
Produced organically
Produced locally
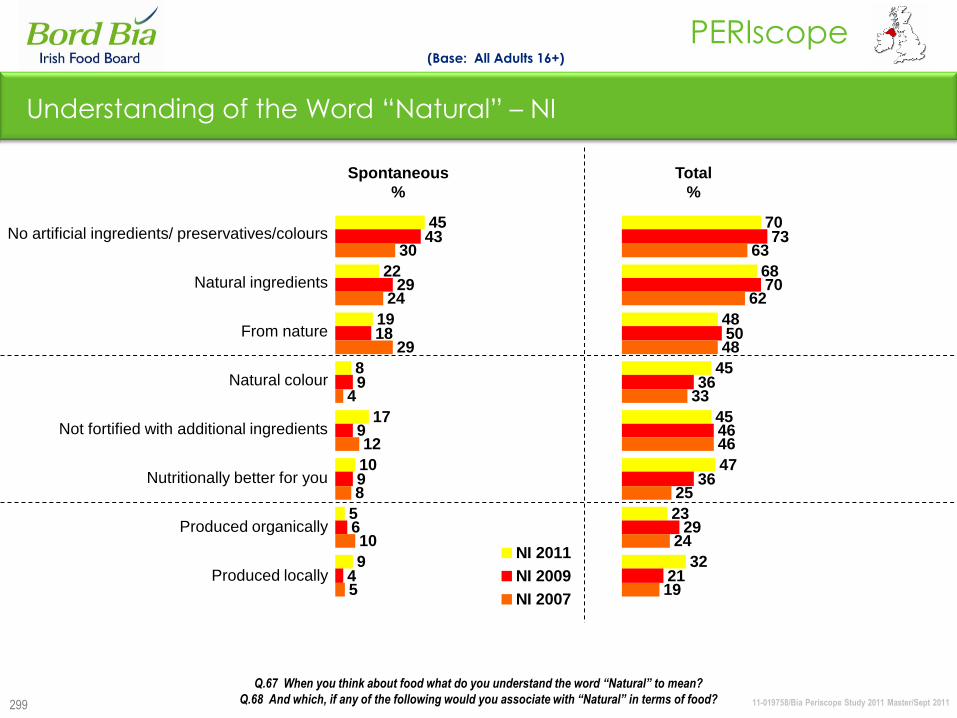
11-019758/Bia Periscope Study 2011 Master/Sept 2011
PERIscope
299
Understanding of the Word “Natural” – NI
(Base: All Adults 16+)
45
22
19
8
17
10
5
9
43
29
18
9
9
9
6
4
30
24
29
4
12
8
10
5
NI 2011
NI 2009
NI 2007
Spontaneous
%
Total
%
70
68
48
45
45
47
23
32
73
70
50
36
46
36
29
21
63
62
48
33
46
25
24
19
Q.67 When you think about food what do you understand the word “Natural” to mean?
Q.68 And which, if any of the following would you associate with “Natural” in terms of food?
No artificial ingredients/ preservatives/colours
Natural ingredients
From nature
Natural colour
Not fortified with additional ingredients
Nutritionally better for you
Produced organically
Produced locally
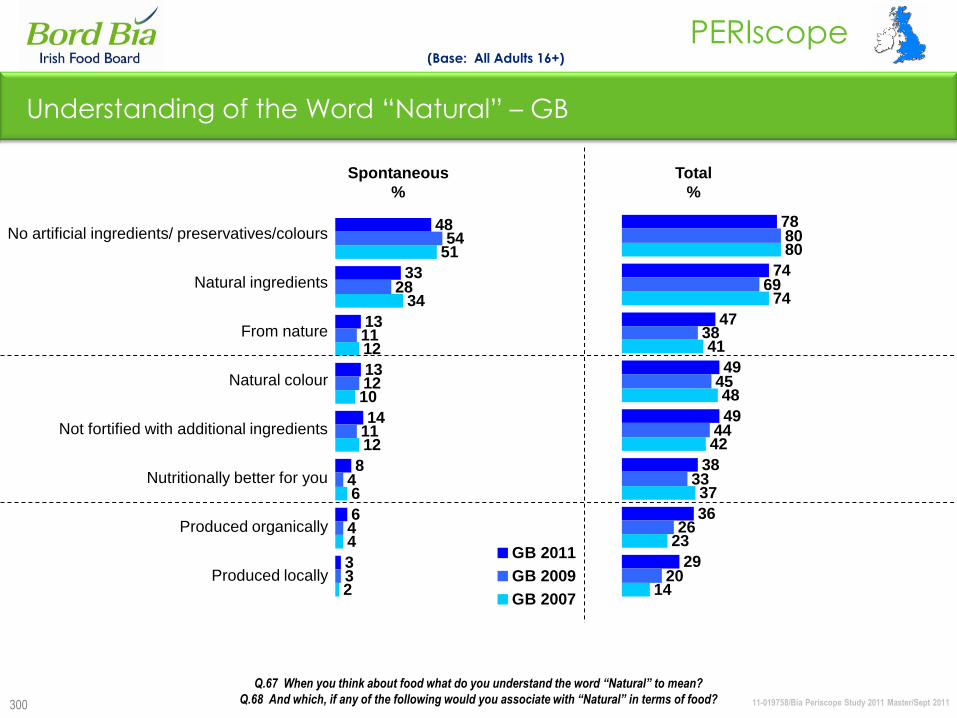
11-019758/Bia Periscope Study 2011 Master/Sept 2011
PERIscope
300
Understanding of the Word “Natural” – GB
(Base: All Adults 16+)
48
33
13
13
14
8
6
3
54
28
11
12
11
4
4
3
51
34
12
10
12
6
4
2
GB 2011
GB 2009
GB 2007
Spontaneous
%
Total
%
78
74
47
49
49
38
36
29
80
69
38
45
44
33
26
20
80
74
41
48
42
37
23
14
Q.67 When you think about food what do you understand the word “Natural” to mean?
Q.68 And which, if any of the following would you associate with “Natural” in terms of food?
No artificial ingredients/ preservatives/colours
Natural ingredients
From nature
Natural colour
Not fortified with additional ingredients
Nutritionally better for you
Produced organically
Produced locally
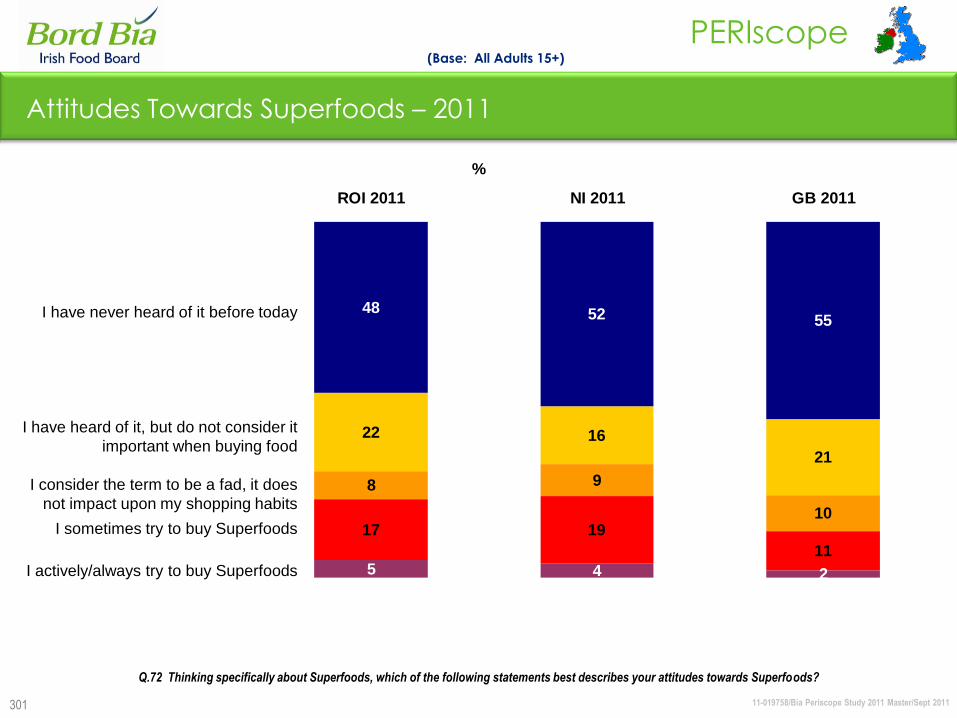
11-019758/Bia Periscope Study 2011 Master/Sept 2011
PERIscope
301
Attitudes Towards Superfoods – 2011
-
Q.72 Thinking specifically about Superfoods, which of the following statements best describes your attitudes towards Superfoods?
I have never heard of it before today
I have heard of it, but do not consider it
important when buying food
I consider the term to be a fad, it does
not impact upon my shopping habits
I sometimes try to buy Superfoods
I actively/always try to buy Superfoods
(Base: All Adults 15+)
48 52 55
22 16
21
8 9
1017 19
115 4 2
ROI 2011 NI 2011 GB 2011
%
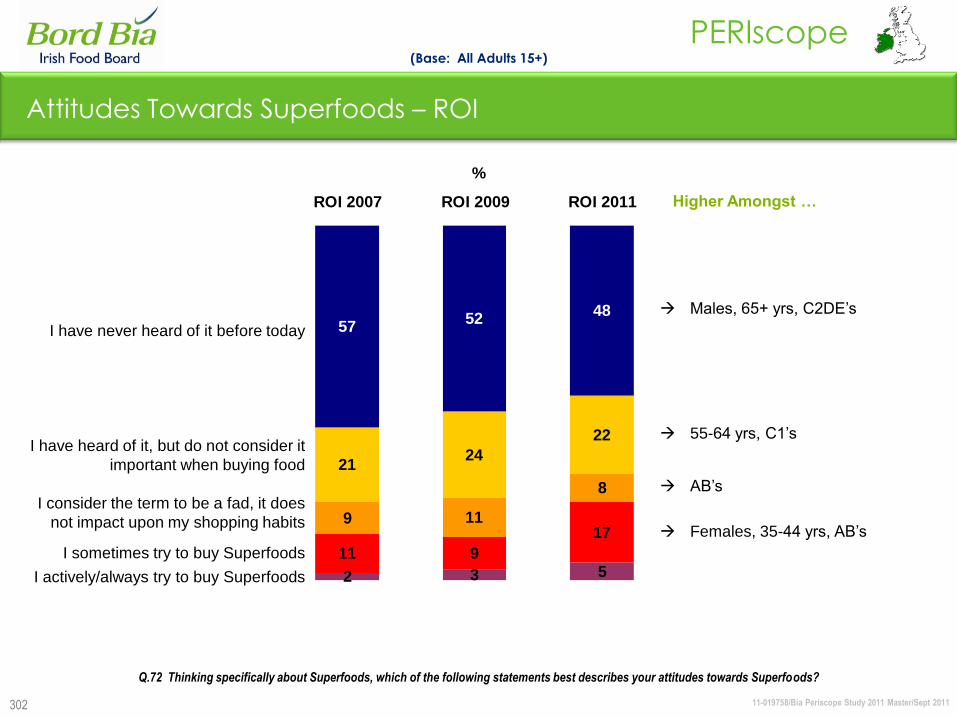
11-019758/Bia Periscope Study 2011 Master/Sept 2011
PERIscope
302
Attitudes Towards Superfoods – ROI
Higher Amongst …
%
(Base: All Adults 15+)
I have never heard of it before today
I have heard of it, but do not consider it
important when buying food
I consider the term to be a fad, it does
not impact upon my shopping habits
I sometimes try to buy Superfoods
I actively/always try to buy Superfoods
Males, 65+ yrs, C2DE‟s
55-64 yrs, C1‟s
AB‟s
Females, 35-44 yrs, AB‟s
Q.72 Thinking specifically about Superfoods, which of the following statements best describes your attitudes towards Superfoods?
5748
21
22
9
8
11
17
2 5
52
24
11
9
3
ROI 2007 ROI 2009 ROI 2011
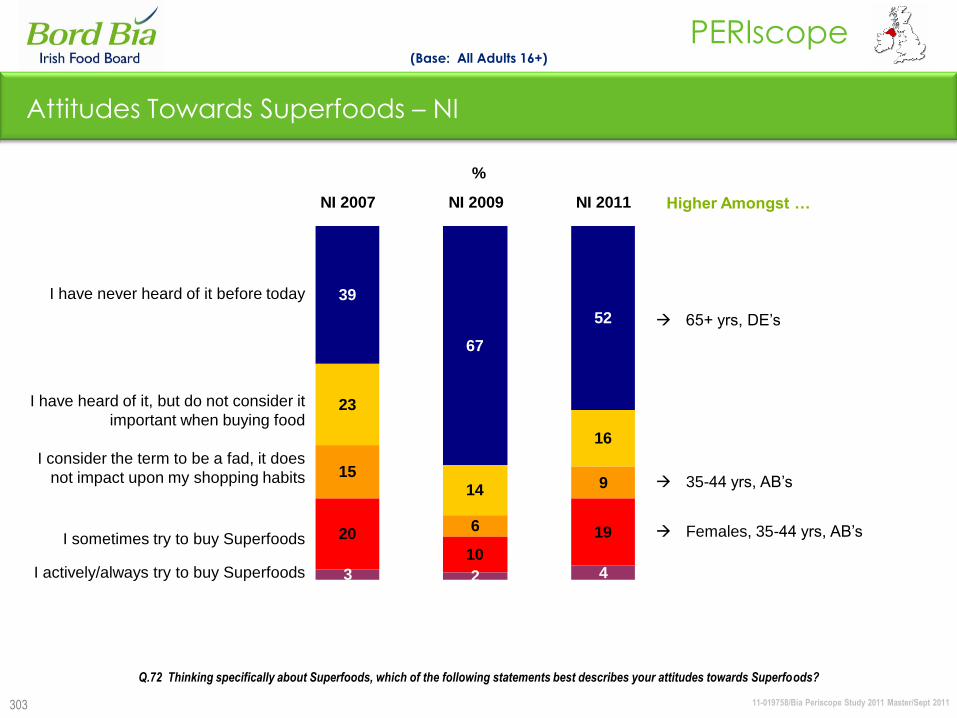
11-019758/Bia Periscope Study 2011 Master/Sept 2011
PERIscope
303
39
67
52
23
14
16
15
6
9
20
10
19
3 2 4
NI 2007 NI 2009 NI 2011
Attitudes Towards Superfoods – NI
Higher Amongst …
%
(Base: All Adults 16+)
Q.72 Thinking specifically about Superfoods, which of the following statements best describes your attitudes towards Superfoods?
65+ yrs, DE‟s
35-44 yrs, AB‟s
Females, 35-44 yrs, AB‟s
I have never heard of it before today
I have heard of it, but do not consider it
important when buying food
I consider the term to be a fad, it does
not impact upon my shopping habits
I sometimes try to buy Superfoods
I actively/always try to buy Superfoods
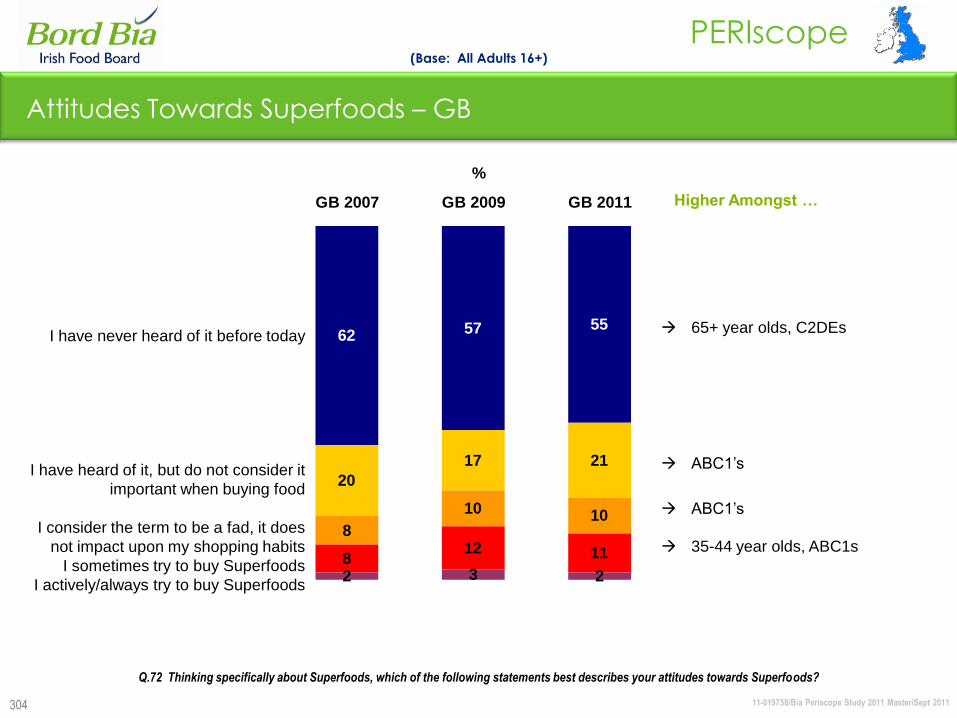
11-019758/Bia Periscope Study 2011 Master/Sept 2011
PERIscope
304
Attitudes Towards Superfoods – GB
Higher Amongst …
62 57 55
20
17 21
8
10 10
812 11
2 3 2
GB 2007 GB 2009 GB 2011
%
(Base: All Adults 16+)
I have never heard of it before today
I have heard of it, but do not consider it
important when buying food
I consider the term to be a fad, it does
not impact upon my shopping habits
I sometimes try to buy Superfoods
I actively/always try to buy Superfoods
65+ year olds, C2DEs
ABC1‟s
ABC1‟s
35-44 year olds, ABC1s
Q.72 Thinking specifically about Superfoods, which of the following statements best describes your attitudes towards Superfoods?
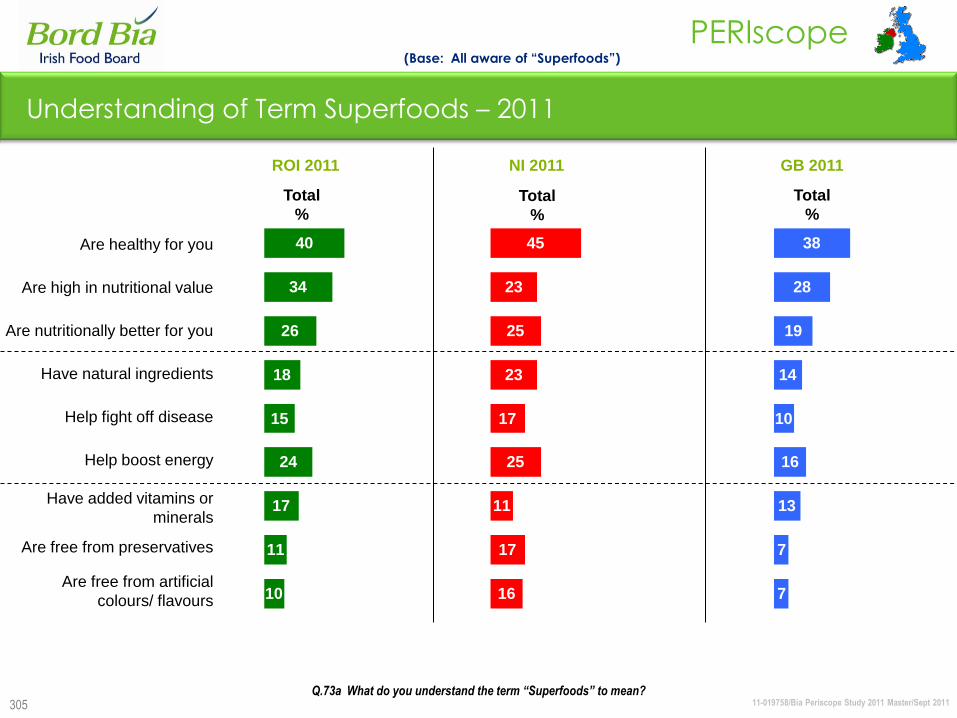
11-019758/Bia Periscope Study 2011 Master/Sept 2011
PERIscope
305
Understanding of Term Superfoods – 2011
(Base: All aware of “Superfoods”)
Are healthy for you
Are high in nutritional value
Are nutritionally better for you
Have natural ingredients
Help fight off disease
Help boost energy
Have added vitamins or
minerals
Are free from preservatives
Are free from artificial
colours/ flavours
ROI 2011 NI 2011 GB 2011
Q.73a What do you understand the term “Superfoods” to mean?
Total
%Total
%
Total
%
40
34
26
18
15
24
17
11
10
45
23
25
23
17
25
11
17
16
38
28
19
14
10
16
13
7
7
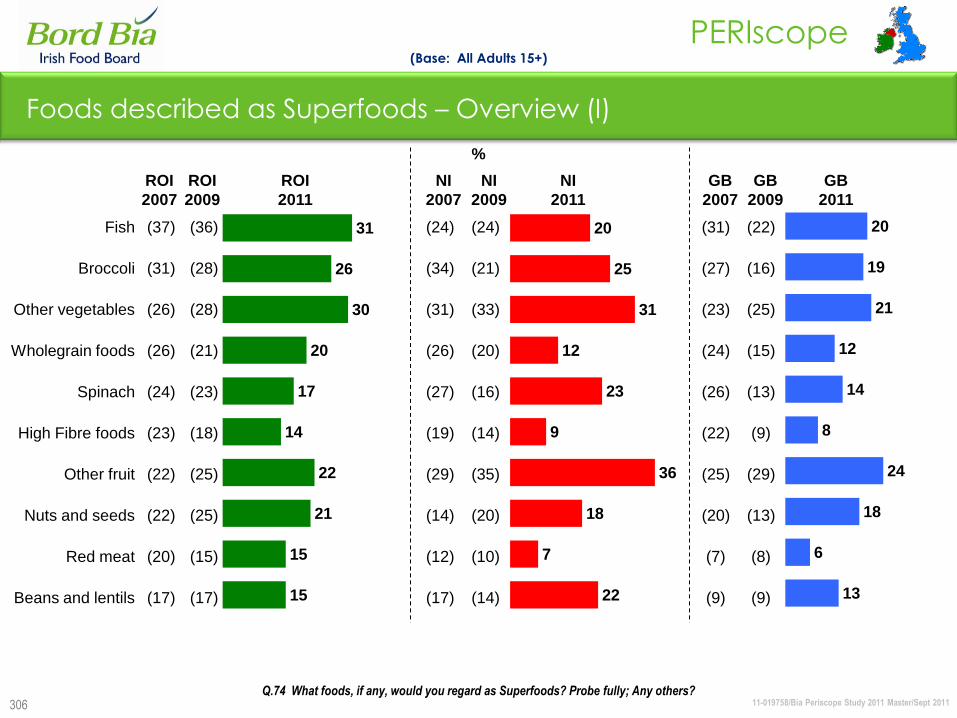
11-019758/Bia Periscope Study 2011 Master/Sept 2011
PERIscope
306
Foods described as Superfoods – Overview (I)
(Base: All Adults 15+)
31
26
30
20
17
14
22
21
15
15
Fish
Broccoli
Other vegetables
Wholegrain foods
Spinach
High Fibre foods
Other fruit
Nuts and seeds
Red meat
Beans and lentils
ROI
2011
20
25
31
12
23
9
36
18
7
22
NI
2011
20
19
21
12
14
8
24
18
6
13
GB
2011
Q.74 What foods, if any, would you regard as Superfoods? Probe fully; Any others?
(37)
(31)
(26)
(26)
(24)
(23)
(22)
(22)
(20)
(17)
(24)
(34)
(31)
(26)
(27)
(19)
(29)
(14)
(12)
(17)
ROI
2007
%
(31)
(27)
(23)
(24)
(26)
(22)
(25)
(20)
(7)
(9)
NI
2007
GB
2007
(36)
(28)
(28)
(21)
(23)
(18)
(25)
(25)
(15)
(17)
ROI
2009
(24)
(21)
(33)
(20)
(16)
(14)
(35)
(20)
(10)
(14)
NI
2009
(22)
(16)
(25)
(15)
(13)
(9)
(29)
(13)
(8)
(9)
GB
2009
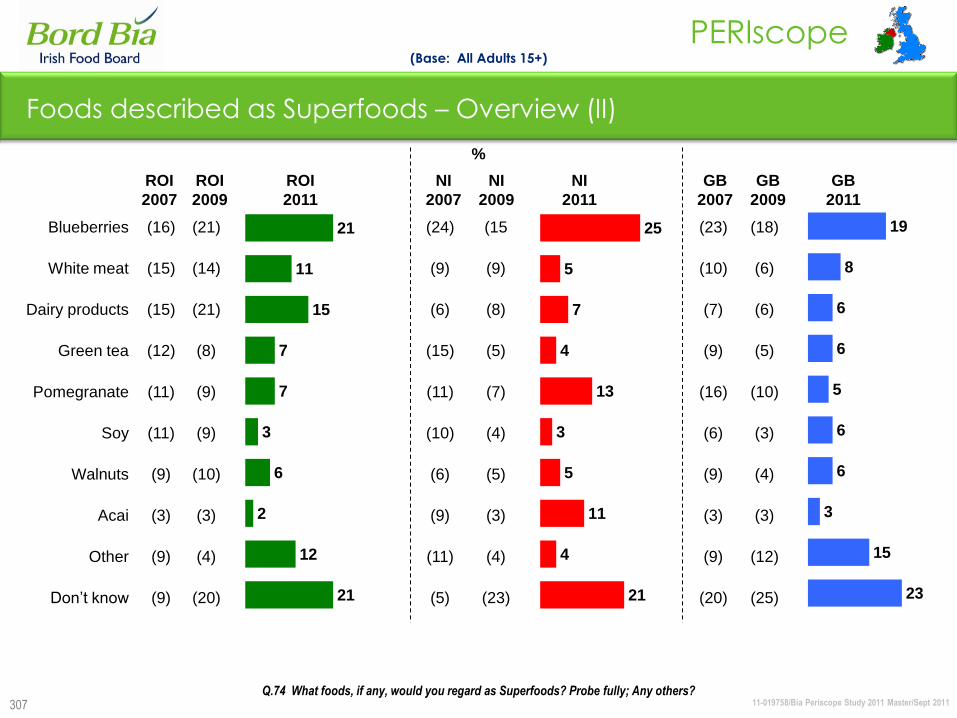
11-019758/Bia Periscope Study 2011 Master/Sept 2011
PERIscope
307
21
11
15
7
7
3
6
2
12
21
25
5
7
4
13
3
5
11
4
21
19
8
6
6
5
6
6
3
15
23
Foods described as Superfoods – Overview (II)
(Base: All Adults 15+)
Blueberries
White meat
Dairy products
Green tea
Pomegranate
Soy
Walnuts
Acai
Other
Don‟t know
ROI
2009
Q.74 What foods, if any, would you regard as Superfoods? Probe fully; Any others?
(16)
(15)
(15)
(12)
(11)
(11)
(9)
(3)
(9)
(9)
ROI
2007
(24)
(9)
(6)
(15)
(11)
(10)
(6)
(9)
(11)
(5)
%
(23)
(10)
(7)
(9)
(16)
(6)
(9)
(3)
(9)
(20)
NI
2007
GB
2007
NI
2009
GB
2009
GB
2011
NI
2011
ROI
2011
(21)
(14)
(21)
(8)
(9)
(9)
(10)
(3)
(4)
(20)
(15
(9)
(8)
(5)
(7)
(4)
(5)
(3)
(4)
(23)
(18)
(6)
(6)
(5)
(10)
(3)
(4)
(3)
(12)
(25)
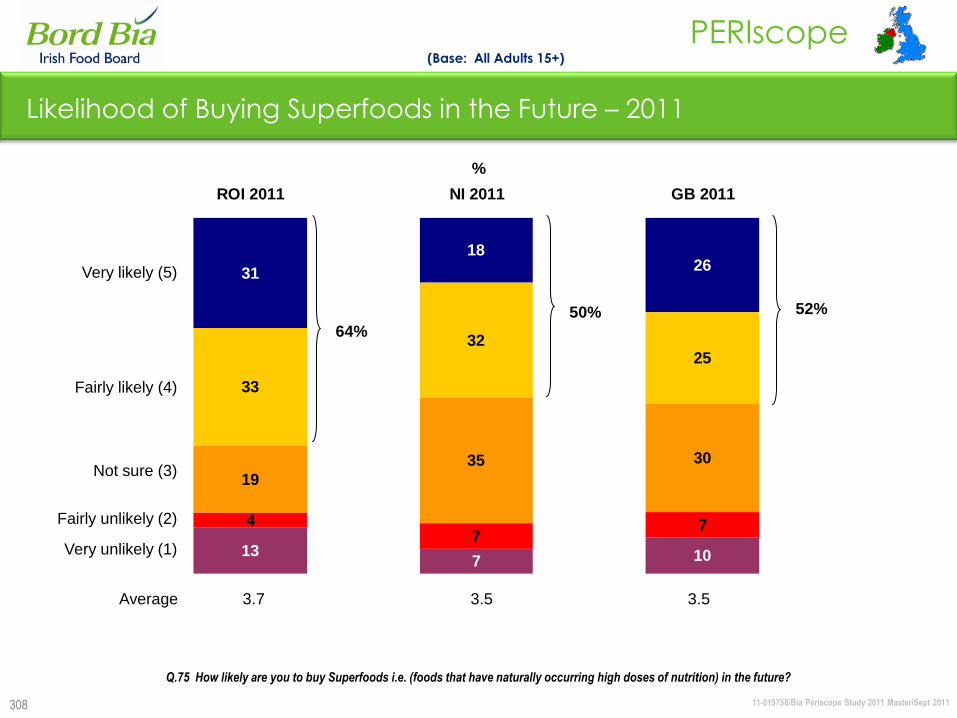
11-019758/Bia Periscope Study 2011 Master/Sept 2011
PERIscope
308
Likelihood of Buying Superfoods in the Future – 2011
(Base: All Adults 15+)
31
1826
33
3225
19
35 30
47
7
137 10
ROI 2011 NI 2011 GB 2011
Very likely (5)
Fairly likely (4)
Not sure (3)
Fairly unlikely (2)
Very unlikely (1)
Average 3.7 3.5 3.5
%
Q.75 How likely are you to buy Superfoods i.e. (foods that have naturally occurring high doses of nutrition) in the future?
64%
52%50%

11-019758/Bia Periscope Study 2011 Master/Sept 2011
PERIscope
309
Higher Amongst …
19 2231
36 30
33
30
25
19
6
74
916 13
ROI 2007 ROI 2009 ROI 2011
%
Very likely (5)
Fairly likely (4)
Not sure (3)
Fairly unlikely (2)
Very unlikely (1)
Q.75 How likely are you to buy Superfoods i.e. (foods that have naturally occurring high doses of nutrition) in the future?
Likelihood of Buying Superfoods in the Future – ROI
Females, 35-44 yrs, AB‟s
Main/joint shoppers
Male, 15-24 yrs
C2‟s
Males, DE‟s
(Base: All Adults 15+)
Average 3.5 3.4 3.7
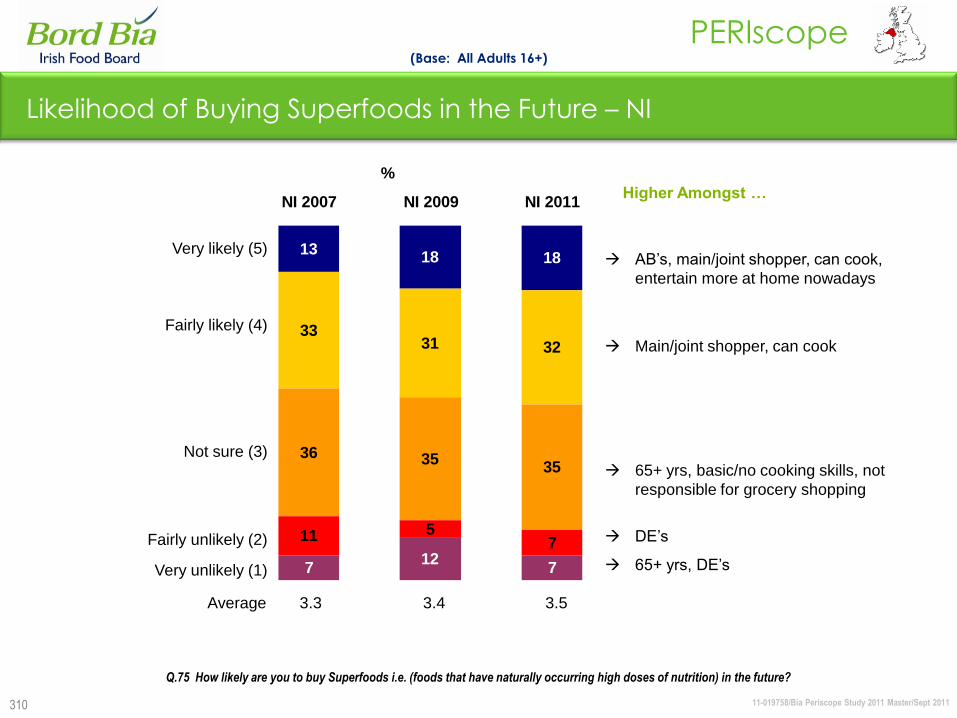
11-019758/Bia Periscope Study 2011 Master/Sept 2011
PERIscope
310
Higher Amongst …
1318 18
3331 32
36 3535
11 57
712
7
NI 2007 NI 2009 NI 2011
Very likely (5)
Fairly likely (4)
Not sure (3)
Fairly unlikely (2)
Very unlikely (1)
Q.75 How likely are you to buy Superfoods i.e. (foods that have naturally occurring high doses of nutrition) in the future?
Likelihood of Buying Superfoods in the Future – NI
(Base: All Adults 16+)
AB‟s, main/joint shopper, can cook,
entertain more at home nowadays
Main/joint shopper, can cook
65+ yrs, basic/no cooking skills, not
responsible for grocery shopping
DE‟s
65+ yrs, DE‟s
Average 3.3 3.4 3.5
%
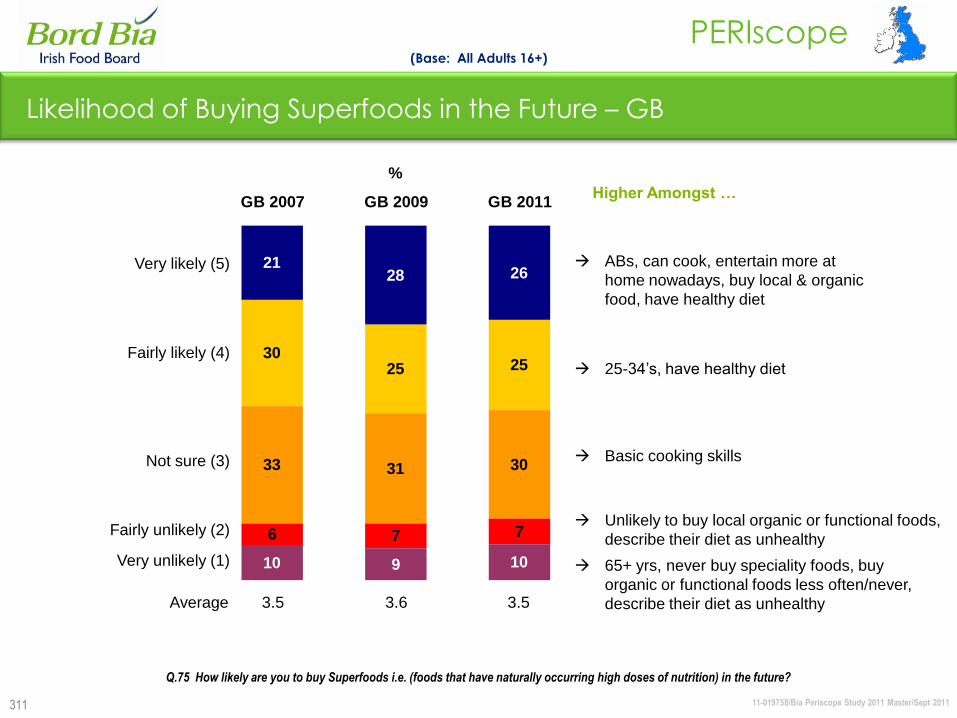
11-019758/Bia Periscope Study 2011 Master/Sept 2011
PERIscope
311
Higher Amongst …
2128 26
3025 25
33 31 30
6 7 7
10 9 10
GB 2007 GB 2009 GB 2011
%
Very likely (5)
Fairly likely (4)
Not sure (3)
Fairly unlikely (2)
Very unlikely (1)
Q.75 How likely are you to buy Superfoods i.e. (foods that have naturally occurring high doses of nutrition) in the future?
Likelihood of Buying Superfoods in the Future – GB
(Base: All Adults 16+)
ABs, can cook, entertain more at
home nowadays, buy local & organic
food, have healthy diet
25-34‟s, have healthy diet
Basic cooking skills
Unlikely to buy local organic or functional foods,
describe their diet as unhealthy
65+ yrs, never buy speciality foods, buy
organic or functional foods less often/never,
describe their diet as unhealthyAverage 3.5 3.6 3.5
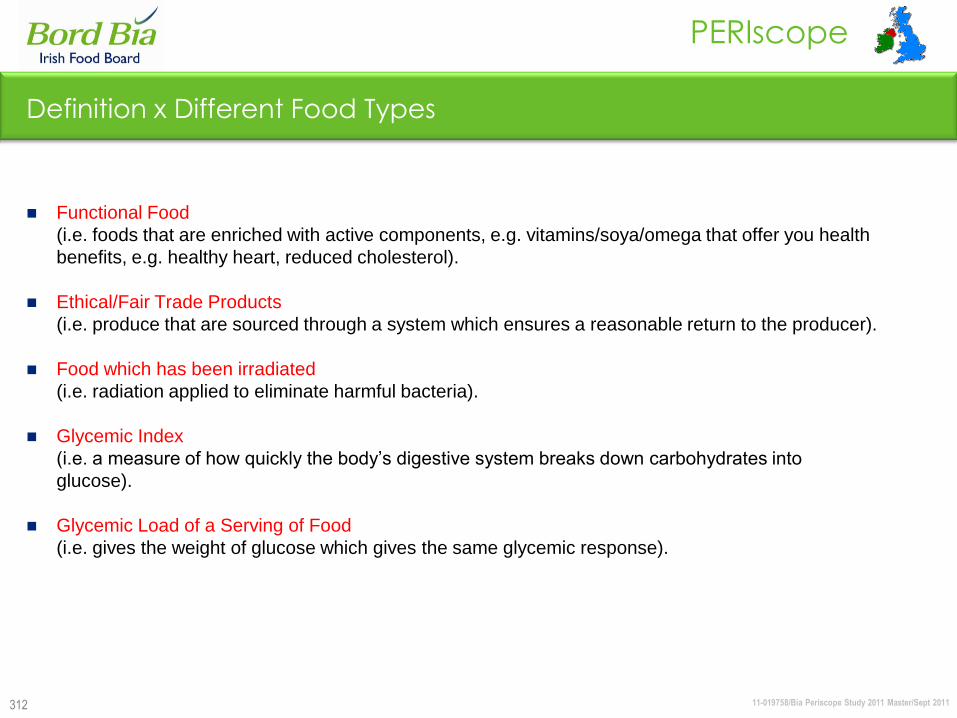
11-019758/Bia Periscope Study 2011 Master/Sept 2011
PERIscope
312
Definition x Different Food Types
Functional Food
(i.e. foods that are enriched with active components, e.g. vitamins/soya/omega that offer you health
benefits, e.g. healthy heart, reduced cholesterol).
Ethical/Fair Trade Products
(i.e. produce that are sourced through a system which ensures a reasonable return to the producer).
Food which has been irradiated
(i.e. radiation applied to eliminate harmful bacteria).
Glycemic Index
(i.e. a measure of how quickly the body‟s digestive system breaks down carbohydrates into
glucose).
Glycemic Load of a Serving of Food
(i.e. gives the weight of glucose which gives the same glycemic response).

11-019758/Bia Periscope Study 2011 Master/Sept 2011
PERIscope
313
Awareness of Different Food Types – 2011
(Base: All Adults 15+)
49
70
44
30
ROI
2011
NI
2011
GB
2011
Functional foods
Fair trade products
Ethical products
Glycemic index
Q.69 Which of the following have you ever heard of?
Total Aware
%
26
63
34
22
34
87
54
30
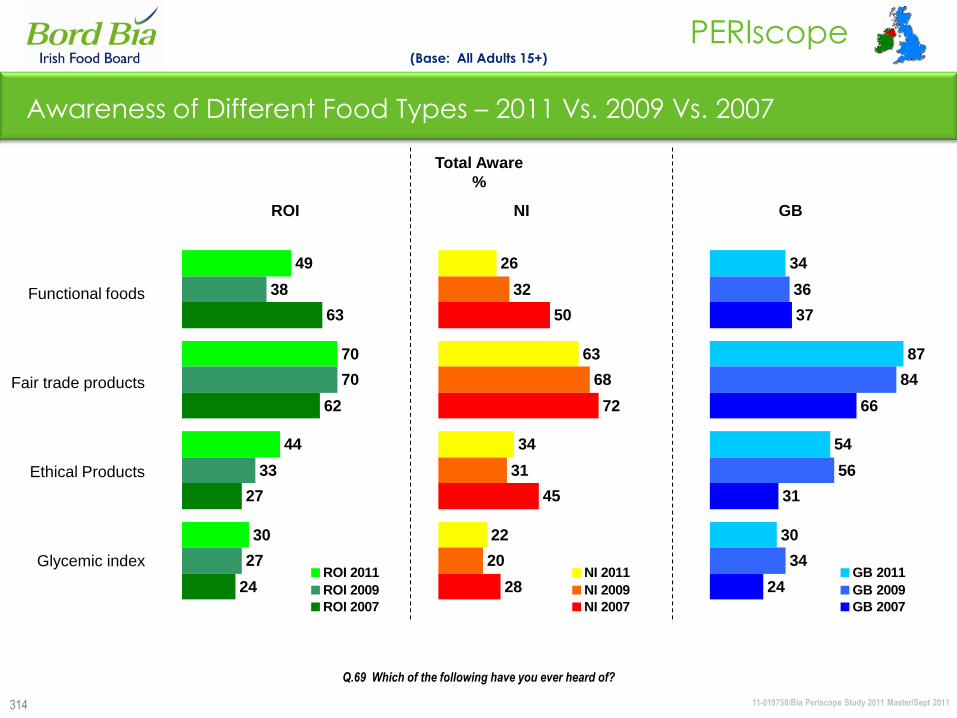
11-019758/Bia Periscope Study 2011 Master/Sept 2011
PERIscope
314
Awareness of Different Food Types – 2011 Vs. 2009 Vs. 2007
(Base: All Adults 15+)
Functional foods
Fair trade products
Ethical Products
Glycemic index
Q.69 Which of the following have you ever heard of?
Total Aware
%
NI ROI
49
70
44
30
38
70
33
27
63
62
27
24ROI 2011
ROI 2009
ROI 2007
GB
26
63
34
22
32
68
31
20
50
72
45
28NI 2011
NI 2009
NI 2007
34
87
54
30
36
84
56
34
37
66
31
24GB 2011
GB 2009
GB 2007
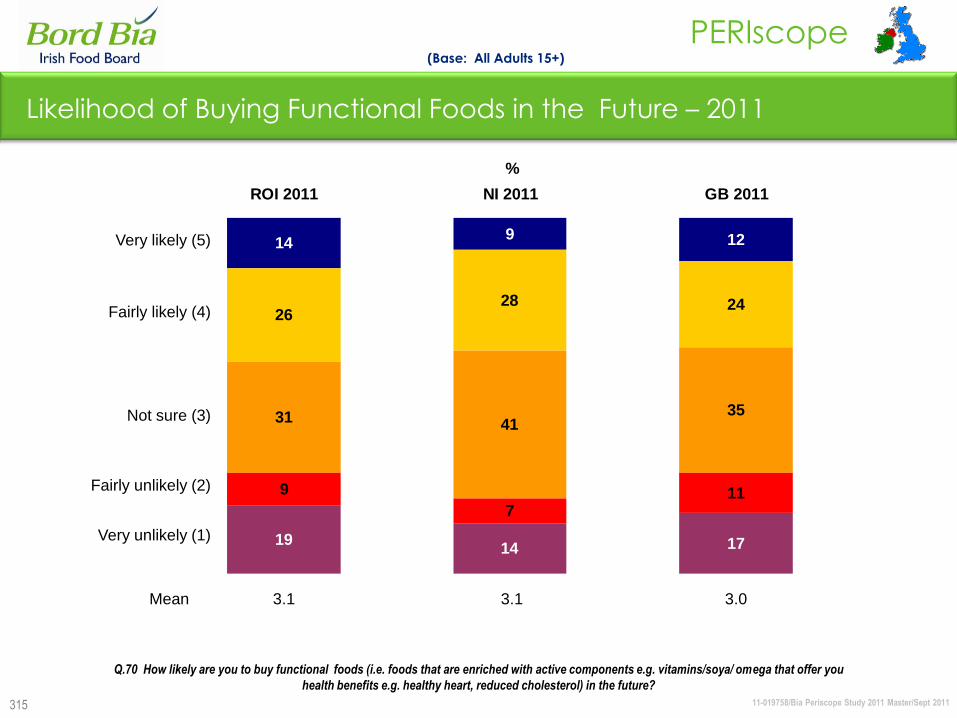
11-019758/Bia Periscope Study 2011 Master/Sept 2011
PERIscope
315
Likelihood of Buying Functional Foods in the Future – 2011
(Base: All Adults 15+)
149 12
2628 24
31 4135
9
711
1914 17
ROI 2011 NI 2011 GB 2011
Very likely (5)
Fairly likely (4)
Not sure (3)
Fairly unlikely (2)
Very unlikely (1)
Mean 3.1 3.1 3.0
%
Q.70 How likely are you to buy functional foods (i.e. foods that are enriched with active components e.g. vitamins/soya/ omega that offer you
health benefits e.g. healthy heart, reduced cholesterol) in the future?
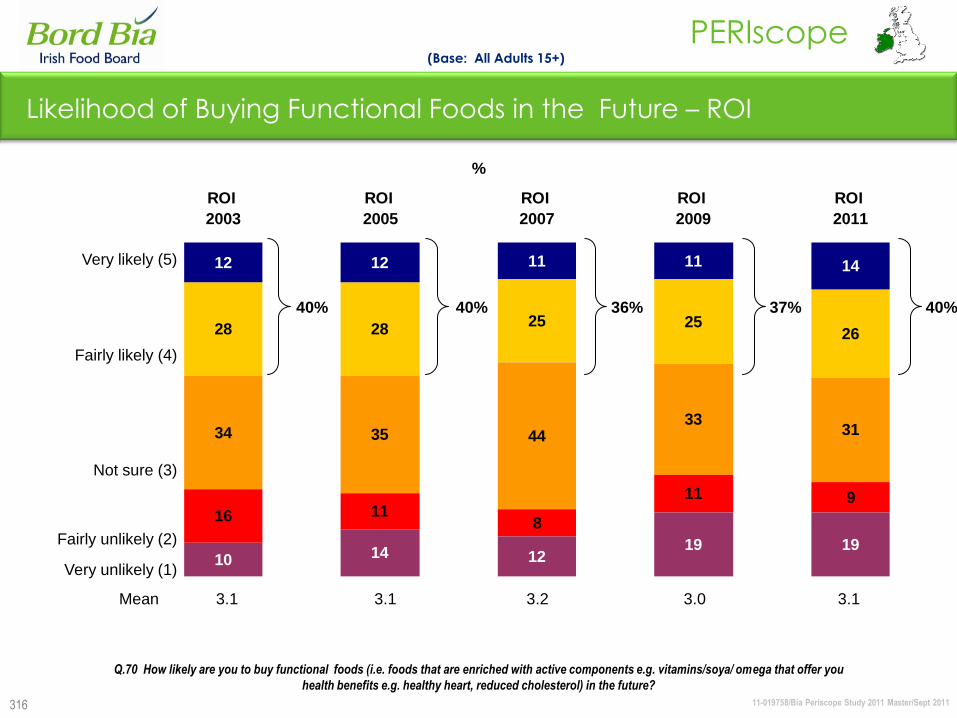
11-019758/Bia Periscope Study 2011 Master/Sept 2011
PERIscope
12 12 11 11 14
28 2825 25
26
34 35 4433
31
16 118
11 9
10 14 1219 19
ROI
2003
ROI
2005
ROI
2007
ROI
2009
ROI
2011
316
Likelihood of Buying Functional Foods in the Future – ROI
(Base: All Adults 15+)
Very likely (5)
Fairly likely (4)
Not sure (3)
Fairly unlikely (2)
Very unlikely (1)
Mean 3.1 3.1 3.2 3.0 3.1
%
40% 40% 36%
Q.70 How likely are you to buy functional foods (i.e. foods that are enriched with active components e.g. vitamins/soya/ omega that offer you
health benefits e.g. healthy heart, reduced cholesterol) in the future?
37% 40%
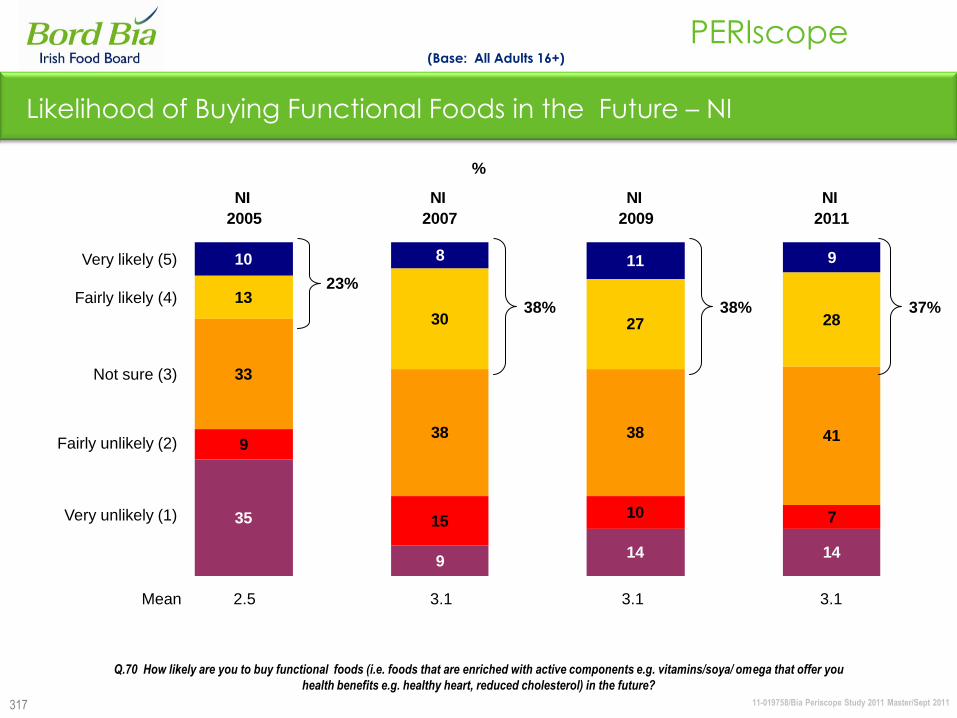
11-019758/Bia Periscope Study 2011 Master/Sept 2011
PERIscope
317
10 8 11 9
13
30 27 28
33
38 38 419
1510 735
914 14
NI
2005
NI
2007
NI
2009
NI
2011
Likelihood of Buying Functional Foods in the Future – NI
(Base: All Adults 16+)
Very likely (5)
Fairly likely (4)
Not sure (3)
Fairly unlikely (2)
Very unlikely (1)
Mean 2.5 3.1 3.1 3.1
%
23%
38%
Q.70 How likely are you to buy functional foods (i.e. foods that are enriched with active components e.g. vitamins/soya/ omega that offer you
health benefits e.g. healthy heart, reduced cholesterol) in the future?
38% 37%

11-019758/Bia Periscope Study 2011 Master/Sept 2011
PERIscope
318
10 8 10 13 12
25 25 25 20 24
32 3539
3635
13 129
13 11
20 20 17 18 17
GB
2003
GB
2005
GB
2007
GB
2009
GB
2011
Likelihood of Buying Functional Foods in the Future – GB
(Base: All Adults 16+)
Very likely (5)
Fairly likely (4)
Not sure (3)
Fairly unlikely (2)
Very unlikely (1)
Mean 2.9 2.9 3.0 3.0 3.0
%
Q.70 How likely are you to buy functional foods (i.e. foods that are enriched with active components e.g. vitamins/soya/ omega that offer you
health benefits e.g. healthy heart, reduced cholesterol) in the future?
35% 33% 35% 33% 36%
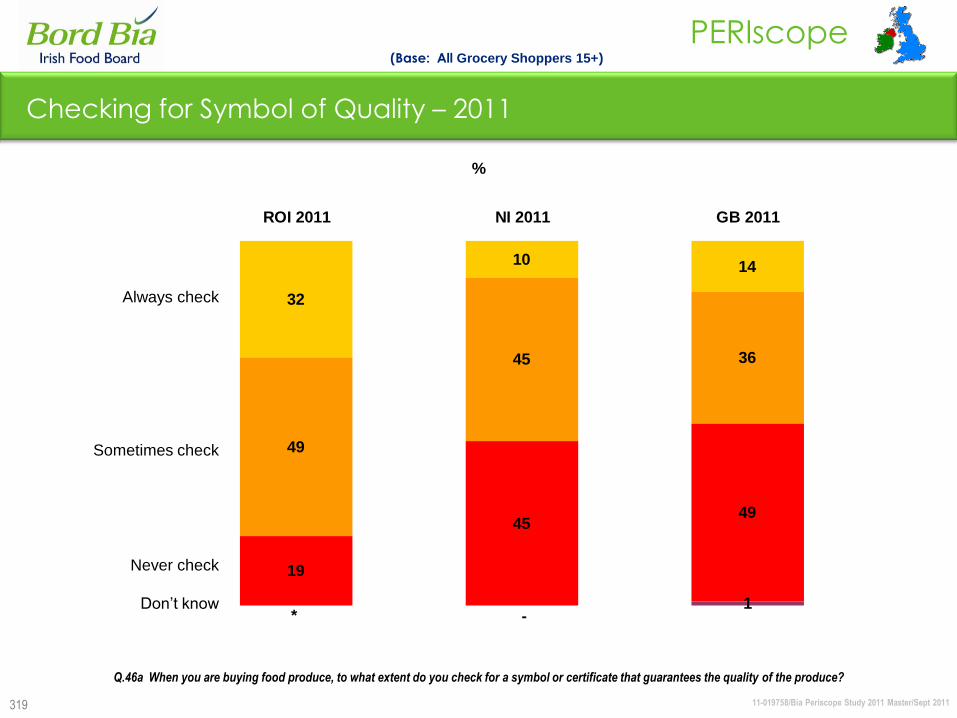
11-019758/Bia Periscope Study 2011 Master/Sept 2011
PERIscope
319
Checking for Symbol of Quality – 2011
(Base: All Grocery Shoppers 15+)
32
10 14
49
45 36
19
4549
1* -
ROI 2011 NI 2011 GB 2011
Always check
Sometimes check
Never check
Don‟t know
%
Q.46a When you are buying food produce, to what extent do you check for a symbol or certificate that guarantees the quality of the produce?
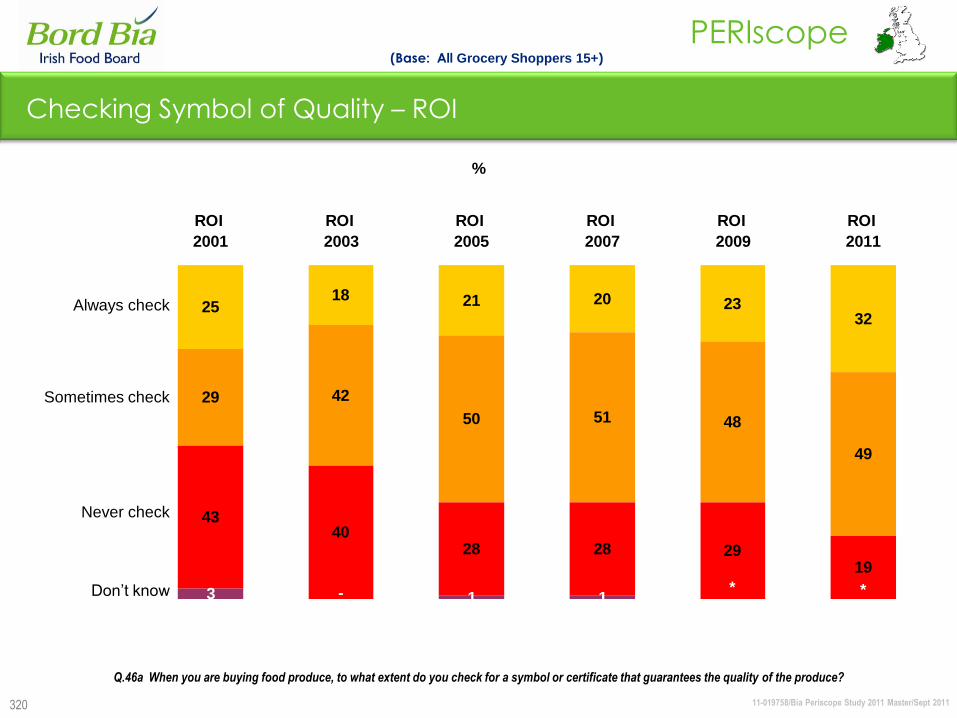
11-019758/Bia Periscope Study 2011 Master/Sept 2011
PERIscope
320
2518 21 20 23
32
29 42
50 51 48
49
4340
28 28 2919
3 1 1**-
ROI
2001
ROI
2003
ROI
2005
ROI
2007
ROI
2009
ROI
2011
Checking Symbol of Quality – ROI
(Base: All Grocery Shoppers 15+)
Always check
Sometimes check
Never check
Don‟t know
Q.46a When you are buying food produce, to what extent do you check for a symbol or certificate that guarantees the quality of the produce?
%
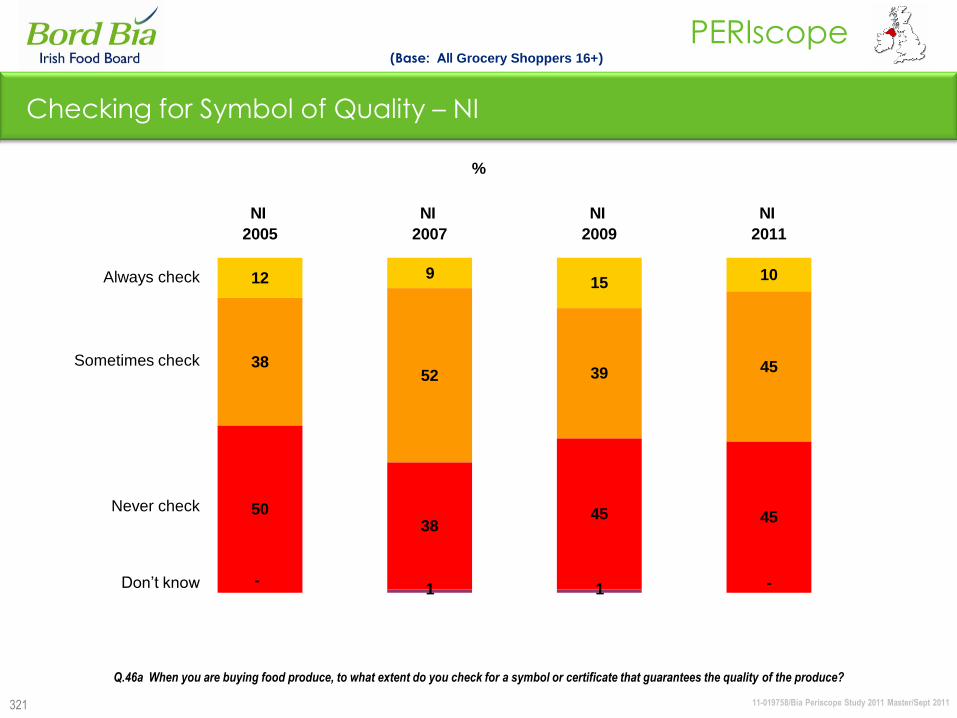
11-019758/Bia Periscope Study 2011 Master/Sept 2011
PERIscope
321
12 915
10
3852 39 45
5038
45 45
1 1 --
NI
2005
NI
2007
NI
2009
NI
2011
Always check
Sometimes check
Never check
Don‟t know
%
Q.46a When you are buying food produce, to what extent do you check for a symbol or certificate that guarantees the quality of the produce?
Checking for Symbol of Quality – NI
(Base: All Grocery Shoppers 16+)
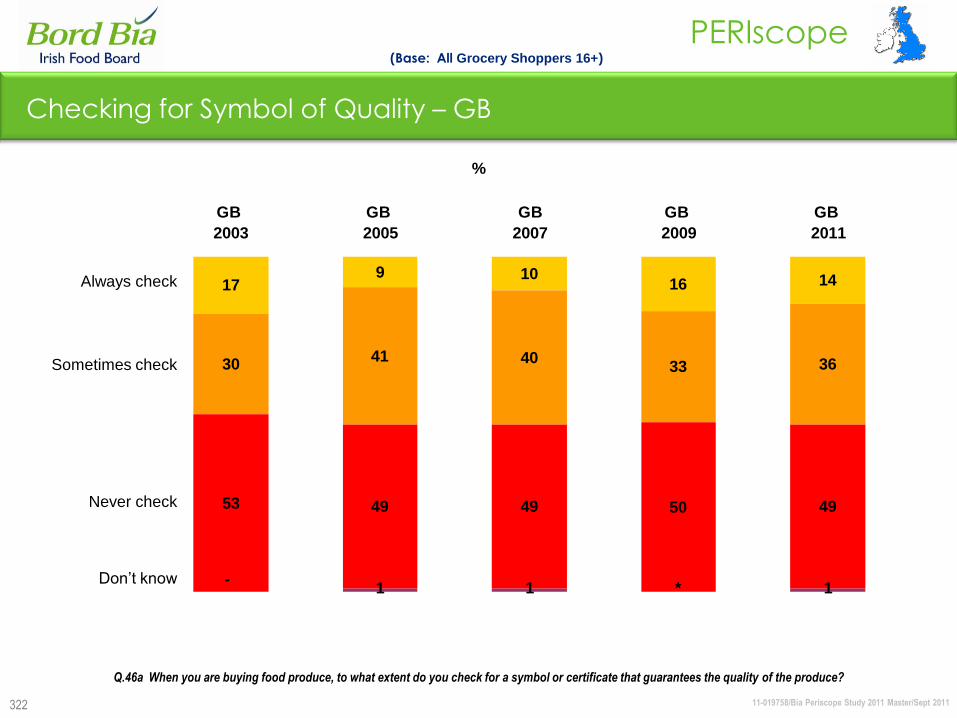
11-019758/Bia Periscope Study 2011 Master/Sept 2011
PERIscope
322
179 10
16 14
3041 40
33 36
53 49 49 50 49
1 1 1*-
GB
2003
GB
2005
GB
2007
GB
2009
GB
2011
Checking for Symbol of Quality – GB
Always check
Sometimes check
Never check
Don‟t know
Q.46a When you are buying food produce, to what extent do you check for a symbol or certificate that guarantees the quality of the produce?
(Base: All Grocery Shoppers 16+)
%
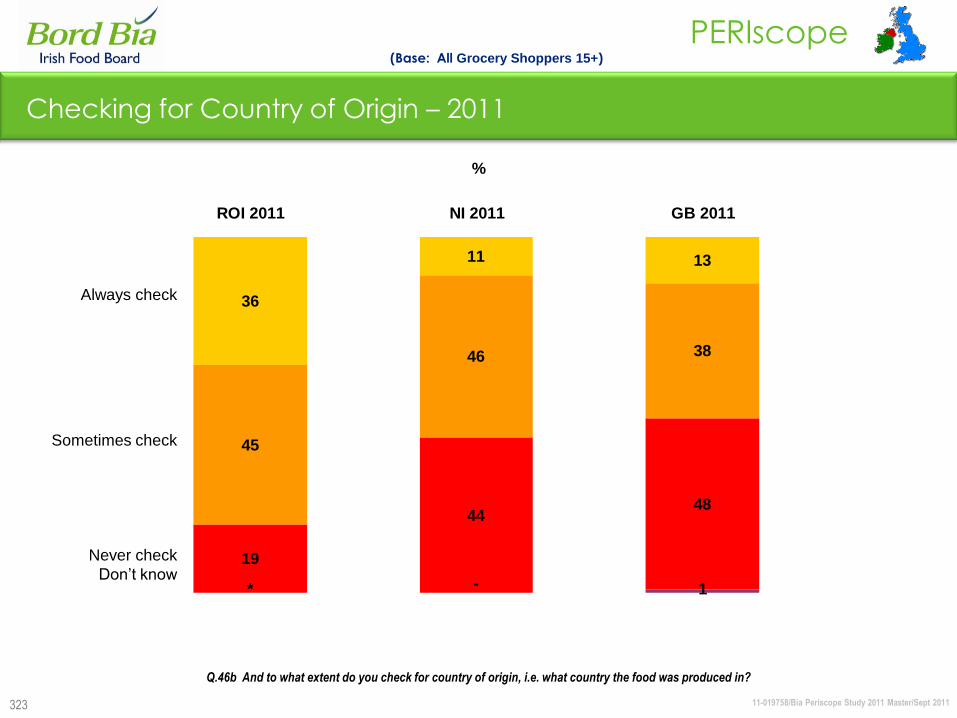
11-019758/Bia Periscope Study 2011 Master/Sept 2011
PERIscope
323
36
11 13
45
46 38
19
4448
1* -
ROI 2011 NI 2011 GB 2011
Q.46b And to what extent do you check for country of origin, i.e. what country the food was produced in?
Checking for Country of Origin – 2011
(Base: All Grocery Shoppers 15+)
Always check
Sometimes check
Never check
Don‟t know
%
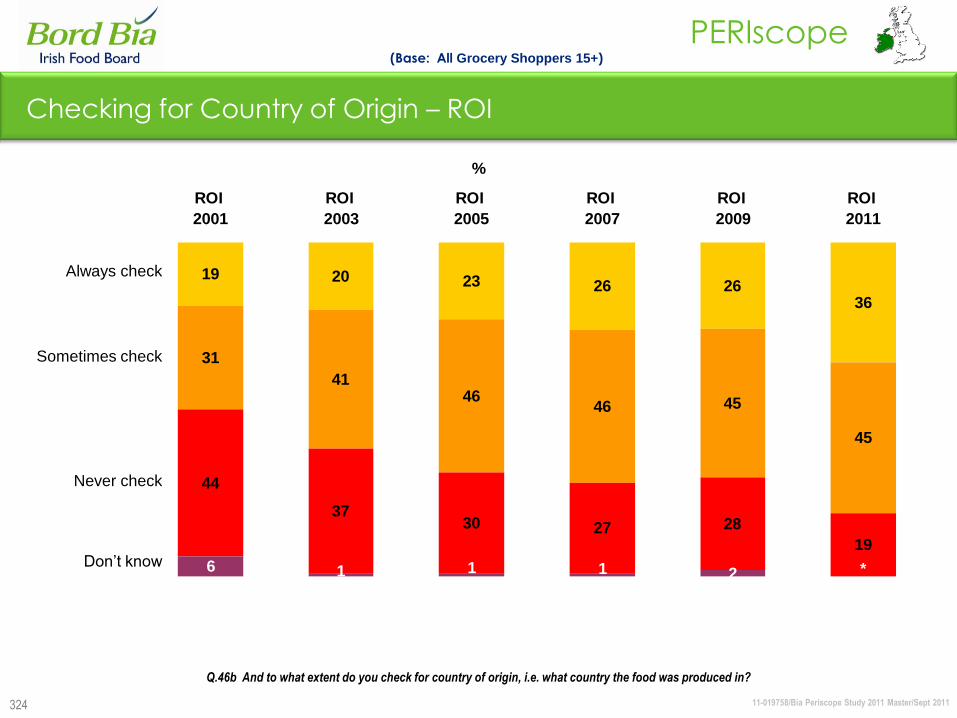
11-019758/Bia Periscope Study 2011 Master/Sept 2011
PERIscope
324
Checking for Country of Origin – ROI
Q.46b And to what extent do you check for country of origin, i.e. what country the food was produced in?
(Base: All Grocery Shoppers 15+)
Always check
Sometimes check
Never check
Don‟t know
%
19 20 23 26 2636
31
4146
46 45
45
44
3730 27 28
19
6 2 *111
ROI
2001
ROI
2003
ROI
2005
ROI
2007
ROI
2009
ROI
2011
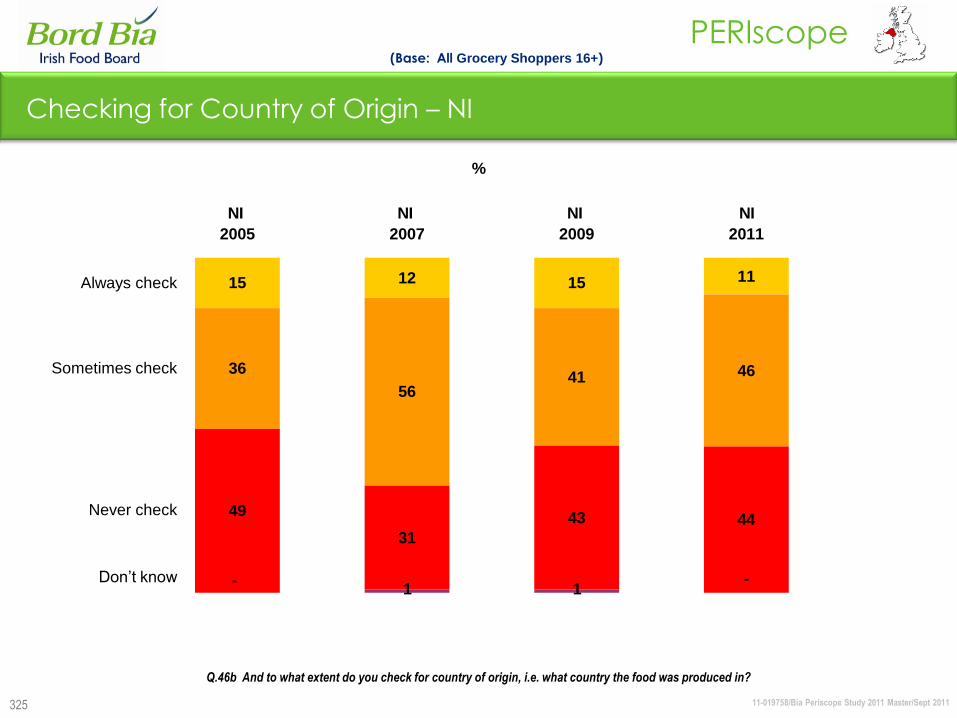
11-019758/Bia Periscope Study 2011 Master/Sept 2011
PERIscope
325
15 12 15 11
36
5641 46
49
31
43 44
1 1--
NI
2005
NI
2007
NI
2009
NI
2011
Checking for Country of Origin – NI
Q.46b And to what extent do you check for country of origin, i.e. what country the food was produced in?
(Base: All Grocery Shoppers 16+)
Always check
Sometimes check
Never check
Don‟t know
%
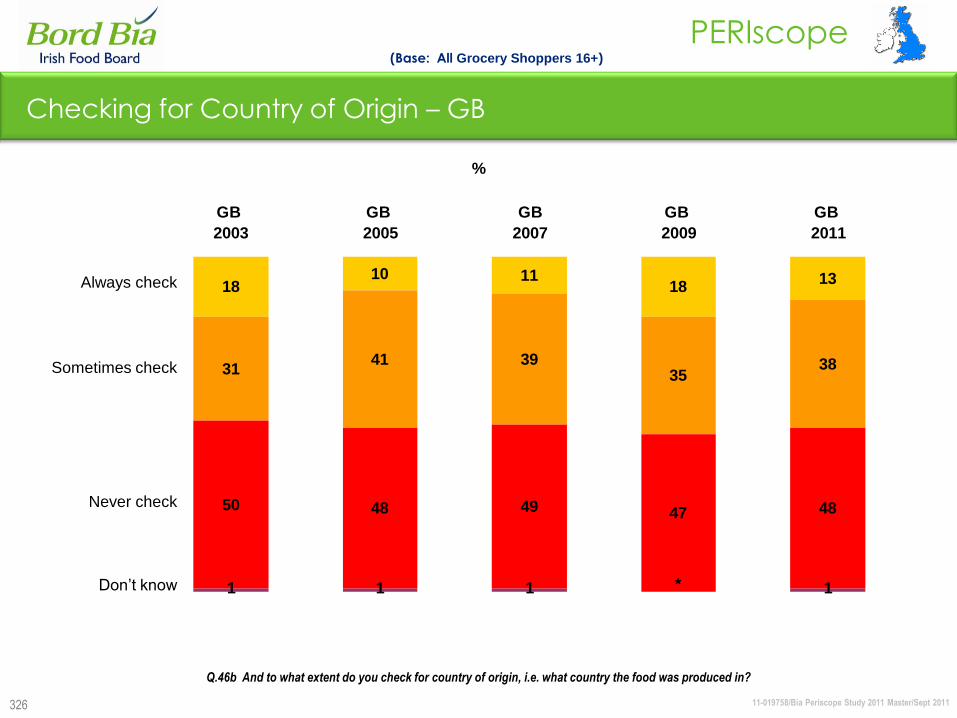
11-019758/Bia Periscope Study 2011 Master/Sept 2011
PERIscope
326
1810 11
1813
3141 39
3538
50 48 49 47 48
1 1 1 1*
GB
2003
GB
2005
GB
2007
GB
2009
GB
2011
Checking for Country of Origin – GB
Q.46b And to what extent do you check for country of origin, i.e. what country the food was produced in?
(Base: All Grocery Shoppers 16+)
Always check
Sometimes check
Never check
Don‟t know
%
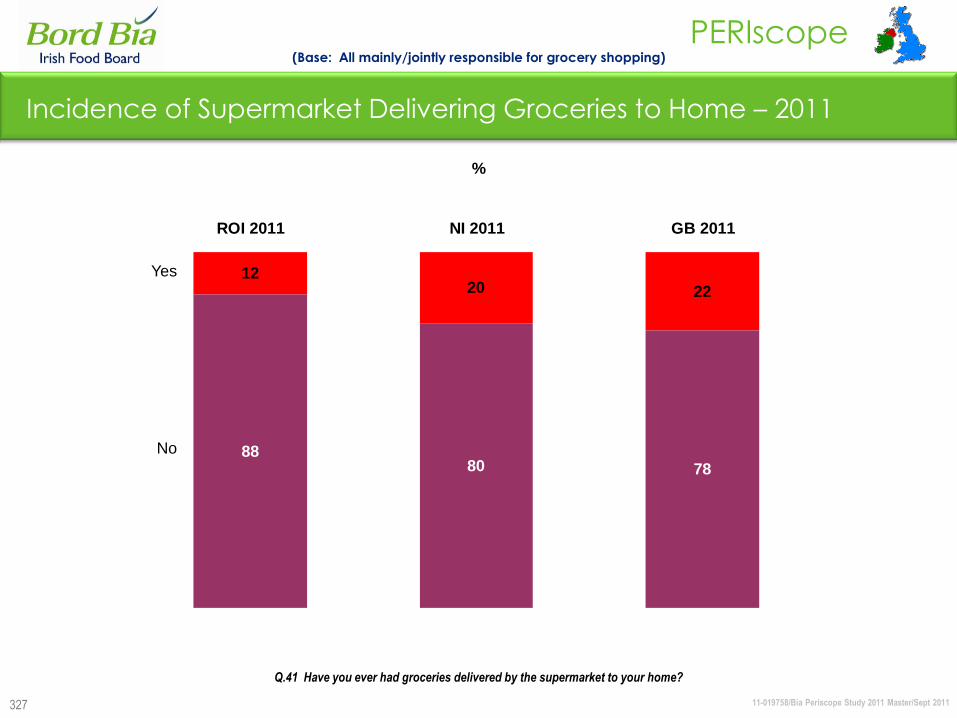
11-019758/Bia Periscope Study 2011 Master/Sept 2011
PERIscope
327
1220 22
8880 78
ROI 2011 NI 2011 GB 2011
Incidence of Supermarket Delivering Groceries to Home – 2011
(Base: All mainly/jointly responsible for grocery shopping)
Yes
No
%
Q.41 Have you ever had groceries delivered by the supermarket to your home?
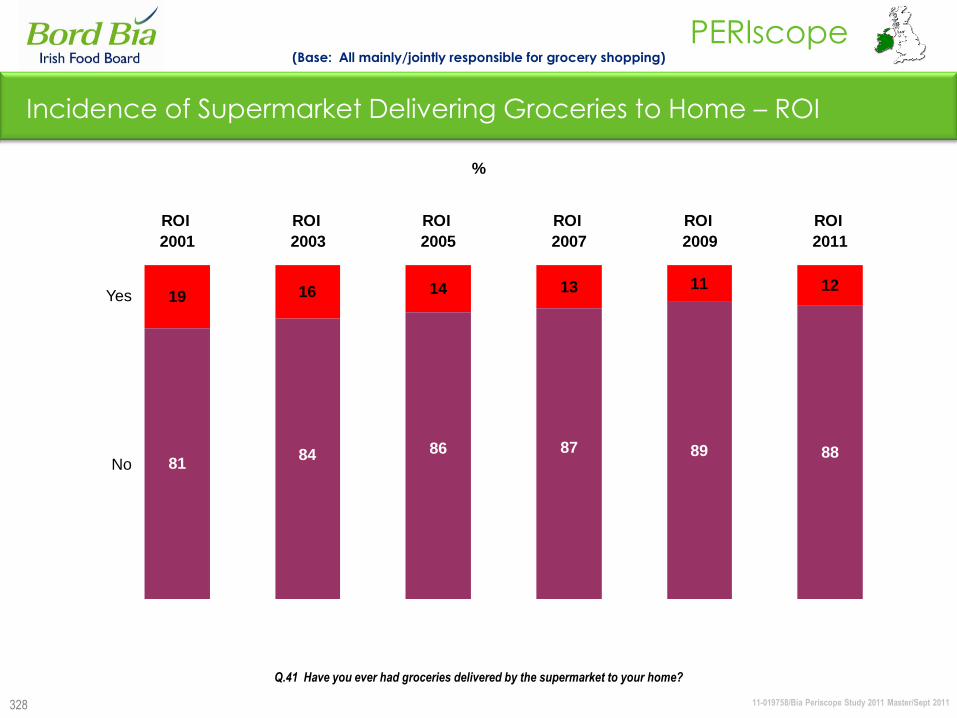
11-019758/Bia Periscope Study 2011 Master/Sept 2011
PERIscope
328
19 16 14 13 11 12
8189 88878684
ROI
2001
ROI
2003
ROI
2005
ROI
2007
ROI
2009
ROI
2011
Incidence of Supermarket Delivering Groceries to Home – ROI
(Base: All mainly/jointly responsible for grocery shopping)
Yes
No
%
Q.41 Have you ever had groceries delivered by the supermarket to your home?
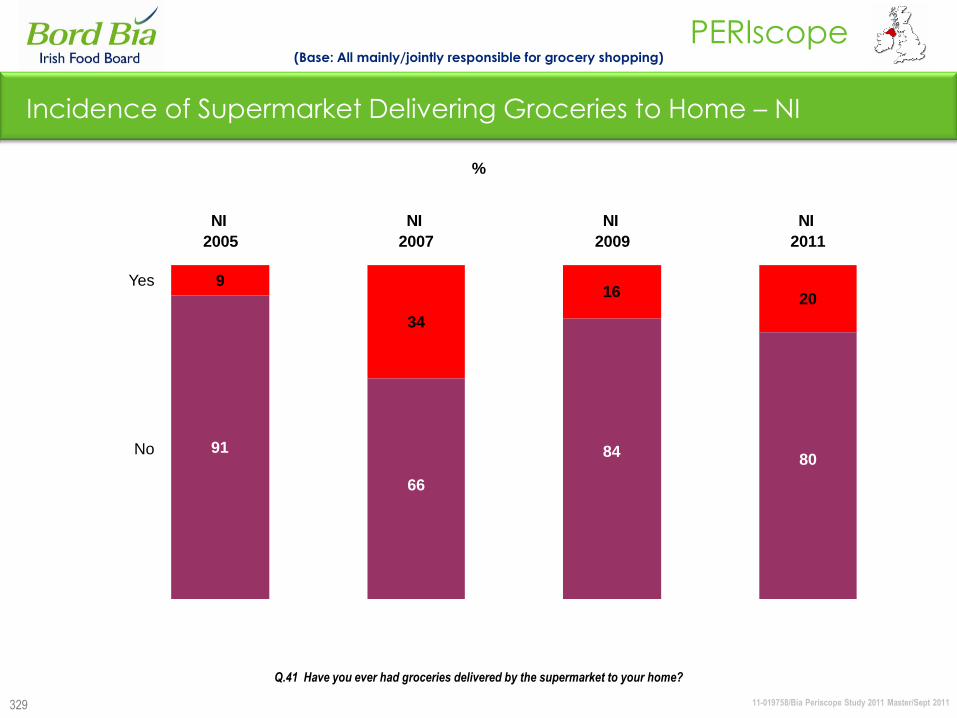
11-019758/Bia Periscope Study 2011 Master/Sept 2011
PERIscope
329
9
34
16 20
9180
84
66
NI
2005
NI
2007
NI
2009
NI
2011
(Base: All mainly/jointly responsible for grocery shopping)
Yes
No
%
Q.41 Have you ever had groceries delivered by the supermarket to your home?
Incidence of Supermarket Delivering Groceries to Home – NI
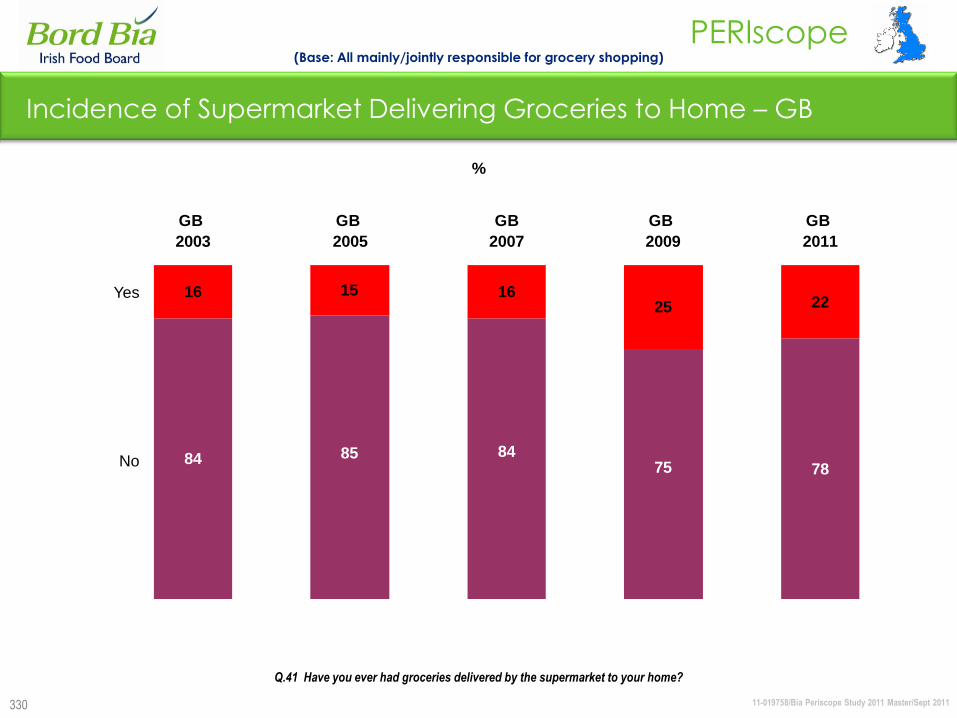
11-019758/Bia Periscope Study 2011 Master/Sept 2011
PERIscope
330
16 15 1625 22
847875
8485
GB
2003
GB
2005
GB
2007
GB
2009
GB
2011
(Base: All mainly/jointly responsible for grocery shopping)
Yes
No
%
Q.41 Have you ever had groceries delivered by the supermarket to your home?
Incidence of Supermarket Delivering Groceries to Home – GB
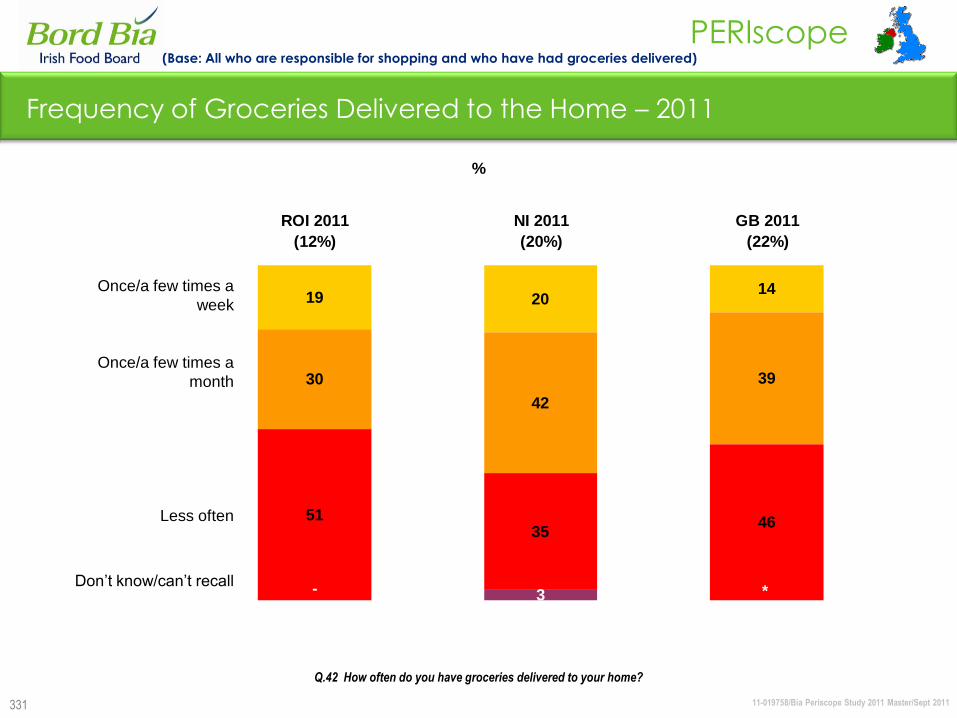
11-019758/Bia Periscope Study 2011 Master/Sept 2011
PERIscope
331
19 2014
30
42
39
5135
46
3- *
ROI 2011
(12%)
NI 2011
(20%)
GB 2011
(22%)
Frequency of Groceries Delivered to the Home – 2011
(Base: All who are responsible for shopping and who have had groceries delivered)
Once/a few times a
week
Once/a few times a
month
Less often
Don‟t know/can‟t recall
%
Q.42 How often do you have groceries delivered to your home?
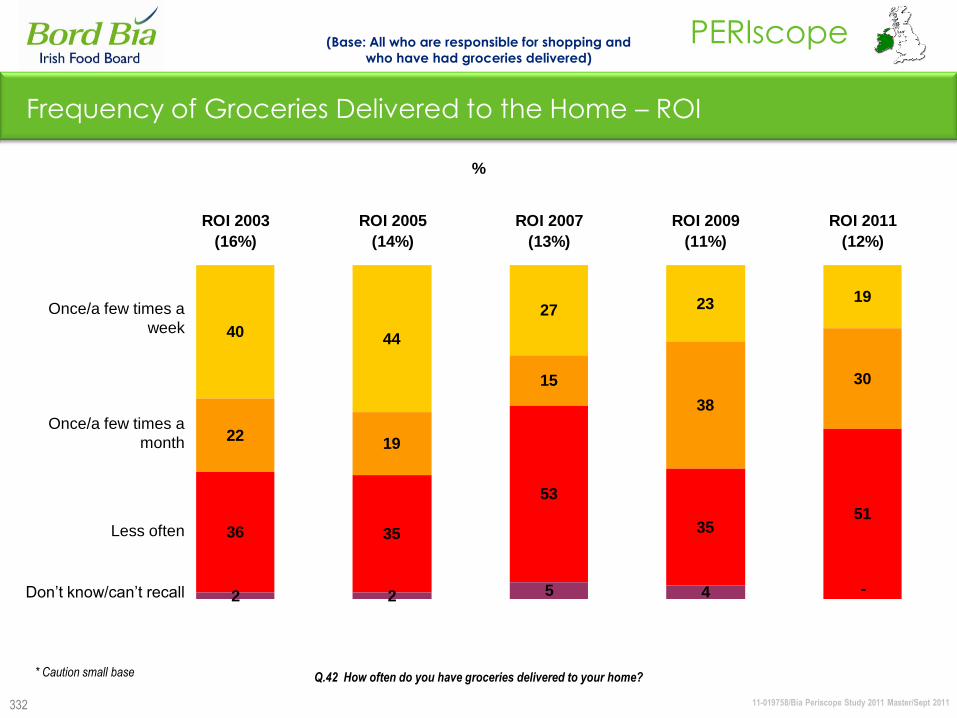
11-019758/Bia Periscope Study 2011 Master/Sept 2011
PERIscope
332
40 44
27 23 19
2219
15
38
30
36 35
53
3551
2 2 5 4 -
ROI 2003
(16%)
ROI 2005
(14%)
ROI 2007
(13%)
ROI 2009
(11%)
ROI 2011
(12%)
Frequency of Groceries Delivered to the Home – ROI
(Base: All who are responsible for shopping and
who have had groceries delivered)
* Caution small base
%
Q.42 How often do you have groceries delivered to your home?
Once/a few times a
week
Once/a few times a
month
Less often
Don‟t know/can‟t recall

11-019758/Bia Periscope Study 2011 Master/Sept 2011
PERIscope
333
1710
1520
40
3736
42
43
4648
35
71 3-
NI 2005
(9%)
NI 2007
(34%)
NI 2009
(16%)
NI 2011
(20%)
%
Frequency of Groceries Delivered to the Home – NI
(Base: All who are responsible for shopping and
who have had groceries delivered)
Q.42 How often do you have groceries delivered to your home?
Once/a few times a
week
Once/a few times a
month
Less often
Don‟t know/can‟t recall
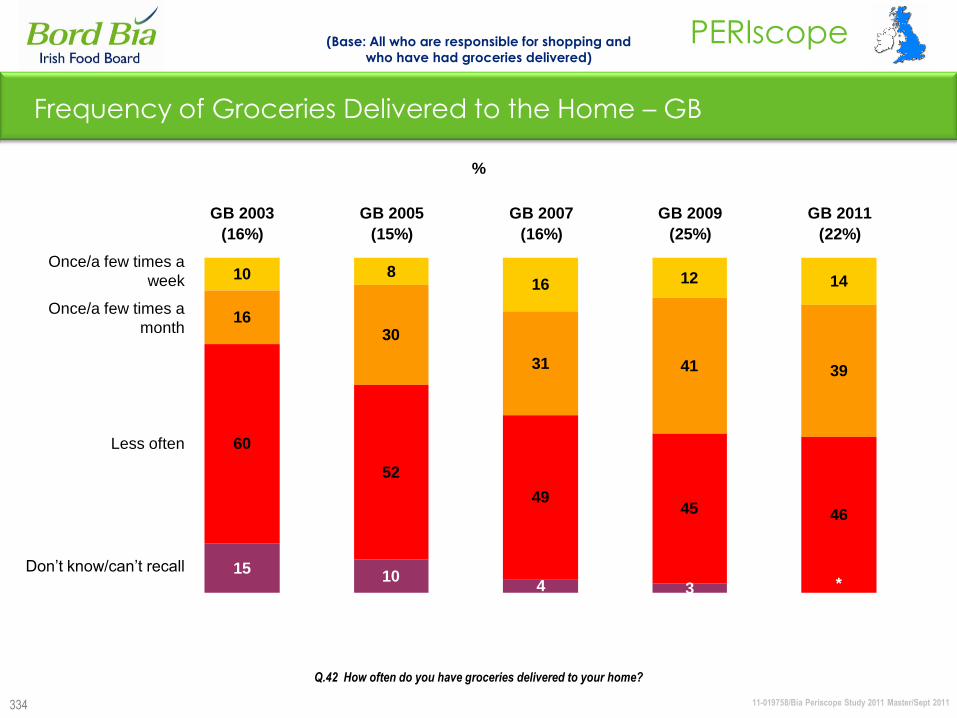
11-019758/Bia Periscope Study 2011 Master/Sept 2011
PERIscope
334
10 816 12 14
1630
31 41 39
60
52
4945 46
1510
4 3 *
GB 2003
(16%)
GB 2005
(15%)
GB 2007
(16%)
GB 2009
(25%)
GB 2011
(22%)
%
Frequency of Groceries Delivered to the Home – GB
(Base: All who are responsible for shopping and
who have had groceries delivered)
Q.42 How often do you have groceries delivered to your home?
Once/a few times a
week
Once/a few times a
month
Less often
Don‟t know/can‟t recall
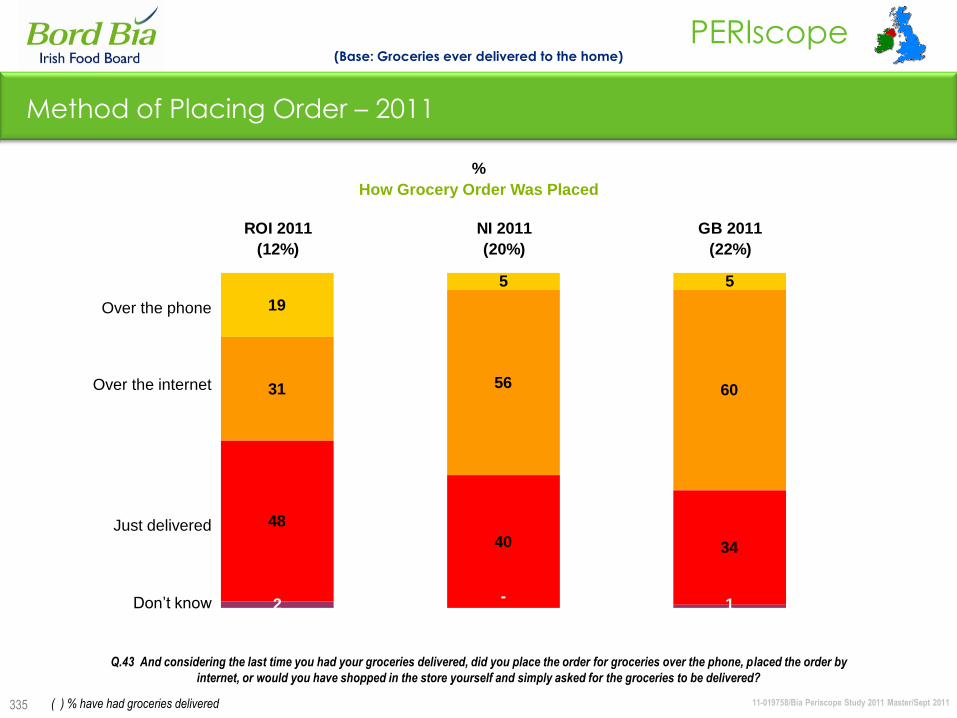
11-019758/Bia Periscope Study 2011 Master/Sept 2011
PERIscope
335
19
5 5
31 56 60
48
40 34
2 1-
ROI 2011
(12%)
NI 2011
(20%)
GB 2011
(22%)
Method of Placing Order – 2011
(Base: Groceries ever delivered to the home)
How Grocery Order Was Placed
%
Q.43 And considering the last time you had your groceries delivered, did you place the order for groceries over the phone, placed the order by
internet, or would you have shopped in the store yourself and simply asked for the groceries to be delivered?
Over the phone
Over the internet
Just delivered
Don‟t know
( ) % have had groceries delivered
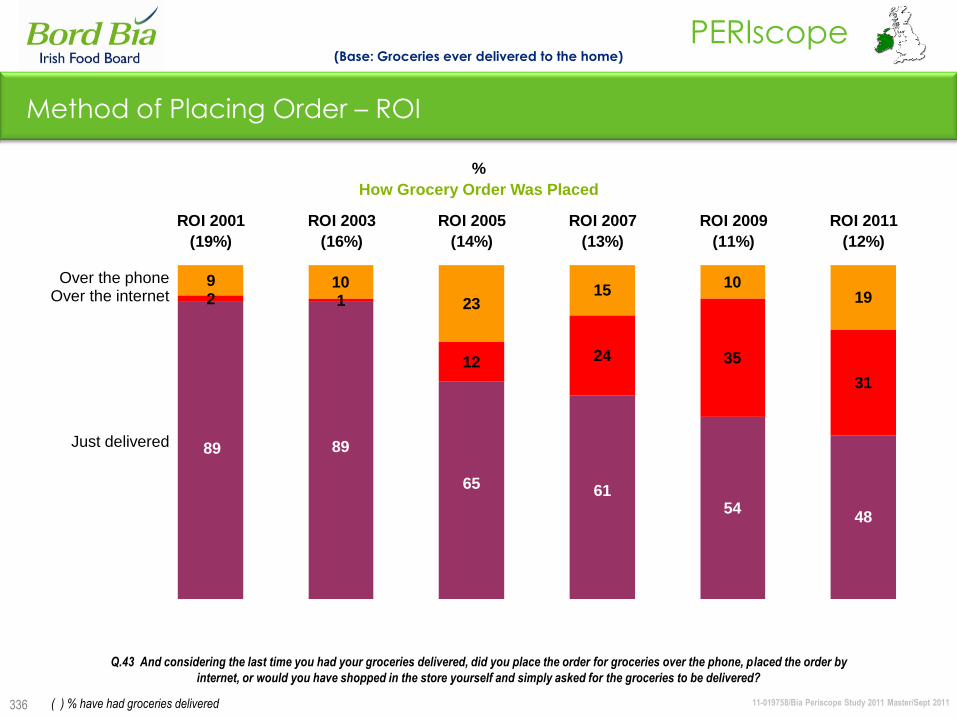
11-019758/Bia Periscope Study 2011 Master/Sept 2011
PERIscope
336
9 10
2315
10192 1
12 24 35
31
5448
89
6165
89
ROI 2001
(19%)
ROI 2003
(16%)
ROI 2005
(14%)
ROI 2007
(13%)
ROI 2009
(11%)
ROI 2011
(12%)
Method of Placing Order – ROI
(Base: Groceries ever delivered to the home)
How Grocery Order Was Placed
( ) % have had groceries delivered
%
Q.43 And considering the last time you had your groceries delivered, did you place the order for groceries over the phone, placed the order by
internet, or would you have shopped in the store yourself and simply asked for the groceries to be delivered?
Over the phoneOver the internet
Just delivered
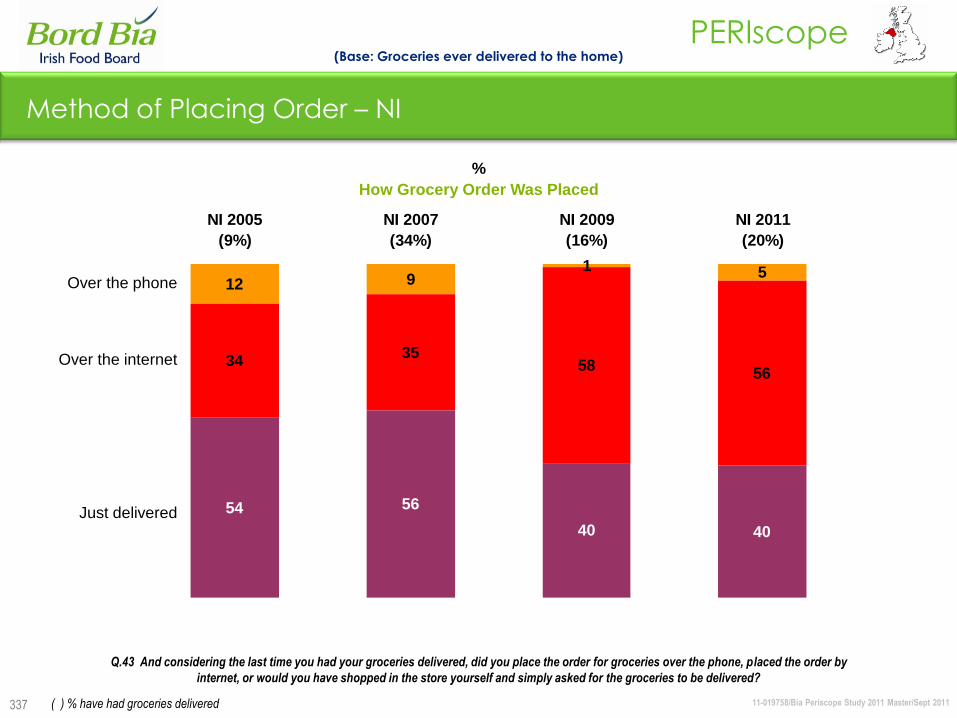
11-019758/Bia Periscope Study 2011 Master/Sept 2011
PERIscope
337
12 91 5
3435
5856
54 56
40 40
NI 2005
(9%)
NI 2007
(34%)
NI 2009
(16%)
NI 2011
(20%)
(Base: Groceries ever delivered to the home)
How Grocery Order Was Placed
( ) % have had groceries delivered
%
Q.43 And considering the last time you had your groceries delivered, did you place the order for groceries over the phone, placed the order by
internet, or would you have shopped in the store yourself and simply asked for the groceries to be delivered?
Over the phone
Over the internet
Just delivered
Method of Placing Order – NI
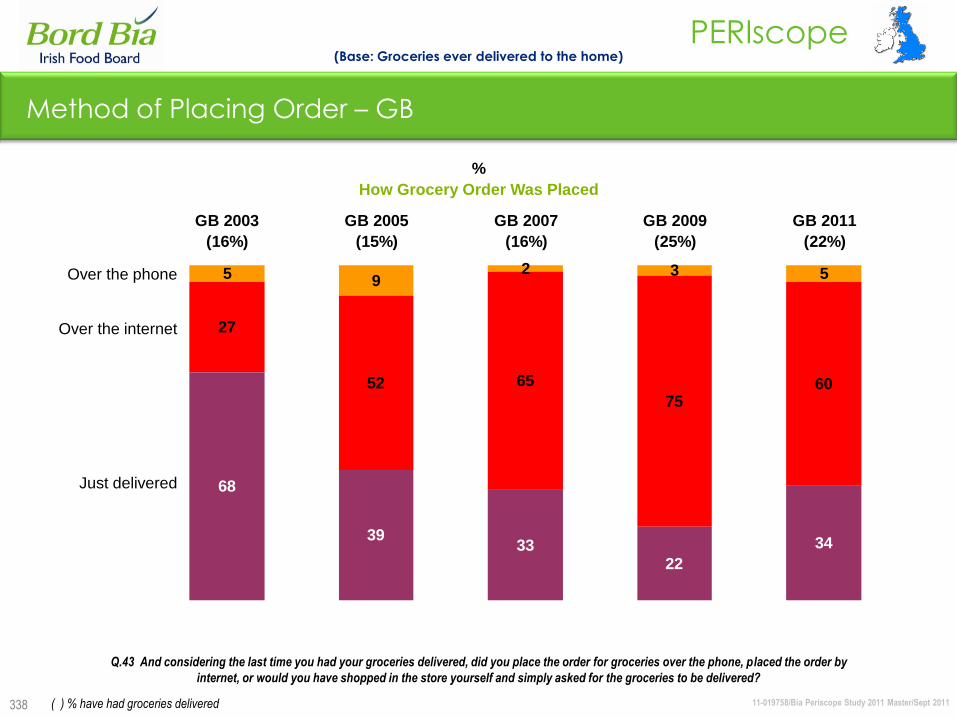
11-019758/Bia Periscope Study 2011 Master/Sept 2011
PERIscope
338
Method of Placing Order – GB
(Base: Groceries ever delivered to the home)
How Grocery Order Was Placed
( ) % have had groceries delivered
%
Q.43 And considering the last time you had your groceries delivered, did you place the order for groceries over the phone, placed the order by
internet, or would you have shopped in the store yourself and simply asked for the groceries to be delivered?
Over the phone
Over the internet
Just delivered
5 92 3 5
27
52 65
7560
68
3933
22
34
GB 2003
(16%)
GB 2005
(15%)
GB 2007
(16%)
GB 2009
(25%)
GB 2011
(22%)
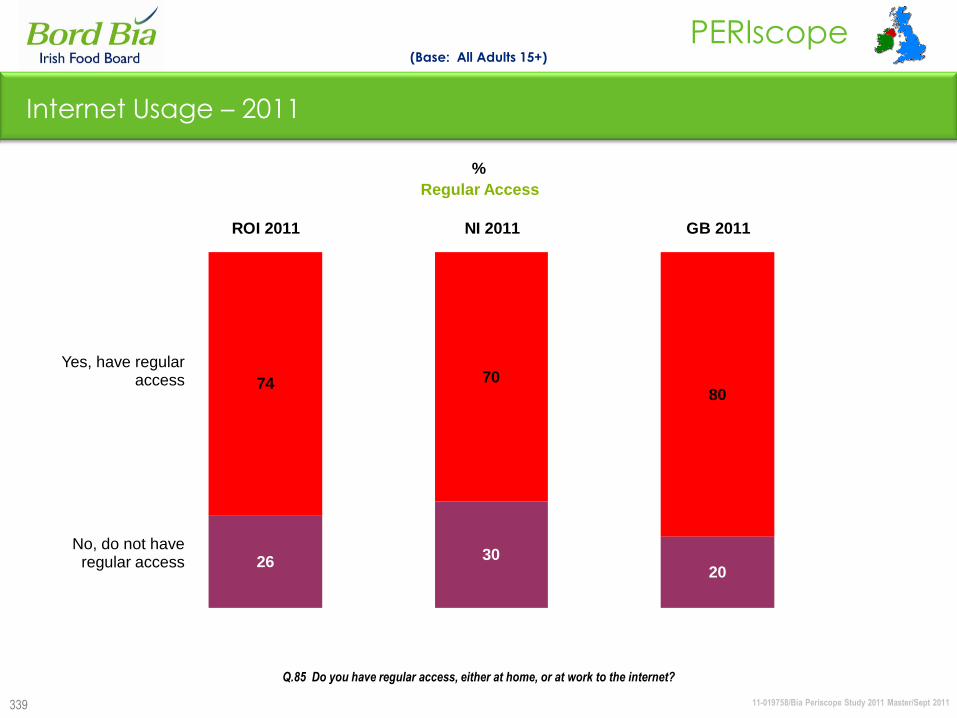
11-019758/Bia Periscope Study 2011 Master/Sept 2011
PERIscope
339
74 7080
26 3020
ROI 2011 NI 2011 GB 2011
Internet Usage – 2011
Regular Access
%
Yes, have regular access
No, do not have regular access
(Base: All Adults 15+)
Q.85 Do you have regular access, either at home, or at work to the internet?
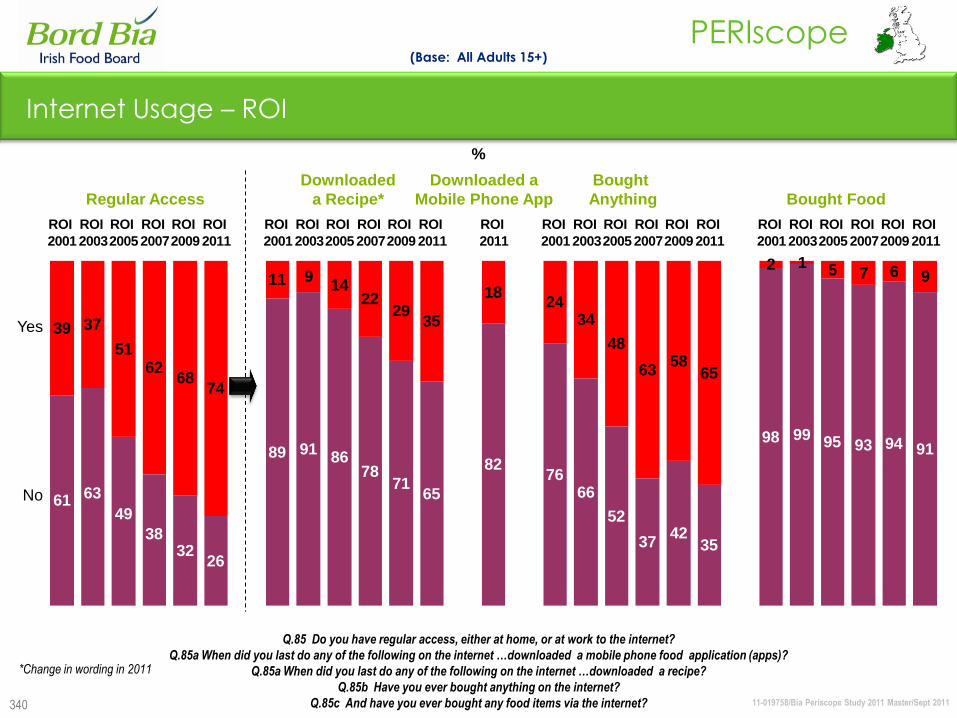
11-019758/Bia Periscope Study 2011 Master/Sept 2011
PERIscope
340
39 37
5162
6874
11 914
2229
35
1824
34
48
6358
65
2 1 5 7 6 9
61
3226
89 9186
7871
65
8276
66
52
3742
35
98 99 95 93 94 91
63
49
38
ROI
2001
ROI
2003
ROI
2005
ROI
2007
ROI
2009
ROI
2011
ROI
2001
ROI
2003
ROI
2005
ROI
2007
ROI
2009
ROI
2011
ROI
2011
ROI
2001
ROI
2003
ROI
2005
ROI
2007
ROI
2009
ROI
2011
ROI
2001
ROI
2003
ROI
2005
ROI
2007
ROI
2009
ROI
2011
Q.85 Do you have regular access, either at home, or at work to the internet?
Q.85a When did you last do any of the following on the internet …downloaded a mobile phone food application (apps)?
Q.85a When did you last do any of the following on the internet …downloaded a recipe?
Q.85b Have you ever bought anything on the internet?
Q.85c And have you ever bought any food items via the internet?
Internet Usage – ROI
(Base: All Adults 15+)
Regular Access
Downloaded
a Recipe*
Bought
Anything Bought Food
%
Yes
No
*Change in wording in 2011
Downloaded a
Mobile Phone App
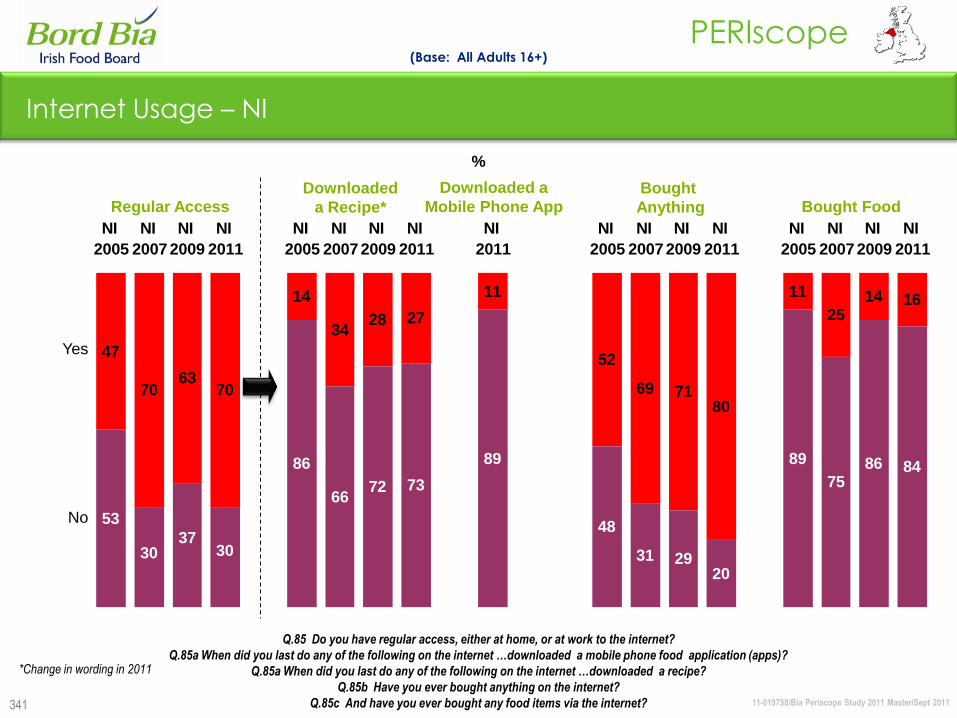
11-019758/Bia Periscope Study 2011 Master/Sept 2011
PERIscope
341
Q.85 Do you have regular access, either at home, or at work to the internet?
Q.85a When did you last do any of the following on the internet …downloaded a mobile phone food application (apps)?
Q.85a When did you last do any of the following on the internet …downloaded a recipe?
Q.85b Have you ever bought anything on the internet?
Q.85c And have you ever bought any food items via the internet?
Internet Usage – NI
(Base: All Adults 16+)
Yes
No
47
7063
70
14
3428 27
11
52
69 7180
11
2514 16
53
86
6672 73
89
48
31 2920
89
7586 84
3037
30
NI
2005
NI
2007
NI
2009
NI
2011
NI
2005
NI
2007
NI
2009
NI
2011
NI
2011
NI
2005
NI
2007
NI
2009
NI
2011
NI
2005
NI
2007
NI
2009
NI
2011
*Change in wording in 2011
Regular AccessDownloaded
a Recipe*
Bought
Anything Bought Food
%
Downloaded a
Mobile Phone App
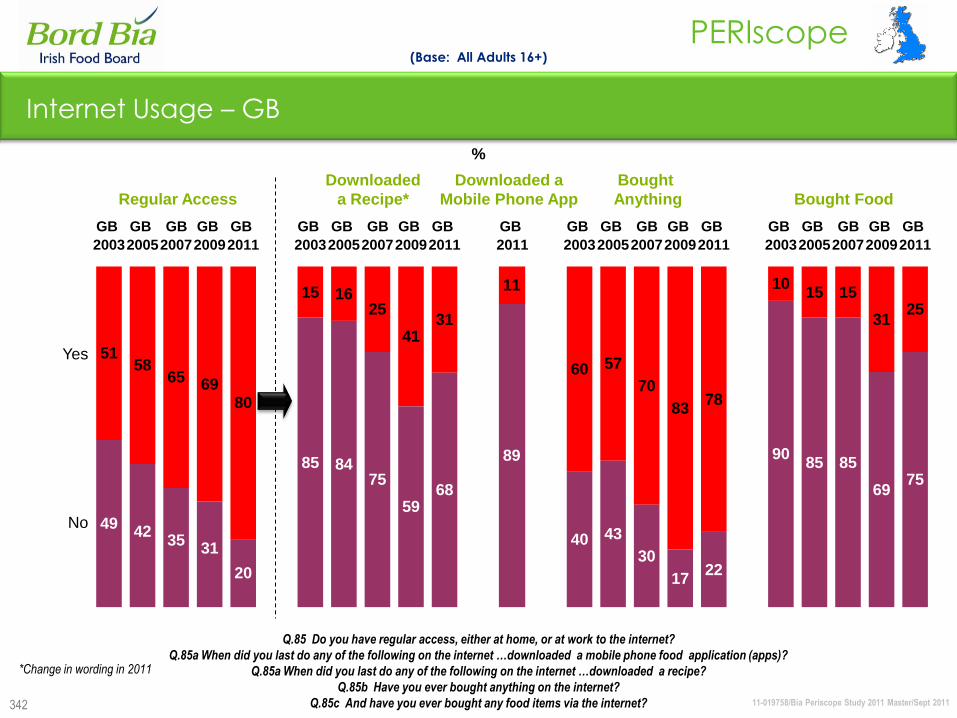
11-019758/Bia Periscope Study 2011 Master/Sept 2011
PERIscope
342
5158
65 6980
15 1625
4131
11
60 57
70
8378
1015 15
3125
49
20
85 8475
5968
89
40 43
30
1722
9085 85
6975
4235
31
GB
2003
GB
2005
GB
2007
GB
2009
GB
2011
GB
2003
GB
2005
GB
2007
GB
2009
GB
2011
GB
2011
GB
2003
GB
2005
GB
2007
GB
2009
GB
2011
GB
2003
GB
2005
GB
2007
GB
2009
GB
2011
Internet Usage – GB
Q.85 Do you have regular access, either at home, or at work to the internet?
Q.85a When did you last do any of the following on the internet …downloaded a mobile phone food application (apps)?
Q.85a When did you last do any of the following on the internet …downloaded a recipe?
Q.85b Have you ever bought anything on the internet?
Q.85c And have you ever bought any food items via the internet?
(Base: All Adults 16+)
Yes
No
*Change in wording in 2011
Regular Access
Downloaded
a Recipe*
Bought
Anything Bought Food
%
Downloaded a
Mobile Phone App
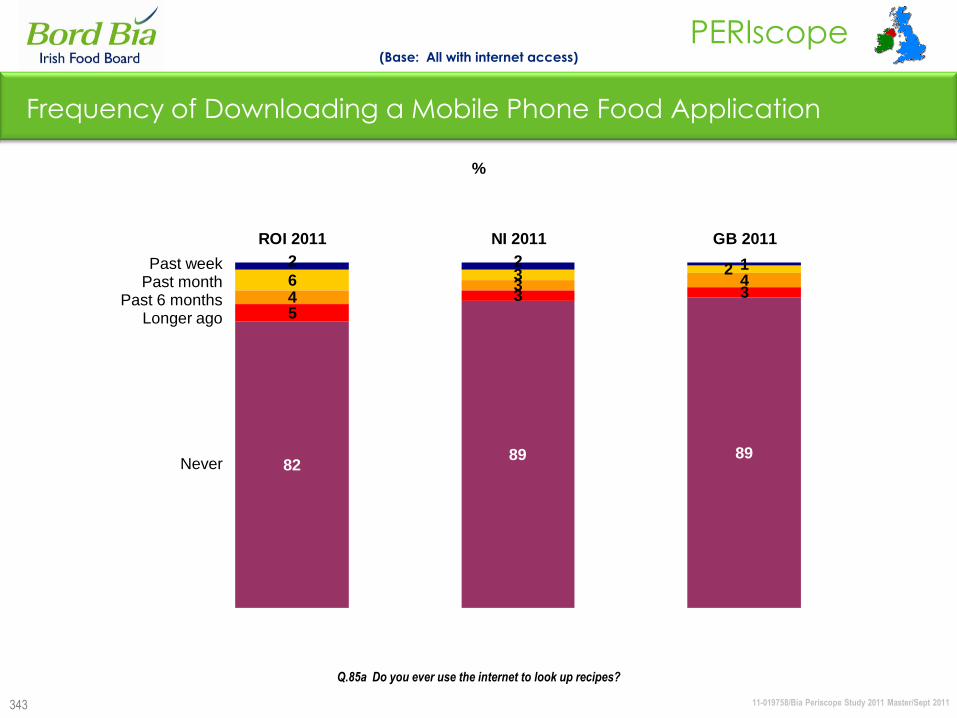
11-019758/Bia Periscope Study 2011 Master/Sept 2011
PERIscope
343
16 3
43 4
53 3
8289 89
222
ROI 2011 NI 2011 GB 2011
Frequency of Downloading a Mobile Phone Food Application
%
Past weekPast month
Past 6 monthsLonger ago
Never
(Base: All with internet access)
Q.85a Do you ever use the internet to look up recipes?

Buying Local
11-019758/Bia Periscope Study 2011 Master/Sept 2011
PERIscope
345
Buying Local: Summary
ROI continues their trend of placing more importance on buying local produce when shopping for
food. their incidence of buying local produce is also higher than in NI and GB, though those
buying local a few times/once a month in NI is almost on a par with ROI figures.
Consumers‟ understanding or interpretation of what the term „local‟ actually means tends to be
slightly different across each region, though the majority believe local to mean that the food is
made within close proximity to where they live. ROI consumers associate farmers markets with
local, while GB think that it has more to do with food that is made within a 20 miles radius of
where they live.
Statements regarding the characteristics of local food, related to its quality, its lack of
preservatives, its health proponents, and its traceability resonate much higher with ROI
consumers, thereby explaining why it is held in higher esteem in this region. Indeed ROI‟s
agreement with these statements continue to show improvement in 2011, while in others they
may have declined.
It is interesting in this context to observe that more ROI consumers perceive local foods to be
more expensive than their NI or GB counterparts.
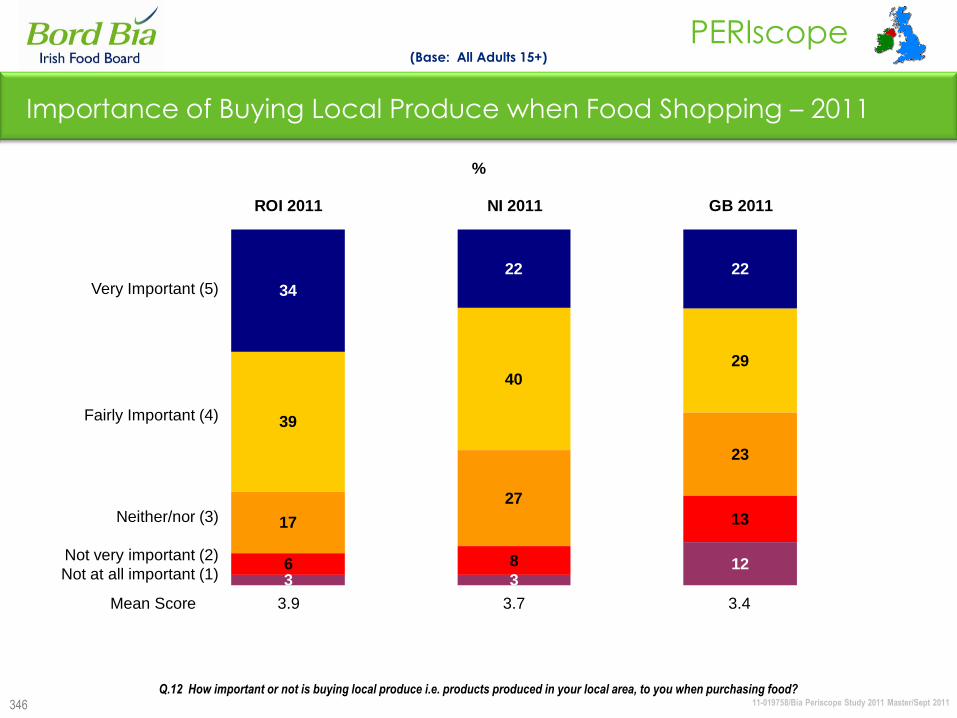
11-019758/Bia Periscope Study 2011 Master/Sept 2011
PERIscope
346
34
22 22
39
4029
17
27
23
6 8
13
3 312
ROI 2011 NI 2011 GB 2011
Importance of Buying Local Produce when Food Shopping – 2011
%
(Base: All Adults 15+)
Very Important (5)
Fairly Important (4)
Neither/nor (3)
Not very important (2)
Not at all important (1)
Mean Score 3.9 3.7 3.4
Q.12 How important or not is buying local produce i.e. products produced in your local area, to you when purchasing food?
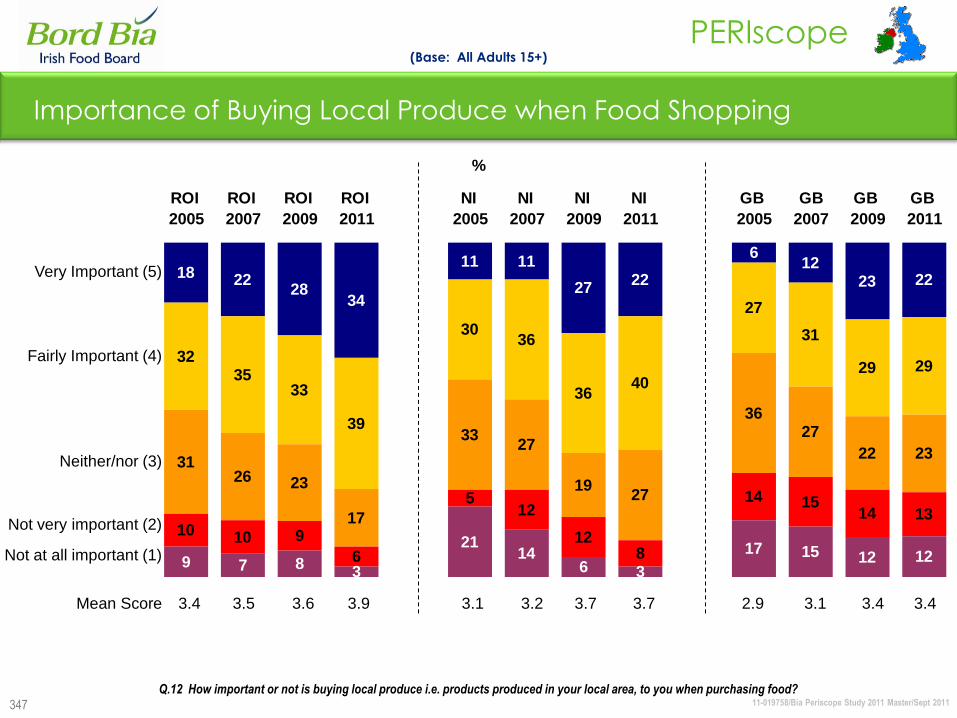
11-019758/Bia Periscope Study 2011 Master/Sept 2011
PERIscope
347
%
Very Important (5)
Fairly Important (4)
Neither/nor (3)
Not very important (2)
Not at all important (1)
18 2228
34
11 11
2722
612
23 22
3235
33
39
3036
3640
27
31
29 29
3126 23
17
3327
1927
3627
22 23
10 10 9
6
512
128
14 1514 13
9 7 83
2114
6 3
17 15 12 12
ROI
2005
ROI
2007
ROI
2009
ROI
2011
NI
2005
NI
2007
NI
2009
NI
2011
GB
2005
GB
2007
GB
2009
GB
2011
Importance of Buying Local Produce when Food Shopping
(Base: All Adults 15+)
Q.12 How important or not is buying local produce i.e. products produced in your local area, to you when purchasing food?
Mean Score 3.4 3.5 3.6 3.9 3.1 3.2 3.7 3.7 2.9 3.1 3.4 3.4
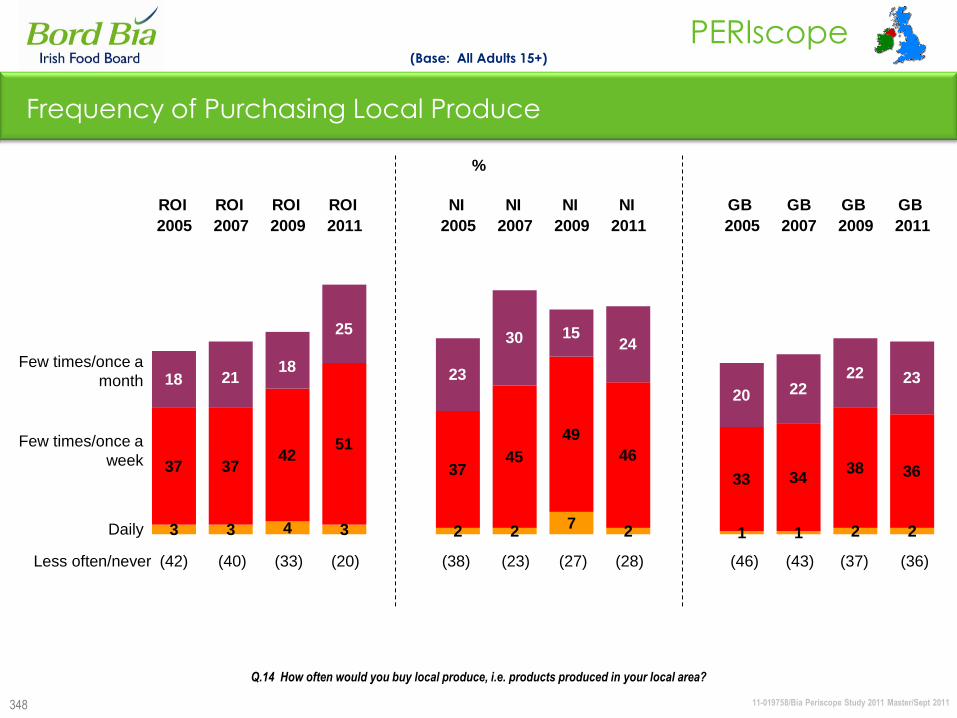
11-019758/Bia Periscope Study 2011 Master/Sept 2011
PERIscope
348
%
3 3 4 3 2 27
2 1 1 2 2
37 3742
51
3745
49
46
33 3438 36
18 23
30 1524
20 2222 2321
18
25
ROI
2005
ROI
2007
ROI
2009
ROI
2011
NI
2005
NI
2007
NI
2009
NI
2011
GB
2005
GB
2007
GB
2009
GB
2011
Q.14 How often would you buy local produce, i.e. products produced in your local area?
Frequency of Purchasing Local Produce
(Base: All Adults 15+)
Few times/once a
month
Few times/once a
week
Daily
Less often/never (42) (40) (33) (20) (38) (23) (27) (28) (46) (43) (37) (36)
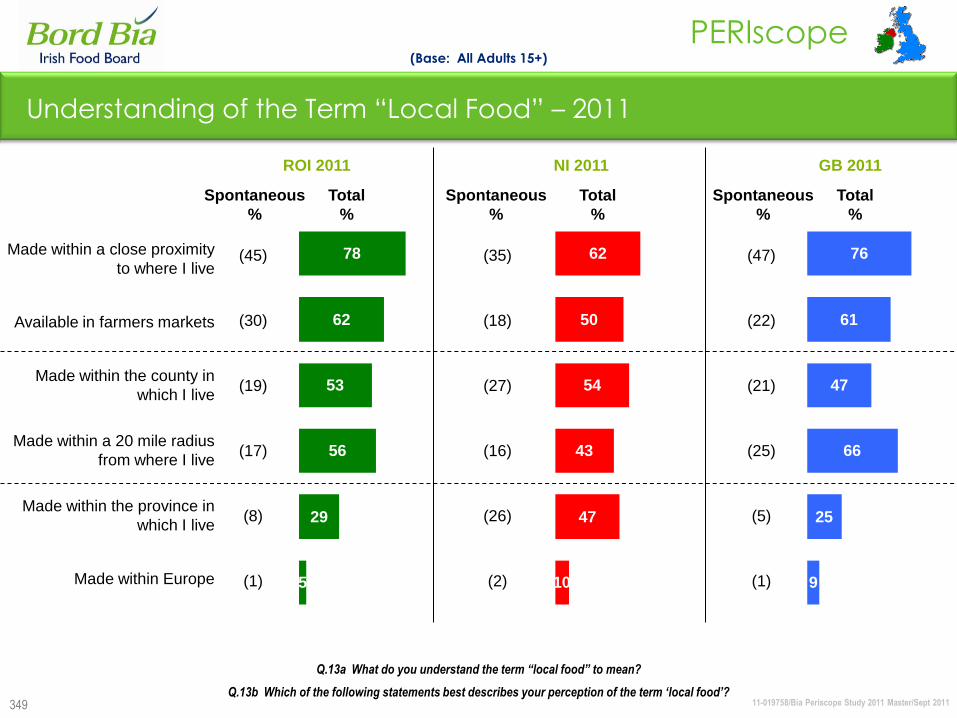
11-019758/Bia Periscope Study 2011 Master/Sept 2011
PERIscope
349
Understanding of the Term “Local Food” – 2011
(Base: All Adults 15+)
Made within a close proximity
to where I live
Available in farmers markets
Made within the county in
which I live
Made within a 20 mile radius
from where I live
Made within the province in
which I live
Made within Europe
Q.13a What do you understand the term “local food” to mean?
Q.13b Which of the following statements best describes your perception of the term „local food‟?
78
62
53
56
29
5
Spontaneous
%
Total
%
ROI 2011
Spontaneous
%
Total
%
NI 2011
Spontaneous
%
Total
%
GB 2011
(45)
(30)
(19)
(17)
(8)
(1)
62
50
54
43
47
10
(35)
(18)
(27)
(16)
(26)
(2)
(47)
(22)
(21)
(25)
(5)
(1)
76
61
47
66
25
9
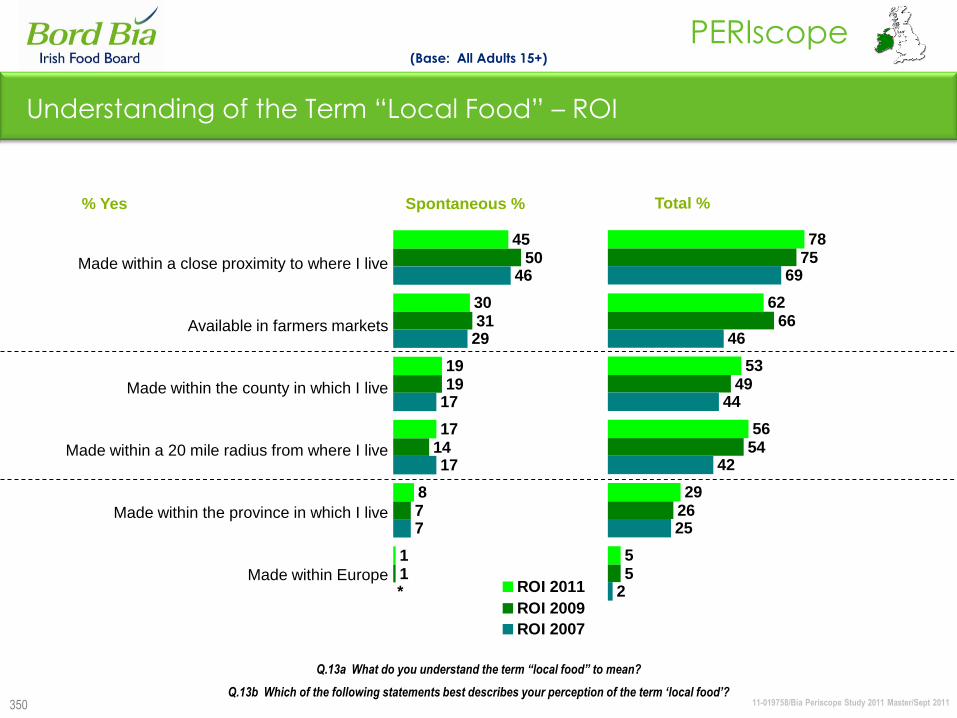
11-019758/Bia Periscope Study 2011 Master/Sept 2011
PERIscope
350
78
62
53
56
29
5
75
66
49
54
26
5
69
46
44
42
25
2
Understanding of the Term “Local Food” – ROI
% Yes
45
30
19
17
8
1
50
31
19
14
7
1
46
29
17
17
7
* ROI 2011
ROI 2009
ROI 2007
Spontaneous % Total %
(Base: All Adults 15+)
Made within a close proximity to where I live
Available in farmers markets
Made within the county in which I live
Made within a 20 mile radius from where I live
Made within the province in which I live
Made within Europe
Q.13a What do you understand the term “local food” to mean?
Q.13b Which of the following statements best describes your perception of the term „local food‟?
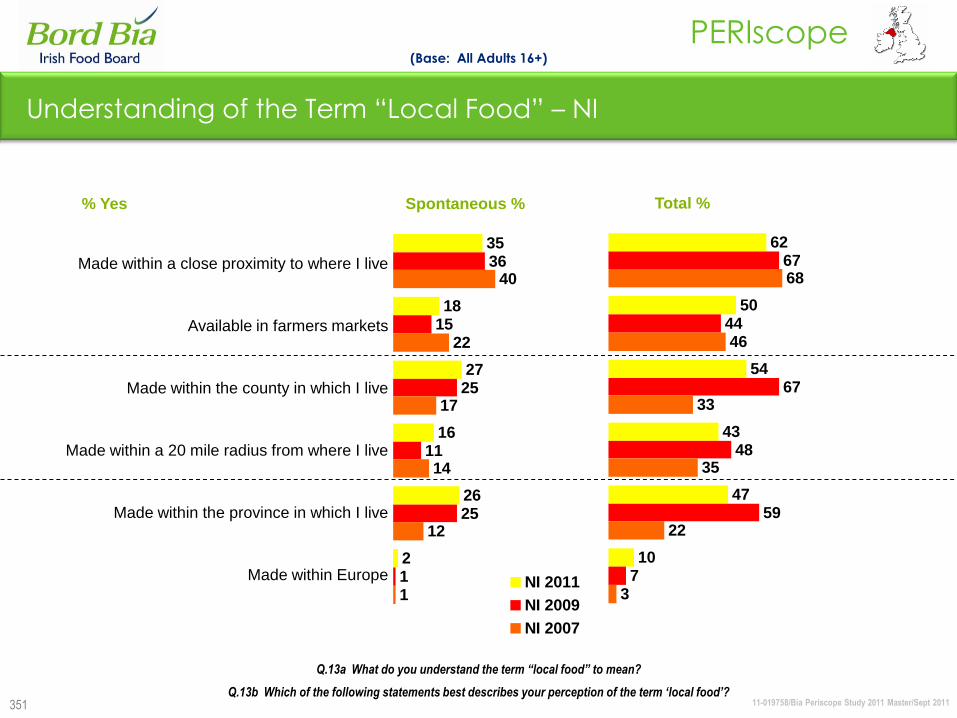
11-019758/Bia Periscope Study 2011 Master/Sept 2011
PERIscope
351
62
50
54
43
47
10
67
44
67
48
59
7
68
46
33
35
22
3
Understanding of the Term “Local Food” – NI
% Yes
35
18
27
16
26
2
36
15
25
11
25
1
40
22
17
14
12
1NI 2011
NI 2009
NI 2007
Spontaneous % Total %
(Base: All Adults 16+)
Made within a close proximity to where I live
Available in farmers markets
Made within the county in which I live
Made within a 20 mile radius from where I live
Made within the province in which I live
Made within Europe
Q.13a What do you understand the term “local food” to mean?
Q.13b Which of the following statements best describes your perception of the term „local food‟?
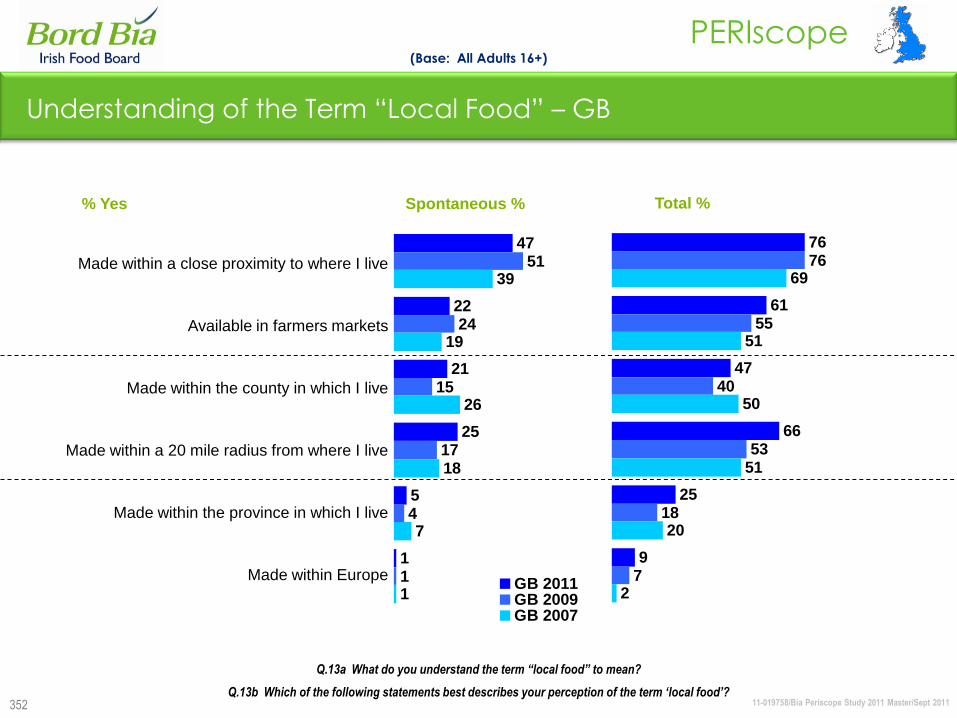
11-019758/Bia Periscope Study 2011 Master/Sept 2011
PERIscope
352
76
61
47
66
25
9
76
55
40
53
18
7
69
51
50
51
20
2
Understanding of the Term “Local Food” – GB
% Yes
47
22
21
25
5
1
51
24
15
17
4
1
39
19
26
18
7
1GB 2011GB 2009GB 2007
Spontaneous % Total %
(Base: All Adults 16+)
Made within a close proximity to where I live
Available in farmers markets
Made within the county in which I live
Made within a 20 mile radius from where I live
Made within the province in which I live
Made within Europe
Q.13a What do you understand the term “local food” to mean?
Q.13b Which of the following statements best describes your perception of the term „local food‟?
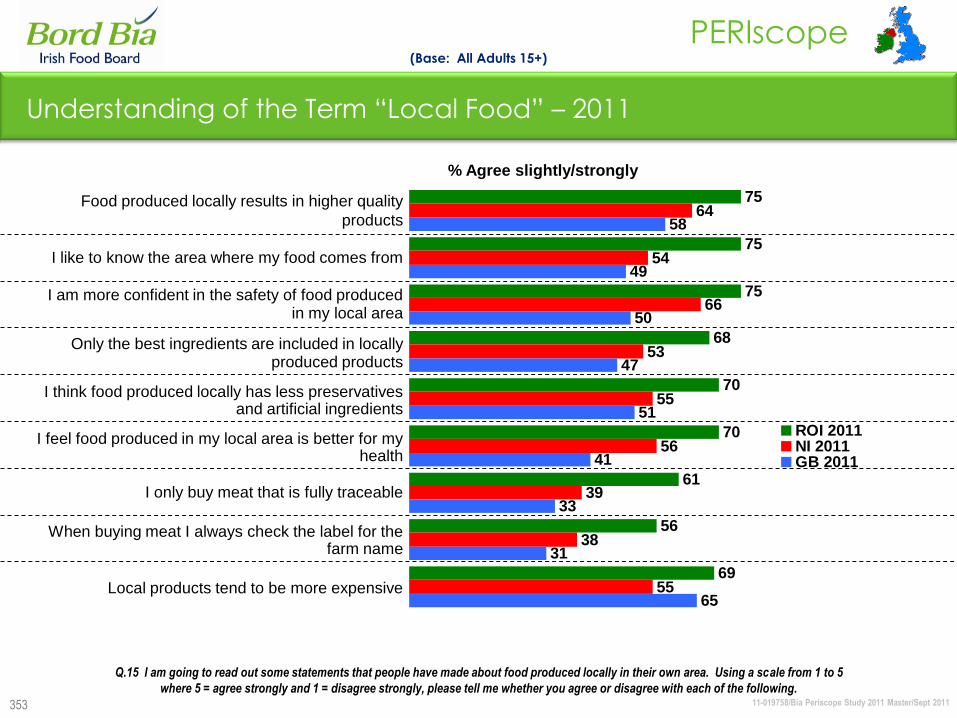
11-019758/Bia Periscope Study 2011 Master/Sept 2011
PERIscope
353
Understanding of the Term “Local Food” – 2011
(Base: All Adults 15+)
Q.15 I am going to read out some statements that people have made about food produced locally in their own area. Using a scale from 1 to 5
where 5 = agree strongly and 1 = disagree strongly, please tell me whether you agree or disagree with each of the following.
75
75
75
68
70
70
61
56
69
64
54
66
53
55
56
39
38
55
58
49
50
47
51
41
33
31
65
ROI 2011NI 2011GB 2011
Food produced locally results in higher quality
products
I like to know the area where my food comes from
I am more confident in the safety of food produced in my local area
Only the best ingredients are included in locally produced products
I think food produced locally has less preservatives and artificial ingredients
I feel food produced in my local area is better for my health
I only buy meat that is fully traceable
When buying meat I always check the label for the farm name
Local products tend to be more expensive
% Agree slightly/strongly

11-019758/Bia Periscope Study 2011 Master/Sept 2011
PERIscope
354
75
75
75
68
70
70
61
56
69
67
64
65
58
60
59
53
46
61
72
65
69
67
66
64
58
48
69
62
62
57
56
53
51
52
45
n/a
ROI 2011ROI 2009ROI 2007ROI 2005
Attitude Towards Food Produced Locally – ROI
(Base: All Adults 15+)
% Agree slightly/strongly
Q.15 I am going to read out some statements that people have made about food produced locally in their own area. Using a scale from 1 to 5
where 5 = agree strongly and 1 = disagree strongly, please tell me whether you agree or disagree with each of the following.
Food produced locally results in higher quality
products
I like to know the area where my food comes from
I am more confident in the safety of food produced
in my local area
Only the best ingredients are included in locally
produced products
I think food produced locally has less preservatives
and artificial ingredients
I feel food produced in my local area is better for my
health
I only buy meat that is fully traceable
When buying meat I always check the label for the
farm name
Local products tend to be more expensive

11-019758/Bia Periscope Study 2011 Master/Sept 2011
PERIscope
355
64
54
66
53
55
56
39
38
55
68
55
63
57
52
54
34
34
55
59
56
56
45
57
52
46
31
61
51
47
52
53
44
48
44
43
n/a
NI 2011NI 2009NI 2007NI 2005
Attitude Towards Food Produced Locally – NI
(Base: All Adults 16+)
Q.15 I am going to read out some statements that people have made about food produced locally in their own area. Using a scale from 1 to 5
where 5 = agree strongly and 1 = disagree strongly, please tell me whether you agree or disagree with each of the following.
Food produced locally results in higher quality
products
I like to know the area where my food comes from
I am more confident in the safety of food produced
in my local area
Only the best ingredients are included in locally
produced products
I think food produced locally has less preservatives
and artificial ingredients
I feel food produced in my local area is better for my
health
I only buy meat that is fully traceable
When buying meat I always check the label for the
farm name
Local products tend to be more expensive
% Agree slightly/strongly
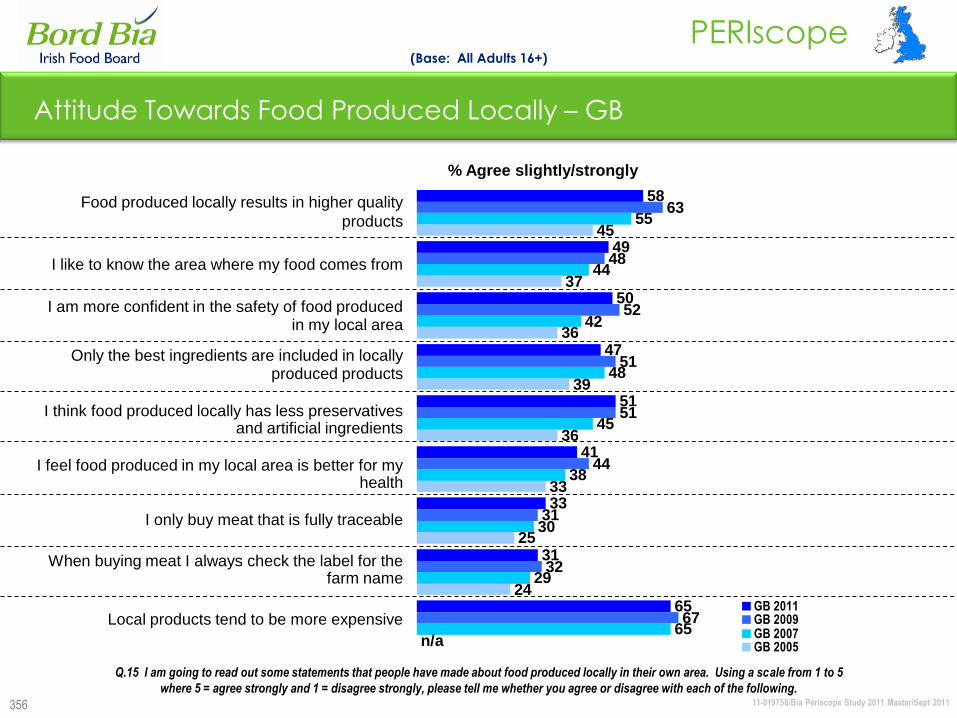
11-019758/Bia Periscope Study 2011 Master/Sept 2011
PERIscope
356
58
49
50
47
51
41
33
31
65
63
48
52
51
51
44
31
32
67
55
44
42
48
45
38
30
29
65
45
37
36
39
36
33
25
24
n/a
GB 2011GB 2009GB 2007GB 2005
Attitude Towards Food Produced Locally – GB
(Base: All Adults 16+)
Q.15 I am going to read out some statements that people have made about food produced locally in their own area. Using a scale from 1 to 5
where 5 = agree strongly and 1 = disagree strongly, please tell me whether you agree or disagree with each of the following.
Food produced locally results in higher quality
products
I like to know the area where my food comes from
I am more confident in the safety of food produced in my local area
Only the best ingredients are included in locally produced products
I think food produced locally has less preservatives and artificial ingredients
I feel food produced in my local area is better for my health
I only buy meat that is fully traceable
When buying meat I always check the label for the farm name
Local products tend to be more expensive
% Agree slightly/strongly

Speciality Foods
11-019758/Bia Periscope Study 2011 Master/Sept 2011
PERIscope
358
Speciality Foods: Summary
In ROI, consumers are most likely to regard farmhouse cheese, smoked salmon and organic
food as „speciality‟. In NI, the top mentions for speciality food are smoked salmon, fresh seafood
and homemade bread, while in GB smoked salmon, sushi and pate are the top mentions.
GB consumers are less likely to associate certain food types with the „speciality‟ label; an
illustration of their higher consumption of these foods and subsequently their view that they are
more mainstream than specialist. Indeed, the % of GB consumers that have „ever bought‟
speciality foods (as defined by this study) is higher for all categories, except smoked salmon,
handmade bread and handmade chocolates.
The movement of these products into the mainstream may gain further momentum in the future
as the % of „ever bought‟ for each food type has increased across the board in ROI. Ni
consumers seem to be less engaged with the category overall.
The two main values associated with speciality foods continue to be „expensive‟ and „high
quality‟.
While speciality foods have retained their stature as a „treat for the family‟ or as a „treat for
myself‟, they also represent foods that are of high quality. However, they have declined
considerably as a food that can be used as „a gift‟.
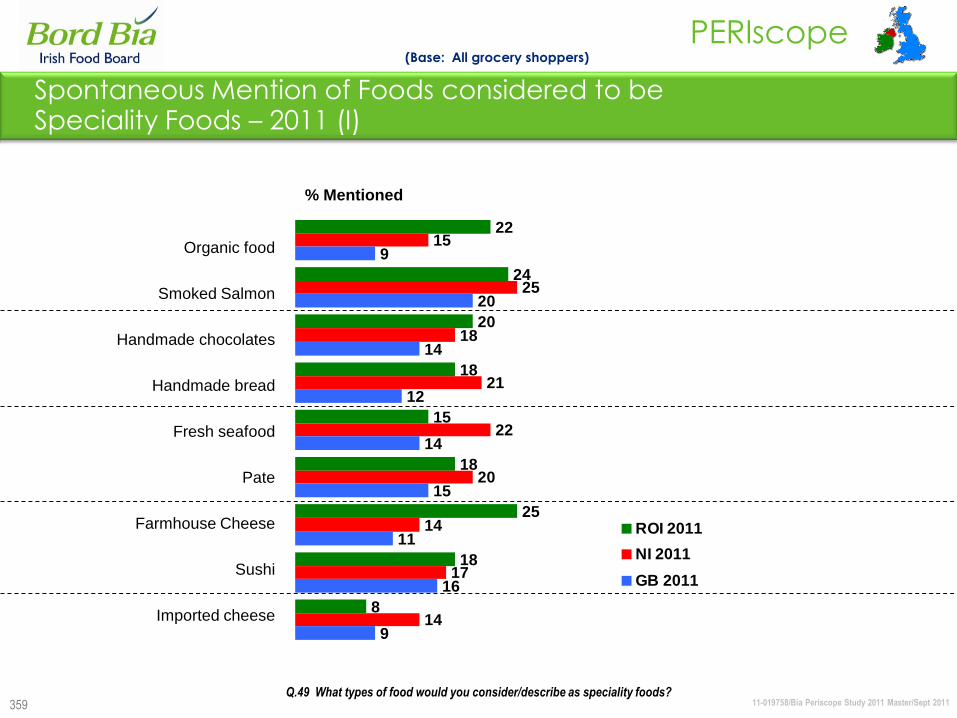
11-019758/Bia Periscope Study 2011 Master/Sept 2011
PERIscope
359
(Base: All grocery shoppers)
Q.49 What types of food would you consider/describe as speciality foods?
22
24
20
18
15
18
25
18
8
15
25
18
21
22
20
14
17
14
9
20
14
12
14
15
11
16
9
ROI 2011
NI 2011
GB 2011
Organic food
Smoked Salmon
Handmade chocolates
Handmade bread
Fresh seafood
Pate
Farmhouse Cheese
Sushi
Imported cheese
% Mentioned
Spontaneous Mention of Foods considered to be Speciality Foods – 2011 (I)
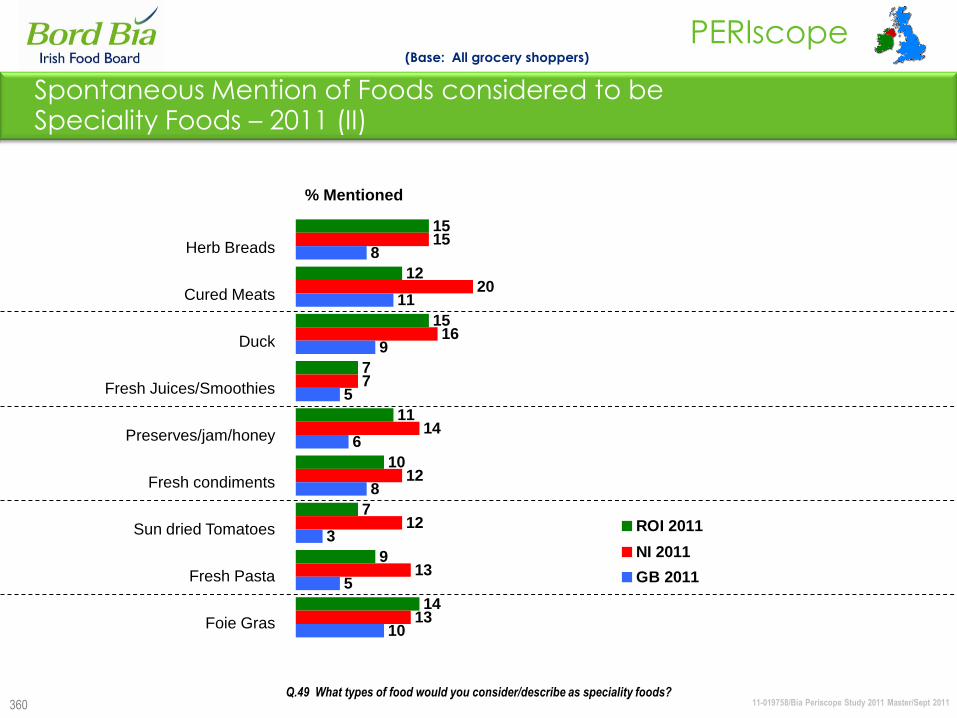
11-019758/Bia Periscope Study 2011 Master/Sept 2011
PERIscope
360
(Base: All grocery shoppers)
Herb Breads
Cured Meats
Duck
Fresh Juices/Smoothies
Preserves/jam/honey
Fresh condiments
Sun dried Tomatoes
Fresh Pasta
Foie Gras
% Mentioned
Q.49 What types of food would you consider/describe as speciality foods?
Spontaneous Mention of Foods considered to be Speciality Foods – 2011 (II)
15
12
15
7
11
10
7
9
14
15
20
16
7
14
12
12
13
13
8
11
9
5
6
8
3
5
10
ROI 2011
NI 2011
GB 2011

11-019758/Bia Periscope Study 2011 Master/Sept 2011
PERIscope
361
(Base: All grocery shoppers)
Olive Oil
Salami
Deli Food
Balsamic Vinegar
Oils/Mustards/Relishes
Micro Brewed Beer
% Mentioned
Q.49 What types of food would you consider/describe as speciality foods?
Spontaneous Mention of Foods considered to be Speciality Foods – 2011 (III)
7
7
6
6
6
5
9
17
12
10
9
6
8
4
10
4
4
3
ROI 2011
NI 2011
GB 2011

11-019758/Bia Periscope Study 2011 Master/Sept 2011
PERIscope
362
22
24
20
18
15
18
25
18
8
20
23
18
17
17
22
23
14
8
26
26
25
22
18
17
17
16
12
23
23
21
15
21
21
18
12
15
ROI 2011
ROI 2009
ROI 2007
ROI 2005
Spontaneous Mention of Foods considered to be Speciality Foods – ROI (I)
(Base: All grocery shoppers)
% Mentioned
Organic food
Smoked Salmon
Handmade chocolates
Handmade bread
Fresh seafood
Pate
Farmhouse Cheese
Sushi
Imported cheese
Q.49 What types of food would you consider/describe as speciality foods?
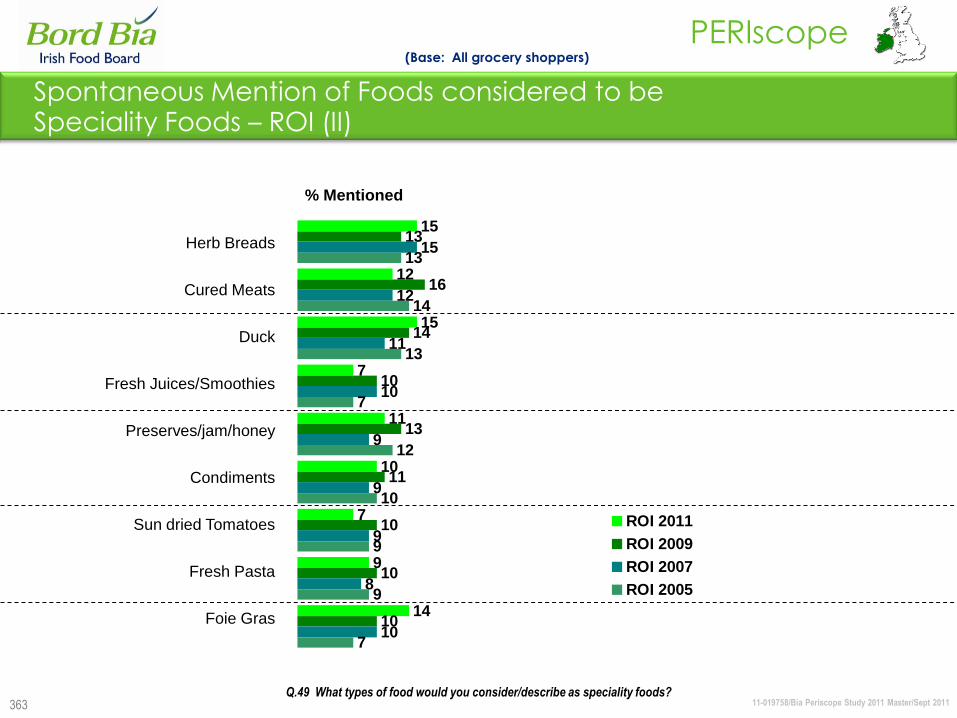
11-019758/Bia Periscope Study 2011 Master/Sept 2011
PERIscope
363
Spontaneous Mention of Foods considered to be Speciality Foods – ROI (II)
(Base: All grocery shoppers)
% Mentioned
Herb Breads
Cured Meats
Duck
Fresh Juices/Smoothies
Preserves/jam/honey
Condiments
Sun dried Tomatoes
Fresh Pasta
Foie Gras
Q.49 What types of food would you consider/describe as speciality foods?
15
12
15
7
11
10
7
9
14
13
16
14
10
13
11
10
10
10
15
12
11
10
9
9
9
8
10
13
14
13
7
12
10
9
9
7
ROI 2011
ROI 2009
ROI 2007
ROI 2005
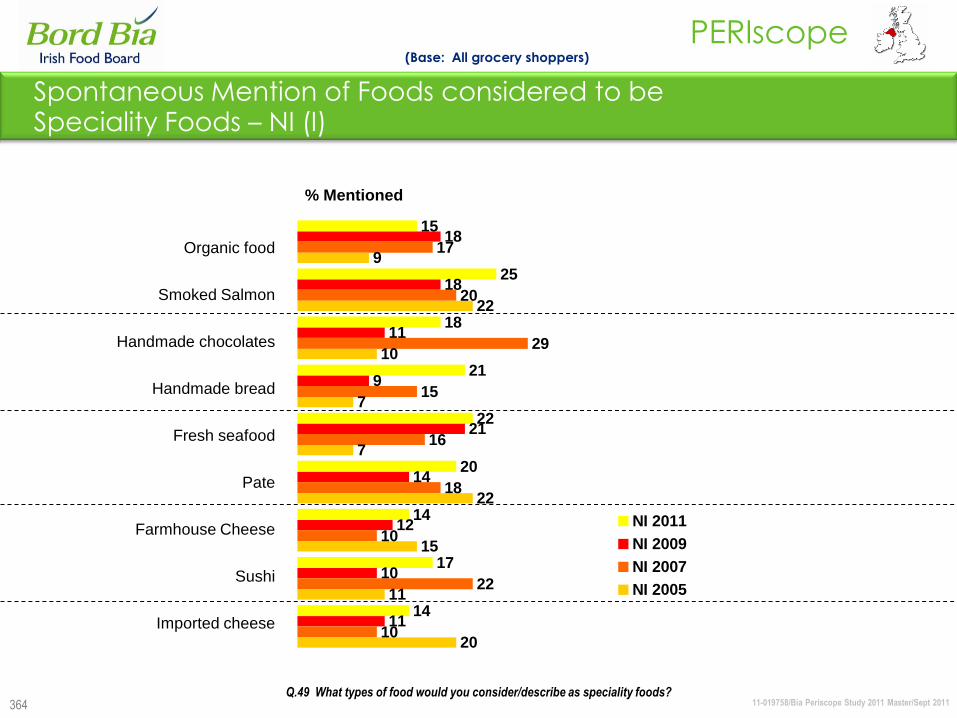
11-019758/Bia Periscope Study 2011 Master/Sept 2011
PERIscope
364
15
25
18
21
22
20
14
17
14
18
18
11
9
21
14
12
10
11
17
20
29
15
16
18
10
22
10
9
22
10
7
7
22
15
11
20
NI 2011
NI 2009
NI 2007
NI 2005
Spontaneous Mention of Foods considered to be Speciality Foods – NI (I)
(Base: All grocery shoppers)
% Mentioned
Organic food
Smoked Salmon
Handmade chocolates
Handmade bread
Fresh seafood
Pate
Farmhouse Cheese
Sushi
Imported cheese
Q.49 What types of food would you consider/describe as speciality foods?
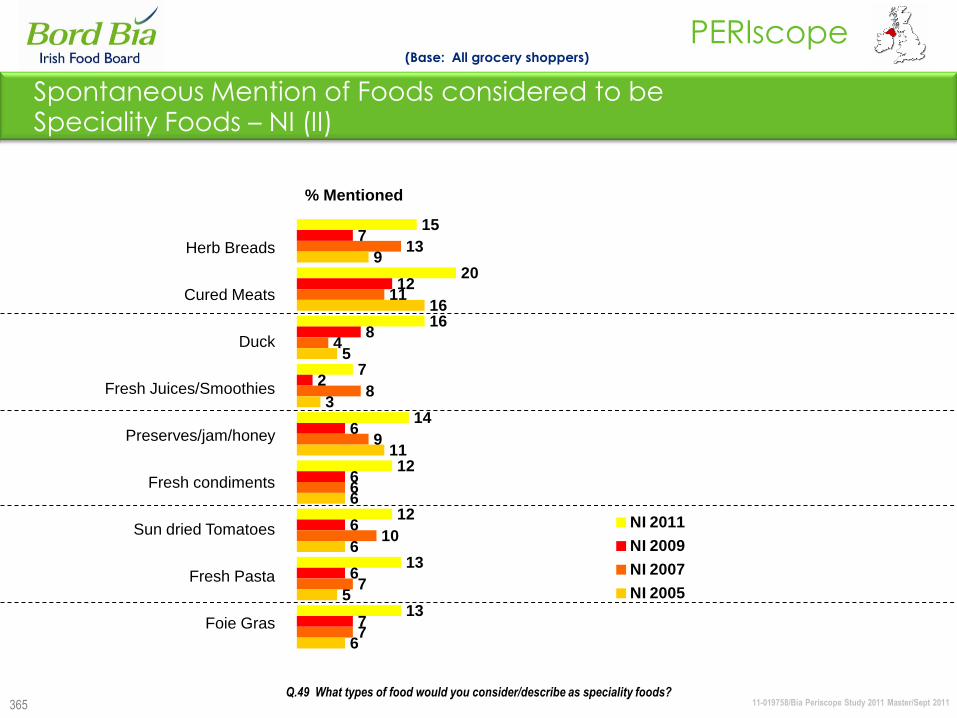
11-019758/Bia Periscope Study 2011 Master/Sept 2011
PERIscope
365
15
20
16
7
14
12
12
13
13
7
12
8
2
6
6
6
6
7
13
11
4
8
9
6
10
7
7
9
16
5
3
11
6
6
5
6
NI 2011
NI 2009
NI 2007
NI 2005
Spontaneous Mention of Foods considered to be Speciality Foods – NI (II)
(Base: All grocery shoppers)
% Mentioned
Herb Breads
Cured Meats
Duck
Fresh Juices/Smoothies
Preserves/jam/honey
Fresh condiments
Sun dried Tomatoes
Fresh Pasta
Foie Gras
Q.49 What types of food would you consider/describe as speciality foods?
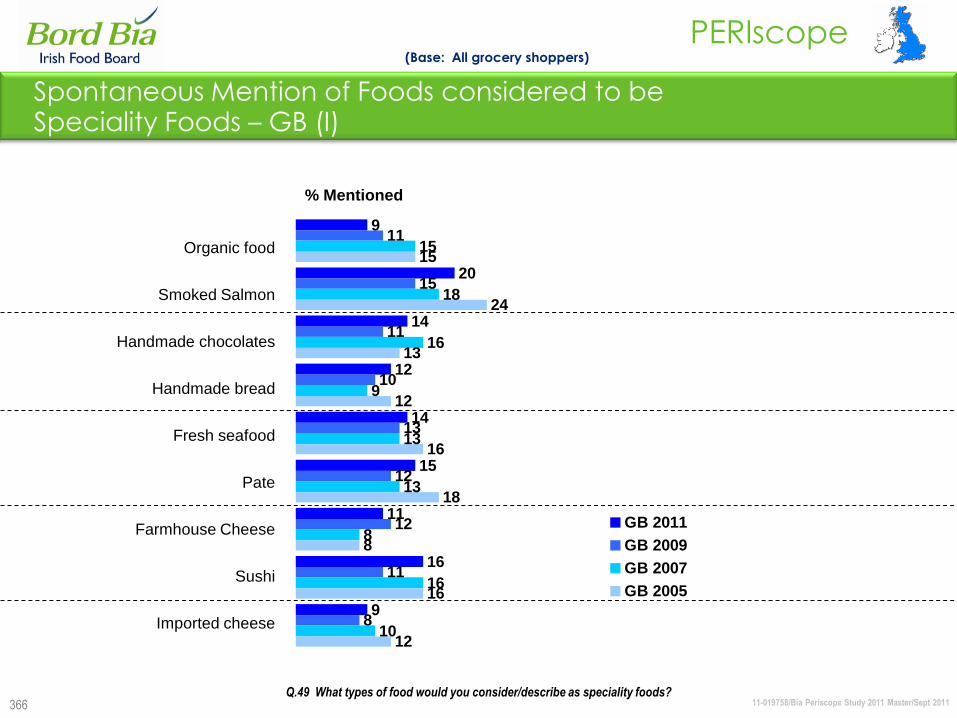
11-019758/Bia Periscope Study 2011 Master/Sept 2011
PERIscope
366
Spontaneous Mention of Foods considered to be Speciality Foods – GB (I)
(Base: All grocery shoppers)
% Mentioned
Organic food
Smoked Salmon
Handmade chocolates
Handmade bread
Fresh seafood
Pate
Farmhouse Cheese
Sushi
Imported cheese
Q.49 What types of food would you consider/describe as speciality foods?
9
20
14
12
14
15
11
16
9
11
15
11
10
13
12
12
11
8
15
18
16
9
13
13
8
16
10
15
24
13
12
16
18
8
16
12
GB 2011
GB 2009
GB 2007
GB 2005
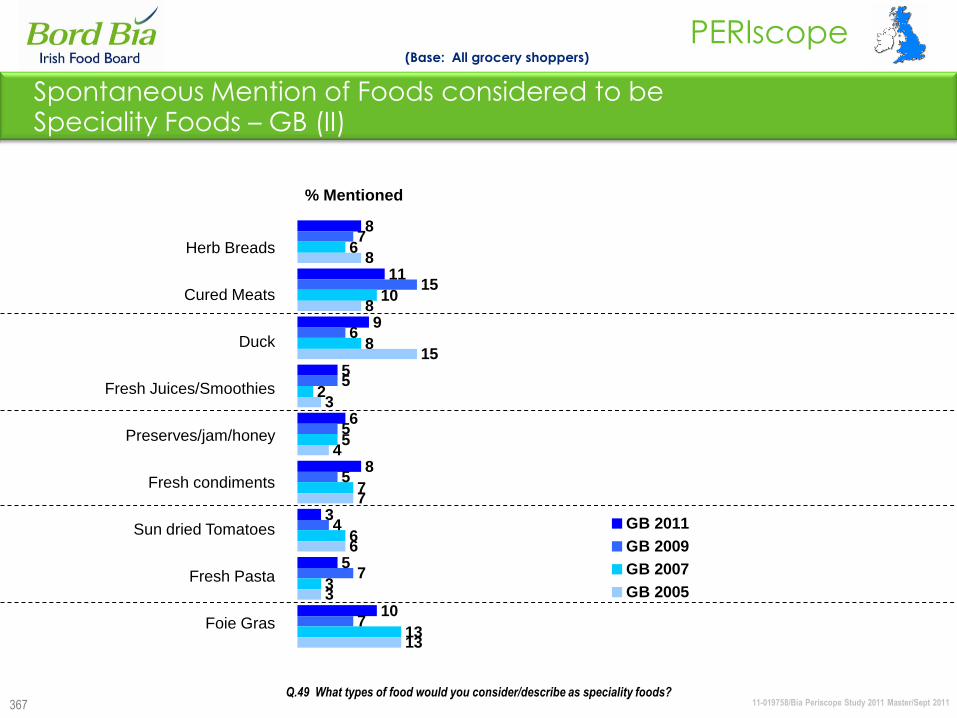
11-019758/Bia Periscope Study 2011 Master/Sept 2011
PERIscope
367
8
11
9
5
6
8
3
5
10
7
15
6
5
5
5
4
7
7
6
10
8
2
5
7
6
3
13
8
8
15
3
4
7
6
3
13
GB 2011
GB 2009
GB 2007
GB 2005
Spontaneous Mention of Foods considered to be Speciality Foods – GB (II)
(Base: All grocery shoppers)
% Mentioned
Herb Breads
Cured Meats
Duck
Fresh Juices/Smoothies
Preserves/jam/honey
Fresh condiments
Sun dried Tomatoes
Fresh Pasta
Foie Gras
Q.49 What types of food would you consider/describe as speciality foods?
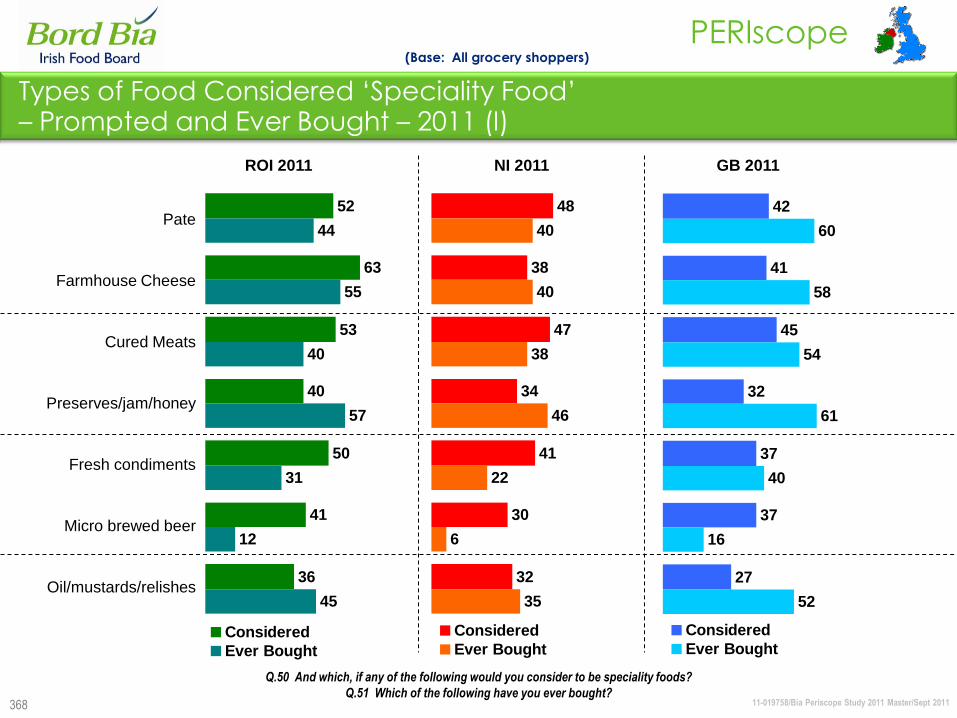
11-019758/Bia Periscope Study 2011 Master/Sept 2011
PERIscope
368
Types of Food Considered „Speciality Food‟ – Prompted and Ever Bought – 2011 (I)
(Base: All grocery shoppers)
Pate
Farmhouse Cheese
Cured Meats
Preserves/jam/honey
Fresh condiments
Micro brewed beer
Oil/mustards/relishes
ROI 2011 NI 2011
Q.50 And which, if any of the following would you consider to be speciality foods?
Q.51 Which of the following have you ever bought?
52
63
53
40
50
41
36
44
55
40
57
31
12
45
Considered
Ever Bought
48
38
47
34
41
30
32
40
40
38
46
22
6
35
Considered
Ever Bought
42
41
45
32
37
37
27
60
58
54
61
40
16
52
Considered
Ever Bought
GB 2011
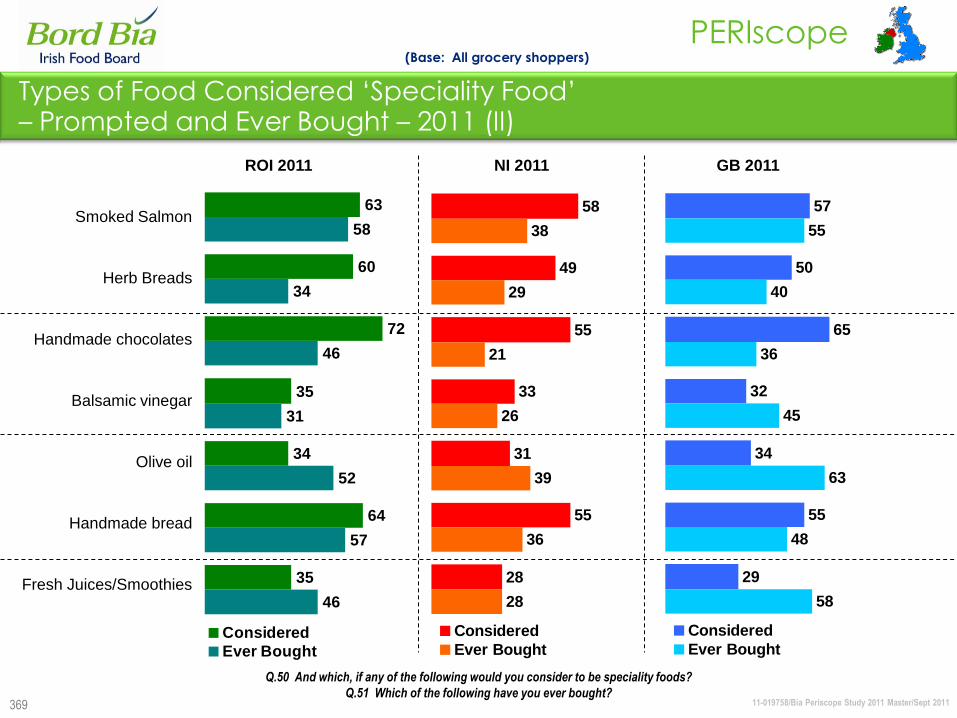
11-019758/Bia Periscope Study 2011 Master/Sept 2011
PERIscope
369
Types of Food Considered „Speciality Food‟ – Prompted and Ever Bought – 2011 (II)
(Base: All grocery shoppers)
Smoked Salmon
Herb Breads
Handmade chocolates
Balsamic vinegar
Olive oil
Handmade bread
Fresh Juices/Smoothies
ROI 2011 NI 2011
Q.50 And which, if any of the following would you consider to be speciality foods?
Q.51 Which of the following have you ever bought?
63
60
72
35
34
64
35
58
34
46
31
52
57
46
Considered
Ever Bought
58
49
55
33
31
55
28
38
29
21
26
39
36
28
Considered
Ever Bought
GB 2011
57
50
65
32
34
55
29
55
40
36
45
63
48
58
Considered
Ever Bought
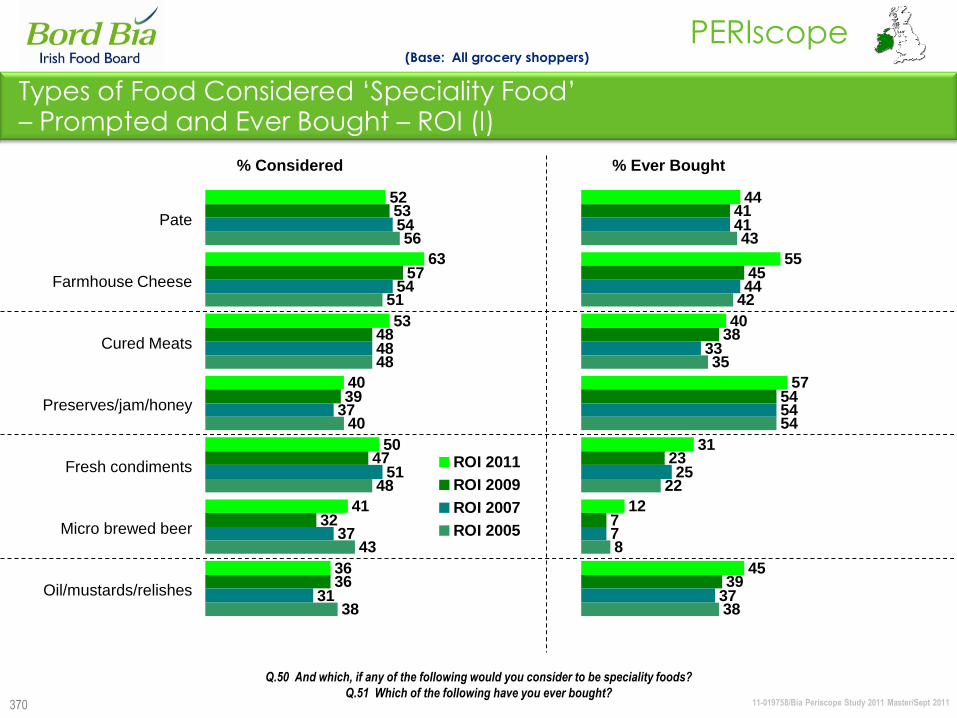
11-019758/Bia Periscope Study 2011 Master/Sept 2011
PERIscope
52
63
53
40
50
41
36
53
57
48
39
47
32
36
54
54
48
37
51
37
31
56
51
48
40
48
43
38
ROI 2011
ROI 2009
ROI 2007
ROI 2005
370
Types of Food Considered „Speciality Food‟ – Prompted and Ever Bought – ROI (I)
(Base: All grocery shoppers)
Pate
Farmhouse Cheese
Cured Meats
Preserves/jam/honey
Fresh condiments
Micro brewed beer
Oil/mustards/relishes
% Considered
Q.50 And which, if any of the following would you consider to be speciality foods?
Q.51 Which of the following have you ever bought?
% Ever Bought
44
55
40
57
31
12
45
41
45
38
54
23
7
39
41
44
33
54
25
7
37
43
42
35
54
22
8
38
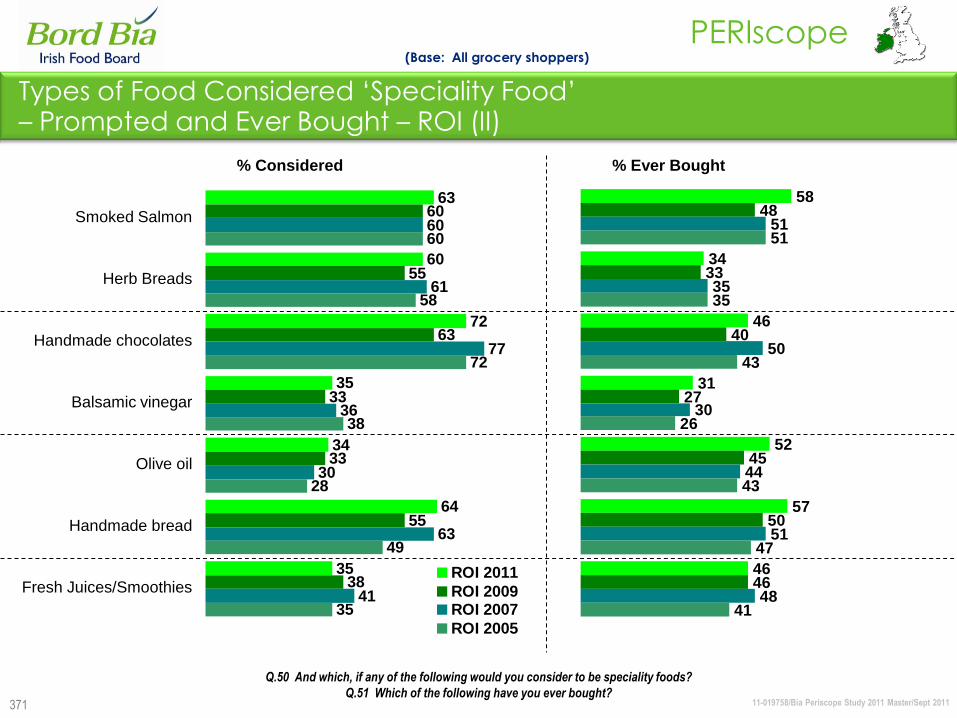
11-019758/Bia Periscope Study 2011 Master/Sept 2011
PERIscope
371
Types of Food Considered „Speciality Food‟ – Prompted and Ever Bought – ROI (II)
(Base: All grocery shoppers)
Smoked Salmon
Herb Breads
Handmade chocolates
Balsamic vinegar
Olive oil
Handmade bread
Fresh Juices/Smoothies
% Considered
Q.50 And which, if any of the following would you consider to be speciality foods?
Q.51 Which of the following have you ever bought?
63
60
72
35
34
64
35
60
55
63
33
33
55
38
60
61
77
36
30
63
41
60
58
72
38
28
49
35
ROI 2011
ROI 2009ROI 2007
ROI 2005
58
34
46
31
52
57
46
48
33
40
27
45
50
46
51
35
50
30
44
51
48
51
35
43
26
43
47
41
% Ever Bought
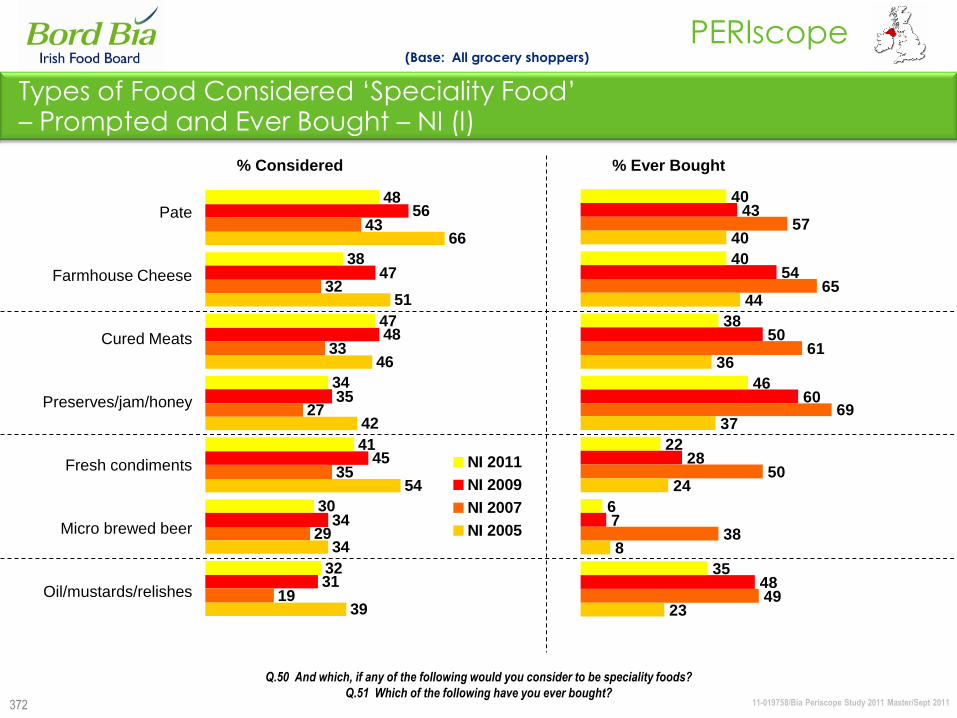
11-019758/Bia Periscope Study 2011 Master/Sept 2011
PERIscope
372
Types of Food Considered „Speciality Food‟ – Prompted and Ever Bought – NI (I)
(Base: All grocery shoppers)
Pate
Farmhouse Cheese
Cured Meats
Preserves/jam/honey
Fresh condiments
Micro brewed beer
Oil/mustards/relishes
% Considered
Q.50 And which, if any of the following would you consider to be speciality foods?
Q.51 Which of the following have you ever bought?
48
38
47
34
41
30
32
56
47
48
35
45
34
31
43
32
33
27
35
29
19
66
51
46
42
54
34
39
NI 2011
NI 2009
NI 2007
NI 2005
40
40
38
46
22
6
35
43
54
50
60
28
7
48
57
65
61
69
50
38
49
40
44
36
37
24
8
23
% Ever Bought
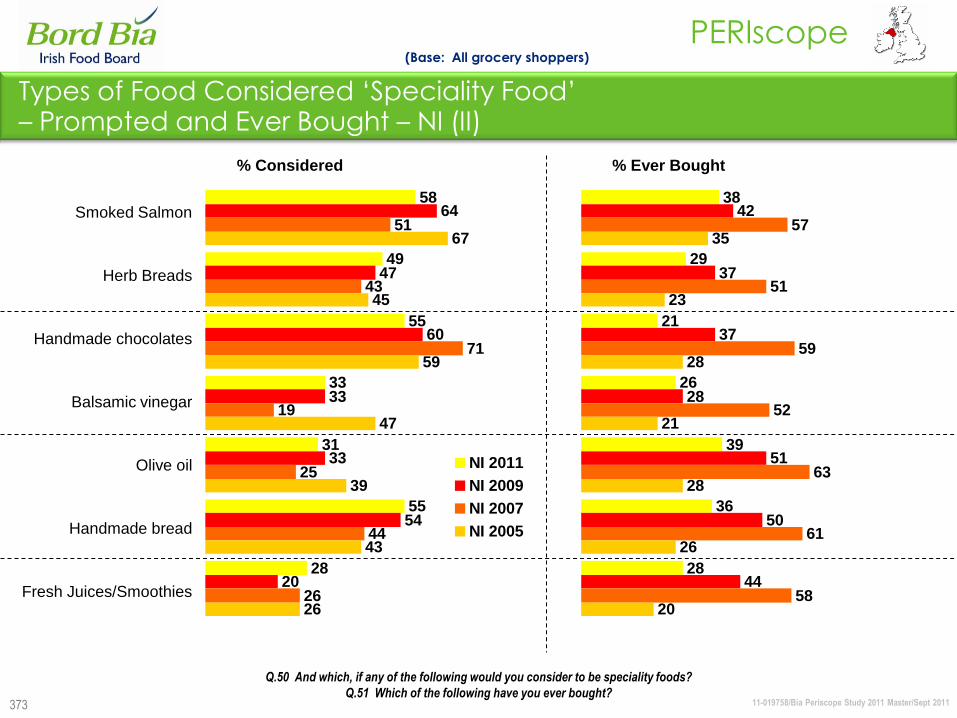
11-019758/Bia Periscope Study 2011 Master/Sept 2011
PERIscope
373
Types of Food Considered „Speciality Food‟ – Prompted and Ever Bought – NI (II)
(Base: All grocery shoppers)
Smoked Salmon
Herb Breads
Handmade chocolates
Balsamic vinegar
Olive oil
Handmade bread
Fresh Juices/Smoothies
% Considered
Q.50 And which, if any of the following would you consider to be speciality foods?
Q.51 Which of the following have you ever bought?
% Ever Bought
58
49
55
33
31
55
28
64
47
60
33
33
54
20
51
43
71
19
25
44
26
67
45
59
47
39
43
26
NI 2011
NI 2009
NI 2007
NI 2005
38
29
21
26
39
36
28
42
37
37
28
51
50
44
57
51
59
52
63
61
58
35
23
28
21
28
26
20
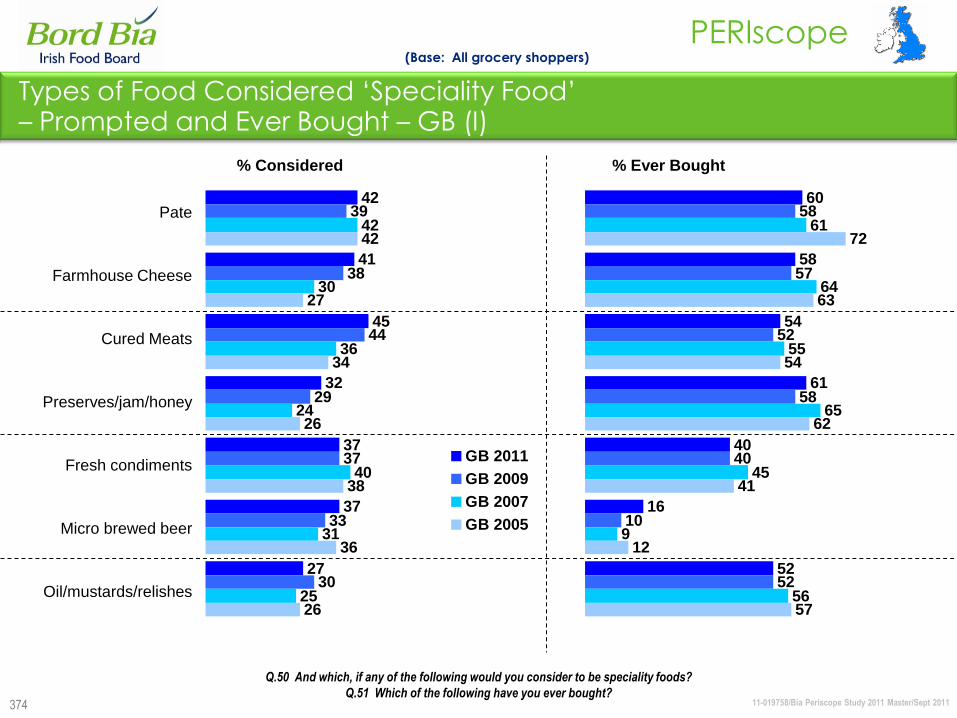
11-019758/Bia Periscope Study 2011 Master/Sept 2011
PERIscope
374
Types of Food Considered „Speciality Food‟ – Prompted and Ever Bought – GB (I)
(Base: All grocery shoppers)
Pate
Farmhouse Cheese
Cured Meats
Preserves/jam/honey
Fresh condiments
Micro brewed beer
Oil/mustards/relishes
% Considered
Q.50 And which, if any of the following would you consider to be speciality foods?
Q.51 Which of the following have you ever bought?
42
41
45
32
37
37
27
39
38
44
29
37
33
30
42
30
36
24
40
31
25
42
27
34
26
38
36
26
GB 2011
GB 2009
GB 2007
GB 2005
60
58
54
61
40
16
52
58
57
52
58
40
10
52
61
64
55
65
45
9
56
72
63
54
62
41
12
57
% Ever Bought

11-019758/Bia Periscope Study 2011 Master/Sept 2011
PERIscope
375
Types of Food Considered „Speciality Food‟ – Prompted and Ever Bought – GB (II)
(Base: All grocery shoppers)
Smoked Salmon
Herb Breads
Handmade chocolates
Balsamic vinegar
Olive oil
Handmade bread
Fresh Juices/Smoothies
% Considered
Q.50 And which, if any of the following would you consider to be speciality foods?
Q.51 Which of the following have you ever bought?
% Ever Bought
57
50
65
32
34
55
29
59
53
68
33
37
57
30
55
47
71
33
28
50
19
58
44
65
33
27
50
20
GB 2011
GB 2009
GB 2007
GB 2005
55
40
36
45
63
48
58
50
37
36
37
59
39
54
50
41
48
36
56
46
57
54
42
47
42
60
45
58
11-019758/Bia Periscope Study 2011 Master/Sept 2011
PERIscope
376
Definition – Speciality Food
Speciality Food
Speciality food is defined as handmade or
hand crafted food typically using quality
ingredients from local or small scale
producers.
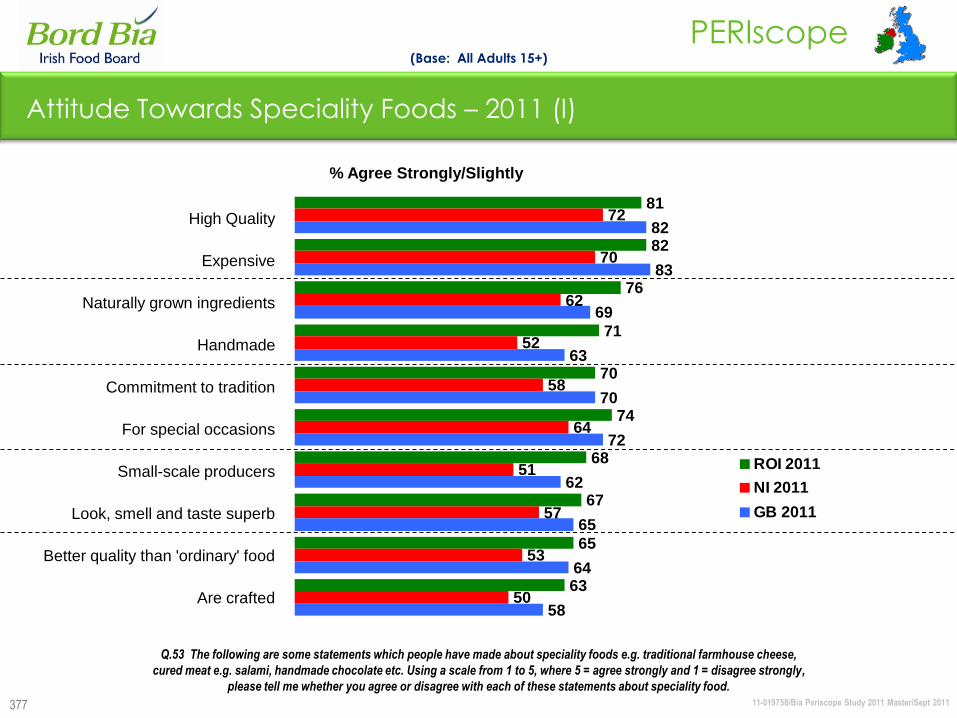
11-019758/Bia Periscope Study 2011 Master/Sept 2011
PERIscope
377
High Quality
Expensive
Naturally grown ingredients
Handmade
Commitment to tradition
For special occasions
Small-scale producers
Look, smell and taste superb
Better quality than 'ordinary' food
Are crafted
Attitude Towards Speciality Foods – 2011 (I)
(Base: All Adults 15+)
Q.53 The following are some statements which people have made about speciality foods e.g. traditional farmhouse cheese,
cured meat e.g. salami, handmade chocolate etc. Using a scale from 1 to 5, where 5 = agree strongly and 1 = disagree strongly,
please tell me whether you agree or disagree with each of these statements about speciality food.
81
82
76
71
70
74
68
67
65
63
72
70
62
52
58
64
51
57
53
50
82
83
69
63
70
72
62
65
64
58
ROI 2011
NI 2011
GB 2011
% Agree Strongly/Slightly
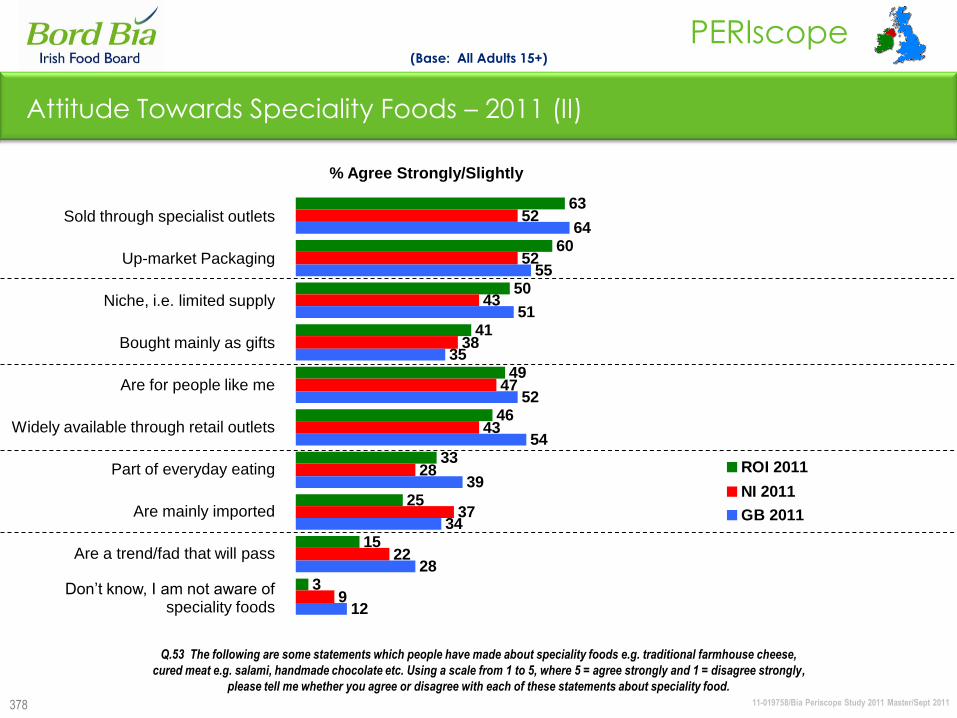
11-019758/Bia Periscope Study 2011 Master/Sept 2011
PERIscope
378
Q.53 The following are some statements which people have made about speciality foods e.g. traditional farmhouse cheese,
cured meat e.g. salami, handmade chocolate etc. Using a scale from 1 to 5, where 5 = agree strongly and 1 = disagree strongly,
please tell me whether you agree or disagree with each of these statements about speciality food.
Sold through specialist outlets
Up-market Packaging
Niche, i.e. limited supply
Bought mainly as gifts
Are for people like me
Widely available through retail outlets
Part of everyday eating
Are mainly imported
Are a trend/fad that will pass
Don‟t know, I am not aware of speciality foods
Attitude Towards Speciality Foods – 2011 (II)
(Base: All Adults 15+)
63
60
50
41
49
46
33
25
15
3
52
52
43
38
47
43
28
37
22
9
64
55
51
35
52
54
39
34
28
12
ROI 2011
NI 2011
GB 2011
% Agree Strongly/Slightly
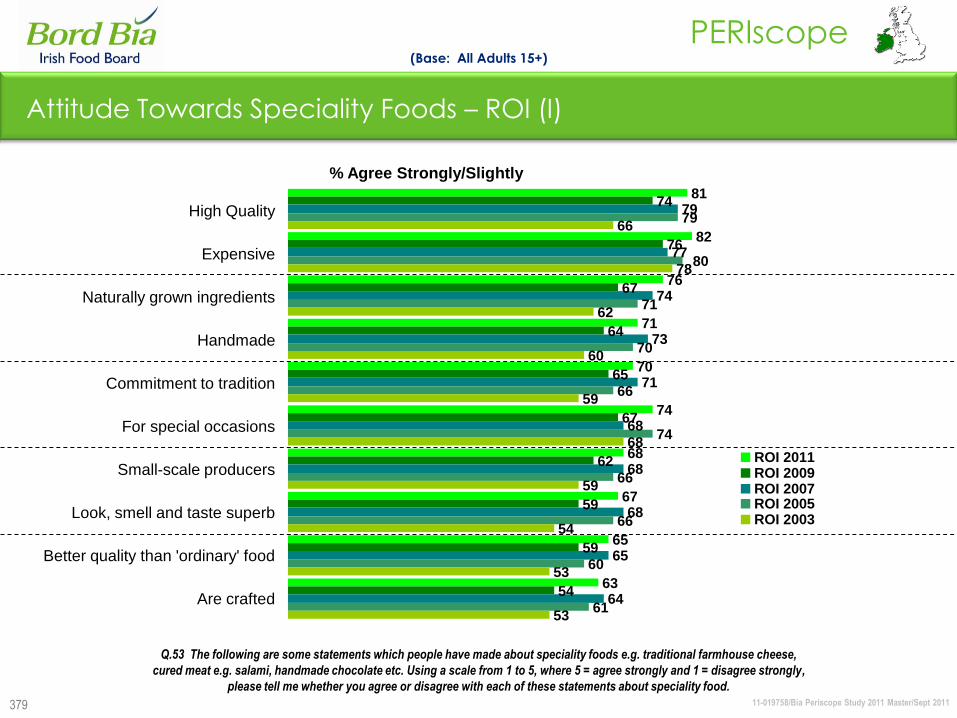
11-019758/Bia Periscope Study 2011 Master/Sept 2011
PERIscope
379
High Quality
Expensive
Naturally grown ingredients
Handmade
Commitment to tradition
For special occasions
Small-scale producers
Look, smell and taste superb
Better quality than 'ordinary' food
Are crafted
Attitude Towards Speciality Foods – ROI (I)
(Base: All Adults 15+)
Q.53 The following are some statements which people have made about speciality foods e.g. traditional farmhouse cheese,
cured meat e.g. salami, handmade chocolate etc. Using a scale from 1 to 5, where 5 = agree strongly and 1 = disagree strongly,
please tell me whether you agree or disagree with each of these statements about speciality food.
% Agree Strongly/Slightly
81
82
76
71
70
74
68
67
65
63
74
76
67
64
65
67
62
59
59
54
79
77
74
73
71
68
68
68
65
64
79
71
70
66
74
66
66
60
61
66
78
62
60
59
68
59
54
53
53
80
ROI 2011ROI 2009ROI 2007ROI 2005ROI 2003
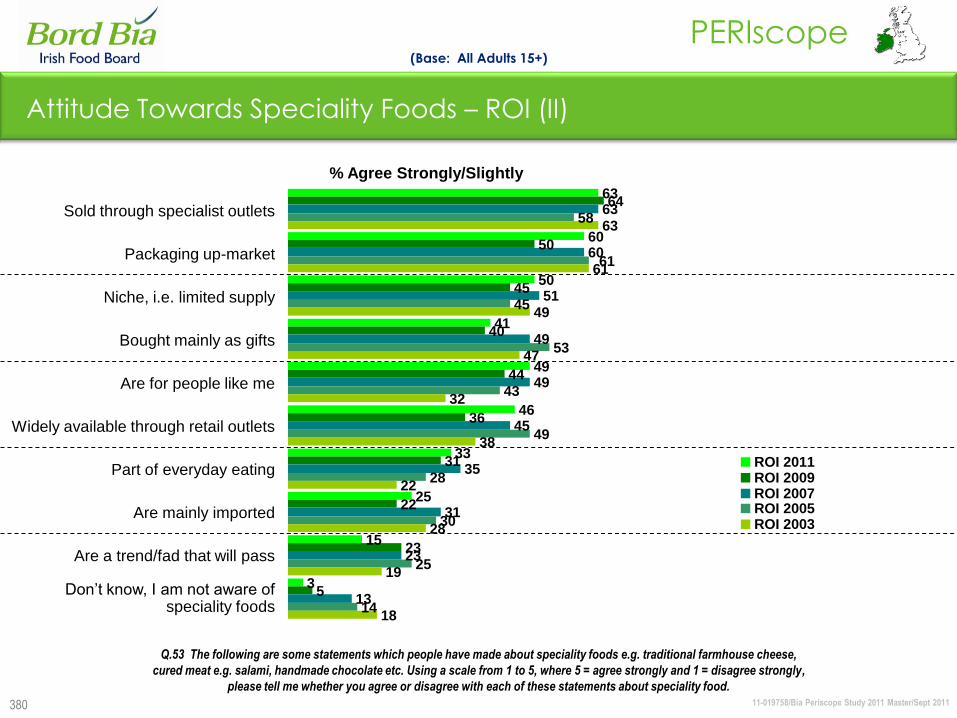
11-019758/Bia Periscope Study 2011 Master/Sept 2011
PERIscope
380
Sold through specialist outlets
Packaging up-market
Niche, i.e. limited supply
Bought mainly as gifts
Are for people like me
Widely available through retail outlets
Part of everyday eating
Are mainly imported
Are a trend/fad that will pass
Don‟t know, I am not aware of speciality foods
Attitude Towards Speciality Foods – ROI (II)
(Base: All Adults 15+)
Q.53 The following are some statements which people have made about speciality foods e.g. traditional farmhouse cheese,
cured meat e.g. salami, handmade chocolate etc. Using a scale from 1 to 5, where 5 = agree strongly and 1 = disagree strongly,
please tell me whether you agree or disagree with each of these statements about speciality food.
% Agree Strongly/Slightly
63
60
50
41
49
46
33
25
15
3
64
50
45
40
44
36
31
22
23
5
63
60
51
49
49
45
35
31
23
13
58
45
53
43
49
28
30
25
14
63
61
49
47
32
38
22
28
19
18
61
ROI 2011ROI 2009ROI 2007ROI 2005ROI 2003
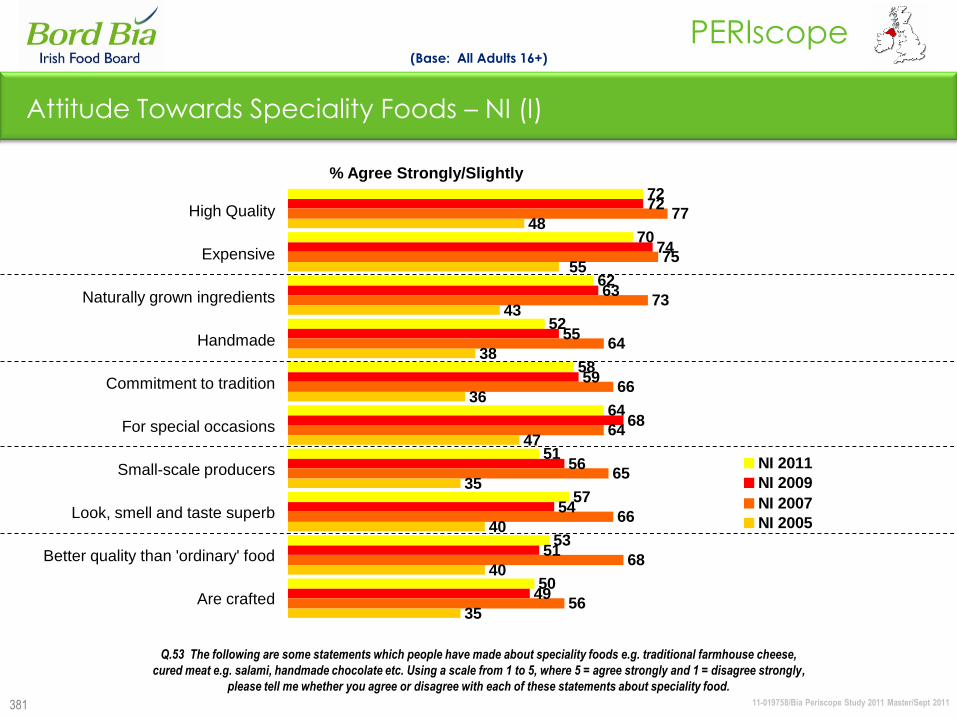
11-019758/Bia Periscope Study 2011 Master/Sept 2011
PERIscope
381
High Quality
Expensive
Naturally grown ingredients
Handmade
Commitment to tradition
For special occasions
Small-scale producers
Look, smell and taste superb
Better quality than 'ordinary' food
Are crafted
Attitude Towards Speciality Foods – NI (I)
(Base: All Adults 16+)
Q.53 The following are some statements which people have made about speciality foods e.g. traditional farmhouse cheese,
cured meat e.g. salami, handmade chocolate etc. Using a scale from 1 to 5, where 5 = agree strongly and 1 = disagree strongly,
please tell me whether you agree or disagree with each of these statements about speciality food.
% Agree Strongly/Slightly
72
70
62
52
58
64
51
57
53
50
72
74
63
55
59
68
56
54
51
49
77
75
73
64
66
64
65
66
68
56
48
43
38
36
47
35
40
40
35
55
NI 2011
NI 2009
NI 2007
NI 2005
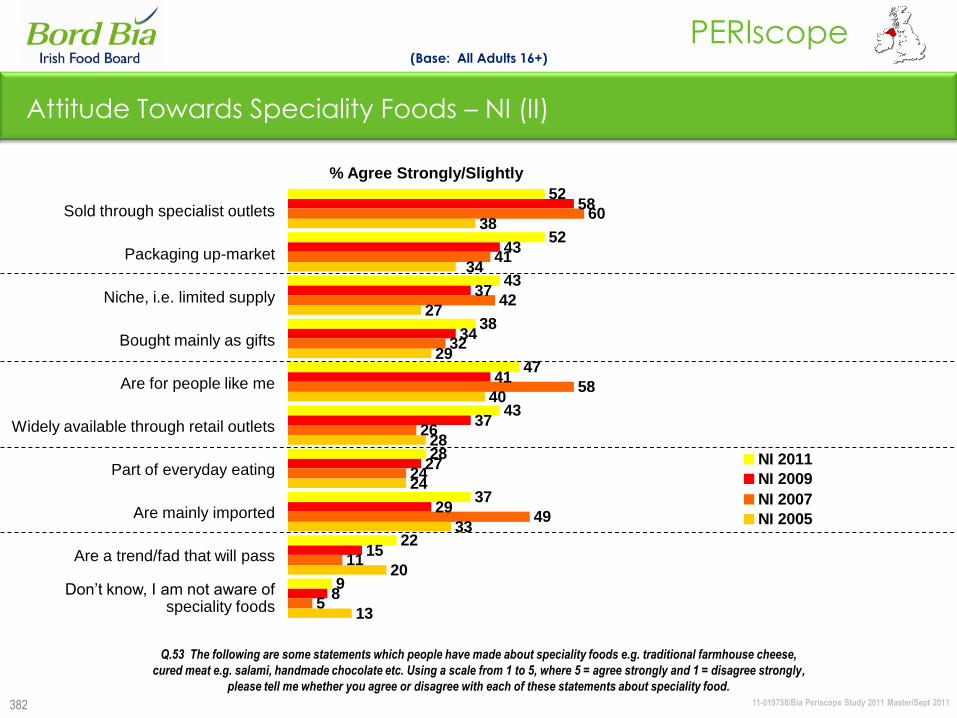
11-019758/Bia Periscope Study 2011 Master/Sept 2011
PERIscope
382
Sold through specialist outlets
Packaging up-market
Niche, i.e. limited supply
Bought mainly as gifts
Are for people like me
Widely available through retail outlets
Part of everyday eating
Are mainly imported
Are a trend/fad that will pass
Don‟t know, I am not aware of speciality foods
Attitude Towards Speciality Foods – NI (II)
(Base: All Adults 16+)
Q.53 The following are some statements which people have made about speciality foods e.g. traditional farmhouse cheese,
cured meat e.g. salami, handmade chocolate etc. Using a scale from 1 to 5, where 5 = agree strongly and 1 = disagree strongly,
please tell me whether you agree or disagree with each of these statements about speciality food.
% Agree Strongly/Slightly
52
52
43
38
47
43
28
37
22
9
58
43
37
34
41
37
27
29
15
8
60
41
42
32
58
26
24
49
11
5
38
27
29
40
28
24
33
20
13
34
NI 2011
NI 2009
NI 2007
NI 2005
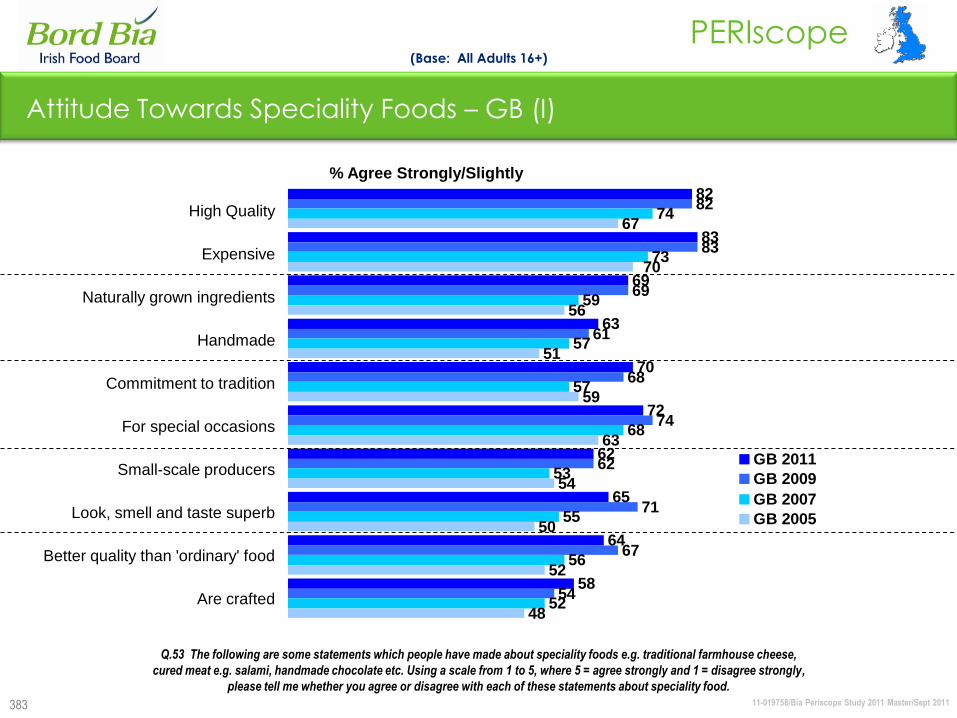
11-019758/Bia Periscope Study 2011 Master/Sept 2011
PERIscope
383
High Quality
Expensive
Naturally grown ingredients
Handmade
Commitment to tradition
For special occasions
Small-scale producers
Look, smell and taste superb
Better quality than 'ordinary' food
Are crafted
Attitude Towards Speciality Foods – GB (I)
(Base: All Adults 16+)
Q.53 The following are some statements which people have made about speciality foods e.g. traditional farmhouse cheese,
cured meat e.g. salami, handmade chocolate etc. Using a scale from 1 to 5, where 5 = agree strongly and 1 = disagree strongly,
please tell me whether you agree or disagree with each of these statements about speciality food.
% Agree Strongly/Slightly
82
83
69
63
70
72
62
65
64
58
82
83
69
61
68
74
62
71
67
54
74
73
59
57
57
68
53
55
56
52
67
56
51
59
63
54
50
52
48
70
GB 2011
GB 2009
GB 2007
GB 2005
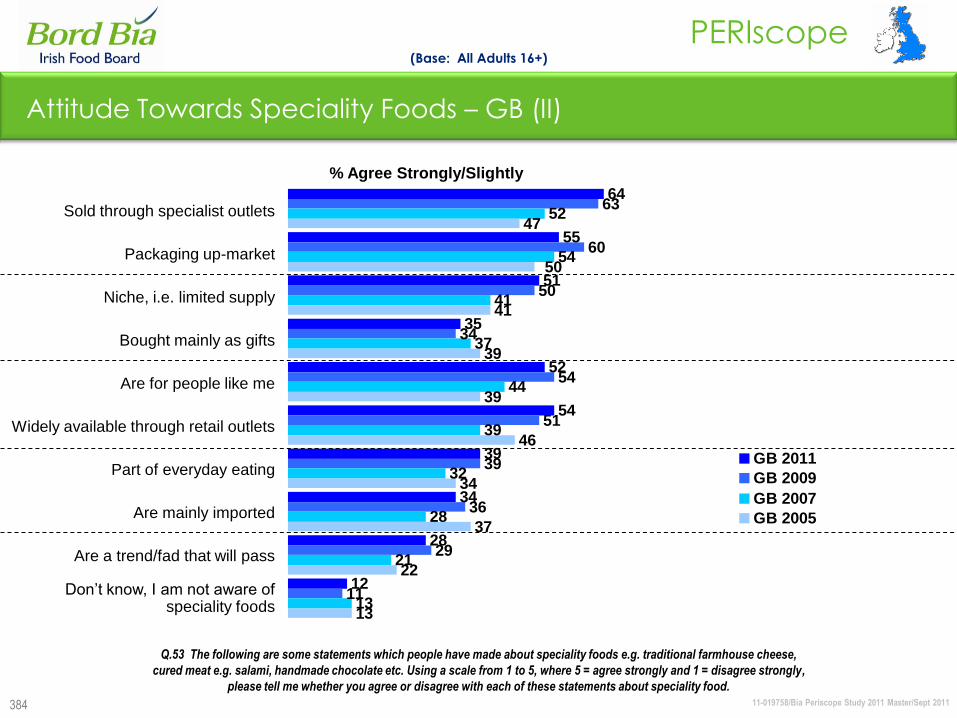
11-019758/Bia Periscope Study 2011 Master/Sept 2011
PERIscope
384
Sold through specialist outlets
Packaging up-market
Niche, i.e. limited supply
Bought mainly as gifts
Are for people like me
Widely available through retail outlets
Part of everyday eating
Are mainly imported
Are a trend/fad that will pass
Don‟t know, I am not aware of speciality foods
Attitude Towards Speciality Foods – GB (II)
(Base: All Adults 16+)
Q.53 The following are some statements which people have made about speciality foods e.g. traditional farmhouse cheese,
cured meat e.g. salami, handmade chocolate etc. Using a scale from 1 to 5, where 5 = agree strongly and 1 = disagree strongly,
please tell me whether you agree or disagree with each of these statements about speciality food.
% Agree Strongly/Slightly
64
55
51
35
52
54
39
34
28
12
63
60
50
34
54
51
39
36
29
11
52
54
41
37
44
39
32
28
21
13
47
41
39
39
46
34
37
22
13
50
GB 2011
GB 2009
GB 2007
GB 2005
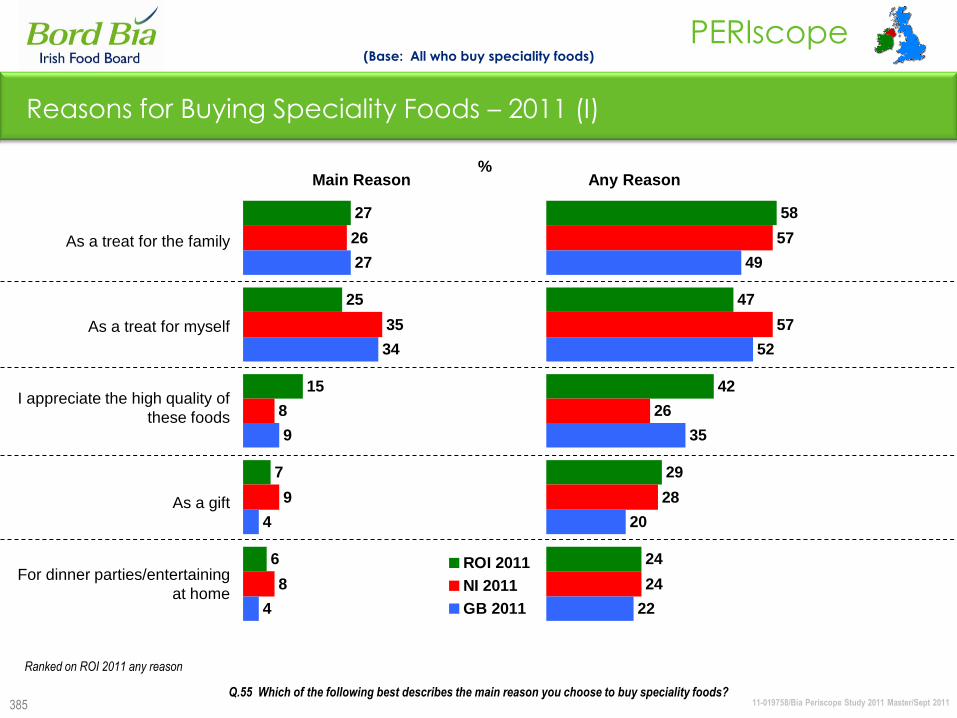
11-019758/Bia Periscope Study 2011 Master/Sept 2011
PERIscope
385
As a treat for the family
As a treat for myself
I appreciate the high quality of
these foods
As a gift
For dinner parties/entertaining
at home
Reasons for Buying Speciality Foods – 2011 (I)
(Base: All who buy speciality foods)
Main Reason Any Reason
Q.55 Which of the following best describes the main reason you choose to buy speciality foods?
27
25
15
7
6
26
35
8
9
8
27
34
9
4
4
ROI 2011
NI 2011
GB 2011
%
58
47
42
29
24
57
57
26
28
24
49
52
35
20
22
Ranked on ROI 2011 any reason
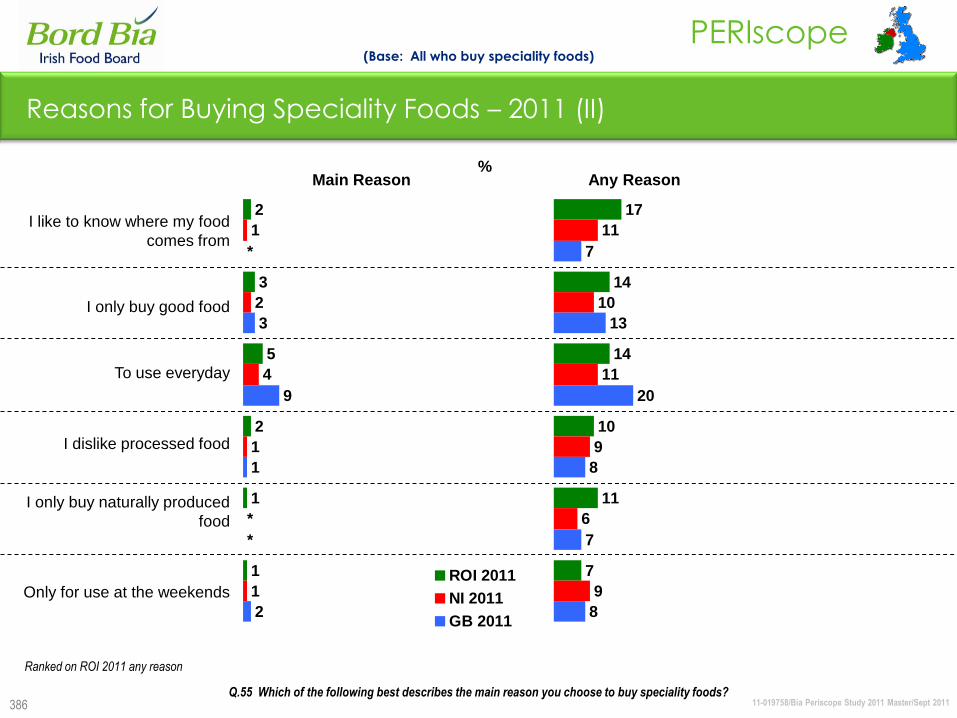
11-019758/Bia Periscope Study 2011 Master/Sept 2011
PERIscope
386
I like to know where my food
comes from
I only buy good food
To use everyday
I dislike processed food
I only buy naturally produced
food
Only for use at the weekends
Main Reason Any Reason
2
3
5
2
1
1
1
2
4
1
1
3
9
1
2
*
*
*
ROI 2011
NI 2011
GB 2011
%
Reasons for Buying Speciality Foods – 2011 (II)
Ranked on ROI 2011 any reason
(Base: All who buy speciality foods)
Q.55 Which of the following best describes the main reason you choose to buy speciality foods?
17
14
14
10
11
7
11
10
11
9
6
9
7
13
20
8
7
8

11-019758/Bia Periscope Study 2011 Master/Sept 2011
PERIscope
387
Reasons for Buying Speciality Foods – ROI (I)
(Base: All who buy speciality foods)
Main Reason Any Reason
Q.55 Which of the following best describes the main reason you choose to buy speciality foods?
27
25
15
7
6
26
29
10
9
7
20
33
11
10
5
28
30
9
9
7
20
20
8
20
8
ROI 2011ROI 2009ROI 2007ROI 2005ROI 2003
58
47
42
29
24
56
51
32
32
25
48
50
36
37
22
52
49
30
35
25
46
36
24
45
27
%
As a treat for the family
As a treat for myself
I appreciate the high quality of
these foods
As a gift
For dinner parties/entertaining
at home
Ranked on ROI 2011 any reason
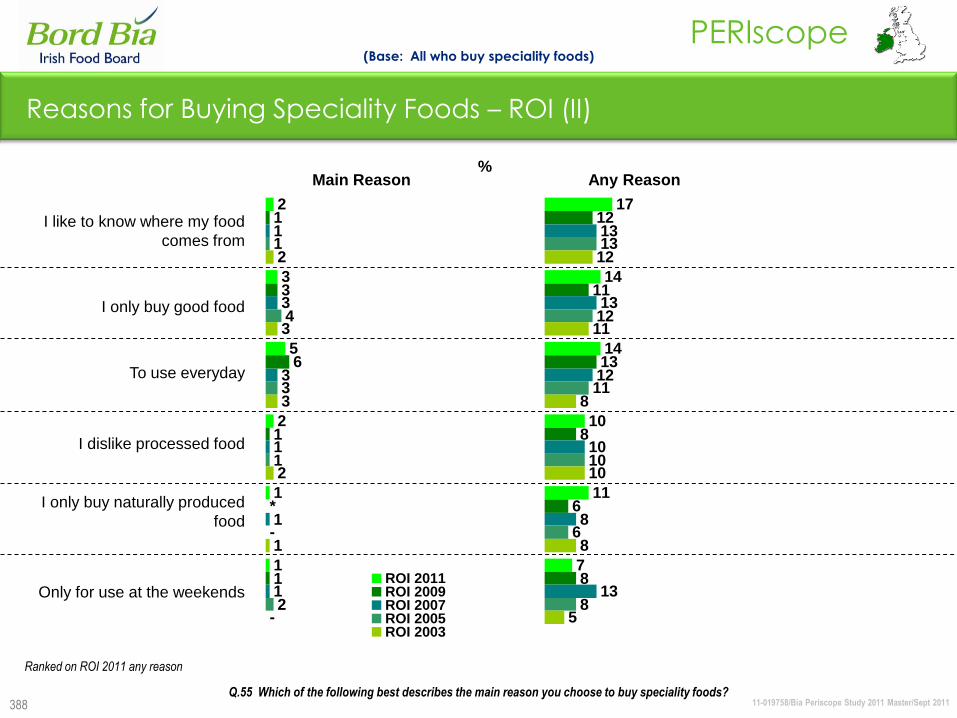
11-019758/Bia Periscope Study 2011 Master/Sept 2011
PERIscope
388
Main Reason Any Reason
2
3
5
2
1
1
1
3
6
1
1
1
3
3
1
1
1
1
4
3
1
2
2
3
3
2
1
*
-
-
ROI 2011ROI 2009ROI 2007ROI 2005ROI 2003
%
Reasons for Buying Speciality Foods – ROI (II)
(Base: All who buy speciality foods)
Q.55 Which of the following best describes the main reason you choose to buy speciality foods?
17
14
14
10
11
7
12
11
13
8
6
8
13
13
12
10
8
13
13
12
11
10
6
8
12
11
8
10
8
5
I like to know where my food
comes from
I only buy good food
To use everyday
I dislike processed food
I only buy naturally produced
food
Only for use at the weekends
Ranked on ROI 2011 any reason
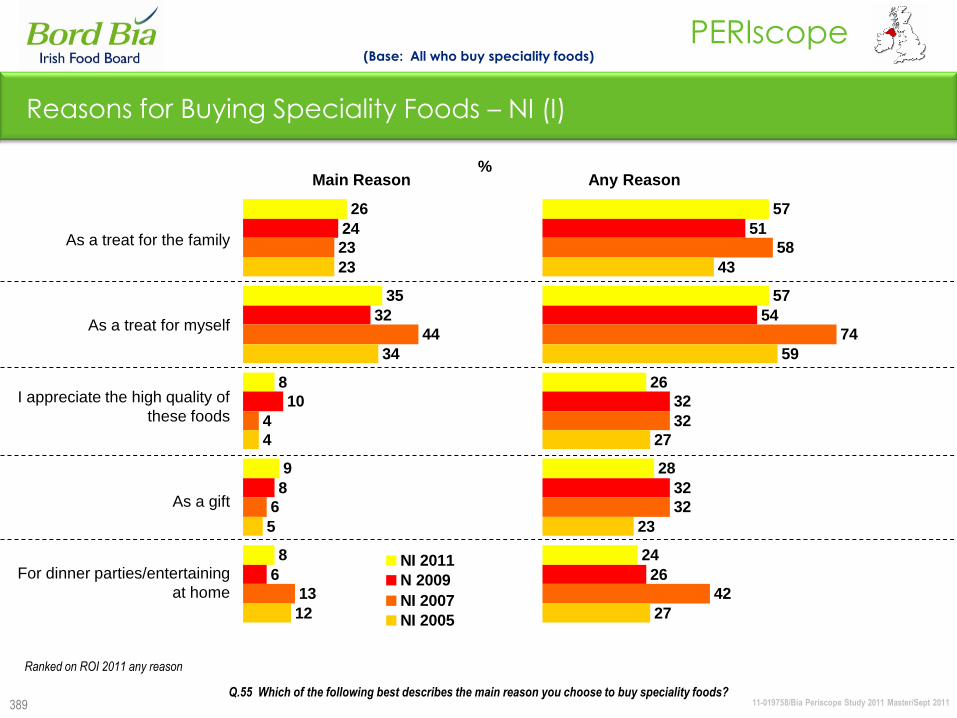
11-019758/Bia Periscope Study 2011 Master/Sept 2011
PERIscope
389
Reasons for Buying Speciality Foods – NI (I)
(Base: All who buy speciality foods)
Main Reason Any Reason
Q.55 Which of the following best describes the main reason you choose to buy speciality foods?
26
35
8
9
8
24
32
10
8
6
23
44
4
6
13
23
34
4
5
12
NI 2011
N 2009
NI 2007
NI 2005
57
57
26
28
24
51
54
32
32
26
58
74
32
32
42
43
59
27
23
27
%
Ranked on ROI 2011 any reason
As a treat for the family
As a treat for myself
I appreciate the high quality of
these foods
As a gift
For dinner parties/entertaining
at home
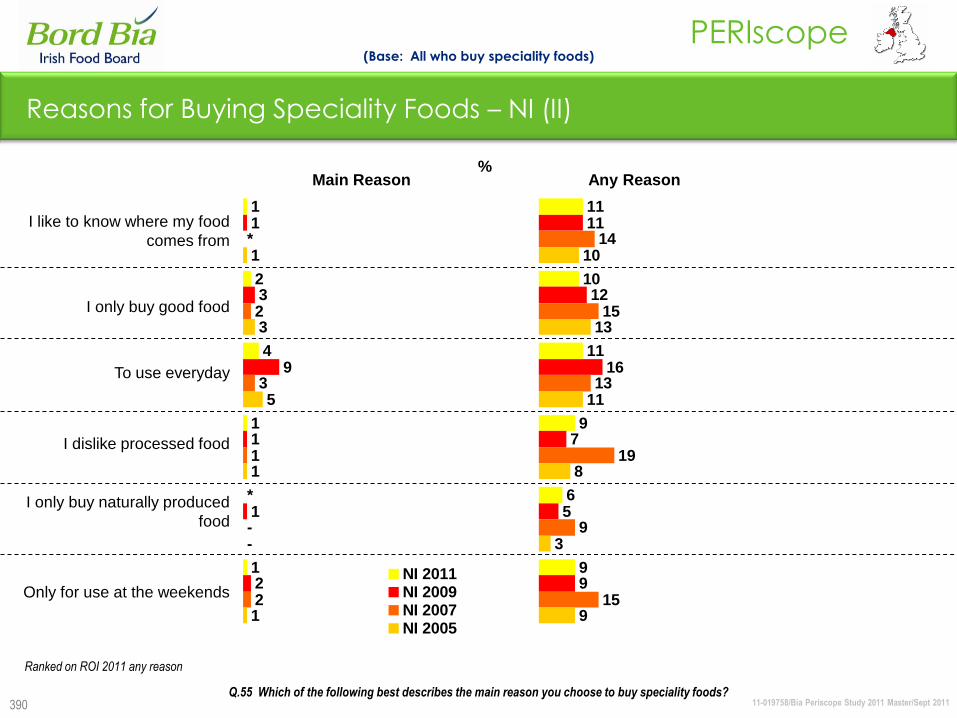
11-019758/Bia Periscope Study 2011 Master/Sept 2011
PERIscope
390
Main Reason Any Reason
1
2
4
1
1
1
3
9
1
1
2
2
3
1
2
1
3
5
1
1
*
-
*
-
NI 2011NI 2009NI 2007NI 2005
11
10
11
9
6
9
11
12
16
7
5
9
14
15
13
19
9
15
10
13
11
8
3
9
%
Reasons for Buying Speciality Foods – NI (II)
(Base: All who buy speciality foods)
Q.55 Which of the following best describes the main reason you choose to buy speciality foods?
Ranked on ROI 2011 any reason
I like to know where my food
comes from
I only buy good food
To use everyday
I dislike processed food
I only buy naturally produced
food
Only for use at the weekends

11-019758/Bia Periscope Study 2011 Master/Sept 2011
PERIscope
391
Reasons for Buying Speciality Foods – GB (I)
(Base: All who buy speciality foods)
Main Reason Any Reason
Q.55 Which of the following best describes the main reason you choose to buy speciality foods?
27
34
9
4
4
23
31
11
5
7
23
35
8
7
8
25
34
8
7
7
GB 2011
GB 2009
GB 2007
GB 2005
%
49
52
35
20
22
50
53
39
18
28
56
60
33
31
33
49
57
31
29
28
Ranked on ROI 2011 any reason
As a treat for the family
As a treat for myself
I appreciate the high quality of
these foods
As a gift
For dinner parties/entertaining
at home
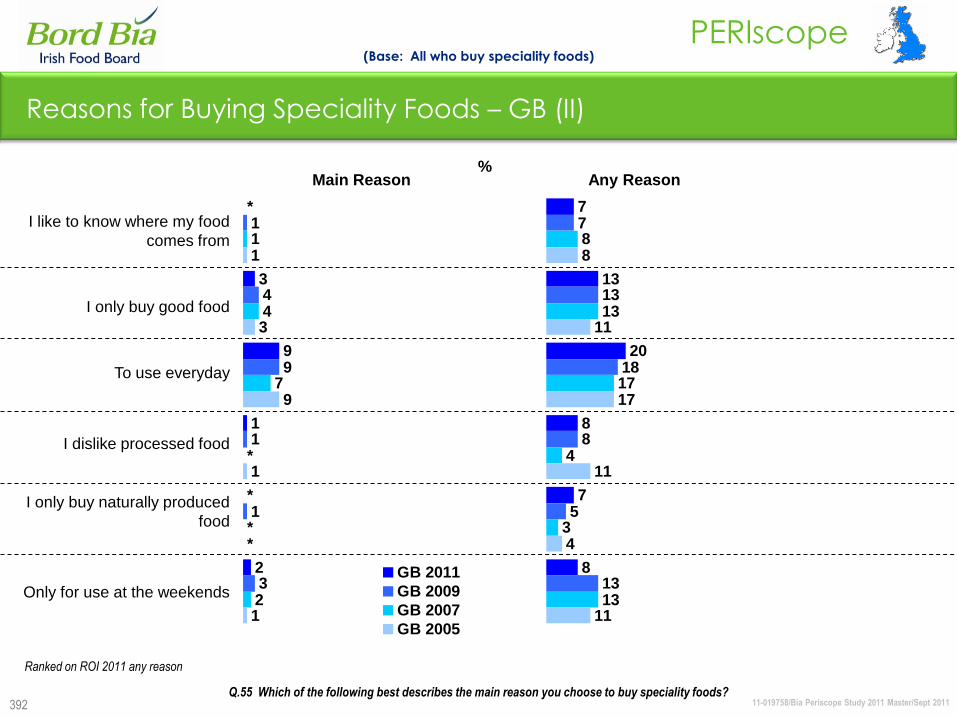
11-019758/Bia Periscope Study 2011 Master/Sept 2011
PERIscope
392
Main Reason Any Reason
3
9
1
2
1
4
9
1
1
3
1
4
7
2
1
3
9
1
1
*
*
*
*
*
GB 2011
GB 2009
GB 2007
GB 2005
%
Reasons for Buying Speciality Foods – GB (II)
(Base: All who buy speciality foods)
Q.55 Which of the following best describes the main reason you choose to buy speciality foods?
7
13
20
8
7
8
7
13
18
8
5
13
8
13
17
4
3
13
8
11
17
11
4
11
Ranked on ROI 2011 any reason
I like to know where my food
comes from
I only buy good food
To use everyday
I dislike processed food
I only buy naturally produced
food
Only for use at the weekends
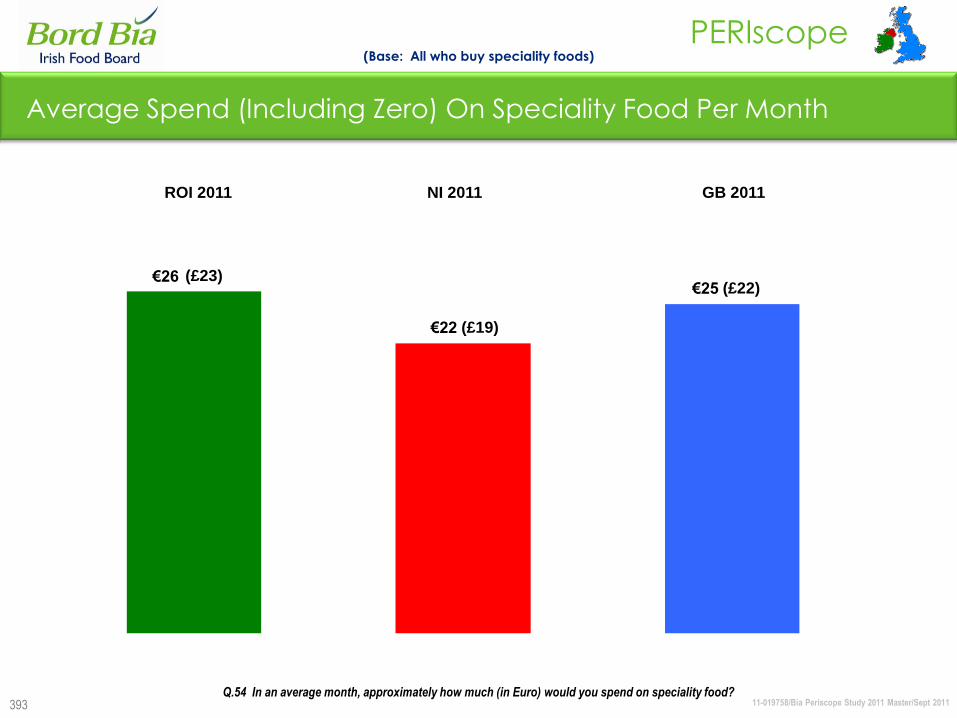
11-019758/Bia Periscope Study 2011 Master/Sept 2011
PERIscope
393
Average Spend (Including Zero) On Speciality Food Per Month
€26
€22
€25
ROI 2011
(Base: All who buy speciality foods)
Q.54 In an average month, approximately how much (in Euro) would you spend on speciality food?
NI 2011 GB 2011
(£22)
(£19)
(£23)
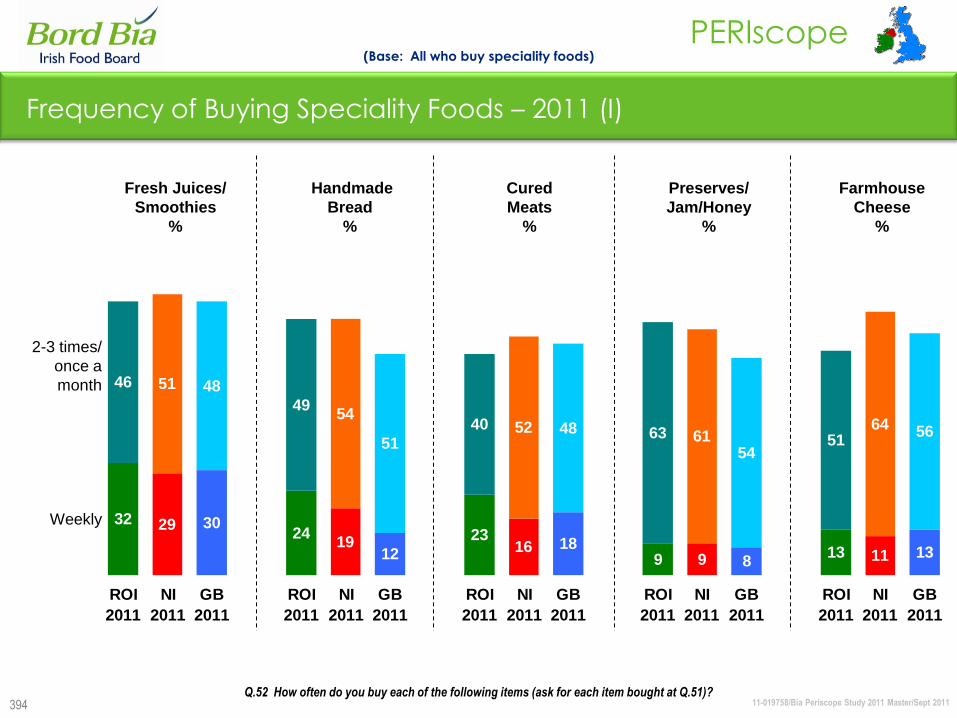
11-019758/Bia Periscope Study 2011 Master/Sept 2011
PERIscope
394
Frequency of Buying Speciality Foods – 2011 (I)
32 29 3024
1912
2316 18
9 9 813 11 13
46 51 48
4954
51
40 52 48 63 6154
5164 56
ROI
2011
NI
2011
GB
2011
ROI
2011
NI
2011
GB
2011
ROI
2011
NI
2011
GB
2011
ROI
2011
NI
2011
GB
2011
ROI
2011
NI
2011
GB
2011
(Base: All who buy speciality foods)
2-3 times/
once a
month
Weekly
Fresh Juices/ Handmade Cured Preserves/ Farmhouse
Smoothies Bread Meats Jam/Honey Cheese
% % % % %
Q.52 How often do you buy each of the following items (ask for each item bought at Q.51)?
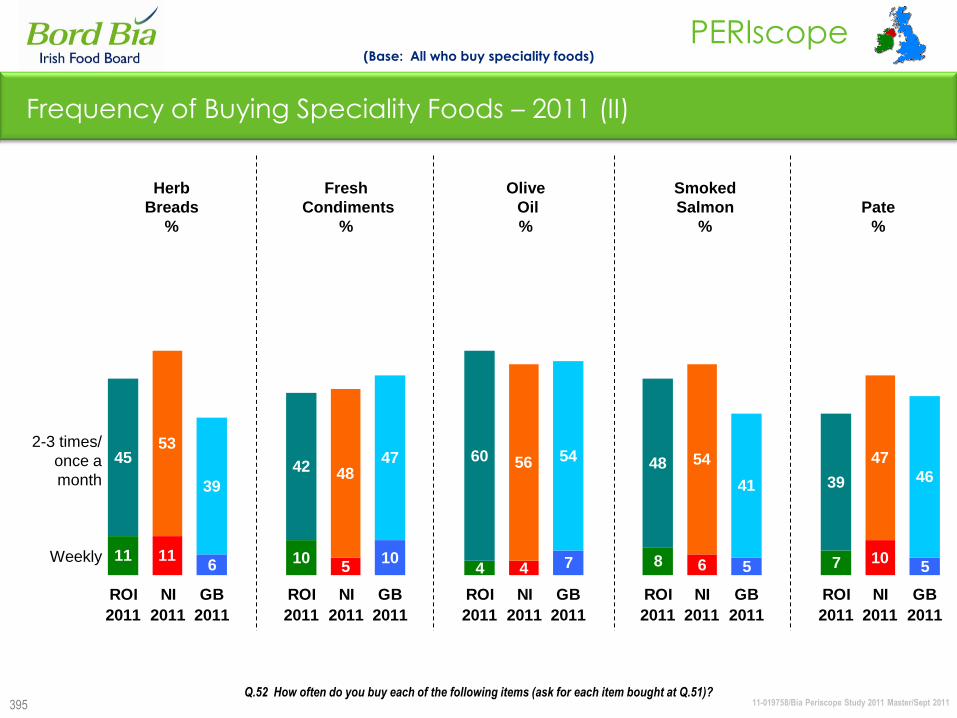
11-019758/Bia Periscope Study 2011 Master/Sept 2011
PERIscope
395
Frequency of Buying Speciality Foods – 2011 (II)
(Base: All who buy speciality foods)
Q.52 How often do you buy each of the following items (ask for each item bought at Q.51)?
2-3 times/
once a
month
Weekly
Herb Fresh Olive Smoked
Breads Condiments Oil Salmon Pate
% % % % %
11 116 10
510
4 4 7 8 6 5 7 105
4553
39
42 4847 60 56 54 48 54
41 39
47
46
ROI
2011
NI
2011
GB
2011
ROI
2011
NI
2011
GB
2011
ROI
2011
NI
2011
GB
2011
ROI
2011
NI
2011
GB
2011
ROI
2011
NI
2011
GB
2011
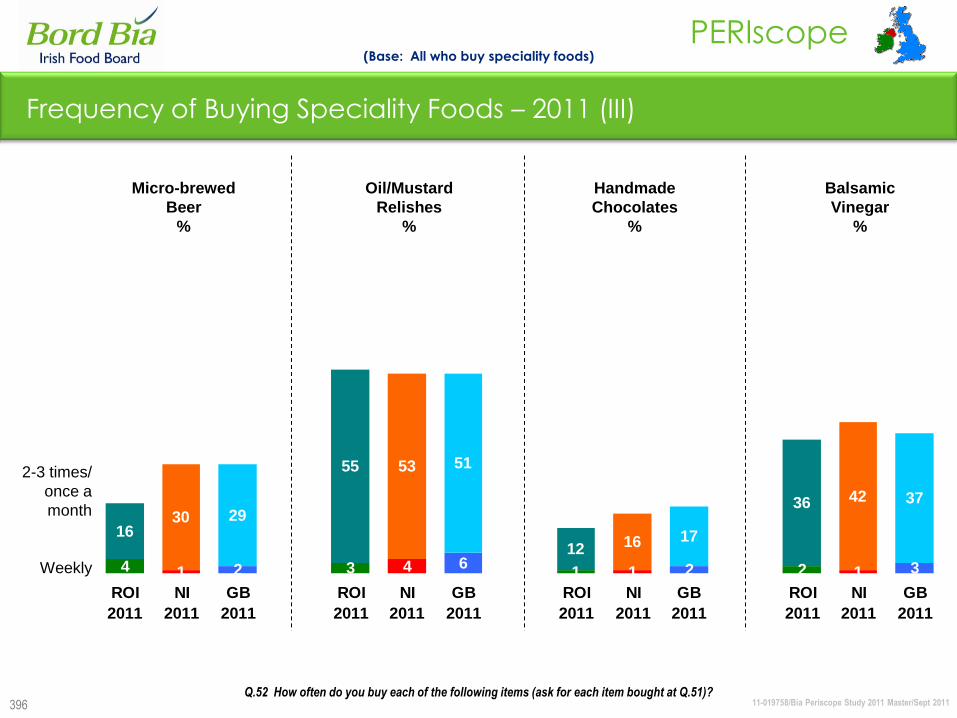
11-019758/Bia Periscope Study 2011 Master/Sept 2011
PERIscope
396
Frequency of Buying Speciality Foods – 2011 (III)
4 1 2 3 4 61 1 2 2 1 3
1630 29
55 53 51
12 16 17
36 42 37
ROI
2011
NI
2011
GB
2011
ROI
2011
NI
2011
GB
2011
ROI
2011
NI
2011
GB
2011
ROI
2011
NI
2011
GB
2011
(Base: All who buy speciality foods)
Q.52 How often do you buy each of the following items (ask for each item bought at Q.51)?
2-3 times/
once a
month
Weekly
Micro-brewed Oil/Mustard Handmade Balsamic
Beer Relishes Chocolates Vinegar
% % % %
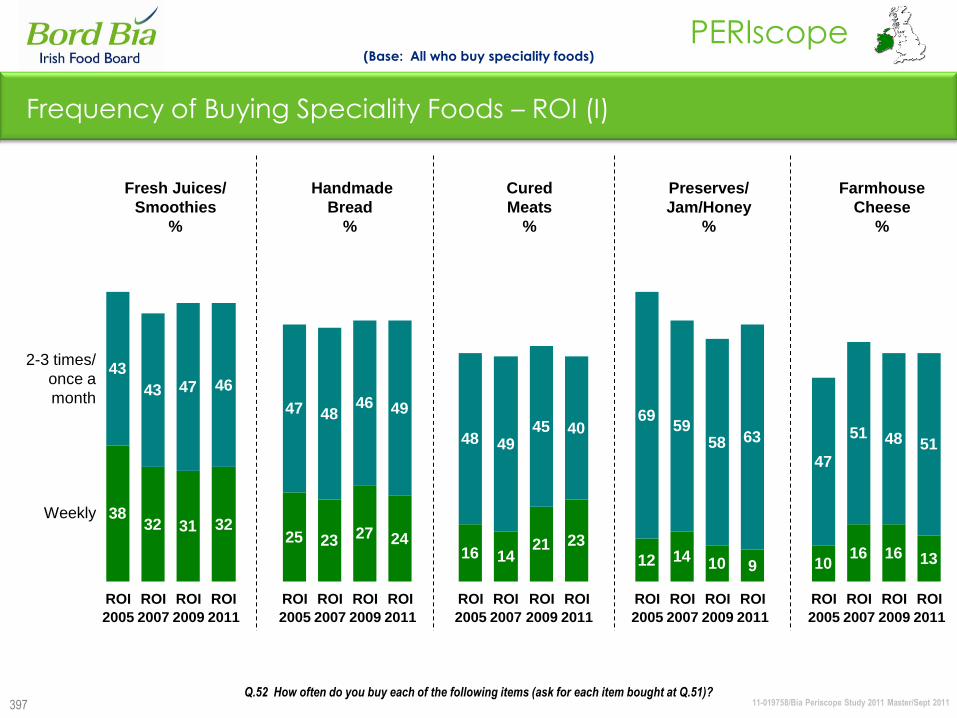
11-019758/Bia Periscope Study 2011 Master/Sept 2011
PERIscope
397
Frequency of Buying Speciality Foods – ROI (I)
3832 31 32
25 23 27 2416 14
21 23
12 14 10 9 1016 16 13
43
43 47 46
47 4846 49
48 4945 40
6959
58 63
47
51 48 51
ROI
2005
ROI
2007
ROI
2009
ROI
2011
ROI
2005
ROI
2007
ROI
2009
ROI
2011
ROI
2005
ROI
2007
ROI
2009
ROI
2011
ROI
2005
ROI
2007
ROI
2009
ROI
2011
ROI
2005
ROI
2007
ROI
2009
ROI
2011
(Base: All who buy speciality foods)
2-3 times/
once a
month
Weekly
Fresh Juices/ Handmade Cured Preserves/ Farmhouse
Smoothies Bread Meats Jam/Honey Cheese
% % % % %
Q.52 How often do you buy each of the following items (ask for each item bought at Q.51)?

11-019758/Bia Periscope Study 2011 Master/Sept 2011
PERIscope
398
Frequency of Buying Speciality Foods – ROI (II)
(Base: All who buy speciality foods)
Q.52 How often do you buy each of the following items (ask for each item bought at Q.51)?
2-3 times/
once a
month
Weekly
Herb Fresh Olive Smoked
Breads Condiments Oil Salmon Pate
% % % % %
712 11 11 7 11 12 10 6 6 5 4 5 6 7 8 5 6 8 7
45
50
3845
45
5343
42 54 57 56 60
38
50 47 48
43 39 39 39
ROI
2005
ROI
2007
ROI
2009
ROI
2011
ROI
2005
ROI
2007
ROI
2009
ROI
2011
ROI
2005
ROI
2007
ROI
2009
ROI
2011
ROI
2005
ROI
2007
ROI
2009
ROI
2011
ROI
2005
ROI
2007
ROI
2009
ROI
2011
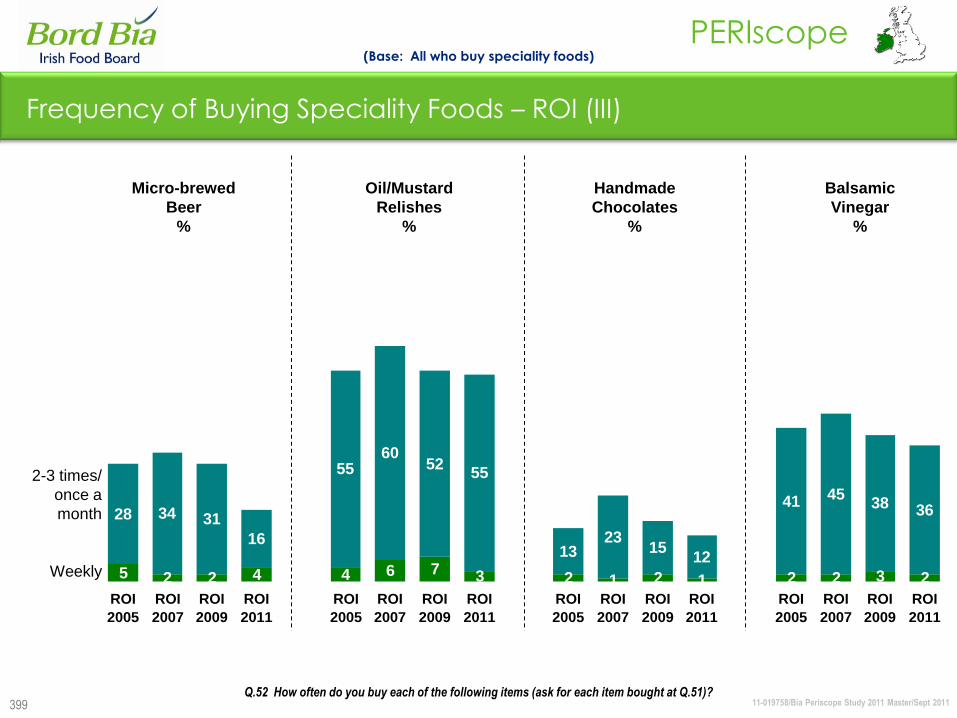
11-019758/Bia Periscope Study 2011 Master/Sept 2011
PERIscope
399
Frequency of Buying Speciality Foods – ROI (III)
(Base: All who buy speciality foods)
Q.52 How often do you buy each of the following items (ask for each item bought at Q.51)?
2-3 times/
once a
month
Weekly
Micro-brewed Oil/Mustard Handmade Balsamic
Beer Relishes Chocolates Vinegar
% % % %
5 2 2 4 4 6 7 3 2 1 2 1 2 2 3 2
28 34 31
16
5560
5255
1323
1512
41 4538 36
ROI
2005
ROI
2007
ROI
2009
ROI
2011
ROI
2005
ROI
2007
ROI
2009
ROI
2011
ROI
2005
ROI
2007
ROI
2009
ROI
2011
ROI
2005
ROI
2007
ROI
2009
ROI
2011
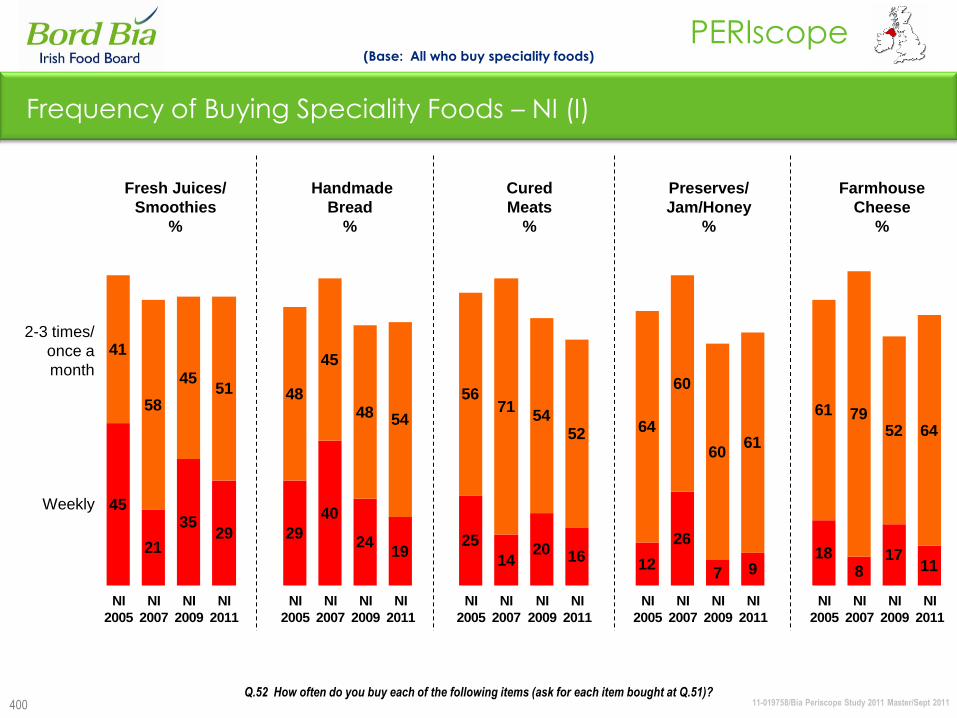
11-019758/Bia Periscope Study 2011 Master/Sept 2011
PERIscope
400
Frequency of Buying Speciality Foods – NI (I)
45
21
3529 29
40
2419
25
1420 16
12
26
7 918
817
11
41
58
4551 48
45
48 54
5671
5452 64
60
6061
61 7952 64
NI
2005
NI
2007
NI
2009
NI
2011
NI
2005
NI
2007
NI
2009
NI
2011
NI
2005
NI
2007
NI
2009
NI
2011
NI
2005
NI
2007
NI
2009
NI
2011
NI
2005
NI
2007
NI
2009
NI
2011
(Base: All who buy speciality foods)
2-3 times/
once a
month
Weekly
Fresh Juices/ Handmade Cured Preserves/ Farmhouse
Smoothies Bread Meats Jam/Honey Cheese
% % % % %
Q.52 How often do you buy each of the following items (ask for each item bought at Q.51)?
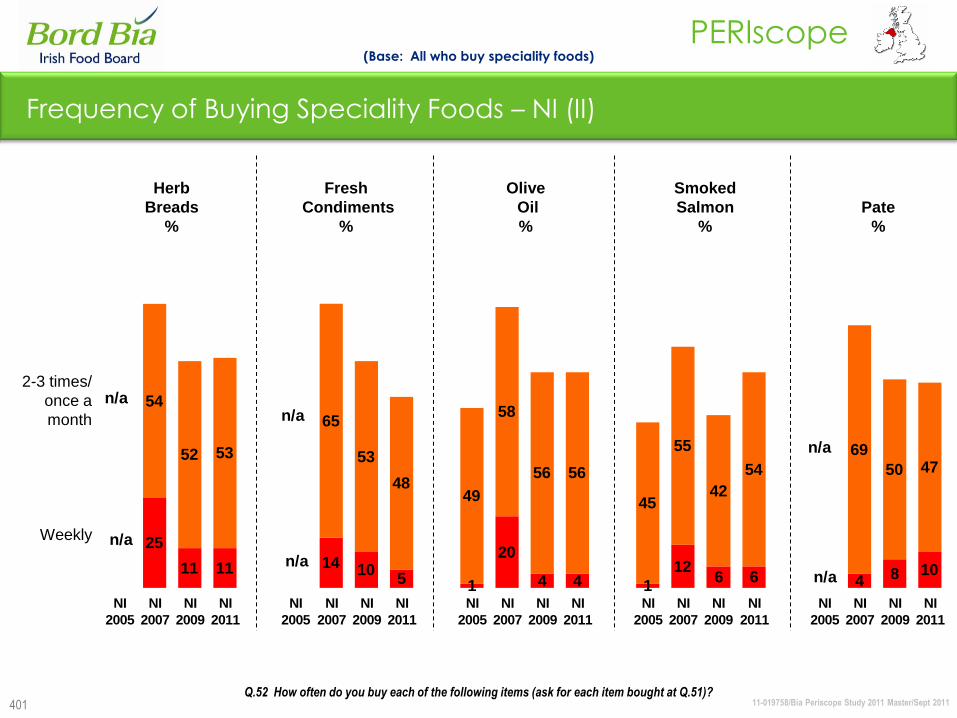
11-019758/Bia Periscope Study 2011 Master/Sept 2011
PERIscope
401
Frequency of Buying Speciality Foods – NI (II)
(Base: All who buy speciality foods)
Q.52 How often do you buy each of the following items (ask for each item bought at Q.51)?
2-3 times/
once a
month
Weekly
Herb Fresh Olive Smoked
Breads Condiments Oil Salmon Pate
% % % % %
25
11 11 14 105 1
20
4 4 1
126 6 4 8 10
54
52 53
65
53
4849
58
56 56
45
55
42
54
69
50 47
n/an/a
n/a
n/a
n/an/a
NI
2005
NI
2007
NI
2009
NI
2011
NI
2005
NI
2007
NI
2009
NI
2011
NI
2005
NI
2007
NI
2009
NI
2011
NI
2005
NI
2007
NI
2009
NI
2011
NI
2005
NI
2007
NI
2009
NI
2011
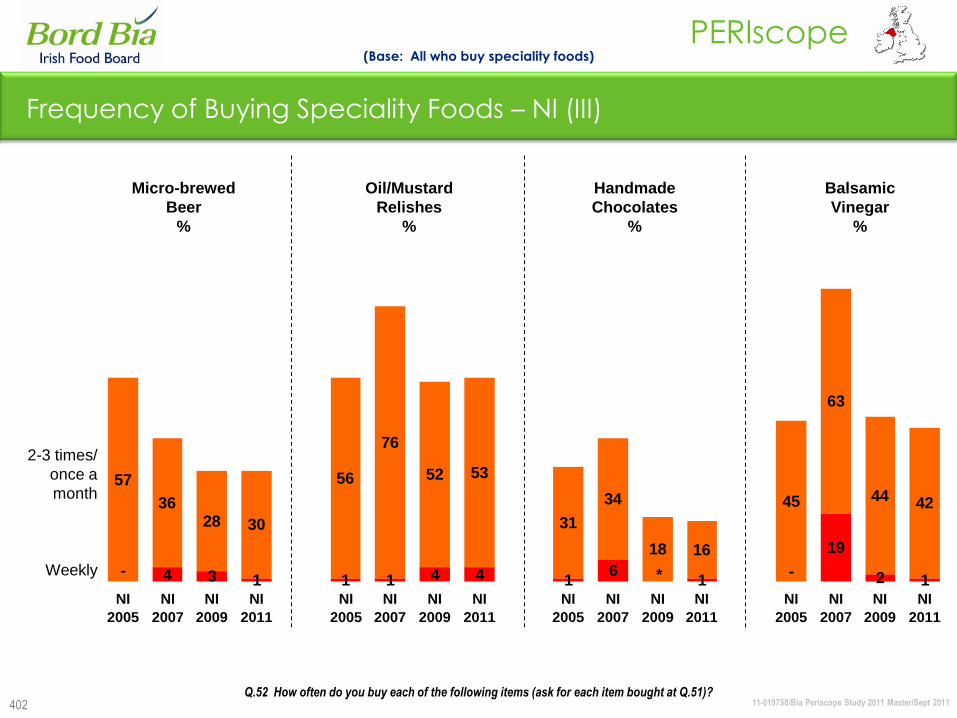
11-019758/Bia Periscope Study 2011 Master/Sept 2011
PERIscope
402
Frequency of Buying Speciality Foods – NI (III)
(Base: All who buy speciality foods)
Q.52 How often do you buy each of the following items (ask for each item bought at Q.51)?
2-3 times/
once a
month
Weekly
Micro-brewed Oil/Mustard Handmade Balsamic
Beer Relishes Chocolates Vinegar
% % % %
4 3 1 1 1 4 4 16
1
19
2 1
57
3628 30
56
76
52 53
31
34
18 16
45
63
44 42
-*-
NI
2005
NI
2007
NI
2009
NI
2011
NI
2005
NI
2007
NI
2009
NI
2011
NI
2005
NI
2007
NI
2009
NI
2011
NI
2005
NI
2007
NI
2009
NI
2011
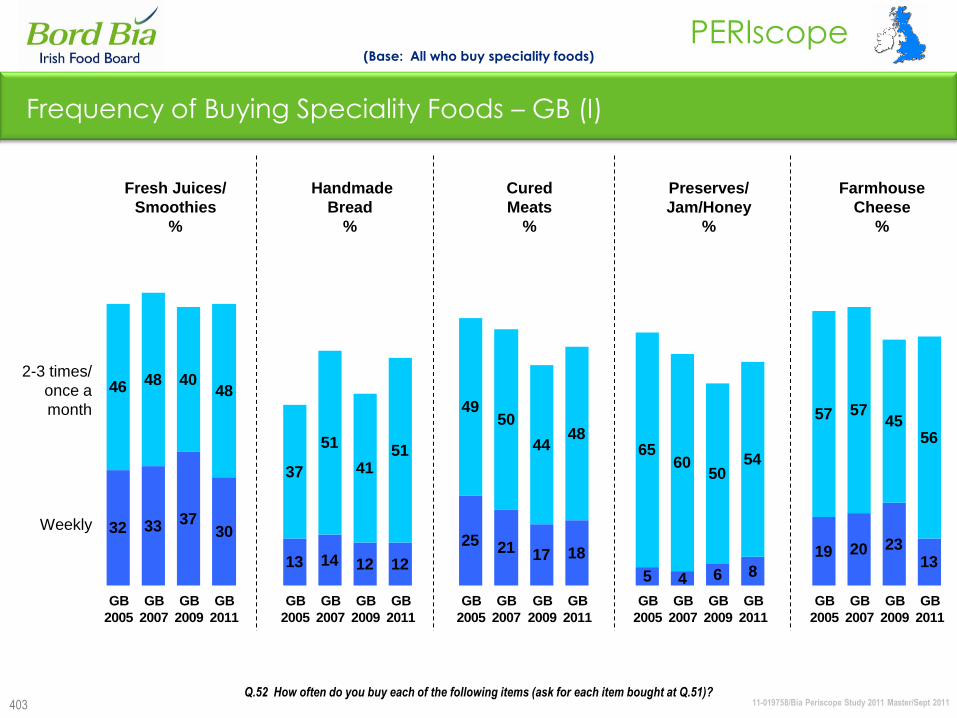
11-019758/Bia Periscope Study 2011 Master/Sept 2011
PERIscope
403
Frequency of Buying Speciality Foods – GB (I)
32 33 3730
13 14 12 12
25 21 17 18
5 4 6 8
19 20 2313
46 48 4048
37
51
4151
4950
4448
6560
5054
57 5745
56
GB
2005
GB
2007
GB
2009
GB
2011
GB
2005
GB
2007
GB
2009
GB
2011
GB
2005
GB
2007
GB
2009
GB
2011
GB
2005
GB
2007
GB
2009
GB
2011
GB
2005
GB
2007
GB
2009
GB
2011
(Base: All who buy speciality foods)
2-3 times/
once a
month
Weekly
Fresh Juices/ Handmade Cured Preserves/ Farmhouse
Smoothies Bread Meats Jam/Honey Cheese
% % % % %
Q.52 How often do you buy each of the following items (ask for each item bought at Q.51)?
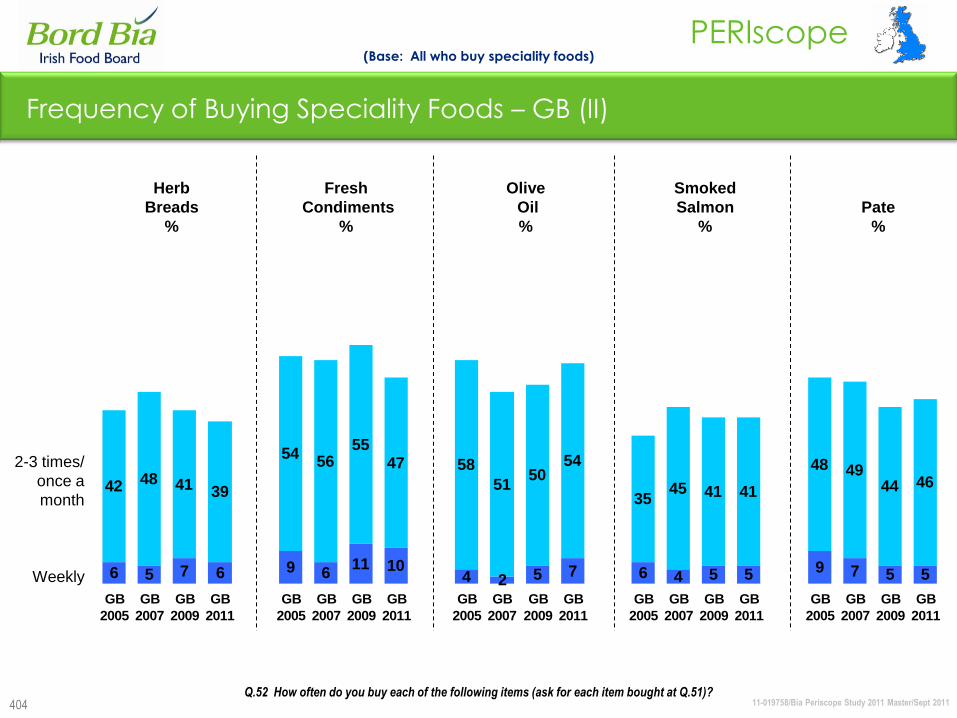
11-019758/Bia Periscope Study 2011 Master/Sept 2011
PERIscope
404
Frequency of Buying Speciality Foods – GB (II)
(Base: All who buy speciality foods)
Q.52 How often do you buy each of the following items (ask for each item bought at Q.51)?
2-3 times/
once a
month
Weekly
Herb Fresh Olive Smoked
Breads Condiments Oil Salmon Pate
% % % % %
6 5 7 6 9 611 10
4 2 5 7 6 4 5 5 9 7 5 5
42 48 41 39
5456
5547 58
5150
54
3545 41 41
48 4944 46
GB
2005
GB
2007
GB
2009
GB
2011
GB
2005
GB
2007
GB
2009
GB
2011
GB
2005
GB
2007
GB
2009
GB
2011
GB
2005
GB
2007
GB
2009
GB
2011
GB
2005
GB
2007
GB
2009
GB
2011
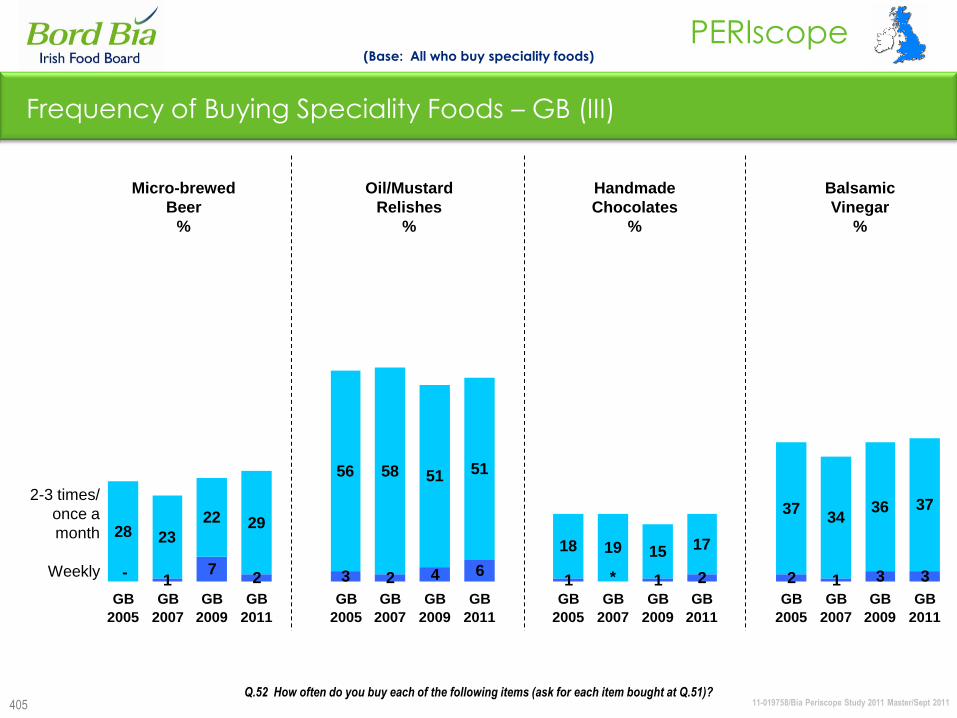
11-019758/Bia Periscope Study 2011 Master/Sept 2011
PERIscope
405
Frequency of Buying Speciality Foods – GB (III)
(Base: All who buy speciality foods)
Q.52 How often do you buy each of the following items (ask for each item bought at Q.51)?
2-3 times/
once a
month
Weekly
Micro-brewed Oil/Mustard Handmade Balsamic
Beer Relishes Chocolates Vinegar
% % % %
17
2 3 2 4 61 1 2 2 1 3 3
28 23
22 29
56 58 51 51
18 19 15 17
3734
36 37
*-
GB
2005
GB
2007
GB
2009
GB
2011
GB
2005
GB
2007
GB
2009
GB
2011
GB
2005
GB
2007
GB
2009
GB
2011
GB
2005
GB
2007
GB
2009
GB
2011

Organic Food
11-019758/Bia Periscope Study 2011 Master/Sept 2011
PERIscope
407
Organic Food: Summary
Over half of all consumers in ROI and GB claim to have „ever bought‟ organic food, a figure
that has continued to increase in both regions since 2005. less consumers in NI claim to have
interacted with the sector.
Purchases of organic food in the past week/past month are higher in ROI than in GB or NI.
These types of purchases continue to increase in ROI, and have done so steadily since 2003.
in contrast, past week/past month purchases have declined in NI since 2007, while in GB they
show signs of stagnating.
Vegetables and fruit continue to be the two most commonly purchased organic food types,
although monthly or more often purchases of poultry in ROI are quite a bit ahead of NI, and GB
particularly.
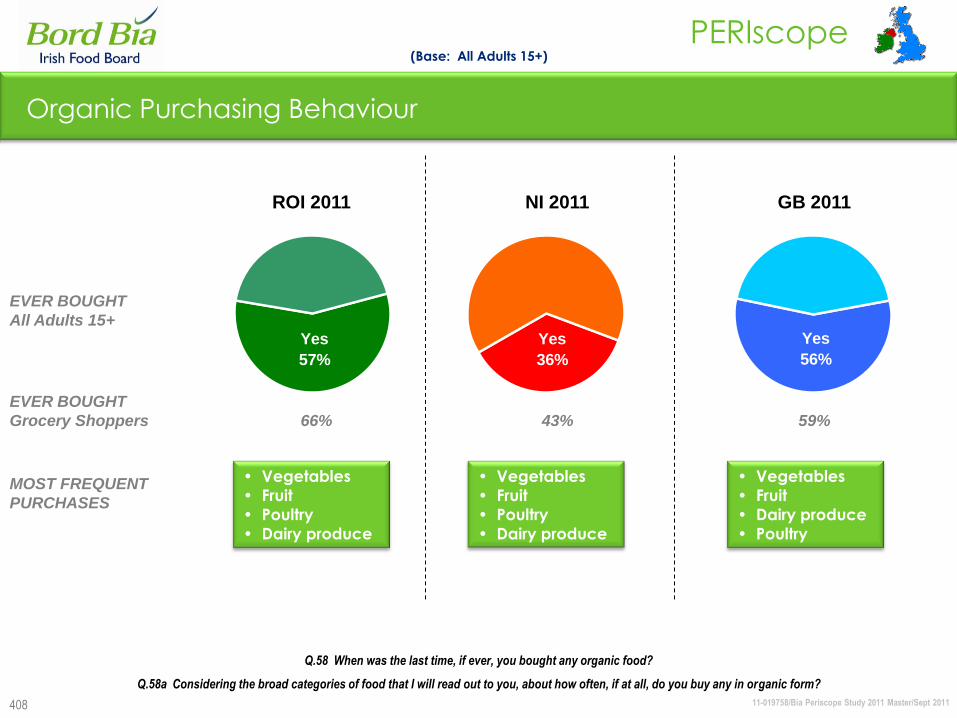
11-019758/Bia Periscope Study 2011 Master/Sept 2011
PERIscope
408
Yes
57%
Organic Purchasing Behaviour
ROI 2011
Q.58 When was the last time, if ever, you bought any organic food?
Yes
56%
EVER BOUGHT
All Adults 15+
MOST FREQUENT
PURCHASES
(Base: All Adults 15+)
Q.58a Considering the broad categories of food that I will read out to you, about how often, if at all, do you buy any in organic form?
EVER BOUGHT
Grocery Shoppers 66% 43% 59%
• Vegetables
• Fruit
• Poultry
• Dairy produce
• Vegetables
• Fruit
• Dairy produce
• Poultry
GB 2011NI 2011
• Vegetables
• Fruit
• Poultry
• Dairy produce
Yes
36%
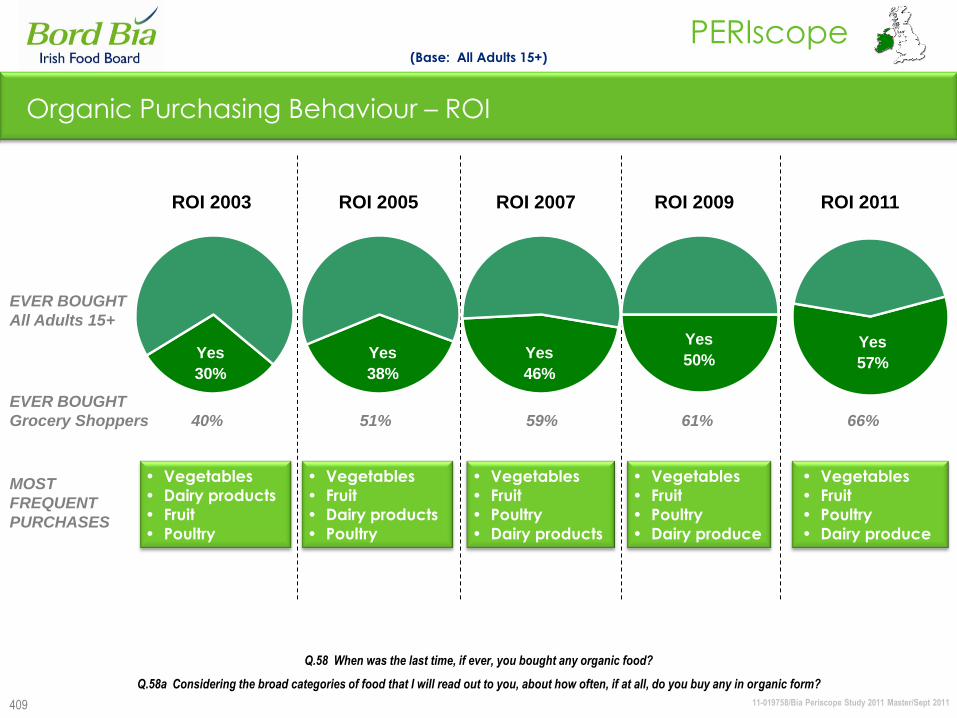
11-019758/Bia Periscope Study 2011 Master/Sept 2011
PERIscope
409
• Vegetables
• Fruit
• Poultry
• Dairy produce
Yes
30%
Organic Purchasing Behaviour – ROI
ROI 2003
EVER BOUGHT
All Adults 15+
MOST
FREQUENT
PURCHASES
ROI 2005 ROI 2007 ROI 2009
Yes
38%
Yes
46%
(Base: All Adults 15+)
EVER BOUGHT
Grocery Shoppers 40% 51% 59% 61% 66%
Q.58 When was the last time, if ever, you bought any organic food?
Q.58a Considering the broad categories of food that I will read out to you, about how often, if at all, do you buy any in organic form?
• Vegetables
• Fruit
• Dairy products
• Poultry
• Vegetables
• Fruit
• Poultry
• Dairy products
Yes
50%
ROI 2011
• Vegetables
• Dairy products
• Fruit
• Poultry
Yes
57%
• Vegetables
• Fruit
• Poultry
• Dairy produce
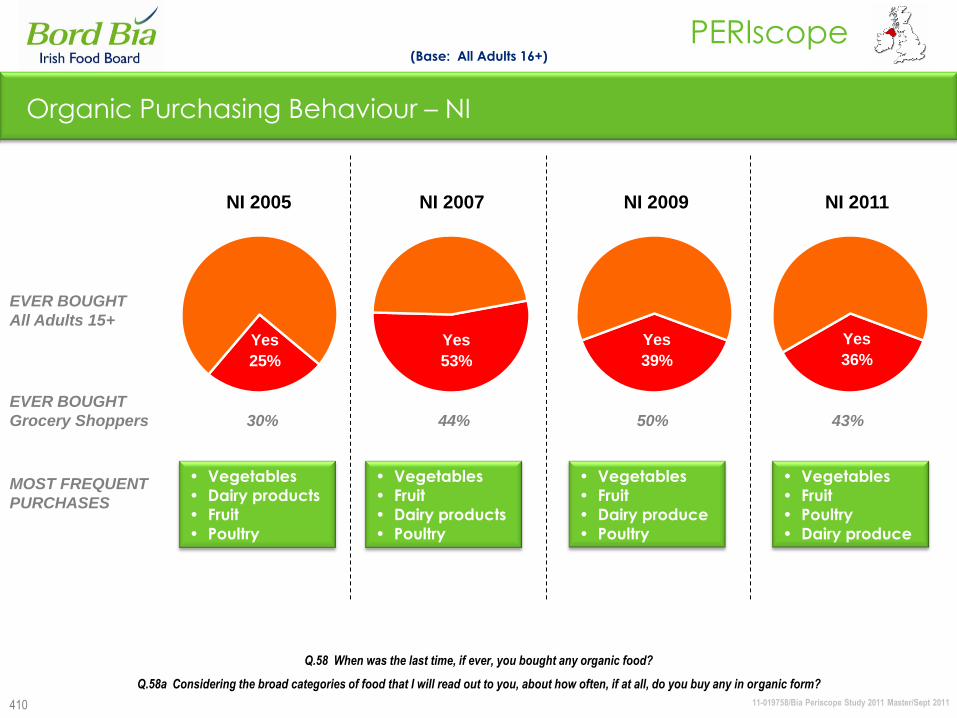
11-019758/Bia Periscope Study 2011 Master/Sept 2011
PERIscope
410
Yes
25%
Organic Purchasing Behaviour – NI
Q.58 When was the last time, if ever, you bought any organic food?
Yes
53%
EVER BOUGHT
All Adults 15+
MOST FREQUENT
PURCHASES
(Base: All Adults 16+)
Q.58a Considering the broad categories of food that I will read out to you, about how often, if at all, do you buy any in organic form?
EVER BOUGHT
Grocery Shoppers 30% 44% 50% 43%
• Vegetables
• Fruit
• Dairy products
• Poultry
• Vegetables
• Fruit
• Dairy produce
• Poultry
NI 2009NI 2007NI 2005
Yes
39%
NI 2011
• Vegetables
• Dairy products
• Fruit
• Poultry
• Vegetables
• Fruit
• Poultry
• Dairy produce
Yes
36%
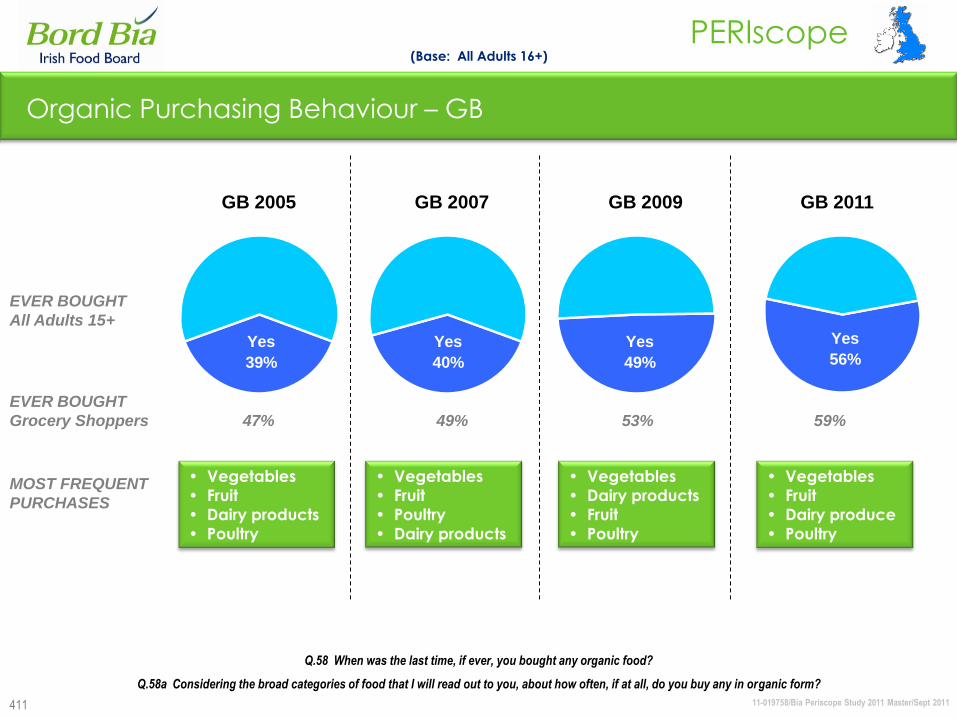
11-019758/Bia Periscope Study 2011 Master/Sept 2011
PERIscope
Yes
49%
411
Organic Purchasing Behaviour – GB
Q.58 When was the last time, if ever, you bought any organic food?
EVER BOUGHT
All Adults 15+
MOST FREQUENT
PURCHASES
(Base: All Adults 16+)
Q.58a Considering the broad categories of food that I will read out to you, about how often, if at all, do you buy any in organic form?
EVER BOUGHT
Grocery Shoppers 47% 49% 53% 59%
• Vegetables
• Fruit
• Poultry
• Dairy products
• Vegetables
• Dairy products
• Fruit
• Poultry
Yes
39%
GB 2007GB 2005 GB 2009
Yes
40%
GB 2011
• Vegetables
• Fruit
• Dairy products
• Poultry
Yes
56%
• Vegetables
• Fruit
• Dairy produce
• Poultry

11-019758/Bia Periscope Study 2011 Master/Sept 2011
PERIscope
412
Frequency of Buying Various Types of Food in Organic Form – 2011 (I)
Vegetables
Fruit
Poultry
Yoghurt
Cheese
Milk/cream
Butter/other dairy spreads
% Monthly or more often
(Base: All who buy organic food)
Q.58a Considering the broad categories of food that I will read out to you, about how often, if at all, do you buy any in organic form?
72
58
50
33
27
15
10
76
66
41
43
42
32
29
59
52
28
31
28
29
20
% Weekly
40
31
18
14
9
8
4
28
24
10
10
10
9
6
26
23
8
9
8
12
6
ROI 2011
NI 2011
GB 2011
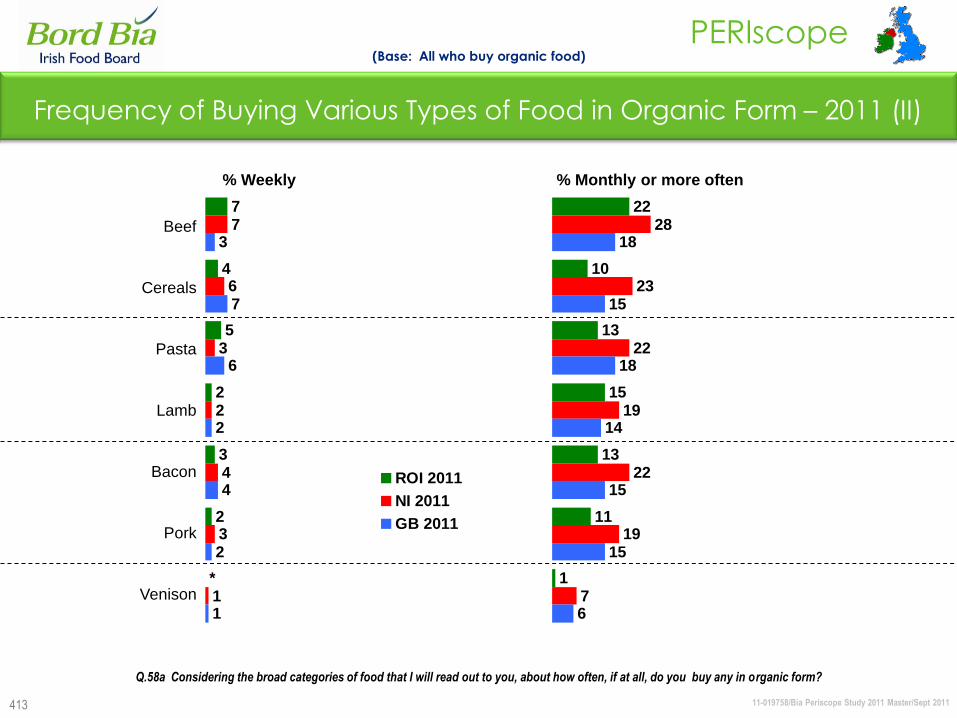
11-019758/Bia Periscope Study 2011 Master/Sept 2011
PERIscope
413
Frequency of Buying Various Types of Food in Organic Form – 2011 (II)
Beef
Cereals
Pasta
Lamb
Bacon
Pork
Venison
% Weekly
(Base: All who buy organic food)
Q.58a Considering the broad categories of food that I will read out to you, about how often, if at all, do you buy any in organic form?
% Monthly or more often
7
4
5
2
3
2
7
6
3
2
4
3
1
3
7
6
2
4
2
1
*
ROI 2011
NI 2011
GB 2011
22
10
13
15
13
11
1
28
23
22
19
22
19
7
18
15
18
14
15
15
6
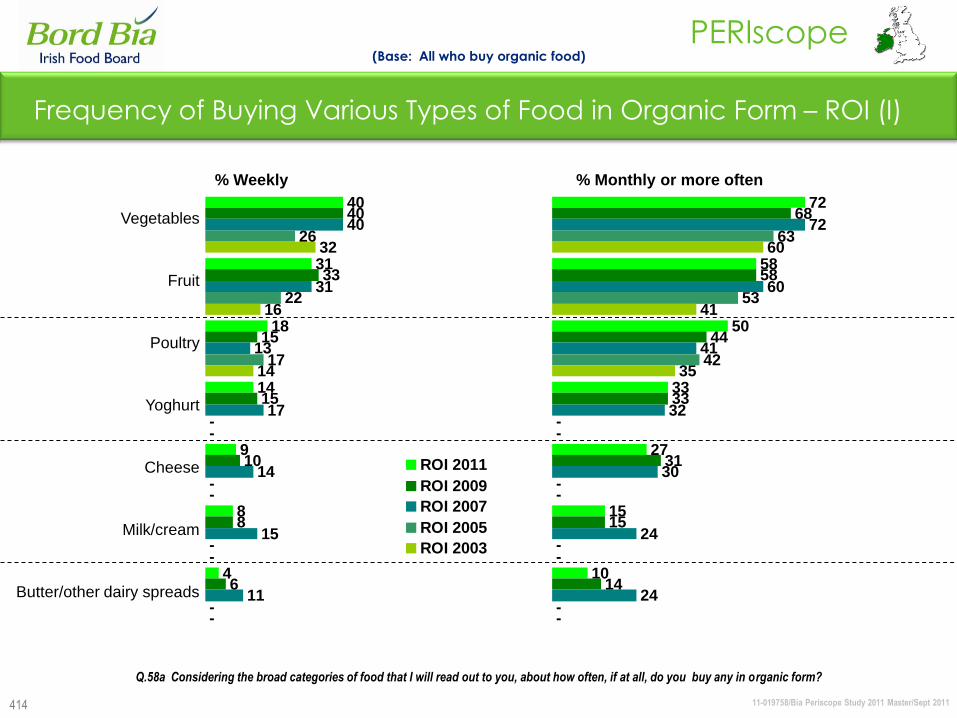
11-019758/Bia Periscope Study 2011 Master/Sept 2011
PERIscope
414
Frequency of Buying Various Types of Food in Organic Form – ROI (I)
Vegetables
Fruit
Poultry
Yoghurt
Cheese
Milk/cream
Butter/other dairy spreads
% Monthly or more often
(Base: All who buy organic food)
Q.58a Considering the broad categories of food that I will read out to you, about how often, if at all, do you buy any in organic form?
72
58
50
33
27
15
10
68
58
44
33
31
15
14
72
60
41
32
30
24
24
63
53
42
60
41
35
-
-
-
-
-
-
-
-
% Weekly
40
31
18
14
9
8
4
40
33
15
15
10
8
6
40
31
13
17
14
15
11
26
22
17
32
16
14
-
-
-
-
-
-
-
-
ROI 2011
ROI 2009
ROI 2007
ROI 2005
ROI 2003
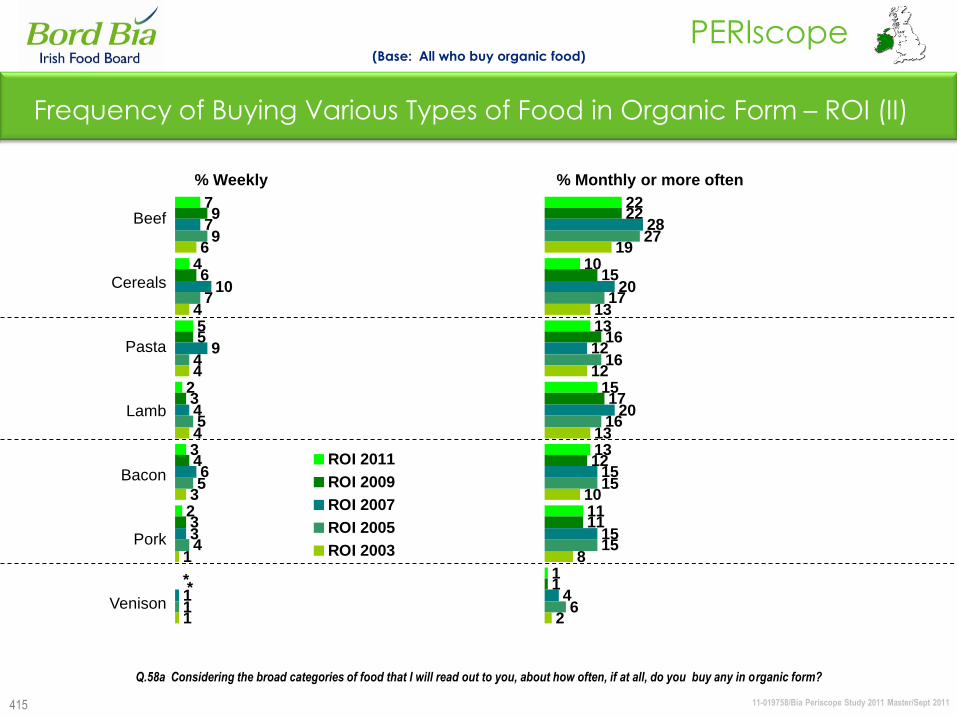
11-019758/Bia Periscope Study 2011 Master/Sept 2011
PERIscope
415
Frequency of Buying Various Types of Food in Organic Form – ROI (II)
Beef
Cereals
Pasta
Lamb
Bacon
Pork
Venison
7
4
5
2
3
2
9
6
5
3
4
3
7
10
9
4
6
3
1
9
7
4
5
5
4
1
6
4
4
4
3
1
1
**
ROI 2011
ROI 2009
ROI 2007
ROI 2005
ROI 2003
% Weekly
(Base: All who buy organic food)
Q.58a Considering the broad categories of food that I will read out to you, about how often, if at all, do you buy any in organic form?
22
10
13
15
13
11
1
22
15
16
17
12
11
1
28
20
12
20
15
15
4
27
17
16
16
15
15
6
19
13
12
13
10
8
2
% Monthly or more often
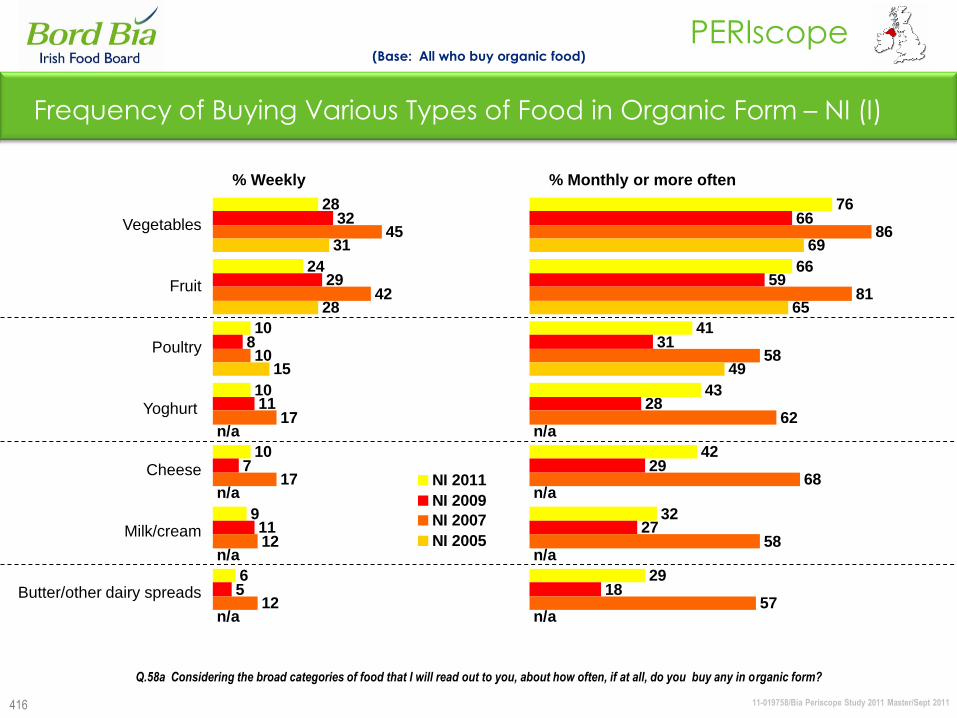
11-019758/Bia Periscope Study 2011 Master/Sept 2011
PERIscope
416
Frequency of Buying Various Types of Food in Organic Form – NI (I)
Vegetables
Fruit
Poultry
Yoghurt
Cheese
Milk/cream
Butter/other dairy spreads
% Weekly % Monthly or more often
(Base: All who buy organic food)
Q.58a Considering the broad categories of food that I will read out to you, about how often, if at all, do you buy any in organic form?
28
24
10
10
10
9
6
32
29
8
11
7
11
5
45
42
10
17
17
12
12
31
28
15
n/a
n/a
n/a
n/a
NI 2011
NI 2009
NI 2007
NI 2005
76
66
41
43
42
32
29
66
59
31
28
29
27
18
86
81
58
62
68
58
57
69
65
49
n/a
n/a
n/a
n/a
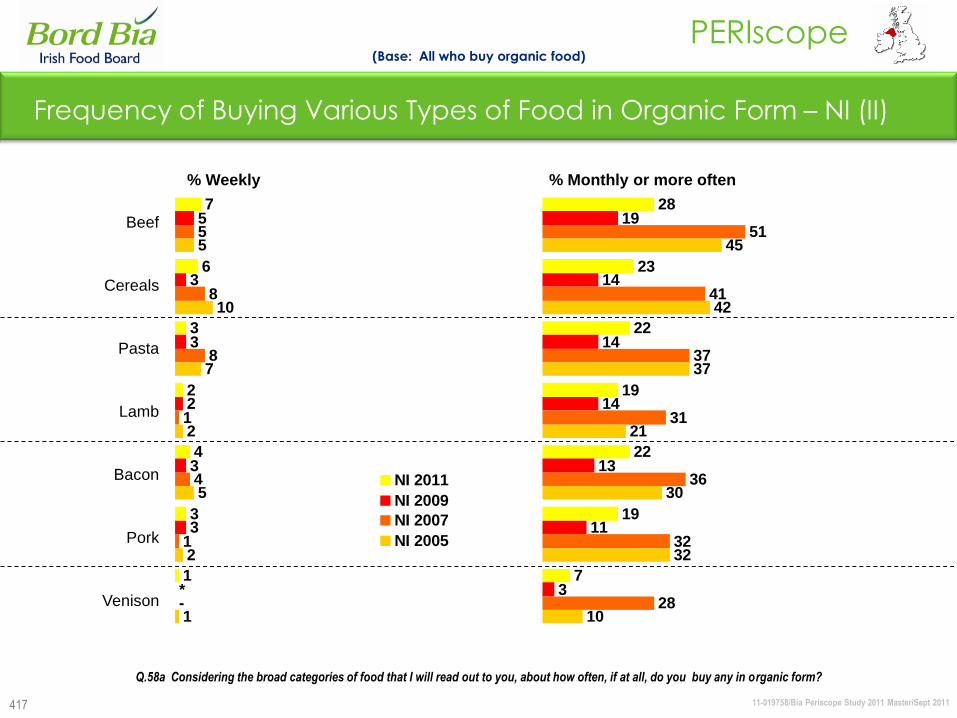
11-019758/Bia Periscope Study 2011 Master/Sept 2011
PERIscope
417
Frequency of Buying Various Types of Food in Organic Form – NI (II)
Beef
Cereals
Pasta
Lamb
Bacon
Pork
Venison
% Weekly
(Base: All who buy organic food)
Q.58a Considering the broad categories of food that I will read out to you, about how often, if at all, do you buy any in organic form?
% Monthly or more often
28
23
22
19
22
19
7
19
14
14
14
13
11
3
51
41
37
31
36
32
28
45
42
37
21
30
32
10
7
6
3
2
4
3
1
5
3
3
2
3
3
5
8
8
1
4
1
5
10
7
2
5
2
1
*-
NI 2011
NI 2009
NI 2007
NI 2005
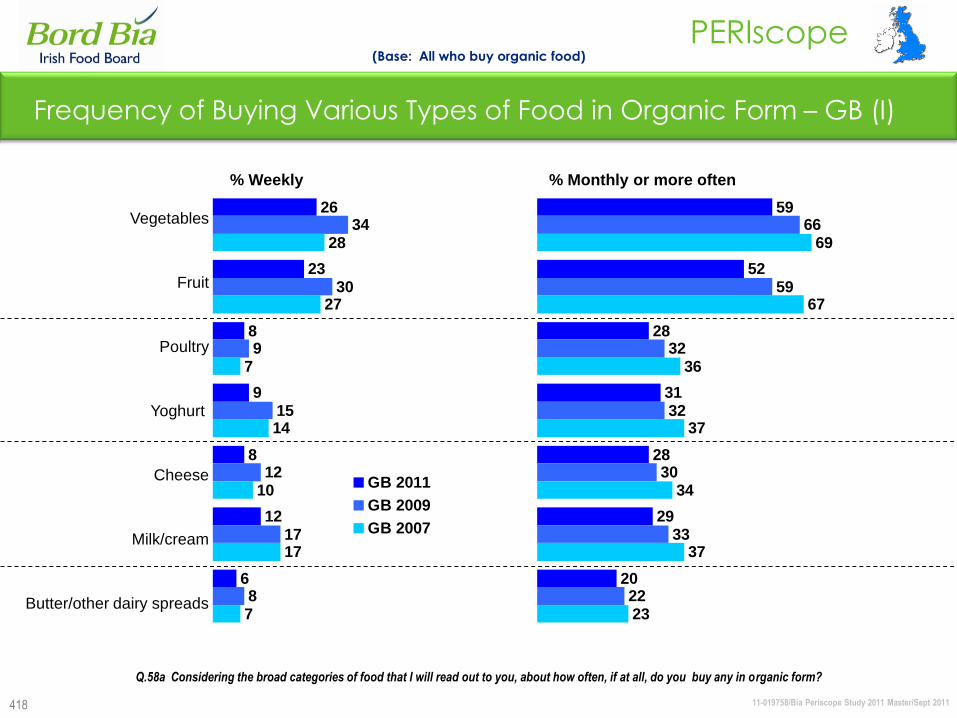
11-019758/Bia Periscope Study 2011 Master/Sept 2011
PERIscope
418
Frequency of Buying Various Types of Food in Organic Form – GB (I)
Vegetables
Fruit
Poultry
Yoghurt
Cheese
Milk/cream
Butter/other dairy spreads
26
23
8
9
8
12
6
34
30
9
15
12
17
8
28
27
7
14
10
17
7
GB 2011
GB 2009
GB 2007
% Weekly % Monthly or more often
(Base: All who buy organic food)
Q.58a Considering the broad categories of food that I will read out to you, about how often, if at all, do you buy any in organic form?
59
52
28
31
28
29
20
66
59
32
32
30
33
22
69
67
36
37
34
37
23
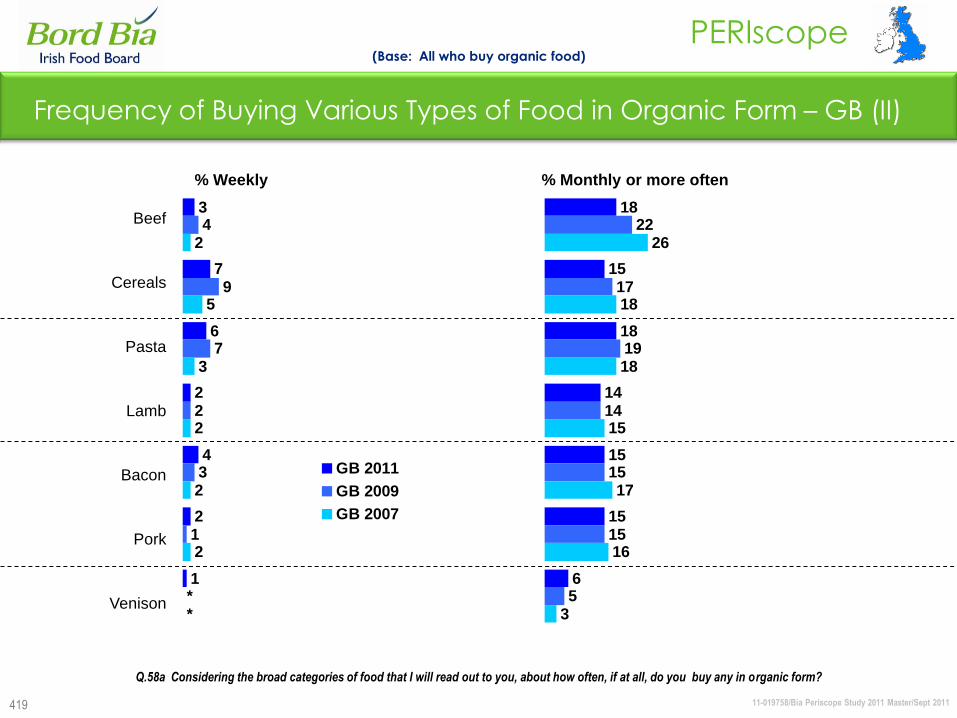
11-019758/Bia Periscope Study 2011 Master/Sept 2011
PERIscope
419
Frequency of Buying Various Types of Food in Organic Form – GB (II)
Beef
Cereals
Pasta
Lamb
Bacon
Pork
Venison
% Weekly
(Base: All who buy organic food)
Q.58a Considering the broad categories of food that I will read out to you, about how often, if at all, do you buy any in organic form?
% Monthly or more often
3
7
6
2
4
2
1
4
9
7
2
3
1
2
5
3
2
2
2
**
GB 2011
GB 2009
GB 2007
18
15
18
14
15
15
6
22
17
19
14
15
15
5
26
18
18
15
17
16
3
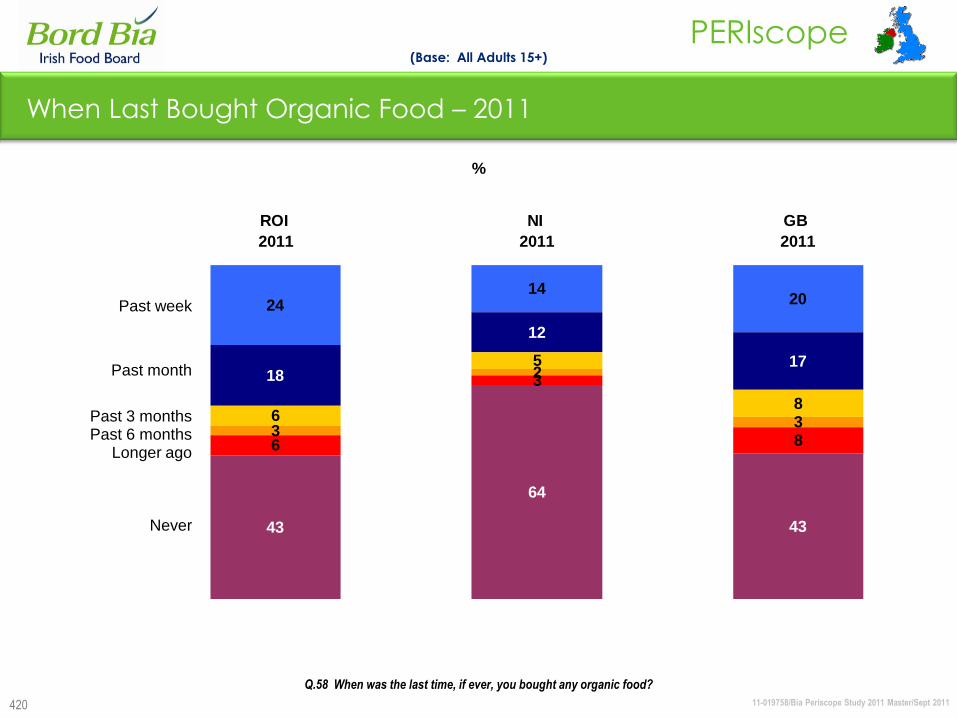
11-019758/Bia Periscope Study 2011 Master/Sept 2011
PERIscope
420
2414
20
18
12
17
6
5
8
3
2
3
6
3
8
43
64
43
ROI
2011
NI
2011
GB
2011
%
Past week
Past month
Past 3 monthsPast 6 months
Longer ago
Never
When Last Bought Organic Food – 2011
(Base: All Adults 15+)
Q.58 When was the last time, if ever, you bought any organic food?
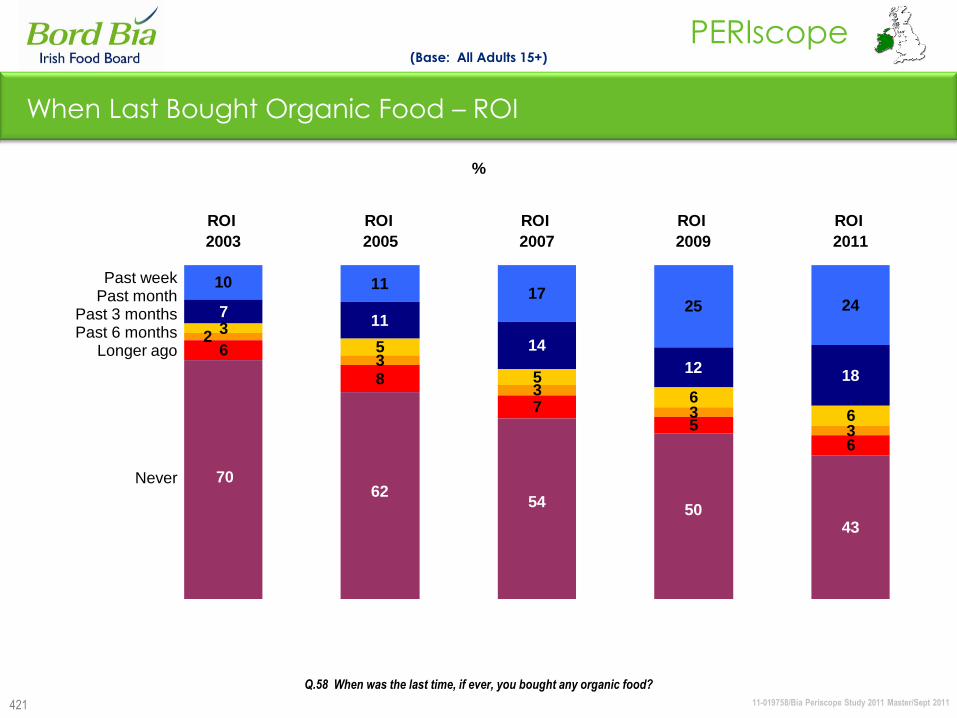
11-019758/Bia Periscope Study 2011 Master/Sept 2011
PERIscope
421
10 1117
25 24711
14
1218
35
5
66
3
3
33
6
8
75
6
43
2
70
5054
62
ROI
2003
ROI
2005
ROI
2007
ROI
2009
ROI
2011
%
Past weekPast month
Past 3 monthsPast 6 months
Longer ago
Never
When Last Bought Organic Food – ROI
(Base: All Adults 15+)
Q.58 When was the last time, if ever, you bought any organic food?
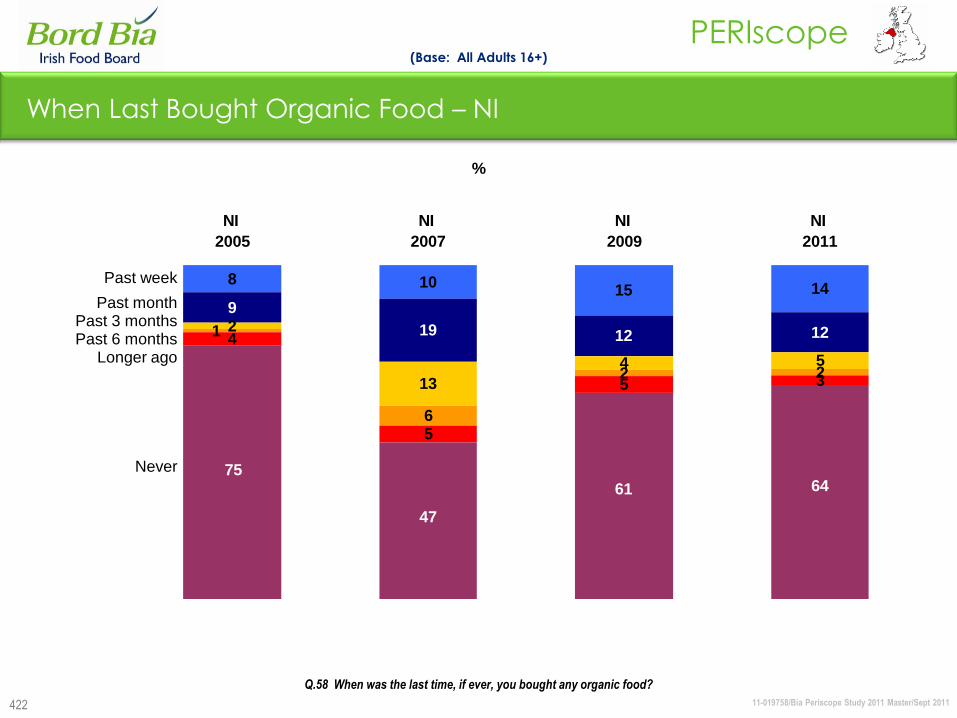
11-019758/Bia Periscope Study 2011 Master/Sept 2011
PERIscope
422
8 1015 14
9
19 12 122
13
4 5
6
2 2
4
5
5 3
1
756461
47
NI
2005
NI
2007
NI
2009
NI
2011
%
Past week
Past monthPast 3 monthsPast 6 months
Longer ago
Never
When Last Bought Organic Food – NI
(Base: All Adults 16+)
Q.58 When was the last time, if ever, you bought any organic food?
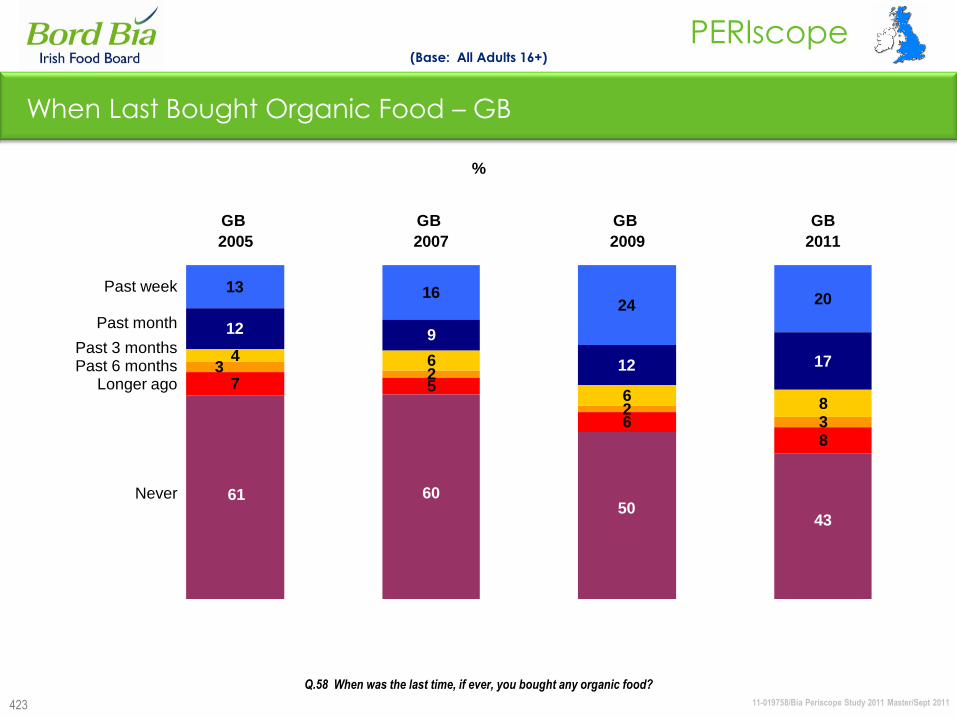
11-019758/Bia Periscope Study 2011 Master/Sept 2011
PERIscope
423
%
Past week
Past month
Past 3 monthsPast 6 months
Longer ago
Never
When Last Bought Organic Food – GB
(Base: All Adults 16+)
Q.58 When was the last time, if ever, you bought any organic food?
13 1624 20
12 9
12 174 6
68
2
23
7 5
68
3
61
4350
60
GB
2005
GB
2007
GB
2009
GB
2011

Alcohol
11-019758/Bia Periscope Study 2011 Master/Sept 2011
PERIscope
425
Alcohol: Summary
Approximately 7 in 10 adults in ROI and GB consume alcohol nowadays. In NI, the figure
drops to just over 6 in 10.
In each region, alcohol consumption is highest amongst 25-44 year olds.
Of those consuming alcohol, daily and weekly consumption tends to be higher in GB.
However, daily and weekly consumption have declined in all regions since 2009.
ROI now has the largest proportion of alcohol drinkers consuming alcohol less often than
once a month. The % of people drinking alcohol with food has also declined in ROI since
the last wave of research.
The purchase of alcohol from supermarkets or off licences as opposed to pubs has
remained the standard for over 6 in 10 consumers in each of the regions.
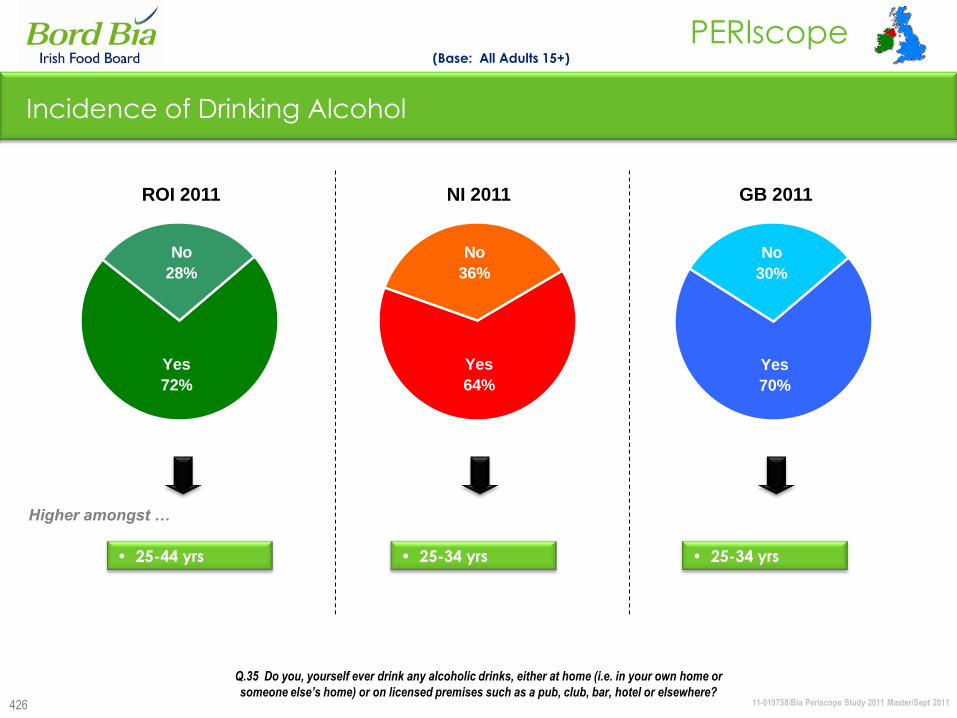
11-019758/Bia Periscope Study 2011 Master/Sept 2011
PERIscope
426
No
28%
Yes
72%
Incidence of Drinking Alcohol
ROI 2011
• 25-34 yrs • 25-34 yrs
(Base: All Adults 15+)
No
36%
Yes
64%
No
30%
Yes
70%
Q.35 Do you, yourself ever drink any alcoholic drinks, either at home (i.e. in your own home or
someone else‟s home) or on licensed premises such as a pub, club, bar, hotel or elsewhere?
Higher amongst …
GB 2011NI 2011
• 25-44 yrs
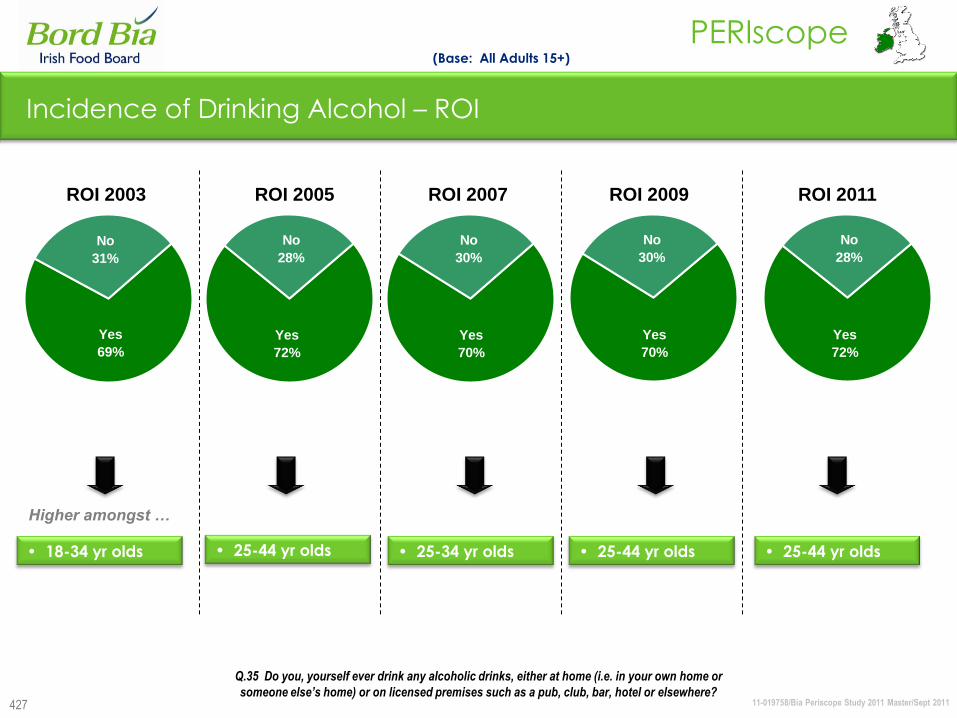
11-019758/Bia Periscope Study 2011 Master/Sept 2011
PERIscope
427
No
28%
Yes
72%
Incidence of Drinking Alcohol – ROI
ROI 2003
• 25-44 yr olds • 25-44 yr olds
(Base: All Adults 15+)
ROI 2005
• 25-34 yr olds
ROI 2007 ROI 2009
No
31%
Yes
69%
No
30%
Yes
70%
Q.35 Do you, yourself ever drink any alcoholic drinks, either at home (i.e. in your own home or
someone else‟s home) or on licensed premises such as a pub, club, bar, hotel or elsewhere?
Higher amongst …
No
30%
Yes
70%
ROI 2011
• 25-44 yr olds
No
28%
Yes
72%
• 18-34 yr olds
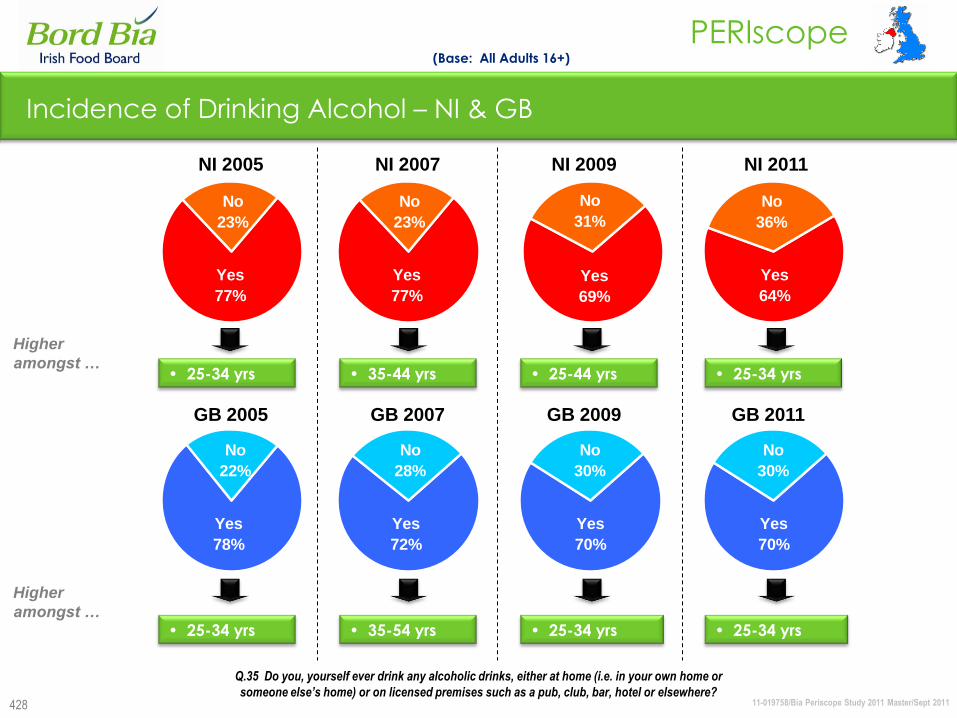
11-019758/Bia Periscope Study 2011 Master/Sept 2011
PERIscope
428
Incidence of Drinking Alcohol – NI & GB
Q.35 Do you, yourself ever drink any alcoholic drinks, either at home (i.e. in your own home or
someone else‟s home) or on licensed premises such as a pub, club, bar, hotel or elsewhere?
(Base: All Adults 16+)
No
23%
Yes
77%
No
23%
Yes
77%
• 35-54 yrs• 25-34 yrs • 25-34 yrs
No
22%
Yes
78%
No
28%
Yes
72%
No
30%
Yes
70%
No
31%
Yes
69%
Higher
amongst …
Higher
amongst …
• 25-34 yrs
NI 2009NI 2007NI 2005 NI 2011
• 35-44 yrs• 25-34 yrs • 25-44 yrs
GB 2009GB 2007GB 2005
• 25-34 yrs
GB 2011
No
30%
Yes
70%
No
36%
Yes
64%

11-019758/Bia Periscope Study 2011 Master/Sept 2011
PERIscope
429
2836
45
4233
32
1924
17
116 6
ROI 2011
(72%)
NI 2011
(64%)
GB 2011
(70%)
Daily/several times a week
Weekly
2-3 times/once a month
Less often
%
Frequency of Drinking Any Alcohol – 2011
(Base: All who drink alcohol)
Q.36 About how often do you have an alcoholic drink either at home or in someone else‟s home or
on licensed premises such as a pub, bar, club, hotel etc.?
% Drink Alcohol
Average Oncea week
Oncea week
Oncea week
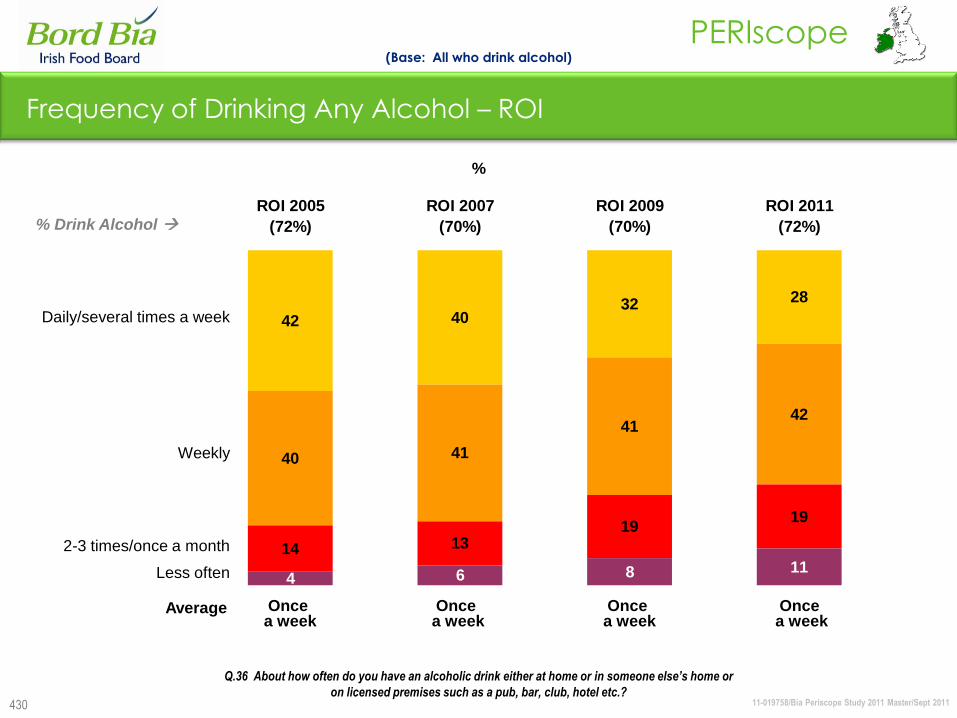
11-019758/Bia Periscope Study 2011 Master/Sept 2011
PERIscope
430
42 4032 28
40 41
4142
14 1319
19
4 6 8 11
ROI 2005
(72%)
ROI 2007
(70%)
ROI 2009
(70%)
ROI 2011
(72%)
Daily/several times a week
Weekly
2-3 times/once a month
Less often
%
Frequency of Drinking Any Alcohol – ROI
(Base: All who drink alcohol)
Q.36 About how often do you have an alcoholic drink either at home or in someone else‟s home or
on licensed premises such as a pub, bar, club, hotel etc.?
% Drink Alcohol
Average Oncea week
Oncea week
Oncea week
Oncea week

11-019758/Bia Periscope Study 2011 Master/Sept 2011
PERIscope
431
40
57
4436
33
23
31
33
2416
2024
3 4 5 6
NI 2005
(77%)
NI 2007
(77%)
NI 2009
(69%)
NI 2011
(64%)
Daily/several times a week
Weekly
2-3 times/once a month
Less often
%
Frequency of Drinking Any Alcohol – NI
(Base: All who drink alcohol)
Q.36 About how often do you have an alcoholic drink either at home or in someone else‟s home or
on licensed premises such as a pub, bar, club, hotel etc.?
% Drink Alcohol
Average Oncea week
Once a week/several times a week
Oncea week
Oncea week
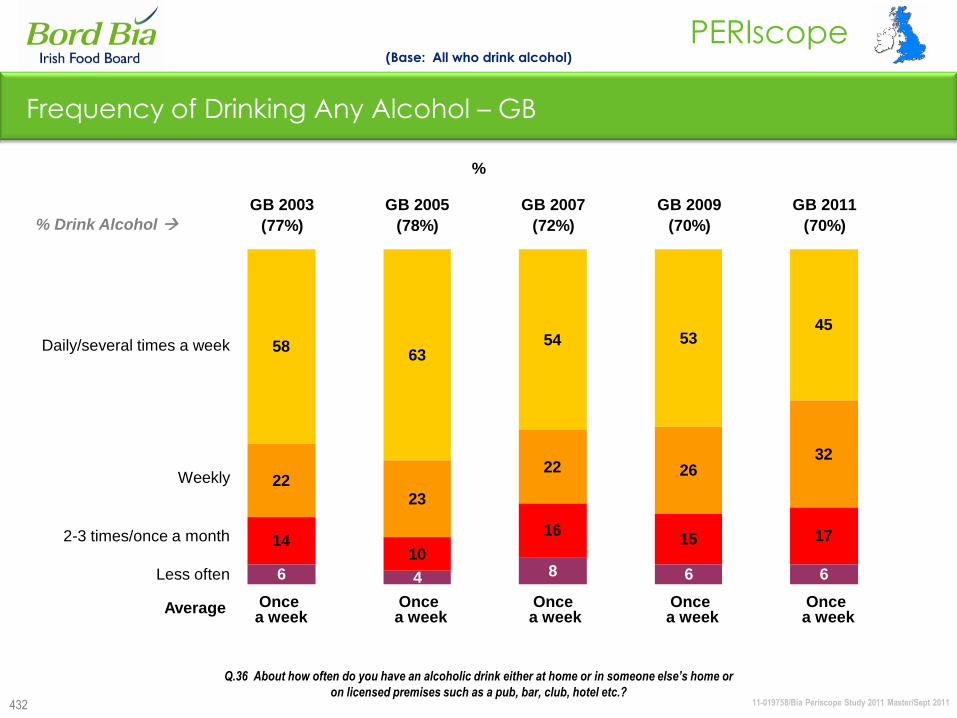
11-019758/Bia Periscope Study 2011 Master/Sept 2011
PERIscope
432
5863
54 5345
2223
22 2632
1410
1615 17
6 4 8 6 6
GB 2003
(77%)
GB 2005
(78%)
GB 2007
(72%)
GB 2009
(70%)
GB 2011
(70%)
Daily/several times a week
Weekly
2-3 times/once a month
Less often
%
Frequency of Drinking Any Alcohol – GB
(Base: All who drink alcohol)
Q.36 About how often do you have an alcoholic drink either at home or in someone else‟s home or
on licensed premises such as a pub, bar, club, hotel etc.?
% Drink Alcohol
Average Oncea week
Oncea week
Oncea week
Oncea week
Oncea week
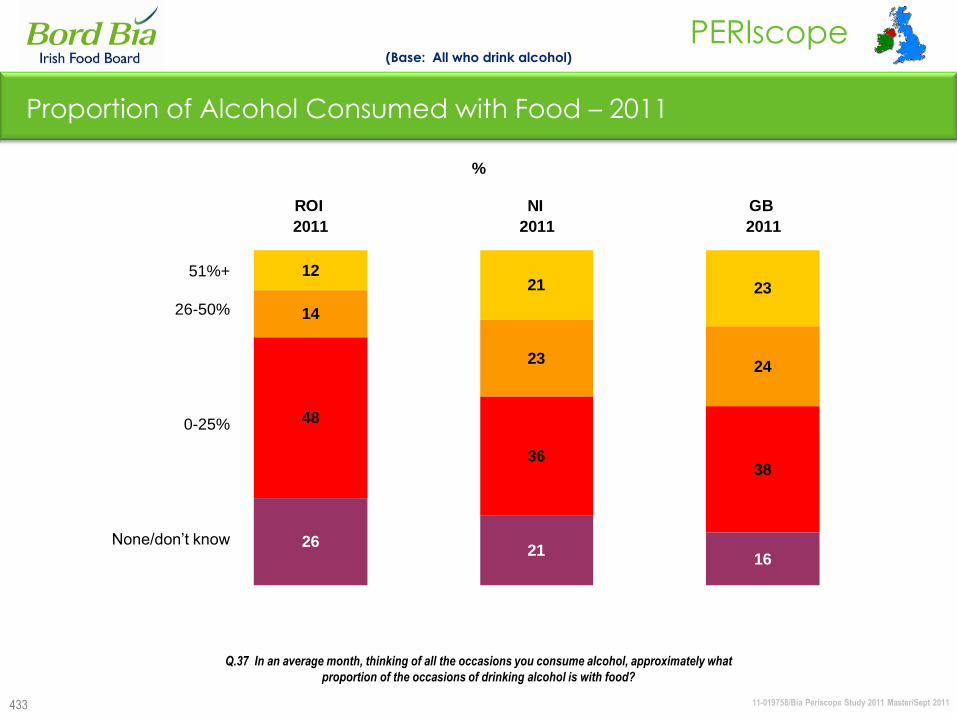
11-019758/Bia Periscope Study 2011 Master/Sept 2011
PERIscope
433
Proportion of Alcohol Consumed with Food – 2011
(Base: All who drink alcohol)
1221 23
14
2324
48
3638
2621
16
ROI
2011
NI
2011
GB
2011
51%+
26-50%
0-25%
None/don‟t know
Q.37 In an average month, thinking of all the occasions you consume alcohol, approximately what
proportion of the occasions of drinking alcohol is with food?
%
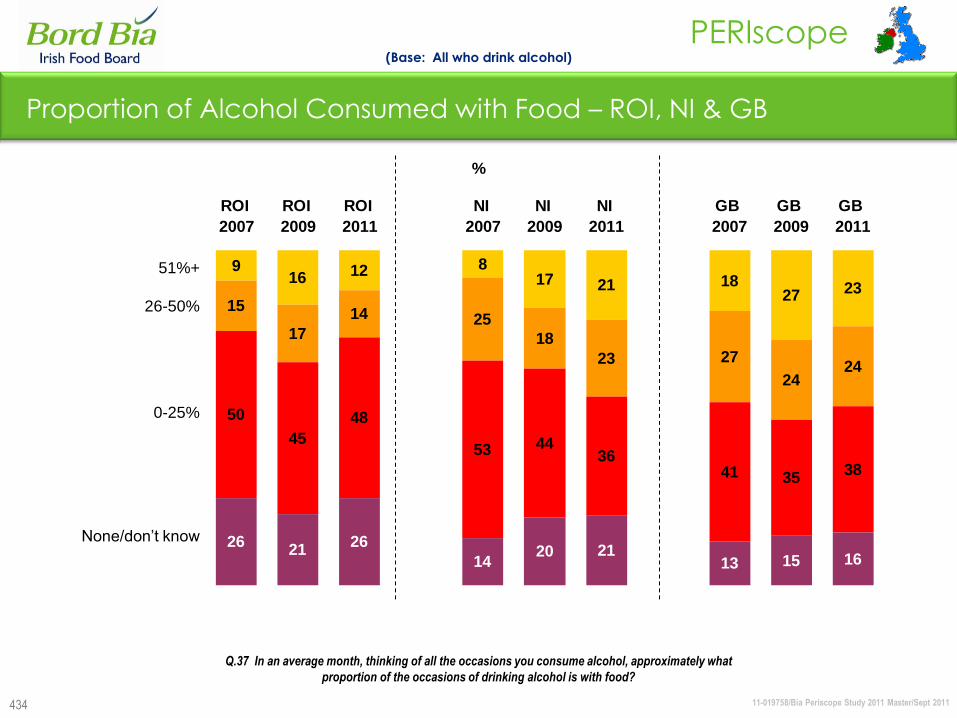
11-019758/Bia Periscope Study 2011 Master/Sept 2011
PERIscope
434
Proportion of Alcohol Consumed with Food – ROI, NI & GB
(Base: All who drink alcohol)
916 12 8
17 21 1827 23
15
17
14 25
18
23 27
2424
50
45
48
53 4436
41 3538
2621
26
1420 21
13 15 16
ROI
2007
ROI
2009
ROI
2011
NI
2007
NI
2009
NI
2011
GB
2007
GB
2009
GB
2011
51%+
26-50%
0-25%
None/don‟t know
Q.37 In an average month, thinking of all the occasions you consume alcohol, approximately what
proportion of the occasions of drinking alcohol is with food?
%
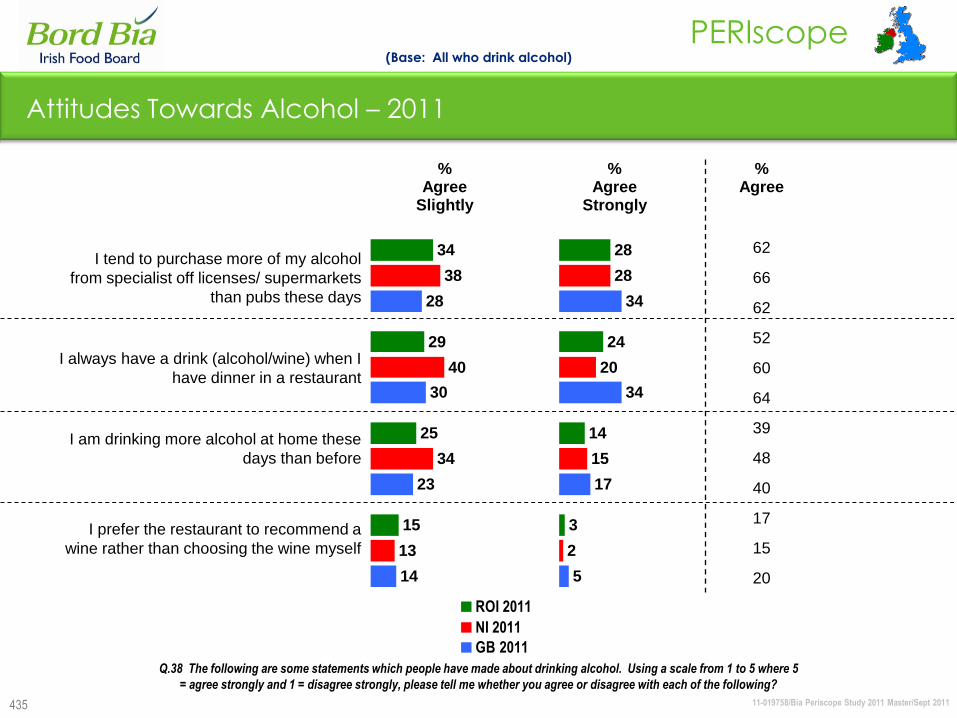
11-019758/Bia Periscope Study 2011 Master/Sept 2011
PERIscope
%Agree
Slightly
%Agree
Strongly
%Agree
I tend to purchase more of my alcohol
from specialist off licenses/ supermarkets
than pubs these days
62
66
62
I always have a drink (alcohol/wine) when I
have dinner in a restaurant
52
60
64
I am drinking more alcohol at home these
days than before
39
48
40
I prefer the restaurant to recommend a
wine rather than choosing the wine myself
17
15
20
435
Attitudes Towards Alcohol – 2011
Q.38 The following are some statements which people have made about drinking alcohol. Using a scale from 1 to 5 where 5
= agree strongly and 1 = disagree strongly, please tell me whether you agree or disagree with each of the following?
14
23
30
28
13
34
40
38
15
25
29
34
ROI 2011
NI 2011
GB 2011
5
17
34
34
2
15
20
28
3
14
24
28
(Base: All who drink alcohol)
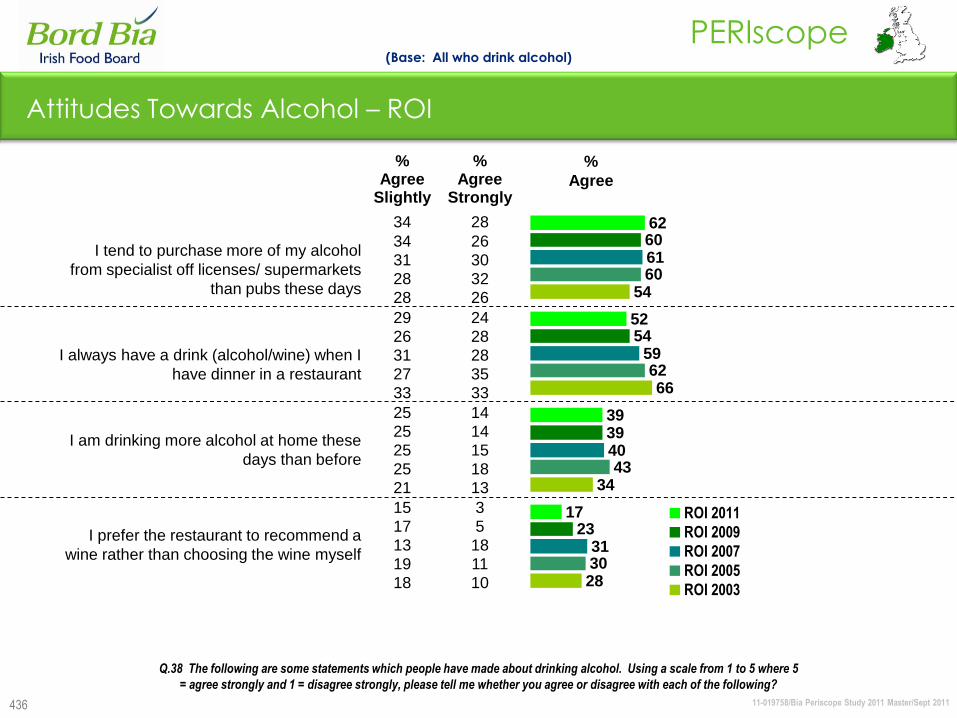
11-019758/Bia Periscope Study 2011 Master/Sept 2011
PERIscope
436
%
Agree
%Agree
Slightly
%Agree
Strongly
34 28
I tend to purchase more of my alcohol
from specialist off licenses/ supermarkets
than pubs these days
34 26
31 30
28 32
28 26
29 24
I always have a drink (alcohol/wine) when I
have dinner in a restaurant
26 28
31 28
27 35
33 33
25 14
I am drinking more alcohol at home these
days than before
25 14
25 15
25 18
21 13
15 3
I prefer the restaurant to recommend a
wine rather than choosing the wine myself
17 5
13 18
19 11
18 10
Attitudes Towards Alcohol – ROI
28
34
66
54
30
43
62
60
31
40
59
61
17
39
52
6260
54
39
23ROI 2011
ROI 2009
ROI 2007
ROI 2005
ROI 2003
Q.38 The following are some statements which people have made about drinking alcohol. Using a scale from 1 to 5 where 5
= agree strongly and 1 = disagree strongly, please tell me whether you agree or disagree with each of the following?
(Base: All who drink alcohol)
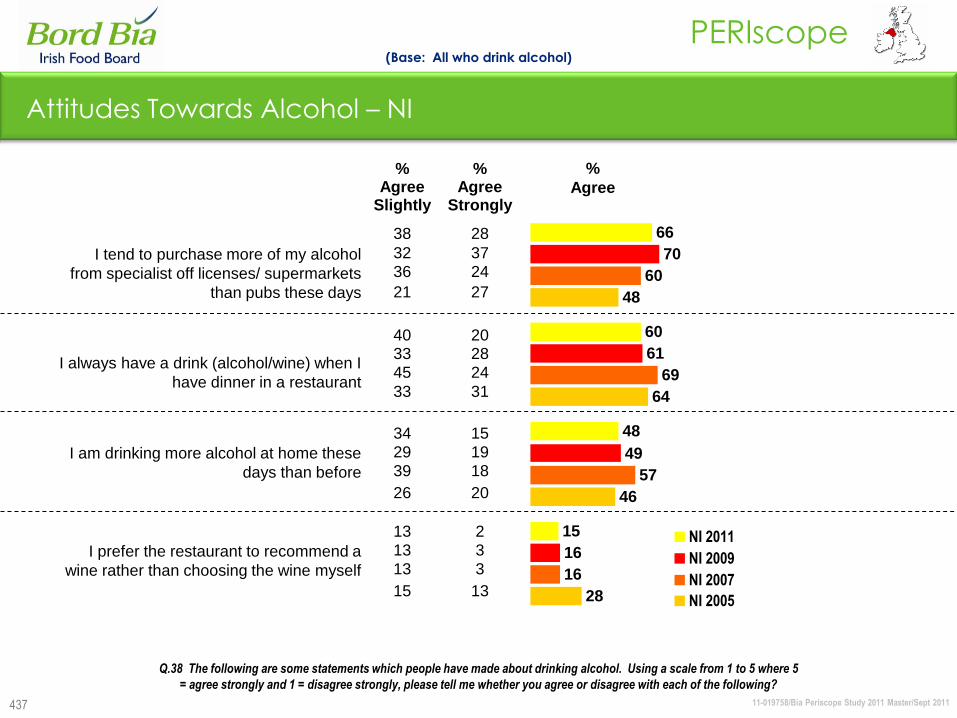
11-019758/Bia Periscope Study 2011 Master/Sept 2011
PERIscope
437
%
Agree
%Agree
Slightly
%Agree
Strongly
38 28
I tend to purchase more of my alcohol
from specialist off licenses/ supermarkets
than pubs these days
32 37
36 24
21 27
40 20
I always have a drink (alcohol/wine) when I
have dinner in a restaurant
33 28
45 24
33 31
34 15
I am drinking more alcohol at home these
days than before
29 19
39 18
26 20
13 2
I prefer the restaurant to recommend a
wine rather than choosing the wine myself
13 3
13 3
15 13
Attitudes Towards Alcohol – NI
28
46
64
48
16
57
69
60
15
48
60
66
70
61
49
16NI 2011
NI 2009
NI 2007
NI 2005
Q.38 The following are some statements which people have made about drinking alcohol. Using a scale from 1 to 5 where 5
= agree strongly and 1 = disagree strongly, please tell me whether you agree or disagree with each of the following?
(Base: All who drink alcohol)
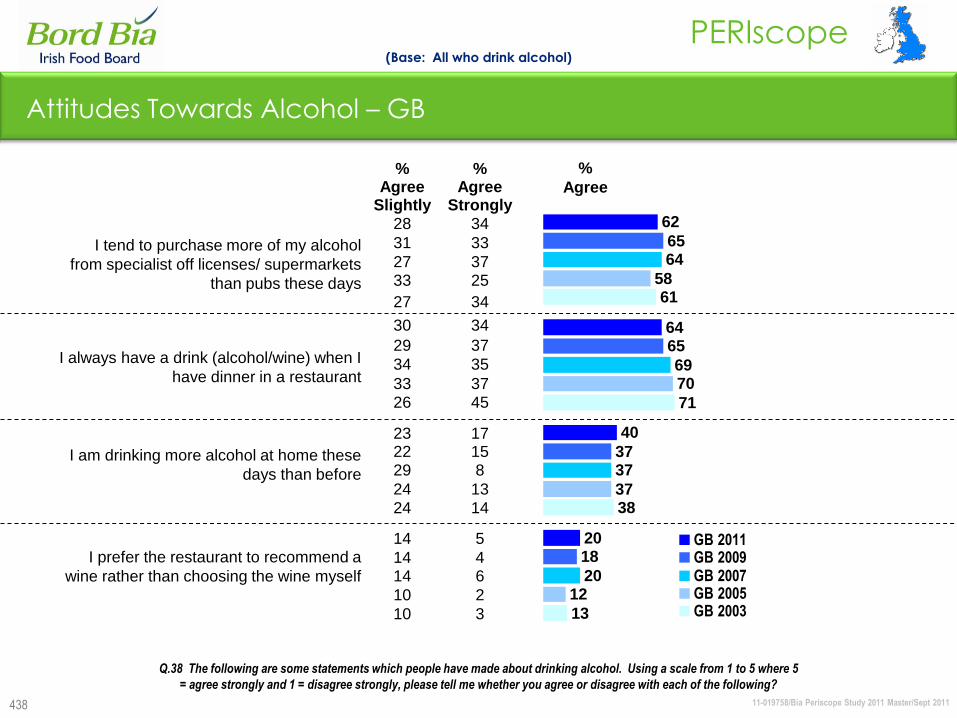
11-019758/Bia Periscope Study 2011 Master/Sept 2011
PERIscope
438
%
Agree %
AgreeSlightly
%Agree
Strongly
I tend to purchase more of my alcohol
from specialist off licenses/ supermarkets
than pubs these days
28 34
31 33
27 3733 25
27 34
I always have a drink (alcohol/wine) when I
have dinner in a restaurant
30 34
29 37
34 35
33 3726 45
I am drinking more alcohol at home these
days than before
23 1722 1529 8
24 1324 14
I prefer the restaurant to recommend a
wine rather than choosing the wine myself
14 5
14 414 6
10 2
10 3
Attitudes Towards Alcohol – GB
13
38
71
61
12
37
70
58
20
37
69
64
20
40
64
62
65
65
37
18GB 2011GB 2009 GB 2007 GB 2005GB 2003
Q.38 The following are some statements which people have made about drinking alcohol. Using a scale from 1 to 5 where 5
= agree strongly and 1 = disagree strongly, please tell me whether you agree or disagree with each of the following?
(Base: All who drink alcohol)

11-019758/Bia Periscope Study 2011 Master/Sept 2011
PERIscope
439
Image Profiling Of Store Type
11-019758/Bia Periscope Study 2011 Master/Sept 2011
PERIscope
440
Image Profiling
Why do image profiling………?
And what does it reveal……..?
Some brands/companies get high scores for all attributes because they are better known
brands/companies.
Some attributes score high for all brands/companies because they are generic to all
brands/companies.
Image profiling strips away the noise to reveal the underlying image contours.
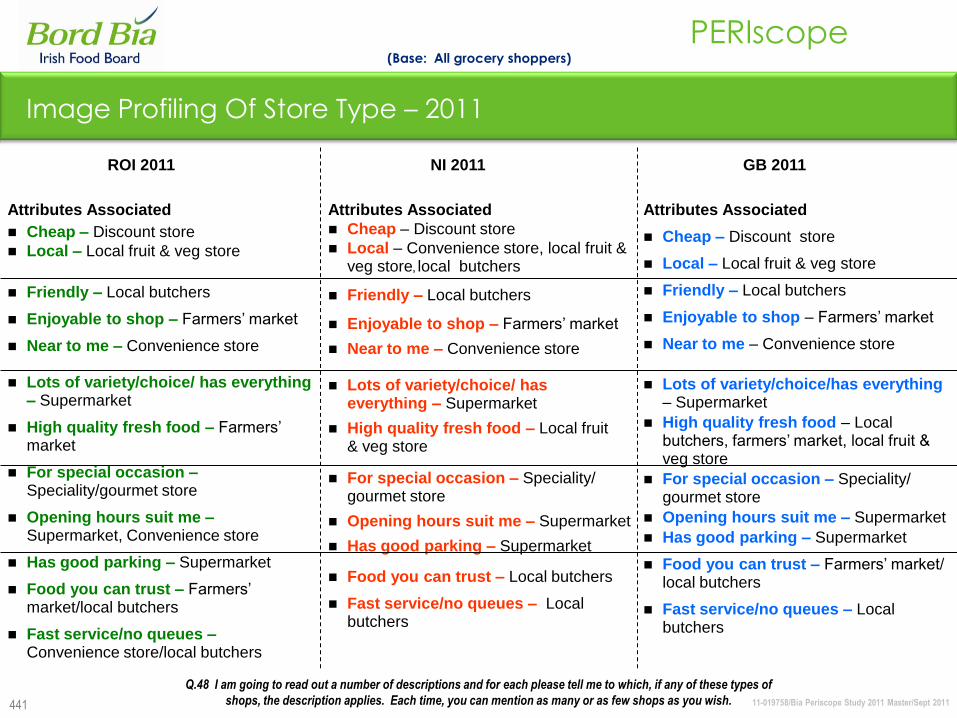
11-019758/Bia Periscope Study 2011 Master/Sept 2011
PERIscope
441
Image Profiling Of Store Type – 2011
Attributes Associated
Cheap – Discount store
Local – Local fruit & veg store
Friendly – Local butchers
Enjoyable to shop – Farmers‟ market
Near to me – Convenience store
Lots of variety/choice/has everything– Supermarket
High quality fresh food – Local butchers, farmers‟ market, local fruit & veg store
For special occasion – Speciality/ gourmet store
Opening hours suit me – Supermarket
Has good parking – Supermarket
Food you can trust – Farmers‟ market/ local butchers
Fast service/no queues – Local butchers
Attributes Associated
Cheap – Discount store
Local – Local fruit & veg store
Friendly – Local butchers
Enjoyable to shop – Farmers‟ market
Near to me – Convenience store
Lots of variety/choice/ has everything – Supermarket
High quality fresh food – Farmers‟ market
For special occasion –Speciality/gourmet store
Opening hours suit me –Supermarket, Convenience store
Has good parking – Supermarket
Food you can trust – Farmers‟market/local butchers
Fast service/no queues –Convenience store/local butchers
Attributes Associated
Cheap – Discount store
Local – Convenience store, local fruit & veg store, local butchers
Friendly – Local butchers
Enjoyable to shop – Farmers‟ market
Near to me – Convenience store
Lots of variety/choice/ has everything – Supermarket
High quality fresh food – Local fruit & veg store
For special occasion – Speciality/ gourmet store
Opening hours suit me – Supermarket
Has good parking – Supermarket
Food you can trust – Local butchers
Fast service/no queues – Local butchers
Q.48 I am going to read out a number of descriptions and for each please tell me to which, if any of these types of
shops, the description applies. Each time, you can mention as many or as few shops as you wish.
(Base: All grocery shoppers)
GB 2011 NI 2011 ROI 2011
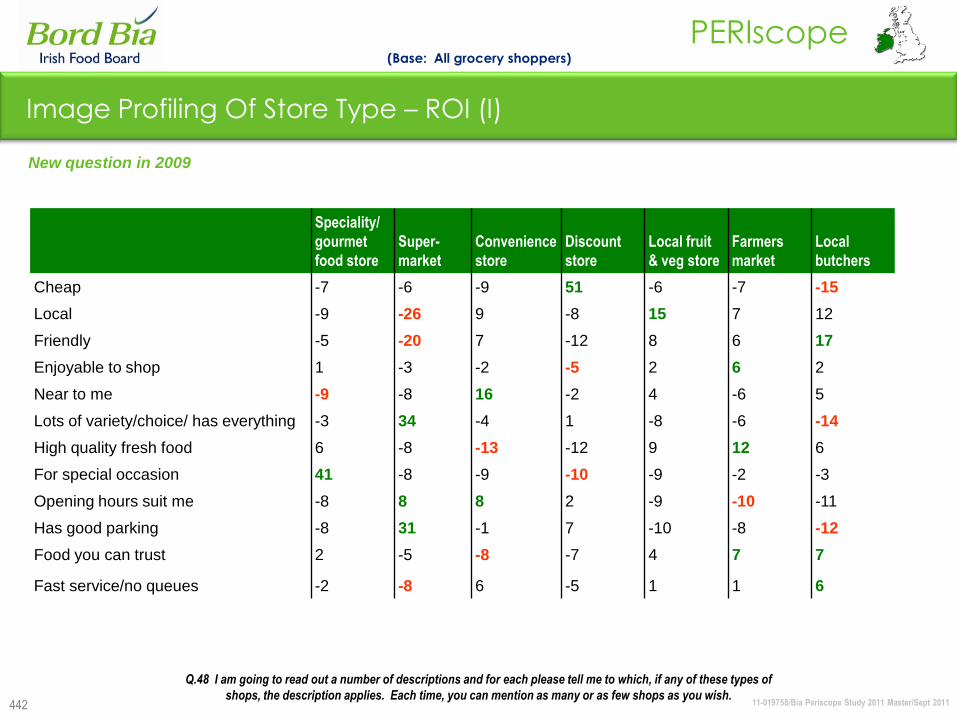
11-019758/Bia Periscope Study 2011 Master/Sept 2011
PERIscope
442
Image Profiling Of Store Type – ROI (I)
Speciality/
gourmet
food store
Super-
market
Convenience
store
Discount
store
Local fruit
& veg store
Farmers
market
Local
butchers
Cheap -7 -6 -9 51 -6 -7 -15
Local -9 -26 9 -8 15 7 12
Friendly -5 -20 7 -12 8 6 17
Enjoyable to shop 1 -3 -2 -5 2 6 2
Near to me -9 -8 16 -2 4 -6 5
Lots of variety/choice/ has everything -3 34 -4 1 -8 -6 -14
High quality fresh food 6 -8 -13 -12 9 12 6
For special occasion 41 -8 -9 -10 -9 -2 -3
Opening hours suit me -8 8 8 2 -9 -10 -11
Has good parking -8 31 -1 7 -10 -8 -12
Food you can trust 2 -5 -8 -7 4 7 7
Fast service/no queues -2 -8 6 -5 1 1 6
New question in 2009
Q.48 I am going to read out a number of descriptions and for each please tell me to which, if any of these types of
shops, the description applies. Each time, you can mention as many or as few shops as you wish.
(Base: All grocery shoppers)
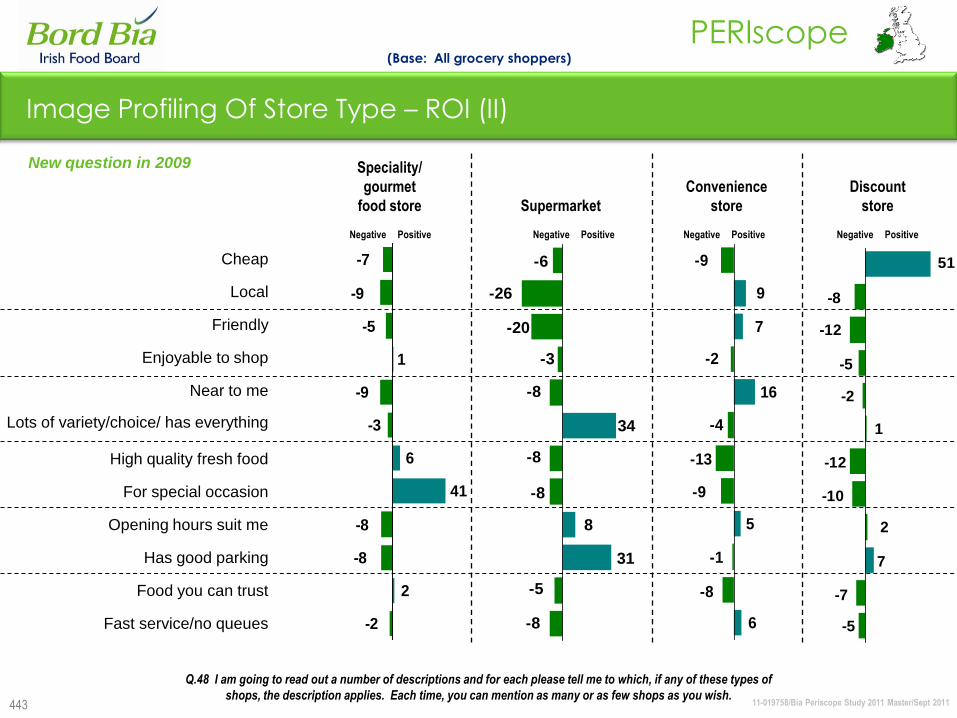
11-019758/Bia Periscope Study 2011 Master/Sept 2011
PERIscope
443
Speciality/
gourmet
food store Supermarket
Convenience
store
Discount
store
Cheap
Local
Friendly
Enjoyable to shop
Near to me
Lots of variety/choice/ has everything
High quality fresh food
For special occasion
Opening hours suit me
Has good parking
Food you can trust
Fast service/no queues -2
2
-8
-8
-7
-9
-5
1
-9
-3
6
41
Image Profiling Of Store Type – ROI (II)
Q.48 I am going to read out a number of descriptions and for each please tell me to which, if any of these types of
shops, the description applies. Each time, you can mention as many or as few shops as you wish.
New question in 2009
Negative Positive Negative Positive Negative Positive Negative Positive
-6
-26
-20
-3
-8
-8
-8
-8
-5
8
31
34
6
-8
-1
5
-9
-13
-4
16
-2
7
9
-9
-5
-7
7
2
-10
-12
1
-2
-5
-12
-8
51
(Base: All grocery shoppers)
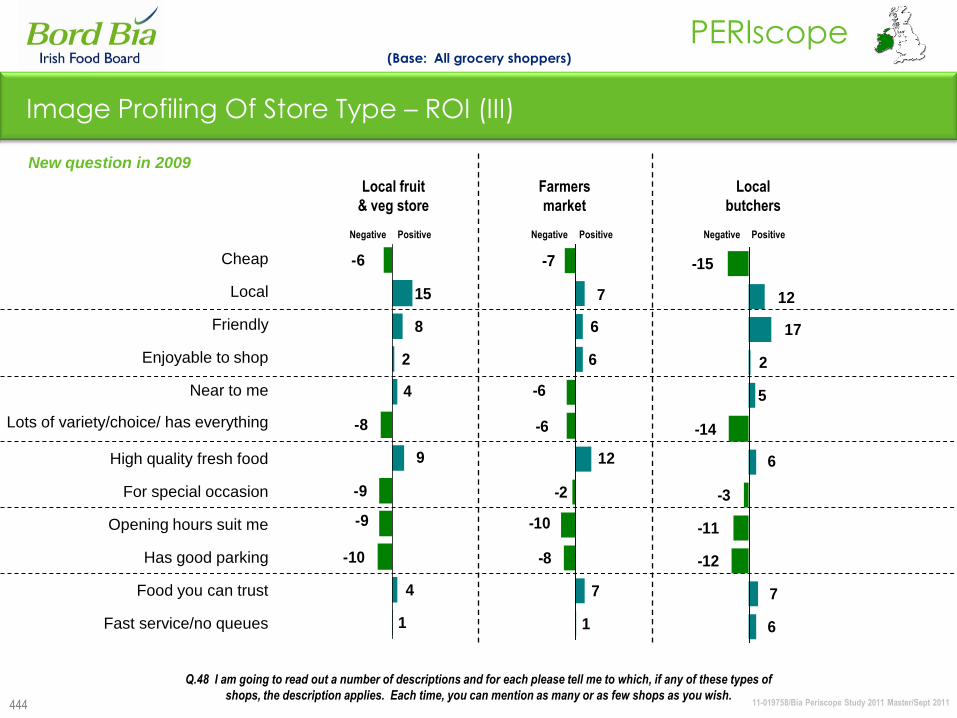
11-019758/Bia Periscope Study 2011 Master/Sept 2011
PERIscope
444
Local fruit
& veg store
Farmers
market
Local
butchers
Cheap
Local
Friendly
Enjoyable to shop
Near to me
Lots of variety/choice/ has everything
High quality fresh food
For special occasion
Opening hours suit me
Has good parking
Food you can trust
Fast service/no queues
Image Profiling Of Store Type – ROI (III)
Q.48 I am going to read out a number of descriptions and for each please tell me to which, if any of these types of
shops, the description applies. Each time, you can mention as many or as few shops as you wish.
New question in 2009
Negative Positive Negative Positive Negative Positive
1
4
-10
-9
-9
9
-8
4
2
8
15
-6
1
7
-8
-10
-2
12
-6
-6
6
6
7
-7
6
7
-12
-11
-3
-14
5
2
17
12
-15
6
(Base: All grocery shoppers)

11-019758/Bia Periscope Study 2011 Master/Sept 2011
PERIscope
445
Image Profiling Of Store Type – NI (I)
Speciality/
gourmet
food store
Super-
market
Convenience
store
Discount
store
Local fruit
& veg store
Farmers
market
Local
butchers
Cheap -9 -3 -3 51 -13 -5 -18
Local -11 -27 14 -5 14 1 14
Friendly -6 -27 10 -4 10 2 14
Enjoyable to shop 3 -1 -3 -4 1 6 -2
Near to me -9 -7 21 -2 1 -4 1
Lots of variety/choice/ -3 37 -6 -3 -9 -3 -13
High quality fresh food 9 -21 -18 -11 17 9 14
For special occasions 43 -12 -13 -8 -10 0 0
Opening hours suit me -7 26 10 -2 -10 -6 -12
Has good parking -7 42 -3 0 -12 -5 -15
Food you can trust 0 -11 -10 -8 10 6 14
Fast service/no queues -4 2 2 -4 0 -1 4
New question in 2009
Q.48 I am going to read out a number of descriptions and for each please tell me to which, if any of these types of
shops, the description applies. Each time, you can mention as many or as few shops as you wish.
(Base: All grocery shoppers)
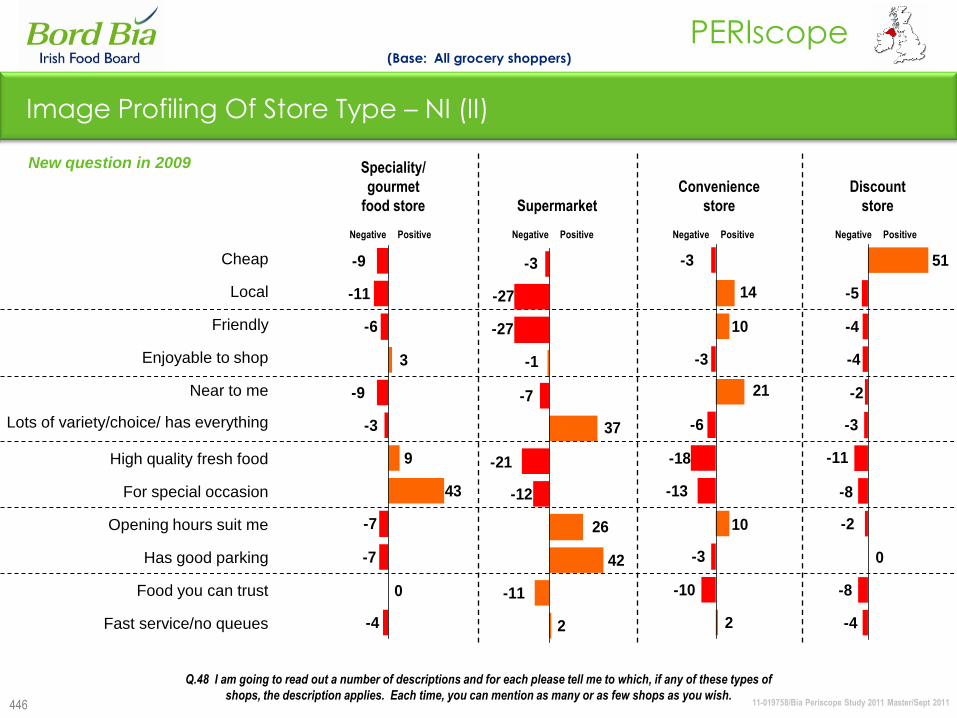
11-019758/Bia Periscope Study 2011 Master/Sept 2011
PERIscope
446
Speciality/
gourmet
food store Supermarket
Convenience
store
Discount
store
Cheap
Local
Friendly
Enjoyable to shop
Near to me
Lots of variety/choice/ has everything
High quality fresh food
For special occasion
Opening hours suit me
Has good parking
Food you can trust
Fast service/no queues -4
0
-7
-7
-9
-11
-6
3
-9
-3
9
43
Image Profiling Of Store Type – NI (II)
Q.48 I am going to read out a number of descriptions and for each please tell me to which, if any of these types of
shops, the description applies. Each time, you can mention as many or as few shops as you wish.
New question in 2009
Negative Positive Negative Positive Negative Positive Negative Positive
2
-11
42
26
-3
-27
-27
-1
-7
37
-21
-12
2
-10
-3
10
-3
14
10
-3
21
-6
-18
-13
-4
-8
0
-2
-8
-11
-3
-2
-4
-4
-5
51
(Base: All grocery shoppers)

11-019758/Bia Periscope Study 2011 Master/Sept 2011
PERIscope
447
Local fruit
& veg store
Farmers
market
Local
butchers
Cheap
Local
Friendly
Enjoyable to shop
Near to me
Lots of variety/choice/ has everything
High quality fresh food
For special occasion
Opening hours suit me
Has good parking
Food you can trust
Fast service/no queues
Image Profiling Of Store Type – NI (III)
Q.48 I am going to read out a number of descriptions and for each please tell me to which, if any of these types of
shops, the description applies. Each time, you can mention as many or as few shops as you wish.
New question in 2009
Negative Positive Negative Positive Negative Positive
0
10
-12
-10
-13
14
10
1
1
-9
17
-10
-1
6
-5
-6
-5
1
2
6
-4
-3
9
0
4
14
-15
-12
-18
14
14
-2
1
-13
14
0
(Base: All grocery shoppers)
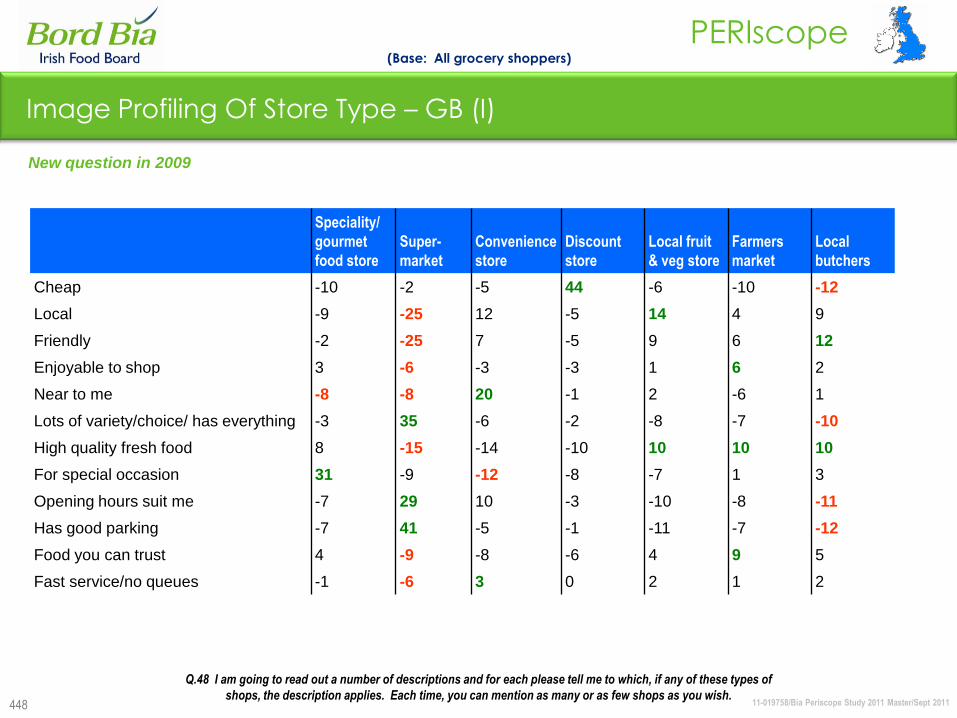
11-019758/Bia Periscope Study 2011 Master/Sept 2011
PERIscope
448
Image Profiling Of Store Type – GB (I)
Speciality/
gourmet
food store
Super-
market
Convenience
store
Discount
store
Local fruit
& veg store
Farmers
market
Local
butchers
Cheap -10 -2 -5 44 -6 -10 -12
Local -9 -25 12 -5 14 4 9
Friendly -2 -25 7 -5 9 6 12
Enjoyable to shop 3 -6 -3 -3 1 6 2
Near to me -8 -8 20 -1 2 -6 1
Lots of variety/choice/ has everything -3 35 -6 -2 -8 -7 -10
High quality fresh food 8 -15 -14 -10 10 10 10
For special occasion 31 -9 -12 -8 -7 1 3
Opening hours suit me -7 29 10 -3 -10 -8 -11
Has good parking -7 41 -5 -1 -11 -7 -12
Food you can trust 4 -9 -8 -6 4 9 5
Fast service/no queues -1 -6 3 0 2 1 2
New question in 2009
Q.48 I am going to read out a number of descriptions and for each please tell me to which, if any of these types of
shops, the description applies. Each time, you can mention as many or as few shops as you wish.
(Base: All grocery shoppers)

11-019758/Bia Periscope Study 2011 Master/Sept 2011
PERIscope
449
Speciality/
gourmet
food store Supermarket
Convenience
store
Discount
store
Cheap
Local
Friendly
Enjoyable to shop
Near to me
Lots of variety/choice/ has everything
High quality fresh food
For special occasion
Opening hours suit me
Has good parking
Food you can trust
Fast service/no queues
-2
-1
4
-7
-7
31
8
-3
-8
3
-9
-10
Image Profiling Of Store Type – GB (II)
Q.48 I am going to read out a number of descriptions and for each please tell me to which, if any of these types of
shops, the description applies. Each time, you can mention as many or as few shops as you wish.
-25
-6
-9
41
29
-9
-15
35
-8
-6
-25
-2
7
3
-8
-5
10
-12
-14
-6
20
-3
12
-5
0
-6
-1
-3
-8
-10
-2
-1
-3
-5
-5
44
New question in 2009
Negative Positive Negative Positive Negative Positive Negative Positive
(Base: All grocery shoppers)
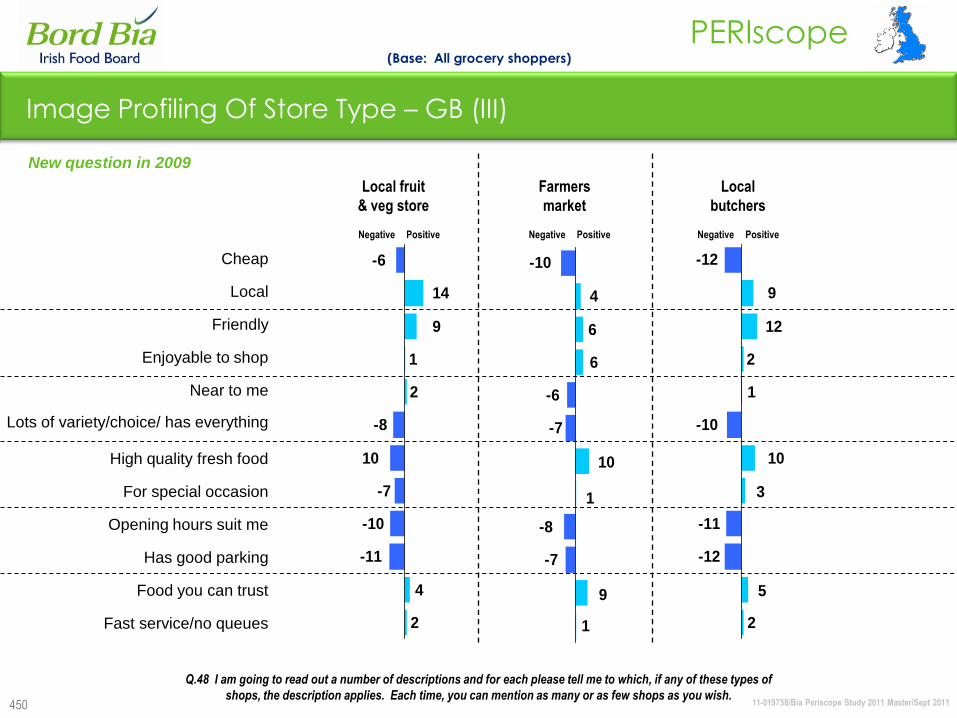
11-019758/Bia Periscope Study 2011 Master/Sept 2011
PERIscope
450
Local fruit
& veg store
Farmers
market
Local
butchers
Cheap
Local
Friendly
Enjoyable to shop
Near to me
Lots of variety/choice/ has everything
High quality fresh food
For special occasion
Opening hours suit me
Has good parking
Food you can trust
Fast service/no queues
9
2
4
-11
-10
-7
10
-8
2
1
14
-6
Image Profiling Of Store Type – GB (III)
Q.48 I am going to read out a number of descriptions and for each please tell me to which, if any of these types of
shops, the description applies. Each time, you can mention as many or as few shops as you wish.
10
1
-8
-7
9
1
-7
-6
6
6
4
-10
New question in 2009
Negative Positive Negative Positive
(Base: All grocery shoppers)
12
2
5
-12
-11
3
10
-10
1
2
9
-12
Negative Positive
197077/Bord Bia Periscope Study 2009 - Trends in Consumer Food Intelligence
Growing the success of Irish food & horticulture
6