Embed Size (px)
Citation preview

Page 1

Group Presentation
Page 2

Companies
STIAL
SOCOGES
Centrale Laitière du Cap-Bon (CLC)
Centrale Laitière du Nord (CLN)
Centrale Laitière de Sidi-Bouzid (CLSB)
Compagnie Fromagère (CF)
Société des Boissons du Cap-Bon (SBC)
DELTA PLASTIC (DP)
Shareholders
MEDDEB's FamilyGervais DANONE
MEDDEB's FamilyGervais DANONE
MEDDEB's Family
MEDDEB's Family
MEDDEB's Family
MEDDEB's Family
BONGRAIN
MEDDEB's Family
MEDDEB's Family
DELICE Holding subsidiaries
Page 3

Manufacturing premises
2 plants in Boussalem :- CLN
- La Compagnie Fromagère
1 plant inSidi-Bouzid (2014):
- CLSB
5 plants in Soliman :- STIAL- CLC- SBC- DELTAPlastic- CF (Borj Cedria)
Korbous
Soliman
Cap Bon
Sidi Daoud
Kélibia
Korba
Nabeul
Page 4

Main milestones
Creation of STIAL byM. Mohamed
MEDDEB : total
investment of 200K€
- Creation of SOCOGES
- Partnership talks with :
- YOPLAIT
- DANONE
1978 2005-2006
-Strategic partnership withDANONE (50% of STIAL
and SOCOGES acquired by
CGD)-Creation of “CLC” with an
investment of 22 MDT
-Acquisition of "CLN"
-End of partnership with
VIRGIN COLA
Creation of CLSB with total
investment of 24 M€
(expected to reach 35.5 M€
in 2018)
- Creation of SBC
- Creation of Delta Plastic
- Partnership with VIRGIN COLA (franchising contract)
Creation of CF through a
strategic partnership with
BONGRAIN
- Creation of DELICE Holding
- IPO (15% of DH listed)
- Activity launch of CLSB
1997 2011
1993 20082002 2013-2014
Page 5

DELICE Holding structure
Beverage
activity
Milk
activityCheese
activityDistribution
activity
Dairy activity
SBC STIAL CF SOCOGES
DELTA
PLASTICCLSB CLN
DELICE Holding
CLC
Page 6

Business Activities
Page 7

Milk activityRaw milk in Tunisia
Page 8
286 collecting centers
424 000 cows
Annual yield per cow : 4 500 L 120 000 dairy farmers
7 milk production plants
4 yogurt production plants
31 cheese production small plants

The milk production represents 25% of the animal production, 11% of the
agricultural products and 7% of the food production
The national production of raw milk is around 1 200 Millions liters with an
annual average growth rate of 4%
90% of the milk collected by the industry is brought by small dairy farmers
286 Collecting centers with a total collection ability around 2,6 millions liters
42 milk units contribute to the transformation process with a daily
production of 3,4 Millions liters
Milk activityRaw milk in Tunisia
Page 9

National Production
National Collection
1054
638
1090
664
1136
709
1150
745
1200
783
1248
823
2013 2014
Raw milk in Tunisia
National production and collection of milk (million liters)
Page 10
2015*
*Estimates
2010 2011 2012
Source : GIVLAIT
Milk activity

Milk
drinks
(546 ML)
Powdered
milk
(20 ML)
Yogurt
and dairy
(155 ML)
18% 15% 4% 26%
Informal market
and self
consumption
(310 ML)
Cheese
(135 ML)Others
(34 ML)
National production (1200 ML)
74%
Improvement
potential
Total raw milk going to the industry (890 ML)
61% 2%
Milk activityRaw milk in Tunisia
Page 11
2014 Data

Milk activity
Per Capita Consumption PCC
+0,3% +20,1% +3,8% +2,4%
2013 20142011
0,0 0
10
20
30
40
50
100,0
200,0
300,0
400,0
500,0
2012 2015
398 399 479 497 509
* Total UHT milk (1/2 skimmed,
vitamin enriched milk, skimmed
milk and whole milk)
51
55 5759 60
60
70
600,0
700,0
CAGR
+9,7% +3,1%
Annual growth (%)
Volume (liters)
Volume / capita (liters)*
BENCHMARK PCC
Source :Nielsen/ tetrapak
Page 12
Estimated
Market 2011 2012 2013 2014
Algeria 53,49 54,08 56,76 58,84
Libya 16,67 21,95 23,42 25,06
Morocco 28,83 29,62 30 30,47
Ireland 129,27 127,33 125,79 124,22
Finland 125,78 125,15 132,92 122,08
CAGR

Milk activity
SKU’s = 17
Page 13
Company
Centrale Laitière du Cap-Bon
CLC
Employees
696
Centrale Laitière du Nord
CLN436
Centrale Laitièrede Sidi Bouzid
CLSB300
Total
employees
1432

Beverage activity
Per Capita Consumption PCC
13 % 9%8%
30%
2010 2011
BENCHMARK PCC
20122009
8,3
8,7 9,1
10,611,3
12,2
13,2
2013
34 37 40 52 63
21%13%
14%
2014 2015*
Annual growth (%)
Volume (liters)
71 81
CAGR
+17%
Volume / capita (liters)*
Source: Nielsen JJ14 & INS 1
Compass Tétrapak 14
Estimated
Page 14
2009 2010 2011 2012 2013 2014
Libya 55,38 61,49 29,92 51,68 71 54,29
Algeria 17,14 19,18 21,62 26,33 26,13 28,09
Egypt 4,85 6,95 8,58 8,86 9,13 9,59
Morocco 3,69 4,24 4,72 5,11 6,02 6,49

Beverage activity
160
160
Société des Boissons du Cap-
Bon
SBC
Total employees
Company
Page 15
Employees SKU’s = 38

Dairy activity
Per Capita Consumption PCC
2008 2009 2010 20112004 2005 2006
88,4
9,310,4 10,7
11,2
17,416,4
15,9
14,6
12,8
11,7
2007 2012 2013 2014 2015 2016 2017
Estimates
2018
18,619,9
21,3
CAGR+7%
CAGR+7%
CAGR+6%
CAGR+7%
Evolution PCC Kg*
BENCHMARK
Source : Nielsen JJ14 & INS 1
Compass Tétrapak 14
France = 36 kg
Saudi Arabia = 28 kg
Spain = 27 kg
Turkey = 26 kg
Algeria = 11 kg
Page 16
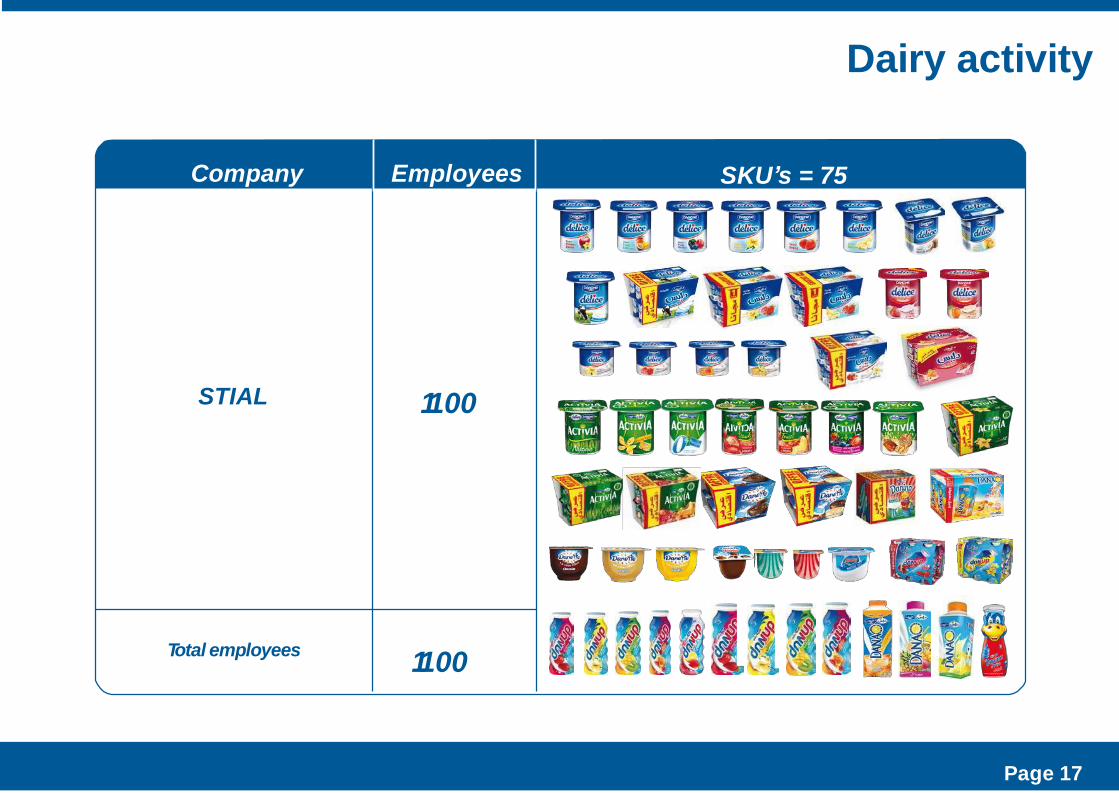
Dairy activity
1100
1100
STIAL
Total employees
Company Employees SKU’s = 75
Page 17

Cheese activity
Per Capita Consumption PCC
CAGR
23%
-4%
22%
2013 20142011
0,816
1,198 1,213
2012
871510721 13040
+15%
(kilos)
BENCHMARK PCC
Market
France
Italy
Egypt
South Africa
28
22
10
2
2014
13340
Volume (tons)
Volume / capita2%
2015
Estimates
Annual growth(%)
1,244
Page 18
3%
13681

Cheese activity
Company
170
170
La Compagnie Fromagère
CF
Total employees
Employees SKU’s = 36
Page 19

Packaging activity
Outsourcing Danup bottles production for STIAL
Company
60
60
Delta Plastic
DP
Total employees
Employees
Page 20

Distribution activitySales process
SOCOGES
SBC
Distribution workforce:
- 220 freelance drivers with SOCOGES' tracks
- 20 SOCOGES’ sales platform with own tracks-Retailers spread on whole Tunisian territory
CLN CLC
CLSB
SOCOGES’
sales
platform
Retailers
Hypermarkets
STIAL
CF
Page 21
Company
SOCOGES
Employees
-
Total employees -

DELICE Holding Key Figures
Page 22

Economic Environment
Page 23
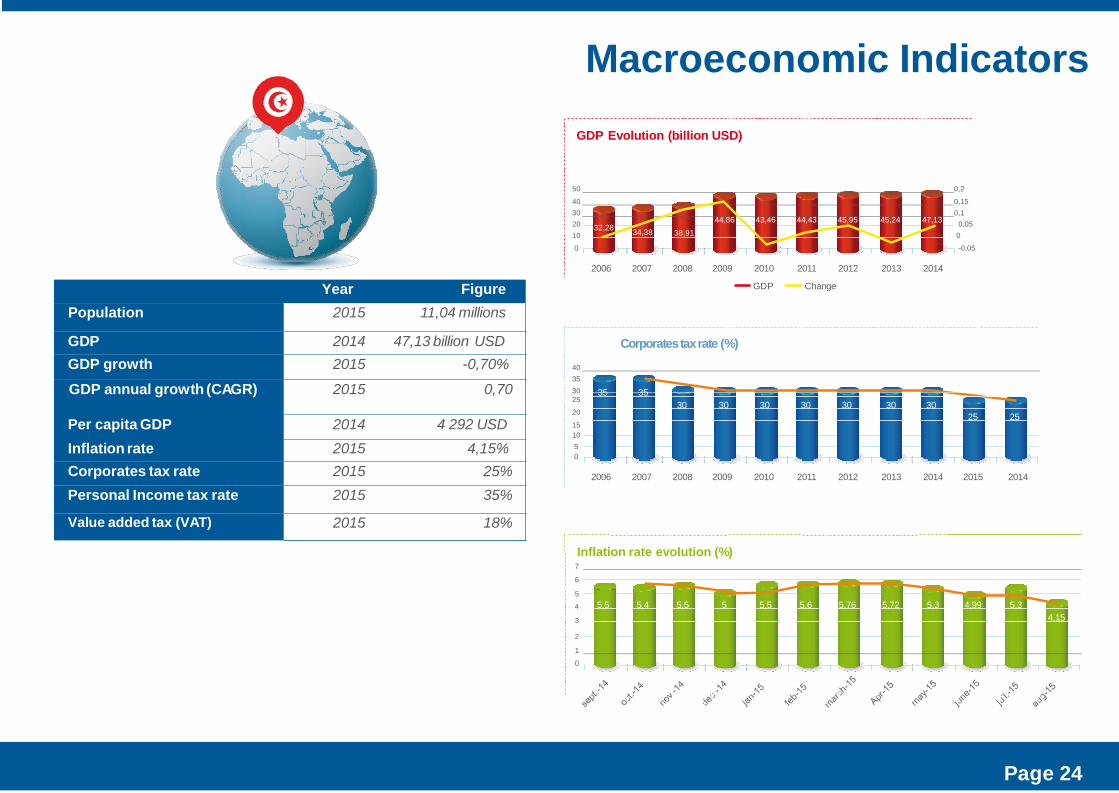
Macroeconomic Indicators
Corporatestaxrate (%)
2006
30
25
20
15
10
5
0
25 25
40
35
30 30 30 30 30 30 30
35 35
2007 2008 2009 2010 2011 2012 2013 2014 2015 2014
Inflation rate evolution (%)7
6
5
4
3
2
1
0
5,5 5,4 5,5 5 5,5 5,6 5,76 5,72 5,3 4,99 5,3
4,15
GDP Evolution (billion USD)
2006 2007 2011
Change
2012
20
10
0
2014
34,38 38,910,05
0
-0,05
50 0,2
40 0,15
30 0,1
2008 2009 2010
GDP
2013
32,2844,86 43,46 44,43 45,95 45,24 47,13
Page 24
Year Figure
Population 2015 11,04 millions
GDP 2014 47,13 billion USD
GDP growth 2015 -0,70%
GDP annual growth (CAGR) 2015 0,70
Per capita GDP 2014 4 292 USD
Inflation rate 2015 4,15%
Corporates tax rate 2015 25%
Personal Income tax rate 2015 35%
Value added tax (VAT) 2015 18%

Beverage Activity
Page 25

Beverage activity
27 160
22,5% 14,8% 8,6% 29,7%
33 269
38 17941 481
2 602
3,2% 118,0% -27,7% 28,9%
2 684
5 850
4 228
5 450
Net income
CAGR = 20%
RevenuesCAGR = 19%
Operating income
CAGR = 30%
Margin’s Evolution
Operating margin = Operating Income / Total revenues Net margin = Net income/ Total revenues
2011 2012
Operating margin
2013 2014
Net margin
2015*
* Estimation
10,3 %11,1 %
8,1 %
9,6 %
14,6 % 15 %
10,2 % 10,1 %
18,5 %
15,3 %
2013 20142011* Estimation
2012
2013 20142011
* Estimation
2012
53 795
2015* 2015*
2015*
2 804
31,2% 91,6% -13,8% 33,0%
3 680
7 051 6 075
2013 20142011
* Estimation
2012
Capital value = 2600 Kdt
8 077
Page 26

Dairy Activity
Page 27

Dairy activity
195 157
18,5% 14,6% 8,3% 8,5%
231 302
265 023287 068
25 500
19,7% 16,9% 17,2% 13,9%
30 518
35 687
41 837
47 654
Net Income
CAGR = 17%
RevenuesCAGR = 12%
Operating Income
CAGR = 13%
Margin’s evolution
2011 2013 2014 2015*
* Estimation
19,0 %19,2 %
13,2 %
13,1 %
19,3 %19,6 %
14,6 % 15,3%
19,0 %
13,5 %
2012
Operating
margin
Net margin
2013 20142011
* Estimation
2012
2013 20142011 2012
37 152
19,7% 13,0% 10,4% 9,9%
44 487
50 285
55 528
2013 20142011
* Estimation
20122015*
311 436
2015*
61 042
2015*
* Estimation
Page 28

Packaging Activity
Page 29

Packaging activity
2 245
42,7% 23,3% 2,2% 14,0%
3 203
3 9504 035
598
42,8% -40,5% -11,4% 22,2%
854
508450
Net IncomeCAGR = -2%
RevenuesCAGR = 20%
Margin’s evolution
2011 2013
Operating IncomeCAGR = 1%
1 147
2014
* Estimation
30,0 %
35,8 %
26,6 %26,7 %
14,7 %15,1 %
11,2 % 12 %
21,1 %
12,9 %
2012
Operating
margin
Net margin
2013 20142011
* Estimation
2012
2013 20142011
* Estimation
2012
674
70,2% -27,2% -28,7% 16,5%
835
595
2013 20142011
* Estimation
20122015*
2015*
4 598
2015*
693
2015*
550
Page 30

Cheese Activity
Page 31

Cheese activity
5 554153,7% -15,2% 50,6% 21,0%
14 088
11 950
17 999
Net Income
RevenuesCAGR = 41%
Operating Income
Margin’s evolution
2011 2012 2013 2014 2015*
-31,9%
1,9 %
-0,3 %
-37,6 %
-4,4 %
4,8 %
0,2 %
-10,3 %
-5,1 %
-8,3 %
OperatingMargin
Net margin
2013 20142011
* Estimation
2012 -1 773
* Estimation
115,4% -324,2% -30,7% 230,4%
273
-612
-800
2013 20142011
2012
-2 086
97,9% -2156,8% -86,0% 101,8%
-44
-993
-1 847
33
2013 20142011 2012
2015*
21 774
2015*
1 043
2015*
* Estimation
Page 32
* Estimation

Distribution Activity
Page 33

Distribution activity
507 088
14,0% 9,2% 14,0% 12,4%
578 196
631 112
719 576
Net Income
RevenuesCAGR = 12%
Operating Income
Margin’s evolution
2011 2012 2013 2014 2015*
-0,4%
-0,3 %
-0,3 %
-0,5 %
-0,6 %-0,8 %
-0,8 %-0,9 %
-0,4 %
-0,4 %
Operatingmargin
Net margin
2013 20142011
* Estimation
2012
-2 633
25,3% -31,4% -136,0% -25,8%
-1 967
-2 585
-6 100
2013 20142011 2012
-2 251
32,6% -60,7% -77,6% -43,4%
-1 517
-2 438
-4 331
-6 209
2013 2014 2015*2011 2012
2015*
809 041
-7674
2015*
* Estimation
Page 34
* Estimation
* Estimation
Milk Activity
Page 35

Milk activity
286 046
6,3% 12,1% 18,0% 19,5%
304 090
340 960
402 474
5 474
50,8% 210,4% -68,4% 24,9%
8 255 8 100
Net Income
CAGR = 17%
RevenuesCAGR = 14%
Operating Income
CAGR = 11%
Margin’s evolution
2011 2012
Operating
2014
* Estimation
3,7 % 3,7 %
2,7 %1,9 %
3,3 % 3,4 %
2,0 % 2,1 %
7,5 %
2,8 %
margin
2013
Net margin
2013 20142011
* Estimation
2012
2013 20142011 2012
10 723
4,3% -13,1% 35,6% 24,3%
11 179
9 709
13 162
2013 20142011
* Estimation
2012
25 626
2015*
481 053
2015*
16 356
2015*
10 119
* Estimation
Page 36
2013 capital value = 17 644 Kdt
2015

Consolidated Performance
Page 37

Human Resources
Page 38

Human resources
Headcount evolution
20142012
Headcount evolution and high skilled staff
2013 20142012
Men Headcount
Women Headcount
High skilled staff ratio
HR Policy
Human capital management and development
Fairness and transparency
Harmonious and fair remuneration policy
Training plans to develop competencies
Performance management
Page 39
2013
Total headcount
+70 +466

CAPEX
Page 40

CAPEX
CAPEX in KDT
Page 41
Activity 2015 * 2014 2013
* Estimated
Beverage activity 2 300 12 384 2 890
Dairy activity 14 463 9 357 8 294
Packaging activity 10 176 698
Cheese activity 300 1 045 10 603
Distribution activity 4 396 4 524 5 541
Milk activity 14 200 33 280 40 909
TOTAL CAPEX 35 669 * 60 766 68 935

Financial Statements
Page 42

Income allocation
Income allocation (TND)
Retained earnings -1 600 944
Income 2014 39 017 383
Page 43
Available income
Legal reserves
37 416 439
-1 870 822
Distributable profits 35 545 617
Dividends -35 140 647
Retained earnings 404 970
640 millimes/share

Consolidated Statements
Page 44

Consolidated income statements
Page 45

Consolidated income statement
20 000
0
40 000
92 69060 000
80 000
100 000
120 000
140 000
25 002 25 826
74 009
8 417 3 118
16,3%17,3%
19,0%13,8%
19,7%
38,9%
1 548 586
-93,4%
-6,7%3,3%
2070
NET INCOME VARIATION 2014 VS 2013
%In
co
me
an
nu
alin
cre
ase
2014
vs.
2013
6 386
Page 46

Financial Indicators
Page 47

Financial indicators
In 2014 , the debt to equity and debt to revenues ratios has been relatively steady and reached
respectively 18.5% and 17%.
Net financial debt has increased by 33% to support investment efforts
Page 48
2014 2013 %
Net financial debt 112 84 +33%
Debt /equity 18,5% 14,4%
Debt/revenues 17% 14,7%

2015 Q3 KPI’s
Page 49

2015 Q3 KPI’sKPI’s as of
30.09.2015 vs
30.09.2014
Consolidated
revenues
Production in
value
Debt structure
543 906 Kdt
+10%
575 815 Kdt 140 220 Kdt
Consolidated revenues YTD (kDT)
600 000
500 000
400 000 +10%
300 000
200 000
100 000
30.09.2014 30.09.2015
400 000
300 000
200 000
100 000
600 000
500 000
30.09.2014 30.09.2015
Production in value YTD (kDT)
+18%
45 000
40 000
35 000
30 000
25 000
20 000
15 000
10 000
30.09.2014 30.09.2015
Inventories (kDT)
120 000
110 000
100 000
140 000
130 000
150 000
30.09.2014 30.09.2015
Debt structure (kDT)
The revenues’ increase has
been driven by a relatively more
important growth pace for the
beverage and cheese activities.
Milk and dairy segments’
revenues had respectively
grown by 7.5% and 6.5%.+89%-5%
Page 50
+18% -5%

DELICE Holding Share
Page 51

DELICE Holding shareEvolution of the DELICE Holding share
6000
DH / Tunindex
Overall yield : 7,7%
Highest : 16,91 TD
Lowest : 14,02 TD
Tunindex
Page 52
DH
5800
5600
5400
52005000
18
16
14
12
4800 10
4600 8
4400
4200 6
4000 4

DELICE Holding share
Page 53
Stock market indicators
Libellé 2014* 2015**
Highest(DT) 15,589 16,905
Lowest(DT) 14,023 14,000
Closing price(DT) 14,551 15,68
Yield
DH 3,77% 0,89%
Tunindex 10,76% 2,43%
Market cap(MDT) 798,9 806,4
Number of traded shares 1 154 465 3 502 946
Traded Volumes (MDT) 17,7 56,4
Foreign shares 4,13% 9,05%
* since 08/10/2014
** as of 06/10/2015

Thank you