Embed Size (px)
Citation preview
ORIGINAL PAPER
Groundwater exploration using remote sensing and geographicinformation systems in a semi-arid area (Southwest of Urmieh,Northwest of Iran)
Kamal Khodaei & Hamid Reza Nassery
Received: 20 April 2011 /Accepted: 22 September 2011 /Published online: 18 October 2011# Saudi Society for Geosciences 2011
Abstract Shortage of water required for drinking andagricultural uses is a subject with a vital importance inmost arid and semi-arid regions. The area of this study isone of the semi-arid regions located in southwest of Urmiehlake, northwest of Iran, between N 37°00′, 37°15′ latitudeand E 45°05′, 45°30′ longitude which is composed ofPermian dolomitic limestone, limestone, and post-Jurassicgranite with a very low primary porosity/permeabilitycharacter. In order to delineate groundwater potential zonesin this area, the study focused on identifying secondaryporosity/permeability indicators such as lineaments, vege-tation cover, lithology, drainage pattern, drainage density,etc. In this regard, a remote sensing and geographicinformation system-based methodology was selected. Land-sat ETM, IRS (pan), SPOT data, digital elevation model,and digital image processing techniques such as filtering,false color composite, principal component analysis, bandrationing and classification have been applied to reach thepurposes. Information layers extracted for analysis andinterpretation stage were then integrated with other data andmodeled through the use of existing geographic informationsystem (GIS) software and their related analytical functions.Finally, based on determined ground water favorabilityindex for different sub zones, layers, weighting, andoverlapping, a ground water potential index (GWPI) wasdefined which respectively was utilized to groundwater
potential zoning and preparation of GWPI map of theregion. Within the six different sub zones defined, two subzones labeled with high and very good potential areas werehighly recommended for further development and explora-tion purposes. Geophysical investigations in target areasconfirm the labeled subzones. Based on the obtained resultsof the study, it can be concluded that remote sensing dataare very useful tool to extract information of groundwaterexploration. Also, application of geographic informationsystems to find target areas for groundwater exploration areeffective to save time and cost.
Keywords Groundwater . Remote sensing . GIS . Urmieh .
Image processing
Introduction
In arid and semi-arid regions, rainfall distribution is notuniform in all seasons. In such areas, groundwater plays animportant role and provides the water demands for variouspurposes such as domestic, agricultural, and industrialusage. Water specialists and managers pay attention to hardrock and karstic aquifers due to increasing population,developing cities, the earth heating, water pollution at largescale and intense falling of water table in unconsolidatedsedimentary aquifers. Therefore, study of karstic and hardrock water resources is very important. Because of lowprimary hydraulic conductivity and porosity in hard rockand karstic terrains, occurrence of groundwater is limited toincreased secondary porosity zones. Secondary porosityincreases along bedding plains, fractures and their inter-sections, and lineaments. Some surface features such aslineaments, drainage pattern and density, rock type,fractured and weathered zones, green vegetation of dry
K. Khodaei (*)Research Institute of Applied Science, ACECR,Shahid Beheshti University,Tehran, Irane-mail: [email protected]
H. R. NasseryEarth Science Faculty, Shahid Beheshti University,Tehran, Iran
Arab J Geosci (2013) 6:1229–1240DOI 10.1007/s12517-011-0414-4
season, etc., known as “groundwater indicators”, are usedto find increased secondary porosity zones.
Defining and extraction of groundwater indicators usinggeophysical and geological approaches, specially, in anextended area are very costly and time consuming. Remotelysensed data which has digital multispectral, multi temporal andextensive synoptic coverage ability are very useful tools ofdefining groundwater indicators. In addition, GIS techniquescan be used to process and analyze data to define target areas ofgroundwater resources. Many applications of remote sensingand GIS techniques have been reported for groundwaterexploration (Krishnamurthy et al. 1996; Gustafsson 1993;Kodituwakka 1996; Saraf and Choudhury 1998; Murthy2000; Shahid et al. 2000; Krishnamurthy et al. 2000; Sultanet al. 2007; Dhakate et al. 2008; Ringrose et al. 1998;Ganapuran et al. 2009; Madrucci et al. 2008; Dar et al. 2010).
The study area is located in a semi-arid area in thenorthwest of Iran. The main part of the study area iscomposed of limestone-dolomitic limestone and granite.The aim of this study was to demonstrate the potential ofremote sensing and GIS techniques for groundwaterexploration in hard rock and soft rock (limestone) terrainsthrough the modeling of groundwater indicators to find
target areas for detailed investigations. To overcome thisaim, some satellite remote sensing data were used to extractgroundwater indicators. An index/overlay method has beenapplied to integrate these data to define target areas in GISenvironment. Then defined target areas were assistedthrough geophysical investigations.
Study area
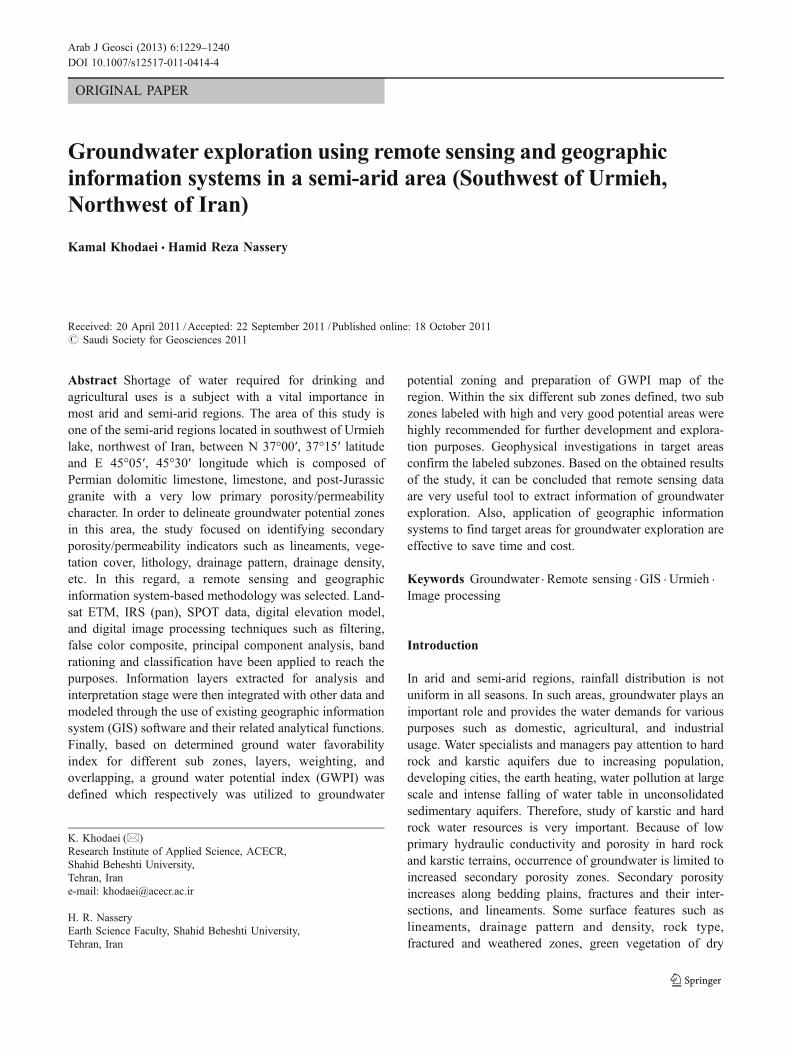
The area of study is located in northwest of Iran andsouthwest of Urmieh lake, bounded by N 37°00′ to 37°15′latitude and E 45°05′ to 45°30′ longitude (Fig. 1). Theaverage annual precipitation is less than 470 mm and mostof the precipitations occur as snow in winter. Groundwateris the only reliable water resources in the study area.
Geological background
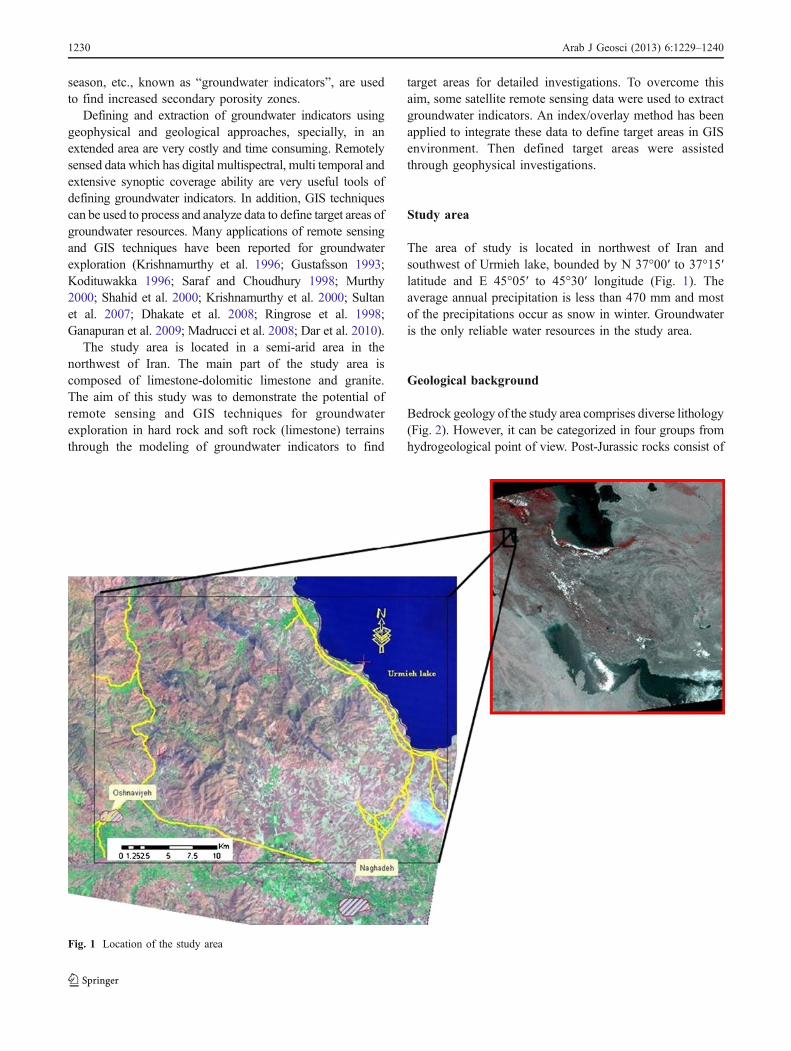
Bedrock geology of the study area comprises diverse lithology(Fig. 2). However, it can be categorized in four groups fromhydrogeological point of view. Post-Jurassic rocks consist of
Fig. 1 Location of the study area
1230 Arab J Geosci (2013) 6:1229–1240
granite with most common silicate minerals such as quartz,plagioclase, and orthoclase feldspars (granite group), andconstitute the major part of relatively smooth and low reliefhills. Permian carbonate rocks (Route formation) comprisinglimestone and dolomitic limestone constitute the major partof high relief hill range at the center of area. These carbonaterocks surrounded by granite group and altered to marble atthe contact of granites. The other group of the bedrockcomprises Qom Formation which is composed of fine-grained limestone with marl and gypsum interbeds. Thisgroup occupies the east and southeast of the area withmaximum 10 m in thickness (Shahrabi 1994). The last groupis colored mélange in the west of the area consisting ofserpentine, amphibolites, basalt, schist, and shale.
From a hydrogeological point of view, none of the rocks hassufficient primary porosity for significant groundwater storage.However, there are series of fracture systems have developedin the study area. Granites mainly impart low porosity exceptin fractured and weathered zones. Increasing porosity ingranites is very slow and sometimes feldspar minerals alteredto clay minerals and cause a decrease in porosity. Fractures andporosity in limestone (Route group) can be developed due tosolution of the carbonate minerals in contact with groundwater.Route formation is the most important unit in the area because
of increased secondary porosity and permeability that facilitateoccurrence and movement of groundwater. High-yield springsin the area originate from the Route formation. Coloredmélange and Qom formation have less importance fromhydrogeological point of view.
Methodology
Input data
The first stage of research for gathering data needed includetopographic and geological maps respectively, with a scaleof 1:50,000 and 1:250,000, spring locations, Landsat TMdata (bands 1 through 8)—August 1990, spot panchromaticband (2005, 05, 29), IRS panchromatic band (2004, 09, 15).All data were geometrically co-registered with topographicmaps and geodetically transformed into the TransverseMercator projection and the WGS84 datum.
Preparation of thematic layers
In the second phase, remote sensing techniques were usedto extract some of the groundwater indicators such as
Fig. 2 The geological units of the study area (the name of units are in Table 4)
Arab J Geosci (2013) 6:1229–1240 1231
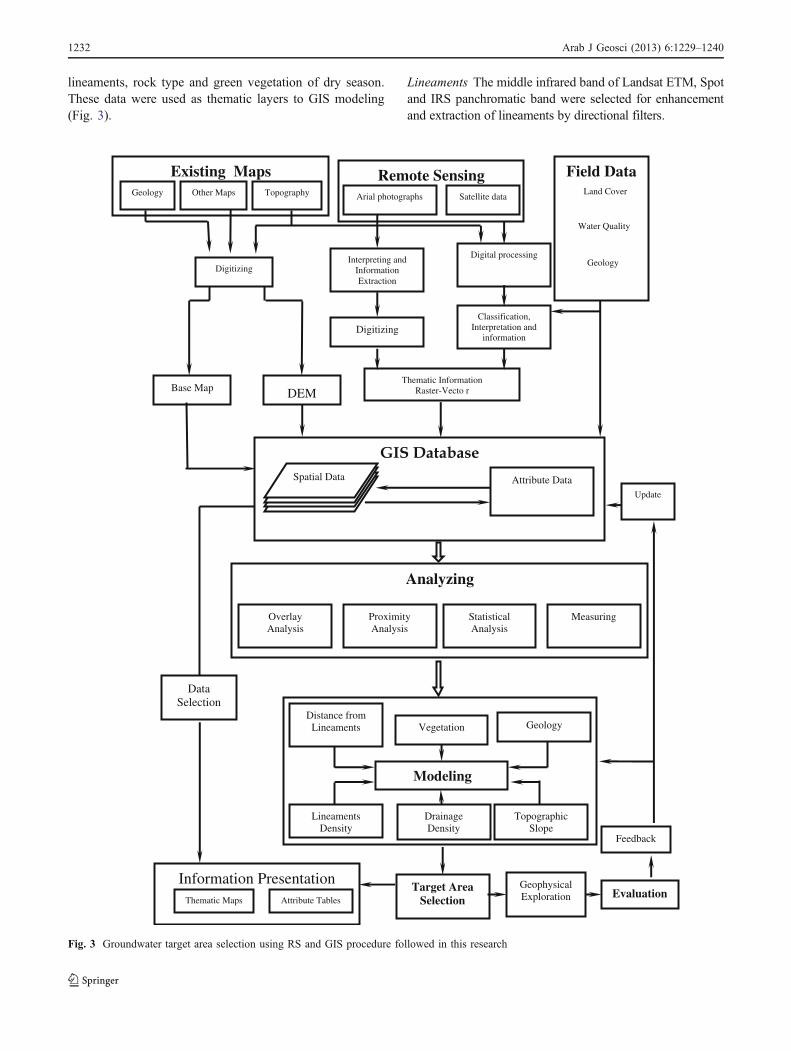
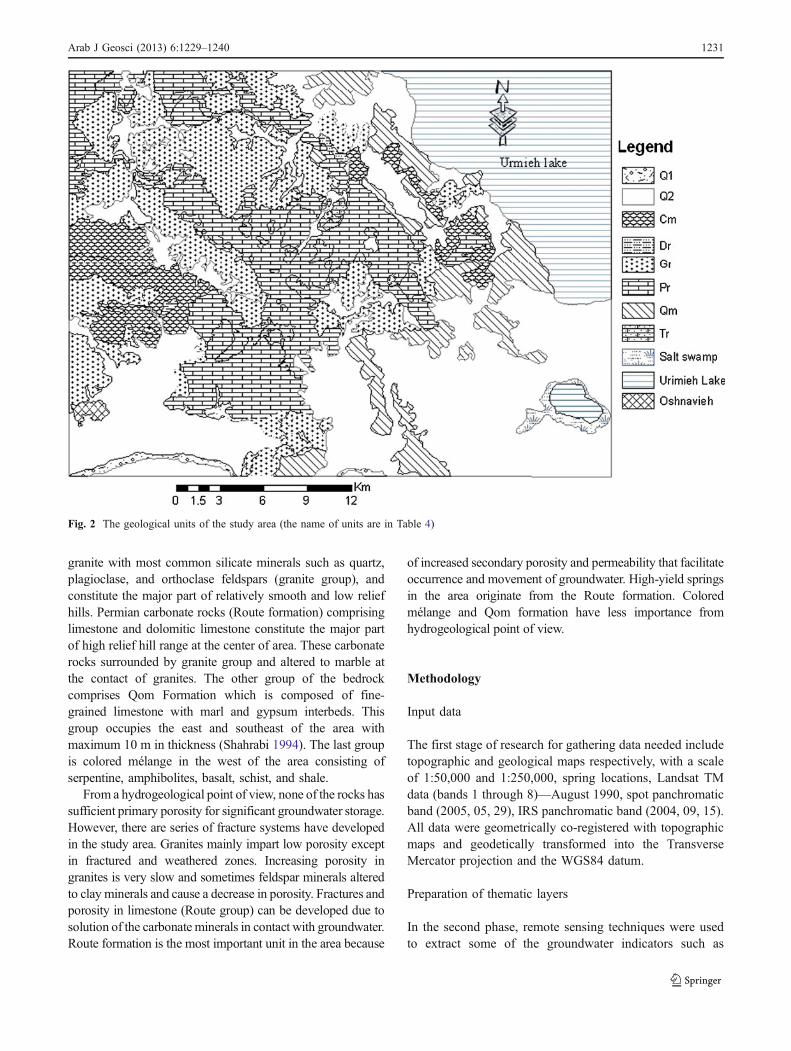
lineaments, rock type and green vegetation of dry season.These data were used as thematic layers to GIS modeling(Fig. 3).
Lineaments The middle infrared band of Landsat ETM, Spotand IRS panchromatic band were selected for enhancementand extraction of lineaments by directional filters.
Analyzing
Overlay Analysis
Proximity Analysis
Statistical Analysis
Measuring
Digitizing
DEM Base Map
Existing Maps Remote Sensing Satellite data Arial photographs
Field Data
Water Quality
Geology
Land Cover
Interpreting and Information Extraction
Digitizing
Digital processing
Classification, Interpretation and
information
Thematic Information Raster-Vecto r
Other Maps Topography Geology
Data Selection
Spatial Data Attribute Data Update
Information Presentation Thematic Maps Attribute Tables
Target Area Selection
Geophysical Exploration Evaluation
Feedback
Distance from Lineaments Vegetation
Modeling
Geology
Lineaments Density
Topographic Slope
Drainage Density
Fig. 3 Groundwater target area selection using RS and GIS procedure followed in this research
1232 Arab J Geosci (2013) 6:1229–1240
Vegetation Landsat 5-TM data were selected to extractvegetation cover due to its multispectral abilities. NDVIindex and supervised classification was used for enhance-ment and mapping of vegetation.
Rock type The lithological map of the study area wasprepared from Landsat TM data using image characterssuch as tone, texture, and drainage pattern and imageprocessing techniques such as false color composite(FCC), principal component analysis (PCA) and bandrationing.
Additional thematic layers such as drainage density andslope have been developed from topographic maps.
The study area has been divided into 32 sub-basinsbased on topographic maps with the scale of 1:50,000. Ineach sub-basin, the length of the drainage channels dividedto area of the polygon. Drainage density provides thequantitative measure of the average length of streamchannels within different sub-basins.
To prepare the slope map, at first step digital elevationmodel (DEM) of the study area was created fromtopographic contour line and elevation points from topo-graphic maps scale 1:50,000 with a grid spacing of 50 m. Inthe second step, DEM of the study area was converted topercentile slope map.
Assigning the GWFI to thematic layers
Different thematic layers are in descriptive form and revealthe parameters favoring the occurrence of groundwater. In
order to achieve definite conclusions through computationand other mathematical operations in GIS analysis, thedescriptive information has been converted into “GroundWater Favorability Index” (Kamaraju et al. 1996). Theconversions were carried out by rating the groundwatercharacteristics of the parameters in terms of representativenumerical values. Ground water favorability index (GWFI)values are ranging from 0.0 to 10.0 where 0.0 stands for theparameters non favorability for the occurrence of ground-water and 10.0 for 100% favorability.
Integration and modeling
An index/overlay GIS-based model has been developed forintegration of thematic maps to define target areas fordetailed groundwater explorations.
In order to take into account the importance of thematiclayers in controlling the occurrence of groundwater in a givenstudy area during the overlay analysis, the GWFI values ofvarious parameters are weighted in importance. The weightingvalues are assigned to the GWFI values in terms ofpercentages assuming that the combined control of fivethematic layers for the occurrence of groundwater in givenarea is 100%. The union command in GIS software was usedto integrate five thematic layers for computing the groundwater potential index (GWPI). The GWPI values are given by
GWPI ¼Xn
i¼1
GWFIi �Wi \ Cj
GWFIi Ground water favorability index of thematic layeri
Wi The weight of thematic layer i according toimportance of layer to groundwater occurrence
Cj Constrains of groundwater explorationn Total number of thematic layers
Table 1 The directional filters used to enhance directional trends
E–W N–S NW–SE NE–SW
−1 −2 −1 −1 2 −1 2 −1 −2 −2 −1 2
2 4 2 −2 4 −2 −1 4 −1 −1 4 −1−1 −2 −1 −1 2 −1 −2 −1 2 2 −1 −2
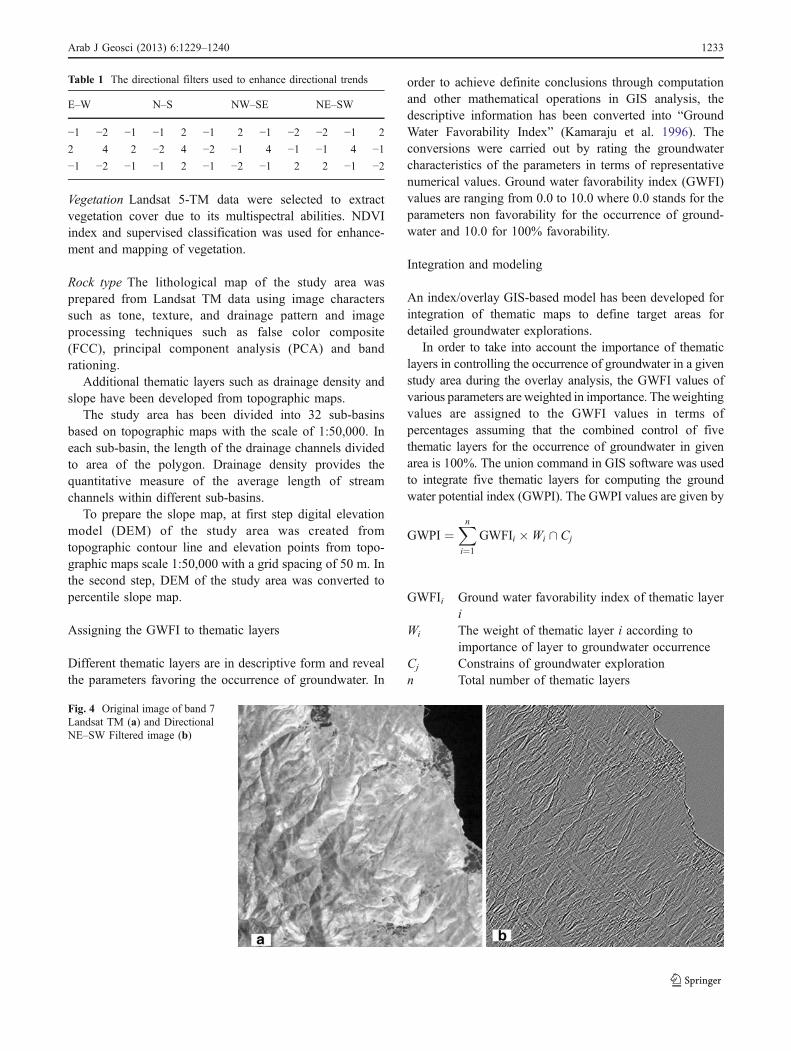
Fig. 4 Original image of band 7Landsat TM (a) and DirectionalNE–SW Filtered image (b)
Arab J Geosci (2013) 6:1229–1240 1233
The integration of thematic layers yields so manygroundwater units that each GWPI value of the groundwa-ter unit indicates the groundwater potential. The ground-water units have been classified into six classes includingexcellent, very good, good, moderate, poor, and nonepotentials according to GWPI value. The areas withexcellent and very good classes were proposed to geophys-ical investigations. Geoelectrical method with Schlum-berger array was selected for geophysical investigations.
Results
Thematic layers
Thematic layers that have been used for GIS modeling fordemarcation of target areas are given in the followingsubsections.
Lineaments Lineaments can be defined as mappable,simple or composite linear features of a surface, whose
parts are aligned in a rectilinear or slightly curvilinearrelationship and which differs distinctly from the patterns ofadjacent features and presumably reflects a subsurfacephenomenon (O’Leary et al. 1976). Often, these representfaults, fractures, sharp anticline fold axes, geological rockformation contacts or vertical beds such as flat irons orhogbacks. Generally, lineaments are underlain by zones oflocalized weathering and increased permeability and poros-ity. The significance of lineaments in groundwater explo-ration has been described by many authors (Lattman andParizek 1964). Lattman and Parizek (1964) showed that thebedrock beneath fracture traces in carbonate rocks ofPennsylvania, USA, yielded significantly more than wellssited away from fracture traces. Fracture zones in hard rockdespite their origin present lines of weakness in whicherosion and weathering can take place. The drainage patterntends to follow the fracture pattern, meaning that a large
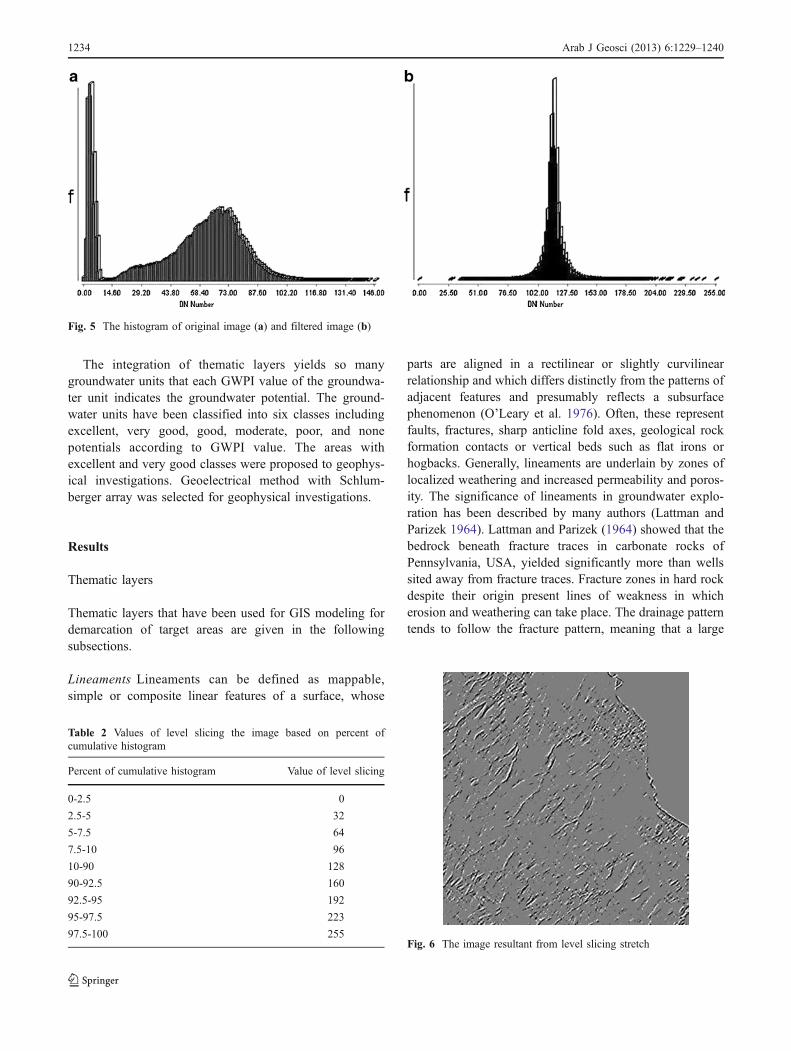
Fig. 5 The histogram of original image (a) and filtered image (b)
Table 2 Values of level slicing the image based on percent ofcumulative histogram
Percent of cumulative histogram Value of level slicing
0-2.5 0
2.5-5 32
5-7.5 64
7.5-10 96
10-90 128
90-92.5 160
92.5-95 192
95-97.5 223
97.5-100 255Fig. 6 The image resultant from level slicing stretch
1234 Arab J Geosci (2013) 6:1229–1240
proportion of the water-bearing fracture systems are suitedat valley bottoms where the recharge potential is higher andwhere weathering is deepest.
Directional filters (Table 1) were applied to selectedimages for enhancement of directional trends. Afterapplying the directional filters, linear features have beenenhanced in desired directions. Figure 4 shows the originaland filtered image with NE–SW kernel. Histogram of theoriginal and filtered image shows (Fig. 5) the relativelygood contrast between linear features, as dark or with color,and background of image. Directional components of theimage are in the tails of the histogram.
To extract the longer and more prominent line segmentsfrom the directional filtered images, level slicing methodapplied as proposed algorithm by Moore and Waltz (1983)according to Table 2. Image slices near the histogram tailscontain virtually all of the directional information in theimage. As slices are taken closer to the histogram center,the orientation of line segments becomes more random, thesegments become shorter, and the alignments of thesesegments become more obscure. In this stage, histogramtails stretched to fill the intervals 0 to 127 and 129 to 255and set the digital values of pixels near the histogram centerequal to 128 (Fig. 6).
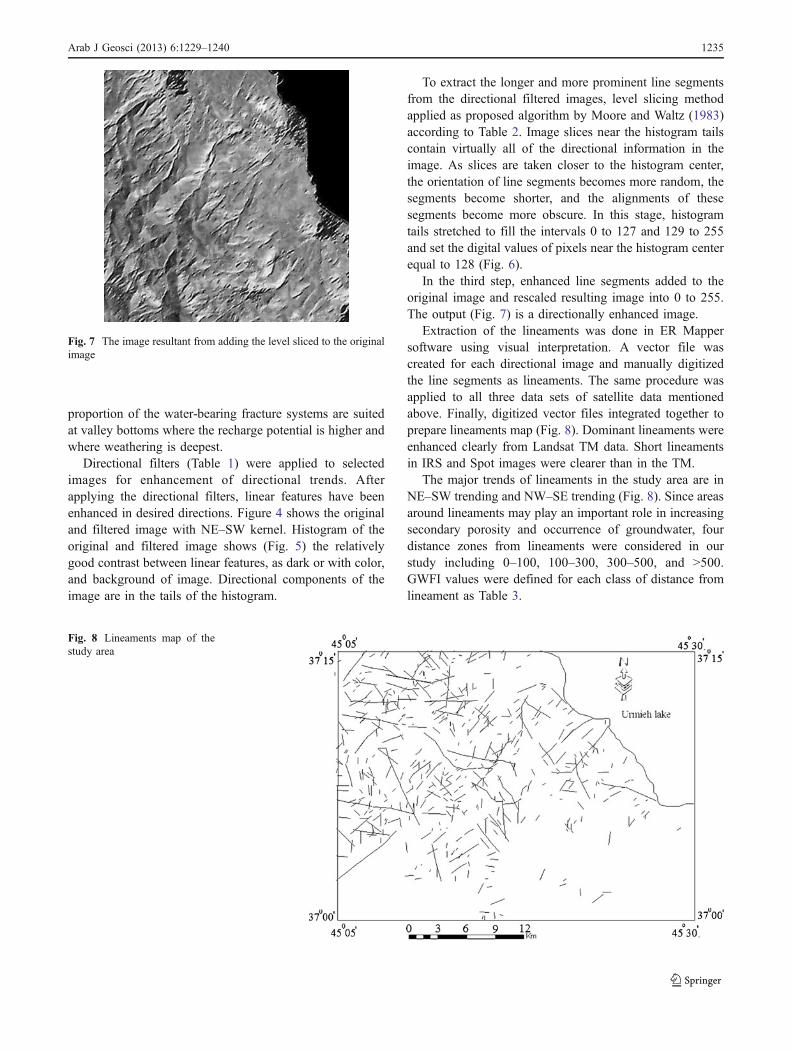
In the third step, enhanced line segments added to theoriginal image and rescaled resulting image into 0 to 255.The output (Fig. 7) is a directionally enhanced image.
Extraction of the lineaments was done in ER Mappersoftware using visual interpretation. A vector file wascreated for each directional image and manually digitizedthe line segments as lineaments. The same procedure wasapplied to all three data sets of satellite data mentionedabove. Finally, digitized vector files integrated together toprepare lineaments map (Fig. 8). Dominant lineaments wereenhanced clearly from Landsat TM data. Short lineamentsin IRS and Spot images were clearer than in the TM.
The major trends of lineaments in the study area are inNE–SW trending and NW–SE trending (Fig. 8). Since areasaround lineaments may play an important role in increasingsecondary porosity and occurrence of groundwater, fourdistance zones from lineaments were considered in ourstudy including 0–100, 100–300, 300–500, and >500.GWFI values were defined for each class of distance fromlineament as Table 3.
Fig. 7 The image resultant from adding the level sliced to the originalimage
Fig. 8 Lineaments map of thestudy area
Arab J Geosci (2013) 6:1229–1240 1235
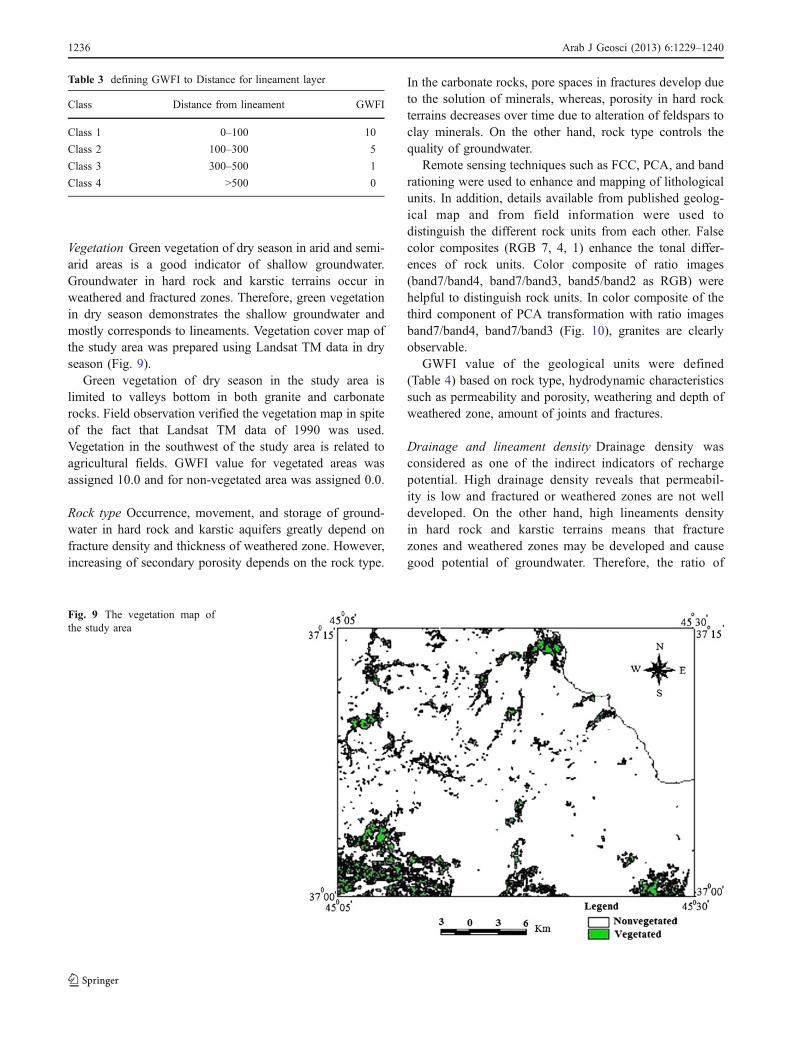
Vegetation Green vegetation of dry season in arid and semi-arid areas is a good indicator of shallow groundwater.Groundwater in hard rock and karstic terrains occur inweathered and fractured zones. Therefore, green vegetationin dry season demonstrates the shallow groundwater andmostly corresponds to lineaments. Vegetation cover map ofthe study area was prepared using Landsat TM data in dryseason (Fig. 9).
Green vegetation of dry season in the study area islimited to valleys bottom in both granite and carbonaterocks. Field observation verified the vegetation map in spiteof the fact that Landsat TM data of 1990 was used.Vegetation in the southwest of the study area is related toagricultural fields. GWFI value for vegetated areas wasassigned 10.0 and for non-vegetated area was assigned 0.0.
Rock type Occurrence, movement, and storage of ground-water in hard rock and karstic aquifers greatly depend onfracture density and thickness of weathered zone. However,increasing of secondary porosity depends on the rock type.
In the carbonate rocks, pore spaces in fractures develop dueto the solution of minerals, whereas, porosity in hard rockterrains decreases over time due to alteration of feldspars toclay minerals. On the other hand, rock type controls thequality of groundwater.
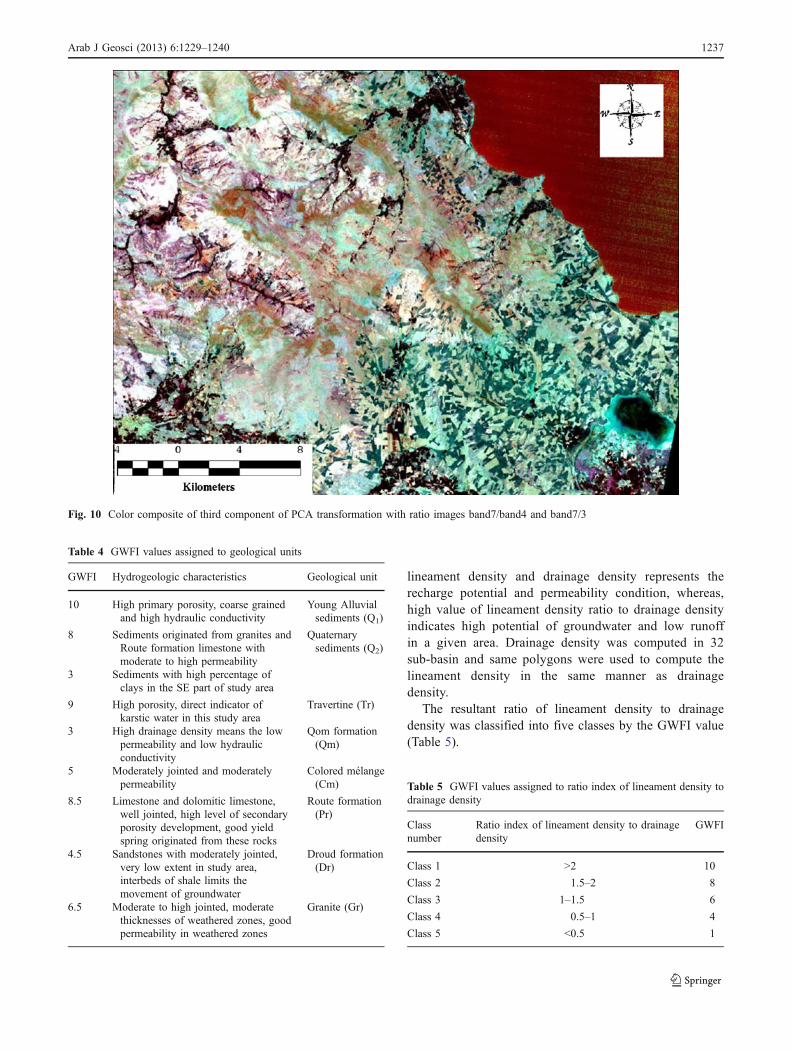
Remote sensing techniques such as FCC, PCA, and bandrationing were used to enhance and mapping of lithologicalunits. In addition, details available from published geolog-ical map and from field information were used todistinguish the different rock units from each other. Falsecolor composites (RGB 7, 4, 1) enhance the tonal differ-ences of rock units. Color composite of ratio images(band7/band4, band7/band3, band5/band2 as RGB) werehelpful to distinguish rock units. In color composite of thethird component of PCA transformation with ratio imagesband7/band4, band7/band3 (Fig. 10), granites are clearlyobservable.
GWFI value of the geological units were defined(Table 4) based on rock type, hydrodynamic characteristicssuch as permeability and porosity, weathering and depth ofweathered zone, amount of joints and fractures.
Drainage and lineament density Drainage density wasconsidered as one of the indirect indicators of rechargepotential. High drainage density reveals that permeabil-ity is low and fractured or weathered zones are not welldeveloped. On the other hand, high lineaments densityin hard rock and karstic terrains means that fracturezones and weathered zones may be developed and causegood potential of groundwater. Therefore, the ratio of
Table 3 defining GWFI to Distance for lineament layer
Class Distance from lineament GWFI
Class 1 0–100 10
Class 2 100–300 5
Class 3 300–500 1
Class 4 >500 0
Fig. 9 The vegetation map ofthe study area
1236 Arab J Geosci (2013) 6:1229–1240
lineament density and drainage density represents therecharge potential and permeability condition, whereas,high value of lineament density ratio to drainage densityindicates high potential of groundwater and low runoffin a given area. Drainage density was computed in 32sub-basin and same polygons were used to compute thelineament density in the same manner as drainagedensity.
The resultant ratio of lineament density to drainagedensity was classified into five classes by the GWFI value(Table 5).
Fig. 10 Color composite of third component of PCA transformation with ratio images band7/band4 and band7/3
Table 4 GWFI values assigned to geological units
GWFI Hydrogeologic characteristics Geological unit
10 High primary porosity, coarse grainedand high hydraulic conductivity
Young Alluvialsediments (Q1)
8 Sediments originated from granites andRoute formation limestone withmoderate to high permeability
Quaternarysediments (Q2)
3 Sediments with high percentage ofclays in the SE part of study area
9 High porosity, direct indicator ofkarstic water in this study area
Travertine (Tr)
3 High drainage density means the lowpermeability and low hydraulicconductivity
Qom formation(Qm)
5 Moderately jointed and moderatelypermeability
Colored mélange(Cm)
8.5 Limestone and dolomitic limestone,well jointed, high level of secondaryporosity development, good yieldspring originated from these rocks
Route formation(Pr)
4.5 Sandstones with moderately jointed,very low extent in study area,interbeds of shale limits themovement of groundwater
Droud formation(Dr)
6.5 Moderate to high jointed, moderatethicknesses of weathered zones, goodpermeability in weathered zones
Granite (Gr)
Table 5 GWFI values assigned to ratio index of lineament density todrainage density
Classnumber
Ratio index of lineament density to drainagedensity
GWFI
Class 1 >2 10
Class 2 1.5–2 8
Class 3 1–1.5 6
Class 4 0.5–1 4
Class 5 <0.5 1
Arab J Geosci (2013) 6:1229–1240 1237
Topographic slope Rainfall has more opportunity of perco-late in ground in gentle sloped lands. On the other hand,karstification in the carbonate rocks in slopes more than20% can be effectively developed. Therefore, increasingland slope limits the groundwater and recharge potential.Slope map classified into six classes by the GWFI values asTable 6.
Integration of thematic layers
In our study, five thematic layers have been used todemarcate groundwater potential zones including distancefrom lineaments, rock type, green vegetation of dry season,ratio of lineaments density to drainage density, and slope.
These thematic layers do not have equal importance indefining groundwater potential zones. In order to considerthe importance of thematic layers in groundwater explora-tion, during the overlay analysis, the thematic layers havebeen weighted as Table 7.
An index/overlay method has been used to integrate thethematic layers. In this method, GWPI value is computed ineach layer as mentioned in the “Methodology” section. Inthe resultant layer, all features of input thematic layers willbe written to the output feature classes and the attribution of
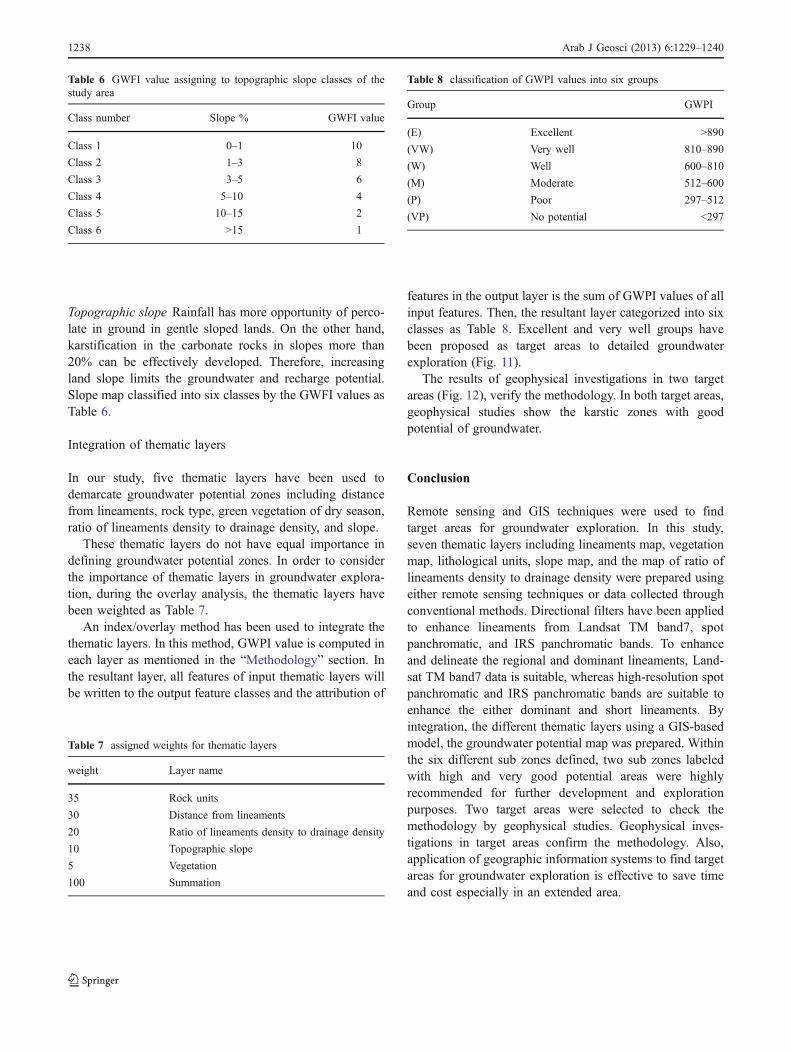
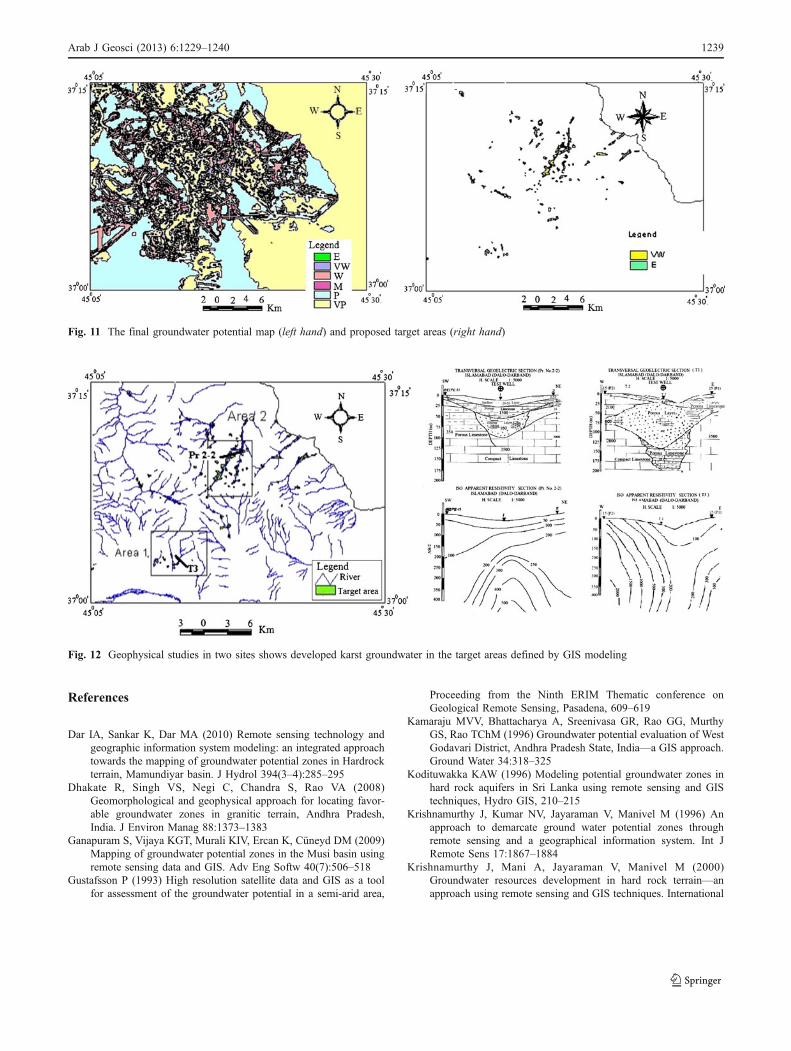
features in the output layer is the sum of GWPI values of allinput features. Then, the resultant layer categorized into sixclasses as Table 8. Excellent and very well groups havebeen proposed as target areas to detailed groundwaterexploration (Fig. 11).
The results of geophysical investigations in two targetareas (Fig. 12), verify the methodology. In both target areas,geophysical studies show the karstic zones with goodpotential of groundwater.
Conclusion
Remote sensing and GIS techniques were used to findtarget areas for groundwater exploration. In this study,seven thematic layers including lineaments map, vegetationmap, lithological units, slope map, and the map of ratio oflineaments density to drainage density were prepared usingeither remote sensing techniques or data collected throughconventional methods. Directional filters have been appliedto enhance lineaments from Landsat TM band7, spotpanchromatic, and IRS panchromatic bands. To enhanceand delineate the regional and dominant lineaments, Land-sat TM band7 data is suitable, whereas high-resolution spotpanchromatic and IRS panchromatic bands are suitable toenhance the either dominant and short lineaments. Byintegration, the different thematic layers using a GIS-basedmodel, the groundwater potential map was prepared. Withinthe six different sub zones defined, two sub zones labeledwith high and very good potential areas were highlyrecommended for further development and explorationpurposes. Two target areas were selected to check themethodology by geophysical studies. Geophysical inves-tigations in target areas confirm the methodology. Also,application of geographic information systems to find targetareas for groundwater exploration is effective to save timeand cost especially in an extended area.
Table 6 GWFI value assigning to topographic slope classes of thestudy area
Class number Slope % GWFI value
Class 1 0–1 10
Class 2 1–3 8
Class 3 3–5 6
Class 4 5–10 4
Class 5 10–15 2
Class 6 >15 1
Table 7 assigned weights for thematic layers
weight Layer name
35 Rock units
30 Distance from lineaments
20 Ratio of lineaments density to drainage density
10 Topographic slope
5 Vegetation
100 Summation
Table 8 classification of GWPI values into six groups
Group GWPI
(E) Excellent >890
(VW) Very well 810–890
(W) Well 600–810
(M) Moderate 512–600
(P) Poor 297–512
(VP) No potential <297
1238 Arab J Geosci (2013) 6:1229–1240
References
Dar IA, Sankar K, Dar MA (2010) Remote sensing technology andgeographic information system modeling: an integrated approachtowards the mapping of groundwater potential zones in Hardrockterrain, Mamundiyar basin. J Hydrol 394(3–4):285–295
Dhakate R, Singh VS, Negi C, Chandra S, Rao VA (2008)Geomorphological and geophysical approach for locating favor-able groundwater zones in granitic terrain, Andhra Pradesh,India. J Environ Manag 88:1373–1383
Ganapuram S, Vijaya KGT, Murali KIV, Ercan K, Cüneyd DM (2009)Mapping of groundwater potential zones in the Musi basin usingremote sensing data and GIS. Adv Eng Softw 40(7):506–518
Gustafsson P (1993) High resolution satellite data and GIS as a toolfor assessment of the groundwater potential in a semi-arid area,
Proceeding from the Ninth ERIM Thematic conference onGeological Remote Sensing, Pasadena, 609–619
Kamaraju MVV, Bhattacharya A, Sreenivasa GR, Rao GG, MurthyGS, Rao TChM (1996) Groundwater potential evaluation of WestGodavari District, Andhra Pradesh State, India—a GIS approach.Ground Water 34:318–325
Kodituwakka KAW (1996) Modeling potential groundwater zones inhard rock aquifers in Sri Lanka using remote sensing and GIStechniques, Hydro GIS, 210–215
Krishnamurthy J, Kumar NV, Jayaraman V, Manivel M (1996) Anapproach to demarcate ground water potential zones throughremote sensing and a geographical information system. Int JRemote Sens 17:1867–1884
Krishnamurthy J, Mani A, Jayaraman V, Manivel M (2000)Groundwater resources development in hard rock terrain—anapproach using remote sensing and GIS techniques. International
Fig. 11 The final groundwater potential map (left hand) and proposed target areas (right hand)
Fig. 12 Geophysical studies in two sites shows developed karst groundwater in the target areas defined by GIS modeling
Arab J Geosci (2013) 6:1229–1240 1239
Journal of Applied Earth Observation and Geoinformation2:204–215
Lattman LH, Parizek RP (1964) Relationship between fracture traces andthe occurrence of ground water in carbonate rocks. J Hydrol 2:73–91
Madrucci V, Taioli F, César de Araújo C (2008) Groundwaterfavorability map using GIS multicriteria data analysis on crystallineterrain, São Paulo State, Brazil. J Hydrol 357(3–4):153–173
Moore G, Waltz FA (1983) Objective procedure for lineamentenhancement and extraction. Photogramm Eng Remote Sens49:641–647
Murthy KSR (2000) Ground water potential in a semi-arid region ofAndhra Pradesh—a geographical information system approach.Int J Remote Sens 21:1867–1884
O’Leary DW, Friedman ID, Phon HA (1976) Lineament, linear,lineation: some proposed new standards for old terms. Geol SocAm Bull 87:1463–1469
Ringrose S, Vanderpost C, Matheson W (1998) Evaluation ofvegetative criteria for near-surface groundwater detection usingmultispectral mapping and GIS techniques in semi-arid Bot-swana. Appl Geogr 18(4):331–354
Saraf AK, Choudhury PR (1998) Integrated remote sensing and GISfor groundwater exploration and identification of artificialrecharge sites. Int J Remote Sens 19:1825–1841
Shahid S, Nath SK, Roy J (2000) Groundwater potential modeling in asoft rock area using a GIS. Int J Remote Sens 21:1919–1924
Shahrabi M (1994) Geological map of the Urmieh scale 1:250000,Geological Survey of Iran
Sultan M, Wagdy A, Manocha N, Sauck W, Abdel Gelil K, YoussefAF, Backer R, Milewski A, El Alfy Z, Jones C (2007) Anintegrated approach for identifying aquifers in transcurrent faultsystems: the Najd shear system of the Arabian Nubian shield. JHydrol 349:475–488
1240 Arab J Geosci (2013) 6:1229–1240