Embed Size (px)
Citation preview
Ground-Water Conditions in the Avenal-McKittrick Area Kings and Kern Counties CaliforniaBy P. R. WOOD and G. H. DAVIS
GEOLOGICAL SURVEY WATER-SUPPLY PAPER 1457
Prepared in cooperation with the U.S. Bureau of Reclamation
^NITED STATES GOVERNMENT PRINTING OFFICE, WASHINGTON : 1959
UNITED STATES DEPARTMENT OF THE INTERIOR
FRED A. SEATON, Secretary
GEOLOGICAL SURVEY
Thomas B. Nolan, Director
The U.S. Geological Survey Library has cataloged this publication as follows :
Wood, Perry Rowley, 1920-
Ground-water conditions in the Avenal-McKittrick area, Kings and Kern Counties, California, by P. E. Wood and G. H. Davis. Washington, U.S. Govt. Print. Off., 1959.
iv, 141 p. maps, diagrs., tables. 24 cm. (U.S. Geological Survey. Water-supply paper 1457)
Part of illustrative matter folded in pocket.Prepared in cooperation with the U.S. Bureau of Reclamation.Bibliography: p. 62-64.
1. Water, Underground California Kern Co. 2. Water, Under ground California Kings Co. I. Davis, George Hamilton, 1921- joint author. II. Title: Avenal-McKittrick area, Kings and Kern Counties, California. (Series)
For sale by the Superintendent of Documents, U.S. Government Printing Office Washington 25, D.C.

CONTENTS
Page
Abstract. _____________________-_____-______________----____------_ 1Introduction._ ____________________________________________________ 3
Location and general features of area.____________--_-_--_-----__ 3Scope and purpose..___________________________________________ 4Cli mate ______________________________________________________ 6Acknowledgments. ______-_-____-___-_-_--___-_---_----_---_-__ 9Well-numbering system._________________-_______-__--._---_--_ 10
Physiography _____________________________________________________ 11Topography and drainage._____________________________________ 11
San Joaquin Valley______________-_______-______---_-.-__-__ 11Dissected uplands._____.____...-_______--______-_-_.__ 11Low plains and fans.__________________________________ 14Overflow lands and lake bottoms. _______________________ 15
Coast Ranges.______-_________________--___--_---_-------_ 16Geologic features____-_-_______________-_---_______________------__ 17
Previous work_________________________-_-_____---__-_-_---_- 17General geology.._____________________________________________ 17Geologic units and their water-bearing properties._________________ 19
Consolidated rocks._.____________________________________ 20Unconsolidated rocks. _____________________________________ 21
Tulare formation._____________________________________ 22Old stream deposits...__-__--____---___-----_--_--_--__ 26Alluvium..-. ___-----_------___-___-___---_ ----------- 26Flood-basin sediments..._______________________________ 28
Ground-water conditions. ___________.____________-__-----___-_____. 29Occurrence, recharge, and movement_-__________-------_---_--. 29
Kettleman Plain_________________________________________ 33McLure Valley.___________________________________________ 35Subarea east of Avenal Gap__-__-_----_-----------_--------- 37Antelope Valley___________________________________________ 41Antelope Plain and area east of Lost Hills.___________________ 43
Pumping.-_----_----_--------_---_----------_-------------.-- 45Geochemistry of natural waters. ____________________________________ 47
Surface waters._______________________________________________ 49Spring waters.._______________________________________________ 52Ground waters__---_-____-_-___-_______-____-_----_-___---_--_ 53
Kettleman City subarea.___________________________________ 54Kettleman Plain_________________________________________ 54McLure Valley..____--____.-_______-________.-_---___--_-- 54Subarea east of Avenal Gap_______________________________ 56Antelope Valley ___________________________________________ 57Antelope Plain and area east of Lost Hills.______---__._-____- 59
Quality of ground water as a limiting factor in the utilization of theground-water basins________________________________________ 60
References..______________________________________________________ 62Index.___________________________________________________________ 139
m
IV CONTENTS
ILLUSTRATIONS[Plates in pocket]
PLATE 1. Map of Avenal-McKittrick area showing geology and geomorphic units.
2. Geologic sections a-a' through 6-6'.3. Map of Avenal-McKittrick area showing wells, springs, irrigated
areas, and water-level contours.4. Composite hydrograph of eight wells in Kettleman and Antelope
Plains.5. Map of Avenal-McKittrick area showing chemical quality of streams,
springs, and typical ground waters.
Page
FIGURE 1. Map of California showing area covered by this report.______ 42. Sketch map showing anticlines in the Avenal-McKittrick area
and vicinity_________________________________________ 123. Sketch map showing hydrologic units ___________________ 324. Hydrograph of well 24/17-25Hl____-__----___ ____________ 385. Hydrograph of well 24/18-30Dl___--_-_-_-_- -_-_-----_--_ 396. Hydrograph of well 24/18-30B1. _..._______._._______.____ 407. Geochemical cycle of surface and ground waters.___________ 488. Geochemical graph of spring and stream waters. __________ 519. Geochemical graph of typical ground waters _______________ 55
10. Geochemical graph of typical ground waters ________________ 58
TABLES
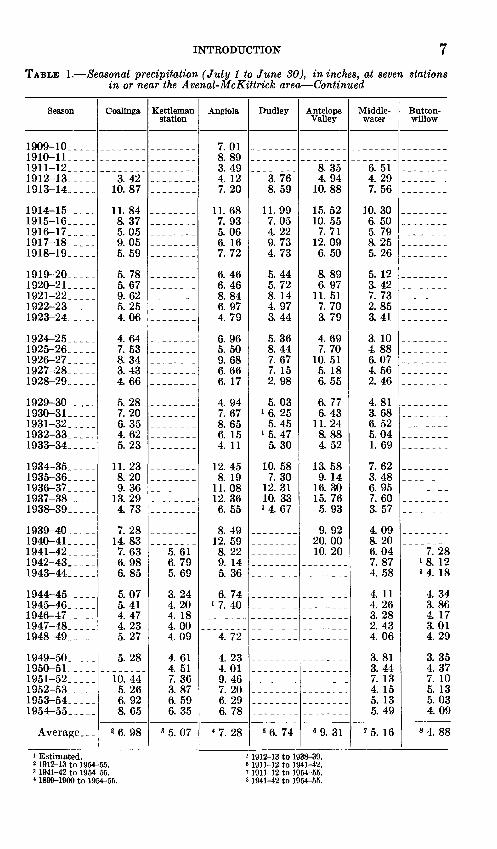
TABLE 1. Seasonal precipitation (July 1 to June 30), in inches, at sevenstations in or near the Avenal-McKittrick area. _________^_ 6
2. Average monthly precipitation (inches) at seven stations in ornear the Avenal-McKittrick area__ ______ _____________ 8
3. Average temperatures (°F) at six stations in or near the Avenal- McKittrick area ___.____________-_____-^________-___-__ 9
4. Thickness and depth to the base of the Tulare formation in theAvenal-McKittrick area_ ________-_-___-__---__----_ 25
5. Approximate acreage of irrigated lands in the Avenal-McKit trick area _-______-_________.___.___-__-__-_-___-.---_- 45
6. Estimated ground-water pumpage (in acre-feet) in the Avenal- McKittrick area, 1947-56.__-_---_---------------------_ 46
7. Description of wells in the Avenal-McKittrick area, Kings andKern Counties, Calif _ __________________________________ 66
8. Chemical analyses of waters from wells in the Avenal-McKittrickarea, Kings and Kern Counties, Calif. ________-__-.--_ 106
9. Chemical analyses of waters from streams and springs in theAvenal-McKittrick area, Kings and Kern Counties, Calif___ 122
10. Drillers' records of wells in the Avenal-McKittrick area, Kingsand Kern Counties, Calif _ ______-_____---_-- _-___-_-_-_ 124
GROUND-WATER CONDITIONS IN THE AVENAL-McKIT- TRICK AREA, KINGS AND KERN COUNTIES, CALIFORNIA
By P. E. WOOD and G. H. DAVIS
ABSTRACT
The Avenal-McKittrick area consists of about 850 square miles on the south west side of the San Joaquin Valley, extends southeastward from the towns of Avenal and Kettleman City to the Elk Hills. Except for about 16,000 acres in several isolated localities, the area is uninhabited desert most of the year, al though extensive grazing is carried on during winter and spring. The area includes Kettleman and Antelope Plains, Antelope and McLure (also known as Sunflower) Valleys, and the area south of Tulare Lake.
The geologic units of the area are classed as consolidated rocks and uncon- solidated deposits. The first group includes consolidated non-water-bearing rocks and semiconsolidated rocks of Jurassic to Pliocene age which in general contain connate water of poor quality; locally at shallow depth fresh water is present in them. Most of the formations contain fold- and fault-induced frac tures, and these openings probably convey small quantities of water to the adjacent unconsolidated deposits. The second group consists of unconsolidated to loosely consolidated water-bearing deposits of continental origin which sup ply nearly all the water pumped from wells. These deposits include the struc turally deformed Tulare formation of late Pliocene and Pleistocene (?) age and the alluvium of Pleistocene and Recent age, which in most places unconform- ably overlies the Tulare. Both units are composed of generally poorly sorted silty materials containing lenticular bodies of sand and gravel derived from the Coast Ranges and deposited by streams on extensive alluvial fans. The allu vium is only moderately permeable, and, although the water-bearing properties of the Tulare are little known, it probably is also only moderately permeable. Lacustrine and fiood-basin sediments of Pleistocene and Recent age, present in the bed of Tulare Lake and along Buena Vista Slough, consist of nearly fiat- lying well-stratified silt, clay, and fine sand which generally are poorly perme able.
The alluvium and the Tulare formation range in thickness from a few feet along the western border of the valley to several thousand feet beneath the valleys and plains. However, because of comparatively late structural deforma tion in the area, the deposits vary considerably in thickness for short dis tances. Over the crests of buried anticlines the deposits thin considerably, and along the flanks and in adjoining synclinal troughs they thicken rapidly.
Recharge to the unconfined and semiconfined bodies of ground water may be by seepage loss from streams, by deep penetration of imported water applied for irrigation in excess of plant requirements, by losses of imported water through irrigation canals and ditches, and by deep penetration of rainfall. However, seepage loss from intermittent streams draining the Coast Ranges
2 GROUND-WATER CONDITIONS, AVENAL-McKITTRICK AREA, CALIF.
probably is the chief source of recharge. Poorly defined drainage channels that extend generally eastward across the area suggest that little water escapes as surface outflow. Inasmuch as arfhual precipitation averages less than 12 inches, deep penetration of rainfall is a significant source of recharge only during infrequent years of exceptionally large precipitation.
Although the general movement of ground water is northeastward from recharge areas along the western border of the valley toward Buena Vista Slough in the trough of the valley, the movement is interrupted or deflected in several places by northwestward-trending anticlinal structures, principally those underlying the Pyramid, Kettleman, and Lost Hills. Movement is restricted in the narrow Dagany and Avenal Gaps and the area between the Kettleman and Lost Hills. Local pumping depressions have developed in McLure and Ante lope Valleys.
Of the 344 wells that were investigated in the field in 1951 and 1955, only 95 were used as irrigation wells in the autumn of 1955. Short-term drawdown and recovery tests made by the Pacific Gas and Electric Co. indicate that the yields ranged from about 100 to 1,700 gpm (gallons per minute). Specific capacities ranged from 2 to 120 gpm per foot of drawndown. The depths of irrigation wells ranged from about 100 to 1,700 feet.
Irrigation pumpage by electrically powered pumps increased steadily from about 13,000 acre-feet in 1947 to about 25,000 acre-feet in 1953. From 1953 to 1956 the annual pumpage remained nearly constant, about 25,000 acre-feet. The total for the 10-year period was about 200,000 acre-feet.
In areas of large withdrawals water levels have undergone steady and marked declines. For the period 1936-53 the levels at Devils Den ranch de clined a maximum of about 100 feet; for the period 1951-56 levels in Antelope Valley declined a maximum of 40 feet; and for the period 1947-54 levels in McLure Valley declined 60 to 120 feet In the areas of little ground-water development east of Avenal Gap and throughout most of Kettleman and Ante lope Plains, water levels remained essentially unchanged to 1955, the date of this report.
The stream waters tributary to the Avenal-McKittrick area differ greatly in both chemical character and mineral content. They were divided into two general types on the basis of their chemical character. The waters of Avenal and Polonio Creeks are characterized by a comparatively lower min eral content and proportionally less sulfate but more magnesium than the waters of Bitterwater, Media Agua, and Carneros Creeks. These differences in mineral content are related to the lithology of the rocks in the respective drainage areas. The waters in which the concentration of sulfate is relatively low were derived from areas underlain predominantly by marine sediments of Cretaceous age and sedimentary, igneous, and metamorphic rocks of the Franciscan forma tion of Jurassic and Cretaceous age. The waters characterized by a high pro portion of sulfate were derived from areas underlain chiefly by marine and continental sedimentary rocks of Tertiary and Quaternary age.
The ground waters of the area are fairly consistent in chemical character but differ greatly in mineral content. The typical waters are of sodium sulfate composition or are sulfate waters of intermediate cation composition. Locally, sodium chloride waters are present. The mineral content of ground waters in the area ranges from 477 to 7,040 ppm (parts per million), hardness ranges from 30 to 3,020 ppm, and boron from 0.3 to 11 ppm. The high sodium content of the ground waters in comparison to that of the stream waters evidently is the result of cation exchange with the sediments.
In most of the area the ground waters are of doubtful to unsuitable quality for irrigation. Further detailed studies of soil salinity and quality of ground
INTRODUCTION 6
water, and exploration and testing of undeveloped parts of the area will be required to determine whether ground-water supplies or ground-water storage can be utilized effectively in conjunctions with imported surface-water supplies.
INTRODUCTION
LOCATION AND GENERAL FEATURES OF AREA
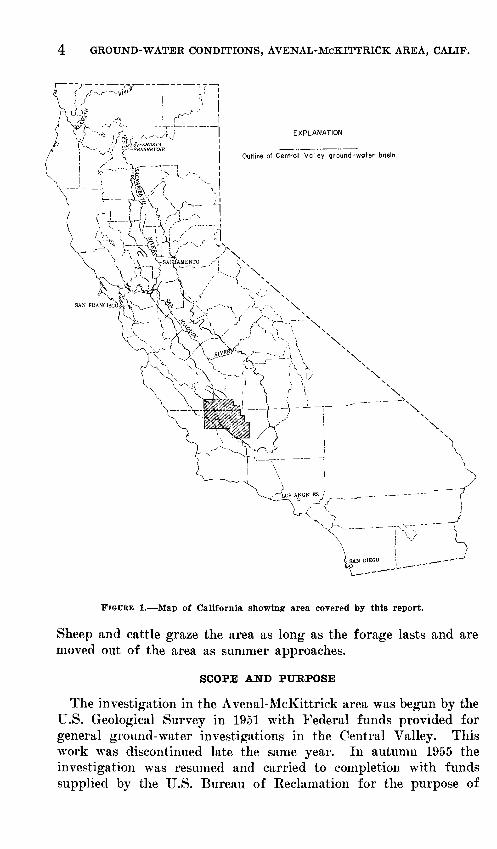
The Avenal-McKittrick area of this report includes that part of the west side of the San Joaquin Valley which extends southeast ward from the towns of Avenal and Kettleman City to the north ern border of Elk Hills and west from the axial trough of the valley, marked by Buena Vista Slough and the southwestern margin of the dry bed of Tulare Lake, to the foothills of the Coast Ranges on the west. It also includes parts of Kettleman Hills and Reef Ridge-Pyramid Hills, outliers of the Coast Ranges, and Kettleman Plain and McLure (Sunflower) Valley the valley between these outliers and the Coast Ranges proper. The location and general features of the area are shown on plates 1 and 2 and figure 1.
The area is about 70 miles long by an average of 12 miles wide and includes about 850 square miles. Of this total about 700 square miles is underlain by unconsolidated alluvial deposits; the rest con sists of hilly and mountainous country underlain by consolidated and semiconsolidated rocks of marine and continental origin. The greater part of the area is in Kern County; the remainder extends north into the southern part of Kings County.
The area is readily accessible to automobiles by way of U.S. Highway 466 and State Highways 33 and 41 (pi. 1). The only railroad is the McKittrick branch of the Southern Pacific, which provides freight service from Bakersfield to the oil-producing dis tricts near the town of McKittrick.
Avenal, founded after the discovery of oil in the Kettleman Hills in 1928, had a population of 3,982 in 1950 and is the largest town in the area. Lost Hills, a small community in the east-central part of the area, is the only other town. Other settlements include com bination service stations and eating places at Kecks Corner, Black- wells Corner, North Belridge, and South Belridge, and an unnamed station at the intersection of State Highways 33 and 41. The agri cultural population is concentrated chiefly on the Devils Den ranch, in McLure Valley, and in Antelope Valley. People employed by the oil industry generally live in small company-owned communities or isolated dwellings near the producing oil fields.
Except for the irrigated areas in McLure Valley, Antelope Valley, and Kettleman Plain (pi. 3) the greatest part of the Avenal-McKit- trick area is an uninhabited desert during most of the year. Only in the winter and early spring when the native pasture greens as a result of winter rains is there appreciable agricultural activity.
4 GROUND-WATER CONDITIONS, AVENAL-McKITTRICK AREA, CALIF.
EXPLANATION
Outline of Central Valley ground-water basin
FIGCRE 1. Map of California showing area covered by this report.
Sheep and cattle graze the area as long as the forage lasts and are moved out of the area as summer approaches.
SCOPE AND PURPOSE
The investigation in the Avenal-McKittrick area was begun by the U.S. Geological Survey in 1951 with Federal funds provided for general ground-water investigations in the Central Valley. This work was discontinued late the same year. In autumn 1955 the investigation was resumed and carried to completion with funds supplied by the U.S. Bureau of Reclamation for the purpose of
INTRODUCTION 5
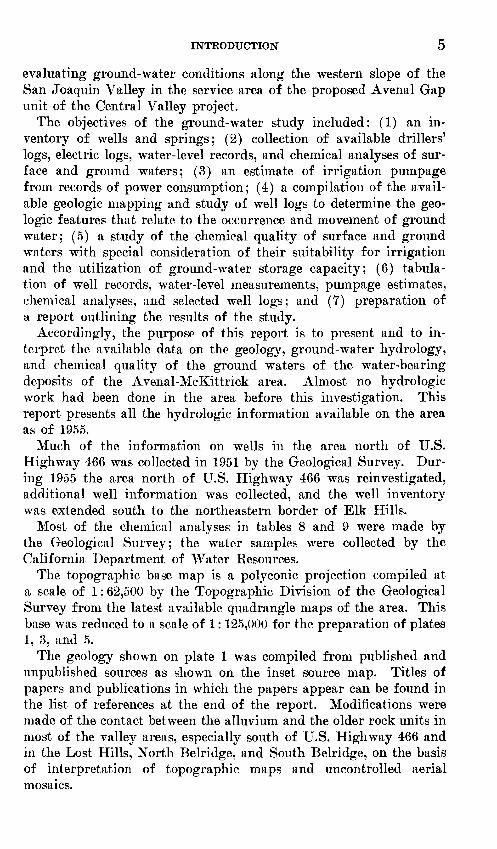
evaluating ground-water conditions along the western slope of the San Joaquin Valley in the service area of the proposed Avenal Gap unit of the Central Valley project.
The objectives of the ground-water study included: (1) an in ventory of wells and springs; (2) collection of available drillers' logs, electric logs, water-level records, and chemical analyses of sur face and ground waters; (3) an estimate of irrigation pumpage from records of power consumption; (4) a compilation of the avail able geologic mapping and study of well logs to determine the geo logic features that relate to the occurrence and movement of ground water; (5) a study of the chemical quality of surface and ground waters with special consideration of their suitability for irrigation and the utilization of ground-water storage capacity; (6) tabula tion of well records, water-level measurements, pumpage estimates, chemical analyses, and selected well logs; and (7) preparation of a report outlining the results of the study.
Accordingly, the purpose of this report is to present and to in terpret the available data on the geology, ground-water hydrology, and chemical quality of the ground waters of the water-bearing deposits of the Avenal-McKittrick area. Almost no hydrologic work had been done in the area before this investigation. This report presents all the hydrologic information available on the area as of 1955.
Much of the information on wells in the area north of U.S. Highway 466 was collected in 1951 by the Geological Survey. Dur ing 1955 the area north of U.S. Highway 466 was reinvestigated, additional well information was collected, and the well inventory was extended south to the northeastern border of Elk Hills.
Most of the chemical analyses in tables 8 and 9 were made by the Geological Survey; the water samples were collected by the California Department of Water Resources.
The topographic base map is a polyconic projection compiled at a scale of 1:62,500 by the Topographic Division of the Geological Survey from the latest available quadrangle maps of the area. This base was reduced to a scale of 1:125,000 for the preparation of plates 1, 3, and 5.
The geology shown on plate 1 was compiled from published and unpublished sources as shown on the inset source map. Titles of papers and publications in which the papers appear can be found in the list of references at the end of the report. Modifications were made of the contact between the alluvium and the older rock units in most of the valley areas, especially south of U.S. Highway 466 and in the Lost Hills, North Belridge, and South Belridge, on the basis of interpretation of topographic maps and uncontrolled aerial mosaics.
6 GROUND-WATER CONDITIONS, AVENAL-McKITTRICK AREA, CALIF.
The investigation was started under the supervision of J. F. Poland, district geologist of the Geological Survey in charge of ground-water investigations in California, and completed under the supervision of G. F. Worts, Jr., district geologist since July 1956. G. H. Davis was in charge of the investigation. Fieldwork in 1951 was done by P. R. Wood, M. E. Cooley, and R. S. Stone.
CLIMATE
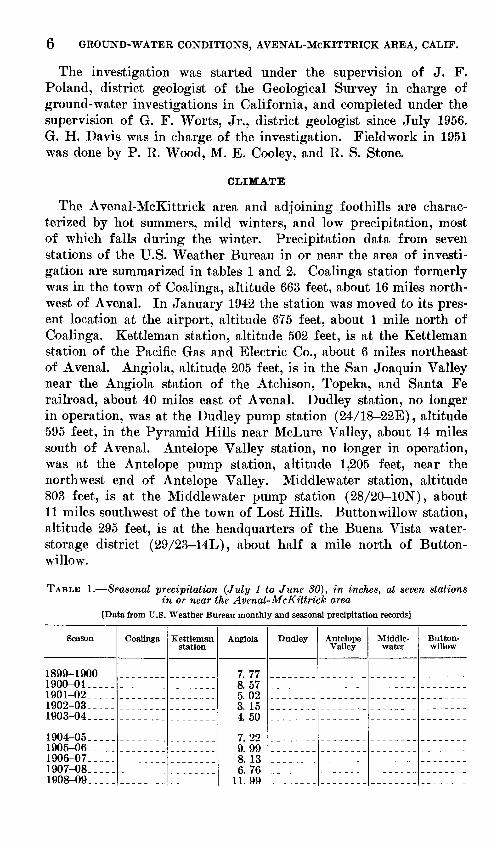
The Avenal-McKittrick area and adjoining foothills are charac terized by hot summers, mild winters, and low precipitation, most of which falls during the winter. Precipitation data from seven stations of the U.S. Weather Bureau in or near the area of investi gation are summarized in tables 1 and 2. Coalinga station formerly was in the town of Coalinga, altitude 663 feet, about 16 miles north west of Avenal. In January 1942 the station was moved to its pres ent location at the airport, altitude 675 feet, about 1 mile north of Coalinga. Kettleman station, altitude 502 feet, is at the Kettleman station of the Pacific Gas and Electric Co., about 6 miles northeast of Avenal. Angiola, altitude 205 feet, is in the San Joaquin Valley near the Angiola station of the Atchison, Topeka, and Santa Fe railroad, about 40 miles east of Avenal. Dudley station, no longer in operation, was at the Dudley pump station (24/18 22E), altitude 595 feet, in the Pyramid Hills near McLure Valley, about 14 miles south of Avenal. Antelope Valley station, no longer in operation, was at the Antelope pump station, altitude 1,205 feet, near the northwest end of Antelope Valley. Middlewater station, altitude 803 feet, is at the Middlewater pump station (28/20-10N), about 11 miles southwest of the town of Lost Hills. Button willow station, altitude 295 feet, is at the headquarters of the Buena Vista water- storage district (29/23-14L), about half a mile north of Button- willow.
TABLE 1. Seasonal precipitation (July 1 to June 30), in inches, at seven stations in or near the Avenal-McKittrick area
[Data from U.S. Weather Bureau monthly and seasonal precipitation records]
Season
1899-1900---1900-01 .._. .1901-02_--__1902-03-----1903-04--.--
1904-05-.---1905-06---..1906-07-....1907-08---.-1908-09- -.-_
Coalinga Kettleman station
Angiola
7. 778. 575.023. 154. 50
7. 229.998. 136. 76
11.99
Dudley Antelope Valley
Middle- water
Button- willow
INTRODUCTION
TABLE 1. Seasonal precipitation (July 1 to June SO), in inches, at seven stations in or near the Avenal-McKittrick area Continued
Season
1909-10... __1910-11.....1911-12. .._.1912-13... _.1913-14-....
1914-15.. _._1915-16.....1916-17.....1917-18.. ...1918-19.. .._
1919-20... __1920-21.....1921-22.....1922-231923-24-----
1924-25- ... .1925-26-----1926-27._.-.1927-28.....1928-29- ___-
1929-30.-...1930-31.....1931-321932-33. ... -1933-34.- --_
1934-35.....1935-36._...1936-37-.-..1937-38.-...1938-39.. _. _
1939-40-.---1940-41.-.--1941-42.....1942-43. ....1943-44.....
1944-45_--_-1945-46.--.-1946-47.. -_-1947-48-....1948-49___--
1949-50 --_.1950-51-----1951-52--...1952-53-----1953-54. -.. _1954-55__-_-
Average. _ .
Coalinga
3. 4210. 87
11. 848. 375.059.055.59
5. 785.679. 625. 254.06
4. 647. 538. 343.434. 66
5.287.206.354.625.23
11. 238. 209. 36
13. 294.73
7.2814. 837.636. 986. 85
5.075.414.474. 235. 27
5. 28
10.445. 266. 928. 65
26. 98
Kettleman station
5.616. 795. 69
3. 244. 204. 184.004.09
4. 614. 517. 363. 876. 596. 35
3 5. 07
Angiola
7.018. 893.494. 127. 20
11. 687. 935. 066. 167. 72
6. 466. 468.846. 974. 79
6. 965. 509. 686. 666. 17
4. 947.678.656. 154. 11
12.458 1Q
11.0812. 36
6. 55
8. 4912. 59
8. 229. 145. 36
6. 74i 7. 40
4. 72
4. 234.019. 467. 206. 296. 78
4 7. 28
Dudley
3. 768.59
11.997.054. 229. 734.73
5. 445. 728. 144. 973.44
5.368.447.677. 152.98
5.03'6. 25
5.45!5. 47
5. 30
10. 587. 30
12.3110. 33M. 67
5 6. 74
Antelope Valley
8. 354. 94
10.88
15.5210. 55
7. 7112.09
6. 50
8. 896. 97
11. 517.703. 79
4.697. 70
10. 515. 186. 55
6. 776.43
11. 248. 884.52
13.589. 14
16. 3015. 76
5. 93
9. 9220.0010. 20
6 9. 31
Middle- water
6. 514.297.56
10. 306.505. 798. 255. 26
5. 123. 427. 732. 853.41
3. 104.886.074. 562.46
4. 813. 686. 525.041. 69
7.623.486.957.603. 57
4.098. 206.047. 874. 58
4. 114. 263. 282. 434.06
3. 813. 447. 134. 155. 135. 49
7 5. 16
Button- willow
7. 28!8. 12M. 18
4. 343. 864. 173.014. 29
3. 354. 377. 105. 135.034.09
8 4. 88
1 Estimated.2 1912-13 to 1954-55. ' 1941-42 to 1954-55. 4 1899-1900 to 1954-55.
51912-13 to 1938-39. 6 1911-12 to 1941-42. ? 1911-12 to 1954-55. 8 1941-42 to 1954-55.

8 GROUND-WATER CONDITIONS, AVENAL-McKITTRICK AREA, CALIF.
TABLE 2. Average monthly precipitation (inches') at seven stations in or near theAvenal-McKittrick area
[Data from U.S. Weather Bureau annual summaries]
January.FebruaryMarchApril. _May . _June.July....... ........August.SeptemberOctoberNovemberDecember
Coalinga (1912-50)
1 261 581 15
55240806
Tr.062546
1 24
Kettleman station
(1942-50)
0. 761. 311. 13
. 53
. 14
. 07Tr.Tr..04. 14. 31
Q7
Angiola (1899-1950)
1 431 411 31
6332050101153555
1 11
Dudley (1911-35)
1 321 221 00
4545OQ010306295991
Antelope Valley
(1911-42)
2 022 091 51
6219090402103060
1 60
Middle- water
(1911-50)
0 951 09
87392505040106303383
Button- willow
(1942-50)
0 991 02
9343230303
Tr.15254875
The west side of the San Joaquin Valley lies in a rain shadow of the Coast Ranges. Moisture-laden air moving eastward from the Pacific Ocean is cooled while passing over the mountainous country west of the valley, resulting in condensation of water vapor fol lowed by precipitation, mostly in the mountains. Consequently, when the air masses have passed over the mountains and descend to cross the San Joaquin Valley, they contain less moisture, and only a relatively small amount of rain falls on the valley floor. The orographic effect of the mountains is shown by the records of precipitation stations in the Coast Ranges and in the San Joaquin Valley. For example, Priest Valley, altitude 2,400 feet, in the Coast Ranges about 22 miles west of Coalinga, has a 56-year aver age precipitation of 19.56 inches. Parkfield, altitude 1,700 feet, in the Coast Ranges about 18 miles southwest of Avenal, has a 47-year average of 14.40 inches. In the Avenal-McKittrick area, Antelope Valley, altitude 1,205 feet, has a 30-year average of 9.31 inches, and Buttonwillow, altitude 295 feet, has a 14-year average of 4.88 inches.
Precipitation in the drainage basins tributary to the Avenal- McKittrick area falls almost entirely as rain. Rainfall very often occurs as heavy downpours in a small part of a drainage basin, with only light showers or no rain falling in other parts of the basin. Again, precipitation may occur as a gentle rain over a large part of the area. Ordinarily the rainfall does not last long, and during heavy downpours runoff generally is rapid. At most places soils are loose and poorly developed, and vegetation is scanty, consisting mostly of sparse grasses, brush, and weeds. Because of their loose texture the soils probably retain a large proportion of the precipi tation resulting from gentle rains or showers.
Precipitation records given in tables 1 and 2 show the seasonal (July 1 to June 30) and monthly distribution and intensity of the
INTRODUCTION 9
rainfall in different parts of the area. The seasonal precipitation for the period of record at seven stations in or near the Avenal- McKittrick area is summarized in table 1. From the records of average monthly precipitation pres.ented in table 2, it can be com puted that nearly 75 percent of the precipitation occurs during the four months from December through March.
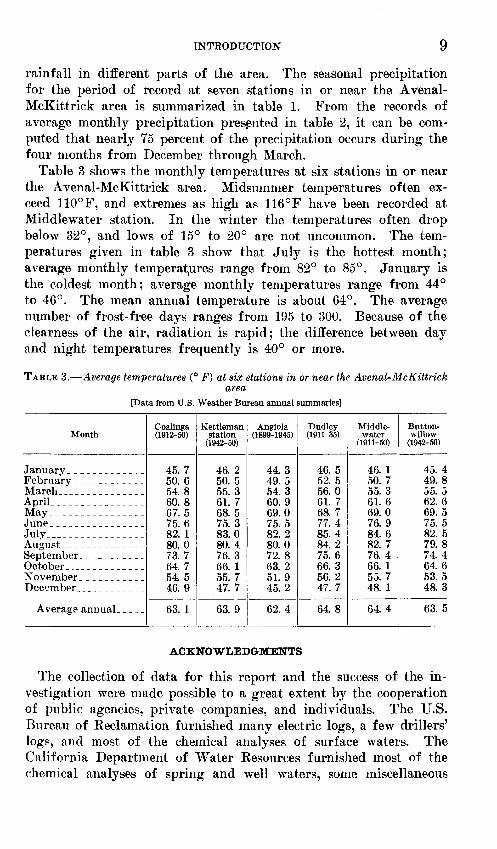
Table 3 shows the monthly temperatures at six stations in or near the Avenal-McKittrick area. Midsummer temperatures often ex ceed 110°F, and extremes as high as 116°F have been recorded at Middlewater station. In the winter the temperatures often drop below 32°, and lows of 15° to 20° are not uncommon. The tem peratures given in table 3 show that July is the hottest month; average monthly temperatures range from 82° to 85°. January is the coldest month; average monthly temperatures range from 44° to 46°. The mean annual temperature is about 64°. The average number of frost-free days ranges from 195 to 300. Because of the clearness of the air, radiation is rapid; the difference between day and night temperatures frequently is 40° or more.
TABLE 3. Average temperatures (° F) at six stations in or near the Avenal-McKittrickarea
[Data from U.S. Weather Bureau annual summaries]
Month
JanuaryFebruary . _March _April _ _ _May _ _ _ _JuneJuly___. .._......_...AugustSeptemberOctoberNovemberDecember
Average annual
Coalinga (1912-50)
45. 750. 654. 860. 867. 575. 682. 180.073. 764. 754. 546. 9
63. 1
Kettleman station
(1942-50)
46. 250. 555. 361. 768. 575. 383.080. 476. 366. 155. 747. 7
63. 9
Angiola (1899-1945)
44. 349. 554. 360. 969.075. 582. 280.072. 863. 251. 945. 2
62. 4
Dudley (1911-35)
46. 552. 556. 061. 768. 777. 485. 484. 275. 666. 356. 247. 7
64. 8
Middle- water
(1911-50)
46. 150. 755. 361. 669.076. 984. 682. 776.466. 155. 748. 1
64. 4
Button- willow
(1942-50)
45. 449. 855. 562. 669. 575. 582. 579. 874. 464. 653.548. 3
63.5
ACKNOWLEDGMENTS
The collection of data for this report and the success of the in vestigation were made possible to a great extent by the cooperation of public agencies, private companies, and individuals. The U.S. Bureau of Reclamation furnished many electric logs, a few drillers' logs, and most of the chemical analyses of surface waters. The California Department of Water Resources furnished most of the chemical analyses of spring and well waters, some miscellaneous
10 GROUND-WATER CONDITIONS, AVENAL-McKITTRICK AREA, CALIF.
water-level measurements, and a few drillers' logs. Data on water levels, pumpage, and results of pumping-plant tests, which made possible quantitative estimates of irrigation pumpage, were fur nished by the San Joaquin Division of the Pacific Gas and Electric Co. The Tidewater Associated Oil Co. supplied miscellaneous water-level measurements, chemical analyses, and drillers' logs of water wells at Reef, Temblor, and Cameras oil pump stations. The California Division of Mines made available unpublished geologic maps and furnished copies of the geologic map of California (pre liminary uncolored edition) compiled by C. J. Kundert (1955). Acknowledgment also is due the many individuals, well drillers, and ranchers who furnished basic data and other information.
WELL-NUMBERING SYSTEM
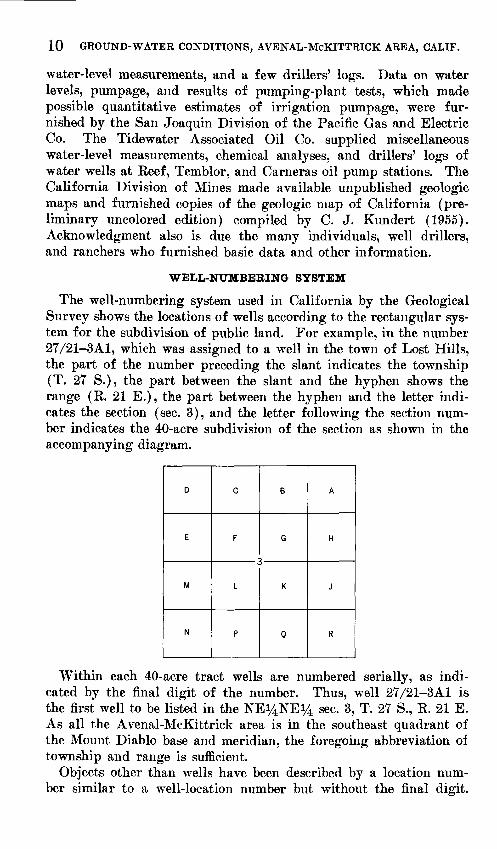
The well-numbering system used in California by the Geological Survey shows the locations of wells according to the rectangular sys tem for the subdivision of public land. For example, in the number 27/21-3A1, which was assigned to a well in the town of Lost Hills, the part of the number preceding the slant indicates the township (T. 27 S.), the part between the slant and the hyphen shows the range (R. 21 E.), the part between the hyphen and the letter indi cates the section (sec. 3), and the letter following the section num ber indicates the 40-acre subdivision of the section as shown in the accompanying diagram.
Within each 40-acre tract wells are numbered serially, as indi cated by the final digit of the number. Thus, well 27/21-3A1 is the first well to be listed in the NEi^NEi^ sec, 3, T. 27 S., R. 21 E. As all the Avenal-McKittrick area is in the southeast quadrant of the Mount Diablo base and meridian, the foregoing abbreviation oi township and range is sufficient.
Objects other than wells have been described by a location num ber similar to a well-location number but without the final digit.
PHYSIOGRAPHY 11
For example, an oil well in the NE^NEi/4 sec. 15, T. 24 S., R. 18 E., near Avenal Gap, may be described as being in 24/18-15A.
PHYSIOGRAPHY
TOPOGBAPHY AND DBAINAGE
The Avenal-McKittrick area for the most part lies in the Great Valley geomorphic province as defined by Jenkins (1938) but in cludes Kettleman Hills, Kettleman Plain, Reef Ridge-Pyramid Hills, and McLure Valley of the Coast Ranges province of Jenkins (1938).
The part of the San Joaquin Valley south of Tulare Lake is for all practical purposes a basin of interior drainage (Davis and others, 1959, p. 18). There the drainage is poorly integrated; the streams flow toward the valley trough and thence northward by way of Buena Vista Slough to Tulare Lake bed. Formerly, water collected in Tulare Lake and overflowed northward to the San Joaquin River during periods of exceptionally heavy runoff when the lake surface reached an elevation of as much as 210 feet above sea level. At present most of the lake bed has been reclaimed and is under cultivation; the northwestern part contains the lake which is confined by dikes and levees.
All the streams in the area are intermittent and flow only during periods of heavy rainfall. In periods of average rainfall virtually all the runoff from these streams is absorbed by permeable alluvial- fan deposits before reaching the valley trough.
SAN JOAQUIN VALUET
The surface of the San Joaquin Valley is characterized by several types of topography which may be grouped into four geomorphic units (Davis and others, 1959, p. 16) : Dissected uplands, low plains and fans, river flood plains and channels, and overflow lands and lake bottoms. The first, second, and fourth units are recognized in the Avenal-McKittrick area. Their general extent is shown on the inset map on plate 1.
DISSECTED UPLANDS
The dissected uplands (idem) are underlain chiefly by the mod erately deformed Tulare formation, slightly warped old stream deposits, and alluvium. This geomorphic unit has several low, deeply eroded hills or ridges which protrude through the relatively smooth alluvial plains. These hills include Kettleman, Lost, and Elk Hills, the low hills and much dissected surface near North Belridge and west of South Belridge. Elsewhere, the dissected up lands include low hills underlain chiefly by deformed sediments of continental origin along the eastern margin of the Temblor Range
12 GROUND-WATER CONDITIONS, AVENAL-McKITTRICK AREA, CALIF.
and the upper, more dissected parts of alluvial fans bordering de formed marine sediments of the Coast Kanges.
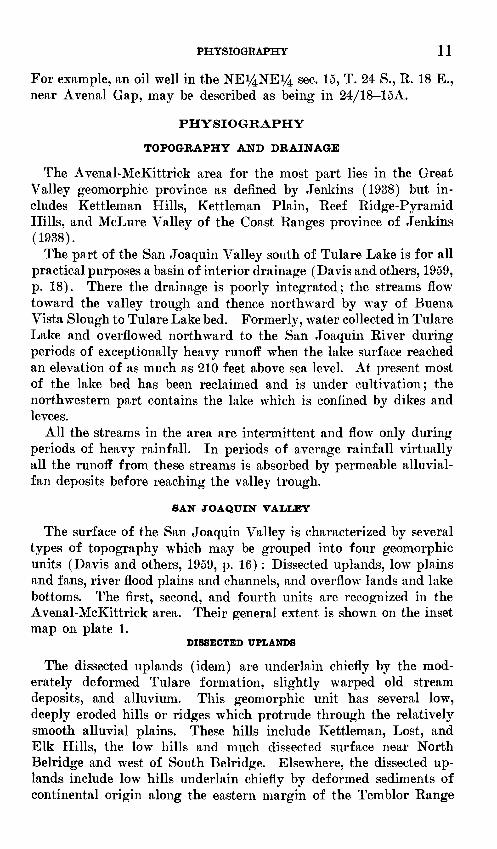
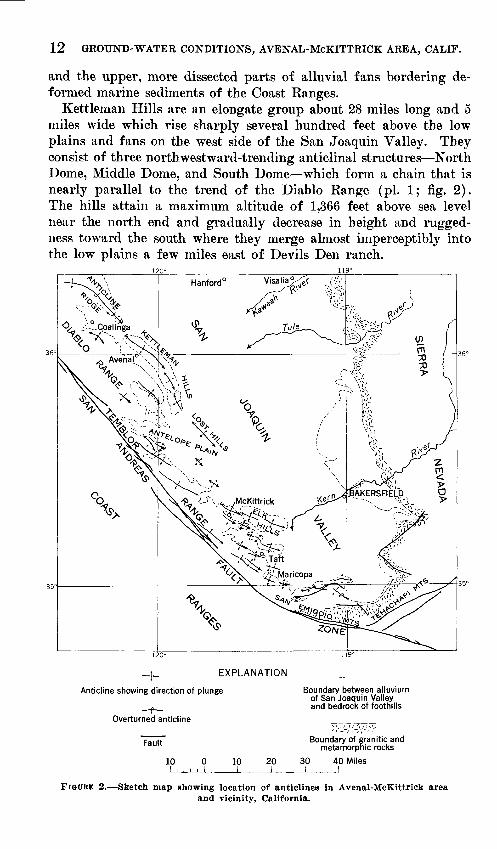
Kettleman Hills are an elongate group about 28 miles long and 5 miles wide which rise sharply several hundred feet above the low plains and fans on the west side of the San Joaquin Valley. They consist of three northwestward-trending anticlinal structures North Dome, Middle Dome, and South Dome which form a chain that is nearly parallel to the trend of the Diablo Kange (pi. 1; fig. 2). The hills attain a maximum altitude of 1,366 feet above sea level near the north end and gradually decrease in height and rugged- ness toward the south where they merge almost imperceptibly into the low plains a few miles east of Devils Den ranch.
120°
__{_ EXPLANATION
Anticline showing direction of plunge Boundary between alluvium of San Joaquin Valley and bedrock of foothills
Overturned anticline
Fault
10 01 , , , , !
Boundary of granitic and metamorpnic rocks
10 20 30 40 Miles1 1 1 1
FIGURE 2. Sketch map showing location of anticlines in Avenal-McKittrick area and vicinity, California.
PHYSIOGRAPHY 13
Most of the trunk streams are consequent and flow down the slopes roughly at right angles to the trend of the hills and the strike of the strata, but many of the tributary streams are more or less parallel to the strike of the strata and form nearly right angles with the trunk streams.
Around the periphery of Kettleman Hills the dissected uplands include a band of deformed continental deposits and older alluvium about 2 miles in width. West of Kettleman Plain they include a discontinuous band of deformed continental deposits that overlie marine sediments of Tertiary age of the Diablo Range, and the higher parts of the alluvial fans that border the continental and marine sediments.
Lost Hills, about 4 miles southeast of the South Dome of Kettle man Hills, form a low ridge rising above Antelope Plain. These hills have a northwestward trend and are about 8 miles long and more than a mile wide. The maximum relief is near the center of the hills which stand about 80 feet above the adjacent Antelope Plain and about 125 feet above the main San Joaquin Valley to the northeast. The southwestern slope is very gentle, but the north eastern slope is steep and has been dissected to a depth of about 100 feet by the headward erosion of several streams. Lost Hills were so named because, though easily seen from the east, they appear to be lost when viewed from the west, where the slight eastward rise is hardly apparent.
Several small northeastward-trending streams have cut trans versely across the hills and have an uninterrupted flow from Ante lope Plain to the San Joaquin Valley. Lost Hills is the surface reflection of an underlying anticline (fig. 2) which extends north westward through the Kettleman Hills to Anticline Ridge in the Diablo Range northeast of Coalinga.
The low hills known locally as the Antelope Hills, which are about 4 miles west of North Belridge, rise above the plains to the west only at the north end, where local relief is as much as 50 feet. To the east and southeast these hills blend into a slightly arched, much dissected northwestward-trending surface that is characterized by a local flattening on the west and a steepening on the east where it blends into the low plains. Although several poorly defined drainage courses extend northeastward across this surface, most of the dissection has been accomplished by local stream gullying on the eastern slopes. This dissected, slightly hilly area is the surface reflection of an anticlinal fold underlying the North Belridge oil field (fig. 2). A similar anticlinal fold underlies the South Belridge oil field, which is a few miles to the south. Its topographic expres sion is slight, although a rise in altitude can be observed from the east.
503194 O 59 2
14 GROUND-WATER CONDITIONS, AVENAL-McKITTRICK AREA, CALIF.
About 4 miles west of South Belridge a hilly area, known locally as Bacon Hills, rises above a dissected surface which is crudely ellip tical in outline. The drainage courses of Carneros and Chico Mar- tinez Creeks, which drain much of the mountainous country to the southwest, are deflected northward and southward, respectively, around the Bacon Hills. One unnamed stream maintains a course across the area, and much dissection has been accomplished by local gullying in the poorly consolidated continental deposits. The Bacon Hills and the small isolated outcrops of continental deposits to the northwest indicate the location and trend of an underlying anticlinal structure that has been drilled successfully for oil.
Elk Hills, which form the southern border of the Avenal-McKit- trick area and a relatively narrow group of northwestward-trending hills northeast of McKittrick Valley (pi. 1), are underlain by de formed continental deposits. They lie along the north side of a wedge of west-northwestward-trending foothills that adjoin the east flank of the Temblor Range. The hills are the surface expression of an anticlinal fold and are isolated from the foothills to the south by Buena Vista and McKittrick Valleys which are the surface ex pression of a northwestward-trending syncline (Woodring and others, 1932, p. 41).
The Elk Hills are crudely elliptical in outline, having a length of about 17 miles and a maximum width of almost 6 miles. They are separated from the much narrower range of hills north and northwest of McKittrick by the narrow northeastward-trending stream gap traversed by the Southern Pacific railroad. The hills rise to an altitude of 1,551 feet above sea level, about 1,000-1,200 feet above the floor of the San Joaquin Valley. They are drained by many-branched ephemeral streams, and the terrain is character ized by gentle slopes and smoothly rounded hills.
LOW PLAINS AND FANS
The belt of coalescing alluvial fans of low relief that lie between the dissected uplands and the Coast Ranges on the west and the nearly flat surface of the valley trough on the east have been called the "low plains and fans" by Davis and others (1959, p. 21-23). Land- surface altitudes in this area decline from about 1,000 feet above sea level on the west to about 200 feet on the east, and, except for trenching by the major streams, local relief is generally less than 10 feet and in most places less than 5 feet. The relatively smooth surfaces of the low plains and fans are interrupted in several places by low hills which are surface expressions of Coast Range folds. These low hills serve to subdivide the low plains and fans into several natural units, as follows: Kettleman Plain, McLure Valley, Antelope Valley,
PHYSIOGRAPHY 15
Antelope Plain, and the western slope of the valley east of Lost Hills(pl. I)-
Kettleman Plain is a relatively narrow, northwestward-trending valley occupying a deep alluvium-filled synclinal trough between the Kettleman Hills and the Kreyenhagen Hills (pl. 1), which are formed by a chain of structural ridges along the eastern border of the Diablo Kange.
McLure Valley, also known locally as Sunflower Valley, occupies a shallow northwestward-trending alluvium-filled basin of structural origin between the Pyramid Hills and Avenal Kidge, the southern most spur of the Diablo Range (pl. 1). At its lower end McLure Valley is connected to Kettleman Plain by an alluvium-floored out let, known as Dagany Gap, which is less than a mile wide and apparently was cut by Avenal Creek. Avenal Gap is a similar alluvium-floored plain, nearly half a mile wide, which separates the Middle Dome and South Dome of the Kettleman Hills; it also appears to have been cut by Avenal Creek. Avenal Creek follows a course across McLure Valley, passes through Dagany Gap, trends northeastward across Kettleman Plain, eastward across the uplift of the Kettleman Hills through Avenal Gap, and debouches onto an alluvial fan along the west side of the San Joaquin Valley. Old residents report that in the past Avenal Creek occasionally has fol lowed an alternate course around the south end of Kettleman Hills instead of through Avenal Gap.
Antelope Valley occupies a shallow northwestward-trending basin- like depression, probably of structural origin, between the southern most spur of the Diablo Range (Avenal Ridge) and the north end of the Temblor Range (pl. 1). In the western and northwestern parts of the valley, alluvial deposits have been laid down and form alluvial fans built for the most part by Polonio and Franciscan Creeks. The east end of the valley broadens to form Antelope Plain, where Packwood and Bitterwater Creeks are the principal sources of the alluvium.
Antelope Plain is a gently sloping alluvial surface covering an extensive area along the west side of the San Joaquin Valley. In general, the plain extends from the south end of the Kettleman Hills to the northeastern border of Elk Hills and from Lost Hills to the Temblor Range. It includes most of the unit of low plains and fans of this report.
OVERFLOW LANDS AND LAKE BOTTOMS
The unit of overflow lands and lake bottoms includes a narrow strip of land west of Buena Vista Slough. Buena Vista Slough trends northwestward for a distance of about 50 miles from the Kern River near the east tip of Elk Hills, to Sand Ridge at the
16 GROUND-WATER CONDITIONS, AVENAL-McKITTRICK AREA, CALIF.
south end of Tulare Lake bed (pi. 1). The western boundary of these lands is formed by Elk Hills and the adjacent low plains and fans along the west side of the valley. Throughout much of its extent the slough is contained within levees and serves chiefly as a wasteway for excess flood waters being discharged from the Kern River and from Buena Vista Lake. The soils in the bed of Tulare Lake and the Buena Vista Slough area consist principally of heavy, poorly permeable clays.
COAST RANGES
The mountainous country that forms the western border of the San Joaquin Valley is the easternmost tier of a series of northwest ward-trending mountain ranges that make up the Coast Ranges physiographic province of Jenkins (1938) and is traversed by the San Andreas fault zone (fig. 2). According to Taliaferro (1951, p. 142) this series of mountain ranges evolved as a result of several episodes of folding and faulting of geosynclinal sediments of Meso- zoic and Tertiary ages during late Tertiary time. The Avenal- McKittrick area includes the east flank of the Temblor Eange and part of the easternmost hills that comprise the Diablo Eange.
The Diablo Eange extends from Carquinez Straits at San Fran cisco Bay southeastward along the western border of the San Joaquin Valley and terminates at Avenal Eidge, which is a rugged east-southeastward-plunging anticlinal feature that forms the di vide between McLure and Antelope Valleys (pi. 1). Other promi nent salients or spurs of the Diablo Eange that project toward the San Joaquin Valley include Eeef Eidge and the Pyramid Hills. The Kreyenhagen Hills form a long foothill belt between Eeef Ridge and the Kettleman Plain and are considered a structural part of the Diablo Eange.
The Temblor Eange is the dominant feature of the region. It is separated both topographically and structurally from the Diablo Eange by Antelope Valley. The range has an echelon relationship to the Diablo Eange at its north end and merges with the eastward- trending San Emigdio Mountains which form the southern border of the San Joaquin Valley (fig. 2). The Temblor Eange has a south easterly trend and preserves a broadly even summit line which reaches its greatest altitude, 4,332 feet above sea level, about 8 miles west of McKittrick. The northeast slope descends in a series of irregular tiers of structurally controlled hills, the lowest of which merge gently into the fans of the San Joaquin Valley.
The smaller streams draining the northeastern slopes of the Coast Eanges commonly flow in a northeasterly direction almost at right angles to the structurally controlled ridges. Larger streams com monly flow for some distance parallel to the structurally controlled
GEOLOGIC FEATURES 17
longitudinal ridges and then turn sharply across them to lose their identity where they debouch on the alluvial plains beyond.
GEOLOGIC FEATURES
PREVIOUS WORK
The geologic history and structure of the San Joaquin Valley are intimately related to geologic events in the Sierra Nevada and south ern Coast Ranges. Major events in the geologic history of the area since Late Cretaceous time were summarized in tabular form by Da vis and others (1959). More detailed discussions of this subject may be found in papers by Anderson and Pack (1915), Hoots (1929), Matthes (1930), Eeed (1933), Piper and others (1939), Woodring and others (1940), and Taliaferro (1943). An excellent summary of the stratigraphy and structure of the valley was presented by Hoots and others (1954). More detailed discussions of these sub jects may be found in California Division of Mines Bulletin 118 (1943), pt. 3.
Papers outlining the structure and stratigraphy of oil fields in the Avenal-McKittrick area, notably the Kettleman Hills, Lost Hills, Pyramid Hills, Devils Den, Blackwells Corner, Antelope Hills, North Belridge, McDonald Anticline, Cymric, and Elk Hills oil fields have been presented in "Summary of Operations California Oil Fields" (1919-56), published quarterly by the California Depart ment of Natural Kesources, Division of Oil and Gas.
GENERAL GEOLOGY
The following geologic summary of the San Joaquin Valley is taken with only slight modification from Davis and others (1959).
Although the full thickness of the sedimentary fill in the San Joaquin Valley is not known from drilling, several lines of indirect evidence indicate that the valley is an asymmetrical trough, the axis of which lies close to the western border of the valley. Vaughan (1943, p. 68) concluded, from geophysical evidence, that granitic and metamorphic rocks of the tilted Sierra Nevada fault block continue westward beneath the valley to the flanks of the Coast Ranges. Wells penetrating granitic and metamorphic rocks along the east side of the valley and as far west as the topographic trough (May and Hewitt, 1948, pi. 10) confirm this hypothesis. The fact that wells of equal or greater depths on the west side of the valley do not penetrate basement rocks is further confirmation of the asym metrical character of the valley. Published geologic sections (Hoots, 1943, p. 266; de Laveaga, 1952, p. 120; Hoots and others, 1954, pi. 6; Davis and others, 1959, pi. 2) and interpretations (Hoots and others,
18 GROUND-WATER CONDITIONS, AVENAL-McKITTRICK AREA, CALIF.
1954, p. 113-129 and pi. 5) based on the records of many hundreds of wells drilled for oil present a picture of an asymmetrical valley in which the basement rocks beneath the surface continue westward at increasing depths and with little structural disturbance to the flanks of the Coast Eanges.
During the Cretaceous and throughout much of the Tertiary periods, the San Joaquin Valley was the site of marine deposition, although nonmarine beds of Tertiary age are known to interfinger with marine deposits in several oil fields in the southern part of the valley. The youngest marine rocks are sediments of the Etchegoin and San Joaquin formations of middle Pliocene and late Pliocene age, respectively, which are exposed in the core of the Kettleman Hills and which form extensive outcrops along the southwestern margin of the valley. These marine sediments nearly everywhere are overlain by semiconsolidated and unconsolidated fluvial and lacustrine deposits of late Pliocene to Eecent age.
The sedimentary units penetrated in the oil wells thin to the east and pinch out against the westward-dipping basement rocks of the Sierra Nevada block. In the southern part of the valley, rocks of Cretaceous and early Tertiary age thicken to the west, attaining their maximum thickness in the Coast Eanges.
During late Tertiary and Quaternary time, sedimentation in large part was confined to the present valley trough, although locally great thicknesses of deposits of these ages are exposed along the western margin of the valley.
The Diablo Eange and the Temblor Eange, which mark the west ern border of the San Joaquin Valley, are the easternmost of a series of northwestward-trending mountain ranges that make up the south ern Coast Eanges. They are composed chiefly of sharply folded and intricately faulted marine sedimentary rocks of Mesozoic and Tertiary ages. The Diablo Eange, although anticlinal in general, is not a single fold but rather an assemblage of folds, many of which are more or less oblique to the general structural trend. Its core is com posed of folded and contorted sedimentary, igneous, and metamor- phic rocks of the Franciscan formation of Jurassic and Cretaceous age. In the Avenal-McKittrick area the main salients or subsidiary structural features of the Diablo Range that trend toward the San Joaquin Valley are the echelon folds expressed topographically as the Kettleman Hills, Lost Hills, and others (fig. 2).
The Temblor Range forms the southwestern border of the San Joaquin Valley and merges with the eastward-trending San Emigdio Mountains which form the southern border of the valley. The range is composed of tightly folded sedimentary rocks chiefly of Tertiary age. Although its structure is complex throughout, the complexity increases toward the south, where a series of east-southeastward-
GEOLOGIC FEATURES 19
trending anticlinal ridges and synclinal valleys extend out into the San Joaquin Valley.
Although the Coast Eanges have been established throughout a long interval of geologic time, they owe their present form largely to tectonic movements which resulted in deformation of marine sedi ments of late Tertiary age and continental deposits of late Tertiary and Quaternary age that border the valley. According to Hoots and others (1954, p. 128) the orogeny that produced most of the folding, faulting, and mountain building took place in middle Pleistocene time. In the Avenal-McKittrick area most if not all the anticlinal folds were formed or at least underwent the greater part of their present structural deformation at that time. Sedimentary deposits of the foothills and mountain areas forming the western border of the valley underwent pronounced uplift and compression which pro duced a complex pattern of tightly folded, overturned, and thrust- faulted anticlinal structures. Hoots and others (1954, p. 128) report that:
Although it is certain that anticlines of the San Joaquin basin developed most of their present character and structural relief during the mid-Pleistocene orogeny, there is considerable evidence that some and possibly most of them began to develop as early as late Miocene or early Pliocene time, and experi enced additional growth as broad, gentle folds during later Pliocene and early Pleistocene time.
In the Avenal-McKittrick area the anticlinal structures formed during this orogeny have warped the continental deposits of late Tertiary and Quaternary age at Kettleman Hills, Lost Hills, the hills west of North Belridge and South Belridge, and Elk Hills, where older sediments have been brought to the surface and exposed in topographic highs. These anticlinal structures commonly are flanked by structural depressions that contain continental deposits that were laid down subsequently.
The chief significance of these structural features is their effect on the quality of ground water. In general, the structural highs are areas where connate marine waters are found at relatively shal low depth, and the structural depressions contain maximum thick nesses of continental deposits that contain water of relatively good quality.
GEOLOGIC UNITS AND THEIR WATER-BEARING PROPERTIES
The geology shown on plate 1 is a compilation of work done by others (p. 5). On the basis of these earlier studies, the geologic units of the Avenal-McKittrick area were divided into two principal groups: (1) consolidated rocks, which include the Franciscan formation and ultramafic rocks, undifferentiated, of Jurassic and Cretaceous age, and sedimentary rocks, undifferentiated, of Creta-

20 GROUND-WATER CONDITIONS, AVENAL-McKITTRICK AREA, CALIF.
ceous and Tertiary age; and (2) unconsolidated to loosely consoli dated deposits that include the Tulare formation of Pliocene and Pleistocene (?) age, old stream deposits of Pleistocene age, and allu vium and flood-basin sediments of Pleistocene and Kecent age.
The consolidated rocks are poorly permeable to impermeable. Locally, the sedimentary rocks contain connate water of poor chemi cal quality. The unconsolidated deposits supply nearly all the water pumped from wells. Of the unconsolidated deposits the Tulare for mation and the alluvium are the most permeable and are tapped by most of the wells in the area. Collectively, the unconsolidated de posits range in thickness from a few feet along the contacts with older rocks to several thousand feet beneath Kettleman Plain and Tulare Lake. In general they are thickest in synclinal troughs and thinnest on the flanks or over the crests of anticlines.
CONSOLIDATED ROCKS
The consolidated rocks have been mapped in detail by previous workers who have identified them as follows: The Franciscan for mation of Jurassic and Cretaceous age; the Panoche formation of Late Cretaceous age; the Tejon formation, Avenal sandstone, and Kreyenhagen shale of Eocene age; the Temblor sandstone, McLure shale member of the Monterey shale, and Keef Kidge shale of Mio cene age; and the Jacalitos, Etchegoin, and San Joaquin formations of Pliocene age. In this report and on the geologic map (pi. 1) these formations have been divided into three groups: The Francis can formation and ultramafic rocks, undifferentiated, undifferenti- ated sedimentary rocks of Cretaceous age, and undifferentiated sedi mentary rocks of Tertiary age.
The Franciscan formation consists of a heterogeneous assemblage of sedimentary, volcanic, and locally metamorphosed rocks that have been intruded by mafic and ultramafic igneous rocks. Irregular masses and dikelike bodies of serpentine associated with this series of rocks probably are an alteration product by the ultramafic intru sive rocks. As shown on the geologic map (pi. 1) the Franciscan locally is separated from the marine sedimentary rocks of Cretaceous and Tertiary age by steeply inclined faults. Thus, its thickness and lateral extent are not known. However, studies made in other parts of the Coast Ranges, where the Franciscan is better exposed, indicate that this series of rocks forms the basement upon which a large part of the Cretaceous and later sediments were deposited.
The Cretaceous rocks, which attain their maximum thickness in the Coast Ranges, consist of a thick monotonous sequence of arkosic sandstone, conglomerate, sandy shale, thin impure limestone, and organic shale. They dip steeply toward the valley and wedge out against the basement complex of the Sierra Nevada near the east
GEOLOGIC FEATURES 21
edge of the San Joaquin Valley where they are overlapped by conti nental deposits. At depth beneath the valley they contain connate saline waters unsuitable for any present agricultural purpose.
The marine sediments of Tertiary age attain a thickness of at least 15,000 feet near the western border of the valley and, like the Cretaceous rocks, thin eastward and wedge out against the basement complex of the Sierra Nevada where they too are overlapped by younger continental deposits. The rocks of early Tertiary age con sist chiefly of shale, in large part organic, and conspicuous sandstone strata, whereas the rocks of late Tertiary age consist chiefly of sand containing abundant volcanic detritus and silt with some sandstone and conglomerate.
The consolidated rocks are generally of low permeability and trans mit little water. Most contain fractures induced by folding and faulting; these openings probably convey small quantities of water to the adjacent unconsolidated deposits or yield small amounts of water to a few wells. Many of the small springs in creeks and ravines along the east side of the Coast Ranges evidently serve as outlets for ground water contained in such fracture systems.
Water wells drilled through the unconsolidated deposits into the underlying consolidated rocks usually are plugged back to beds in the Tulare formation or younger deposits because of the poor quality of the water at depth. Therefore, in these areas, except locally, it is unlikely that formations older than the Tulare would be tapped as a source of fresh-water supply.
UNCONSOLIDATED BOCKS
The unconsolidated deposits have been mapped by previous workers as the Tulare formation of Pliocene to Pleistocene (?) age; older alluvium, stream-terrace deposits, and old fan deposits of Pleistocene age; and younger alluvium, lake sediments, and basin deposits of Pleistocene and Recent age. In this report and on the geologic map (pi. 1), these deposits have been divided into four groups: The Tulare formation, old stream deposits of Pleistocene age, alluvium of Pleistocene and Recent age which includes younger and older alluvial deposits exposed on and underlying the valley floors, and flood-basin deposits approximately equivalent in age to and interfingered with the alluvium underlying Tulare Lake bed and Buena Vista Slough. The stratigraphic and structural relations and the general litholegic character of the unconsolidated deposits beneath Kettleman and Antelope Plains and Antelope and McLure Valleys are shown on plates 1 and 2.
The Tulare formation has been mildly folded; the old stream de posits have been uplifted, dissected, and locally tilted gently; and the youngest materials comprising the alluvium and flood-basin sedi-
22 GROUND-WATER CONDITIONS, AVENAL-McKITTRICK AREA, CALIF.
ments are almost undisturbed. Except for the fine-grained flat-lying flood-basin deposits, all these units are similar lithologically. Hence, only along the valley margins where there has been uplift and ero sion is it possible to distinguish between them. In the subsurface it is virtually impossible to recognize these distinctions, which are based largely on structural deformation and physiographic position rather than or lithologic features. Accordingly, except locally, no attempt was made to distinguish the units on the detailed geologic sections presented on plate 2.
TULARE FORMATION
The Tulare formation consists chiefly of unconsolidated continental deposits along the western border of the San Joaquin Valley that have been mapped by previous workers. Information concerning the surface extent of the Tulare was compiled from several sources as shown on the inset source map (pi. 1). Stewart (1946) mapped the Tulare along the west side of Kettleman Plain, where it rests com- formably on semiconsolidated marine sediments and forms the high est parts of the Kreyenhagen Hills. Woodring and others (1940) showed that in the Kettleman Hills outcrops of the Tulare forma tion form a nearly continuous rim of intricately dissected deposits that in most places rest conformably on semiconsolidated marine sediments of the San Joaquin formation, which is exposed in the core of the hills. Woodring and others (1932) mapped the Tulare exposed in the Elk Hills along the southern border of the area. Exposures of the Tulare formation along the crest of the Temblor Range in the Bitterwater Creek area were mapped by English (1921). Other exposures along the western border of the valley were mapped by Arnold and Johnson (1910) and English (1921). Unpublished mapping by many oil-company geologists was compiled by Kundert (1955) for the geologic map of California.
The dissected uplands forming Lost Hills, the hills west of North and South Belridge, and other isolated outcrops protruding through Quaternary alluvium near the western border of the valley probably are underlain chiefly by the Tulare formation, which has been arched and uplifted along the northwestward-trending anticlines (fig. 2). On the geologic map of California (Kundert, 1955) most of these areas have been shown as Pliocene to Pleistocene nonmarine deposits, although older alluvial deposits, which are difficult to - distinguish from the Tulare formation, may make up many of the exposures in these areas. However, because of the similarity between the Tulare and the older alluvial deposits and because of the lack of detailed geologic mapping in the dissected areas, they are shown on the geo logic map (pi. 1) as the Tulare formation.
GEOLOGIC FEATURES 23
Discontinuous exposures of the Tulare formation in the foothills and along the east flanks of the Coast Ranges extend from a point several miles north of Corral Hollow Creek in San Joaquin County to Wheeler Eidge at the south end of the valley. In the synclines, however, the Tulare is covered by unknown thicknesses of alluvium,
The Tulare formation was named by F. M. Anderson (1905), p. 181-182), but a type locality was not designated. The Kettleman Hills have been regarded as the type locality, and Woodring pro posed that the section on La Ceja (north of area shown on pi. 1) on the east side of North Dome be designated the type locality (Wood- ring and others, 1940, p. 13). Woodring placed the base of the Tulare just above the youngest widespread marine deposits compris ing the upper Mya zone of the San Joaquin formation. At the type locality there is no evidence of a major discontinuity at this horizon, and the boundary represents a change from marine to continental deposition. The change is not abrupt, however, because continental deposits occur below the contact, and a few marine strata are found in the basal part of the Tulare formation. Although the Tulare conformably overlies the San Joaquin formation in the Kettleman Hills, it rests unconformably on sediments of Pliocene age and on older formations along much of the eastern border of the Diablo and Temblor Eanges (Woodring and others, 1940, p. 14).
Stratigraphic studies, based on electric-log data from many oil fields, indicate that the Tulare formation rests unconformably on the truncated edges of marine sedimentary rocks of Pliocene and Miocene age. Although the absence of diagnostic fossils has hindered the correlation of the Tulare beyond the type locality in the Kettle man Hills, its locality has been extended by other workers to the north and south on the basis of lithologic similarity and strati- graphic position.
As denned by Woodring, the Tulare formation includes those con tinental beds in the Kettleman Hills that have been deformed or tilted at an angle to their original plane of deposition. At those places along the valley margin where the alluvium and old stream deposits overlie the Tulare with angular unconformity, the contact is established readily. However, at many places along the valley border the dips increase westward so gradually that the contact be tween the alluvium and the Tulare formation is difficult to identify. Because of the similar lithology of the alluvium and the Tulare, their contact beneath the valley floor is virtually impossible to recog nize in well logs.
The exposed thickness of the Tulare formation ranges from a few tens of feet along the western margins of the valley to about 3,500 feet in the Kettleman Hills. Because the Tulare is overlapped by alluvium and old stream deposits, its full thickness probably is not
24 GROUND-WATER CONDITIONS, AVENAL-McKITTRICK AREA, CALIF.
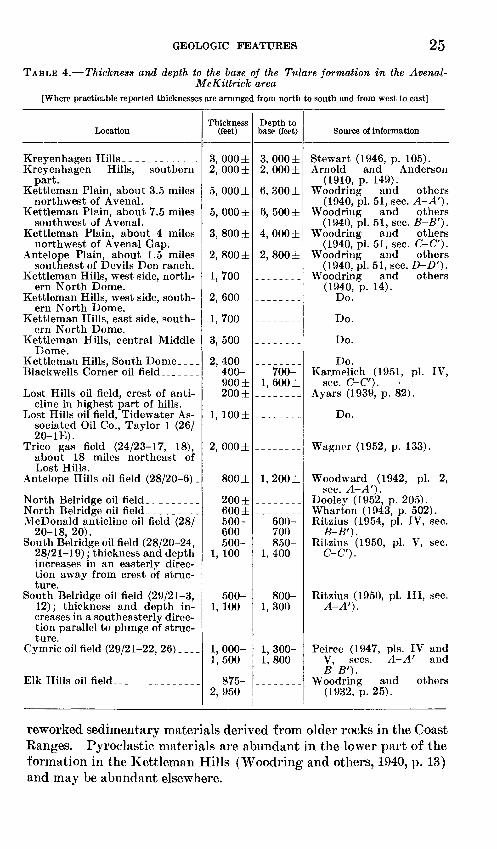
exposed. The available information on the thickness and depth to the base of the Tulare in several parts of the Avenal-McKittrick area and the source of the information are summarized in table 4. After studying the structural relations in the Kettleman Hills-Reef Ridge areas, Woodring and others (1940, pi. 51) postulated that the Tulare, which is overlain by 1,000 to 1,500 feet of alluvium, reaches a maximum thickness of about 5,000 feet in the syncline beneath Kettleman Plain (pi. 1). Near Avenal Gap the Tulare thins to about 3,800 feet, and southeast of Devils Den ranch, where it is ex posed at the land surface, the Tulare has a maximum thickness of about 3,000 feet.
Although the interpretation given by Woodring suggests that the Tulare formation thins toward the southeast both in the Kettleman Hills and in the syncline west of the hills, the formation probably continues in a southeasterly direction for a considerable distance beneath the alluvium of Antelope Plain. Its depth, thickness, and lateral extent in this area are little known. Although its thickness, depth, and lateral extent east of the Kettleman Hills-Lost Hills upwarp are little known, information shown in table 4 indicates that the Tulare thickens rapidly east of the Lost Hills anticline and reaches a maximum of about 2,000 feet in the Trico gas field in the central part of the San Joaquin Valley about 15 miles west of Delano. West and southwest of Lost Hills the thickness and depth to the base of the Tulare (table 4) are well known only where struc tural highs have been drilled for oil. In these areas the Tulare has been uplifted and structurally deformed, and unknown thicknesses may have been removed from the crests of the folds by subsequent erosion. The thickness and depth of Tulare deposits in synclinal troughs adjacent to the structural highs generally are not well known, owing to the fact that few exploratory oil wells have been drilled in structural depressions.
Lithologically the Tulare formation is similar to the alluvium now being deposited along the west side of the valley. The forma tion generally consists of poorly sorted predominantly silty mate rials containing lenses of coarse sand and gravel and locally thin beds of argillaceous limestone, marl, and marly silt. The fine-grained beds are loose to semiconsolidated; the gravels locally are cemented by either calcium carbonate or gypsum to form resistant strata of conglomerate. Not all the sediments are of fluvial origin. Strata of diatomaceous clay, such as that near the base of the formation in the Kettleman Hills, and a widespread diatomaceous clay in the Mendota-Huron area, which was described in detail by Davis and others (1959, p. 76) and Frink and Kues (1954), represent lacustrine deposits, as do possibly some of the well-sorted fine sand and thin- bedded silt, clay, and limestone. Most of the formation consists of
GEOLOGIC FEATURES 25
TABLE 4. Thickness and depth to the base of the Tulare formation in the Avenal-McKittrick area
[Where practicable reported thicknesses are arranged from north to south and from west to east]
Location
Kreyenhagen HillsKreyenhagen Hills, southern
part. Kettleman Plain, about 3.5 miles
northwest of Avenal. Kettleman Plain, about 7.5 miles
southwest of Avenal. Kettleman Plain, about 4 miles
northwest of Avenal Gap. Antelope Plain, about 1.5 miles
southeast of Devils Den ranch. Kettleman Hills, west side, north
ern North Dome. Kettleman Hills, west side, south
ern North Dome. Kettleman Hills, east side, south
ern North Dome. Kettleman Hills, central Middle
Dome. Kettleman Hills, South Dome _Blackwells Corner oil field
Lost Hills oil field, crest of anticline in highest part of hills.
Lost Hills oil field, Tidewater Associated Oil Co., Taylor 1 (26/ 20-1E).
Trico gas field (24/23-17, 18),about 18 miles northeast of Lost Hills.
Antelope Hills oil field (28/20-6) .
North Belridge oil field . _North Belridge oil fieldMcDonald anticline oil field (28/
20-18, 20). South Belridge oil field (28/20-24,
28/21-1 9) ; thickness and depth increases in an easterly direc tion away from crest of struc ture.
South Belridge oil field (29/21-3, 12) ; thickness and depth in creases in a southeasterly direc tion parallel to plunge of struc ture.
Cymric oil field (29/21-22, 26) _ _ . .
Elk Hills oil field. _________
Thickness (feet)
3, 000 ±2, 000 ±
5, 000 ±
5, 000 ±
3, 800 ±
2, 800 ±
1,700
2, 600
1,700
3,500
2,400400-900 ± 200 ±
1, 100±
2, 000 ±
800 ±
200 ±600 ±500- 600 500-
1, 100
500- 1, 100
1, 000- 1,500
875-2,950
Depth to base (feet)
3, 000 ±2, 000 ±
6, 300 ±
6, 500 ±
4, 000 ±
2, 800 ±
700-1, 600 ±
1, 200 ±
600- 700 850-
1,400
800- 1,300
1, 300- 1,800
Source of information
Stewart (1946, p. 105).Arnold and Anderson
(1910, p. 149). Woodring and others
(1940, pi. 51, sec. A- A'). Woodring and others
(1940, pi. 51, sec. B-B'). Woodring and others
(1940, pi. 51, sec. C-C'). Woodring and others
(1940, pi. 51, sec. D-D'). Woodring and others
(1940, p. 14). Do.
Do.
Do.
Do.Karjnelich (1951, pi. IV,
sec. C-C'). Ayars (1939, p. 82).
Do.
Wagner (1952, p. 133).
Woodward (1942, pi. 2, sec. A- A').
Dooley (1952, p. 205).Wharton (1943, p. 502).Ritzius (1954, pi. IV, sec.
B-B'). Ritzius (1950, pi. V, sec.
C-C').
Ritzius (1950, pi. Ill, sec.A- A').
Peirce (1947, pis. IV and V, sees. A-A' and B-B').
Woodring and others(1932, p. 25).
reworked sedimentary materials derived from older rocks in the Coast Ranges. Pyroclastic materials are abundant in the lower part of the formation in the Kettleman Hills (Woodring and others, 1940, p. 13) and may be abundant elsewhere.
26 GROUND-WATER CONDITIONS, AVENAL-McKITTRICK AREA, CALIF.
As few wells are known to penetrate the Tulare formation in the Avenal-McKittrick area, its water-bearing properties are not known. However, except in the basal part where brackish connate water may occur, it probably contains water similar in quality to that yielded by wells tapping the alluvium. The subsurface section of the Tulare consists chiefly of discontinuous, lenticular, and commonly elongated bodies of poorly sorted silt, sand, and gravel probably laid down for the most part on extensive alluvial fans by intermittent streams. In general, the deposits become progressively coarser toward their source area in the Coast Ranges. Because of their predominantly fine-grained poorly sorted character and their moderate degree of consolidation, the deposits on the average probably are only moder ately to poorly permeable.
OLD STREAM DEPOSITS
The old stream deposits of this report include remnants of old dissected stream-terrace and alluvial-fan deposits that lie above the floors of present streams and valleys. These deposits in the Kreyen- hagen Hills-Reef Ridge areas and in the Kettleman Hills were mapped as older alluvium by Stewart (1946) and by Woodring and others (1940), respectively. These remnants may correspond or be equivalent to a part of the great thicknesses of older alluvium and younger alluvial deposits beneath the valley floors, which together have been termed the alluvium in this report. Although the old stream deposits in other parts of the Avenal-McKittrick area have not been mapped, they occur in and near the foothills of the Coast Ranges at several levels above the present stream courses.
The old stream deposits in the Kettleman Hills consist of dissected alluvial deposits generally 25 to 150 feet above the present stream beds. They are composed chiefly of silty sand that encloses occa sional lenses or stringers of coarse sand and gravel. The gravel layers consist chiefly of subrounded cobbles and granules of volcanic rocks, brown sandstone, and red, green, and black chert.
The old stream deposits in the Kreyenhagen Hills-Reef Ridge area generally are less than 15 feet thick. They consist chiefly of boulders, gravel, and sand that have been deposited on stream terraces 25 to 150 feet above present stream channels.
As nearly all the old stream deposits shown on the geologic map (pi. 1) occur above the zone of saturation, they are not a source ofground-water supply.
ALLUVIUM
The unit shown as alluvium on the geologic map (pi. 1) includes principally the younger alluvium, whose surface actively receives deposition during the infrequent periods of runoff, and the older alluvium, which in large part is concealed beneath the younger de-
GEOLOGIC FEATURES 27
posits and in small part is exposed around the valley margins and locally in areas where dissection has occurred. The alluvium also is defined to include alluvial-fan deposits around the valley margins and minor areas of dune sand beneath Dudley Ridge and Sand Ridge (pi. 1) at the south end of the Tulare Lake bed.
The alluvium underlying much of the Avenal-McKittrick area consists of a poorly sorted heterogeneous complex of silt and sand enclosing lenses and tongues of coarse sand and gravel. The deposits are coarsest near the mountains and grade into fine materials in the valley. These deposits are lithologically similar to those of the Tulare formation, although as pointed out by Reiche (1950, p. 9) in a discussion of the foothill area along the west side of the San Joaquin Valley west of Tracy, they generally are somewhat coarser, looser, and cleaner than those of the Tulare formation. The char acter and thickness of the alluvium in Kettleman Plain, McLure Valley, and Antelope Valley are shown on plate 2 and by representa tive drillers' logs in table 10.
Although the maximum thickness of the alluvium is unknown, sections presented by Woodring and others (1940, pi. 51) show the alluvium extending to depths as much as 1,500 feet beneath Kettle man Plain. There the deposits rest on the Tulare formation which is of similar composition and lithology. In McLure Valley the continental deposits, chiefly alluvium but possibly including part of the Tulare formation, rest unconformably on semiconsolidated ma rine sediments at depths of 300 to 400 feet below the land surface (pi. 2). Similarly drillers' logs of water wells in Antelope Valley reveal from 200 to 700 feet of continental deposits overlying con solidated rocks of marine origin (pi. 2).
The alluvium of the Avenal-McKittrick area presumably was laid down by intermittent streams of the Coast Ranges under conditions similar to those of the present time. A downstream decrease in carrying power has been and is at present the principal cause of deposition. All the streams tributary to the area have flatter gradi ents in the valley areas than in their mountain watersheds. Ac cordingly, much of the load, including most of the coarse detritus, is carried to and deposited in the valley areas. Loss of flow by seep age to ground water further decreases the carrying power of the streams in the valleys.
In general the streams drop the coarsest part of their load where they issue from the mountains; progressively finer grained mate rials carried by the streams are deposited farther out on the valley floor. Thus, in the lower areas streams of this type tend to build up sloping plains more or less semicircular in outline with their high est points or apexes near the confined channels from which the streams emerge. Because the surfaces formed by this type of de-
28 GROUND-WATER CONDITIONS, AVENAL-McKITTRICK AREA, CALIF.
posit generally have the form of part of a low nearly flat cone, they are called alluvial cones or fans.
The streams generally build up their channels in periods of flood; when they overflow their banks the velocity of the current is checked, and part of the suspended load is deposited near the edge of the channels to form raised banks that are natural levees. When the bottoms of the channels have been built above the adjacent parts of the fans, the streams tend to break out, to take lower courses, and in turn to build them up. Consequently, the principal channels or distributaries on the surfaces of the fans change course frequently as they become choked with alluvial debris in a relatively short time. When the water subsides, erosion takes place and channels may be cut into the surface of the fans for some distance below the mouths of the confined channels. During subsequent periods of flood, new channels are formed, and the gravel beds of the aban doned channels gradually become covered with poorly assorted allu vium deposited by lesser distributaries, sheetfloods, and rill wash; hence, the alluvial-fan deposits as a whole ultimately develop into a thick mass of poorly sorted material containing a branching net work of moderately assorted gravel. These deposits grade laterally into the thick sequence of younger and older alluvium underlying the extensive plains and valleys.
East of the Kettleman and Lost Hills the alluvium is in grada- tional contact with the flood-basin sediments. In most places the contact between the 2 geologic units is poorly defined, and at depth the 2 units interfinger over a relatively wide area.
The alluvium is composed of unconsolidated to loosely consoli dated silt and sand, enclosing lenses of sand and gravel which in large part are saturated with water. Because the coarser deposits for the most part are poorly sorted, their permeability is only mod erate. In general the alluvial-fan deposits, which are very poorly sorted, have a lower permeability than the younger and older allu vium beneath the extensive plains and valleys. In addition, the deeper and older alluvial deposits, which are more compacted and locally cemented, have a lower permeability than the shallower and younger deposits, which are loosely consolidated.
Most of the 344 water wells investigated in the Avenal-McKittrick area in 1951 and 1955 obtained their supply from the alluvium. The wells ranged in depth from about 100 to 1,700 feet and averaged about 400 feet. For the irrigation wells, yields of more than 1,500 gpm (gallons per minute) were uncommon; the average was about 600 gpm (table 7).
FLOOD-BASIN SEDIMENTS
The flood-basin sediments include the lake sediments and other fine-grained materials deposited under sluggish floodwater or lacus-
OCCURRENCE, RECHARGE, AND MOVEMENT 29
trine environments in Tulare Lake and Buena Vista Slough in the trough of the San Joaquin Valley (pi. 3). They are composed chiefly of silt, clay, and fine sand deposited in the still waters of shallow lakes or by sluggish, slow-moving floodwaters. Except near former shorelines where they interfinger with beach-sand and allu vial-fan deposits, the lake sediments consist chiefly of layers of relatively impermeable silt and clay.
The sediments along Buena Vista Slough are composed chiefly of relatively impermeable layers of clay and sandy clay, interbedded with moderately to poorly permeable sand layers. Because of their fine-grained character, the flood-basin sediments generally are poorly permeable and are tapped only by a few stock wells.
GROUND-WATER CONDITIONS
OCCURRENCE, RECHARGE, AND MOVEMENT
In the Avenal-McKittrick area the unconsolidated continental deposits of late Tertiary and Quaternary age constitute the prin cipal source of ground-water supply. The water-bearing deposits consist chiefly of the alluvium and in part the Tulare formation and are substantially more permeable than the consolidated rocks of marine origin that make up the mountainous country west of the valley. The consolidated rocks in general are barriers to ground- water movement and thus form the western boundary and the base of the ground-water body in this part of the San Joaquin Valley.
Ground water generally occurs either under unconfined (water- table) or confined (artesian) conditions. The water table, or surface of an unconfined-water body, is the upper surface of the zone satu rated with water under hydrostatic pressure; it is the level at which the hydrostatic pressure is equal to atmospheric pressure. Above it is the capillary fringe, the lower part of which also may be saturated, but with water at less than atmospheric pressure. Confined water is contained in aquifers overlain by materials of sufficiently low per meability to hold water in the aquifer under artesian pressure. Even the least permeable confining beds in the area permit slow, perhaps inperceptible, movement into or out of confined aquifers. On the other hand, owing to differences in horizontal and vertical permea bility, water bodies that generally are considered to be unconfined may react to fluctuations in pressure due to pumping in much the same manner as confined-water bodies, but the amplitude of such fluctuations will be less.
Because of the heterogeneous character of most unconsolidated al luvial deposits, confinement in them is commonly a matter of degree, and the time element must be considered. In most alluvial deposits there is enough hindrance to the vertical movement of ground water
503194 O 59 3
30 GROUND-WATER CONDITIONS, AVENAL-McKITTRICK AREA, CALIF.
between separate aquifers that differences in head between the aquifers exist during periods of heavy pumping. During periods of little draft, the head in all the aquifers may recover to a level common with water table. Such conditions of occurrence commonly are called semiconfmed, to indicate that, although the aquifers are subject to pressure effects over short periods, the head adjusts to equilibrium with the water table over long periods of time and under steady-state conditions.
In most of the Avenal-McKittrick area, ground water occurs un der unconfined or semiconfined conditions in heterogeneously assorted alluvium. Although confined water has not been recognized in most of the Avenal-McKittrick area, it may occur in the topographic trough of the valley. During a ground-water study made in 1905- 07 Medenhall and others (1916, pi. 1) outlined the area of flow ing wells in the valley. At that time the western boundary of the artesian area, south of Tulare Lake, closely approximated the east ern border of the Avenal-McKittrick area. Several wells drilled along the southwestern border of Tulare Lake basin in the Kettle- man City area before 1921 reportedly discharged small quantities of water of poor quality. Well 25/21-22H1, near Buena Vista Slough, was drilled to a depth of 649 feet before 1919 and report edly had a small flow of water that was too highly mineralized for agricultural use. In July 1951 the water level in the well stood 39.9 feet below the land surface; in November 1955 the casing was open to a depth of 615 feet, and the water level was 66.8 feet below the land surface; and on May 24, 1956 the water level was 62.2 feet below the land surface. The lowering of the water level in this well between July 1951 and November 1955 probably was the result of long-continued heavy withdrawals of water, in excess of replen ishment, from confined deposits in the trough of the valley.
The ultimate source of the ground-water recharge in the Avenal- McKittrick area is precipitation that falls on the valley floor and on the eastern slopes of the Coast Ranges bordering the valley. Replenishment to ground water occurs by seepage loss from streams, by deep penetration of rainfall, by losses of imported water from irrigation canals and ditches, and by deep penetration of the im ported water applied for irrigation in excess of plant requirements.
Seepage loss from intermittent streams draining the Coast Ranges probably is the chief source of recharge to the ground water. Al though most of the streams maintain fairly well-defined drainage channels for some distance east of the valley margins, only the largest maintain drainage courses that reach the axial trough of the valley. The poor definition of the drainage channels indicates that little water leaves the area by surface outflow. Except in times of exceptional floods, most of the surface runoff from the streams is
OCCURRENCE, RECHARGE, AND MOVEMENT 31
lost by seepage into the moderately permeable alluvial deposits over which they flow. Because there are few precipitation stations in the drainage basins tributary to the Avenal-McKittrick area and because there are no gaging stations on the streams, no quantitative estimates of recharge to ground water have been made. However, the tributary drainage basins are small and have meager rainfall. Therefore, it is believed that the mean annual runoff from the basins and recharge to ground water are relatively small.
Deep penetration of rainfall may be a significant source of re charge to the ground-water body when there is ample rainfall. However, in the Avenal-McKittrick area rainfall averages much less than 12 inches per year, which for practical purposes may be considered the lower limit of precipitation below which little deep penetration of rainfall occurs (Blaney, 1933, p. 89). Thus, except for years when rainfall is in excess of about 12 inches (table 1), rainfall is not a significant source of recharge to ground water.
As importations of water to the Avenal-McKittrick area are minor under present development, deep penetration of irrigation water and losses from irrigation canals and ditches represent only minor sources of ground-water recharge.
Plate 3 shows the locations of all water wells investigated and water-level contours for the autumn of 1955. Also shown are the areas irrigated in 1955 and in certain prior years. The altitudes of the water levels in wells were determined from depth-to-water measurements made in October and November 1955, and the water- level contours were drawn from these data. Water-level contours are not shown for much of the area south of U.S. Highway 466 because of the scarcity of wells in which water-level measurements could be made. Where possible, the shape and slope of the ground- water surface are shown by water-level contours drawn at 10-foot intervals. In McLure and Antelope Valleys the water-level con tours were drawn at 50-foot intervals because of the relatively steep gradients in these areas.
Contours drawn on the surface of the water body show its con figuration in much the same way that topographic contours show the shape of the land surface. Ground-water movement is always in the downslope direction and at right angles to the contours. Thus, the contours show the direction of ground-water movement and hence indicate the areas of recharge and discharge.
Except for local pumping depressions, the contours on plate 3 show that in 1955 ground water was moving out of the several valleys through gaps or broad valley mouths and thence eastward toward the San Joaquin Valley. The details of the occurrence and movement of ground water are discussed by subareas of general extent in the following pages. The subareas comprise Kettleman
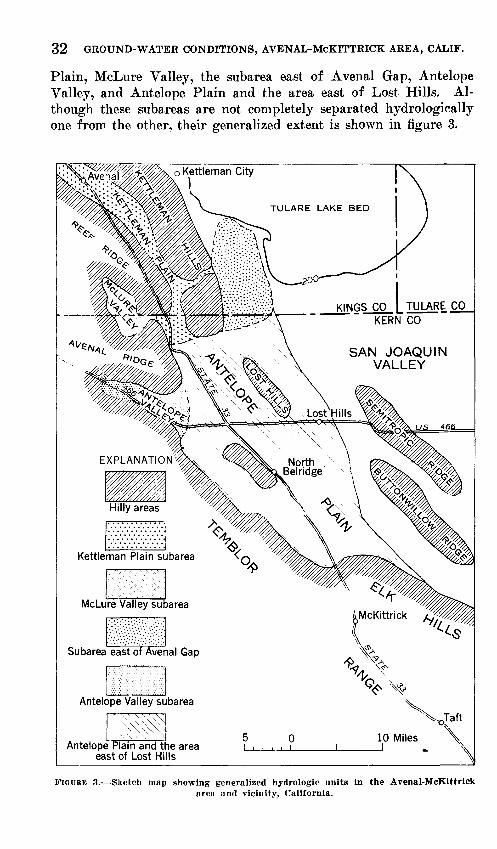
32 GROUND-WATER CONDITIONS, AVENAL-McKITTRICK AREA, CALIF.
Plain, McLure Valley, the subarea east of Avenal Gap, Antelope Valley, and Antelope Plain and the area east of Lost Hills. Al though these subareas are not completely separated hydrologically one f roir> the other, their generalized extent is shown in figure 3.
Subarea east of Avenal Gap
Antelope Plain and the area east of Lost Hills
FIGURE 3. Sketch map showing generalized hydrologic units in the Avenal-McKittrick area and vicinity, California.
OCCURRENCE, RECHARGE, AND MOVEMENT 33
KETTLEMAN PLAIN
The Kettleman Plain subarea includes all of Kettleman Plain, Avenal Gap, and the arm of Antelope Plain that extends northward between the southwestern part of Kettleman Hills and that part of Pyramid Hills south of Dagany Gap.
Occurrence and movement. Ground water in the Kettleman Plain subarea occurs in continental deposits, including the alluvium and the Tulare formation, that range in thickness from a few feet to several thousand feet as shown on geologic sections A A 1 and B B' (pi. 1). These deposits consist chiefly of unconsolidated to slightly consolidated, generally poorly sorted, predominantly silty materials containing lenses and stringers of poorly sorted sand and gravel that yield water to wells. In the irrigated part of Kettleman Plain (south and west of Avenal Gap and east of Dagany Gap) the depths of irrigation wells range from 500 to 1,432 feet (table 7).
Short-term drawdown and recovery tests made by the Pacific Gas and Electric Co. indicate that the yields of wells in the southern part of Kettleman Plain and in the north end of Antelope Plain ranged from less than 300 to about 1,400 gpm and averaged about 800 gpm. Specific capacities J ranged from 6 to 21 gpm per foot of drawdown and averaged about 14 gpm per foot of drawdown.
Although data regarding depths, perforated intervals of rock, and materials penetrated fiuring drilling are not available for many of the wells in this area, drillers report that it is difficult to obtain wells of high yield and that many wells do not yield sufficient water for irrigation purposes and consequently are never completed.
A possible explanation for poorly productive or nonproductive wells in the southern part of this subarea may be seen on geologic sections B-B' and C-C' (pi. 1). These sections show that beneath much of the irrigated area the alluvium ranges in thickness from a few tens of feet to about 800 feet and overlies semiconsolidated rocks of marine origin. These semiconsolidated rocks generally yield little water to wells, and deep wells that tap them probably receive most of their water supply from the overlying alluvium. The geologic sections also show that the Tulare formation underlies the east edge of the irrigated area and much of the alluvial slopes to the east. The easternmost wells in the vicinity of the Devils Den ranch (25/19-7M) may receive part of their water supply from the Tulare formation. If wells were drilled east of the area irrigated in 1955, they might be expected to yield moderate quantities of water, prin cipally from water-bearing beds in the Tulare formation.
1 Specific capacity of a well is the ratio of the yield to the drawdown and generally is expressed in gallons per minute per foot of drawdown.
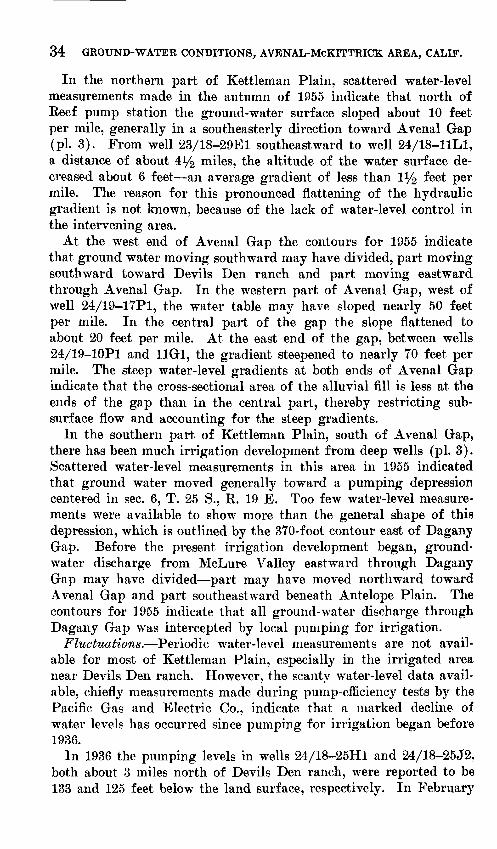
34 GROUND-WATER CONDITIONS, AVENAL-McKITTRICK AREA, CALIF.
In the northern part of Kettleman Plain, scattered water-level measurements made in the autumn of 1955 indicate that north of Keef pump station the ground-water surface sloped about 10 feet per mile, generally in a southeasterly direction toward Avenal Gap (pi. 3). From well 23/18-29E1 southeastward to well 24/18-11L1, a distance of about 4y2 miles, the altitude of the water surface de creased about 6 feet an average gradient of less than iy2 feet per mile. The reason for this pronounced flattening of the hydraulic gradient is not known, because of the lack of water-level control in the intervening area.
At the west end of Avenal Gap the contours for 1955 indicate that ground water moving southward may have divided, part moving southward toward Devils Den ranch and part moving eastward through Avenal Gap. In the western part of Avenal Gap, west of well 24/19-17P1, the water table may have sloped nearly 50 feet per mile. In the central part of the gap the slope flattened to about 20 feet per mile. At the east end of the gap, between wells 24/19-10P1 and 11G1, the gradient steepened to nearly 70 feet per mile. The steep water-level gradients at both ends of Avenal Gap indicate that the cross-sectional area of the alluvial fill is less at the ends of the gap than in the central part, thereby restricting sub surface flow and accounting for the steep gradients.
In the southern part of Kettleman Plain, south of Avenal Gap, there has been much irrigation development from deep wells (pi. 3). Scattered water-level measurements in this area in 1955 indicated that ground water moved generally toward a pumping depression centered in sec. 6, T. 25 S., R. 19 E. Too few water-level measure ments were available to show more than the general shape of this depression, which is outlined by the 370-foot contour east of Dagany Gap. Before the present irrigation development began, ground- water discharge from McLure Valley eastward through Dagany Gap may have divided part may have moved northward toward Avenal Gap and part southeastward beneath Antelope Plain. The contours for 1955 indicate that all ground-water discharge through Dagany Gap was intercepted by local pumping for irrigation.
Fluctuations. Periodic water-level measurements are not avail able for most of Kettleman Plain, especially in the irrigated area near Devils Den ranch. However, the scanty water-level data avail able, chiefly measurements made during pump-efficiency tests by the Pacific Gas and Electric Co., indicate that a marked decline of water levels has occurred since pumping for irrigation began before 1936.
In 1936 the pumping levels in wells 24/18-25H1 and 24/18-25J2, both about 3 miles north of Devils Den ranch, were reported to be 133 and 125 feet below the land surface, respectively. In February
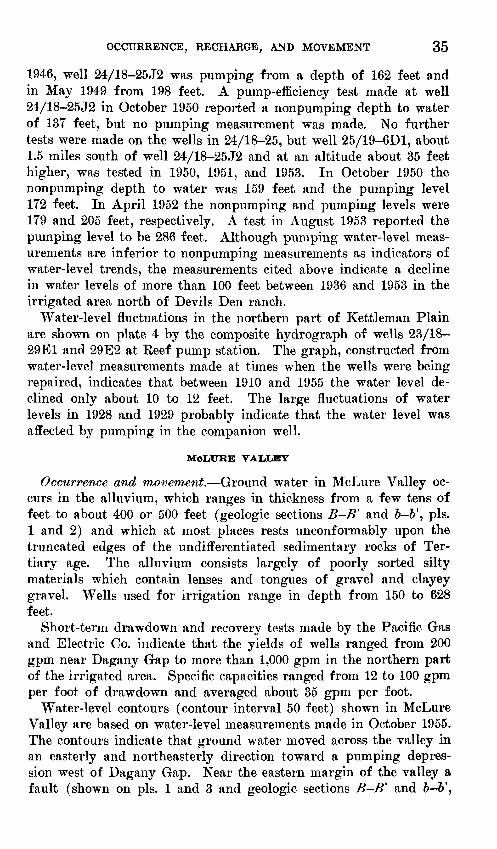
OCCURRENCE, RECHARGE, AND MOVEMENT 35
1946, well 24/18-25J2 was pumping from a depth of 162 feet and in May 1949 from 198 feet. A pump-efficiency test made at well 24/18-25J2 in October 1950 reported a nonpumping depth to water of 137 feet, but no pumping measurement was made. No further tests were made on the wells in 24/18-25, but well 25/19-6D1, about 1.5 miles south of well 24/18-25J2 and at an altitude about 35 feet higher, was tested in 1950, 1951, and 1953. In October 1950 the nonpumping depth to water was 159 feet and the pumping level 172 feet. In April 1952 the nonpumping and pumping levels were 179 and 205 feet, respectively. A test in August 1953 reported the pumping level to be 286 feet. Although pumping water-level meas urements are inferior to nonpumping measurements as indicators of water-level trends, the measurements cited above indicate a decline in water levels of more than 100 feet between 1936 and 1953 in the irrigated area north of Devils Den ranch.
Water-level fluctuations in the northern part of Kettleman Plain are shown on plate 4 by the composite hydrograph of wells 23/18- 29E1 and 29E2 at Keef pump station. The graph, constructed from water-level measurements made at times when the wells were being repaired, indicates that between 1910 and 1955 the water level de clined only about 10 to 12 feet. The large fluctuations of water levels in 1928 and 1929 probably indicate that the water level was affected by pumping in the companion well.
McLTTRE VAUUEY
Occurrence and movement. Ground water in McLure Valley oc curs in the alluvium, which ranges in thickness from a few tens of feet to about 400 or 500 feet (geologic sections B-B' and 5-5', pis. 1 and 2) and which at most places rests unconformably upon the truncated edges of the undifferentiated sedimentary rocks of Ter tiary age. The alluvium consists largely of poorly sorted silty materials which contain lenses and tongues of gravel and clayey gravel. Wells used for irrigation range in depth from 150 to 628 feet.
Short-term drawdown and recovery tests made by the Pacific Gas and Electric Co. indicate that the yields of wells ranged from 200 gpm near Dagany Gap to more than 1,000 gpm in the northern part of the irrigated area. Specific capacities ranged from 12 to 100 gpm per foot of drawdown and averaged about 35 gpm per foot.
Water-level contours (contour interval 50 feet) shown in McLure Valley are based on water-level measurements made in October 1955. The contours indicate that ground water moved across the valley in an easterly and northeasterly direction toward a pumping depres sion west of Dagany Gap. Near the eastern margin of the valley a fault (shown on pis. 1 and 3 and geologic sections B-B 1 and &-&',
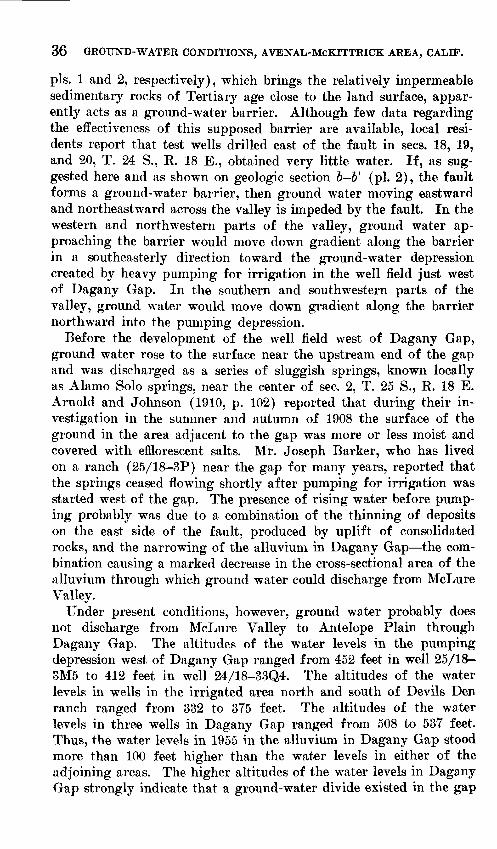
36 GROUND-WATER CONDITIONS, AVENAL-McKITTRICK AREA, CALIF.
pis. 1 and 2, respectively), which brings the relatively impermeable sedimentary rocks of Tertiary age close to the land surface, appar ently acts as a ground-water barrier. Although few data regarding the effectiveness of this supposed barrier are available, local resi dents report that test wells drilled east of the fault in sees. 18, 19, and 20, T. 24 S., E. 18 E., obtained very little water. If, as sug gested here and as shown on geologic section & 6' (pi. 2), the fault forms a ground-water barrier, then ground water moving eastward and northeastward across the valley is impeded by the fault. In the western and northwestern parts of the valley, ground water ap proaching the barrier would move down gradient along the barrier in a southeasterly direction toward the ground-water depression created by heavy pumping for irrigation in the well field just west of Dagany Gap. In the southern and southwestern parts of the valley, ground water would move down gradient along the barrier northward into the pumping depression.
Before the development of the well field west of Dagany Gap, ground water rose to the surface near the upstream end of the gap and was discharged as a series of sluggish springs, known locally as Alamo Solo springs, near the center of sec. 2, T. 25 S., E. 18 E. Arnold and Johnson (1910, p. 102) reported that during their in vestigation in the summer and autumn of 1908 the surface of the ground in the area adjacent to the gap was more or less moist and covered with efflorescent salts. Mr. Joseph Barker, who has lived on a ranch (25/18-3P) near the gap for many years, reported that the springs ceased flowing shortly after pumping for irrigation was started west of the gap. The presence of rising water before pump ing probably was due to a combination of the thinning of deposits on the east side of the fault, produced by uplift of consolidated rocks, and the narrowing of the alluvium in Dagany Gap the com bination causing a marked decrease in the cross-sectional area of the alluvium through which ground water could discharge from McLure Valley.
Under present conditions, however, ground water probably does not discharge from McLure Valley to Antelope Plain through Dagany Gap. The altitudes of the water levels in the pumping depression west of Dagany Gap ranged from 452 feet in well 25/18- 3M5 to 412 feet in well 24/18-33Q4. The altitudes of the water levels in wells in the irrigated area north and south of Devils Den ranch ranged from 332 to 375 feet. The altitudes of the water levels in three wells in Dagany Gap ranged from 508 to 537 feet. Thus, the water levels in 1955 in the alluvium in Dagany Gap stood more than 100 feet higher than the water levels in either of the adjoining areas. The higher altitudes of the water levels in Dagany Gap strongly indicate that a ground-water divide existed in the gap
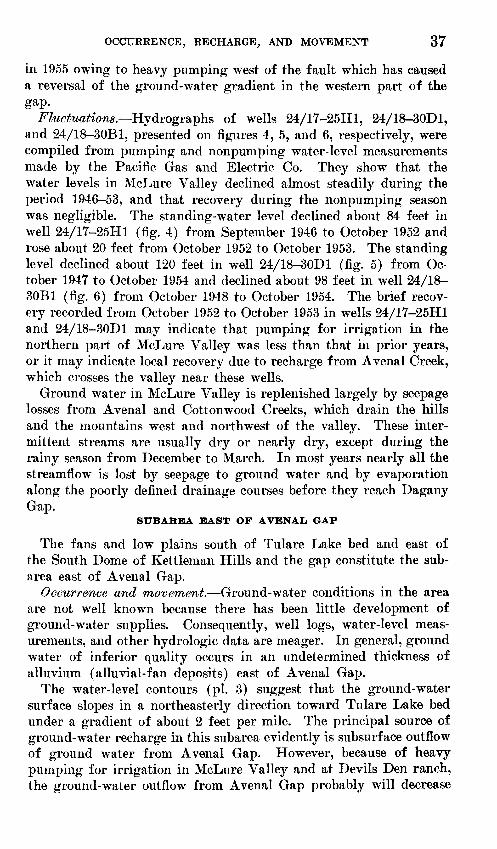
OCCURRENCE, RECHARGE, AND MOVEMENT 37
in 1955 owing to heavy pumping west of the fault which has caused a reversal of the ground-water gradient in the western part of the gap.
Fluctuations. Hydrographs of wells 24/17-25H1, 24/18-30D1, and 24/18 30B1, presented on figures 4, 5, and 6, respectively, were compiled from pumping and nonpumping water-level measurements made by the Pacific Gas and Electric Co. They show that the water levels in McLure Valley declined almost steadily during the period 1946 53, and that recovery during the nonpumping season was negligible. The standing-water level declined about 84 feet in well 24/17-25H1 (fig. 4) from September 1946 to October 1952 and rose about 20 feet from October 1952 to October 1953. The standing level declined about 120 feet in well 24/18-30D1 (fig. 5) from Oc tober 1947 to October 1954 and declined about 98 feet in well 24/18- 30B1 (fig. 6) from October 1948 to October 1954. The brief recov ery recorded from October 1952 to October 1953 in wells 24/17-25H1 and 24/18-30D1 may indicate that pumping for irrigation in the northern part of McLure Valley was less than that in prior years, or it may indicate local recovery due to recharge from Avenal Creek, which crosses the valley near these wells.
Ground water in McLure Valley is replenished largely by seepage losses from Avenal and Cottonwood Creeks, which drain the hills and the mountains west and northwest of the valley. These inter mittent streams are usually dry or nearly dry, except during the rainy season from December to March. In most years nearly all the streamflow is lost by seepage to ground water and by evaporation along the poorly defined drainage courses before they reach Dagany Gap.
SUBAREA EAST OF AVENAL GAP
The fans and low plains south of Tulare Lake bed and east of the South Dome of Kettleman Hills and the gap constitute the sub- area east of Avenal Gap.
Occurrence and movement. Ground-water conditions in the area are not well known because there has been little development of ground-water supplies. Consequently, well logs, water-level meas urements, and other hydrologic data are meager. In general, ground water of inferior quality occurs in an undetermined thickness of alluvium (alluvial-fan deposits) east of Avenal Gap.
The water-level contours (pi. 3) suggest that the ground-water surface slopes in a northeasterly direction toward Tulare Lake bed under a gradient of about 2 feet per mile. The principal source of ground-water recharge in this subarea evidently is subsurface outflow of ground water from Avenal Gap. However, because of heavy pumping for irrigation in McLure Valley and at Devils Den ranch, the ground-water outflow from Avenal Gap probably will decrease
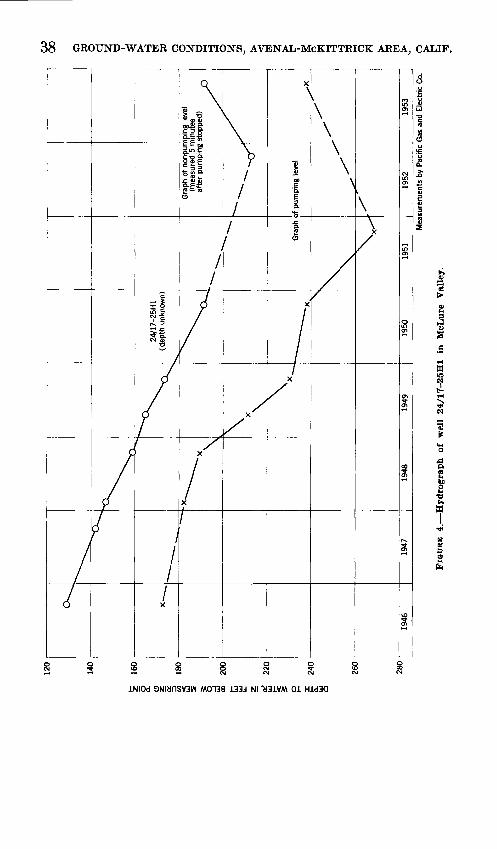
DEPTH TO WATER, IN FEET BELOW MEASURING POINT
ro ro ro H; i § 8 8 8 S
\\i
i&
\\
$5* a-2
'vaHV'8^010,10^00
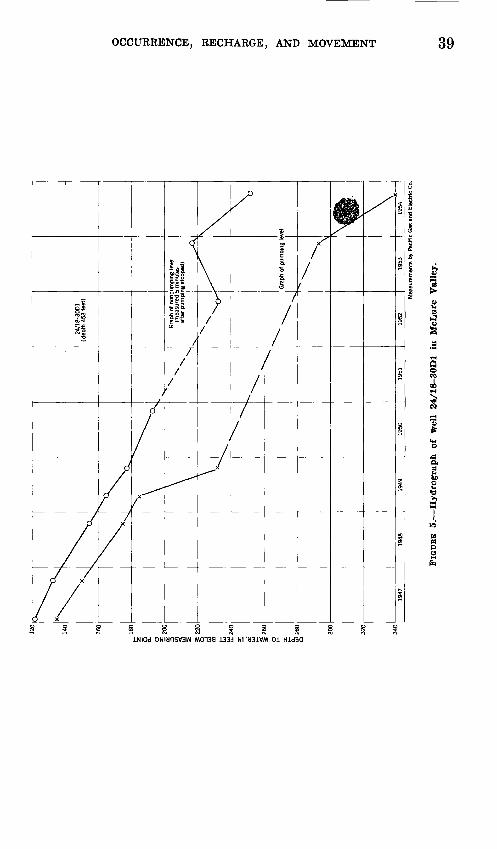
OCCURRENCE, KECHARGE, AND MOVEMENT 39
L
I-f
~7
INIOd 9NiaflSV3W W0139 133J Nl 'a31V«l 01 Hld3Q
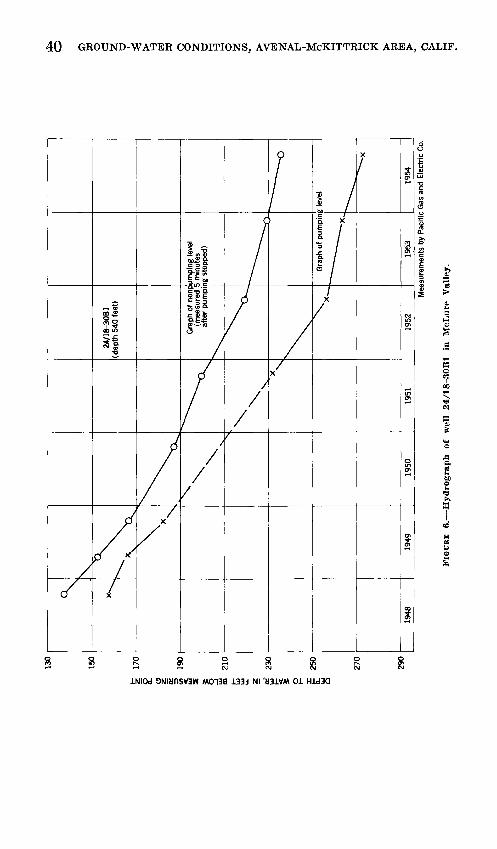
130
150
170
190
m
210
230
250
270
290
1948
1949
1950
1951
Z4/
18-3
0B1
(dep
th 5
40 fe
et)
Gra
ph o
f no
npum
ping
leve
l (m
easu
red
5 m
inut
es
afte
r pu
mpi
ng s
topp
ed)
1952
I le
vel
1953
1954
Mea
sure
men
ts b
y Pa
cifi
c G
as a
nd E
lect
ric
Co.
FIG
UR
E
6.
Hy
dro
gra
ph
of
wel
l 24/1
8-3
0B
1
in
McL
ure
V
all
ey.
W
OCCURRENCE, RECHARGE, AND MOVEMENT 41
with time. The contours for 1955 indicate that ground water drain ing through the alluvium in the northern part of Kettleman Plain may have constituted the principal source of supply to the alluvium in Avenal Gap. However, in time it is likely that the ground-water depression created by pumping in the southern part of Kettleman Plain will expand sufficiently to intercept part or all of the ground water that otherwise would discharge through the gap.
Because of the poor quality of ground water (p. 56-57) east of Avenal Gap, most of the water used for irrigation is imported through an unlined canal from sources east and northeast of the area of investigation. Some of the water is diverted from Tulare Lake and some is pumped from a well field near the Tule Eiver north of Angiola (shown on the U.S. Geological Survey Alpaugh and Taylor Weir quadrangle maps).
Fluctuations. Little is known about the fluctuations of water levels in this subarea. Water-level measurements made in October 1955 and in May 1956 in unused large-diameter gravel-packed wells 24/19-2Q1 and 12N1 indicate that the water levels fluctuated less than 0.5 foot in well 2Q1 and about 2 feet in well 12N1. Water- level measurements made in old stock wells 24/19-12G1 and 24/20- 9K1 are shown in the following table. The measurements in the 2 unused irrigation wells and the 2 old stock wells suggest that there has been little change in water levels in this subarea in the years 1951-56.
Well
24/19-12G1-. __.____._..___ ___. . __. -----24/20-9K1..- _ ._.
Water level (in feet below land surface); datum for
June 1951
77. 8 32. 9
October 1955
33. 2
May 1956
76. 8 33. 1
ANTELOPE VAILLEY
Occurrence and movement. Ground water in Antelope Valley occurs in alluvium which unconformably overlies sedimentary rocks of Cretaceous and Tertiary age. The thickness and lithologic char acter of the alluvium as interpreted from drillers' logs of wells are shown on geologic sections c c and d-d' (pi. 2), which show that the alluvial deposits are composed mostly of silt, clay, and gravel. They range in thickness from a few tens of feet near the valley mar gins to about 300 feet in the central part of the valley. Their satu rated thickness in autumn 1955 ranged from about 60 feet in well 26/18-14E1 to about 120 feet in well 26/17-11K1 and averaged about 100 feet. Wells used for irrigation range in depth from 185 to 1,200 feet (table 7).
42 GROUND-WATER CONDITIONS, AVENAL-McKITTRICK AREA, CALIF.
Short-term drawdown and recovery tests made in 1951 by the Pacific Gas and Electric Co. indicate that the yield of wells ranged from 160 to 700 gpm and averaged less than 350 gpm. At that time pumping drawdowns ranged from 20 to 70 feet and averaged about 40 feet. Specific capacities ranged from 4 to 23 gpm per foot of drawdown and averaged about 10 gpm per foot. Because of de creasing yields since that time, pumps of smaller capacity and elec tric motors of less horsepower have been installed on many of the wells.
Water-level measurements made in irrigation wells during October 1955 indicate that, because of heavy pumping for irrigation, a steep cone-shaped depression has formed. The deepest depression is near well 26/18-22G1, in which the water level was 439 feet above sea level. Water-level contours (pi. 3) indicate that in the western part of the valley between wells 26/17-11F1 and 26/18-18F3 the gra dient was about 25 feet per mile to the east-southeast. Between wells 26/18-18F3 and 16E1 the gradient steepened to about 120 feet per mile; between wells 26/18-16E1 and 22G1, near the center of the cone-shaped depression, it flattened to about 50 feet per mile. North and east of well 26/18-22G1 the gradient was between 50 and 60 feet per mile toward the depression, and to the south it was about 90 feet per mile. Thus, the contours show that in 1955 there was no ground-water discharge to Antelope Plain from Antelope Valley; rather, the gradient was reversed and ground water was moving westward into the pumping depression from beneath the west side of Antelope Plain.
The difference in water levels between wells 26/18-18F4 and 26/18-18G1, 51 feet in a distance of less than 500 feet, suggests either a marked reduction in thickness of the water-bearing deposits or a concealed fault that forms a ground-water barrier. The geo logic map (pi. 1) indicates 2 known faults in the consolidated rocks to the south, either or both of which may extend northward beneath the alluvium and between the 2 wells.
Fluctuations. Although no periodic water-level measurements are available for Antelope Valley, measurements made by the Geological Survey in June 1951 and May 1956 indicate a general decline of water levels during the period. Comparison of depth to water in 12 wells measured in 1951 and 1956 show a rise of water level in only 1 well, 26/18-14R2; in all other wells there were declines, ranging from 2.3 feet in well 26/18-11K1 to 40.1 feet in well 26/18-14N1. The average decline for the 12 wells was about 14 feet, or nearly 3 feet per year.
OCCURRENCE, RECHARGE, AND MOVEMENT 43
ANTELOPE PLAIN AND AREA EAST OF LOST HILLS
Antelope Plain and the western slope of the San Joaquin Valley east of Lost Hills include the greater part of the valley lands in the Avenal-McKittrick area. Despite the large size of the area, little information is available regarding ground-water conditions. This area is characterized by low rainfall, ground water of inferior qual ity, no imported surface-water supplies, and high concentrations of salts in the soil and subsoil. Accordingly, there has been little agri cultural development in this vast area. For the most part the land is used only for grazing, and that only during the winter and spring. Records are available on the industrial wells drilled to supply water to widely scattered oil-pumping stations; otherwise, the few wells in the area are mostly stock wells drilled many years ago for which little or no information is available.
Occurrence and movement. In Antelope Plain and the western slope of the valley east of Lost Hills, ground water occurs in the alluvium and in the underlying Tulare formation. Because of the similarity of the lithology of these units, they are virtually indis tinguishable in the subsurface. In general the water-bearing deposits consist of lenses and stringers of sand and gravel enclosed in pre dominantly poorly sorted silty materials.
Wells in Antelope Valley penetrate more coarse water-bearing material than do the wells in Antelope Plain. Thus, the average grain size decreases valleyward with increasing distance from the source of the deposits. However, just east of the southern part of Antelope Plain, wells in the axial trough of the San Joaquin Valley yield large quantities of water from sands deposited by the Kern River. Some of these sands probably extend into the Avenal- McKittrick area, but their westerly extent is not known.
The data on the thickness of the water-bearing deposits, chiefly from electric logs of oil-test wells, suggests that sediments in most of the Antelope Plain area contain waters of high conductivity. These waters are presumably of marine origin and are within less than 1,000 feet of land surface. Locally, however, particularly near Lokern, northeast of the Elk Hills, and near the Junction pump station in the northern part of Antelope Plain, the waters of high specific conductance are found at greater depths.
The electric log of an oil well drilled in sec. 26, T. 29 S., R. 22 E., about 2 miles southwest of Lokern, recorded reasonably fresh water in continental deposits to a depth of about 1,500 feet. Between about 1,500 and 2,000 feet the deposits contained water of progres sively higher conductivity, which was apparently transitional between the fresher water above and the marine water below.
Electric logs of several oil tests drilled in sees. 27 and 28, T. 26 S., R. 19 E., about 2 miles east of Junction pump station, indicate that
44 GROUND-WATER CONDITIONS, AVENAL-McKITTRICK AREA, CALIF.
fresh waters overlie highly conductive waters with only a thin tran sitional zone at about 1,300 to 1,400 feet below land surface.
Because of the scarcity of hydrologic data, little is known about the movement of ground water in much of Antelope Plain. Al though the general movement of ground water is in a northeasterly direction from recharge areas along the western border of the valley toward Buena Vista Slough in the trough of the San Joaquin Valley, it probably is interrupted or deflected in several places by southeast ward-trending anticlinal structures, such as the Lost Hills. The water-level contours for 1955 (pi. 3) suggest that in the northern part of Antelope Plain ground water moved in a northeasterly direc tion between the south end of the Kettleman Hills and the north end of the Lost Hills toward Buena Vista Slough. The gradients were about 17 feet per mile between wells 25/19-25B1 and 25/20- 19G1, about 28 feet per mile between wells 25/20-19G1 and 25/20- 15Q1, and about 21 feet per mile between wells 25/20-19G1 and 25/20-4C1.
The Lost Hills anticlinal structure probably acts at least as a partial barrier to the northeasterly movement of ground water. The presence of gypsite deposits along the west side of Lost Hills (Ver- Planck, 1952, p. 53) suggests that at an earlier geologic time the barrier effect of the Lost Hills anticlinal structure may have caused ground water to rise to or nearly to the land surface.
Fluctuations. The hydrographs presented on plate 4 are based on miscellaneous water-level measurements in wells 25/19-20Q1-3 at Temblor pump station and in wells 2T/20-34G1 and 34P1-2 at Cameras pump station; they show the water-level fluctuations in the northern and southern parts of Antelope Plain, respectively. The hydrograph of well 25/19-20Q1 at Temblor pump station shows that the water level rose about 55 feet from 1928 to 1941 and then declined about 60 feet to 1951. However, it is possible that the exceptionally high water level recorded in September 1941 may have been an error. The relatively flat graphs for wells 27/20-34G1 and 34P1-2 at Cameras pump station suggest that there has been very little depletion of ground water in storage in this part of the area.
Periodic measurements made in a well near the center of sec. 22, T. 26 S., R. 21 E. (possibly well 26/21-22G2), by the U.S. Bureau of Reclamation between January 1945 and September 1954 show that annual water-level fluctuations in the area east of Lost Hills ranged from less than a foot in 1946 and 1947 to a maximum of 7.6 feet in 1950. Depths to water of 49 feet in February 1954 and 53 feet in September 1954 showed an annual fluctuation of at least 4 feet in that year.
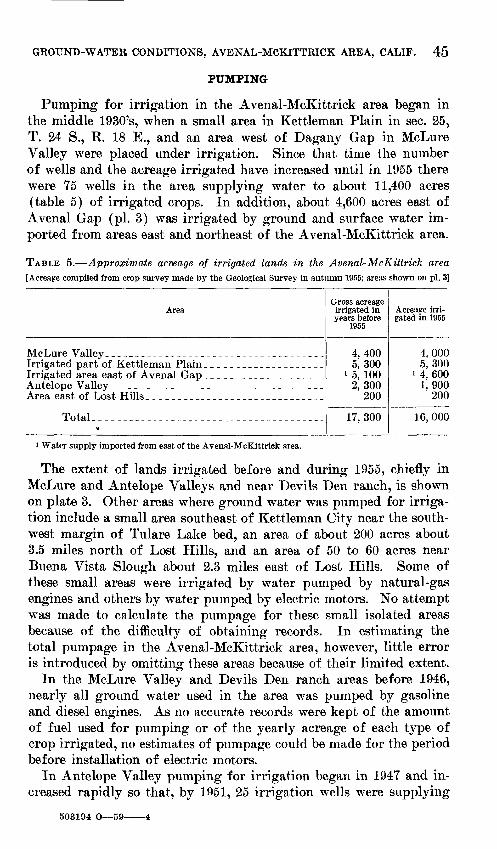
GROUND-WATER CONDITIONS, AVENAL-MCKITTRICK AREA, CALIF. 45
PUMPING
Pumping for irrigation in the Avenal-McKittrick area began in the middle 1930's, when a small area in Kettleman Plain in sec. 25, T. 24 S., R. 18 E., and an area west of Dagany Gap in McLure Valley were placed under irrigation. Since that time the number of wells and the acreage irrigated have increased until in 1955 there were 75 wells in the area supplying water to about 11,400 acres (table 5) of irrigated crops. In addition, about 4,600 acres east of Avenal Gap (pi. 3) was irrigated by ground and surface water im ported from areas east and northeast of the Avenal-McKittrick area.
TABLE 5. Approximate acneage of irrigated lands in the Avenal-McKittrick area [Acreage compiled from crop survey made by the Geological Survey in autumn 1955; areas shown on pi. 3]
Area
McLure ValleyIrrigated part of Kettleman Plain _Irrigated area east of Avenal GapAntelope ValleyArea east of Lost Hills
Total. . .
Gross acreage irrigated in years before
1955
4,4005,300
i 5, 1002, 300
200
17, 300
Acreage irri gated in 1955
4,0005,300
1 4, 6001, 900
200
16, 000
i Water supply imported from east of the Avenal-McKittrick area.
The extent of lands irrigated before and during 1955, chiefly in McLure and Antelope Valleys and near Devils Den ranch, is shown on plate 3. Other areas where ground water was pumped for irriga tion include a small area southeast of Kettleman City near the south west margin of Tulare Lake bed, an area of about 200 acres about 3.5 miles north of Lost Hills, and an area of 50 to 60 acres near Buena Vista Slough about 2.3 miles east of Lost Hills. Some of these small areas were irrigated by water pumped by natural-gas engines and others by water pumped by electric motors. No attempt was made to calculate the pumpage for these small isolated areas because of the difficulty of obtaining records. In estimating the total pumpage in the Avenal-McKittrick area, however, little error is introduced by omitting these areas because of their limited extent.
In the McLure Valley and Devils Den ranch areas before 1946, nearly all ground water used in the area was pumped by gasoline and diesel engines. As no accurate records were kept of the amount of fuel used for pumping or of the yearly acreage of each type of crop irrigated, no estimates of pumpage could be made for the period before installation of electric motors.
In Antelope Valley pumping for irrigation began in 1947 and in creased rapidly so that, by 1951, 25 irrigation wells were supplying
503194 O 59-
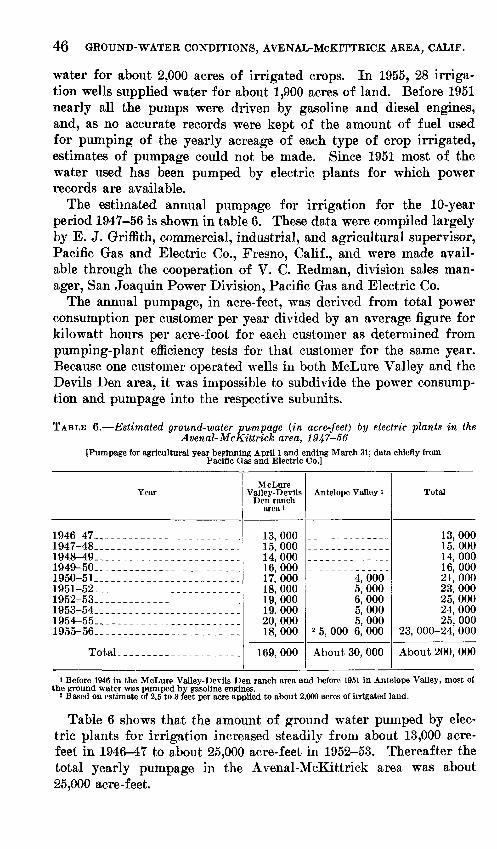
46 GROUND-WATER CONDITIONS, AVENAL-McKITTRICK AREA, CALIF.
water for about 2,000 acres of irrigated crops. In 1955, 28 irriga tion wells supplied water for about 1,900 acres of land. Before 1951 nearly all the pumps were driven by gasoline and diesel engines, and, as no accurate records were kept of the amount of fuel used for pumping of the yearly acreage of each type of crop irrigated, estimates of pumpage could not be made. Since 1951 most of the water used has been pumped by electric plants for which power records are available.
The estimated annual pumpage for irrigation for the 10-year period 1947-56 is shown in table 6. These data were compiled largely by E. J. Griffith, commercial, industrial, and agricultural supervisor, Pacific Gas and Electric Co., Fresno, Calif., and were made avail able through the cooperation of V. C. Redman, division sales man ager, San Joaquin Power Division, Pacific Gas and Electric Co.
The annual pumpage, in acre-feet, was derived from total power consumption per customer per year divided by an average figure for kilowatt hours per acre-foot for each customer as determined from pumping-plant efficiency tests for that customer for the same year. Because one customer operated wells in both McLure Valley and the Devils Den area, it was impossible to subdivide the power consump tion and pumpage into the respective subunits.
TABLE 6. Estimated ground-water pumpage (in acre-feet) by electric plants in the Avenal-McKittrick area, 1947-56
[Pumpage for agricultural year beginning April 1 and ending March 31; data chiefly from Pacific Gas and Electric Co.]
Year
1946-47...1947-48_____-________ _ _______1948-49__. _______ _______________1949-50___ ______________________1950-51_. . ___ _1951-52____________________ _ _1952-53_.__ _____________________1953-54____-_-_____.1954-55_______ __________________1955-56_____-_-_.______ _ _ _ __
Total__-_----._______ ____
McLure Valley-Devils
Den ranch area '
13, 00015, 00014, 00016, 00017, 00018, 00019, 00019. 00020, 00018, 000
169, 000
Antelope Valley '
4,0005,0006,0005,0005,000
2 5, 000-6, 000
About 30, 000
Total
13, 00015, 00014, 00016, 00021, 00023, 00025, 00024, 00025, 000
23, 000-24, 000
About 200, 000
1 Before 1946 in the McLure Valley-Devils Den ranch area and before 1951 in Antelope Valley, most of the ground water was pumped by gasoline engines.
2 Based on estimate of 2.5 to 3 feet per acre applied to about 2,000 acres of irrigated land.
Table 6 shows that the amount of ground water pumped by elec tric plants for irrigation increased steadily from about 13,000 acre- feet in 1946-47 to about 25,000 acre-feet in 1952-53. Thereafter the total yearly pumpage in the Avenal-McKittrick area was about 25,000 acre-feet.
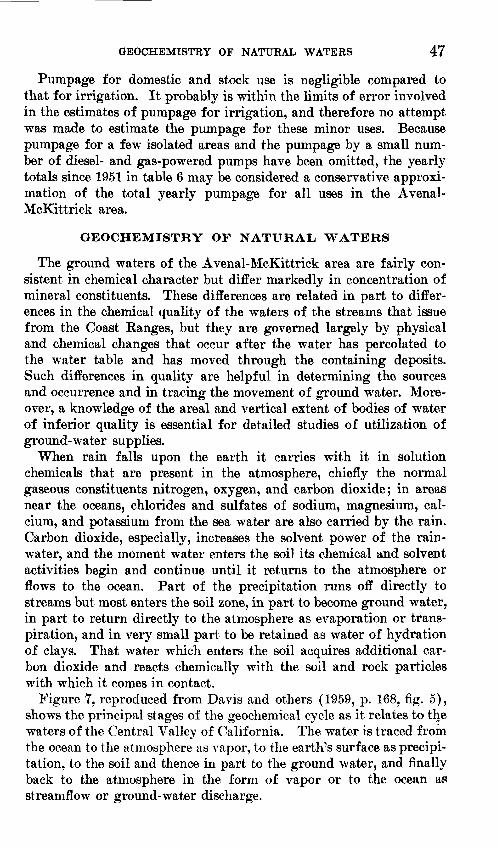
GEOCHEMISTRY OF NATURAL WATERS 47
Pumpage for domestic and stock use is negligible compared to that for irrigation. It probably is within the limits of error involved in the estimates of pumpage for irrigation, and therefore no attempt was made to estimate the pumpage for these minor uses. Because pumpage for a few isolated areas and the pumpage by a small num ber of diesel- and gas-powered pumps have been omitted, the yearly totals since 1951 in table 6 may be considered a conservative approxi mation of the total yearly pumpage for all uses in the Avenal- McKittrick area.
GEOCHEMISTRY OF NATURAL WATERS
The ground waters of the Avenal-McKittrick area are fairly con sistent in chemical character but differ markedly in concentration of mineral constituents. These differences are related in part to differ ences in the chemical quality of the waters of the streams that issue from the Coast Ranges, but they are governed largely by physical and chemical changes that occur after the water has percolated to the water table and has moved through the containing deposits. Such differences in quality are helpful in determining the sources and occurrence and in tracing the movement of ground water. More over, a knowledge of the areal and vertical extent of bodies of water of inferior quality is essential for detailed studies of utilization of ground-water supplies.
When rain falls upon the earth it carries with it in solution chemicals that are present in the atmosphere, chiefly the normal gaseous constituents nitrogen, oxygen, and carbon dioxide; in areas near the oceans, chlorides and sulfates of sodium, magnesium, cal cium, and potassium from the sea water are also carried by the rain. Carbon dioxide, especially, increases the solvent power of the rain water, and the moment water enters the soil its chemical and solvent activities begin and continue until it returns to the atmosphere or flows to the ocean. Part of the precipitation runs off directly to streams but most enters the soil zone, in part to become ground water, in part to return directly to the atmosphere as evaporation or trans piration, and in very small part to be retained as water of hydration of clays. That water which enters the soil acquires additional car bon dioxide and reacts chemically with the soil and rock particles with which it comes in contact.
Figure 7, reproduced from Davis and others (1959, p. 168, fig. 5), shows the principal stages of the geochemical cycle as it relates to the waters of the Central Valley of California. The water is traced from the ocean to the atmosphere as vapor, to the earth's surface as precipi tation, to the soil and thence in part to the ground water, and finally back to the atmosphere in the form of vapor or to the ocean as streamflow or ground-water discharge.
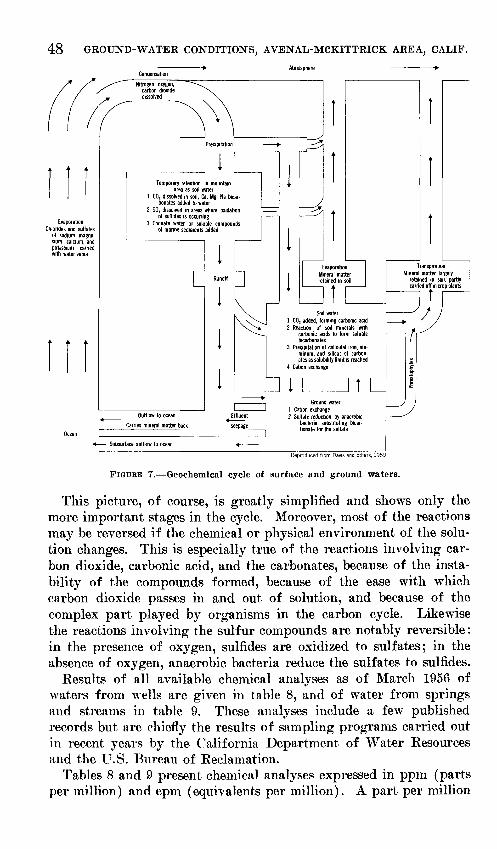
48 GROUND-WATER CONDITIONS, AVENAL-MCKITTRICK AREA, CALIF.
Evaporation Chlorides and sutfates
of sodium, magne sium, calcium, and potassium carried with water vapor
Temporary retention in mountain area as soil water
1 CO, dissolved in soil, Ca, Mg, Na bicar- bonates added to water
2 SO, dissolved in areas where oxidation of sulfides is occurring
3 Connate water or soluble compounds of marine sediments added
Outflow to ocean
Carries mineral matter back
Soil water1 CO, added, forming carbonic acid2 Reaction of soil minerals with
carbonic acids to form soluble bicarbonates
3 Precipitation of colloidal iron, alu minum, and silica; of carbon ates as solubility limit is reached
4 Cation exchange
Ground water1 Cation exchange2 Sulfate reduction by anaerobic
bacteria, substituting bicar bonate for the sulfate
Subsurface outflow to ocean
FIGURE 7. Geochemlcal cycle of surface and ground waters.
This picture, of course, is greatly simplified and shows only the more important stages in the cycle. Moreover, most of the reactions may be reversed if the chemical or physical environment of the solu tion changes. This is especially true of the reactions involving car bon dioxide, carbonic acid, and the carbonates, because of the insta bility of the compounds formed, because of the ease with which carbon dioxide passes in and out of solution, and because of the complex part played by organisms in the carbon cycle. Likewise the reactions involving the sulfur compounds are notably reversible: in the presence of oxygen, sulfides are oxidized to sulf ates; in the absence of oxygen, anaerobic bacteria reduce the sulf ates to sulfides.
Results of all available chemical analyses as of March 1956 of waters from wells are given in table 8, and of water from springs and streams in table 9. These analyses include a few published records but are chiefly the results of sampling programs carried out in recent years by the California Department of Water Resources and the U.S. Bureau of Reclamation.
Tables 8 and 9 present chemical analyses expressed in ppm (parts per million) and epm (equivalents per million). A part per million
GEOCHEMISTRY OF NATURAL WATERS 49
is a unit weight of a constituent in a million unit weights of solution. An equivalent per million is an expression of the concentration of a constituent in terms of chemical equivalents or combining weights. Parts per million may be converted to equivalents per million by dividing the concentration of each constituent, in parts per million, by the equivalent weight (combining weight) of the constituent or ion. The equivalent weight is the atomic or molecular weight of an element or ion divided by the valence. Percentage reacting value of total cations or anions is calculated from the analytical statement in equivalents and is a ratio, expressed in percent, of each cation or anion to the sum of the cations or anions, respectively.
Eepresentative analyses are presented in graphic form on a geo- chemical map (pi. 5) and geochemical graphs (figs. 8-10). The map shows the areal distribution of surface and ground waters with respect to chemical character and concentration. The geochemical graphs show the chemical character in terms of relative proportions of the cations (basic ions) and anions (acid ions). The anions are shown in the lower right triangle, the cations in the lower left. The single-point plots in the diamond field provide a means for distin guishing waters of different character. The diagram is one utilized and described by Piper (1945).
In this report the terms describing the general chemical character of a water are used in particular senses, as in the following examples: (1) "calcium bicarbonate" designates a water in which calcium amounts to 50 percent or more of the cations and bicarbonate to 50 percent or more of the anions, in epm; (2) "sodium calcium bicar bonate" designates a water in which sodium and calcium are first and second in order of abundance among the cations but neither amounts to 50 percent of all the cations; and (3) "sodium sulfate bicarbonate" designates a water in which sulfate and bicarbonate are first and second in order of abundance among the anions, as above. A water described as being of "intermediate cation composition" is one in which the three principal cations are present in approximately equal proportions. Likewise, the description "intermediate anion composition" indicates that the three principal anions are present in approximately equal proportions.
SURFACE WATERS
The streams tributary to the Avenal-McKittrick area are notable for their small and flashy discharge. Because of the difficulty of sampling these streams, only a few analyses, reported in table 9 and illustrated on plate 5 and figure 8, are available for study.
The surface waters of the area may be divided into two general groups on the basis of their chemical character: (1) The waters of Avenal and Polonio Creeks, as indicated by the available analyses,
50 GROUND-WATER CONDITIONS, AVENAL-McKITTRICK AREA, CALIF.
contain much less dissolved mineral matter and proportionally less sulfate but more magnesimum than (2) the waters of Bitterwater, Media Agua, and Carneros Creeks. All these streams were sampled during January 25 to 28, 1952, so it is assumed that comparable stages of flow existed and that there were no great differences in chemical quality related to the time and duration of the runoff. The samples range in dissolved solids from 530 ppm in the water of Avenal Creek to 3,200 ppm in the water of Bitterwater Creek.
The water of Avenal Creek, sampled in January 1952 at an esti mated flow of 18 cfs (cubic feet per second) was a bicarbonate sul fate water of intermediate cation composition. However, a sample taken 2 years later, on January 26, 1954, at a flow of 0.2 cfs showed that the water was of the sulfate bicarbonate type and of lower mineral content than the sample of January 1952 (table 9). The water of Polonio Creek, like that of Avenal Creek, is relatively low in dissolved mineral matter; on January 25, 1952, it contained 540 ppm of dissolved solids. It was a calcium-sodium water of inter mediate anion composition.
In contrast, the waters of Bitterwater, Media Agua, and Carneros Creeks are characterized by concentrations of dissolved solids in excess of 1,500 ppm and by the fact that sulfate constitutes about 80 percent or more of the anion total (fig. 8). Calcium is the pre dominant cation in the water of Bitterwater Creek, but the waters of Media Agua and Carneros Creeks are of calcium and sodium calcium composition, respectively. Although sulfate is the predomi nant anion in these waters, the concentration of bicarbonate neverthe less is about the same as in the waters of Avenal and Polonio Creeks. The chloride content, however, is substantially higher in these sulfate waters, ranging from 90 to 160 ppm, compared to 14 to 42 ppm in the samples from Avenal and Polonio Creeks.
The differences in chemical character and concentration of the surface waters of the Avenal-McKittrick area appear to be related chiefly to differences in lithology of the rocks of the respective drainage basins. The most distinctive differences are in the relative concentrations of the anions, but the waters of Avenal and Polonio Creeks show significant differences from those of other streams in relative concentration of magnesium as well.
Plate 1 and Kundert's geologic map of California (1955), show that Avenal and Polonio Creeks, the two streams in which sulfate is relatively unimportant, drain terranes formed predominantly by marine sediments of Cretaceous age and by sedimentary, igneous, and metamorphic rocks of the Franciscan formation of Jurassic and Cretaceous age. On the other hand, Bitterwater, Media Agua, and Carneros Creeks, the streams characterized by waters of high sulfate
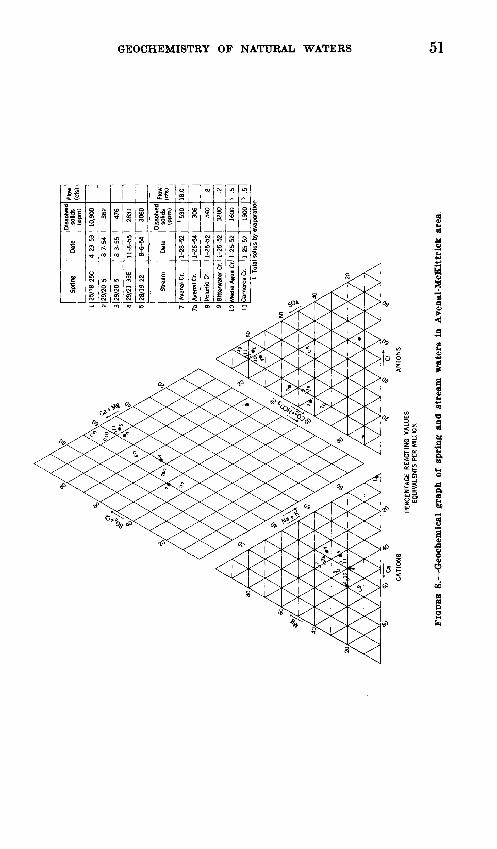
Spr
ing
25/1
8-25
C
29/2
0-5
29/2
0-5
29/2
1-33
E
28/1
9-22
Stre
am
Ave
nal C
r.
Ave
nal C
r.
Pol
onio
Cr.
Bitt
erw
ater
Cr.
Med
ia A
gua
Cr
Car
nero
s Cr
.
Dat
e
4-23
-53
8-7-
54
8-3-
55
11-8
-55
8-6-
54
Dat
e
1-28
-52
1-26
-54
1-25
-52
1-25
-52
1-25
-52
1-25
-52
Dis
solv
ed
solid
s (p
pm)
10,9
00 362
476
2831
3060
Dis
solv
ed
solid
s (p
pm)
J530 30
6
540
3200
1600
1900
Flow
(c
fs)
Flow
(c
fs)
18.0 .8 .2
> .5
> .5
Tota
l sol
ids
by e
vapo
ratio
ng d
PER
CEN
TAG
E R
EA
CTI
NG
V
ALU
ES
EQ
UIV
ALEN
TS P
ER M
ILLI
ON
FIG
UR
E 8. G
eoch
emic
al g
raph
of
spri
ng a
nd s
trea
m w
ater
s in
Ave
nal-
McK
ittr
ick
area
.
52 GROUND-WATER CONDITIONS, AVENAL-McKITTRICK AREA, CALIF.
content, drain terranes formed predominantly by marine and conti nental sedimentary rocks of Tertiary and Quaternary age.
The stream waters have little consistency in cation content, except that the waters of Avenal, Polonio, and Carneros Creeks contain relatively more magnesium than those of Bitterwater and Media Agua Creeks. (See fig. 8.)
The bicarbonate in the stream waters presumably is derived largely from the atmosphere either as carbon dioxide dissolved in rain or as a product of the decay of organic matter. However, the calcium carbonate cement of marine sandstones, which form a substantial part of the Mesozoic section, may contribute appreciable quantities of bicarbonate to the stream waters. The sulfate, so prominent in some of the waters, presumably was supplied initially by the oxida tion of sulfides, especially pyrite (iron sulfide), present in organic marine deposits of Tertiary age. Undoubtedly, much of the sulfate is derived directly from gypsiferous continental deposits of late Tertiary and early Quaternary age, but the gypsum of these sedi ments probably was derived from waters whose source of sulfate was the older marine rocks.
The relatively high magnesium content of the waters of Avenal and Polonio Creeks can be explained by the presence of ultramafic intrusive rocks in the drainage basins of the two streams (Kundert, 1955). Ultramafic rocks, such as peridotite, saxonite, dunite, and pyroxenite or their altered equivalents of the serpentine group, all of which are composed largely of magnesium silicate minerals, are a source of readily weathered magnesium compounds; hence, the stream waters may be expected to show a correspondingly high mag nesium content.
SPRINO WATERS
Chemical analyses of the water of 4 springs in the Avenal-McKit- trick area, reported in table 9 and shown on plate 5 and figure 8, have extreme variations both in the chemical character and in the concentration of the water. This is not surprising, however, as the waters are derived from rocks of different origin and age. The min eral content, expressed as the sum of determined constituents, ranges from 362 ppm in the water from the spring at 29/20-5 (Carneros Spring) to 10,900 ppm in the water from the spring at 25/18-25C. The chemical character likewise is erratic; the spring at 25/18-25C yields a sodium chloride water, the springs at 28/19-22 and 29/21- 33E yield sulfate waters of intermediate cation composition, and the spring at 29/20-5 yields bicarbonate or sulfate water of calcium sodium composition.
The water from a sump at the spring at 25/18-25C is of the sodium chloride type and contains 10,900 ppm of dissolved solids. It issues near an outcrop of upper Miocene marine sediments, ac-
GEOCHEMISTRY OF NATURAL WATERS 53
cording to Kundert (1955), and seeps into a large fenced sump. There is no surface outlet or apparent escape from the sump; there fore, the high concentration may be due in part to evaporation of the water. The mud around the spring is black and smells strongly of hydrogen sulfide. Although this spring apparently is the same one described by Arnold and Johnson (1910, p. 44) as a tar spring issuing from the contact of the Vaqueros formation and alluvium, there was no evidence of tar or oil when the spring was sampled in April 1954. Because of the high mineral content of the water, the spring is unused at present.
The spring at 28/19-22, known locally as Mize Spring, yields a sodium calcium sulfate water containing 3,060 ppm of dissolved solids. The water issues from sedimentary rocks shown by Kundert as early Miocene (1955). It is used for stock and domestic purposes.
The spring at 29/20-5 (Carneros Spring) yields a calcium sodium sulfate bicarbonate or bicarbonate sulfate water containing less than 500 ppm dissolved solids. The water trickles from sandstone of Eocene age (idem). Arnold and Johnson (1910, p. 105) reported that the spring was used extensively by cattlemen and sheepherders and, as shown by the drawings and artifacts in the vicinity, was known to the Indians before the settlement of the area. At the present time the spring is used for watering stock.
The water from the spring at 29/21-33E is a sodium magnesium sulfate water containing 2,830 ppm of dissolved solids. The water issues from an outcrop of siliceous shale of middle Miocene age (Kundert, 1955). It is used for watering stock.
GROUND WATERS
With few exceptions the waters from wells in the Avenal-McKit- trick area are consistent in chemical character but inconsistent in concentration of mineral matter. The typical wells yield sodium sulfate waters or sulfate waters of intermediate cation composition. Concentrations of dissolved solids range from 477 ppm in the water from well 22/19-19J1 in the northern part of the area east of Kettleman Hills to 7,040 ppm in the water from well 26/18-27F1 near the south flank of Antelope Valley. The range in hardness is reflected by that of the water in these same wells, 30 and 3,020 ppm, respectively. Boron content ranges from 0.3 ppm in the water of well 25/18-34R1, drilled in sandstone of Eocene age, to 11 ppm in well 26/18-11K1, a salt-water well less than 2 miles southeast near an outcrop of Eocene sediments. More critical for agriculture is the fact that of the 97 samples analyzed for boron only 12 had less than 1.0 ppm, 43 had 1.0 to 2.0 ppm, and 42 had more than 2.0 ppm.
54 GROUND-WATER CONDITIONS, AVENAL-McKITTRICK AREA, CALIF.
KETTLEMAN CITY SUB AREA
Three wells in sees. 19 and 20, T. 22 S., E. 19 E., east of Kettle- man Hills, yield high-sodium waters that differ greatly in anion composition (pi. 5). These waters range from the bicarbonate to the sulfate bicarbonate type and include a chloride wa^er from well 22/19-20Q1 (fig. 9). The sodium exceeds 80 percent of the cation total in all the wells.
Owing to lack of information on the depths of wells in this sub- area, it is difficult to evaluate the marked differences in water qual ity. Well 22/19-20Q1 not only yields a chloride water but also yields the warmest water of the group of wells, suggesting that it may be deeper than the other wells and, hence, may be producing water from a deep zone not tapped by the other wells.
KETTLEMAN PLAIN
All ground-water analyses available for the Kettleman Plain sub- area show sulfate waters, in which the concentration of dissolved solids ranges from 1,090 ppm in the water of well 23/18-30A1 to 2,270 ppm in the water of well 25/19-6D2. As shown on figure 9, sulfate exceeds 65 percent of the anion total in typical samples. Sodium, the predominant cation, ranges from 40 to 65 percent of the cations in typical waters. Among the other cations, magnesium generally is present in slightly greater quantities than calcium and is expressed as equivalents per million.
The high sulfate content of the ground waters probably reflects recharge from the hill areas to the east and west of Kettleman Plain, which are underlain chiefly by marine and continental deposits of Tertiary age and by continental deposits of early Quaternary age. The high percent sodium of the well waters are compared to that of typical stream waters of the Avenal-McKittrick area (fig. 8) is characteristic of most of the ground waters of the area. Presum ably the high percent sodium is the result of cation exchange be tween the ground waters and the sediments in which they occur.
McLTJRE VALLEY
Wells in McLure Valley yield sulfate-type waters that have a range in concentration of dissolved solids from 849 ppm in the water from well 25/18-5J2, in the south-central part of the valley, to 4,900 ppm in the water of well 25/18-3N2, just west of Dagany Gap near an area where ground water formerly rose to discharge at the land surface. However, most of the waters contain less than 1,400 ppm.
As shown in figure 9, the typical waters contain sulfate in the proportion of more than 50 percent of their total anions, although the proportion of sulfate is lower than in the ground waters of
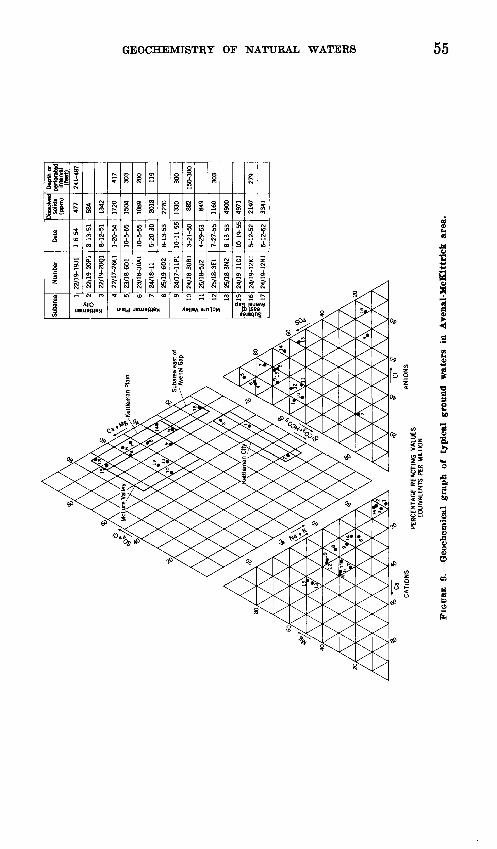
Ket
tlem
an P
lain
Sub
area
eas
t of
Aven
al G
ap
Sub
area
Kettleman Cit
y
Kettleman
Plain
oo xi o> tn .*
McLure
Valley
!*f1
5Jt»
gl6
"
S!l7
Num
ber
22/1
9-19
J1
22/1
9-20
P1
22/1
9-20
Q1
22/1
7-26
E1
23/1
8-6D
1
23/1
8-30
A1
24/1
8-11
25/1
9-6D
2
24/1
7-1
1P1
24/1
8-30
B1
25/1
8-5J
2
25/1
8-3E
1
25/1
8-3N
2
24/1
9-1
1G1
24/1
9-12
K1
24/1
9-12
N1
Dat
e
1-6-
54
8-13
-51
8-12
-51
1-20
-54
10-5
-55
10-5
-55
5-20
^30
8-13
-53
10-1
1-55
3-21
-50
4-29
-53
7-27
-55
8-13
-53
10-1
9-55
5-12
-52
5-12
-52
Dis
solv
ed
solid
s (p
pm)
477
584
1342
1720
1504
1089
2018
2270
1330 88
2
849
1160
4900
4971
2197
3341
Dep
th o
r"S
SSr1
(fee
t)
241-
487
417
303
200
119
300
150-
300
303
279
PER
CEN
TAG
E R
EA
CTI
NG
V
ALU
ES
EQ
UIV
ALEN
TS P
ER M
ILLI
ON
FIG
URE
9
. G
eoch
emic
al g
raph
of
typi
cal
grou
nd w
ater
s in
A
vena
l-M
cKit
tric
k ar
ea.
Cn
56 GROUND-WATER CONDITIONS, AVENAL-McKITTRICK AREA, CALIF.
Kettleman Plain. In cation composition the waters range from so dium to sodium magnesium; magnesium exceeds calcium in all samples.
McLure Valley ground waters, with a relatively high proportion of sulfate, differ from the water of Avenal Creek (table 9; pi. 5; fig. 8), in which bicarbonate is the principal anion. This difference is difficult to explain as Avenal Creek is the principal stream dis charging into McLure Valley and presumably is the principal source of recharge to the ground-water body. Aside from the possibility that the two analyses for Avenal Creek shown in table 9 are not representative of the average chemical quality of the water of the creek, the most likely explanation is that unsampled local tributary runoff may dilute the waters of Avenal Creek with water of sulfate content high enough to make the average blend a sulfate composition. Another possibility is that the alluvium contains soluble sulfate salts. The bicarbonate contribution of Avenal Creek definitely is shown by the composition of the ground waters of McLure Valley, which con tain proportionally more bicarbonate and less sulfate than the ground waters of Kettleman Plain across Pyramid Hills to the east. As in the waters of Avenal Creek, magnesium is present in significant con centrations, although in most waters sodium is the predominant cation. The high-sodium content presumably is the result of cation exchange with the sediments or of solution of alkali salts.
SUBAREA EAST OF AVENAL GAP
Two of the three wells (pi. 5; fig. 9) immediately east of Avenal Gap yield sulfate waters of sodium or magnesium sodium composi tion. Well 24/19-12N1 yields a sodium chloride water containing 3,340 ppm of dissolved solids. The sulfate waters range in concen tration of dissolved solids from 2,200 ppm in the water of well 24/19-12K1 to 4,970 ppm in the water of well 24/19-11G1. Among the other principal anions the chloride, in equivalents per million, exceeds the bicarbonate by 114 to 6 times (table 8).
Although sodium is the predominant cation in most of the well waters, magnesium averages 30 percent of the cation total in the 6 waters analyzed; in the water of well 24/19-12K1 its content exceeds that of sodium, making up almost 50 percent of the cation total.
As indicated by the water-level contours on plate 3, subsurface inflow of water through Avenal Gap probably is the principal source of replenishment to ground water in this subarea, although surface flow may contribute recharge in times of heavy runoff. Hence, the quality of the water yielded by wells east of Avenal Gap is of inter est. The generally higher mineral content of these ground waters compared to that of ground waters west of Avenal Gap in Kettle man Plain implies one of two possibilities: (1) that an increase in mineral content occurs as the ground waters move through the gap,
GEOCHEMISTRY OF NATURAL WATERS 57
presumably as a result of solution of mineral matter present in the deposits through which the water moves, or (2) that waters of infe rior quality are supplied by minor accretions from the older rocks and deposits underlying Avenal Gap and Kettleman Hills. The rela tively high proportion of magnesium among the cation radicals suggests further that the greater part of the water passing through Avenal Gap originated in the drainage basin of Avenal Creek rather than in the drainage tributary to Kettleman Plain.
The sodium chloride water reported from well 24/19 12N1 (depth not known) evidently comes from a different zone than that tapped by other wells in the vicinity. For the present, it is assumed to represent a deeper zone because highly concentrated chloride-waters are tapped beneath fresh waters by water wells in Tulare Lake bed, about 10 miles to the north (Davis and others, 1959, p. 190).
ANTELOPE VALUBY
Most of the wells in Antelope Valley yield sulfate waters that range in concentration from a little more than 1,000 ppm to more than 7,000 ppm (table 8). Except for the water from a few wells along the margins of the valley, the ground waters generally contain less than 2,000 ppm of dissolved solids. Well 26/17-11E1, in the northwestern part of the valley, yields water with the lowest mineral content, 1,250 ppm; well 26/18-27F1, near the south edge of the valley, yields water with the highest mineral content, 7,040 ppm. The mineral content of the latter well increased from 6,180 ppm in April 1953 to 7,040 ppm in August 1955. The reason for the increase is not known.
The typical ground waters are of the sulfate type, and sodium is the predominant cation (fig. 10). Among the other cations magne sium usually exceeds calcium, and among the anions chloride nor mally exceeds bicarbonate.
Along the margins of the valley several wells tap ground waters of high concentration. Well 26/18-27F1, mentioned above, in August 1955 yielded a sodium magnesium sulfate water containing 7,040 ppm of dissolved solids. The water of well 26/18-19B2, about 3 miles west of well 27F1 and also along the south edge of the valley, sampled in August 1954, was of sodium magnesium sulfate composi tion and contained 3,580 ppm of dissolved solids. Well 26/18-11K1, near the northern margin of the valley, when sampled at the dis charge in January 1953, yielded a sodium chloride water containing 5,450 ppm of dissolved solids.
The relatively high proportion of sulfate in the ground waters of Antelope Valley evidently reflects the contribution of runoff from the sedimentary rocks of Tertiary age that flank the valley along its southern margin. The generally high percent sodium in the
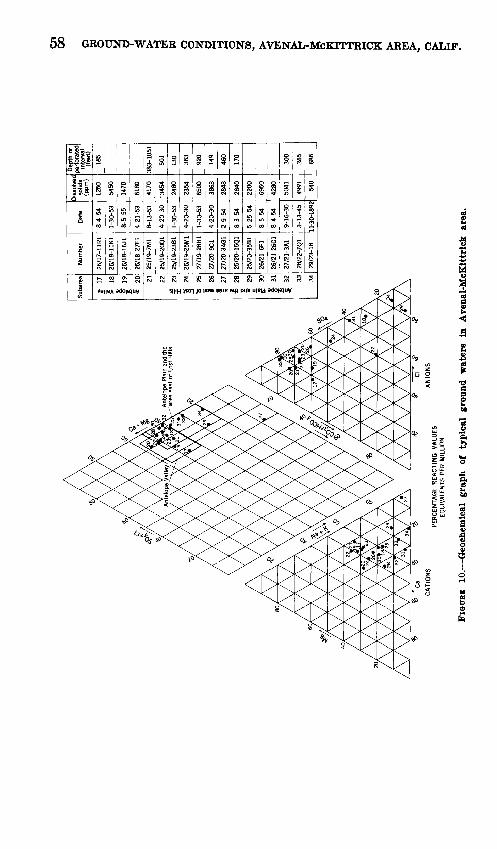
Sub
area
Antelope
Valley
O
VO
00
^ 21
22
=
23
I
24
S
25
|26
1 27
1
28
1
30
i 31
|
32
33
34
Num
ber
26/1
7-11
R1
26/1
8-1
1K1
26/1
8-16
J1
26/1
8-27
F1
25/1
9-7M
1
25/1
9-20
Q1
25/1
9-23
B1
26/1
9-25
M1
27/1
9-28
H1
27/2
0-9C
1
27/2
0-34
G1
25/2
0-15
Q1
25/2
0-35
B1
26/2
1-6F
1
26/2
1-26
G1
27/2
1-3A
1
28/2
2-7Q
1
29/2
3-18
Dat
e
8-4-
54
1-30
-53
8-5-
55
4-21
-53
8-13
-53
4-20
-30
1-30
-53
4-20
-30
1-30
-53
4-20
-30
2-9-
54
8-3-
54
5-25
-54
8-5-
54
8-4-
54
9-16
-30
3-13
-45
11-3
0-18
92
Dis
solv
ed
solid
s (p
pm)
1250
5450
1470
6180
4170
345
4
2480
2354
6500
3863
2848
2840
2200
6950
4280
5041
4991 54
0
Dep
th o
r pe
rfora
ted
inte
rval
,_
(fe
et)
185
383-
1051
501
130
363
920
149
460
170
300
365
686
ss 8 H
PER
CEN
TAG
E R
EA
CTI
NG
V
ALU
ES
EQ
UIV
ALEN
TS P
ER M
ILLI
ON
H
> a
FIG
UR
E 10
. Geo
chem
ical
gr
aph
of
typi
cal
grou
nd
wat
ers
in
Ave
nal-
McK
ittr
ick
area
.
GEOCHEMISTRY OF NATURAL WATERS 59
ground waters presumably results from cation exchange between the ground waters and the containing sediments. Sulfate waters of high mineral content noted from wells 26/18-27F1 and 26/18-19B2 along the south edge of the valley may be representative of local slope runoff from the deposits of Tertiary age in that vicinity, whereas the sodium chloride water tapped by well 26/18-11K1 probably is of marine origin, either connate water contained in the deposits tapped by the wells or, possibly, water occurring in a fracture zone.
ANTELOPE PLAIN AND AREA BAST OF LOST HILLS
Antelope Plain is extensive and receives recharge from several drainage basins; accordingly, the ground waters have a considerable range in quality. The concentration of dissolved solids ranges from 2,480 ppm in well 25/19-23B1, at the north end of the plain, to 6,500 ppm in well 27/19-28H1, about 2 miles south of Bitterwater Creek along the southwest edge (table 8). However, most of the waters pumped from wells contain less than 4,500 ppm of dissolved solids.
As shown in figure 10, the typical ground waters of Antelope Plain are of sodium sulfate composition. Among the other cations mag nesium generally exceeds calcium, and among the anions chloride generally exceeds bicarbonate.
A notable exception to the typical ground water of the area is the water yielded by well 27/20-34G1, near North Belridge (pi. 5). It is a sodium chloride water that contains 2,850 ppm of dissolved solids. Sodium makes up 93 percent of the cation total, and chlo ride, bicarbonate, and sulfate comprise 50, 29, and 21 percent, re spectively, of the anions. The source of this anomalous water is not obvious, but the high proportions of sodium and chloride suggest a marine origin. Moreover, that the bicarbonate content is higher than the sulfate content suggests that sulfate reduction has occurred. In many respects this water is similar to oil-field brines described by Kogers (1919) from the Midway-Sunset oil field about 25 miles to the south. Well 27/20-34G1 is reported to be 460 feet deep and is less than 1 mile from the producing area of the North Belridge oil field. It seems likely, therefore, that this well taps reduced sedi ments similar in lithology to the oil-producing sediments of the North Belridge oil field.
Ground waters tapped by wells in the Lost Hills and the area to the east show a greater range in chemical character and concentra tion than those in other parts of the Avenal-McKittrick area (pi. 5). The range in mineral content as shown in table 8 is from 540 ppm in the water from well 29/23-18, at the railroad station at Lokern, to 6,950 ppm in the water from well 26/21-6F1, on the northeast Hank of Lost Hills about 6 miles northwest of the town of Lost
60 GROUND-WATER CONDITIONS, AVENAL-McKITTRICK AREA, CALIF.
Hills. However, most of the ground waters contain 2,000 to 5,000 ppm of dissolved solids. Although the normal waters are of sodium sulfate composition, chloride waters are found locally. The occur rence of sulfate chloride and chloride sulfate waters in some wells is indicative of mixed sources or possibly of vertical separation of water bodies which cannot be defined with the information available.
Two widely separated wells, 25/20-35B1, about 9 miles northwest of the town of Lost Hills, and 29/23-18 at Lokern, yield sodium chloride waters. The water from 25/20-35B1 contained 2,200 ppm of dissolved solids; sodium made up 73 percent of the cations and chloride 82 percent of the anions. In the water of well 29/23-18, which contained only 540 ppm of dissolved solids, sodium and potas sium made up 79 percent of the cations and chloride 84 percent of the anions.
The sodium sulfate ground waters of this district appear to have the same origin as other sodium sulfate waters of the Avenal- McKittrick area; that is, they probably originated as sulfate waters derived from drainage areas in the Temblor Eange underlain by Tertiary deposits, and the waters have become enriched in sodium by cation exchange reaction with the sediments of the valley. The chloride waters may be of marine origin, or they may be waters in which concentration by evaporation at the land surface had oc curred before entrapment. Waters of proportionally high chloride content that originated as evaporation residues are known from sev eral other areas in the San Joaquin Valley (Davis and others, 1959, p. 175). A marine source appears most likely for chloride waters near Lost Hills, as marine sediments are found at shallow depth on the Lost Hills anticline (Scouler, 1952, p. 164). In fact, the discovery well of the Lost Hills oil field, drilled in 1910 in sec. 30, T. 26 S., E. 21 E., as a water well, penetrated oil in marine deposits at a depth of 472 feet.
Waters in which bicarbonate makes up a substantial percentage of the anions, tapped by wells in the axial part of the San Joaquin Valley, probably indicate recharge from the east side of the valley. Both the streams and ground waters of the east side are character ized by proportionally high bicarbonate content.
QUALITY OF GROUND WATER AS A LIMITING FACTOR IN THE UTILIZATION OF THE GROUND-WATER BASINS
Solutions to problems of utilizing ground-water supplies and stor age are beyond the scope of this report and beyond the scope of the basic data available in 1955. The following paragraphs outline some of the problems that must be considered in the planning for the efficient use of any imported water and the ground water in the Avenal-McKittrick area.
GEOCHEMISTRY OF NATURAL WATERS 61
The chemical quality of the ground waters in the Avenal-McKit- trick area may limit the future development and utilization of ground waters in the area. At present ground water is not available in suitable quality or quantity for irrigation throughout a large part of the area. Plans have been proposed by both the Federal Gov ernment (U.S. Bureau of Reclamation, 1955) and the State of Cali fornia (California State Water Resources Board Bull. 3, pi. 6) to import water to the area. Under such proposed development the efficient use of the ground-water supply of the area is important to the success of the project.
If the several ground-water reservoirs in the area can be uti lized effectively for the storage of imported water ,then it would be economically advantageous to use these reservoirs to balance fluctua tions in the ground-water and surface-water supplies. On the other hand, if the utilization of the ground-water reservoirs for this pur pose is not feasible, then imported water would have to be used to furnish most of the supply to the area. Imported irrigation water applied in excess of plant needs probably would cause a general rise of the water table, which in turn eventually would require local remedial drainage works. Because of the generally high mineral content of the ground waters, a careful and detailed evaluation of the quality of the ground waters would be essential to any detailed planning of water projects.
Systems for classifying waters in terms of their effects on soils and growing crops have been proposed by Schofield (1936), by the U.S. Salinity Laboratory (1954), by Wilcox (1948), by Thorne and Thorne (1951), by Doneen (1954), and by the California Water Pollution Control Board (1952). In using these methods for classi fying ground waters of the Avenal-McKittrick area, it was deter mined that, according to most of the classifications, most of the waters were in the doubtful to unsuitable class.
Locally, as at Kettleman Plain, McLure Valley, and Antelope Valley, the ground water evidently is suitable for irrigation, as it has been the only supply to lands irrigated in these areas for 10 to 20 years. However, the lack of irrigation development in most of the area, despite the fact that the soils generally are suitable for cultivation, testifies to the unavailability of suitable ground-water supplies for irrigation. Sporadic efforts to obtain water suitable in quality for oil-well drilling generally have been unsuccessful. Inten sive exploration of the undeveloped areas might reveal some bodies of ground water suitable for irrigation use, similar to water tapped by wells in the presently developed areas. However, the high min eral content of most of the ground waters pumped from the scat tered stock and industrial wells in the areas not under irrigation (table 8) precludes their use for domestic and irrigation supplies.
503194 O 5!
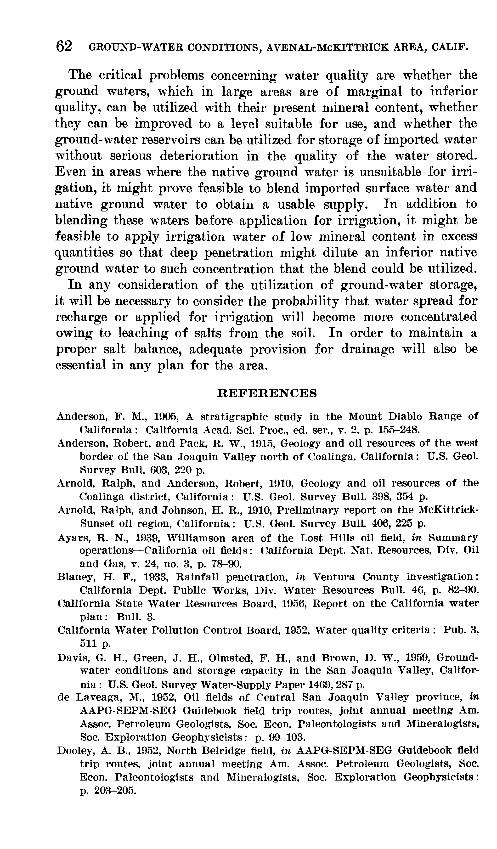
62 GROUND-WATER CONDITIONS, AVENAL-McKITTRICK AREA, CALIF.
The critical problems concerning water quality are whether the ground waters, which in large areas are of marginal to inferior quality, can be utilized with their present mineral content, whether they can be improved to a level suitable for use, and whether the ground-water reservoirs can be utilized for storage of imported water without serious deterioration in the quality of the water stored. Even in areas where the native ground water is unsuitable for irri gation, it might prove feasible to blend imported surface water and native ground water to obtain a usable supply. In addition to blending these waters before application for irrigation, it might be feasible to apply irrigation water of low mineral content in excess quantities so that deep penetration might dilute an inferior native ground water to such concentration that the blend could be utilized.
In any consideration of the utilization of ground-water storage, it will be necessary to consider the probability that water spread for recharge or applied for irrigation will become more concentrated owing to leaching of salts from the soil. In order to maintain a proper salt balance, adequate provision for drainage will also be essential in any plan for the area.
REFERENCES
Anderson, F. M., 1905, A stratigraphic study in the Mount Diablo Range ofCalifornia: California Acad. Sci. Proc., ed. ser., v. 2, p. 155-248.
Anderson, Robert, and Pack, R. W., 1915, Geology and oil resources of the westborder of the San Joaquin Valley north of Coalinga, California: U.S. Geol.Survey Bull. 603, 220 p.
Arnold, Ralph, and Anderson, Robert, 1910, Geology and oil resources of theCoalinga district, California: U.S. Geol. Survey Bull. 398, 354 p.
Arnold, Ralph, and Johnson, H. R., 1910, Preliminary report on the McKittrick-Sunset oil region, California: U.S. Geol. Survey Bull. 406, 225 p.
Ayars, R. N., 1939, Williamson area of the Lost Hills oil field, in Summaryoperations California oil fields: California Dept. Nat. Resources, Div. Oiland Gas, v. 24, no. 3, p. 78-90.
Blaney, H. F., 1933, Rainfall penetration, in Ventura County investigation:California Dept. Public Works, Div. Water Resources Bull. 46, p. 82-90.
California State Water Resources Board, 1956, Report on the California waterplan: Bull. 3.
California Water Pollution Control Board, 1952, Water quality criteria: Pub. 3,511 p.
Davis, G. H., Green, J. H., Olmsted, F. H., and Brown, D. W., 1959, Ground- water conditions and storage capacity in the San Joaquin Valley, Califor nia : U.S. Geol. Survey Water-Supply Paper 1469, 287 p.
de Laveaga, M., 1952, Oil fields of Central San Joaquin Valley province, inAAPG-SEPM-SEG Guidebook field trip routes, joint annual meeting Am.Assoc. Petroleum Geologists, Soc. Econ. Paleontologists and Mineralogists,Soc. Exploration Geophysicists: p. 99-103.
Dooley, A. B., 1952, North Belridge field, in AAPG-SEPM-SEG Guidebook fieldtrip routes, joint annual meeting Am. Assoc. Petroleum Geologists, Soc.Econ. Paleontologists and Mineralogists, Soc. Exploration Geophysicists:p. 203-205.
REFERENCES 63
Doneen, L. D., 1954, Salination of soil by salts in the irrigation water: Am. Geophys. Union Trans., v. 35, no. 6, pt. 1, p. 943-950.
Eaton, F. M., 1935, Boron in soils and irrigation waters and its effect on plants, with particular reference to the San Joaquin Valley of California: U.S. Dept. Agriculture Tech. Bull. 448, 131 p.
English, W. A., 1921, Geology and petroleum resources of northwestern Kern County, California: U.S. Geol. Survey Bull. 721, 48 p.
Frink, J. W., and Kues, H. A., 1954, Corcoran clay a Pleistocene lacustrine deposit in San Joaquin Valley, California: Am. Assoc. Petroleum Geologists Bull., v. 38, no. 11, p. 2357-2371.
Hoots, H. W., 1929, Geology and oil resources along the southern border of San Joaquin Valley, California: U.S. Geol. Survey Bull. 812, 338 p.
_____1943, Origin, migration, and accumulation of oil in California, in Geo logic formations and economic development of the oil and gas fields of California: California Dept. Nat. Resources, Div. Mines Bull. 118, p. 253- 275.
Hoots, H. W., Bear, T. L., and Kleinpell, W. D., 1954, Geological summary of the San Joaquin Valley, California, in Geology of the natural provinces, p. 113-129: California Dept. Nat. Resources, Div. Mines Bull. 170.
Jenkins, O. P., 1938, Geologic map of California: California Dept. Nat. Re sources, Div. Mines.
Karmelich, F. J., 1951, Blackwells Corner oil field, in Summary of operations California oil fields: California Dept. Nat. Resources, Div. Oil and Gas, v. 37, no. 2, p. 5-8.
Kundert, C. J., 1955, Geologic map of California, preliminary edition: Cali fornia Dept. Nat. Resources, Div. Mines, Bakersfield and San Luis Obispo sheets, 1:250,000.
Matthes, F. E., 1930, Geologic history of the Yosemite Valley: U.S. Geol. Sur vey Prof. Paper 160, 137 p.
May, J. C., and Hewitt, R. L., 1948, The basement complex in well samples from the Sacramento and San Joaquin Valleys, California: California Jour. Mines and Geology, v. 44, no. 2, p. 129-158.
Mendenhall, W. C., Dole, R. B., and Stabler, Herman, 1916, Ground water in San Joaquin Valley, California: U.S. Geol. Survey Water-Supply Paper 398, 310 p.
Peirce, G. G., 1947, Cymric oil field, in Summary of operations California oil fields: California Dept. Nat. Resources, Div. Oil and Gas, v. 33, no. 2, p. 7-15.
Piper, A. M., 1945, A graphic procedure in the geochemical interpretation of water analyses: Am. Geophys. Union Trans. 25th Ann. Mtg., pt. 6, p. 914- 928.
Piper, A. M., Gale, H. S., Thomas, H. E., and Robinson, T. W., 1939, Geology and ground-water hydrology of the Mokelumne area, California: U.S. Geol. Survey Water-Supply Paper 780, 230 p.
Reed, R. D., 1933, Geology of California: Am. Assoc. Petroleum Geologists, 328 p.
Reiche, Parry, 1950, Geology of part of the Delta-Mendota Canal near Tracy, California: California Dept. Nat. Resources, Div. Mines Spec. Rept. 2, 12 p.
Ritzius, D. E., 1950, South Belridge oil field, in Summary operations Califor nia oil fields: California Dept. Nat. Resources, Div. Oil and Gas, v. 36, no. 1, p. 18-24.
_____1954, MacDonald Anticline oil field, in Summary operations California oil fields: California Dept. Nat. Resources, Div. Oil and Gas, v. 40, no. 1, p. 5-13.
64 REFERENCES
Rogers, G. S., 1919, The Sunset-Midway oil field, California, Part II, Geo- chemical relations of the oil, gas, and water: U.S. Geol. Survey Prof. Paper 117, 103 p.
Scofleld, C. S., 1936, The salinity of irrigation water: Smithsonian Inst. Ann. Rept., p. 275-285.
Scouler, A. B., 1952, Lost Hills oil field, in AAPG-SEPM-SEG Guidebook field trip routes, joint annual meeting Am. Assoc. Petroleum Geologists, Soc. Econ. Paleontologists and Mineralogists, Soc. Exploration Geophysicists: p. 164-168.
Stewart, Ralph, 1946, Geology of Reef Ridge, Coalinga district, California: U.S. Geol. Survey Prof. Paper 205-C, p. 81-115.
Taliaferro, N. L., 1943, Geologic history and structure of the central Coast Ranges of California, in Geologic formations and economic development of the oil and gas fields of California ; California Dept. Nat. Resources, Div. Mines Bull. 118, p. 118-163.
1951, Geology of the San Francisco Bay counties, in Geologic guide book of the San Francisco Bay counties: California Dept. Nat. Resources, Div. Mines Bull. 154, p. 117-150.
Thorne, J. P., and Thorne, D. W., 1951, Irrigation waters of Utah: Utah Agr. Exp. Sta. Bull. 346, 64 p.
U.S. Bureau of Reclamation, 1955, San Luis unit, Central Valley project, Cali fornia ; a report on the feasibility of water supply development: U.S. Bur. Reclamation open-file report, 158 p.
U.S. Salinity Laboratory Staff, 1954, Diagnosis and improvement of saline and alkali soils: U.S. Dept. Agriculture Agr. Handb. No. 60, 160 p.
Vaughan, F. E., 1943, Geophysical studies in California, in Geologic formations and economic development of the oil and gas fields of California: Cali fornia Dept. Nat. Resources, Div. Mines Bull. 118, p. 67-70.
Ver Planck, W. E., 1952, Gypsum in California: California Dept. Nat. Re sources, Div. Mines Bull. 163.
Wagner, J. P., 1952, Trico gas field, in AAPG-SEPM-SEG Guidebook field trip routes, joint annual meeting Am. Assoc. Petroleum Geologists, Soc. Econ. Paleontologists and Mineralogists, Soc. Exploration Geophysicists: p. 133- 134.
Wharton, J. B., 1943, Belridge oil field, in Geologic formations and economic development of the oil and gas fields of California: California Dept. Nat. Resources, Div. Mines Bull. 118, p. 502-504.
Wilcox, L. V., 1948, The quality of water for irrigation use: U.S. Dept. Agri culture Tech. Bull. 962, 40 p.
Woodring, W. P., Roundy, P. V., and Farnsworth, H. R., 1932, Geology and oil resources of the Elk Hills, California: U.S. Geol. Survey Bull. 835, 82 p.
Woodring, W. P., Stewart, Ralph, and Richards, R. W., 1940, Geology of the Kettleman Hills oil field, California: U.S. Geol. Survey Prof. Paper 195, 170 p.
Woodward, W. T., 1942, Antelope Hills oil field, in Summary operations Cali fornia oil fields: California Dept. Nat. Resources, Div. Oil and Gas, v. 28, no. 2, p. 7-11.
BASIC DATA
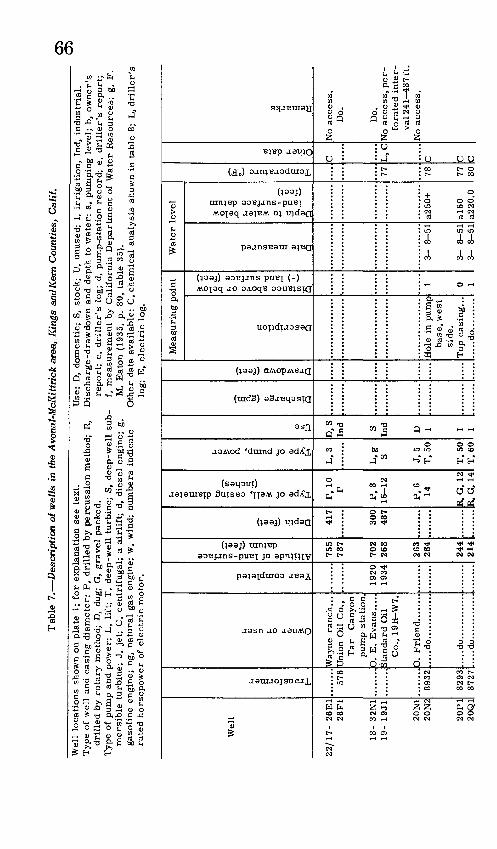
COto
CD co -j
tO tO tO tO !- CO tO tO OO OO CO to CO 05O'ti 2 g £2 £ W
co co co -j to cotO CO 03-a co to
l. l, i. 33 3
CO CO COI-1 >*» O) >*> >*> *>
' en. . -J: : °5
O W'O G
^ ?i.w?£5- 2. ° g- ' 3 S 3» ^ 1 WT3 O
1 ?s IsS < . ET. ^ 0*; too; : ? 3
co co03 tO !*>. 0
CO M -J -3cn O5 o co to co to -j
*» wCO O -J O
t8 50 ^ "« « >- "ti <P V GO £ 1 * *T1 ^ 0) h-> CO W 1 h-> tO*> to
r* * .H «H r C5 CJl Ol Ol GfQ 00 0
~d 5>
H ffia"8 £&"» ° £ » S 5-
n » B
* U" a
h- 0 H-
rr r f f ? en en en
so 93 so to i to to 05 en O O Ob +
co -3 -aO -3 CO
O O O
~a -a
r0
? a
^
iD§5 r
-JVI VI
£>
-3
^
(->0
rOJ
d en
O
22 2 0 < «, ° oW P) 2 P hi hi 1" 0 - H 0 P doo to JJ. o o O oo ^ (1) o * o 01 h- Q, 01 01 01 01 01 * £ *
CO 3 T3-* m Z Z? 1 n
3fl)
Transformer
Owner or user
Year completed
Altitude of land-surface datum (feet)
Depth (feet)
Type of well, casing diameter (inches)
Type of pump, power
Use
Discharge (gpm)
Drawdown (feet)
Description
Distance above or below (-) land surface (feet)
Date measured
Depth to water below land-surface datum (feet)
Temperature (°F)
Measuring point
Water level
Other data
Remarks
cr 3 o"O D- s P)2 m n B o- » H.S o ^.3^ c§
8« 5 » 3 § 3I § I g. f * I -
^ - r a- P sr 3.E-; gp| IM 'p fl) -T o. 2 " i S iHcg-^o'5- o 2. " " 'TJ *« ^ I £ S" P " 21^ II
,
III I
O d d? y ."» ^ w'o(B S n>f>..4 B T3 3-
ii!!f < ? g a * S S S 3 ^ g o> fL c»3 (I) <- ^ P".
P'S I
a g1||* g 5 .T r 3 .
3 ff » TO -
I iii-1 01 I " F M-
CO O O 3 C i-i p. D.
T O " " » fl) ._. O e-f
^ j? S S3. P. T3 3 P)£ TO o 2 r n> * i .
99
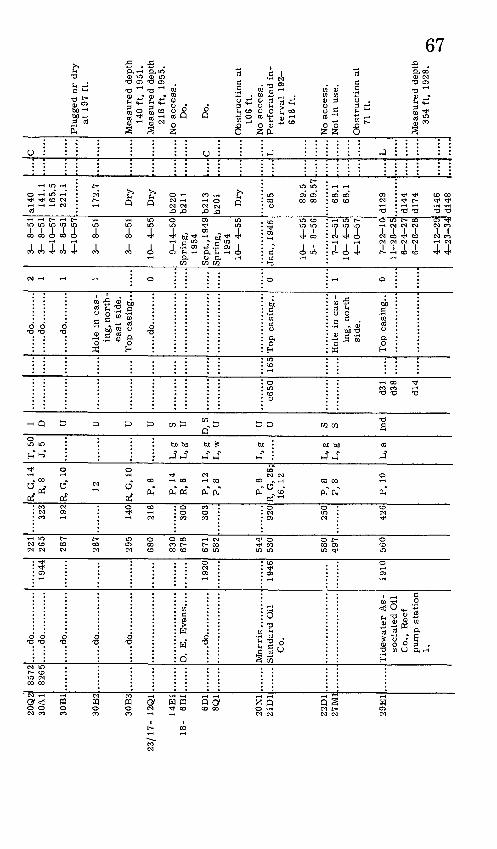
20Q
2 30
A1
30B
1
30B
2
30B
3
23/1
7-
12Q
1
14E
1 1
8-
6B1
6D1
8Q1
20N
1 21
D1
22D
1 27
M1
29E
1
8572
82
65
....
...
.....d
o............
.....d
o............
.....d
o............
.....d
o............
.....d
o.. ..........
O.
E.
Ev
an
s....
....
.do
....
....
....
Morr
is .
....
....
. S
tandar
d O
il
Co.
Tid
ewat
er A
s
socia
ted O
il
Co
., R
eef
pum
p s
tati
on
1.
1944
.......
1920
1946
1910
221
265
287
287
295
680
830
678
671
582
544
530
580
497
560
323
192
140
218
300
303
920
250
426
R,
G,
14
R,
8
R,
G,
10
12
R,
G,
10
P,
8
P,
14
R,
6
P,
12
P,
8
P,
8 R
, G
, 26
;16
, 12
P,
8 P
, 8
P,
10
T,
50
J, 5
L.g
L
,g
L.g
L,
w
L.g
L,g
L
,g
L,
a
I D U U TT TT S U
D,
S U U
U S S Ind
c65
0
d31
d38
d!4
165
....
.do..
....
...
.....d
o.........
....
.do..
....
...
Hole
in c
as
in
g, nort
h
east
sid
e.
.....d
o.........
Top c
asin
g..
Hole
in
cas
in
g,
no
rth
si
de.
Top c
asin
g..
2 1 1 1 0 0 1 0
3-
8-5
1
3-
8-5
1
4-1
0-5
7
3-
8-5
1
4-1
0-5
7
3-
8-5
1
3-
8-5
1
10-
4-5
5
9-1
4-5
0
Spri
ng,
1954
S
ept.
, 194
9S
pri
ng,
1954
10-
4-5
5
Jan
., 1
946
10-
4-5
5
5-
8-5
6
7-1
2-5
1
10-
4-5
5
4-1
0-5
7
7-2
2-1
0
11-2
8-2
5
6-2
4-2
7
6-2
8-2
8
4-1
2-2
9
4-2
3-3
4
a!4
0
141.
1 16
5.5
221.
1
172.
7
Dry
Dry
b2
20
b2
11
b2
13
b2
01 Dry
c85 89.5
8
9.5
7
68.1
68
.1
d!2
9
d!4
4
d!7
4
d!4
6
d!4
8
....
.C C L L
Plu
gged
or
dry
at
197
ft.
Mea
sure
d d
epth
14
0 ft
, 19
51.
Mea
sure
d d
epth
21
8 ft
, 19
55.
No
access
. D
o.
Do.
Ob
stru
ctio
n a
t 10
6 ft
.N
o access
.P
erf
ora
ted
in
te
rval
19
2
618
ft.
No
access
. N
ot i
n u
se.
Ob
stru
ctio
n a
t71
ft.
Mea
sure
d d
epth
35
4 ft
, 19
28.
.
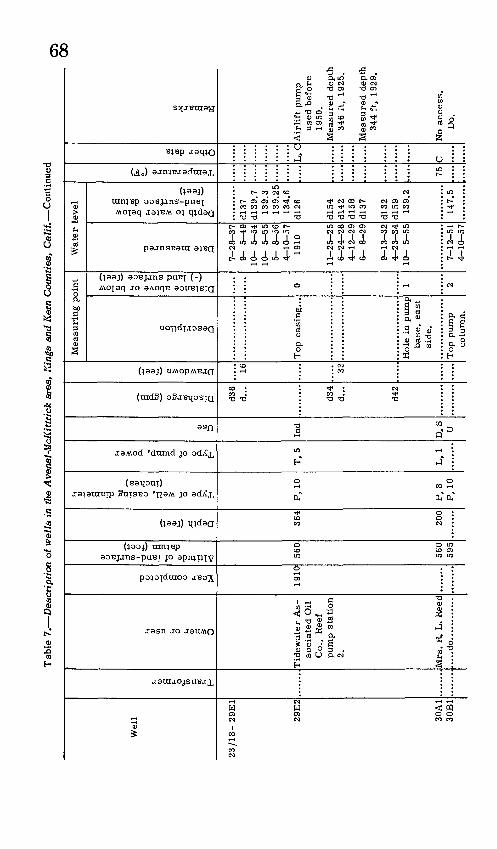
1S3 GO
co 1
GO GO tO tO O O CO COM > MM H- l-» M I-"
1 1 1
: g H: % t&v o w a. & ' ' 1 ? o i: J° 1 5' »! r &?I5i ? rs? 0. 3 '
i w: oUl Ul Ulco as asUl O O
: to GO O 05' o *
'r) 'r) ^i-1 os »->O O
: -r -H ; i-» en
«5 1 a. a. a. i a. a. : *. ta w; to Ji. ; OS
iX !- . d . as
H ffi H
8^ I^S" §11 P-S^ 1
3^ Si I "" "a :10 !- O
tr ?r? fff- ^tr???-3 h-»l-' tOh-» h-»ts3tO CO"-* 10
cp^ yc^c^ ^^fy SffTTTf UIUI Ul W W tO tO tO tO Ul Ul Ul Ul *> W -JI-* Ul *> to CD CD CO Ul -O m Ul *> CD -J
a a a a a a a a a(£> W Ul W W Ul * Ul tOCOCdCOCdCO-a cocoto -aostoiti. as fr to to to -a ui to 05 to ia -a
Ul
: n : : : : : : : r :::::: : : : : : : : : n ::::::
% § § > M "S 08 {* !- C HPm ^S ^gtotnp: .°o *-S2 ojJSuiaiU;
S ?3 ?3pai w _ a. _. a. j^ c co a. co a. o £ 10 fD 10 fD 4 ~ CO "U Ul "U fD
? ' 3"
2-
Transformer
Owner or user
tear completed
Altitude of land-surface datum (feet)
Depth (feet)
Type of well, casing diameter (inches)
Type of pump, power
Use
Discharge (gpm)
Drawdown (feet)
Description
Distance above or below (-) land surface (feet)
Date measured
Depth to water below land-surface datum (feet)
Temperature (°F)
Other data
Measuring point
Water level
Remarks
89
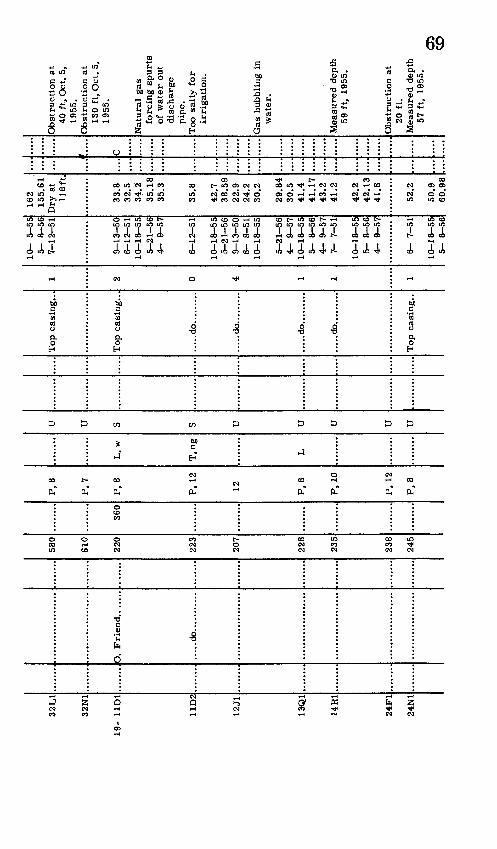
32L
1
32N
1
19-
11D
1
11D
2
12J1
13Q
1
14R
1
24F
1
24N
1
. ....d
o.... ..
.....
580
Bin
220
?,?.3
207
?,?,8
9^ *
\
?,3R
245
360
P,
8
P,
7
P,
8
P,
12
12 P,
8
P,
10
P,
12
P,
8
L,
w
T, n
g
L
U TT S s TT TT U TT TT
Top
cas
ing..,
....
.do
....
....
.
.....d
o.........
.....d
o.........
.....d
o.........
1 2 0 4 1 1 1
10
- 5-
555
- 8-
567-1
2-5
1
9-1
3-5
06-1
2-5
110-1
8-5
55-2
1-5
64
- 9-
57
6-1
2-5
1
10
-18
-55
5-2
1-5
69
-13
-50
6-
8-51
10-1
8-5
5
5-2
1-5
64-
9-57
10-1
8-5
55
- 8-
56A
A
t?
7
7-
7-51
10
-18
-55
5-
8-56
A
. O
_.C
7
6-
7-51
10
-18
-55
5-
8-56
162
155.
61D
ry a
t118ft
.
33.8
32.5
34.2
35.1
811
i
35.8
42.7
38.5
922
.924
.230
.2
29.8
430
.541
.441
.17
41
9
41
9
42
2
49
1
1
41.8
52.2
50.9
60.9
8
\ r,
Ob
stru
ctio
n a
t40
ft,
Oct
. 5,
1955
. O
bst
ruct
ion a
t13
0 ft
, O
ct.
5,19
55.
Nat
ura
l gas
forc
ing
sp
urt
sof
wat
er o
utd
isch
arg
epip
e.
Too
sal
ty f
or
irri
gat
ion.
Gas
bub
blin
g in
w
ater
.
Mea
sure
d d
epth
59
ft,
19
55.
Obst
ruct
ion a
t20
ft.
M
easu
red
dep
th57
ft,
19
55.
<£>
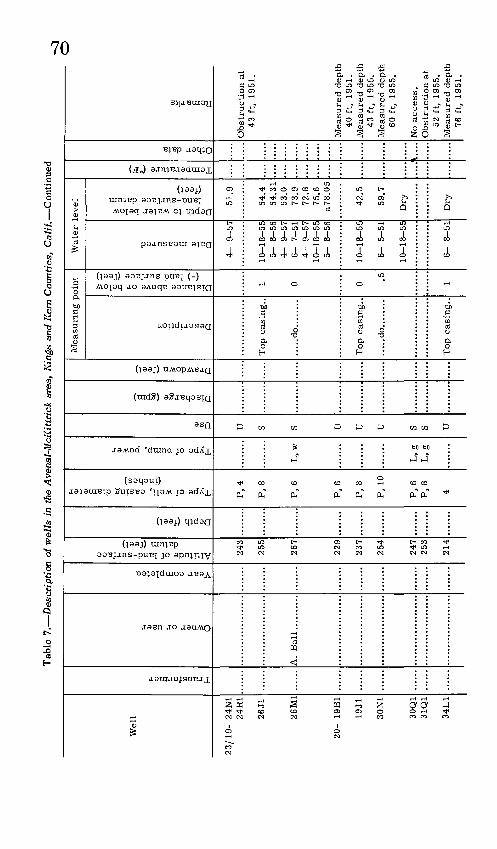
w
o co i i
WWW Wf-'l-' W WWW ^ h-> O O CD CD O5 O) it*. >£.t-1 £>£> 2 ^ W g £ S3 2
S371
W
[0
-O
00 CO
t-1 1-1TO TO
^ MM
o
o p enH1'
3 TO
-
Tcn
d
!\
O
CO -0-o
id30
d d
ai^
O
cn
! T ! roi oo 1 1
cn cn cn tn f-1 cn
0 cn ^
-o cn
O
td^
to05 -O
O5 Ol
f1
a
12.3
I
!\cn
T300
CO
-303 n P tn
3
O i-1
CJl O Ji» O> 4^ CJl O
r CO CD -~J CD CO CO T T 1 T T T
cn cn cn cn cn cn 01 cn CTI -J H-* -j cn 01
P -j 3 -J -J cn cn cn oo cn w w co rfa. rfa-o 01 oo co o w ^ cn f-1
a
I
d
rOl-J
cn
co
: > : \ ....... : =
> o 2 ^ ^ ^ o ^ CF O CT
cn £^" Q cn cn cn ^H £ £? e o £? £ £? 5 £? H I?c ^'Ott"4"4"^ "O
cn o, cn 3 ° cno.cno.cno. cn 3 H-'n)cnm cnfDcnfDH-'n) ^m ^3"P_ *& *& *& "rt-
ft
Transformer
Owner or user
Year completed
Altitude of land-surface datum (feet)
Depth (feet)
Type of well, casing diameter (inches)
Type of pump, power
Use
Discharge (gpm)
Drawdown (feet)
Description
Distance above or below (-) land surface (feet)
Date measured
Depth to water below land-surface datum (feet)
Temperature (°F)
Remarks
Measuring point
Water level
OL
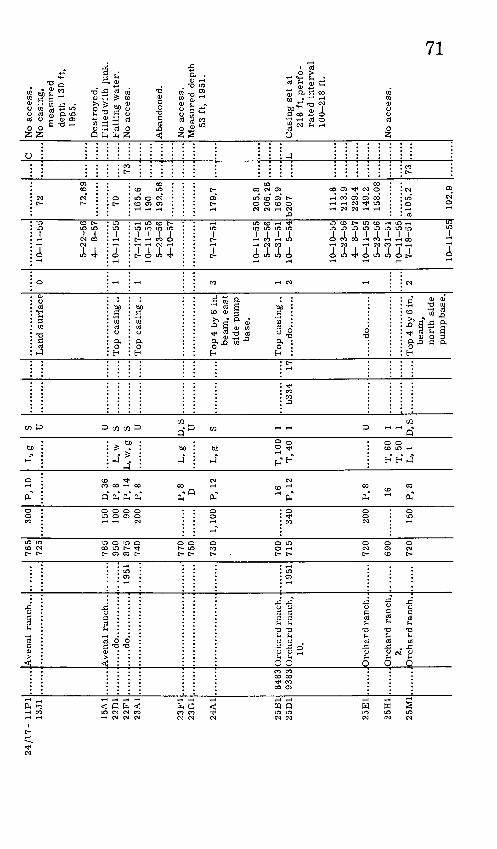
24/1
7-
11P
113
J1
15A
122
D1
22F
123
A1
23F
123
G1
24A
1
25B
125
D1
25E
1
25H
1
25M
1
8483
9383
.....d
o.............
....
.do
....
....
....
.
Orc
hard
ran
ch,
10.
2.O
rchar
d r
anch
.,
1951
1951
765
735
7R5
950
875
740
770
750
730
700
715
720
690
720
300
150
100 90
200
1,10
0
340
200
150
P,
10
D,
36P
, 8
P,
14P
, 8
P,
8D
P,
12
16P
, 12
P,
8
16 P,
8
L.g
L,
wL
, w
, g
L,
g
L,g
T,
100
T,
40
T,
60T
, 50
L,
1
S TT TT S S TT n, s TT S T I TT T T n, s
b334
17
bea
m,
east
si
de
pum
p
bas
e.
.....d
o.........
.....d
o.........
Top 4
by 6
in.
bea
m,
nort
h s
ide
pum
p b
ase.
0 1 1 3 1 2 1 2
10-1
1-5
5
5-2
2-5
64-
8-5
7
10-1
1-5
5
7-1
7-5
110-1
1-5
55
-23
-56
4-1
0-5
7
7-1
7-5
1
10-1
1-5
55
-23
-56
5-3
1-5
110-
5-5
4
10-1
0-5
55-2
3-5
64-
8-5
710-1
1-5
55-2
3-5
65-3
1-5
110-1
1-5
57
-18
-51
10-1
1-5
5
72 72.6
9
70 165.
619
019
2.56
179.
7
20
5.8
206.2
616
9.9
b207
111.
8213.9
229.4
149.
215
8.08
a!0
5.2
102.
9
73 73
L
No
access
.N
o ca
sing,
measu
red
dep
th
130
ft,
1955
.
Des
tro
yed
. F
ille
d w
ith j
un
k.
Fall
ing
wate
r.
No
access
.
Aban
doned
.
No
access
. M
easu
red
dep
th
53 f
t,
1951
.
Cas
ing
set
at
218
ft, p
erf
o
rate
d i
nte
rval
100-2
18 f
t.
No
access
.
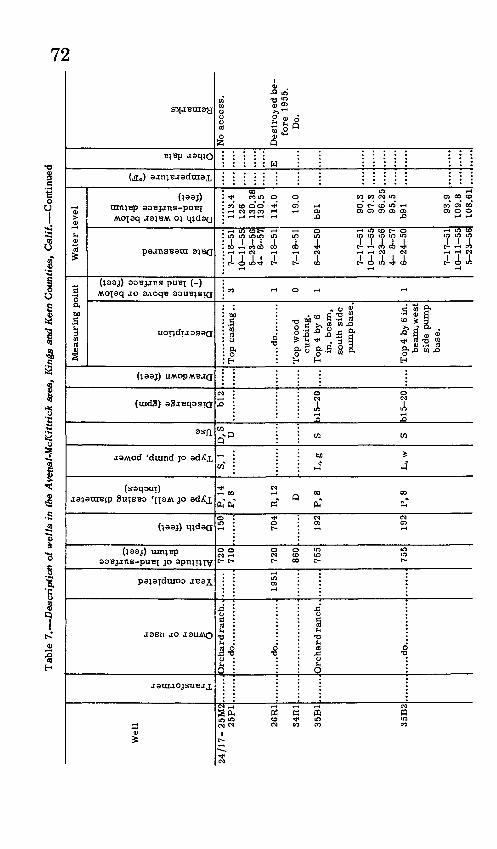
CO*
-a 1
W W W to CO CO Ol Vt it* a Ol O1a a » » ^S CO -> H-> H-> H-> (O
o4O
a cr 5 >)
1,w
]5y
-a -a oo 01 01 01 en 01 o
CO CO CO CO
t >ti"CO "00 °
r r ^ TO
CO W
O" O"
£ wCO COo o
i iH H H
o- » IT .§ -0 g B" § ° § QJH»(T)1-' C^PwpwEnQ.03^ Bc"»^-4^
1 I f»|iH 3 (B H. m a P TO ' a S. ? S re "
?
I-" co j\
-aCO0
-]0*
50
o
a3
a0
-a i-*0
^.00
l
C1
H o0o1!a * 3 9
H-> (-> O I-1 W
uio-3 02 *. en o --] 9s T1 T1 "^V1 9* T1tOI-'C CO COh-H' CO H- H- COH-h-
rrr trrrr t r rrrrr 010101 oitnoioioi 01 tn tn tnoi 01 01 oioii-1 o-aojuii o H-> H-> -301 01 H->
!->!- O* O" l-i l-> l-« H* l->OOCO COCOCDCOCO CO H-> h-> W W CO I-1 Cn CD W H->ciOl-]O H-> CD >^ .°.° ro ,w
oiaoco 01 co co w oo aico £. i-. 01 oo
J > 31 1)-i
33 >
-a CO O
h^Jl0
"fl*.
J5
0
J5
rO
: : : : : H : : : : :
D 2 3-S ° M ° P
? 8 3 8 ^<<! (1)S » w S Q- .w -01 IT
(1)1
(B
Transformer
Owner or user
Year completed
Altitude of land-surface datum (feet)
Depth (feet)
Type of well, casing diameter (inches)
Type of pump, power
Use
Discharge (gpm)
Drawdown (feet)
Description
Distance above or below (-) land surface (feet)
Date measured
Depth to water below land-surface datura (feet)
Temperature (°F)
Other data
Remarks
Measuring point
!n> 4n> n>

18-
5D1
11D
1
11G
1
11L
1
13D
1
ISM
:
19P
1
19Q
1 19
Q2
20N
1 20
N2
20N
3 23
J1
8843
8278
8278
H.
M. H
ollo
way
In
c.
A..
McP
hai
ll..
...
A.
McP
hai
ll..
...
.....d
o............
.....d
o............
.....d
o............
.....d
o............
.....d
o............
1950
........
610
470
438
450
435
432
699
698
700
676
676
676
468
150
.........
1,70
0
300
300
300
300
D, 4
8
R,
14
P>
8
P,
8
P,
12
P,
10
P,
8
P,
16
P,
16
P,
16
P,
8 16
P
, 10
T,g
LiW
, g
T,g
T,
75
L.g
T
, 40
TT Ind
U
TT S TT TT I TT TT S I TT
....
....
.........
....
.
Top
woo
d pla
tform
.
Top
cas
ing..
.....d
o.........
.....d
o.........
....
.do
....
....
.
Top
cas
ing..
.....d
o.........
0 0 1 1 0 1 1
4-
8-57
7-1
2-5
1
10-
5-55
7-1
2-5
1
10-
5-55
5
- 8-
56
4-
9-57
10-
5-5
5
10
- 5-
55
5-
8-56
4
- 9-
57
7-1
2-5
1
10
- 6-5
5
5-
8-56
4
- 9-
57
10
-10
-55
1
0-1
0-5
5
99.9
D
ry
Dry
36
.3
36.5
37
.07
36.8
24 34
.6
34.9
35
.0
25.7
31.2
30
.9
170.
3
225+
24
1.9
Mea
sure
d d
epth
26
ft,
195
5.M
easu
red d
epth
62
ft,
19
55.
Ori
gin
al d
epth
ab
out
1,7
00ft
; ju
nk i
n ho
le
abou
t 80
0 ft
; to
be
dev
el
oped
as
an
irri
gat
ion
w
ell
if p
oss
i
ble,
19
55.
. Plu
gged
nea
r la
nd s
urf
ace.
. Mea
sure
d d
epth
35
ft,
195
5.
. Mea
sure
d d
epth
10
6 ft
, 19
55.
CO
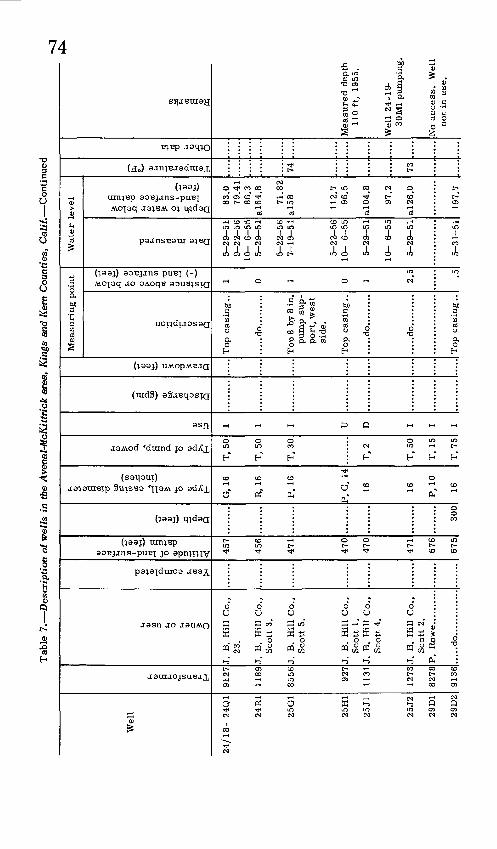
001
to to to to to to to to CDCDCn cncn en >£ £* d d ^ t! ffi Q & JQ CO *-* 1s3 ^ h- ' I-* »-* I-*
CD CO * * * * 00 *-* CD1 M CO »-* CD Oi K-1 I-*co ~a <j toco oioocoCi 00 CO h-1-*] CT1 CO ~4
J-
en en
COo o
30' 2. " 0 ' §.' g. 's^S rt.K<-^w ^S ""S S
to t± * p J-- £ en p co p p
O O ' O O O O p p p p ? ?
JS t^ ȣ
en i-1 o
en ,_. en en , o
H H H H-a i-1 en to en en o
1 1 1 1 HH O
H O
o P ra
TO
en
enCO
en
CD
-a
i
:i * : p1 3"
i
^] ^] j\ t\ o i-- en <i
i
^ O> OT O>
H H Hco en en o o o
C^ hH hH hH
H H H3 M tl 13 § 3 T O. hj M 00 ^ o P ? r~ S rf P Ji *, ^ «3 n H- ^ . ^ t-»-
3 S ? °° 3 fci J^ P M- (q
to I-1 O !-> O I-1
en
en o en O en 7]C|n cln'PcPcln
to to to K- to to to to cp en cp o>to T1!3 cpotjjcp Cn en Cn enen Cncn cnenenen t-1 en (- enen t-'cn i-'cnoi-'P P p pto CD o coi-* en^] o>oo~]oo en -] *. cnto co K- ^>.cncDcoo to co en -j ooooco^o
to i-1
co ^ : : : '. '.
$ * S 3 co 2, i-- £
a" IS Si S- 8 - 32 2 g eg ? ^ "^ S. S ' 1 ^ S a $ -g. 55
S- S ' ?
ro
Transformer
Owner or user
Year completed
Altitude of land-surface datum (feet)
Depth (feet)
Type of well, casing diameter (inches)
Type of pump, power
Use
Discharge (gpm)
Drawdown (feet)
Description
Distance above or below (-) land surface (feet)
Date measured
Depth to water below land-surface datum (feet)
Temperature (°F)
Measuring point
Water level
Other data
Remarks
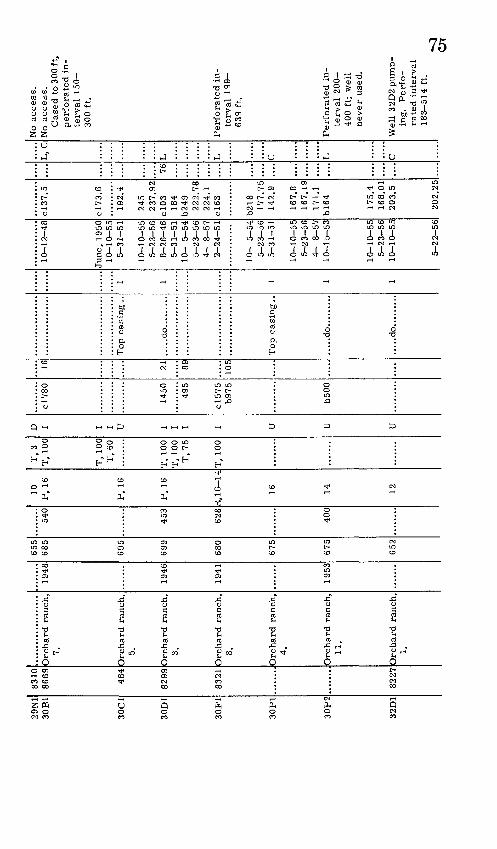
29N
1 30
B1
30C
1
30D
1
30F
1
30P
1
30P
2
32D
1
8310
86
69
484
8299
8321
8227
Orc
har
d r
anch
,7.
Orc
har
d r
anch
, 5.
Orc
har
d r
anch
, 3.
Orc
har
d r
anch
, 8.
Orc
har
d r
anch
, 4.
Orc
hard
ran
ch,
11.
Orc
hard
ran
ch,
1.
1948
1946
1941
1953
655
685
695
699
680
675
675
652
540
453
628
400
10
P,
16
P,
16
P,
16
R, 1
6-1
4
16
14 12
T,
3 T
, 10
0
T,
100
T,
60
T,
100
T,
100
T,
75
T,
100
D I I I U I I I I TT U TT
c!7
80
1450 49
5
c!575
b975
b500
16 21 89 105
.....
Top c
asin
g ..
....
.do..
....
...
Top c
asi
ng..
....
.do..
....
...
....
.do..
....
...
1 1 1 1 1
10
-12
-48
Jun
e, 1
950
10
-10
-55
5-3
1-5
1
10
-10
-55
5
-23
-56
8
-26
-46
5-3
1-5
1
10-
5-5
4
5-2
3-5
6
4-
8-5
7
2-2
4-5
1
10-
5-5
4
5-2
3-5
6
5-3
1-5
1
10-1
0-5
5
5-2
3-5
6
4-
8-5
7
10
-15
-53
10-1
0-5
5
5-2
3-5
6
10-1
0-5
5
5-2
2-5
6
c!37.5
c!73.6
19
2.4
245
237.9
2
c!0
3
184
b249
222.7
8
224.
1 c!
63
b218
1
77
.75
1
42
.9
167.
8 1
67
.19
17
1.1
b!6
4
175.
4 16
8.01
203.5
202.2
5
76
L,
C
L L C L C
No
access
.N
o access
.C
ased
to
300
ft,
perf
ora
ted i
n
terv
al
ISO
- 30
0 ft
.
Perf
ora
ted i
n
terv
al
19
9-
639
ft.
Perf
ora
ted i
n
terv
al
200-
400
ft;
wel
l never
use
d.
Wel
l 3
2D2
pum
p
ing
. P
erf
o
rate
d i
nte
rval
18
3-5
14
ft.
Oi
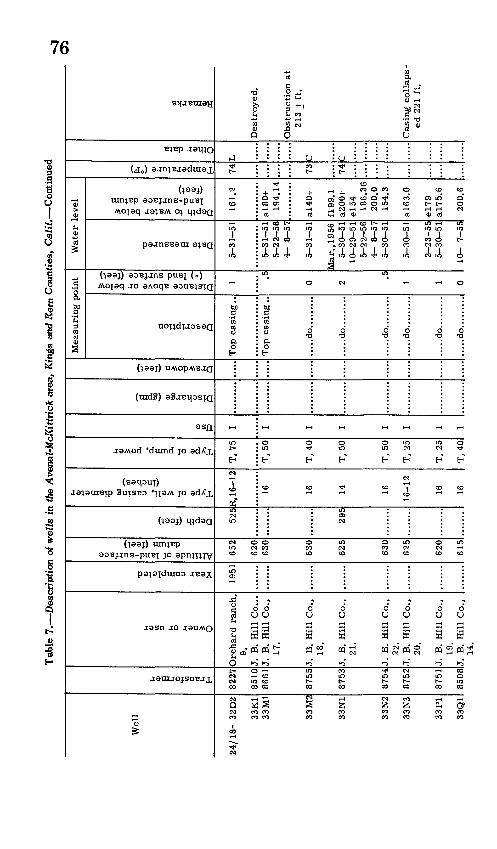
Tab
le 7
. D
escr
ipti
on o
f w
ells
in
the
Ave
nal
-McK
ittr
ick
area
, K
ings
and
Ker
n C
oun
ties
, C
ali
f. C
onti
nued
Wel
l
24/1
8-
32D
2
33K
1 33
M1
33M
2
33N
1
33N
2
33N
3
33P
1
33Q
1
Transformer
8227
8510
86
61
8755
8753
8754
8752
8751
8508
Owner or user
Orc
har
d r
anch
, 9.
J.
B.
Hil
l C
o..
.J.
B.
Hil
l C
o.,
17.
J. B
. H
ill
Co
.,18
.
J. B
. H
ill
Co
.,21
.
J. B
. H
ill
Co.
,22
. J.
B.
Hil
l C
o.,
20.
J. B
. H
ill
Co.
,19
. J.
B.
Hil
l C
o.,
14.
Year
completed
1951
Altitude of
land-surface datum
(fee
t)
652
620
630
630
625
630
625
6?0
615
'£ UJ CM £"5. 0) Q 525
295
Type
of
well, casing
diameter (inch
es)
R.1
6-12
16 16
14 16
16-1
2
16
16
t, 0) o 0, a a,
«w o 0) a,
>>
H
T,
75
T,
50
T,
40
T,
50
T,
50
T,
25
T,
25
T,
40
0) 5 i i i i i i i i
Discharge
(gpm)
Drawdown
(feet)
Mea
suri
ng
poi
nt
Description
Top
cas
ing..
Top
cas
ing .
.
.....d
o.........
.....d
o.........
....
.do
....
....
.
.....d
o.........
....
.do
....
....
.
....
.do
....
....
.
Distance
above or below
(-)
land
surfac
e (fee
t)
1 .5
0 2
.5
1 1 0
Wat
er l
evel
Date
measured
5-3
1-5
1
5-3
1-5
15-2
2-5
6
4-
8-57
5-3
1-5
1
Mar
., 1
956
5-3
0-5
1
10
-29
-51
5-2
2-5
6
4-
8-57
5-3
0-5
1
5-3
0-5
1
2-2
3-5
5
5-3
0-5
1
10-
7-55
Depth
to
water
below land-surfa
ce datum (fee
t)
161.
2
a!8
0+
19
4.14
a!4
0+
f 199
.1
a200
+
e!54
186.
36
200.
0 15
4.3
a!6
3.0
e!7
9
a!7
5.6
200.
6
Temperature
(°F)
74 73 74
rt i h 0) O
L c c
Remarks
Des
tro
yed
.
Obst
ruct
ion a
t 21
3 +
ft.
Cas
ing c
oll
aps
ed
221
ft.
Ci

33Q
21
33Q
3
33Q
4
36J1
36
P1
19-
1D1
1E1
1M1
1M2
2L1
2Q1
10P
1
11C
1
11G
1
8507
8506
8509
9474
9480
9511
9510
J.
B.
Hil
l C
o.,
13.
J.
B.
Hil
l C
o.,
16.
J.
B.
Hil
l C
o.,
15.
J.
B.
Hil
l C
o.,
36.
J.
B.
Hil
l C
o.,
35.
J.
B.
Hil
l C
o...
....
.do
....
....
....
.....d
o............
.....d
o............
J.
B.
Hil
l C
o.,
W.
C.
6.
J.
B.
Hil
l C
o.,
W.
C.
5.
J.
B.
Hil
l C
o...
....
...
....
...
615
615
610
495
508
282
286
287
287
298
300
330
304
305
320
........
704
16
14
16
R,
18
R,
16
P,
6
P,
4P
, 10
P,
6
R,
G,
16
R,
16
P,
10
P,
10
R.
16
T,
30
T,
50
T,
50
T,
100
L.g
T,
d
L,
w
L,
w,
g
L.
e
I I U I I s U I s s s
......
......
..
.....d
o.........
.....d
o.........
.....d
o.........
Top c
asi
ng..
Top c
asi
ng
..
Top c
asi
ng
..
.....d
o.........
.....d
o.........
.....d
o.........
.....d
o.........
1 .5
0 1 0 2 1 1.6
0 1
5-3
0-5
1
5-2
2-5
6
5-3
1-5
1
3-
5-5
5
5-3
0-5
1
5-2
2-5
6
10-
7-5
5
5-2
2-5
6
6-
7-5
1
6-
7-5
1
10-1
9-5
5
5-
8-5
6
10-1
9-5
5
5-
8-5
6
6-8
-51
8-
2-5
1
10
-19
-55
5-
8-5
6
4-
9-5
7
6-
7-5
1
10-1
9-5
5
a!7
0.4
17
9.3
9
168.
1
e!90
16
4.8
184.8
19
7.9
17
2.9
8
19.5
Dry
68.7
68.8
98.8
98.2
8
25.0
25.0
25.3
25.4
25.4
94.2
94.4
74 75 77 80
C .....
C C C
Dest
roy
ed
be
fo
re
1955
. D
o.M
easu
red
dep
th
66 f
t,
1951
. D
estr
oyed
be
fore
195
5.D
est
roy
ed
be
fo
re
1955
.
Mea
sure
d d
epth
10
0 ft
, 19
55.
Ob
stru
ctio
n a
t 90
ft,
19
55.
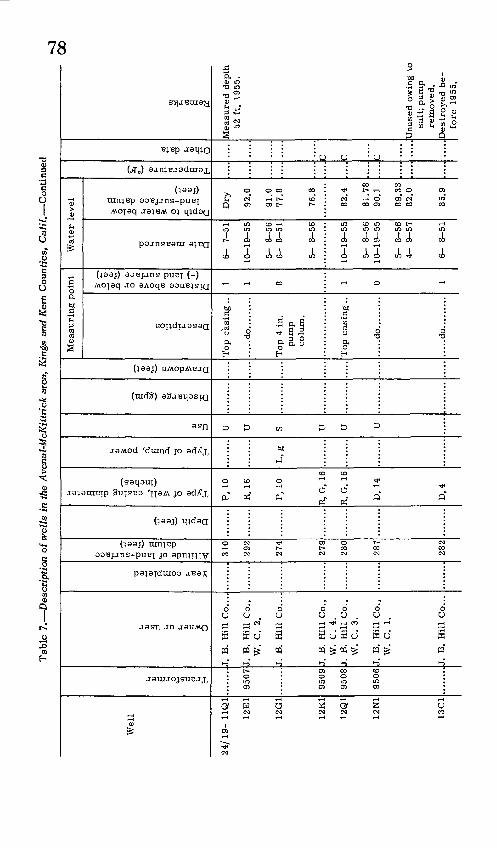
to
CD1
oo to to to to to 1-1O 2| <O W O M <O
CD CD CD 01 en en o o o03 00 CD
c_i CH c_i CH
u o J.
O 5
to00to
o
}.t
S p ffi P (#>-*& 0 ' 0 ' 3 O
to to co co<I O
O P03
a &
H -§
* §5'TO
h-i O h-i
03 ^Cn jpcn £
fcp co cp co cp T I T T T en en en en en en
i-" -3 O3 en 03 01
CO CO 00 CD CO 00en to CD on-1 to
00 CO
: : :
50 o
toCD
CD en ; o-j ;
S P tono
to
a03
j"1
TO
a
i * * '^ C P
5"1 J^
o n o p
CO OO CD I-1 CO O
d Jt
03 O
a a
H o a
S1 ^ en
TO
00 i_x )-.
r rr ? rf ff T f en en en en en03 i-" 03 en i-1
-] -J CD CD O 03 -3 h-i tO 4
00 00 O O
. h h b
o 'g § "> $ *1 to 2 01 O 3 B) £ to f i-J JJ' jjj ,:_, m M
S S. 2. B i » a
re
Transformer
Owner or user
Year completed
Altitude of land-surface datum (feet)
Depth (feet)
Type of well, casing diameter (inches)
Type of pump, power
Use
Discharge (gpm)
Drawdown (feet)
Description
Distance above or below (-) land surface (feet)
Date measured
Depth to water below land-surface datum (feet)
Temperature (°F)
Measuring point
Water level
Other data
Remarks
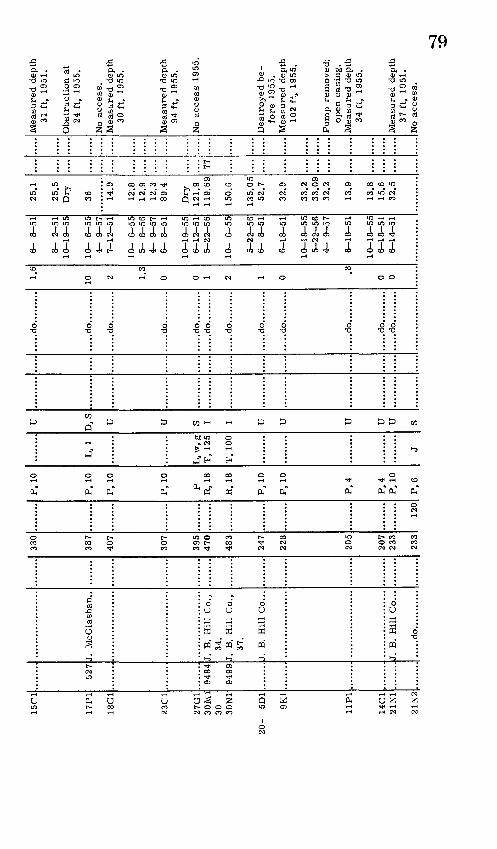
15C
1
17P
1
18G
1
23C
1
27G
130
M1
30
30N
1
20-
5D1
9K1
11P
1
14C
121
N1
21N
2
527
9484
9499
J.
B.
Hil
l C
o.,
34.
J.
B.
Hil
l C
o.,
37.
J.
B.
Hil
l C
o...
J.
B.
Hil
l C
o...
....
.do
....
....
...
330
387
407
307
395
470
483
247
22R
205
207
233
233
120
P,
10
P,
10
P,
10
P,
10
P R,
18
R,
18
P,
10
P,
10
P,
4
P,
4P
, 10
P,
6
L,
1
T,
125
T,
100
J
TT n, R TT TT R T T TT TT TT TT TT S
....
.do..
....
...
....
.do..
....
...
....
.do..
....
...
....
.do..
....
...
....
.do..
....
...
....
.do..
....
...
....
.do..
....
...
....
.do..
....
...
....
.do..
....
...
....
.do..
....
...
....
.do..
....
...
....
.do..
....
...
1.6
10 2 1.3
0 0 1 2 1 0
.8
0 0
6-
8-5
1
8-
2-5
110-1
9-5
5
10-
6-5
54-
9-5
77
-12
-51
10-
6-5
55-
8-5
64-
9-5
76-
8-5
1
10
-19
-55
6-1
2-5
15
-22
-56
10-
6-5
5
5-2
2-5
66-
8-5
1
6-1
8-5
1
10-1
8-5
55
-22
-56
4-
9-5
7
6-1
8-5
1
10-1
8-5
56-1
8-5
16-1
4-5
1
25.1
25.5
Dry
36 14.9
12.8
12.9
12.3
89.4
Dry
121.
91
19
.69
150.
6
13
5.0
552.7
32.9
33.2
33
.09
32.2
13.9
13.8
15.6
32.5
77
Mea
sure
d d
epth
31
ft,
19
51.
Ob
stru
cti
on
at
24 f
t,
1955
.
No
access
. M
easu
red
dep
th
30 f
t,
1955
.
Mea
sure
d d
epth
94
ft,
19
55.
No
access
19
55.
Des
troyed
be
fore
19
55.
Mea
sure
d d
epth
10
2 ft
, 19
55.
Pu
mp
rem
ov
ed;
open
cas
ing.
Mea
sure
d d
epth
34 f
t,
1955
.
Mea
sure
d d
epth
37 f
t,
1951
. N
o access
.
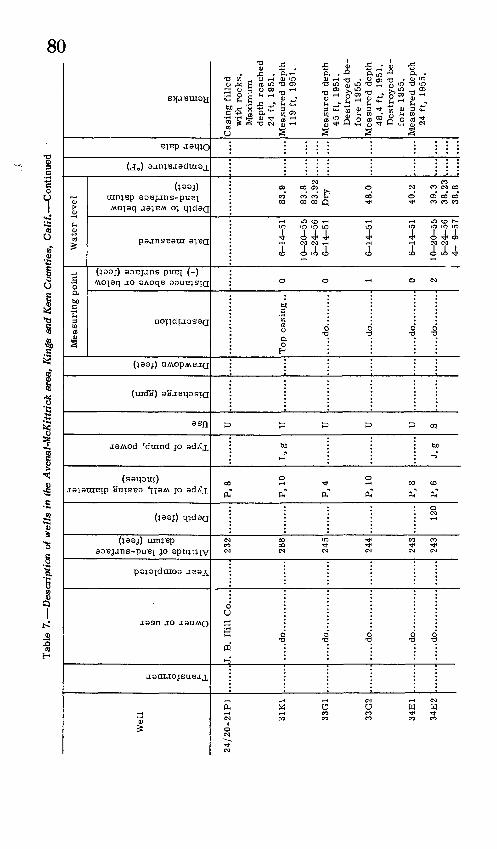
to
COo
1 co co co oo co to
W H O O W ?
3
K)
d
i05
n
co
J-
i.3
K>
.0
oo
«
3
3
£
D
*
i 3
a.3
to 1\
&
IN3oo oo
o
r(TO
d d
- j
0
00 T
n-* XJ
N3 O 1 O O
*. tn 0 05 O5 05CJ1O05
NJ CO ^ (- t- NJ NJ (-
?r? t r rr? r enenenen tn en en en en
cococo^ ^ O oo co co oo oo co o oo HJ co co coco to GO K> o CD co co
co to
r :
LH
td
J-
)
N3 CO N3
doo
-
J5C(T> .d^Cn) -JJC CJ5n-X_pT(jq
enfT)' &^OfT)" & » * n> enfT)> *o CQ& *O rr'^'O rr*T3 I-1 "O * P*
<4- fD ""* " rn "" -S- n>
(5
Transformer
Owner or user
Year completed
Altitude of land-surface datum (feet)
Depth (feet)
Type of well, casing diameter (inches)
Type of pump, power
Use
Discharge (gpm)
Drawdown (feet)
Description
Distance above or below (-) land surface (feet)
Date measured
Depth to water below land-surface datum (feet)
Temperature (°F)
Measuring point
Water level
Other data
Remarks
08
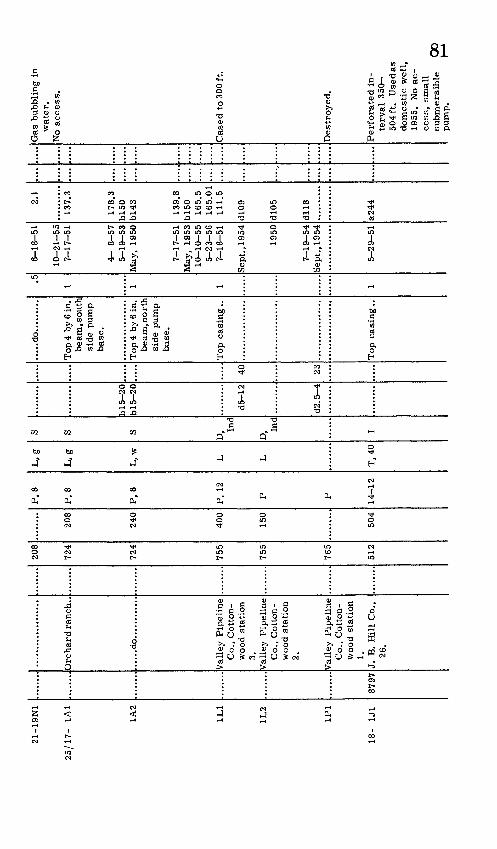
21-1
9N
1
25/1
7-
1A1
1A2
1L1
1L2
1P1
18-
1J1
8797
Orc
hard
ran
ch. .
....
.do
....
....
....
Val
ley
Pip
elin
eC
o., C
ott
on-
woo
d st
atio
n3.
Val
ley
P
ipel
ine
Co
., C
ott
on-
wood s
tati
on
2.
Val
ley
P
ipel
ine
Co
., C
ott
on-
wood s
tati
on
1.J.
B
. H
ill
Co
26.
?08
724
724
755
755
765
512
208
240
400
150
504
P,
8
P,
8
P,
8
P,
12
P P 14-1
2
L,g
L,g
L,
w
L L
T,
40
S S S
D, In
d
D, In
d
I
bl5
-20
bl5
-20
d5-1
2
d2.5
-4
40 23
....
.do
....
....
.
beam
.south
si
de
pum
p
bas
e.
be am
, no
rth
si
de
pum
p
bas
e.
.................
,5
1 1 1
....
..
1
6-1
8-5
1
10-2
1-5
57
1 7
M
4-
8-5
75
-19
-53
May
, 19
50
7-1
7-5
1
May
, 19
5310-1
0-5
55
-23
-56
7-1
8-5
1
Sep
t., 1
954
1950
7-1
9-5
4S
ept.
,19
54
5-2
9-5
1
2.1
m-j
178.
3b
!50
b!4
3
13
9.8
b!5
01
65
.516
5.01
11
1.5
d!0
9
d!0
5
dl!
8
a24
4
....
....
wate
r.
Cas
ed t
o 3
00 f
t.
Des
tro
yed
.
terv
al
350-
504ft
. U
sed a
s dom
esti
c w
ell,
19
55.
No
ac
cess
, sm
all
su
bm
ers
ible
00
pu
mp
. H
"1
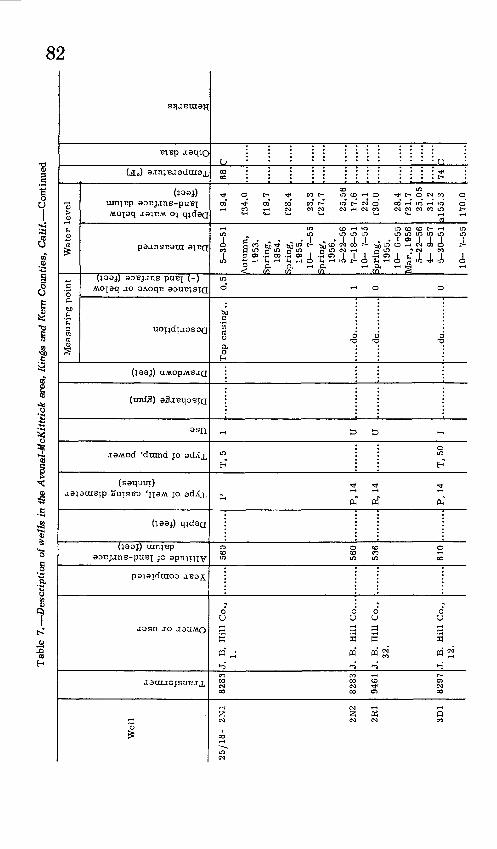
toen
CO
co to to toO £3 ^H ^
CO CO 00 00to tJ^- to toCO OS 00 00 -J I-- CO CO
to W to
ffi
n o
co3
"U
H
cno
~
5
33
3n o
tn COCO
*
c
)
CH JH
3d bd
n n o p
tn tnCO CO 0 0
T)
tn
C i-
H _3
o o 0 a n >
U
001-- p tn
I T 1 TP I CO K- I 1 1 CO H' I CO £' CD £ CO H TCo CO*. tn *^ * * CO tn *^ tn^cn^tnB Co
j o CD to * * cn tn TO ^j GO to co ^ * J tn TO ^ TO co P oI T T I w T " i T i * ! * " ? T tntntntntntn tntntn tn tn
tn H- * -j co co tn tn t * co cn H- *
-j tncotototo cotoi-'to toto to i-1 co i-1 o 01 H> 01 H> oo Oto-atn -jco oo co ^ coO CO to O -J *" Oh-'COCn -J to il^ -J o *"
tn co
n . . . . .... . . n
fD
Transformer
Owner or user
Year completed
Altitude of land-surface datum (feet)
Depth (feet)
Type of well, casing diameter (inches)
Type of pump, power
Use
Discharge (gpm)
Drawdown (feet)
Description
Distance above or below (-) land surface (feet)
Date measured
Depth to water below land-surface datum (feet)
Temperature (°F)
Other data
Measuring point
Water level
Remarks
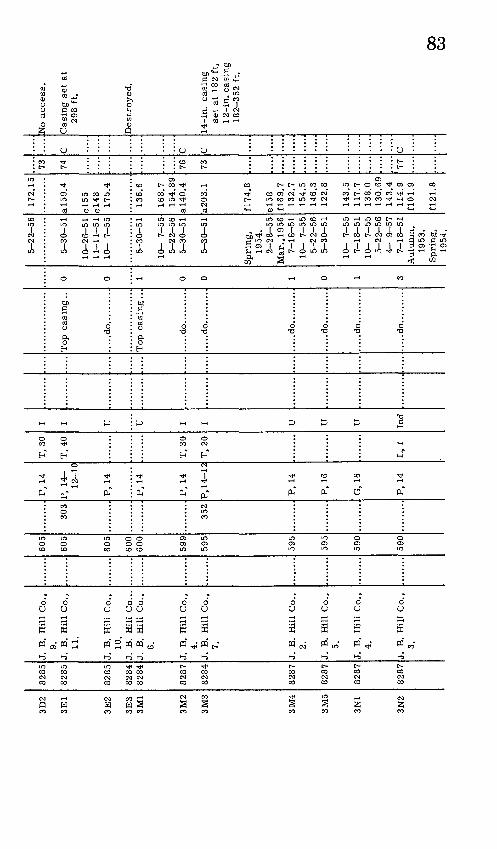
3D2
3E1
3E2
3E3
3M1
3M2
3M3
3M4
3M5
3N1
3N2
8285
8285
8285
8284
8284
8287
8284
8287
8287
8287
8287
J.
B.
Hil
l C
o9.
J.
B
. H
ill
Co
11.
J.
B.
Hil
l C
o10
.J.
B
. H
ill
Co
J.
B.
mil
Co
6.
J.
B.
Hil
l C
o4.
J.
B
. H
ill
Co
7.
J.
B.
Hil
l C
o 2.
J.
B.
Hil
l C
o 5.
J.
B.
Hil
l C
o4.
J.
B.
Hil
l C
o 3.
605
805
R05
ROO
ROO
599
595
595
595
590
590
303
352
P,
14
P,
14
-12-1
0
P,
14
P,
14
P,
14
P, 1
4-1
2
P,
14
P,
16
G,
16
P,
14
T,
30
T,
40
T,
30
T,
20
L,
1
T T TT TT T T TT TT TT Tnd
Top c
asi
ng..
.....d
o..........
....
.do
....
....
..
.....d
o..........
.....d
o..........
.....d
o..........
....
.do
....
....
..
....
.do..
....
....
0 0 1 0 0 1 0 1 3
5-2
2-5
6
5-3
0-5
1
10-2
6-5
111-1
1-5
110-
7-5
5
5-3
0-5
1
10-
7-5
55-2
2-5
65
-30
-51
5-3
0-5
1
1954
. 2
-28
-55
Mar
., 1
956
7-1
8-5
110-
7-5
55
-22
-56
5-3
0-5
1
10-
7-5
57-1
8-5
110-
7-5
55-2
2-5
64-
9-5
77
-18
-51
1953
.
1954
.
17
2.1
5
a!5
9.4
e!5
5e!4
81
75
.4
136.
6
16
8.7
15
4.8
9a!4
0.4
a203.1
£174
.8
e!58
£169
.71
32
.715
4.5
146.
31
22
.8
143.
511
7.7
138.
01
30
.69
14
3.4
11
4.9
£101
.9
£121
.8
73 74 7fi
73 77
C c C c
No
access
.
bas
ing s
et
at
298
ft.
Des
troyed
.
14-i
n.
casi
ng
se
t at
18
2 ft
, 12-i
n.
casi
ng
1
82
-35
2 f
t.
00
CO
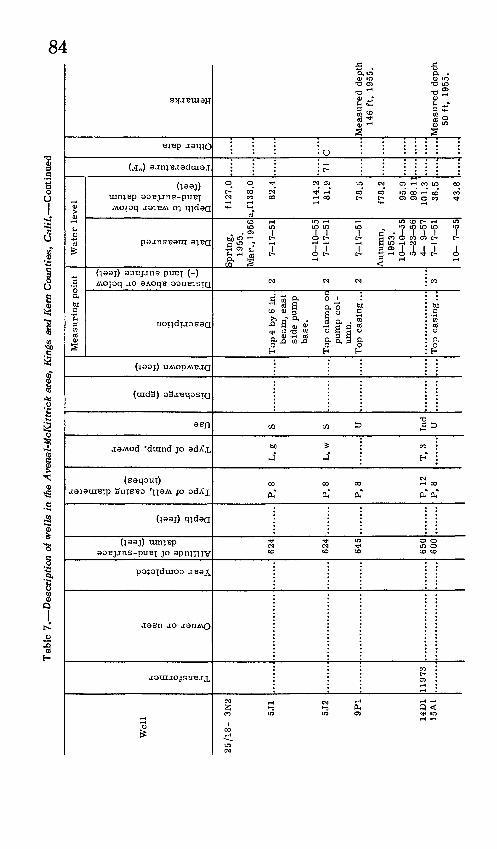
CO tn
oo
en *> co 01 en co> O t) =3 ^ 2! h-> h-> |_i CO (- ^3
i
i
co -aCO
01O O
T)
oo
-
u A
Q
CO
Olcn o
^
o
HCO
3 L
!
(
Oi Oi C73 *" CO COcn *> *>
XI t) ^00 00 00
r r ^ TO
Cj CO CO
;
-^ H H3C"O"§ tT01tT>2
Be13 Pt!'"1^. 5B5o 01 S" p * 5. ' -5 jjj " ^ .B «§ 3 2 £ £ (t Olo o ^ 3 P _,.
" o -o £. 3
CO CO CO
ft g en
fo * 01 p l S- -J ~J<? T3 2 "-1 ** llTltoc 1 IT 1 .^ <° 5' !- to i en B > i-'i >-' en 3
f r?f?-wl r r? r s-^ cncncncnm** en cncn cncn cni -jcncn i-1 i-'cn 1 01
P
£>COOC0C0-J-J 001 CO W tocooii-'oocnoooo i ^ tooo-joo en co t co co en coco rfs>. oo
.... Q .
1 1 en H> L_ (D
ss is 2 c c « >-! r? >-! _ (t .^ (tStt ^a en a. co a. en (t en n' "H- .cn>2-
(B
Transformer
Owner or user
Year completed
Altitude of land-surface datum (feet)
Depth (feet)
Type of well, casing diameter (inches)
Type of pump, power
Use
Discharge (gpm)
Drawdown (feet)
Description
Distance above or below (-) land surface (feet)
Date measured
Depth to water below land-surface datum (feet)
Measuring point
Water level
Temperature (°F)
Other data
Remarks
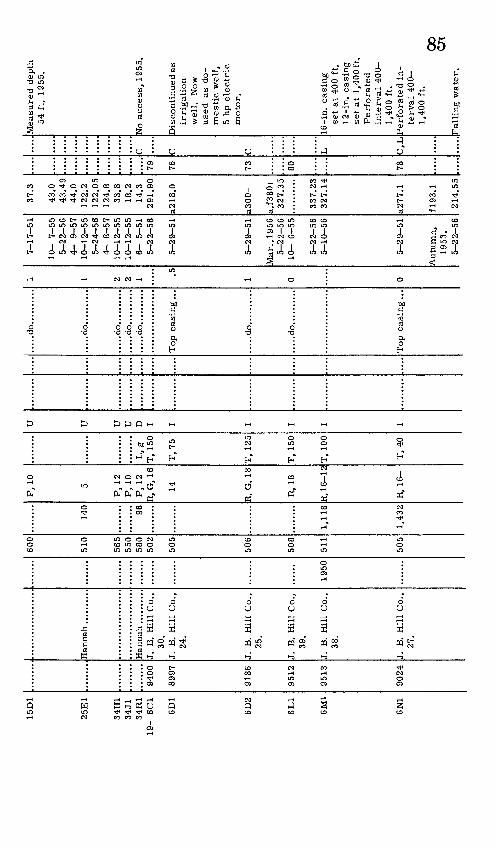
15D
1
25E
1
34H
134
J134
R1
19
- 6C
1
6D1
6D2
6L1
6M1
6N1
9400
8997
9186
9512
9513
9024
J.
B.
Hil
l C
o.,
30.
J.
B.
Hil
l C
o.,
24.
J.
B.
Hil
l C
o.,
25.
J.
B.
Hil
l C
o.,
39.
J.
B.
Hil
l C
o.,
38.
J.
B.
Hil
l C
o.,
27.
1950
fiOO
510
565
550
580
502
505
50fi
508
511
505
140 96
1,11
8
1,43
2
P,
10 5
P,
12P
, 10
P,
12R
, G
, 16
14
R,
G,
18
R,
18
R, 1
6-1
2
R,
16-
L,
gT
, 15
0
T,
75
T,
125
T,
150
T,
100
T,
40
TT TT TT TT n T T T T T T
....
.do
....
....
..
.....d
o..........
.....d
o..........
....
.do
....
....
.......d
o..........
.....d
o..........
.....d
o..........
1 1 ?: ?,
1
5
1 0 0
7-1
7-5
1
10-
7-5
5
5-2
2-5
6
4-
9-5
7
10
-12
-55
5-2
4-5
6
4-
8-5
7
10-1
2-5
5
10-1
2-5
5
6-
5-5
15
-22
-56
5-2
9-5
1
5-2
9-5
1
Mar
. ,1956
5-2
2-5
6
10
- 6-5
5
5-2
2-5
6
5-1
0-5
6
5-2
9-5
1
Autu
mn,
1953
. 5-2
2-5
6
37.3
43.0
4
3.4
9
44.0
12
2.2
12
2.0
5
124.
8 33.8
18
.2
14.3
291.9
0
a21
8.0
a300+
a,f3
80+
327.3
5
337.2
3
327.1
4
a27
7.1
f!93.1
214.5
5
.....
79 76 73 80 78
C .....
C C L C,L
Mea
sure
d d
epth
54
fi,
19
55.
No
access
, 19
55.
Dis
conti
nued
as
irri
gati
on
wel
l.
Now
use
d
as d
o
mest
ic w
ell.
5 hp
ele
ctr
icm
oto
r.
16
-in
. casi
ng
se
t at
400
ft,
12 -in
. casi
ng
se
t at
1,4
00ft
.P
erf
ora
ted
inte
rval
400
1,4
00 f
t.P
erf
ora
ted
in
terv
al
400-
1,40
0 ft
. 00
Ol
Fal
ling w
ate
r.

Tab
le 7
. D
escr
ipti
on o
f w
ells
in
the
Ave
nal-
McK
ittr
ick
area
, K
ings
and
Ker
n C
ount
ies,
Cali
f. C
onti
nued
oo
Wel
l
25
/19
- 6P
1
6P
2
7 M
l
7N1
7P
1
11P
1
!-, <1> s !-, «2 tn c ed H
9660
9530
9141
9456
8989
^ <u 3 O IL, C 1
J.
B.
Hil
l C
o.,
42.
J.
B.
Hil
l C
o.,
41.
J.
B.
Hil
l C
o28
.
J.
B.
Hil
l C
o.,
31.
J.
B.
Hil
l C
o29
.
T3 -2 U "a 1 o j^ a
u o ni 3 ,-
.?
"£
73 ,
2ni
"""
1 '
S«t
-j 3
o 5
73 p r-t
^
504
505
499
505
490
404
^* » o <£ a a
1,12
6
I 1 rH 73 C .
ni
"°
O.
CI 1
-|H
t"o Q) a. H"
R,
16
R,
16
16-1
2
16 16
P,
8
^ 1 a d. Q,
CM o <1> Q,
H"
T,
100
T,
100
T,
75
T,
20
T,
75
L,
g
u 5 I I I I I S
I a is a1 ni o Q
^ _ t5 0)
C4-
I c: o 73 £ rt Q
Mea
suri
ng p
oin
t
c o r-t "5, o Q
Top c
asin
g .
.
....
.do..
....
...
....
.do..
....
...
£~
2 g
° ^
O
0
<u c2
>
fn
0
3J2
<fl
fl>
C
o
niC
-
1cd
^->
tn
-I-
1 1 1
Wat
er l
evel
73 <1> 3 ni u S ^_, <S
5-2
2-5
6
5-2
9-5
1
Autu
mn,
1953
.10-1
0-5
5
5-2
2-5
65-2
9-5
1
Autu
mn,
1953
.5-2
2-5
6
t g
o 3
^ ^
fn
0>S3
o
*J
Oj
rt v
^
3o
"P ^
1 "2
«X
j *-
fl>
Ci,
cti
*w
Q 154.
35
a32
9.6
f!70.7
130.
1
11
9.8
527
9.3
151.
5
121.
77
F u !-, 3 ni
!-, u Q,
H 81 77 78
ni u o
C,
L
C
tn ni «
Fall
ing w
ate
r.
16-i
n.
casi
ng
set
at 3
83 f
t,12
-in
. ca
sin
gse
t at
1,0
51ft
.P
erf
ora
ted
inte
rval
383-
1,05
1 ft
.
No
access
.
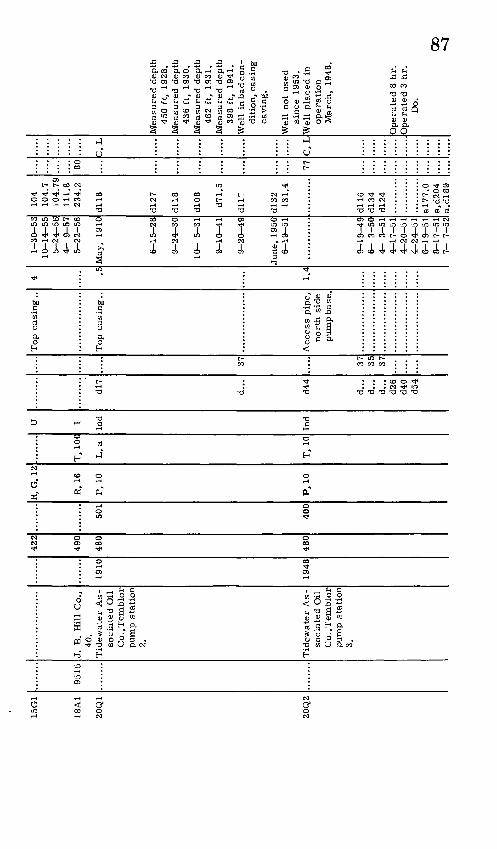
15G
1
18A
1
20Q
1
20Q
2
9515
J.
B.
Hil
l C
o.,
40.
Tid
ewat
er A
s
soci
ated
Oil
C
o. .T
em
blo
r p
um
p s
tati
on
2.
Tid
ewat
er A
s
socia
ted O
il
Co.
.Tem
blo
r pum
p s
tati
on
3.
1910
1948
4??
490
480
480
501
400
R,
G,
12
R,
16
P,
10
P,
10
T,
100
L,
a
T,
10
U I
Ind
Ind
d!7
d...
d44
d...
d...
d...
d26
d40
d54
37 37 35 37
Top c
asi
ng..
Top c
asi
ng..
Acc
ess
pip
e,
nort
h s
ide
pum
p b
ase.
4
.5
1.4
1-3
0-5
3
10-1
4-5
5
5-2
4-5
6
4-
9-5
7
5-2
2-5
6
May
, 19
10
6-1
5-2
8
9-2
4-3
0
10-
5-3
1
9-1
0-4
1
9-2
0-4
9
Jun
e, 1
950
6-1
9-5
1
9-1
9-4
9
6-
3-5
0
4-
3-5
1
4-1
7-5
1
4-2
0-5
1
4-2
4-5
1
6-1
9-5
1
8-1
7-5
1
7-
7-5
2
104
104.
7 104.7
9
111.
8 234.2
dl!
8
d!2
7
dl!
8
d!0
8
d71.5
dll
?
d!3
2
131.4
dl!
6
d!3
4
d!2
4
a!7
7.0
a,
d2
04
a,d
!89
80 77
3, L
C,
L
Measu
red d
epth
45
0 ft
, 19
28.
Mea
sure
d d
epth
43
6 ft
, 19
30.
Mea
sure
d d
epth
46
2 ft
, 1931.
Mea
sure
d d
epth
39
8 ft
, 19
41.
Wel
l in
bad
con
dit
ion,
casi
ng
ca
vin
g.
Wel
l not
use
d
since 1
953.
W
ell
pla
ced i
n
opera
tion
Mar
ch,
1948
.
Oper
ated
8 h
r.
Oper
ated
3 h
r.
Do.
oo
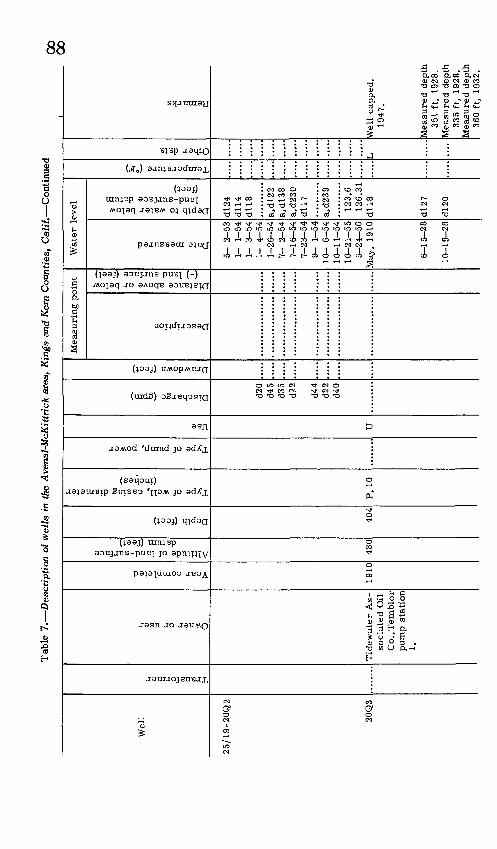
toOl
COi
to too o £> £> 03 to
H
ra g S" «
ff £ o > o o £ «
CO
o
co o
o
o
«a a a a a a a o to it* to ai yi o
6-15-28 10-19-28
a a to toO -J
3 r???f rrrrrrrr to to i-* to i to
ztl^lllllltllli-'toto Q. >-'i:!'2:2: ' '-'to O3O5W tO ^j W ^^ " CO»t^^
. . 03 CO W tO OJ O3 CO O CO tO
r .............
. Measured depth 351 ft, 1928.
Measured depth 335 ft, 1928.
Measured depth 360 ft, 1932.
,_, (B CO 1=1
o o(ta
1
Transformer
Owner or user
Year completed
Altitude of land-surface datum (feet)
Depth (feet)
Type of well, casing diameter (inches)
Type of pump, power
Use
Discharge (gpm)
Drawdown (feet)
Description
Distance above or below (-) land surface (feet)
Date measured
Depth to water below land-surface datum (feet)
Other data
Measuring p
oint Water level
Remarks
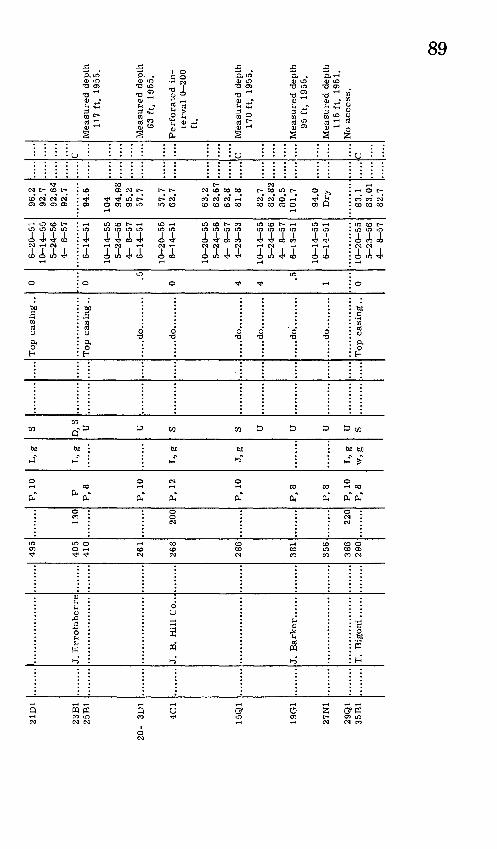
21D
1
23B
1 25
B1
20-
3D1
4C1
15Q
1
19G
1
27N
1
29Q
1 35
B1
J. B.
Hil
l Co..,
495
405
410
261
268
286
381
356
386
290
130
200
220
P, 10
PP, 8
P, 10
P, 12
P, 10
P, 8
P, 8
P, 10
P, 8
L, g
Ug
L, g
J.g
L, g
S
D, S U U S S U U U U S
....
.do.
....
....
....
.do.
....
....
.....do.........
....
.do.
....
....
....
.do.
....
....
....
.do.
....
....
0 0
.5
0 4 4
.5 1 0
6-20-51
10-14-55
5-24-56
4- 8-57
6-14-51
10-1
4-55
5-24-56
4- 8-57
6-14-51
10-20-55
6-14-51
10-20-55
5-24
-56
4- 9-57
4-23-53
10-14-55
5-24-56
4- 8-57
6-13
-51
10-1
4-55
6-14
-51
10-2
0-55
5-23-56
4- 8-57
96.2
92.7
92.64
92.7
94.6
104 94.9
895
.257.7
57.7
62.7
63.2
62.67
62.8
81.8
82.7
82.82
80.5
101.
7
94.0
Dry
83.1
83.0
182
.7
C C r
Mea
sure
d d
epth
11
7 ft
, 19
55.
Mea
sure
d d
epth
63
ft,
19
55.
Perf
ora
ted i
n
terv
al
0-2
00
ft.
Mea
sure
d d
epth
17
0 ft
, 19
55.
Mea
sure
d d
epth
95
ft,
19
55.
Mea
sure
d d
epth
115
ft,
1951
. N
o access
.
00 co
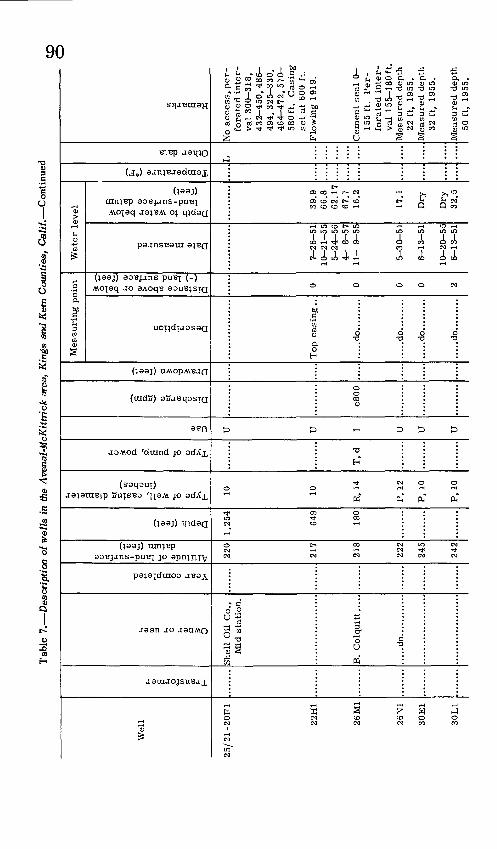
toOl
00 OJ CO CO t\3 tO O O Cn Cn to Otr* W S| g K 2
:o
3
«
3
CO
Jl
to
a
3
wv J
0 0. , 3j.
[O CO CO l-< CO O3
co o
o *
H a
a
(Dco o o
3. 1. 3 0
(
g JLo.
sen o
5
«
03 ODn
t»
CO O O O O
T? f T rtrrr l-> tO l-> Cd CO 10 CO
r? r ? f?rr? 01 oi 01 01 01 01 01 01 01t * Ol I-* I-* CJl^JOiCJll-*
tO hj hj
I * H* O3 O3 O3-a en -a co en
ooCO
I-* CO -3 I-* O3 CO-a
I : : : : : : :
o3
O Ol
5
«
w| ^1^1^^^? ?Ko,^^^<-°
r-l- f-i- -!- Hi*? 'r"3'QOCT)»H|-jrr rrj^? 1 /JSI" .1
1
Transformer
Owner or user
Year completed
Altitude of land-surface datum (feet)
Depth (feet)
Type of well, casing diameter (inches)
Type of pump, power
Use
Discharge (gpm)
Drawdown (feet)
Description
Distance above or below (-) land surface (feet)
Date measured
Depth to water below land-surface datum (feet)
Temperature (°F)
Measuring point
Water level
Other data
Remarks
06
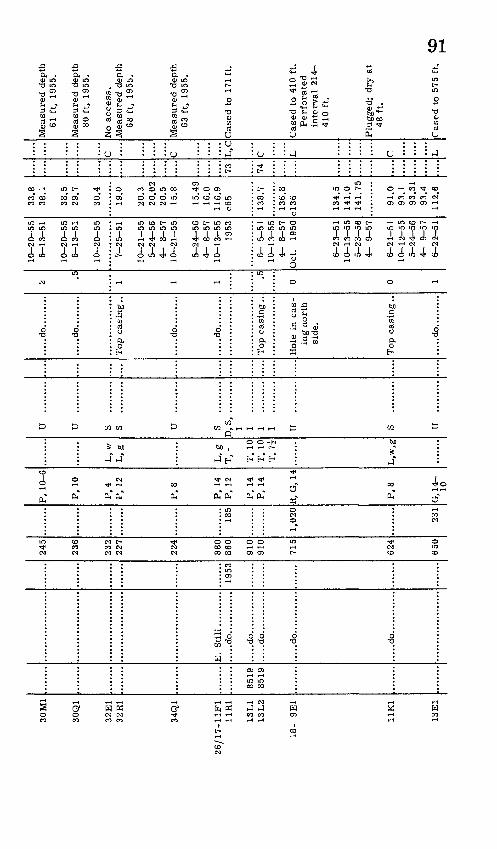
30M
1
30Q
1
32E
1 32
R1
34Q
1
26
/17
-11
F1
11
R1
13L
1 13
L2
18
- 9E
1
11K
1
13E
1
8519
85
19
......
..
E.
Sti
ll..........
.....d
o............
....
.do
....
....
....
.....d
o............
.....d
o............
....
.do
....
....
....
1953
....
...
245
236
232
227
224
880
860
910
910
715
624
650
185
1,02
0
231
P,
10
-6
P,
10
P,4
P
, 12
P,
8
P,
14
P,
12
P,
14
P,
14
R,
G,
14
P,
8
G,1
4-
10
L,
w
L.g
L.g
T
, -
T,
10
T,
10T
7 l
L,w
,g
U
.........
U
.........
s ...
......
s ...
......
u ...
......
s ...
......
D,
S, .........
I I .........
I .........
I ..
....
...
U
.........
s ...
......
u ...
......
.....
....
.do..
....
...
....
.do..
....
...
Top c
asi
ng
..
....
.do..
....
...
....
.do..
....
...
Top c
asin
g .
.
Hole
in c
as
in
g n
ort
h
side.
Top
casi
ng..
....
.do..
....
...
2
.5
1 1 1 .5
0 0 1
10-2
0-5
5
6-1
3-5
1
10-2
0-5
5
6-1
3-5
1
10-2
0-5
5
7-2
5-5
1
10-2
1-5
55
-24
-56
4-
8-5
7
10-2
1-5
5
5-2
4-5
6
4-
8-5
7
10-1
3-5
5
1953
6-
5-5
1
10
-13
-55
4-
8-5
7
Oct
. 19
50
6-2
3-5
1
10-1
3-5
5
5-2
3-5
6
4-
9-5
7
6-2
1-5
1
10-1
2-5
5
5-2
4-5
6
4-
9-5
7
6-2
2-5
1
33.8
38
.1
38.5
29.7
30.4
19.0
20.3
2
0.0
2
20.5
15
.8
15.4
9 16
.0
116.
9 c6
5
138.
7
136.
8 c!
36
134.
5 1
41
.0
141.7
5
91.0
93
.1
93.3
1 93.4
11
2.6
....
73 74 ....
.....
C C L,C
C L C L
Mea
sure
d d
epth
61
ft,
19
55.
Mea
sure
d d
epth
80
ft,
19
55.
No
access
. M
easu
red
dep
th
68 f
t,
1955
.
Mea
sure
d d
epth
63
ft,
19
55.
Cas
ed t
o 1
71
ft.
Cas
ed t
o 41
0 ft
. P
erf
ora
ted
inte
rval
21
4
410
ft.
Plu
gged
; dry
at
48 f
t.
Cas
ed t
o 57
5 ft
.
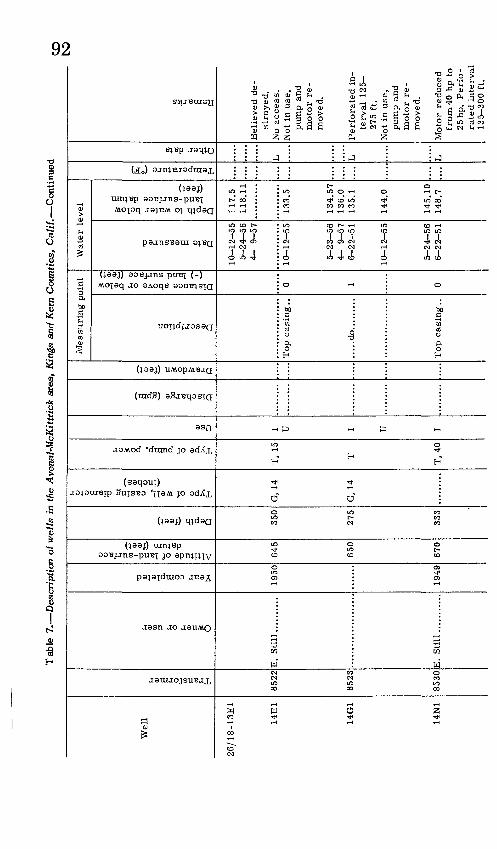
K>cn
oo
(£ 4^ tt* 005 O MM
oo co oo cn cn ui oo to K) o oo t\sM
C/3H1'
CO * CO
05 05 -4 Ul 0 0
00 K> 00 -J 00 Ul
: p' it*.
-H H * o
ej ej
H O ^3O P 01H»-
<*
O
TTKl Kl
rrUl Ull-> O5
^ ^oo m'-4 h->
O
r
H O a
§ o u p « ».IP
I 1 O
? Ttr ? i-* to to i-1 to to cp oo toJl Ul Ul Ol Ul Jl l-> ~3 O5 Ul
^ 00 00 00 CO 4^ Ul O5 i^. 00
O l-1 O Ul Ul-4
M
M-J-
co cn o
05 >£> Ul
00 Ulo
oi.
H
Jl
"
rr?I\3 I-"
?rr Ul m cn -a 05 cn
oo -4I-" Ul
r l r : :
g 51 t) SI S| M ^-ston-S- BB-aS-to-S B,B.-a2-0i«llcopui^cf SgCH-^S^ nnSH55^^r^5-|° §|BS-^^O sal 5- 033 i> a? p « n)2'acS!B3 n>2'acS'<n' OH. M fe S a ^ p g - «. a ^ p w S « a OB^0^ ^Sn) i->2 ^3mDiO.0s» ?^g T § %?. ?§ ? 3 s>^ » 7 B ' ^ ? S" a
3re
Transformer
Owner or user
Year completed
Altitude of land-surface datum (feet)
Depth (feet)
Type of well, casing diameter (inches)
Type of pump, power
Use
Discharge (gpm)
Drawdown (feet)
Description
Distance above or below (-) land surface (feet)
Date measured
Depth to water below land-surface datum (feet)
Measuring point
Water level
Temperature (°F)
Other data
Remarks
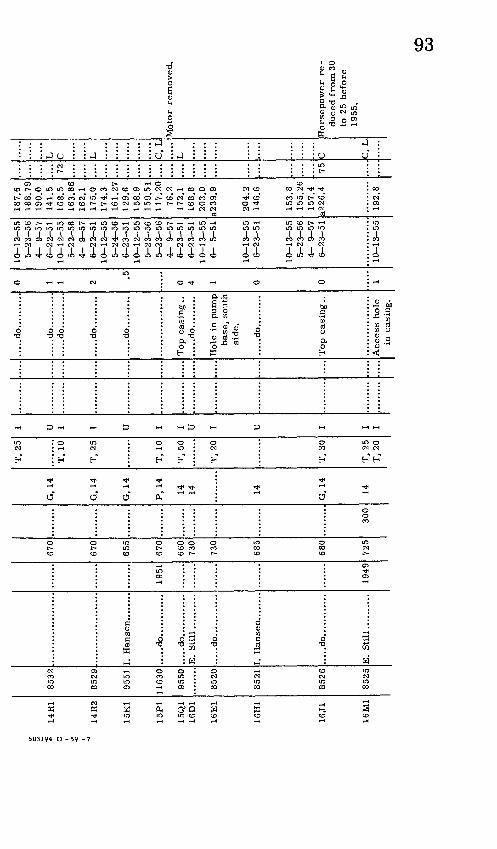
* 14
R1
O
14R
2
15K
1
15P
1
15Q
1 16
D1
16E
1
16H
1
16J1
16M
1
8532
R^9Q
QCC 1
11630
9550
8520
8521
8526
8525
.....do............
.....do............
E. S
till
....
....
..
.....do............
.....do............
E. Still..........
....
...
1951
1949
670
670
655
670
660
730
730
685
680
725
300
G, 14
G, 14
G, 14
P, 14
14
14 14
G, 14
14
T, 25
T, 10
T, 25
T, 10
T, 50
T, 20
T, 30
T, 25
T, 20
T TT T T U I I U I U T T T
....
.do.
....
....
.
....
.do.
....
....
...
...d
o...
....
...
....
.do.
....
....
.....do.........
Top casing..
....
.do.
....
....
base, so
uth
side
.
....
.do.
....
....
in cas
ing.
0 1 1 2 .5
0 4 1 0 0 1
10-12-55
5-23
-56
4- 9-57
6-22-51
10-12-55
5-22-56
4- 9-57
6-22-51
10-12-55
5-24
-56
6-23
-51
10-12-55
5-23
-56
5-23
-56
4- 9-57
6-23
-51
6-23
-51
10-13-55
6- 5-
51
10-13-55
6-23
-51
10-13-55
5-23
-56
4- 9-57
6-23-51
10-13-55
187.6
188.
7919
0.0
141.
516
8.5
163.
8616
2.1
175.
017
4.3
161.
27129.6
158.
915
9.51
117.
2076.2
172.
1 16
8.8
203.0
a239.9
204.2
146.
6
153.
815
5.26
157.
4a2
26.4
192.
8
72 ...
75
T, c L L c
Moto
r re
moved
.
[Hors
epow
er r
e
duce
d f
rom
30
to 2
5 bef
ore
19
55.
<£>
00
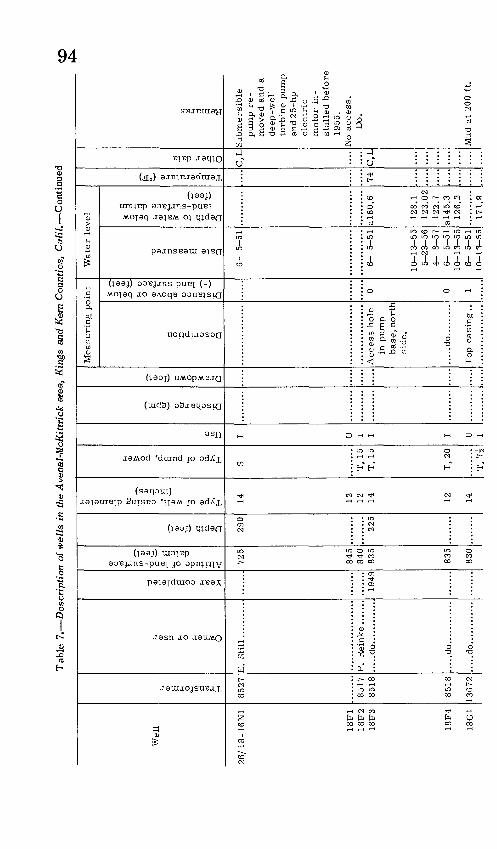
[Oro
COi
CO CO CO CO CO O5
O *1 ^ ^ ^ 211-^ ,£ CO [0 I-1 >-
CO CO CO CO CD Ol Ol Ol -J >- >- >- [O CO CO -3
5 5 O
:
CD
CD
CO CO CO CO CO CO O Ol O!
Ol
* N5 *
H H H J tO I-'oH O Ol
-« -
i
H > o _ M. o
a o p S a>I ° P^IS
cl § * |
i-1 O O
^stncotnqpcoco tn
jn i » 01 > ' <i 03 01 * 'P P
-3 (S5 ^ [O [O N5 O5 ,-L O3 Ol E>^ CO CO O
^) tO CO -3 O I-1 O5
....... o
t335 3"
VD
CO
o
[O
0!
CO O!
-q
t
3 -3
J\ O!
CD O
o *
CO
c;"
TrOl
fD'tCi-j^oiS''^'0
o K°-Mt;-ift>^|-i0 CT3,g'^3!Lgf[>
P"rCO
enM-
0)
Transformer
Owner or user
Year completed
Altitude of land-surface datum (feet)
Depth (feet)
Type of well, casing diameter (inches)
Type of pump, power
Use
Discharge (gpm)
Drawdown (feet)
Description
Distance above or below (-) land surface (feet)
Date measured
Depth to water below land-surface datum (feet)
Measuring point
Water level
Temperature (°F)
Other data
Remarks
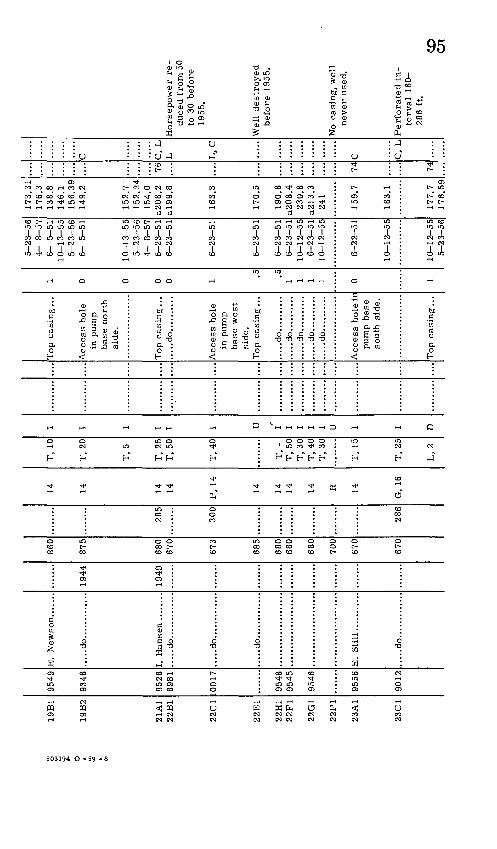
19B1
19B2
21A1
22B1
22C1
22E1
22H1
22F1
22G1
22P1
23A1
23C1
9549
9348
8528
8981
.0017
9548
9545
9546
9556
9012
.....do.............
....
.do.
....
....
....
.....do.............
.....do.............
E. St
ill.
....
....
..
.....do.............
1944
1949
....
...
860
875
680
670
673
685
680
680
680
700
670
670
285
300
286
14 14 14 14
P,
14
14 14 14 14
R
14
G,
16
T,
10
T,
20
T,
5
T,
25T
, 50
T,
40
T,
-T
, 50
T,
30T
, 40
T,
30
T,
15
T,
25
L,
2
T I I I T I U s T T T T I U T I n
in p
um
p
bas
e nort
h
side.
.....d
o..........
in p
um
p
bas
e w
est
sid
e.
.....d
o..........
.....d
o..........
....
.do
....
....
.......d
o..........
.....d
o..........
pum
p b
ase
sou
th s
ide.
1 0 0 0 0 1 .5 51 1 1 1 0 1
5-2
3-5
64-
8-5
76-
5-5
110-1
3-5
55-2
3-5
66-
5-5
1
10-1
3-5
55
-23
-56
4-
8-5
76
-23
-51
6-2
3-5
1
6-2
3-5
1
6-2
3-5
1
6-2
3-5
16
-23
-51
10-1
2-5
56-2
3-5
110-1
2-5
5
6-2
2-5
1
10-1
2-5
5
10-1
2-5
55-2
3-5
6
173.
3117
6.3
138.
814
6.1
15
6.3
91
49
.2
152.
71
52
.24
154.
0a2
08
.2a!
99.8
163.
3
170.5
190.
8a2
08
.4230.8
a21
3.3
241
159.
7
183.
1
17
7.7
17
6.5
9
7fi
74 74
r r T,
T, T, r.
r. C,
T,
Hors
epow
er r
e
du
ced
fro
m 5
0 to
30
bef
ore
19
55.
Wel
l dest
royed
bef
ore
19
55.
No
casi
ng
, w
ell
never
use
d.
Perf
ora
ted i
n
terv
al
160-
286
ft.
CD cn
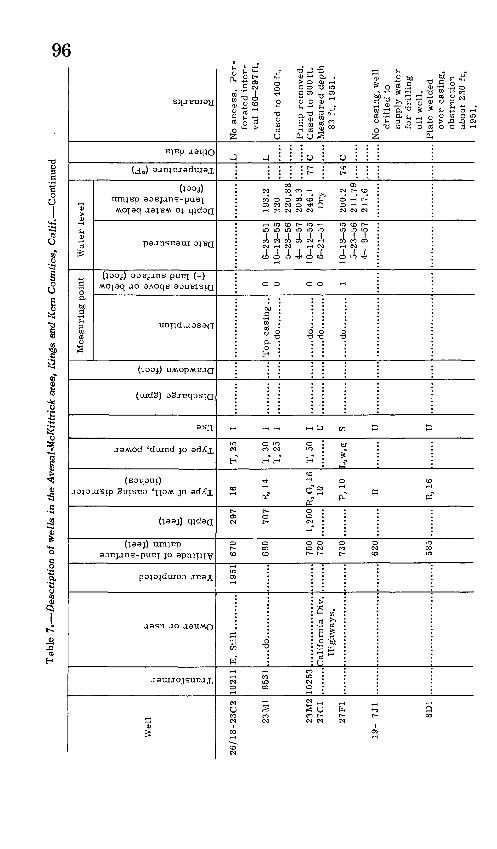
toa>
to co to to to to to
OS -3 -3 -3 CO CO 00
2 S 2 G| g 8
CJI00m
05 tOO
* » O5
C^C^
. 0 00 0 IO CJI IO: en to i-1 ; co i-" i->
California Div. Highways.
i-j -aCO 10 0 O
" ti _,_, O O
rs-<3
cn d
L X3 3
H
2- S23 £
CO en
~J O3 O5o 03 -ao o o
o -a to0 0 COo -a -a
^ » ^O % 03
1- ** O3
H H %H Hen to co too en o en
t-H 1 11 1 1 1
H o *^j
a a n o ° p
a -' (Q
I-' O 0 00
t r? ??t r ?? 10 I-1 to I-1 10 I-1 to
rrr rrrrrr U1U1U1 O1U1U1U1U1U1 *JO5U1 h- 'Ul^JOiUll '
toioio toiototoi-' i-'i-'O Dt^ototoco~]I-'O 1-JO3C33OOOO
O3-31O ^I-'COC» IOco oo
-J ~3 * ^ I ~3
n : o r r
^ 2! g 0 TJ 0 2!i-'poop'o^aia0 °° £ M 3 m ** ?F COO-CT<"->±OCMO co P ® 3 fS P ° P cnotfln>(t>'->i.0£.p _» 0,-a Q, ^So h-crTMs:^a>o£tfl -2 E H, i-S-"' ~3 o 5 » a^g. 5' -^ g s-2 a gg»
S« g S.^B^ *P S^-coS g ?*? * s- s- S. I'l0^ -&§§ ° sa« ^^tw <w o » -"o^ni "> -^ "> ,? * >* - ff " .a r 2 7 S
^ ft
Transformer
Owner or user
Year completed
Altitude of land-surface datum (feet)
Depth (feet)
Type of well, casing diameter (inches)
Type of pump, power
Use
Discharge (gpm)
Drawdown (feet)
Description
Distance above or below (-) land surface (feet)
Date measured
Depth to water below land-surface datum (feet)
Temperature (°F)
Measuring point
Water level
Other data
Remarks
96
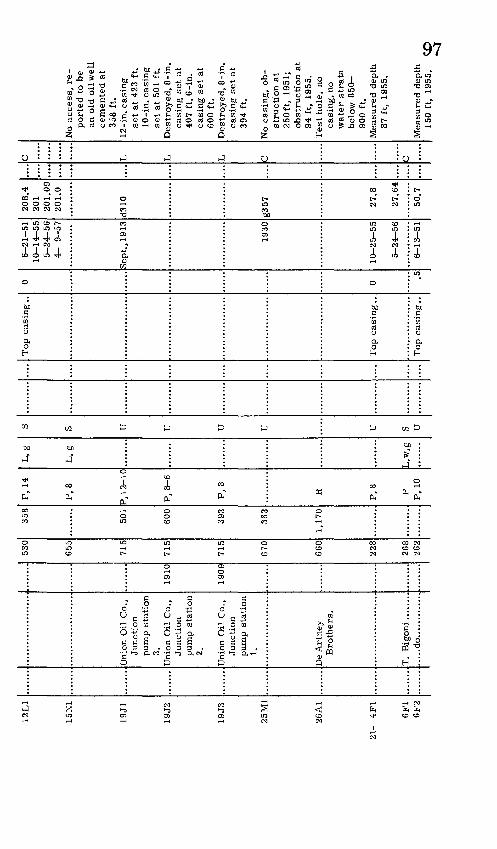
12L
1
15N
1
19J1
19J2
19J3
25M
1
26A
1
21-
4F
1
6F
16F
2
Uni
on O
il C
o.,
Junct
ion
pum
p s
tati
on
3.
U
nion
Oil
Co.,
Junct
ion
pum
p s
tati
on
2.
Uni
on O
il C
o.,
Junct
ion
pu
mp
sta
tio
n
1. Bro
thers
.
T.
Big
on
i. ..
.....
.....d
o.............
1910
1909
530
655
715
715
715
670
660
228
26R
262
358
501
600
393
363
1,17
0
P,
14
P,
8
P, 1
2-1
0
P,
8-6
P,
8
R
P,
8
P P,
10
L
°'
b
L,
g
L w
g
S S TT TT TT TT TT S TT
0 0
.5
6-2
1-5
110-1
4-5
55-2
4-5
64-
9-5
7
Sep
t., 1
913
1930
10-2
5-5
5
5-2
4-5
6
6-1
3-5
1
208.4
201
201.0
9201.0
d310
g357 2
7.8
27.6
4
50.7
r T, T, T, C r
po
rted
to
be
an o
ld o
il w
ell
cem
ente
d a
t 35
8 ft
.
set
at 4
23 f
t.
10
-in
. ca
sing
set
at 5
01 f
t.
casi
ng
set
at
407
ft,
6 -i
n.
casi
ng s
et
at
600
ft.
casi
ng s
et
at
394
ft.
stru
cti
on a
t 250ft
, 19
51;
obst
ructi
on a
t 94
ft,
19
55.
casi
ng
, no
w
ate
r st
rata
b
elo
w 8
50-
900
ft.
87 f
t,
1955
.
150
ft,
1955
. C
D
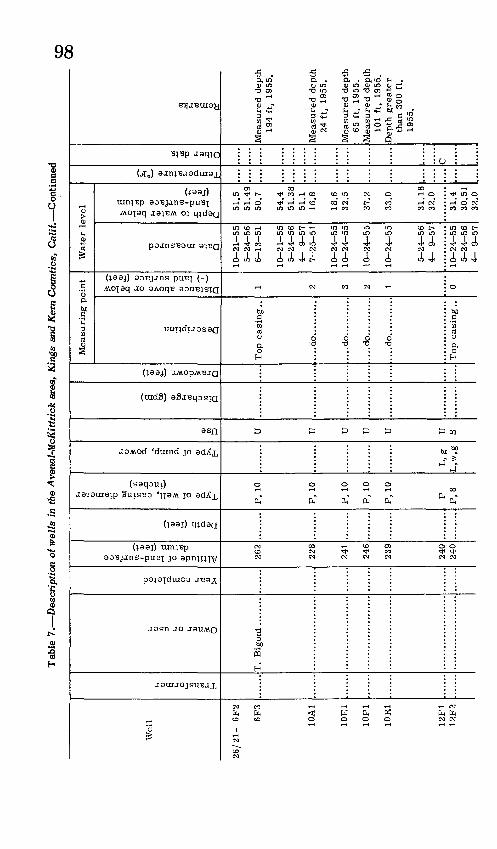
Tab
le 7
. D
escr
ipti
on o
f wel
ls i
n th
e A
vena
l-M
cKit
tric
k ar
ea,
Kin
gs a
nd K
em C
ount
ies,
Cali
f. C
ontin
ued
Wel
l
26/2
1-
6F
2
6F
3
10A
1
10E
1
10P
1
10R
1
12F
112
F2
JU 8 o CO c td fci H
SH w 3
r-i
O C O
CU a a o 0 td
<U td co C~
1 OJ
T3
0)
o|
^-3 <i 262
228
241
246
239
240
240
<U "a <U Q
(U a W>
CO
<uo
"§ . c
(U "o (U H5
P,
10
P,
10
P,
10
P,
10
P,
10
PP
, 8
CU 8 a
"S (U a
L,
gL
,w,g
(U 3 TT TT TT TT U TT S
^^ g (U ff
td 0 ra a
c o td
^ Q
Mea
suri
ng p
oin
t
0 |H "a 0 ra
TOD
cas
ing
....
.do..
....
....
.... .d
o..
.........
,. ...d
o.. ..
....
...
do
_o "
J
^
(U
0
o
<u £
> ^
O
3X
! CO
o td
rt ^
>
rH Q 1 2 3 2 1 0
Wat
er l
evel
o cu 3
CO td (U S (U §1
0-2
1-5
55-2
4-5
66
-13
-51
10
-21
-55
5-2
4-5
64-
9-5
77-2
5-5
1
10
-24
-55
10
-24
-55
10-2
4-5
5
10
-24
-55
5-2
4-5
64-
9-5
7
10-2
4-5
55-2
4-5
64-
9-5
7
o S
oj
fd
<.
<u_.
u
5 f .
!^ 51.5
51
.49
50.7
54.4
51.3
851
.116
.8
18.6
32.5
37.2
33.0
31
.18
32.0
31.4
30.5
132
.0
ft, 3 td S-, (U a S (U H
IS"td
o (U .g o r
CO 0) S (U
194
ft,
19
55
.
24 f
t,
1955
.
65 f
t,
1955
.
101
ft,
1955
.
than
300
ft,
1955
.
CD
00

14E
1
14F
1
14H
1
14H
214
J114
M1
14M
2
18H
1
20K
122
G1
22G
2
25F
1
26G
126
N1
28P
1
34E
1
pum
p.
J. F
ran
z..
....
...
pum
p.
.....d
o............
T.
Big
on
i. ..
....
Sta
ndar
d O
ilC
o., W
-l
(RE
-9).
1949
1949
1953
1953
1945
1946
244
238
236
237
237
242
242
315
331
2R3
263
245
247
266
340
320
300
....
....
190
300
300
396
130
R,
16
P,
10
12
P.G
.14
P,
1416 16 12
P,8
P,
12
P,
14
P,
8P
, 10
P,
8
P,
10
T.n
g
J.I
*
T,n
g
T.n
g
T,
d
1 TT D TT T T TT TT TT TT TT TT TT S S S TT
.........
....
.....d
o..........
.....d
o..........
.....d
o..........
.....d
o..........
pum
p b
ase,
so
uth
sid
e.
Top 1
6-i
n.
casi
ng
in
bott
om
4 -ft
, sq
uare
cu
rbin
g.
....
.do
....
....
..
in c
asin
g,
no
rth
sid
e.
0 0 1 1 0 1-4 0 0 0 0 0 0
5-3
0-5
1
10-2
4-5
55
-30
-51
10-2
4-5
55
-30
-51
10
-24
-55
10-2
4-5
5
5-3
1-5
1
10-2
5-5
5
10
-25
-55
10
-25
-55
7-2
6-5
1
3-2
0-5
310-2
4-5
54-
9-5
710-2
4-5
5
10-2
5-5
54-
9-5
7
a69.4
34.4
21.9
24
a39.4
32.4
31 111.
0
131.
5
49.5
44.4
32.9
30.2
33.8
34.4
37.2
131.
81
27
.8
72 72
K C r T,C
r r
Ob
stru
ctio
n a
t 25
ft,
19
55.
Mea
sure
d d
epth
15
7 ft
, 19
55.
No
access
.M
easu
red
dep
th
77 f
t,
1955
.M
easu
red
dep
th
189
ft,
1955
.P
erf
ora
ted i
n
terv
al
16
4-
384
ft.
Des
troyed
be
fo
re
1955
.
Cem
ent
plu
gab
ou
t 16
ft.
be- ^
low
lan
d s
ur-
C
O
face
.
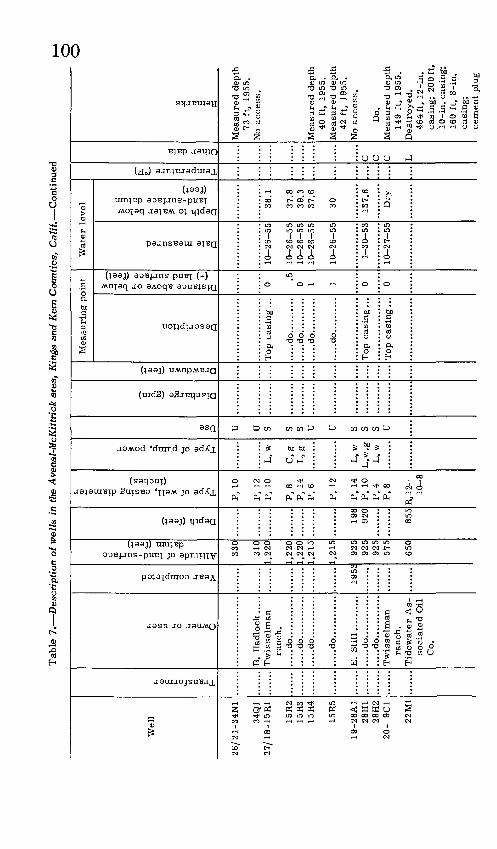
to co-J O5
CO I-1 I-* tO O CO O3 l->II II
CO COCOtO >- !- i-> i-> I-* CO CO CO COO3O3O3 O1 O1O1O1 O1 >£ >£.g n E K > W WWW W-O 3 £2 I ' CO I ' ( ' O1 ^ CO CO I 'I 1 t '
sociated Oil Co.
03
;
Twissel ranch
Tidewat
Hj P
> a CO 1
ien 01 01 -J o 01
» : S :W
^ TO
»
c
ij
H o aoCOH-
3
o
CO
r01 01
d
:
3 O
CO CO CO CO01 01
CO CO
0
"^
CO CO
I
t
H
o
Io
1-30-53
*«
:t- n o o
M
COj-
ji
CO CO01
CO
5"CO
2. 3
0
Oi
0
C
L 3
2. 3
0
J\
05
«
2. 3
2. 3
CO COo
Twisselman ranch. .....do............B. Hadlock.....
CO CO CO CO CO t-1o o o
hd hj hdhJ 03 I-*
t-1 n j-R5 TO ^
CO CO CO
a3
H O a
D.
° P CO5'
h^ K- 0 001
CO CO CO CO CO
TO3 O3 O3 CT3 III 1
01 01 01 01 01O1 O1 UI O1 O1
oCO CO CO CO -J CO -3 O3
O5 CO O3 hJ
o
CJ
COco o
hd
o
«
oo^-o^l ^jfVJf1 °-|
3TO»"'*5J5<'n)'rf(s co ,_. ^ !_, d col_,(I
P* S' H- 2 H- Old O1 d Ol d Old
w 3 S ? .w "2. ' "H- ' "S- ' "S-
|
Transformer
Owner or user
Year completed
Altitude of land-surface datum (feet)
Depth (feet)
Type of well, casing diameter (inches)
Type of pump, power
Use
Discharge (gpm)
Drawdown (feet)
Description
Distance above or below (-) land surface (feet)
Date measured
Depth to water below land-surface datum (feet)
Temperature (°F)
Measuring point
Water level
Other data
Remarks
GOT
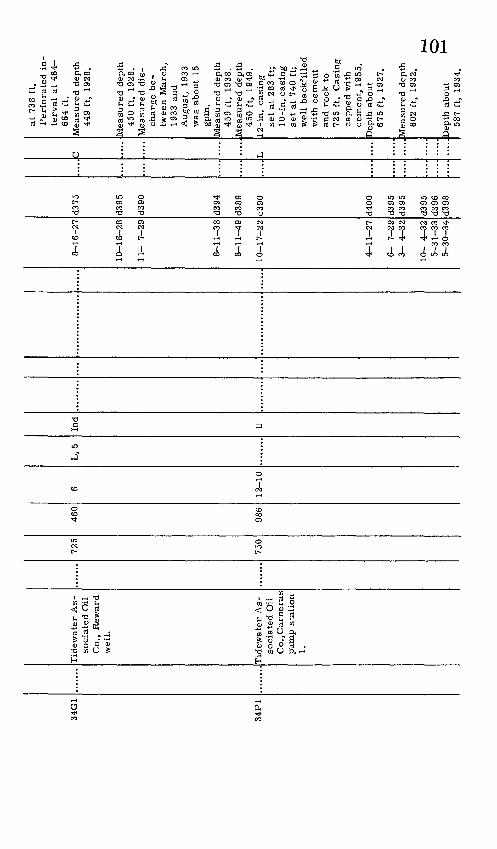
34G
1
34P
1
Tid
ewat
er A
sso
ciat
ed O
ilC
o.,
Rew
ard
wel
l.
Tid
ewat
er A
sso
ciat
ed O
ilC
o., C
amer
aspu
mp
stat
ion
1.
725
750
460
986
12-1
0
L, 5
Ind
U
8-16
-27
10-18-28
11-
7-29
8-11
-38
8-11
-49
10-17-22
4-1 1-27
6- 7-
29
3- 4-
32
10-
4-32
5-31
-33
5-30
-34
d375
d395
d390
d394
d389
c390
d400
d395
d395
d395
d396
d398
.....
ft u L
at 7
38 f
t.P
erfo
rate
d i
n
terv
al a
t 464
664
ft.
Mea
sure
d d
epth
44
9 ft
, 19
28.
Mea
sure
d d
epth
450
ft,
1928
. M
easu
red d
is
char
ge
be
tw
een
Mar
ch,
1933
and
Aug
ust,
19
33
was
abo
ut 1
5
Mea
sure
d d
epth
459
ft,
1938
. M
easu
red d
epth
450
ft,
1949
.12-i
n.
casi
ng
set
at 2
83 f
t;10
-in
. ca
sing
set
at 7
40 f
t;
wel
l bac
kfi
lled
wit
h ce
men
tan
d ro
ck t
o72
5 ft
. C
asin
g
cap
ped
wit
h ce
men
t, 1
955.
D
epth
abo
ut67
5 ft
, 19
27.
Mea
sure
d d
epth
602
ft,
1932
.
Dep
th a
bout
587
ft,
1934
.

CO-J
co toI-- O
1 1co
> ti1-' CO
n H W I-1'01 B HH Jrl I > CO *O O tfl Q- < * P ?< £j M« £ i-\ O <T>as. « TO 5s i : I < O' £. " ?f >* 'OOP'S. 3 S" K u 2- m P> a &' 3 £<!<; P> <^ 4 (3, 1
O ^' O ^ ^^ 01fl> 3 m '
: i
co -J o en o o
CO 05o oo o oo
o ^ o
- aa a I-1 tOco tola a 1 1-' CO to CO 00 O O 05
TTffff T ? CO CO I-' I-1 CO I-1
cocococototo to co* CO CO CD CD CO -J CO
a a a o co co co co co co co oo co en m co
U ...... . p
tn3B'oa.oifl>p)£?fD S^"'H.03oS-ti:>
Ii--"!|^i|-5| ll If ff! ^m-^S'ra'^So' Z -^5 cnS-!"^011ff"£*l3 S i ? gS^FS
(B
Transformer
Owner or user
Year completed
Altitude of land-surface datum (feet)
Depth (feet)
Type of well, casing diameter (inches)
Type of pump, power
Use
Discharge (gpm)
Drawdown (feet)
Description
Distance above or below (-) land surface (feet)
Date measured
Depth to water below land-surface datum (feet)
Measuring point
JU ST
JT
Temperature (°F)
Other data
Remarks
SOT
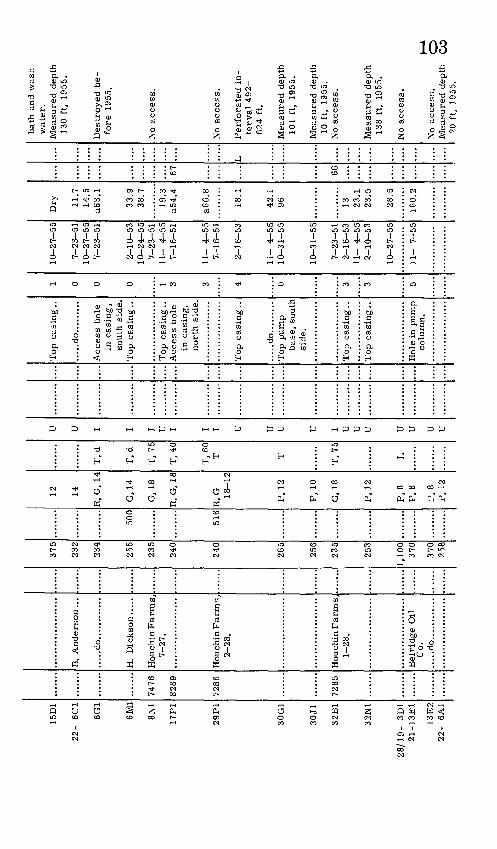
15D
1
22
- 6C
1
6G1
6 M
l
8N1
17P
1
29P
1
30G
1
30
J1
32B
1
32N
1
28/1
9-
3D1
21-1
3E
1
13E
2 2
2-
6A1
....
...
7476
8289
7286
7285
....
...
B.
Ander
son ...
.....d
o............
Houch
in F
arm
s,
7-2
7.
Houch
in F
arm
s,
2-2
8.
Houch
in F
arm
s,
1-2
8.
Bel
rid
ge
Oil
C
o.
.....d
o............
375
232
234
255
235
240
240
265
256
235
253
1,10
037
0
370
258
500
516
....
....
12
14
R,
G,
14
G,
14
G,
18
R,
G,
18
R,
G 18-1
2
P,
12
P,
10
G,
18
P,
12
P,
8 P
, 8
P,8
P,
12
....
...
T,
d
T,
d
T,
75
T,
40
T,
60
T T
T,
75
L
U
TT I I I U
I I I U U
U U I U
U
U U
U U
TT
.........
....
Top c
asin
g .
.
.....d
o.........
Acc
ess
ho
le
in c
asi
ng
, so
uth
sid
e.
Top c
asi
ng..
Top c
asi
ng..
Access
hole
in
cas
ing
, nort
h s
ide.
Top c
asi
ng
..
....
.do..
....
...
Top p
um
p
bas
e, s
outh
si
de.
Top c
asi
ng..
Top c
asi
ng..
Hole
in
pum
p
colu
mn
.
1 0 0 0 1 3 3 4 0 3 3 5
10-2
7-5
5
7-2
3-5
1
10-2
7-5
5
7-2
3-5
1
2-1
0-5
3
10-2
4-5
5
7-2
3-5
1
11-
4-5
5
7-1
6-5
1
11-
4-5
5
7-1
6-5
1
2-1
6-5
3
11
- 4
-55
10-3
1-5
5
10
-31
-55
7-2
3-5
1
2-1
6-5
3
11-
4-5
52
-10
-53
10
-27
-55
11-
7-5
5
Dry 11
.7
14.5
a6
3.1
33.9
38.7
19.3
a5
4.4
a66
.8
18.1
42.1
96 13
23
.1
23.5
28.5
160.
2
67 66
L
bath and wash
water.
Measured depth
130
ft, 1955.
Destroyed be
fore 1
955.
No access.
No access.
Perforated in
te
rval
492-
624
ft.
Measured depth
101
ft, 1955.
Measured depth
10 f
t, 1955.
No access.
Measured depth
138
ft, 1955.
No access.
No
access
. M
easu
red
dep
th
20 f
t,
1955
.
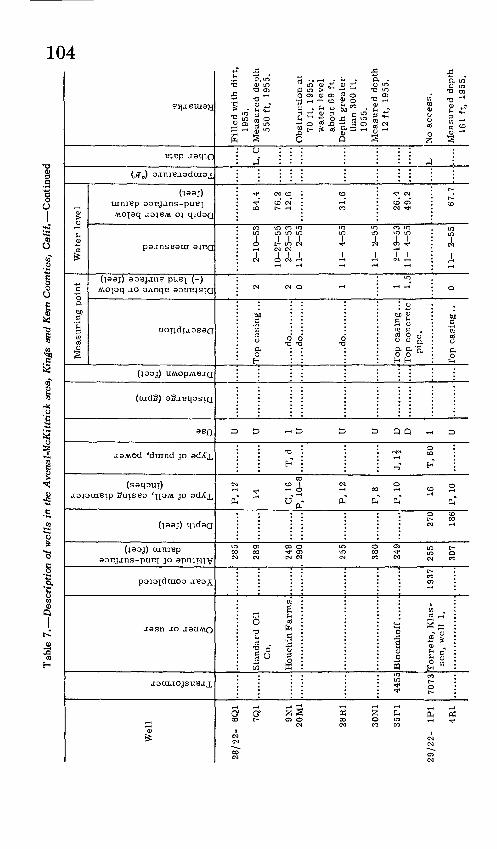
oo oo to to **"- uio oo oco -am
s S 00 jj,
(T> i-j Q1
(D b
^ p" rr £, " p^
' Ul
CO00-a
00 10 fj O Ul ({^ I Ol £j
» -am o
3 m o
H .^ m MI«0
00 00o
00
a *-* d d a
H
o PD! S'
o
1
rUl Ul
m
....Top casing... ...,Top concrete pipe.
Ul
f r 11Ul 00
v^ 10CD m
: r :
CO Ul CJ1
0
a
3
Standard Oil Co. Houchin Farms.
o to to o » co
O ! . .. H- * «
00
H
o. :
a - a
H 18
1 cm
!- O tO to
f r rr? r to to i-1
r t rrr ? Ul Ul Ul Ul Ul Ul Ul Ul Ul 00 Ul 00
oo i-1 i mI 1 tO m rfa-
m m to ((>
rO
to00 Ul
0
a
S ? go o g ^5i s sisff-ts-ssl s^e Si g .3i.s!,«-l-5o ?i-sj
1Transformer
Owner or user
Year completed
Altitude of land-surface datum (feet)
Depth (feet)
Type of well, casing diameter (inches)
Type of pump, power
Use
Discharge (gpm)
Drawdown (feet)
Description
Distance above or below (-) land surface (feet)
Date measured
Depth to water below land-surface datum (feet)
Measuring point
1 m
n>
Temperature (°F)
Other data
Remarks
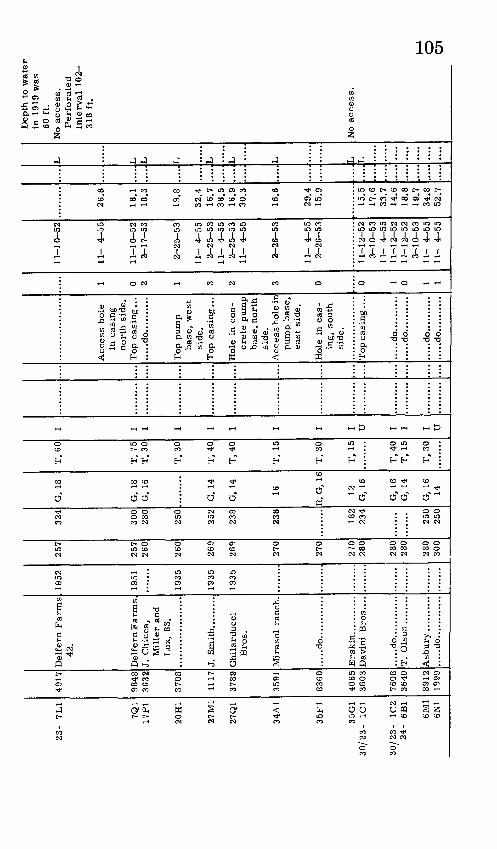
23
- 7L
1
7Q1
17P
1
20H
1
27 M
l
27Q
1
34A
1
35
F1
35G
1 30/2
3-
1C1
30/2
3-
1C2
24-
6B1
6M1
6N1
4917
9848
36
32
3708
4117
3789
3591
8360
4065
36
03
7608
3
64
0
8912
19
99
Del
fern
Farm
s 42
.
Del
fern
Farm
s,
J. C
hic
ca,
Mil
ler
and
Lux,
83.
Gh
ilar
du
cci
Bro
s.
Mir
asol
ran
ch.
.....d
o............
....
.do
....
....
....
T.
Ols
on........
....
.do
....
....
....
1952
1951
1935
r93
5
1935
257
257
260
260
269
269
270
270
270
280
280
280
280
300
324
300
280
250
252
238
238
182
234
250
250
G,
18
G,
18
G,
16
G,
14
G,
14
16
R,
G,
16
12
G,
16
G,
16
G,
14
G,
1614
T,
60
T,
75
T,
30
T,
30
T,
40
T,
40
T,
15
T,
30
T,
15
T,
40T
, 15
T,
30
I 1 I I I 1 I I I TT I I I TT
Acc
ess
ho
le
in c
asin
g
nort
h s
ide.
Top c
asi
ng
...
.....d
o..........
Top p
um
p
bas
e, w
est
side.
Top c
asi
ng
...
Hole
in c
on
cre
te p
um
p
bas
e, n
ort
h
sid
e.
Acc
ess
ho
le in
pum
p b
ase,
east
sid
e.
Hole
in c
as
in
g,
sou
th
side.
Top c
asi
ng....
.....d
o..........
.....d
o..........
.....d
o..........
.....d
o..........
1 0 2 1 3 2 3 0 0 1 0 1 1
11-1
0-5
2
11-
4-5
5
11-1
0-5
2
2-1
7-5
3
2-2
5-5
3
11-
4-5
52-2
5-5
3
11-
4-5
52
-25
-53
11-
4-5
5
2-2
6-5
3
11-
4-5
5
2-2
6-5
3
1 1-
1 2
-52
3-1
0-5
3
11-
4-5
5
11-1
2-5
2
1 1
-1 2
-52
3-1
0-5
3
11-
4-5
511-
4-5
5
26.8
18.1
18
.3
19.8
32.4
16
.7
38.5
16.9
30.3
16.6
29.4
15.9
15.5
17
.6
33.7
14
.6
18.8
19
.7
34.8
52
.7
....
....
....
L L L L L L
Dep
th t
o w
ate
r in
191
9 w
as
60 f
t.
No
access
. P
erf
ora
ted
in
terv
al
10
2
318
ft.
No
access
.
h- l
O
O
l
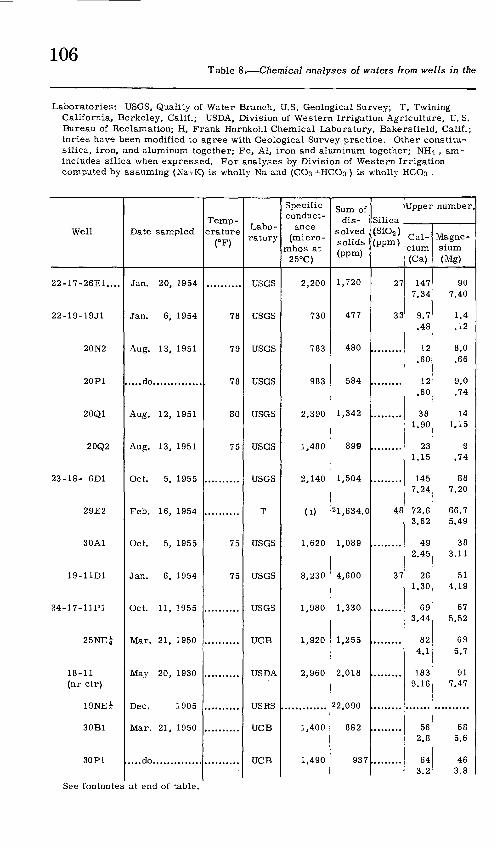
106Table 8. Chemical analyses of waters from wells in the
Laboratories: USGS, Quality of Water Branch, U.S. Geological Survey; T, Twining California, Berkeley, Calif.; USDA, Division of Western Irrigation Agriculture, U. S. Bureau of Reclamation; H, Frank Hornkohl Chemical Laboratory, Bakersfield, Calif.; tories have been modified to agree with Geological Survey practice. Other constitu- silica, iron, and aluminum together; Fe, Al, iron and aluminum together; NEU , am- includes silica when expressed. For analyses by Division of Western Irrigation computed by assuming (Na+K) is wholly Na and (COa +HCOa ) is wholly HCOa .
Well
22-17-26E1....
22-19-19J1
20N2
20P1
20Q1
20Q2
23-18- 6D1
29E2
30A1
19-11D1
24-17-11P1
25NEi
18-11 (nr ctr)
19NE|
30B1
30P1
Date sampled
Jan. 20, 1954
Jan. 6, 1954
Aug. 13, 1951
.....do..............
Aug. 12, 1951
Aug. 13, 1951
Oct. 5, 1955
Feb. 16, 1954
Oct. 5, 1955
Jan. 6, 1954
Oct. 11, 1955
Mar. 21, 1950
May 20, 1930
Dec. 1905
Mar. 21, 1950
....do..............
Temp erature
(°F)
78
79
78
80
75
75
75
Labo ratory
USGS
USGS
USGS
USGS
USGS
USGS
USGS
T
USGS
USGS
USGS
UCB
USDA
USRS
UCB
UCB
Specific conduct
ance (micro-
mhos at 25°C)
2,200
730
783
983
2,390
1,480
2,140
(1)
1,620
8,230
1,980
1,920
2,960
1,400
1,490
Sum of dis- i
solved i solids (ppm) !
1,720
477
480
584
1,342
899
1,504
2 1, 634.0
1,089
4,600
1,330
1,255
2,018
22,090
882
937
Silica (SiOa ) (ppm)
27
33
48
37
........
Upper number,
Cal cium (Ca)
147 7.34
9.7 .48
12 .60
12 .60
38 1.90
23 1.15
145 7.24
72.6 3.62
49 2.45
26 1.30
69 3.44
82 4.1
183 9.16
56 2.8
64 3.2
Magne sium (Mg)
90 7.40
1.4 .12
8.0 .66
9.0 .74
14 1.15
9 .74
88 7.20
66.7 5.49
38 3.11
51 4.19
67 5.52
69 5.7
917.47
68 5.6
46 3.8
See footnotes at end of table.
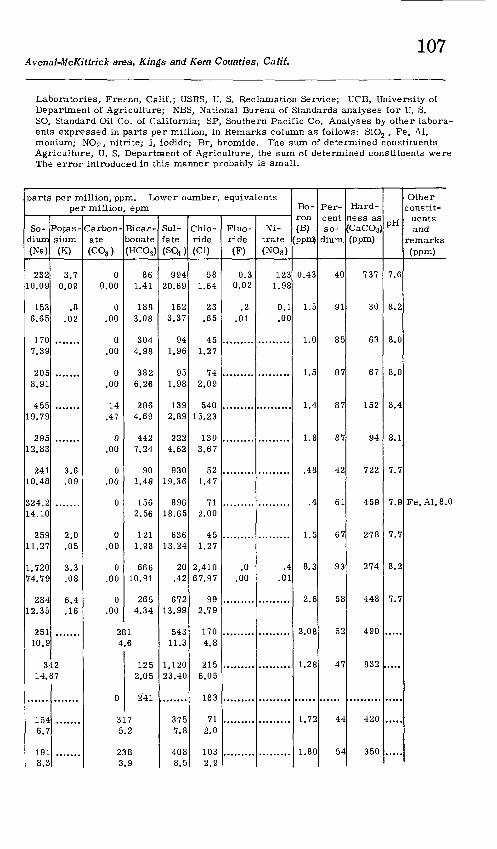
107Avenal-McKittrick area, Kings and Kern Counties, Calif.
Laboratories, Fresno, Calif.; USRS, U. S. Reclamation Service; UCB, University of Department of Agriculture; NBS, National Bureau of Standards analyses for U. S. SO, Standard Oil Co. of California; SP, Southern Pacific Co. Analyses by other labora- ents expressed in parts per million, in Remarks column as follows: SiO2 , Fe, Al, monium; NO2, nitrite; I, iodide; Br, bromide. The sum of determined constituents Agriculture, U. S. Department of Agriculture, the sum of determined constituents were The error introduced in this manner probably is small.
parts per million, ppm. Lower number, equivalents per million, epm
So dium (Na)
23210.09
1536.65
1707.39
2058.91
45519.79
29512.83
24110.48
S94 9O£^:. £
14.10
25911.27
1,72074.79
28412.35
9M £t <J i.
10.9
3<-_
Potas sium (K)
3.70.09
.8.02
3.6.09
2.0.05
3.3.08
6.4.16
.9.
14.87
1546.7
1918.3
Carbon ate(CQj)
00.00
0.00
0.00
0.00
14.47
0.00
0.00
0
0.00
0.00
0.00
Bicar bonate (HC03 )
861.41
1883.08
3044.98
3826.26
2864.69
4427.24
901.48
1562.56
1211.98
66610.91
2654.34
2814.6
0
3i.
19^i. £ <J
2.05
241
75.2
2383.9
Sul- fate (S04 )
99420.69
1623.37
941.96
951.98
1392.89
2224.62
93019.36
89618.65
63613.24
20.42
67213.99
54311.3
1,12023.40
3757.8
4088.5
Chlo ride (Cl)
581.64
23.65
451.27
742.09
54015.23
1303.67
521.47
712.00
451.27
2,41067.97
992.79
1704.8
2156.05
183
712.0
1032.9
Fluo- ride (F)
0.30.02
.2.01
.0.00
Ni trate (N03 )
1231.98
0.1.00
.4.01
Bo ron (B)ppm)
0.43
1.5
1.0
1.5
1.4
1.8
.48
.4
1.5
8.3
2.6
2.08
1.28
1.72
1.80
Per cent so
dium,
40
91
85
87
87
87
42
61
67
93
58
52
47
44
54
Hard ness as (CaCO3) (ppm)
737
30
63
67
152
94
722
459
278
274
448
490
832
420
350
pH
7.6
8.2
8.0
8.0
8.4
8.1
7.7
7.9
7.7
8.2
7.7
Other constit
uents and
remarks (ppm)
Fe, Al, 8.0
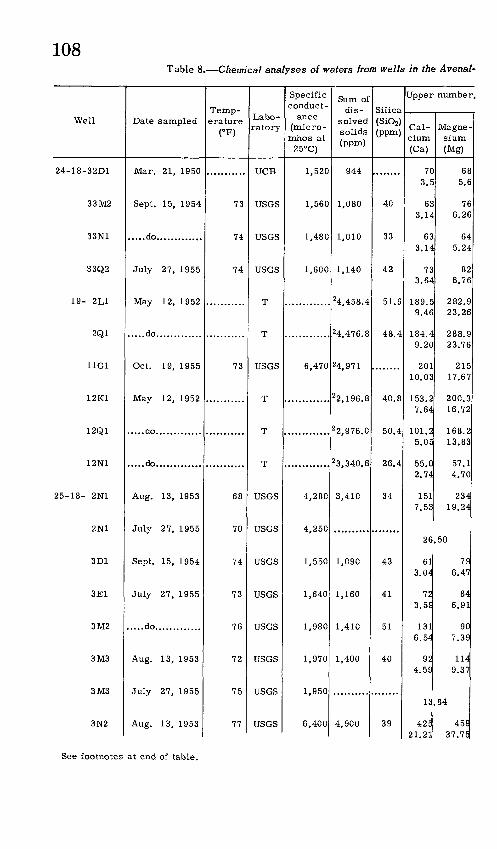
108T able 8. Chemical analyses of waters from wells in the Avenal-
Well
24-18-32D1
33 M2
33N1
33Q2
19- 2L1
2Q1
11G1
12K1
12Q1
12N1
25-18- 2N1
2N1
3D1
3E1
3M2
3M3
3M3
3N2
Date sampled
Mar. 21, 1950
Sept. 15, 1954
.....do.............
July 27, 1955
May 12, 1952
.....do.............
Oct. 19, 1955
May 12, 1952
.....do.............
.....do.............
Aug. 13, 1953
July 27, 1955
Sept. 15, 1954
July 27, 1955
.....do.............
Aug. 13, 1953
July 27, 1955
Aug. 13, 1953
Temp erature
(°F)
73
74
74
73
68
70
74
73
76
72
75
77
Labo ratory
UCB
uses
uses
uses
T
T
uses
T
T
T
USGS
uses
USGS
USGS
USGS
USGS
USGS
USGS
Specific conduct
ance (micro - mhos at
25°C)
1,520
1,560
1,480
1,600
6,470
4,280
4,250
1,550
1,640
1,980
1,970
1,950
6,400
Sum of dis
solved solids (ppm)
944
1,080
1,010
1,140
24,458.4
24,476.8
24,971
22,196.8
2 2,976.0
2 3,340.8
3,410
1,090
1,160
1,410
1,400
4,900
Silica(SiOs)
(ppm)
40
33
42
51.6
48.4
40.8
50.4
26.4
34
43
41
51
40
39
Upper number
Cal cium (Ca)
70 3.5
633.14
633.14
73 3.64
189.5 9.46
184.4 9.20
201 10.03
153.2 7.64
101.2 5.05
55.0 2.74
151 7.53
26
61 3.04
72 3.5S
131 6.54
92 4.5S
13
Magne sium (Mg)
68 5.6
76 6.26
64 5.24
82 6.76
282.9 23.26
288.9 23.76
215 17.67
200.3 16.72
168.2 13.83
57.1 4.70
234 19.24
.50
79 6.47
84 6.91
90 7.39
114 9.37
84
423 459 21.21J 37.75
See footnotes at end of table.
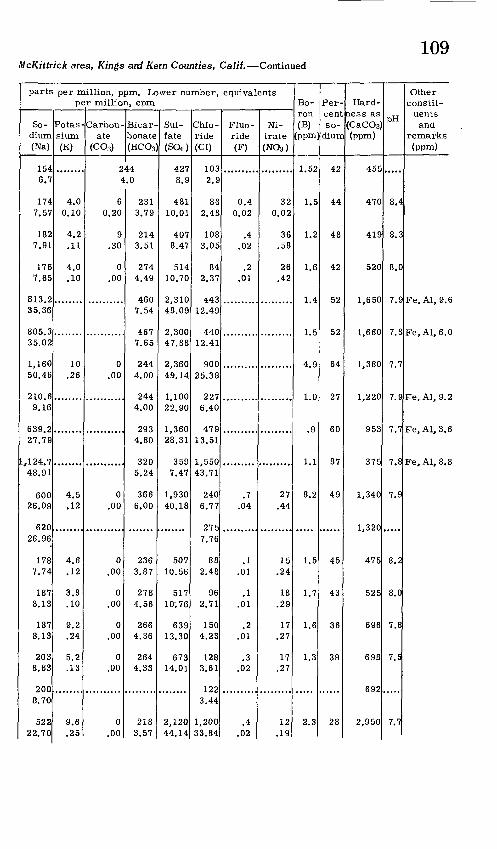
109McKittrick area, Kings and Kern Counties, Calif. Continued
parts per million, ppm. Lower number, equivalents per million, epm
So dium (Na)
154 6.7
1747.57
1827.91
1767.65
813.2 35.36
805.3 35.02
1,160 50.46
210.6 9.16
639.2 27.79
1,124.7 48.91
60026.09
620 26.96
1787.74
1878.13
1878.13
2038.83
200 8.70
52222.70
Potas
sium (K)
4.00.10
4.2.11
4.0.10
10 .26
4.5.12
4.6.12
3.8.10
9.2.24
5.2.13
9.6.25
Carbon ate
(C03)
Bicar bonate (HC03
244 4.0
60.20
9.30
0.00
0 .00
0.00
0.00
0.00
0.00
0.00
0.00
2313.79
2143.51
2744.49
460 7.54
467 7.65
244 4.00
244 4.00
293 4.80
320 5.24
3666.00
2363.87
2784.56
2664.36
2644.33
2183.57
Sul- fate (S04 )
427 8.9
48110.01
4078.47
51410.70
2,310 48.09
2,300 47.88
2,360 49.14
1,100 22.90
1,360 28.31
359 7.47
1,93040.18
50710.56
51710; 76
63913.30
67314.01
2,12044.14
Chlo
ride (Cl)
103 2.9
882.48
1083.05
842.37
443 12.49
440 12.41
900 25.38
227 6.40
479 13.51
1,550 43.71
2406.77
275 7.76
882.48
962.71
1504.23
1283.61
122 3.44
1,20033.84
Fluo- ride (F)
0.40.02
.4.02
.2.01
.7.04
.1.01
.1.01
.2.01
.3.02
.4.02
Ni trate (N03 )
320.02
36.58
26.42
27.44
15.24
18.29
17.27
17.27
12.19
Bo ron (B)
(ppm
1.52
1.5
1.2
1.6
1.4
1.5
4.9
1.0
.9
1.1
8.2
1.5
1.7
1.6
1.3
2.3
Per
cent so
dium
42
44
48
42
52
52
64
27
60
87
49
45
43
36
39
28
Hard ness as (CaCO3 (ppm)
455
470
419
520
1,650
1,660
1,380
1,220
953
375
1,340
1,320
475
525
696
698
692
2,950
pH
.....
8.4
8.3
8.0
7.9
7.8
7.7
7.9
7.7
7.8
7.9
8.2
8.0
7.6
7.5
7.7
Other constit
uents and
remarks (ppm)
Fe, Al, 9.6
Fe.Al, 6.0
Fe, Al, 9.2
Fe,Al, 3.6
Fe.Al, 8.8
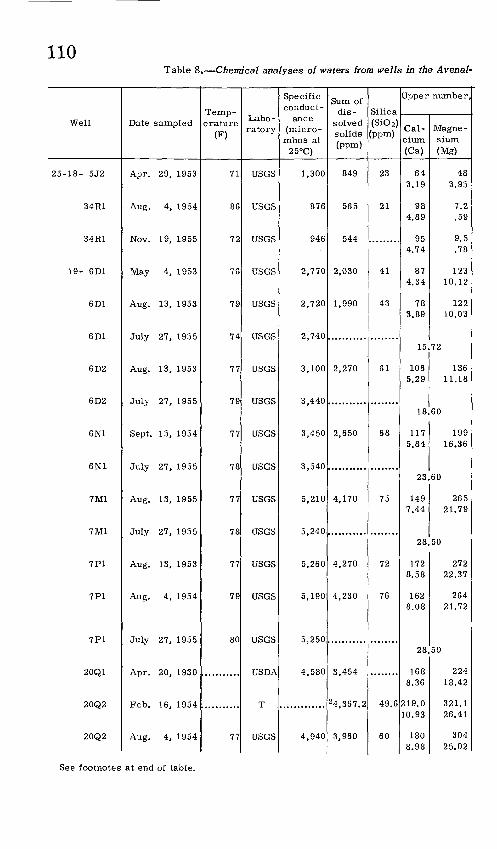
110Table 8. Chemical analyses of waters from wells in the Avenal-
Well
25-18- 5J2
34R1
34R1
19- 6D1
6D1
6D1
6D2
6D2
6N1
6N1
7 Ml
7 Ml
7P1
7P1
7P1
20Q1
20Q2
20Q2
Date sampled
Apr. 29, 1953
Aug. 4, 1954
Nov. 19, 1955
May 4, 1953
Aug. 13, 1953
July 27, 1955
Aug. 13, 1953
July 27, 1955
Sept. 15, 1954
July 27, 1955
Aug. 13, 1955
July 27, 1955
Aug. 13, 1953
Aug. 4, 1954
July 27, 1955
Apr. 20, 1930
Feb. 16, 1954
Aug. 4, 1954
Temp erature
(F)
71
86
72
76
79
74
77
79
77
78
77
78
77
79
80
77
Labo ratory
USGS
USGS
USGS
USGS
USGS
USGS
USGS
USGS
USGS
USGS
USGS
USGS
USGS
USGS
USGS
USDA
T
USGS
Specific conduct
ance (micro-
mhos at 25°C)
1,300
876
946
2,770
2,720
2,740
3,100
3,440
3,450
3,540
5,210
5,240
5,260
5,190
5,250
4,580
4,940
Sum of dis
solved solids (ppm)
849
565
544
2,030
1,990
2,270
2,650
4,170
4,270
4,230
3,454
2 4,367.2
3,960
Silica (Si0 2 ) (ppm)
23
21
41
43
61
68
75
72
76
49.6
60
Upper number.
Cal cium (Ca)
64 3.19
98 4.89
954.74
87 4.34
78 3.89
15.
106 5.29
18.
117 5.84
23
1497.44
28.
172 8.58
162 8.08
28
168 8.36
219.0 10.93
180 8.98
Magne sium (Mg)
48 3.95
7.2 .59
9.5 .78
123 10.12
122 10.03
72
136 11.18
60
199 16.36
60
265 21.79
50
272 22.37
264 21.72
50
224 18.42
321.1 26.41
304 25.02
See footnotes at end of table.

IllMcKitttick area, Kings and Kem Counties, Calif, Continued
parts per million, ppm. Lower number, equivalents per million, epm
So
dium (Na)
1526.61
793.44
84 3.65
39016.96
39517.18
370 16.09
41818.18
482 20.96
43018.70
451 19.61
80034.79
829 36.05
81035.22
840 36.53
829 36.05
6( 26.3
709.6 30.86
63827.74
Potas sium (K)
1.20.03
2.9.07
2.0 .05
4.5.12
4.4.11
12.31
16.41
10.26
12.31
16 .41
6 4
23.59
Carbon
ate (C03 )
00.00
5.17
0 .00
0.00
0.00
0.00
0.00
0.00
0.00
0 .00
254.f
0 .00
Bicar
bonate (HCOs)
2263.70
1292.11
117 1.92
2423.9
2444.00
2544.16
2063.38
4647.60
4747.77
416 6.82
)6 55
342 5.60
273 4.47
Sul- fate (S04 )
3477.22
1643.41
198 4.12
1,04021.65
1,02021.24
1,14023.73
1,40029.15
2,19045.59
2,27047.26
2,260 47.05
1,690 35.22
2,370 49.34
2,190 45.59
Chlo
ride (Cl)
962.71
1022.88
97 2.74
2055.78
1955.50
215 6.06
2607.33
330 9.31
2958.32
305 8.60
43512.27
445 12.55
41011.56
395 11.14
450 12.69
463 13.05
468 13.20
430 12.13
Fluo-
ride (F)
0.30.04
.2.01
.5.03
.5.03
.4.02
.1.01
.5.03
.6.03
.2 .01
.0 .00
Ni
trate (NOa)
4.40.07
22.35
12.19
12.19
12.19
25.40
10.16
4.4.07
5.7 .09
2.5 .04
Bo ron (B)
1.3
.30
.46
4.1
1.6
1.8
2.4
5.7
10
4.7
3.9
1.9
.98
Per
cent so
dium
48
38
40
54
55
52
45
54
53
55
50
45
45
Hard ness as (CaCOs) (ppm)
357
274
276
723
696
786
824
930
1,110
1,180
1,460
1,420
1,550
1,490
1,420
1,340
1,880
1,700
PH
7.9
8.4
7.6
7.9
7.9
7.7
.....
8.1
7.6
7.7
7.9
7.4
7.7
Other constit uents and
remarks
(ppm)
NH4/0.4;NO2, 0.01
NH4.0; NO2 , 0; I, 0.2;Br,l
Fe.Al, 16
NH4.0.1; NO 2 , 0; I, 0.3;Br, 1
503194 O-59 -9
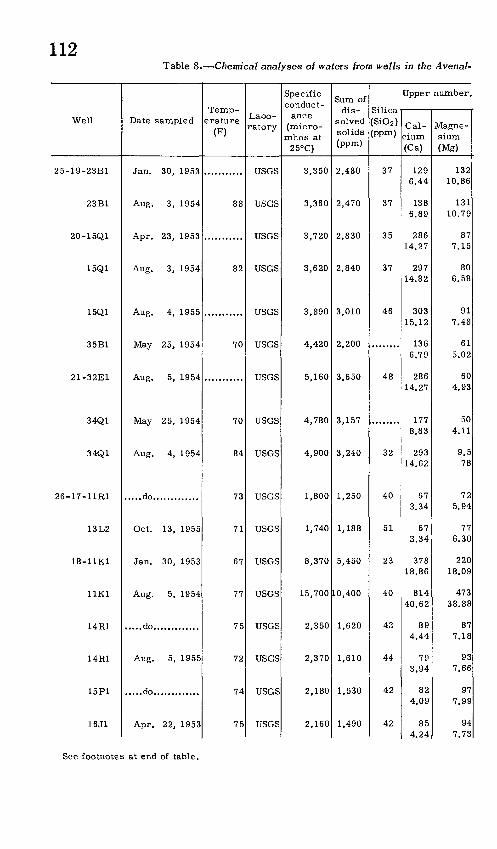
112Table 8. Chemical analyses of waters from wells in the Avenal-
Well
25-19-23B1
23B1
20-15Q1
15Q1
15Q1
35B1
21-32E1
34Q1
34Q1
26-17-11R1
13L2
18-11K1
11K1
14R1
14R1
15P1
16J1
Date sampled
Jan. 30, 1953
Aug. 3, 1954
Apr. 23, 1953
Aug. 3, 1954
Aug. 4, 1955
May 25, 1954
Aug. 5, 1954
May 25, 1954
Aug. 4, 1954
.....do.............
Oct. 13, 1955
Jan. 30, 1953
Aug. 5, 1954
.....do.............
Aug. 5, 1955
.....do.............
Apr. 22, 1953
Temp erature
(F)
88
82
70
70
84
73
71
67
77
75
72
74
75
Labo ratory
uses
USGS
USGS
USGS
USGS
USGS
USGS
USGS
USGS
USGS
USGS
USGS
USGS
USGS
USGS
USGS
USGS
Specific conduct
ance (micro - mhos at
25°C)
3,350
3,360
3,720
3,620
3,890
4,420
5,160
4,780
4,900
1,800
1,740
8,370
15,700
2,350
2,370
2,180
2,160
Sum of dis
solved solids (ppm)
2,480
2,470
2,830
2,840
3,010
2,200
3,650
3,157
3,240
1,250
1,188
5,450
10,400
1,620
1,610
1,530
1,490
Silica (Si02 ) (ppm)
37
37
35
37
46
48
32
40
51
23
40
43
44
42
42
Upper number,
Cal cium (Ca)
129 6.44
138 6.89
286 14.27
297 14.82
30315.12
136 6.79
286 14.27
177 8.83
293 14.62
67 3.34
67 3.34
378 18.86
814 40.62
894.44
79 3.94
82 4.09
85 4.24
Magne sium (Mg)
132 10.86
131 10.79
87 7.15
80 6.58
91 7.48
61 5.02
60 4.93
50 4.11
9.5 78
72 5.94
77 6.30
220 18.09
473 38.88
87 7.18
93 7.66
97 7.99
94 7.73
See footnotes at end of table.
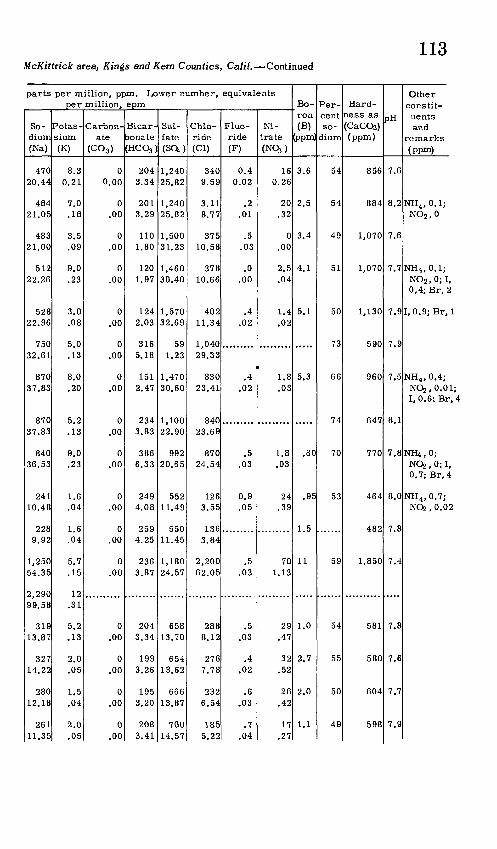
113McKittrick area, Kings and Kem Counties, Calif. Continued
parts per million, ppm. Lower number, equivalentsper million, epm
Sodium(Na)
47020.44
48421.05
48321.00
51222.26
52822.96
75032.61
87037.83
87037.83
84036.53
24110.48
2289.92
1,25054.35
2,29099.58
31913.87
32714.22
28012.18
26111.35
Potassium(K)
8.30.21
7.0.18
3.5.09
9.0.23
3.0.08
5.0.13
8.0.20
5.2.13
9.0.23
1.6.04
1.6.04
5.7.15
12.31
5.2.13
2.0.05
1.5.04
2.0.05
Carbonate
(COg)
00.00
0.00
0.00
0.00
0.00
0.00
0.00
0.00
0.00
0.00
0.00
0.00
0.00
0.00
0.00
0.00
Bicar-xmate(HCOa)
2043.34
2013.29
1101.80
1201.97
1242.03
3165.18
1512.47
2343.83
3866.33
2494.08
2594.25
2363.87
2043.34
1993.26
1953.20
2083.41
Sul-fate(S04 )
1,24025.82
1,24025.82
1,50031.23
1,46030.40
1,57032.69
591.23
1,47030.60
1,10022.90
99220.65
55211.49
55011.45
1,18024.57
65813.70
65413.62
66613.87
70014.57
Chloride(Cl)
3409.59
3.118.77
37510.58
37810.66
40211.34
1,04029.33
83023.41
84023.69
87024.54
1263.55
1363.84
2,20062.05
2888.12
2767.78
2326.54
1855.22
Fluo-ride(F)
0.40.02
.2.01
.5.03
.0.00
.4.02
.4.02
.5.03
0.9.05
.5.03
.5.03
.4.02
.6.03
.7.04
Nitrate(NO,)
160.26
20.32
0.00
2.5.04
1.4.02
1.8.03
1.8.03
24.39
701.13
29.47
32.52
26.42
17.27
Boron(B)
(ppm)
3.6
2.5
3.4
4.1
5.1
5.3
.80
.95
1.5
11
1.0
2.7
2.0
1.1
Percentso
dium
54
54
49
51
50
73
66
74
70
53
59
54
55
50
49
Hardness as(CaC03)(ppm)
856
884
1,070
1,070
1,130
590
960
647
770
464
482
1,850
581
580
604
598
pH
7.6
8.2
7.6
7.7
7.9
7.9
7.5
8.1
7.8
8.0
7.8
7.4
7.8
7.6
7.7
7.9
Otherconstituentsand
remarks(ppm)
NH4 , 0.1;NC-2,0
NH 4 , 0.1;NO2 ,0;I,0.4;Br, 2
I, 0.9;Br, 1
NH4 , 0.4;NC»2,0.01;I, 0.6: Br, 4
NH4,0;NOa , 0; I,O.T;Br, 4
NH 4 , 0.7;NOs,0.02
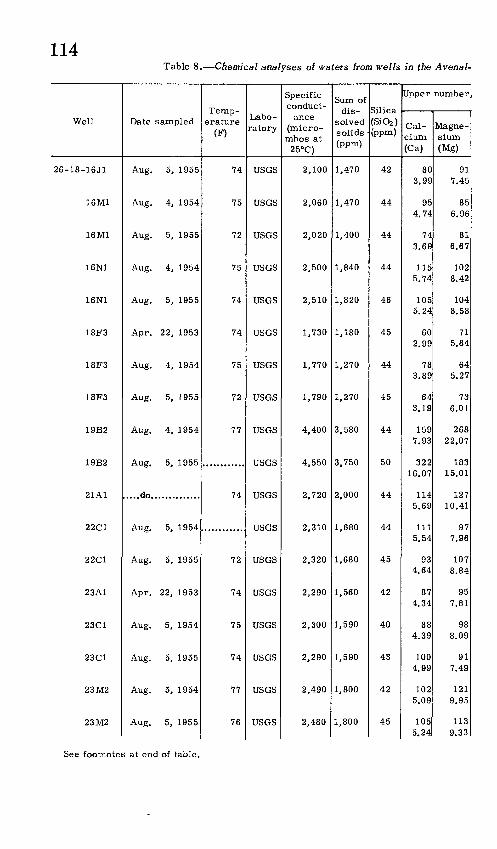
114Table 8. Chemical analyses of waters from wells in the Avenal-
Well
26-18-16J1
16M1
16M1
16N1
16N1
18F3
18F3
18F3
19B2
19B2
21A1
22C1
22C1
23A1
23C1
23C1
23 M2
23M2
Date sampled
Aug. 5, 1955
Aug. 4, 1954
Aug. 5, 1955
Aug. 4, 1954
Aug. 5, 1955
Apr. 22, 1953
Aug. 4, 1954
Aug. 5, 1955
Aug. 4, 1954
Aug. 5, 1955
.....do..............
Aug. 5, 1954
Aug. 5, 1955
Apr. 22, 1953
Aug. 5, 1954
Aug. 5, 1955
Aug. 5, 1954
Aug. 5, 1955
Temp erature
(F)
74
75
72
75
74
74
75
72
77
74
72
74
75
74
77
76
Labo ratory
USGS
USGS
USGS
USGS
USGS
USGS
USGS
USGS
USGS
USGS
USGS
USGS
USGS
USGS
USGS
USGS
USGS
USGS
Specific conduct
ance (micro- mhos at
25°C)
2,100
2,060
2,020
2,500
2,510
1,730
1,770
1,790
4,400
4,550
2,720
2,310
2,320
2,290
2,300
2,290
2,490
2,480
Sum of dis
solved solids (ppm)
1,470
1,470
1,400
1,840
1,820
1,180
1,270
1,270
3,580
3,750
2.000
1,680
1,680
1,560
1,590
1,590
1,800
1,800
Silica(ffioa)(ppm)
42
44
44
44
46
45
44
45
44
50
44
44
45
42
40
43
42
45
Upper number,
Cal cium (Ca)
80 3.99
954.74
743.69
1155.74
1055.24
60 2.99
78 3.89
64 3.19
1597.93
32216.07
1145.69
111 5.54
93 4.64
87 4.34
88 4.39
1004.99
1025.09
1055.24
Magne sium (Mg)
91 7.45
856.96
816.67
1028.42
1048.58
71 5.84
64 5.27
73 6.01
26822.07
183 15.01
12710.41
97 7.96
107 8.84
95 7.81
98 8.09
917.49
1219.95
1139.33
See footnotes at end of table.
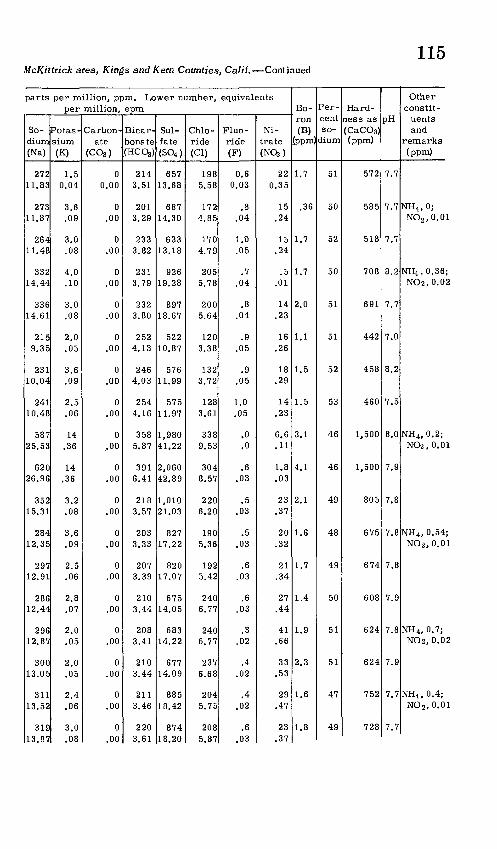
115McKittrick area, Kings and Kem Counties, Calif. Continued
parts per million, ppm. Lower number, equivalents per million, epm
So dium (Na)
27211.83
27311.87
26411.48
33214.44
33614.61
2159.35
23110.04
24110.48
58725.53
62026.96
35215.31
28412.35
29712.91
28612.44
29612.87
30013.05
31113.52
31913.87
Potas sium (K)
1.50.04
3.6.09
3.0.08
4.0.10
3.0.08
2.0.05
3.6.09
2.5.06
14.36
14.36
3.2.08
3.6.09
2.5.06
2.8.07
2.0.05
2.0.05
2.4.06
3.0.08
Carbon ate
(C03 )
00.00
0.00
0.00
0.00
0.00
0.00
0.00
0.00
0..00
0.00
0.00
0.00
0.00
0.00
0.00
0.00
0.00
0.00
Bicar- bona te (HCQj)
2143.51
2013.29
2333.82
2313.79
2323.80
2524.13
2464.03
2544.16
3585.87
3916.41
2183.57
2033.33
2073.39
2103.44
2083.41
2103.44
2113.46
2203.61
Sul- fate (S04 )
65713.68
68714.30
63313.18
92619.28
89718.67
52210.87
57611.99
57511.97
1,98041.22
2,06042.89
1,01021.03
82717.22
82017.07
67514.05
68314.22
67714.09
88518.42
87418.20
Chlo ride (Cl)
1985.58
1724.85
1704.79
2055.78
2005.64
1203.38
1323.72
1283.61
3389.53
3048.57
2206.20
1905.36
1925.42
2406.77
2406.77
2376.68
2045.75
2085.87
Fluo- ride (F)
0.60.03
.8.04
1.0.05
.7.04
.8.04
.9.05
.9.05
1.0.05
.0
.0
.6.03
.5.03
.5.03
.6.03
.6.03
.3.02
.4.02
.4.02
.6.03
Ni trate (NQj)
220.35
15.24
15.24
.5.01
14.23
16.26
18.29
14.23
6.6.11
1.8.03
23.37
20.32
21.34
27.44
41.66
33.53
29.47
23.37
Bo ron (B)
(ppm)
1.7
.36
1.7
1.7
2.0
1.1
1.5
1.5
3.1
4.1
2.1
1.6
1.7
1.4
1.9
2.3
1.6
1.8
Per cent so
dium
51
50
52
50
51
51
52
53
46
46
49
48
49
50
51
51
47
49
Hard ness as (CaC03) (ppm)
572
585
518
708
691
442
458
460
1,500
1,500
805
675
674
608
624
624
752
728
pH
7.7
7.7
7.7
8.2
7.7
7.0
8.2
7.5
8.0
7.9
7.8
7.8
7.8
7.9
7.8
7.9
7.7
7.7
Other constit
uents and
remarks (ppm)
NH4 , 0;NO2 ,0.01
NH4.0.36;NO2,0.02
NH 4, 0.2;NO2.0.01
NH 4 , 0.54;NO2.0.01
NH 4 , 0.7;NO2, 0.02
NH4 ,0.4;NO 2 , 0.01
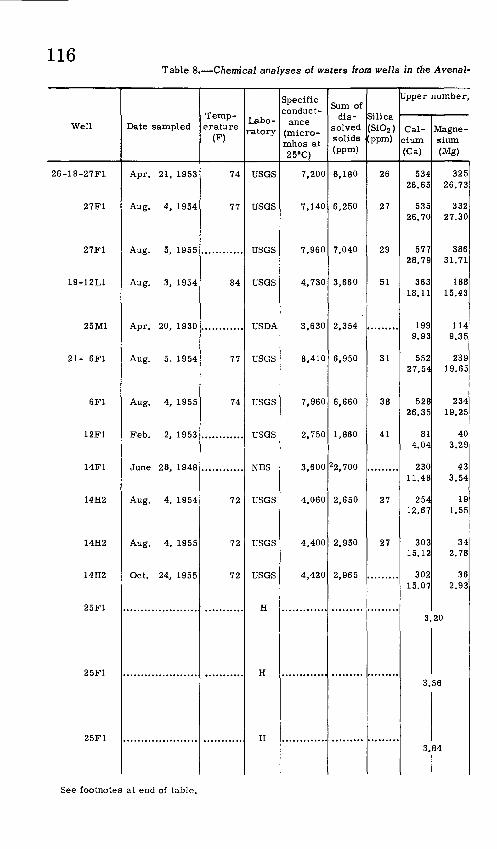
116Table 8. Chemical analyses of waters from wells in the Avenal-
Well
26-18-27F1
27F1
27F1
19-12L1
25M1
21- 6F1
6F1
12F1
14F1
14H2
14H2
14H2
25F1
25F1
25F1
Date sampled
Apr. 21, 1953
Aug. 4, 1954
Aug. 5, 1955
Aug. 3, 1954
Apr. 20, 1930
Aug. 5. 1954
Aug. 4, 1955
Feb. 2, 1953
June 28, 1948
Aug. 4, 1954
Aug. 4, 1955
Oct. 24, 1955
Temp erature
(F)
74
77
84
77
74
72
72
72
Labo ratory
USGS
USGS
USGS
USGS
USDA
USGS
USGS
USGS
NBS
USGS
USGS
USGS
H
H
H
Specific conduct
ance (micro- mhos at 25°C)
7,200
7,140
7,960
4,730
3,630
8,410
7,960
2,750
3,600
4,060
4,400
4,420
Sum of dis
solved solids (ppm)
6,180
6,250
7,040
3,660
2,354
6,950
6,660
1,860
2 2,700
2,650
2,950
2,965
Silica (SiOa) (ppm)
26
27
29
51
31
38
41
27
27
Upper number,
Cal cium (Ca)
53426.65
53526.70
57728.79
36318.11
1999.93
55227.54
52826.35
814.04
23011.48
25412.67
30315.12
30215.07
3.
3.
3.
Magne sium (Mg)
32526.73
33227.30
38631.71
18815.43
1149.35
23919.65
23419.25
403.29
433.54
191.55
342.78
362.93
20
56
84
See footnotes at end of table.
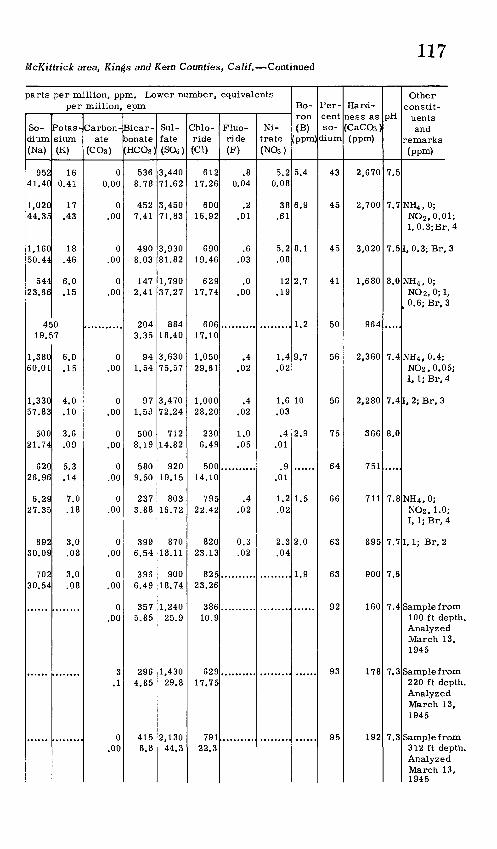
117McKittrick area, Kings and Kem Counties, Calif. Continued
parts per million, ppm. Lower number, equivalents per million, epm
So dium (Na)
95241.40
1,02044.35
1,16050.44
54423.66
45-
Potas sium (K)
160.41
17.43
18.46
6.0.15
019.57
1,38060.01
1,33057.83
50021.74
62026.96
6.2927.35
69230.09
70230.54
6.0.15
4.0.10
3.6.09
5.3.14
7.0.18
3.0.08
3.0.08
Carbon ate
(COs)
00.00
0.00
0.00
0.00
0.00
0.00
0.00
0.00
0.00
0.00
0.00
0.00
3.1
0.00
Bicar-
jonate (HC03 )
5368.78
4527.41
4908.03
1472.41
2043.35
941.54
971.59
5008.19
5809.50
2373.88
3996.54
3966.49
3575.85
2964.85
4156.8
Sul-
fate(S04)
3,44071.62
3,45071.83
3,93081.82
1,79037.27
88418.40
3,63075.57
3,47072.24
71214.82
92019.15
80316.72
87018.11
90018.74
1,24025.9
1,43029.8
2,13044.3
Chlo
ride (Cl)
61217.26
60016.92
69019.46
62917.74
60617.10
1,05029.61
1,00028.20
2306.49
50014.10
79522.42
82023.13
82523.26
38610.9
62917.75
79122.3
Fluo- ride (F)
.80.04
.2.01
.6.03
.0.00
.4.02
.4.02
1.0.05
.4.02
0.3.02
Ni trate (NOa)
5.20.08
38.61
5.2.08
12.19
1.4.02
1.6.03
.4.01
.9.01
1.2.02
2.3.04
Bo ron (B)
(ppm)
5.4
6.9
8.1
2.7
1.2
9.7
10
2.9
1.5
2.0
1.9
Per
cent so
dium
43
45
45
41
50
56
56
75
64
66
63
63
92
93
95
Hard ness as (CaCOa ) (ppm)
2,670
2,700
3,020
1,680
964
2,360
2,280
366
751
711
895
900
160
178
192
pH
7.5
7.7
7.5
8.0
7.4
7.4
8.0
7.8
7.7
7.6
7.4
7.3
7.3
Other constit
uents and
remarks (ppm)
NH4.0;NO 2 , 0.01;I, 0.3;Br, 4
I, 0.3;Br, 3
NH4 ,0;NO 2,0; I,0.6; Br, 3
NH4 , 0.4;NO2.0.05;I, 1; Br, 4
I, 2; Br, 3
NH4 ,0;NO2 , 1.0;I, 1; Br, 4
I, 1; Br, 2
Sample from100 ft depth.AnalyzedMarch 13,1945
Sample from220 ft depth.AnalyzedMarch 13,1945
Sample from312 ft depth.AnalyzedMarch 13,1945
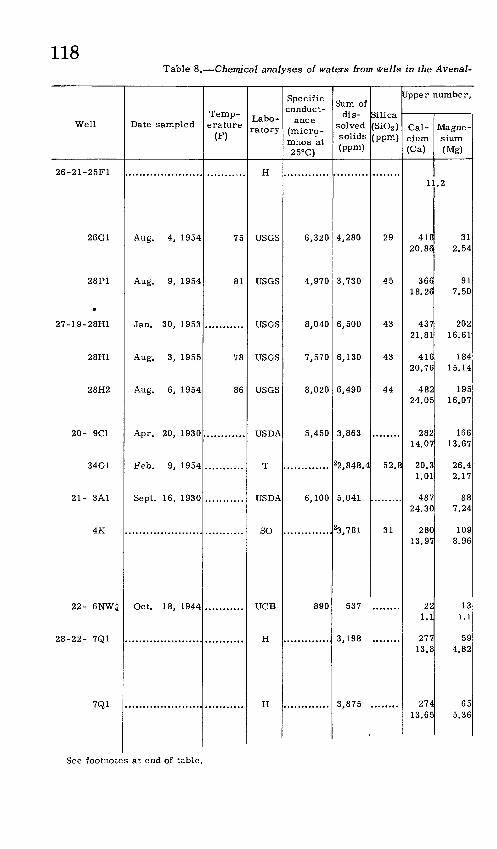
118Table 8. Chemical analyses of waters from wells in the Avenal-
Well
26-21-25F1
26G1
28P1
27-19-28H1
28H1
28H2
20- 9C1
34G1
21- 3A1
4K
22- 6NW^
28-22- 7Q1
7Q1
Date sampled
Aug. 4, 1954
Aug. 9, 1954
Jan. 30, 1953
Aug. 3, 1955
Aug. 6, 1954
Apr. 20, 1930
Feb. 9, 1954
Sept. 16, 1930
Oct. 18, 1944
Temp erature
(F)
75
81
78
86
Labo ratory
H
uses
uses
uses
uses
uses
USDA
T
USDA
SO
UCB
H
H
Specific conduct
ance (micro - mhos at 25°C)
6,320
4,970
8,040
7,570
8,020
5,450
6,100
890
.............
Sum of dis
solved solids (ppm)
4,280
3,730
6,500
6,130
6,490
3,863
22,848.4
5,041
23,781
537
3,198
3,875
Silica (Si02 ) (ppm)
29
45
43
43
44
52.8
31
........
Jpper number.
Cal cium (Ca)
1
418 20.86
366 18.26
437 21.81
416 20.76
482 24.05
282 14.07
20.3 1.01
487 24.30
280 13.97
22 1.1
277 13.8
274 13.65
Magne - slum (Mg)
.2
31 2.54
91 7.50
202 16.61
184 15.14
195 16.07
166 13.67
26.4 2.17
88 7.24
109 8.96
13 1.1
59 4.82
65 5.36
See footnotes at end of table.
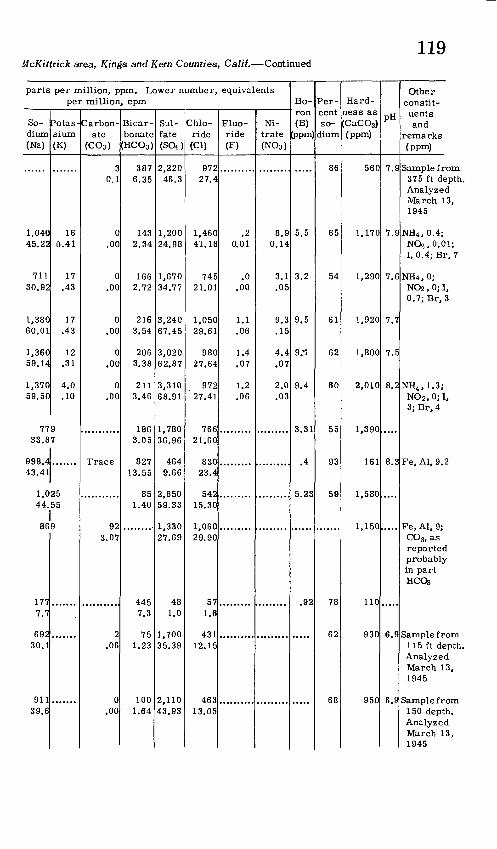
119McKittrick area, Kings and Kern Counties, Calif. Continued
parts per million, ppm. Lower number, equivalents per million, epm
So- dium (Na)
1,04045.22
71130.92
1,38060.01
1,36059.14
1,37059.50
Potas sium (K)
160.41
17.43
17.43
12.31
4.0.10
77933.87
998.443.41
1,02544.
86
1777.7
69230.1
91139.6
55
9
Carbon
ate (C03 )
30.1
0.00
0.00
0.00
0.00
0.00
Trace
923.07
2.06
0.00
Bicar bonate
(HC03 )
3876.35
1432.34
1662.72
2163.54
2063.38
2113.46
1863.05
82713.55
851.40
441; ^*±u
7.3
7S1 O
1.23
1001.64
Sul- fate (S04 )
2,22046.3
1,20024.98
1,67034.77
3,24067.45
3,02062.87
3,31068.91
1,78036.96
4649.66
2,85059.33
1,33027.69
481.0
1,70035.39
2,11043.93
Chlo ride (Cl)
97227.4
1,46041.18
74521.01
1,05029.61
98027.64
97227.41
76621.60
83023.4
54215.30
1,06029.90
571.6
43112.15
46313.05
Fluo- ride (F)
.20.01
.0.00
1.1.06
1.4.07
1.2.06
Ni trate (N03 )
8.90.14
3.1.05
9.3.15
4.4.07
2.0.03
Bo ron (B)
(ppm)
5.5
3.2
9.5
9.1
9.4
3.31
.4
5.23
.92
Per
cent so
dium
86
65
54
61
62
60
55
93
59
78
62
68
Hard ness as (CaC03) (ppm)
560
1,170
1,290
1,920
1,800
2,010
1,390
161
1,580
1,150
110
930
950
PH
7.9
7.9
7.6
7.7
7.5
8.2
8.3
6.9
6.9
Other constit uents and
remarks (ppm)
Sample from375 ft depth.AnalyzedMarch 13,1945
NH4 ,0.4;NOa.O.Ol;I, 0.4; Br, 7
NH4 ,0;NC-2 , 0; I,0.7; Br, 3
NH4 , 1.3;NO 2 , 0; I,3; Br, 4
Fe, Al, 9.2
Fe, Al, 9;CO3, asreportedprobablyin partHCQj
Sample from115 ft depth.AnalyzedMarch 13,1945
Sample from150 depth.AnalyzedMarch 13,1945
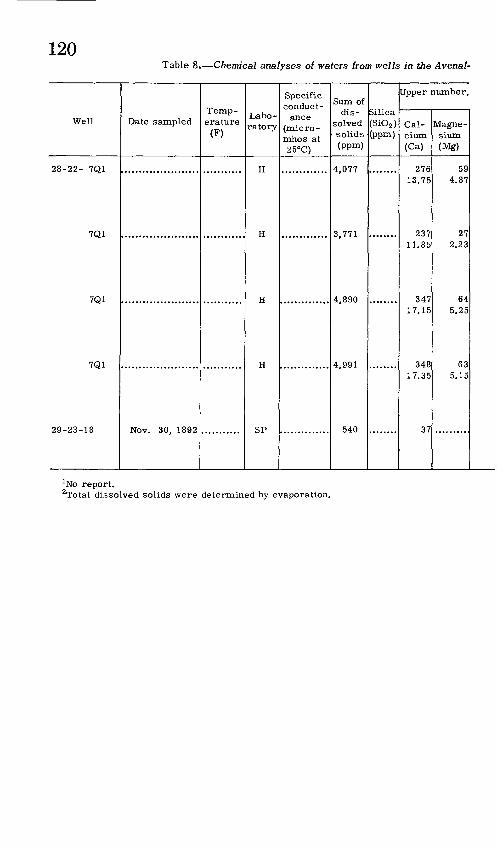
120Table 8. Chemical analyses of waters from wells in the Avenal-
Well
28-22- 7Q1
7Q1
7Q1
7Q1
29-23-18
Date sampled
Nov. 30, 1892
Temp erature
(F)
Labo ratory
H
H
H
H
SP
Specific conduct
ance (micro - mhos at 25°C)
.............
Sum of dis
solved 1 solids
(ppm)
4,077
3,771
4,890
4,991
540
Silica (Si02 ) (ppm)
........
Upper number,
Cal cium (Ca)
276 13.75
237 11.85
347 17.15
348 17.35
37
Magne sium (Mg)
59 4.87
27 2.23
64 5.25
63 5.15
' No report.2Total dissolved solids were determined by evaporation.

121McKittrick area, Kings and Kern Counties, Calif. Continued
parts per million, ppm. Lower number, equivalents per million, epm
So dium (Na)
957 41.6
975 42.4
1,171 50.9
1,207 52.5
IE
Potas sium (K)
1
Carbon ate
(C03 )
2 0.08
9 .3
0 .00
0 .00
0 .00
Bicar
bonate (HC03)
99 1.63
87 1.43
114 1.87
114 1.87
26 .43
Sul- fate (SO*)
2,220 46.22
2,040 42.47
2,740 57.04
2,800 58.3
49 1.02
Chlo ride (Cl)
445 12.56
444 12.52
514 14.5
517 14.57
261 7.36
Fluo-
ride (F)
Ni
trate (N03 )
Boron (B)
(ppm)
Per cent so
dium
69
75
70
70
79
Hard-
less as (CaCO3) (ppm)
931
704
1,120
1,120
PH
6.9
6.8
6.8
6.8
Other constit uents and
remarks (ppm)
Sample from 230 ft depth. Analyzed March 13, 1945.
Sample from 310 ft depth, Analyzed March 13, 1945.
Sample from 352 ft depth. Analyzed March 13, 1945.
Sample from 365 ft depth. Analyzed March 13, 1945.
SiO 2, Fe, Al, 19; well 686 ft deep.
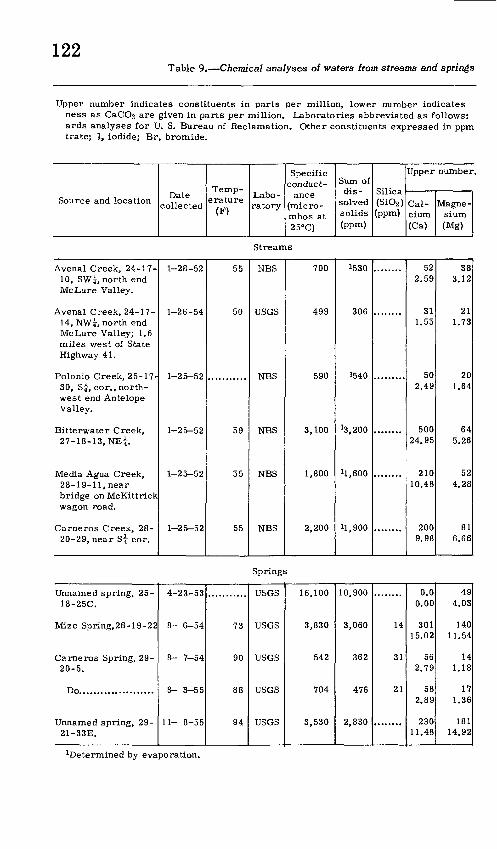
122Table 9. Chemical analyses of waters from streams and springs
Upper number indicates constituents in parts per million, lower number indicates ness as CaCC-3 are given in parts per million. Laboratories abbreviated as follows: ards analyses for U. S. Bureau of Reclamation. Other constituents expressed in ppm trate; I, iodide; Br, bromide.
Source and locationDate
collected
Temp erature
(F)
Labo ratory
Specific conduct
ance (micro- mhos at 25°C)
Sum of dis
solved solids (ppm)
Silica (Si02 ) (ppm)
Upper number
Cal cium (Ca)
Magne sium (Mg)
Streams
Avenal Creek, 24-17-10, SWi north endMe Lure Valley.
Avenal Creek, ^4 17 14, NWi, north endMe Lure Valley; 1.6miles west of StateHighway 41.
Polonio Creek, 25-17-30, 85, cor., northwest end AntelopeValley.
.DlttGFWELtGr Ol*GGK,
27-18-13, NE?.
edi28-19-11, nearbridge on McKittrickwagon road.
Carneros Creek, 28-20-29, near 85 cor.
1-28-52
1-26-54
1 OK _ CO
1 OK _ CO
\ o c _ co
1-25-52
RAoo
R.nJU
iQJ o
55
55
NBS
uses
NBS
NBS
NBS
NBS
700
499
590
3,100
1,800
2,200
!530
306
1540
^,200
il.GOO
11,900
522.59
311.55
502.49
50024.95
21010.48
2009.98
383.12
211.73
201.64
645.26
524.28
816.66
Springs
18-25C.
Mize Spring,28-19-22
Carneros Spring, 29- 20-5.
Do.....................
21-33E.
4-23-53
8- 6-54
8- 7-54
8- 3-55
11- 8-55
73
90
88
Q4
uses
uses
uses
uses
uses
16,100
3,830
542
704
3,530
10,900
3,060
362
476
2,830
14
31
21
0.00.00
301 15.02
56 2.79
582.89
23011.48
494.03
140 11.54
14 1.18
171.36
18114.92
Determined by evaporation.
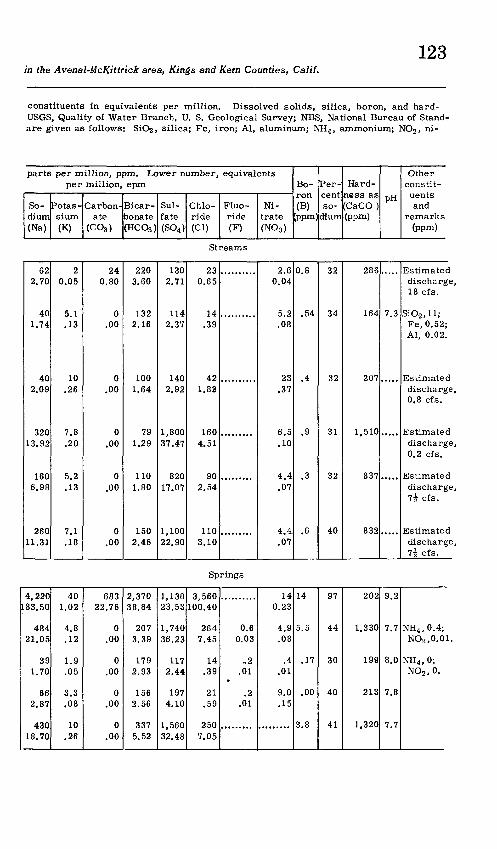
123in the Avenal-McKittrick area, Kings and Kern Counties, Calif,
constituents in equivalents per million. Dissolved solids, silica, boron, and hard- USGS, Quality of Water Branch, U. S. Geological Survey; NBS, National Bureau of Stand- are given as follows: SiO2, silica; Fe, iron; Al, aluminum; NH4 , ammonium; NO2 , ni-
parts per million, ppm. Lower number, equivalents per million, epm
So dium (Na)
Potas sium (K)
Carbon ate
(COa)
Bicar bonate(HCOg)
Sul- fate (S04 )
Chlo ride (Cl)
Fluo- ride (F)
Ni trate (N03 )
Bo ron (B)
ippm)
Per cent so
dium
Hard ness as (CaCO ) (ppm)
PH
Other constit uents and
remarks (ppm)
Streams
622.70
401.74
402.09
32013.92
1606.98
26011.31
20.05
5.1.13
10.26
7.8.20
5.2.13
7.1.18
240.80
0.00
0.00
0.00
0.00
0.00
2203.60
1322.16
1001.64
791.29
1101.80
1502.46
1302.71
1142.37
1402.92
1,80037.47
82017.07
1,10022.90
230.65
14.39
421.82
1604.51
902.54
1103.10
2.60.04
5.2.08
23.37
6.5.10
4.4.07
4.4.07
0.8
.54
.4
.9
.3
.6
32
34
32
31
3?
40
286
164
207
1,510
837
832
7 3
discharge,18 cfs.
SiO2 ,H;Fe, 0.52;Al, 0.02.
discharge, 0.8 cfs.
Estimateddischarge,0.2 cfs.
discharge, 7i cfs.
discharge, 7i cfs.
Springs
4,220183.50
48421.05
391.70
662.87
A^n1GU
18.70
401.02
4.8.12
1.9.05
3.3.08
10.26
68322.76
0.00
0.00
0.00
0.00
2,37038.84
2073.39
1792.93
1562.56
3375.52
1,13023.53
1,74036.23
1172.44
1974.10
1,56032.48
3,560100.40
2647.45
14.39
21.59
2507.05
0.60.03
.,2.01
.2.01
140.23
4.9.08
.4.01
9.0.15
14
5.5
.17
.00
3.8
97
44
30
40
41
202
1,330
199
213
1,320
9.2
7.7
8.0
7.8
7.7
NH4 ,0.4;NOa ,0.01.
NH4 ,0;NO2 ,0.
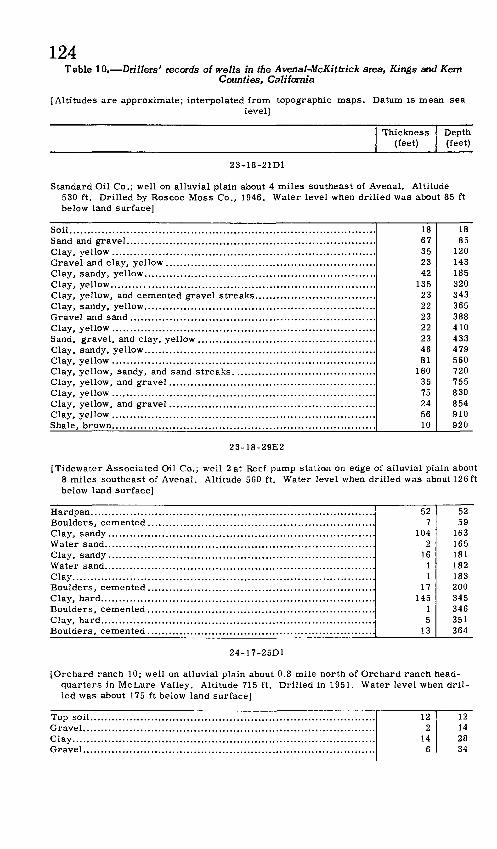
124Table 10. Drillers' records of wells in the Avenal-McKittrick area, Kings and Kern
Counties, California
[Altitudes are approximate; interpolated from topographic maps. Datum is mean sealevel]
Thickness (feet)
Depth (feet)
23-18-21D1
Standard Oil Co.; well on alluvial plain about 4 miles southeast of Avenal. Altitude 530 ft. Drilled by Roscoe Moss Co., 1946. Water level when drilled was about 85 ft below land surface]
Soil......................................................................................
Shale, brown. . ........................................................................
1867352342135232223222346811603575245610
1885120143185320343365388410433479560720755830854910920
23-18-29E2
[Tidewater Associated Oil Co.; well 2 at Reef pump station on edge of alluvial plain about 8 miles southeast of Avenal. Altitude 560 ft. Water level when drilled was about 126 ft below land surface]
Water sand............................................................................
Clay.....................................................................................
Boulders, cemented ................................................................
527
1042
1611
17145
15
13
5259
163165181182183200345346351364
24-17-25D1
[Orchard ranch 10; well on alluvial plain about 0.8 mile north of Orchard ranch head quarters in McLure Valley. Altitude 715 ft. Drilled in 1951. Water level when dril led was about 175 ft below land surface]
Top soil................................................................................
Clay.....................................................................................
122
146
12142834

125Table 10. Drillers' records of wells in the Avenal-McKittrick area, Kings and Kem
Counties, California Continued
Thickness (feet)
Depth (feet)
24-17-25D1 Continued
Clay.....................................................................................
Clay.....................................................................................
C lay , yellow ..........................................................................Sandstone, soft, and boulders....................................................S hale , ye How .........................................................................
1402646
430
827
320
2
174200246250280288315318338340
24-18-30B1
[Orchard ranch 7; well on alluvial plain about 1.5 miles northeast of Orchard ranch headquarters in McLure Valley. Altitude 685 ft. Deepened by L. E. Williams, 1950. Water level when drilled in 1948 was about 123 ft below land surface. Water level when deepened in 1950 was about 174 ft below land surface]
Old well................................................................................Clay, sandy, white ..................................................................
C lay , gray .............................................................................
Sand shell, hard ....................................................................
Sediment, blue .......................................................................Gravel, blue ..........................................................................C lay , blue , s tic ky ...................................................................
3001542
64362
35
443584
300315357363406468471476520523528536540
24-18-30D1
^Orchard ranch 3; well on alluvial plain about 1 mile northeast of Orchard ranch head quarters in McLure Valley. Altitude 699 ft. Drilled by Lantis and Sorensen, 1956. Water level when drilled was about 103 ft below land surface]
Surface soil...........................................................................Rock and gravel .....................................................................
Surface clay ..........................................................................
Clay, sandy ..................................... .. ..... .... . ...................Roc k and grave 1 .....................................................................
Sand and grave 1 ......................................................................Clay, sticky...........................................................................Sand and gravel................................. .. ...... ..........................
Clay ... .Rock and gravel................................................ ....................
14361416408
2416248
20150
8168846
14506480
120128152168192200220370378394402410414420
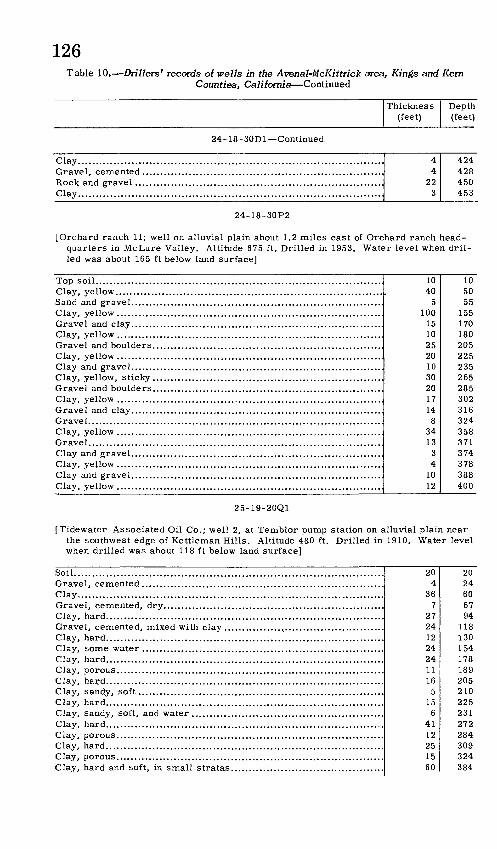
126Table 10. Drillers' records of wells in the Avenal-McKittrick area, Kings and Kem
Counties, California Continued
flav
Clay...........................
24-18-30D1 Continued
Thickness Depth (feet) (feet)
4 4244 428
22 4503 453
24-18-30P2
[Orchard ranch 11; well on alluvial plain about 1.2 miles east of Orchard ranch head quarters in McLure Valley. Altitude 675 ft. Drilled in 1953. Water level when dril led was about 165 ft below land surface]
C lay, ye How ...........................................................................
Clay, yellow ...........................................................................
10405
1001510252010302017148
341334
1012
105055
155170180205225235265285302316324358371374378388400
25-19-20Q1
[Tidewater Associated Oil Co.; well 2, at Temblor pump station on alluvial plain near the southwest edge of Kettleman Hills. Altitude 480 ft. Drilled in 1910. Water level when drilled was about 118 ft below land surface]
Soil.......................................................................................
Clay......................................................................................
Clay, hard..............................................................................
Clay, hard and soft, in small stratas. ............................. .............
204
367
272412242411165
156
4112251560
2024606794
118130154178189205210225231272284309324384
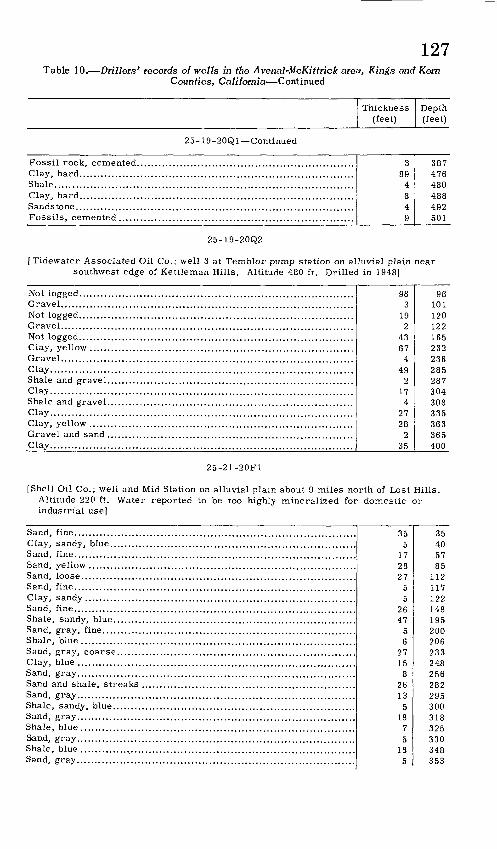
127Table 10. Drillers' records of wells in the Avenal-McKittrick area, Kings and Kern
Counties, California Continued
Thickness (feet)
Depth (feet)
25- 19-20Q1 Continued
Fossil rock, cemented............................................................. 3 387Clay, hard............................................................................. 89 476Shale.................................................................................... 4 480Clay, hard............................................................................. 8 488Sandstone.............................................................................. 4 492Fossils, cemented.................................................................. 9 501
25-19-20Q2
[Tidewater Associated Oil Co.; well 3 at Temblor pump station on alluvial plain near southwest edge of Kettleman Hills. Altitude 480 ft. Drilled in 1948]
Not logged............................................................................. 98 98Gravel.................................................................................. 3 101Not logged............................................................................. 19 120Gravel.................................................................................. 2 122Not logged............................................................................. 43 165Clay, yellow.......................................................................... 67 232Gravel.................................................................................. 4 236Clay..................................................................................... 49 285Shale and gravel..................................................................... 2 287Clay..................................................................................... 17 304Shale and gravel..................................................................... 4 308Clay..................................................................................... 27 335Clay, yellow .......................................................................... 28 363Gravel and sand..................................................................... 2 365Clay..................................................................................... 35 400
25-21-20F1
[Shell Oil Co.; well and Mid Station on alluvial plain about 9 miles north of Lost Hills. Altitude 220 ft. Water reported to be too highly mineralized for domestic or industrial use]
Sand, fine...................Clay, sandy, blue.........Sand, fine...................Sand, yellow ...............Sand, loose.................Sand, fine...................Clay, sandy ................Sand, fine...................Shale, sandy, blue........Sand, gray, fine...........Shale, blue.................Sand, gray, coarse.......Clay, blue ..................Sand, gray..................Sand and shale, streaks Sand, gray..................Shale, sandy, blue........Sand, gray...................Shale, blue..................Sand, gray..................Shale, blue ..................Sand, gray...................
355
17282755
264756
27158
26135
1875
185
35405785112117122148195200206233248256282295300318325330348353
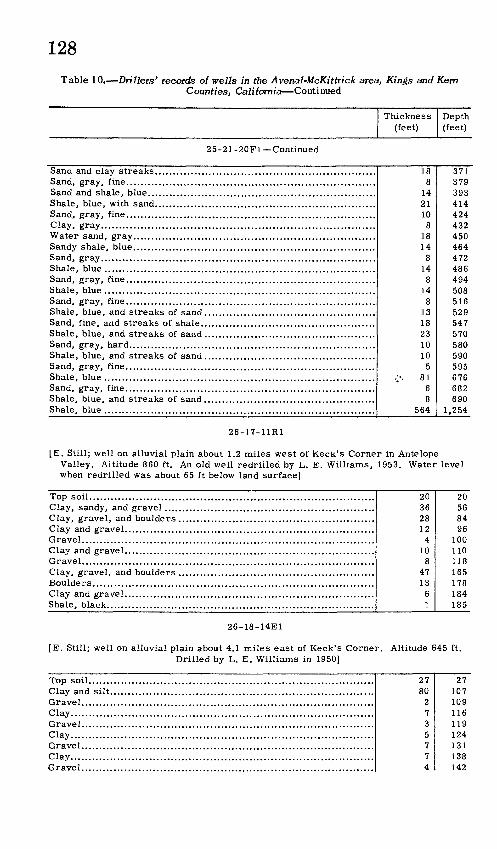
128
Table 10. Drillers' records of wells in the Avenal-McKittrick area, Kings and Kem Counties, California Continued
Thickness (feet)
Depth (feet)
25-21-20F1 Continued
Sand and clay streaks..............Sand, gray, fine.......................Sand and shale, blue.................Shale, blue, with sand...............Sand, gray, fine.......................Clay, gray..............................Water sand, gray.....................Sandy shale, blue.....................Sand, gray..............................Shale, blue .............................Sand, gray, fine.......................Shale, blue.............................Sand, gray, fine.......................Shale, blue, and streaks of sand. Sand, fine, and streaks of shale.. Shale, blue, and streaks of sand. Sand, gray, hard......................Shale, blue, and streaks of sand. Sand, gray, fine.......................Shale, blue .............................Sand, gray, fine.......................Shale, blue, and streaks of sand . Shale, blue .............................
188
142110
81814
814
814
81318231010
581
68
564
371379393414424432450464472486494508516529547570580590595676682690
1,254
26-17-11R1
[E. Still; well on alluvial plain about 1.2 miles west of Keek's Corner in Antelope Valley. Altitude 860 ft. An old well redrilled by L. E. Williams, 1953. Water level when redrilled was about 65 ft below land surface]
Top soil................................................................................ 20 20Clay, sandy, and gravel........................................................... 36 56Clay, gravel, and boulders ....................................................... 28 84Clay and gravel...................................................................... 12 96Gravel.................................................................................. 4 100Clay and gravel...................................................................... 10 110Gravel.................................................................................. 8 118Clay, gravel, and boulders....................................................... 47 165Boulders............................................................................... 13 178Clay and gravel...................................................................... 6 184Shale, black........................................................................... _______1 185
26-18-14E1
[E. Still; well on alluvial plain about 4.1 miles east of Keek's Corner. Altitude 645 ft. Drilled by L. E. Williams in 1950]
Top soil................................................................................ 27 27Clay and silt.......................................................................... 80 107Gravel.................................................................................. 2 109Clay..................................................................................... 7 116Gravel.................................................................................. 3 119Clay..................................................................................... 5 124Gravel.................................................................................. 7 131Clay..................................................................................... 7 138Gravel.................................................................................. 4 142
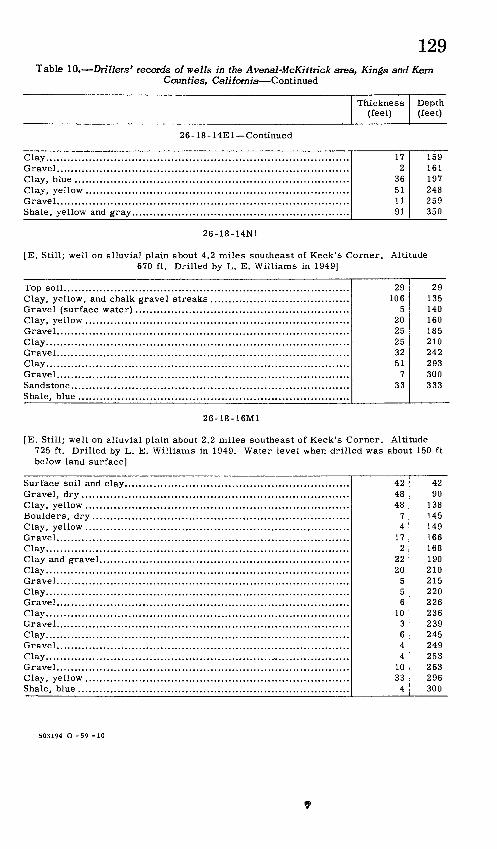
129Table 10. Drillers' records of wells in the Avenal-McKittrick area, Kings and Kem
Counties, California Continued
Thickness (feet)
Depth (feet)
26-18-14E1 Continued
Clay..................................................................................... 17 159Gravel.................................................................................. 2 161Clay, blue............................................................................. 36 197Clay, yellow .......................................................................... 51 248Gravel.................................................................................. 11 259Shale, yellow and gray............................................................. 91 350
26-18-14N1
[E. Still; well on alluvial plain about 4.2 miles southeast of Keek's Corner. Altitude 670 ft. Drilled by L. E. Williams in 1949]
Top soil................................................................................ 29 29Clay, yellow, and chalk gravel streaks ....................................... 106 135Gravel (surface water) ............................................................ 5 140Clay, yellow .......................................................................... 20 160Gravel.................................................................................. 25 185Clay..................................................................................... 25 210Gravel.................................................................................. 32 242Clay..................................................................................... 51 293Gravel.................................................................................. 7 300Sandstone.............................................................................. 33 333Shale, blue ............................................................................
26-18-16M1
[E. Still; well on alluvial plain about 2.2 miles southeast of Keek's Corner. Altitude 725 ft. Drilled by L. E. Williams in 1949. Water level when drilled was about 150 ft below land surface]
Surface soil and clay. Gravel, dry .............Clay, yellow ............Boulders, dry ..........Clay, yellow ............Gravel....................Clay.......................Clay and gravel........Clay.......................Gravel....................Clay.......................Gravel....................Clay.......................Gravel....................Clay.......................Gravel....................Clay.......................Gravel....................Clay, yellow ............Shale, blue..............
4290
138145149166168190210215220226236239245249253263296300
503194 O -59 -10
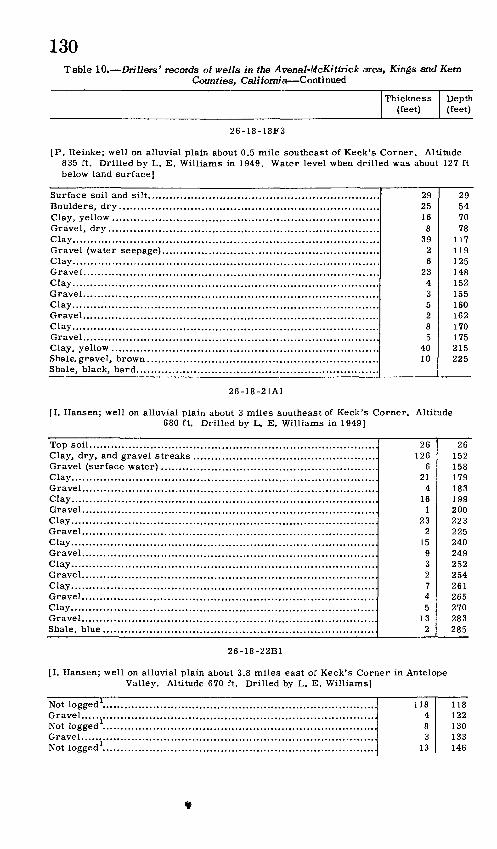
130Table 10. Drillers' records of wells in the Avenal-McKittrick area, Kings and Kern
Counties, California Continued
Thickness (feet)
Depth (feet)
26-18-18F3
[P. Reinke; well on alluvial plain about 0.5 mile southeast of Keek's Corner. Altitude 835 ft. Drilled by L. E. Williams in 1949. Water level when drilled was about 127 ft below land surface]
Surface soil and silt................................................................. 29 29Boulders, dry......................................................................... 25 54Clay, yellow........................................................................... 16 70Gravel, dry............................................................................ 8 78Clay...................................................................................... 39 117Gravel (water seepage)............................................................. 2 119Clay...................................................................................... 6 125Gravel................................................................................... 23 148Clay...................................................................................... 4 152Gravel................................................................................... 3 155Clay...................................................................................... 5 160Gravel................................................................................... 2 162Clay...................................................................................... 8 170Gravel................................................................................... 5 175Clay, yellow ........................................................................... 40 215Shale,gravel, brown................................................................. 10 225Shale, black, hard.................................................................... ___ ____
26-18-21A1
[I. Hansen; well on alluvial plain about 3 miles southeast of Keek's Corner. Altitude 680 ft. Drilled by L. E. Williams in 1949]
Top soil................................................................................. 26 26Clay, dry, and gravel streaks .................................................... 126 152Gravel (surface water)............................................................. 6 158Clay...................................................................................... 21 179Gravel................................................................................... 4 183Clay...................................................................................... 16 199Gravel................................................................................... 1 200Clay...................................................................................... 23 223Gravel................................................................................... 2 225Clay...................................................................................... 15 240Gravel................................................................................... 9 249Clay...................................................................................... 3 252Gravel................................................................................... 2 254Clay...................................................................................... 7 261Gravel................................................................................... 4 265Clay...................................................................................... 5 270Gravel................................................................................... 13 283Shale, blue.............................................................................______2 285
26-18-22B1
[I. Hansen; well on alluvial plain about 3.8 miles east of Keek's Corner in Antelope Valley. Altitude 670 ft. Drilled by L. E. Williams]
Not logged 1............................................................................. 118 118Gravel................................................................................... 4 122Not logged 1............................................................................. 8 130Gravel................................................................................... 3 133Not logged 1............................................................................. 13 146

131Table 10. Drillers' records of wells in the Avenal-McKittrick area, Kings and Kem
Counties, California Continued
Thickness Depth (feet) (feet)
26-18-22B1 Continued
Shale, black...........................................................................
5 16
3 48 38 37
151 167 170 218 256 293
1Driller reported that sections not logged contained fine-grained, relatively imper meable materials.
26-18-23C1
[E. Still; well on alluvial plain about 4.6 miles east of Keek's Corner. Altitude 670 ft. Drilled by L. E. Williams]
Clav
Clav
Clav
Gravel.................................................................................Clav
Clay.................................................................... ................Gravel.................................................................................Clay, blue ............................................................................
1276
2716156
1310201586
17
127133160176191197210220240255263269286
26-18-23C2
[E. Still; well on alluvial plain about 4.4 miles east of Keek's Corner. Altitude 670 ft. Drilled by L. E. Williams in 1951. Water level when drilled was about 160 ft below land surface]
Clav
Clay....................................................................................
Clav
Clav
Clsv
Clay....................................................................................
Clay....................................................................................
Clay....................................................................................
Clay, blue ............................................................................
298174
1028113875
11342
12332
192
133
29110117121131159170208215220231234238240252255258260279281294297
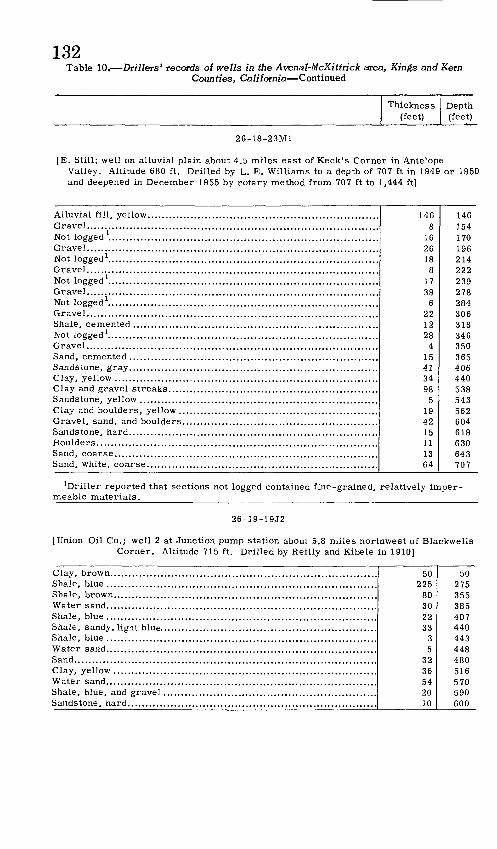
132Table 10. Drillers' records of wells in the Avenal-McKittrick area, Kings and Kern
Counties, California Continued
Thickness (feet)
Depth (feet)
26-18-23M1
[E. Still; well on alluvial plain about 4.5 miles east of Keek's Corner in AntelopeValley. Altitude 680 ft. Drilled by L. E. Williams to a depth of 707 ft in 1949 or 1950 and deepened in December 1955 by rotary method from 707 ft to 1,444 ft]
Alluvial fill, yellow...........Gravel............................Not logged ......................G r ave 1............................Not logged \.....................Gravel............................Not logged 1......................Gravel............................Not logged \.....................Gravel............................Shale, cemented ...............Not logged l. .....................Gravel............................Sand, cemented ................Sandstone, gray................Clay, yellow ....................Clay and gravel streaks.....Sandstone, yellow .............Clay and boulders, yellow .. Gravel, sand, and boulders. Sandstone, hard................Boulders.........................Sand, coarse....................Sand, white, coarse...........
1468
162618
81739
6221228
415413498
5194215111364
146154170196214222239278284306318346350365406440538543562604619630643707
1Driller reported that sections not logged contained fine-grained, relatively imper- meable materials.
26-19-19J2
[Union Oil Co.; well 2 at Junction pump station about 5.8 miles northwest of Blackwells Corner. Altitude 715 ft. Drilled by Reilly and Kibele in 1910]
Clay, brown...............Shale, blue ................Shale, brown..............Water sand................Shale, blue ................Shale, sandy, light blue. Shale, blue ................Water sand................Sand.........................Clay, yellow ..............Water sand................Shale, blue, and gravel Sandstone, hard..........
50225
80302233
35
3236542010
50275355385407440443448480516570590600
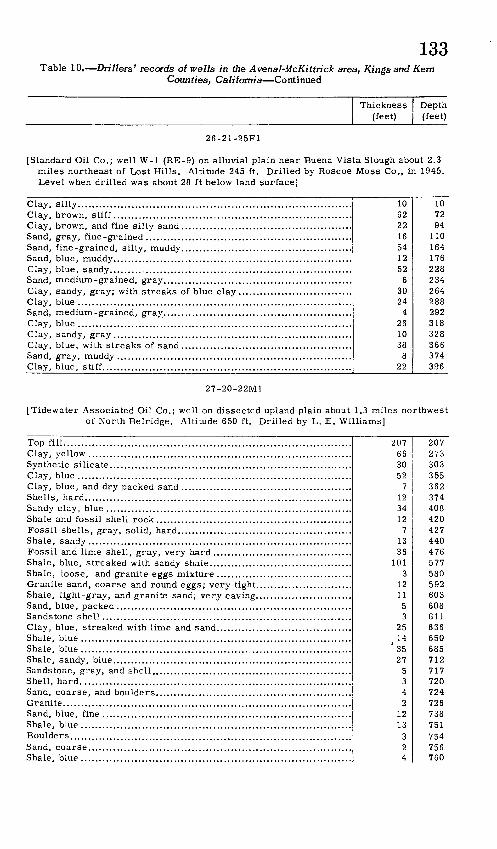
133Table 10. Drillers' records of wells in the Avenal-McKittrick area, Kings and Kem
Counties, California Continued
Thickness (feet)
Depth (feet)
26-21-25F1
[Standard Oil Co.; well W-1 (RE-9) on alluvial plain near Buena Vista Slough about 2.3 miles northeast of Lost Hills. Altitude 245 ft. Drilled by Roscoe Moss Co., in 1945. Level when drilled was about 28 ft below land surface]
Clay, silty............................................................................. 10 10Clay, brown, stiff................................................................... 62 72Clay, brown, and fine silty sand................................................ 22 94Sand, gray, fine-grained.......................................................... 16 110Sand, fine-grained, silty, muddy................................................ 54 164Sand, blue, muddy................................................................... 12 176Clay, blue, sandy.................................................................... 52 228Sand, medium-grained, gray..................................................... 6 234Clay, sandy, gray; with streaks of blue clay................................ 30 264Clay, blue ............................................................................. 24 288Sand, medium-grained, gray..................................................... 4 292Clay, blue ............................................................................. 26 318Clay, sandy, gray................................................................... 10 328Clay, blue, with streaks of sand................................................ 38 366Sand, gray, muddy .................................................................. 8 374Clay, blue, stiff...................................................................... ______22 396
27-20-22M1
[Tidewater Associated Oil Co.; well on dissected upland plain about 1.3 miles northwest of North Belridge. Altitude 650 ft. Drilled by L. E. Williams]
Top fill................................................................................. 207 207Clay, yellow .......................................................................... 66 273Synthetic silicate.................................................................... 30 303Clay, blue ............................................................................. 52 355Clay, blue, and dry packed sand................................................ 7 362Shells, hard........................................................................... 12 374Sandy clay, blue ..................................................................... 34 408Shale and fossil shell rock....................................................... 12 420Fossil shells, gray, solid, hard................................................. 7 427Shale, sandy.......................................................................... 13 440Fossil and lime shell, gray, very hard....................................... 36 476Shale, blue, streaked with sandy shale........................................ 101 577Shale, loose, and granite eggs mixture ...................................... 3 580Granite sand, coarse and round eggs; very tight........................... 12 592Shale, light-gray, and granite sand; very caving........................... 11 603Sand, blue, packed.................................................................. 5 608Sandstone shell...................................................................... 3 611Clay, blue, streaked with lime and sand...................................... 25 636Shale, blue ............................................................................ j 14 650Shale, blue............................................................................ ' 35 685Shale, sandy, blue................................................................... 27 712Sandstone, gray, and shell........................................................ 5 717Shell, hard............................................................................ 3 720Sand, coarse, and boulders....................................................... 4 724Granite................................................................................. 2 726Sand, blue, fine ...................................................................... 12 738Shale, blue ............................................................................ 13 751Boulders............................................................................... 3 754Sand, coarse.......................................................................... 2 756Shale, blue ............................................................................ 4 760
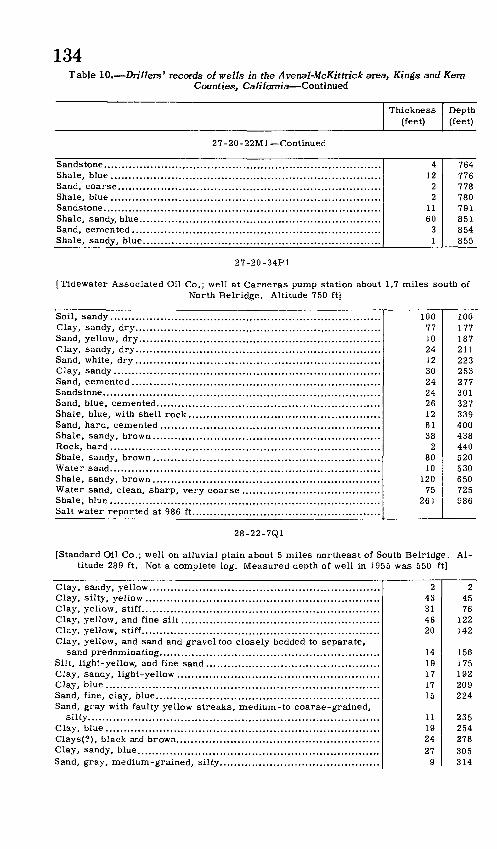
134Table 10. Drillers' records of wells in the Avenal-McKittrick area, Kings and Kern
Counties, California Continued
Thickness (feet)
Depth (feet)
27-20-22M1 Continued
Sandstone.............................................................................. 4 764Shale, blue............................................................................ 12 776Sand, coarse.......................................................................... 2 778Shale, blue............................................................................ 2 780Sandstone.............................................................................. 11 791Shale, sandy, blue......................;............................................. 60 851Sand, cemented...................................................................... 3 854Shale, sandy, blue................................................................... _______1 855
27-20-34P1
[Tidewater Associated Oil Co.; well at Cameras pump station about 1.7 miles south of North Belridge. Altitude 750 ft]
Soil, sandy............................................................................ 100 100Clay, sandy, dry..................................................................... 77 177Sand, yellow, dry.................................................................... 10 187Clay, sandy, dry..................................................................... 24 211Sand, white, dry..................................................................... 12 223Clay, sandy........................................................................... 30 253Sand, cemented...................................................................... 24 277Sandstone.............................................................................. 24 301Sand, blue, cemented............................................................... 26 327Shale, blue, with shell rock...................................................... 12 339Sand, hard, cemented.............................................................. 61 400Shale, sandy, brown................................................................ 38 438Rock, hard............................................................................ 2 440Shale, sandy, brown................................................................ 80 520Water sand............................................................................ 10 530Shale, sandy, brown................................................................ 120 650Water sand, clean, sharp, very coarse....................................... 75 725Shale, blue............................................................................ 261 986Salt water reported at 986 ft.....................................................
28-22-7Q1
[Standard Oil Co.; well on alluvial plain about 5 miles northeast of South Belridge. Al titude 289 ft. Not a complete log. Measured depth of well in 1955 was 550 ft]
Clay, sandy, yellow................................................................. 2 2Clay, silty, yellow .................................................................. 43 45Clay, yellow, stiff................................................................... 31 76Clay, yellow, and fine silt........................................................ 46 122Clay, yellow, stiff................................................................... 20 142Clay, yellow, and sand and gravel too closely bedded to separate,
sand predominating.............................................................. 14 156Silt, light-yellow, and fine sand................................................. 19 175Clay, sandy, light-yellow ......................................................... 17 192Clay, blue............................................................................. 17 209Sand, fine, clay, blue............................................................... 15 224Sand, gray with faulty yellow streaks, medium-to coarse-grained,
silty.................................................................................. 11 235Clay, blue............................................................................. 19 254Clays(?), black and brown......................................................... 24 278Clay, sandy, blue.................................................................... 27 305Sand, gray, medium-grained, silty............................................. 9 314

135Table 10. Drillers' records of wells in the Avenal-McKittrick area, Kings and Kern
Counties, California Continued
Thickness (feet)
Depth (feet)
28-22-7Q1 Continued
Clay, sandy, gray.................................................................... 32 346Sand, gray, with yellow streaks, silty, fine-grained....................... 18 364
29-22-1P1
[Torreta, formerly Klassen 1 well; near Buena Vista Slough about 5.5 miles northwest of Buttonwillow. Altitude 255 ft. Drilled in 1937]
Soil...................................................................................... 16~ 16"Clay, yellow........................................................................... 6 22Sand.................................................................................. 29 51Clay, gray............................................................................. 3 54Sand..................................................................................... 38 92Clay, blue.............................................................................. 26 118Sand..................................................................................... 10 128Clay, blue.............................................................................. 4 132Sand..................................................................................... 6 138Clay, blue.............................................................................. 5 143Clay, and sand streaks ............................................................ 5 148Clay, sandy............................................................................ 5 153Sand..................................................................................... 7 160Clay, blue.............................................................................. 8 168Sand..................................................................................... 4 172Clay, sandy............................................................................. 21 193Sand..................................................................................... 7 200Clay, blue.............................................................................. 5 205Sand..................................................................................... 11 216Clay, sandy............................................................................ 7 223Clay, and sand streaks............................................................. 26 249Sand..................................................................................... 18 267Clay, blue, tough..................................................................... 3 270
29-23-17P1
[J. Chicca, formerly Miller and Lux 83; well near Buena Vista Slough about 3.5 miles west of Buttonwillow. Altitude 260 ft. Drilled by D. W. Slocum in 1934 and deepened from 246 ft to 280 ft in 1935]
Soil............Sand ...........Clay, gray ... Sand...........Clay, yellow. Sand ...........Clay, yellow. Clay, sandy.. Clay, blue....Clay, sandy.. Sand...........Clay, blue....Sand...........Clay, yellow. Clay, blue....Sand ...........Clay, yellow.
104351
2316152099
225
531511212
105358598298
113133142151173178231246257278280
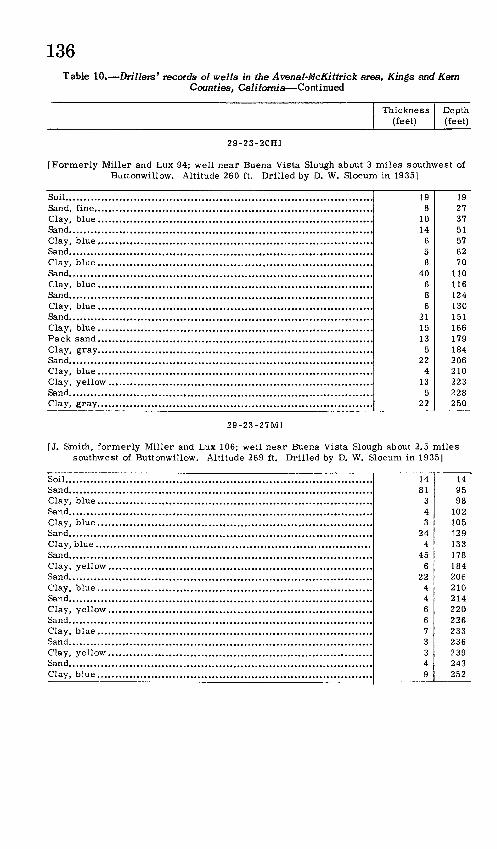
136Table 10.- -Drillers' records of wells in the Avenal-McKittrick area, Kings and Kern
Counties, California Continued
Thickness (feet)
Depth (feet)
29-23-20H1
[Formerly Miller and Lux 94; well near Buena Vista Slough about 3 miles southwest of Buctonwillow. Altitude 260 ft. Drilled by D. W. Slocum in 1935]
Soil...................................................................................... 19 19Sand, fine.............................................................................. 8 27Clay, blue............................................................................. 10 37Sand..................................................................................... 14 51Clay, blue............................................................................. 6 57Sand..................................................................................... 5 62Clay, blue............................................................................. 8 70Sand..................................................................................... 40 110Clay, blue............................................................................. 6 116Sand..................................................................................... 8 124Clay, blue............................................................................. 6 130Sand..................................................................................... 21 151Clay, blue............................................................................. 15 166Pack sand............................................................................. 13 179Clay, gray............................................................................. 5 184Sand..................................................................................... 22 206Clay, blue............................................................................. 4 210Clay, yellow.......................................................................... 13 223Sand..................................................................................... 5 228Clay, gray............................................................................. ______22 250
29-23-27M1
[J. Smith, formerly Miller and Lux 106; well near Buena Vista Slough about 2.5 miles southwest of Buttonwillow. Altitude 269 ft. Drilled by D. W. Slocum in 1935]
Soil...................................................................................... 14~14~Sand..................................................................................... 81 95Clay, blue............................................................................. 3 98Sand..................................................................................... 4 102Clay, blue............................................................................. 3 105Sand..................................................................................... 24 129Clay, blue............................................................................. 4 133Sand..................................................................................... 45 178Clay, yellow.......................................................................... 6 184Sand..................................................................................... 22 206Clay, blue............................................................................. 4 210Sand..................................................................................... 4 214Clay, yellow.......................................................................... 6 220Sand..................................................................................... 6 226Clay, blue............................................................................. 7 233Sand..................................................................................... 3 236Clay, yellow.......................................................................... 3 239Sand..................................................................................... 4 243Clay, blue............................................................................. 9 252
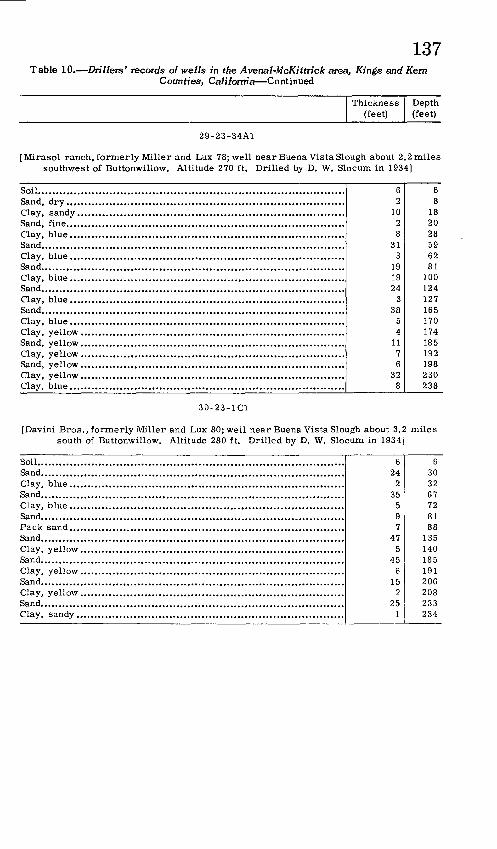
137Table 10. Drillers' records of wells in the Avenal-McKittrick area, Kings and Kem
Counties, California Continued
Thickness (feet)
Depth (feet)
29-23-34A1
[Mirasol ranch, formerly Miller and Lux 78; well near Buena Vista Slough about 2.2 miles southwest of Buttonwillow. Altitude 270 ft. Drilled by D. W. Slocum in 1934]
Soil...................................................................................... 6 6Sand, dry.............................................................................. 2 8Clay, sandy........................................................................... 10 18Sand, fine.............................................................................. 2 20Clay, blue............................................................................. 8 28Sand..................................................................................... 31 59Clay, blue............................................................................. 3 62Sand..................................................................................... 19 81Clay, blue............................................................................. 19 100Sand..................................................................................... 24 124Clay, blue............................................................................. 3 127Sand..................................................................................... 38 165Clay, blue............................................................................. 5 170Clay, yellow.......................................................................... 4 174Sand, yellow.......................................................................... 11 185Clay, yellow.......................................................................... 7 192Sand, yellow.......................................................................... 6 198Clay, yellow.......................................................................... 32 230Clay, blue............................................................................._______8 238
30-23-1C1
[Davini Bros., formerly Miller and Lux 80; well near Buena Vista Slough about 3.2 miles south of Buttonwillow. Altitude 280 ft. Drilled by D. W. Slocum in 1934]
Soil...................................................................................... 6 6Sand..................................................................................... 24 30Clay, blue............................................................................. 2 32Sand..................................................................................... 35 67Clay, blue............................................................................. 5 72Sand..................................................................................... 9 81Pack sand............................................................................. 7 88Sand..................................................................................... 47 135Clay, yellow.......................................................................... 5 140Sand..................................................................................... 45 185Clay, yellow.......................................................................... 6 191Sand..................................................................................... 15 206Clay, yellow.......................................................................... 2 208Sand..................................................................................... 25 233Clay, sandy........................................................................... 1 234
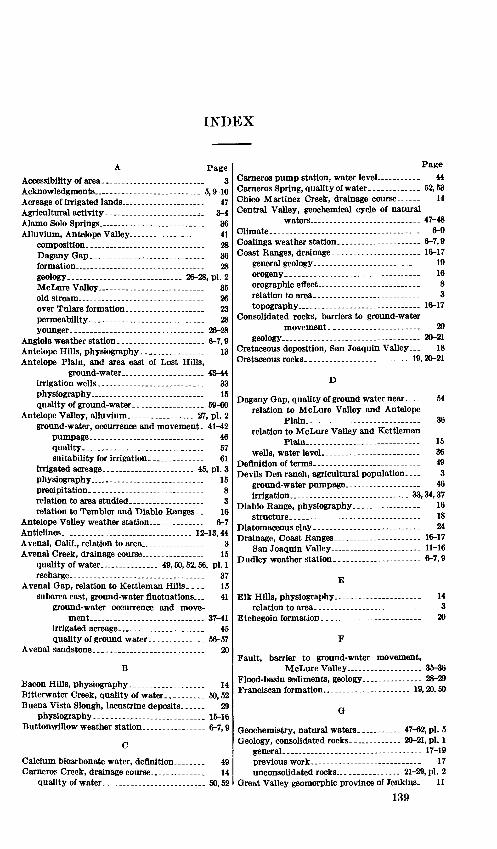
INDEX
A Page Accessibility of area-.-.._...._.._...... 3Acknowledgments_..._ ___.. __ 5,9-10 Acreage of irrigated lands_........._---... 47Agricultural activity- ._...._ ._.,_ 3-4Alamo Solo Springs...__.............._.. 36Alluvium, Antelope Valley.--...----_...... 41
composition.--.-----.--_............... 28Dagany Gap.................___.... 36formation__........................... 28geology...___._-.-----..._... 26-28, pi. 2McLure Valley. .. .. ... . 36 old stream____._.............__.. 26over Tulare formation...----............. 23permeability-___.___--------_.. 28younger...__.__..............__.. 26-28
Angiola weather station._.................. 6-7,9Antelope Hills, physiography..._..--.----. 13Antelope Plain, and area east of Lost Hills,
ground-water________..._ 43-44 irrigation wells.__._____........... 33physiography__........................ 15quality of ground-water---......_...... 59-60
Antelope Valley, alluvium______._ 27, pi. 2ground-water, occurrence and movement- 41-42
pumpage_.._...__............. 46quality____....___._........ 57suitability for irrigation.............. 61
irrigated acreage..._.__..._.__ 45, pi. 3 physiography....---.---..-.__---------- 15precipitation.____............._.... 8relation to area studied..-......._------ 3relation to Temblor and Diablo Ranges.. 16
Antelope Valley weather station_......_.. 6-7Anticlines.-.............. .............. 12-13,44Avenal, Calif., relation to area................ 3Avenal Creek, drainage course__---------- 15
quality of water---..-..---.-.. 49,50,52,56, pi. 1 recharge.--.._.............___.... 37
Avenal Gap, relation to Kettleman Hills.... 15subarea east, ground-water fluctuations_ 41
ground-water occurrence and move ment..._--...--.-._.......... 37-41
irrigated acreage__._._......... 45quality of ground water.......----.-. 56-57
Avenal sandstone...-.-..-------............. 20
B
Bacon Hills, physiography................... 14Bitterwater Creek, quality of water.......... 50,52Buena Vista Slough, lacustrine deposits...... 29
physiography............................ 15-16Buttonwillow weather station................ 6-7,9
Calcium bicarbonate water, definition._.... 49Cameras Creek, drainage course__......... 14
quality of water......................... 50,52
Page Carneros pump station, water level .... 44Cameras Spring, quality of water _ ... 52,53 Chico Martinez Creek, drainage course.---.- 14 Central Valley, geochemical cycle of natural
waters..-.--------------------..-- 47-48Climate... .... - -- 6-9Coalinga weather station..........-...... - 6-7,9Coast Ranges, drainage....__ . 16-17
general geology...-------------------- 19orogeny..._.. ..........- .- .-.. 16orographic effect --.- ... ... .... 8relation to area...---...------------------ 3topography_-...--------------.----.. 16-17
Consolidated rocks, barriers to ground-watermovement.. ...... . 29
geology 20-21Cretaceous deposition, San Joaquin Valley 18 Cretaceous rocks.----.--.-.-------------- 19,20-21
D
54
36
Dagany Gap, quality of ground water near....relation to McLure Valley and Antelope
Plain. relation to McLure Valley and Kettleman
Plain.-----------.-.------------ 15wells, water level-------- ------- .-.. 36
Definition of terms____. ... ...... 49Devils Den ranch, agricultural population.... 3
ground-water pumpage-- ....... 46irrigation.. - 33,34,37
Diablo Range, physiography. __. 16structure.._... .. ... . .... 18
Diatomaceousclay.. ----- ... 24 Drainage, Coast Ranges.--.---------- ----- 16-17
San Joaquin Valley ----------- ... 11-16Dudley weatherstation.------------------- 6-7,9
E
Elk Hills, physiography...---------------- 14relation to area.. -------- ------ 3
Etchegoin formation.. _ . . 20
Fault, barrier to ground-water movement,McLure Valley.....-------- 35-36
Flood-basin sediments, geology. ----- 28-29Franciscan formation..----.. -- ------- 19,20,50
G
Geochemistry, natural waters - _ ------ 47-62, pi. 5Geology, consolidated rocks. - _........ 20-21, pi. 1
general_____..............- ..- . 17-19previous work ------------------------- 17unconsolidated rocks.......__ .. 21-29,pi. 2
Great Valley geomorphic province of Jenkins. 11
139

140 INDEX
PageGround water, from stream seepage...____ 27
in consolidated rocks.._____._.._ 21 occurrence and movement-..._.-.._.. 29-47 pumping...__________.____ 45-47 quality, Antelope Plain...___....__ 59-60
Antelope Valley.-.--.-.--.......-.--- 57areaeastof Lost Hills................ 59-60area east of McLure Valley___ - -.. 56-57 as limiting factor in utilization........ 60-62Kettleman City subarea.............. 54Kettleman Plain...-.._____----- 54in relation to structural features...... 19McLure Valley .................... 54-56
recharge.---------...._................. 29-47subareas of occurrence and movement.. -. 32
H
Hoots, H. W., and others, quoted.----------- 19Hydrologic units, geographic................. 32
Irrigated areas..._...__............ 31,47,pi. 3Irrigation, by pumped water.-.------------.. 45-47
Devils Den ranch..._.................. 37east of Avenal Gap........____...... 41McLure Valley_.___-___.........__ 37wells.................................... 33,34
Jacalitos formation. . ______ ... _ . _ .. 20 Jenkins' Great Valley geomorphic province _ 11 Junction pump station, quality of ground
water _ . __ .................... 43-44Jurassic rocks __ ........................... 19,20
K
Kettleman City, Calif., relation to area...-.- 3 Kettleman City subarea, quality of ground
water_._------------________ 54Kettleman Hills, old stream deposits......... 26
physiography__..._...__ ___..... 12-13relation to area.___....___._____..._ 3
Kettleman Plain, alluvium__.... .._ 27,pi. 2ground-water, fluctuations.__.. .. .. 34-35
occurrence and movement ------------ 33-34quality_.___._._.._........ 54suitability for irrigation.._......... 61
irrigated acreage__----..............--.. 45physiography-..-.-----....-_........._-_ 15relation to area....____...___________._... 3
Kettleman weather station. 6-7,9Kreyenhagen shale-. - 20
L Lacustrine deposits..-.. ...-----.._......... 28-29Location of area................_........_., 3Lokern, Calif., quality of ground water........ 43Lost Hills, area east, irrigated acreage._...__. 45
physiography--------....-..._..--.....-. 13quality of ground water east of. _.-.... 59
Lost Hills, Calif., relation to area. 3Lost Hills anticline.. _ _--_____ 44Lost Hills oil field, discovery well_..-._._... 60
M McLure shale .. -.---. -------------- 20McLure Valley, alluvium __ . _ ... .. 27, pi. 2
ground-water, fluctuations ___ . .. .. 37 occurrence and movement- . .. .. - - 35-37pumpage ____ ..... ......... .... 46quality 54-56suitability . . 61
irrigated acreage.... ------- .- 45, pi. 3physiography .. .. ..... 15relation to area .. ................... 3
Media Agua Creek, quality of water ...... ... 50, 52Middlewater weather station _ . _ ....... ... 6-7, 9Mize Spring, quality of water. __ 53
N
North Belridge oil field, anticlinal fold under lying. ------------------------- 13
P Panoche formation. ... 20Parkfleld, Calif., precipitation.-.------------- 8Physiography_ ---_----------- - 11-17Polonio Creek, quality of water. -- 49,50,52, pi. 1 Population_ -----_--------- ........ 3Precipitation, monthly____.. .. 6-9
source of ground-water recharge - - - - 30,31Priest Valley, precipitation....._----------- 8Purpose of report-------------.---.----------- 4-6
Quality of water, general_.. ..-- -------- 47-49ground, by subareas.____------- 53-60,pi. 1
limiting factor in utilization.......---- 60-62influence of lithology...... 50-52spring .... 52-53in relation to geologic units_.. ..... 20surface ---------------------------- 49-52
Quaternary deposition, San Joaquin Valley. 18
R Railroad in area.. .__-_----.--- --.------ 3Reef Ridge shale. 20Reef pump station.... 35References ...-----.-...---..---.--------.-- 62-64
San Joaquin formation__......._....._.. 20,22San Joaquin Valley, drainage.-..--.-. ------ 11-16
general geology-.---.-.---..-.--- -.----- 17-19interior drainage .__ --- 11 lacustrine deposits.... 29physiography__..._ 11-16previous geologic study _ 17relation to area...--------_-----...--... 3topography .--..._____-....-...-.--_--- 11-16
Scope of report--.-.--..-..--.-.-.-.....-.---. 4-6Seepage, source of recharge to ground water... 30 Sierra Nevada fault_..._.....__----------- 17,18Sodium calcium bicarbonate water, definition. 49 Soil.. 8,16South Belridge, anticlinal fold underlying-. 13 Southern Pacific railroad..------------------- 3
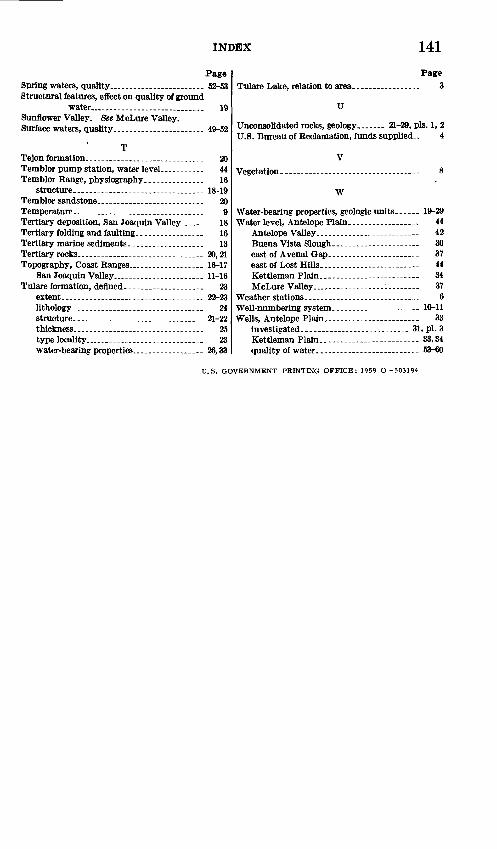
INDEX 141
Page Spring waters, quality...-.--....--..---..--. 52-53Structural features, effect on quality of ground
water -...-.---.----------.---- 19Sunflower Valley. See McLure Valley.Surface waters, quality___.__..._ .. 49-52
Tejon formation. ____.______._ 20 Temblor pump station, water level_____ 44 Temblor Range, physiography......_._ 16
structure.______.__.__.___ 18-19 Temblor sandstone__. __. _._____ 20 Temperature___.____._______. 9 Tertiary deposition, San Joaquin Valley__ 18 Tertiary folding and faulting ___.. .. 16 Tertiary marine sediments..__._......... 13Tertiary rocks________._......___ 20,21Topography, Coast Ranges...____....__ 16-17
San Joaquin Valley___-_-_-----_ 11-16Tulare formation, defined.--- ---._------- 23
extent.................................... 22-23lithology-.. ................... ... 24structure...-._._-------_._------ 21-22thickness__....___.....__.__.. 25type locality ------------------------- 23water-bearing properties..
Tulare Lake, relation to area.Page
3
Unconsolidated rocks, geology_ - _ 21-29, pis. 1, 2 U.S. Bureau of Reclamation, funds supplied- 4
Vegetation.
W
Water-bearing properties, geologic units..... - 19-29Water level, Antelope Plain. - ~ ... 44
Antelope Valley. --..- ---------- 42Buena Vista Slough-. 30east of Avenal Gap.---------------_ 37east of Lost Hills.. . 44Kettleman Plain....._.._._____ 34McLure Valley-..------.----------- 37
Weather stations____ _____ ___ 6 Well-numbering system.---------_ _-. 10-11WeUs, Antelope Plain....------------.------ 33
investigated.....-------.--.----------- 31, pi. 3Kettleman Plain.... 33,34quality of water....__.___-----__ 53-60
U.S. GOVERNMENT PRINTING OFFICE: 1959 O-503194


![OT Survey I Kings. English Location of Kings in Canon Hebrew [Historical Books] Joshua Joshua Judges Judges Ruth Ruth Samuel Samuel Kings Kings Chronicles](https://img.dokumen.tips/doc/110x75/56649e155503460f94affa26/ot-survey-i-kings-english-location-of-kings-in-canon-hebrew-historical-books.jpg)