Embed Size (px)
Citation preview
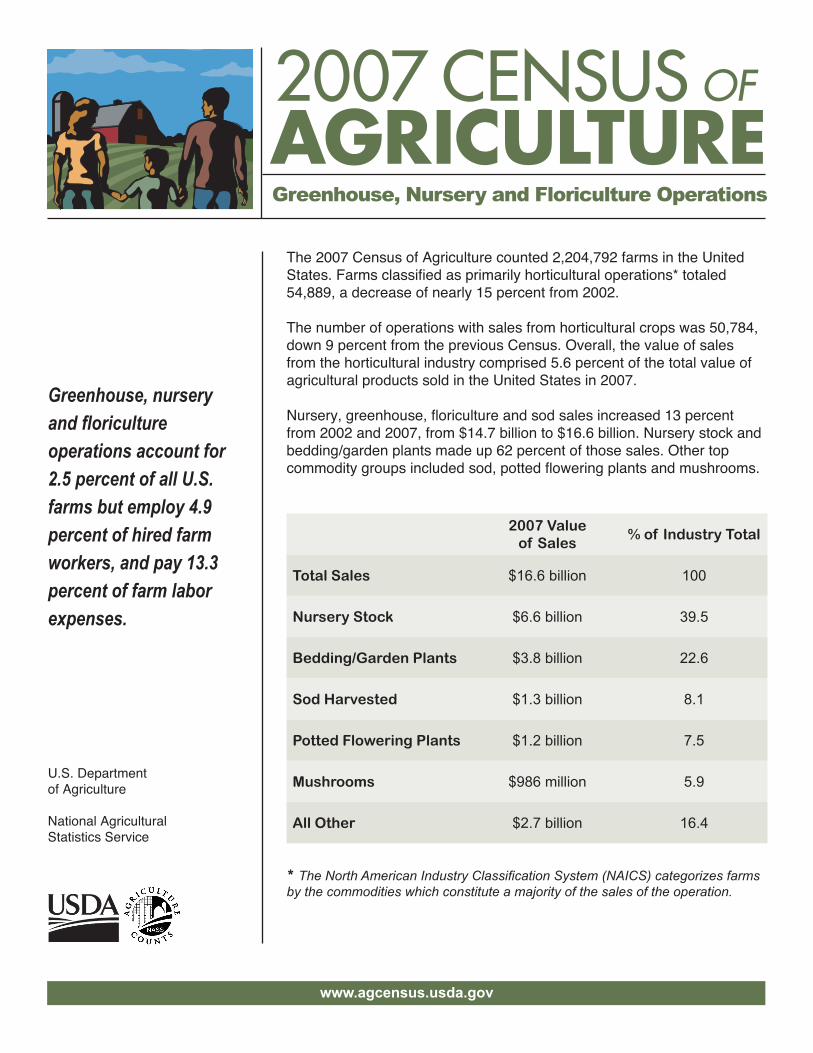
The 2007 Census of Agriculture counted 2,204,792 farms in the United States. Farms classified as primarily horticultural operations* totaled 54,889, a decrease of nearly 15 percent from 2002.
The number of operations with sales from horticultural crops was 50,784, down 9 percent from the previous Census. Overall, the value of sales from the horticultural industry comprised 5.6 percent of the total value of agricultural products sold in the United States in 2007.
Nursery, greenhouse, floriculture and sod sales increased 13 percent from 2002 and 2007, from $14.7 billion to $16.6 billion. Nursery stock and bedding/garden plants made up 62 percent of those sales. Other top commodity groups included sod, potted flowering plants and mushrooms.
2007 Value of Sales
% of Industry Total
Total Sales $16.6 billion 100
Nursery Stock $6.6 billion 39.5
Bedding/Garden Plants $3.8 billion 22.6
Sod Harvested $1.3 billion 8.1
Potted Flowering Plants $1.2 billion 7.5
Mushrooms $986 million 5.9
All Other $2.7 billion 16.4
* The North American Industry Classification System (NAICS) categorizes farms by the commodities which constitute a majority of the sales of the operation.
www.agcensus.usda.gov
Greenhouse, Nursery and Floriculture Operations
Greenhouse, nursery and floriculture operations account for 2.5 percent of all U.S. farms but employ 4.9 percent of hired farm workers, and pay 13.3 percent of farm labor expenses.
U.S. Department of Agriculture
National Agricultural Statistics Service
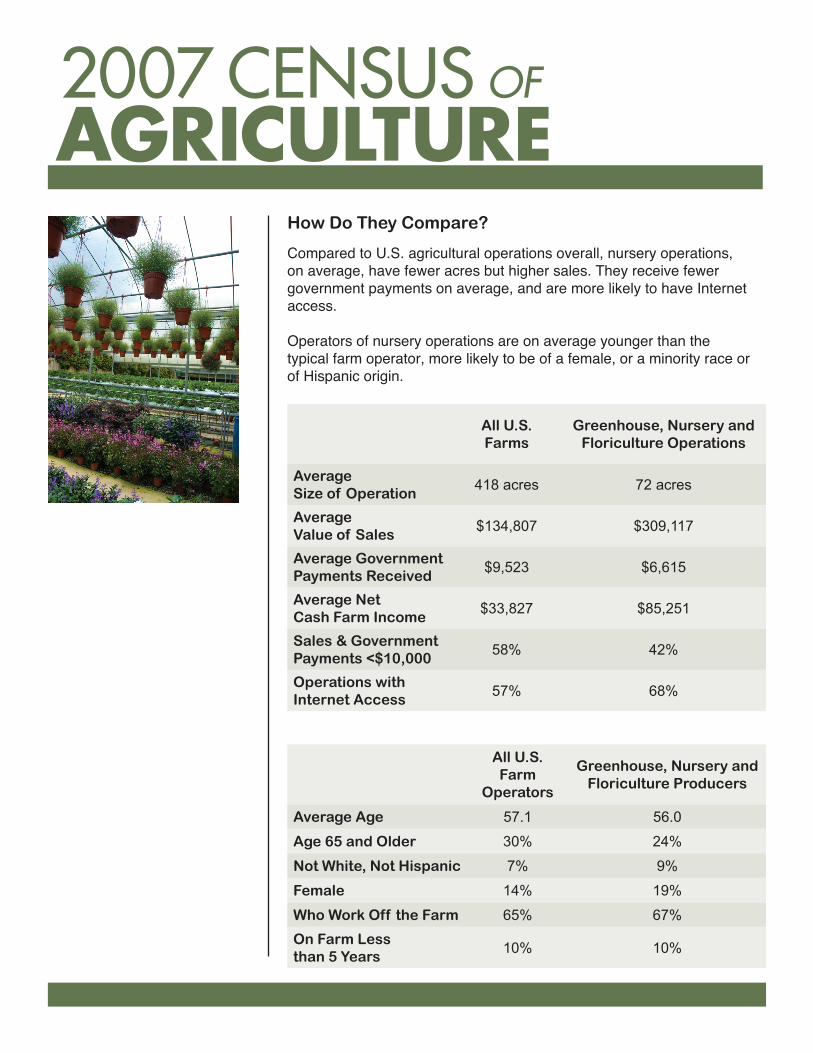
How Do They Compare?
Compared to U.S. agricultural operations overall, nursery operations, on average, have fewer acres but higher sales. They receive fewer government payments on average, and are more likely to have Internet access.
Operators of nursery operations are on average younger than the typical farm operator, more likely to be of a female, or a minority race or of Hispanic origin.
All U.S. Farms
Greenhouse, Nursery and Floriculture Operations
Average Size of Operation
418 acres 72 acres
Average Value of Sales
$134,807 $309,117
Average Government Payments Received
$9,523 $6,615
Average Net Cash Farm Income
$33,827 $85,251
Sales & Government Payments <$10,000
58% 42%
Operations with Internet Access
57% 68%
All U.S. Farm
Operators
Greenhouse, Nursery and Floriculture Producers
Average Age 57.1 56.0
Age 65 and Older 30% 24%
Not White, Not Hispanic 7% 9%
Female 14% 19%
Who Work Off the Farm 65% 67%On Farm Less than 5 Years
10% 10%
Greenhouse, Nursery and Floriculture Operations
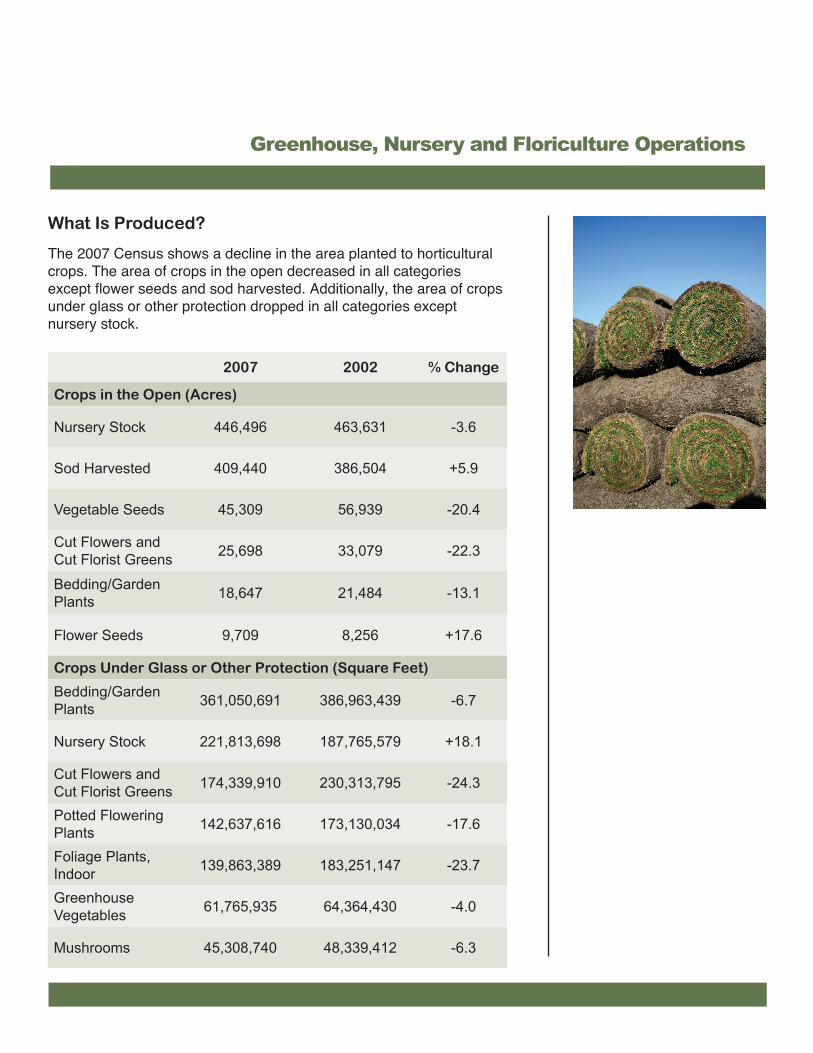
What Is Produced?
The 2007 Census shows a decline in the area planted to horticultural crops. The area of crops in the open decreased in all categories except flower seeds and sod harvested. Additionally, the area of crops under glass or other protection dropped in all categories except nursery stock.
2007 2002 % Change
Crops in the Open (Acres)
Nursery Stock 446,496 463,631 -3.6
Sod Harvested 409,440 386,504 +5.9
Vegetable Seeds 45,309 56,939 -20.4
Cut Flowers and Cut Florist Greens 25,698 33,079 -22.3
Bedding/Garden Plants 18,647 21,484 -13.1
Flower Seeds 9,709 8,256 +17.6
Crops Under Glass or Other Protection (Square Feet)
Bedding/Garden Plants 361,050,691 386,963,439 -6.7
Nursery Stock 221,813,698 187,765,579 +18.1
Cut Flowers and Cut Florist Greens 174,339,910 230,313,795 -24.3
Potted Flowering Plants 142,637,616 173,130,034 -17.6
Foliage Plants, Indoor 139,863,389 183,251,147 -23.7
Greenhouse Vegetables 61,765,935 64,364,430 -4.0
Mushrooms 45,308,740 48,339,412 -6.3
For more information:www.nass.usda.gov
www.agcensus.usda.gov
Agricultural Statistics Hotline(800) 727-9540
www.agcensus.usda.gov
Greenhouse, Nursery and Floriculture Operations
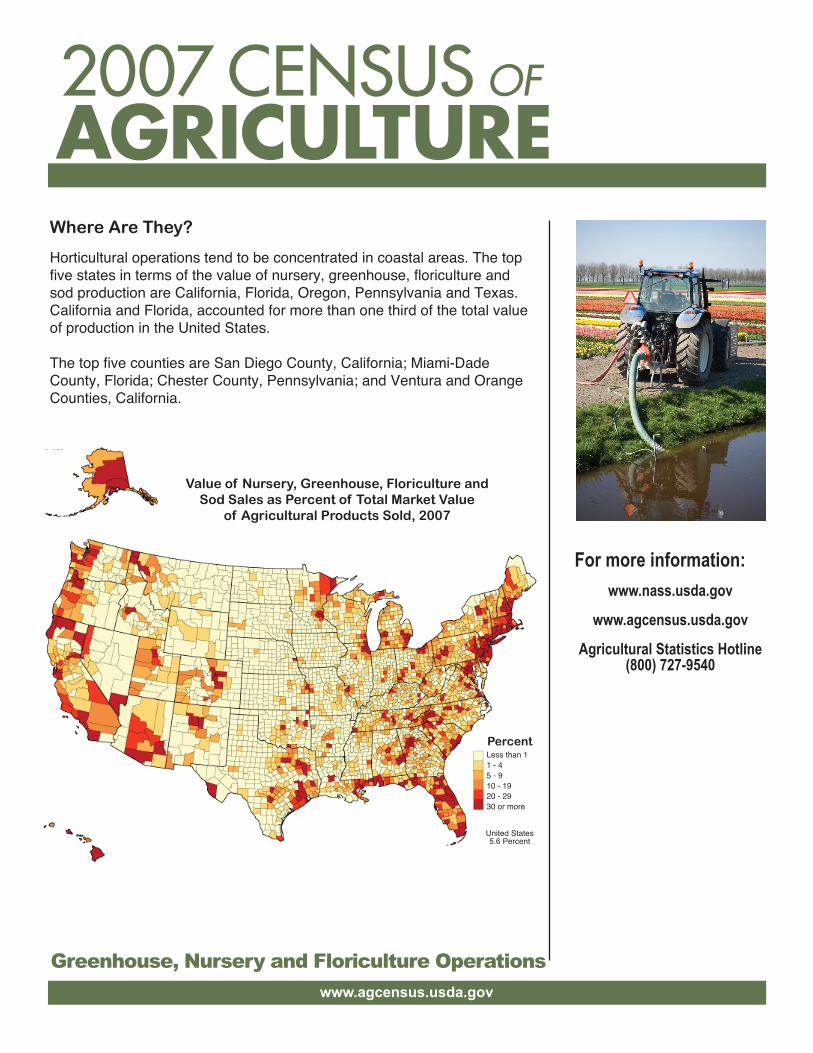
Where Are They?
Horticultural operations tend to be concentrated in coastal areas. The top five states in terms of the value of nursery, greenhouse, floriculture and sod production are California, Florida, Oregon, Pennsylvania and Texas. California and Florida, accounted for more than one third of the total value of production in the United States.
The top five counties are San Diego County, California; Miami-Dade County, Florida; Chester County, Pennsylvania; and Ventura and Orange Counties, California.
Value of Nursery, Greenhouse, Floriculture and Sod Sales as Percent of Total Market Value
of Agricultural Products Sold, 2007
Less than 11 - 45 - 910 - 1920 - 2930 or more
United States 5.6 Percent
Percent