Embed Size (px)
Citation preview

Contents
Appendix 1: Uncertainties in the UK and Devolved Administrations’ GHG Inventory Estimates ...... 5
A1.1 Introduction .............................................................................................................................................................................. 5
A1.2 Uncertainty Estimation Methodology ....................................................................................................................................... 5
A1.3 Trend Uncertainty Analysis ....................................................................................................................................................... 5
A1.4 Uncertainty Analysis Results ..................................................................................................................................................... 6
A1.5 Uncertainty Model Improvements ............................................................................................................................................ 7
Appendix 2: Devolved Administrations’ GHG Inventory Compilation Methods and Data Sources ... 8
A2.1 Introduction .............................................................................................................................................................................. 8
A2.2 Reporting Format ...................................................................................................................................................................... 8
A2.3 General Approach ..................................................................................................................................................................... 8
A2.3.1 Summary of Abbreviations ...................................................................................................................................................... 10
A2.4 Energy Industries ..................................................................................................................................................................... 11
A2.4.1 Electricity Production .............................................................................................................................................................. 11
A2.4.2 Petroleum Refining .................................................................................................................................................................. 14
A2.4.3 Manufacture of Solid Fuels ...................................................................................................................................................... 14
A2.4.4 Other Energy Industries........................................................................................................................................................... 14
A2.5 Manufacturing Industries and Construction............................................................................................................................ 15
A2.5.1 Iron and Steel .......................................................................................................................................................................... 15
A2.5.2 Other Industry ......................................................................................................................................................................... 15
A2.6 Transport ................................................................................................................................................................................. 19
A2.6.1 Aviation ................................................................................................................................................................................... 19
A2.6.2 Navigation ............................................................................................................................................................................... 19
A2.6.3 Road Transport ........................................................................................................................................................................ 20
A2.6.4 Railways ................................................................................................................................................................................... 27
A2.7 Other Sectors........................................................................................................................................................................... 28
A2.7.1 Commercial & Institutional ..................................................................................................................................................... 28
A2.7.2 Residential ............................................................................................................................................................................... 31
A2.7.3 Agriculture, Forestry & Fisheries ............................................................................................................................................. 31
A2.7.4 Military .................................................................................................................................................................................... 32
Greenhouse Gas Inventories for England, Scotland, Wales and Northern Ireland: 1990-2014 ii
A2.8 Fugitive Emissions from Fuels ................................................................................................................................................. 32
A2.8.1 Coal Mining ............................................................................................................................................................................. 32
A2.8.2 Solid Fuel Transformation ....................................................................................................................................................... 32
A2.8.3 Oil and Natural Gas ................................................................................................................................................................. 32
A2.9 Industrial Processes ................................................................................................................................................................. 34
A2.9.1 Minerals Industries .................................................................................................................................................................. 34
A2.9.2 Chemical Production ............................................................................................................................................................... 34
A2.9.3 Metal Production .................................................................................................................................................................... 37
A2.9.4 Use of Halocarbons and Sulphur Hexafluoride ........................................................................................................................ 37
A2.10 Agriculture .......................................................................................................................................................................... 38
A2.10.1 Agricultural Soils ...................................................................................................................................................................... 38
A2.10.2 Livestock Enteric Fermentation and Manure Management .................................................................................................... 39
A2.10.3 Reasons for changes ................................................................................................................................................................ 41
A2.10.4 Planned improvements to the inventory ................................................................................................................................ 41
A2.11 Land Use, Land Use Change & Forestry (LULUCF) ............................................................................................................... 42
A2.12 Waste .................................................................................................................................................................................. 42
A2.12.1 Solid Waste Disposal on Land .................................................................................................................................................. 42
A2.12.2 Biological Treatment of Solid Waste ....................................................................................................................................... 43
A2.12.3 Waste Water Handling ............................................................................................................................................................ 44
A2.12.4 Waste Incineration .................................................................................................................................................................. 44
Appendix 3: Methods Used for Calculating End User Emissions .................................................... 45
A3.1 Introduction ............................................................................................................................................................................ 45
A3.2 End User Methodology ............................................................................................................................................................ 45
A3.3 Revisions to End User Inventory Data and Methodology ........................................................................................................ 47
A3.3.1 End User Analysis by National Communication Sector............................................................................................................ 47
A3.3.1 Summary of End User Data for Wales “Electricity Only” Emissions ........................................................................................ 48
Appendix 4: Emissions Analysis and Methods used for Devolved Administrations’ Traded and Non-
Traded Emissions .............................................................................................................................. 49
A4.1 Background ............................................................................................................................................................................. 49
A4.1.1 UK Context: The Greenhouse Gas Effort Sharing Decision ...................................................................................................... 49
A4.1.2 Non-Traded Emissions in the UK ............................................................................................................................................. 49
A4.2 Data Quality and Reporting Format Issues .............................................................................................................................. 50

Greenhouse Gas Inventories for England, Scotland, Wales and Northern Ireland: 1990-2014 iii
A4.2.1 Devolved Administrations’ Traded and Non-Traded GHG Emission Estimates (2008-2014) ................................................... 51
A4.2.2 Analysis of Emissions 2008-2014 ............................................................................................................................................. 52
Appendix 5: Mapping between Source Name, IPCC Category and National Communication ......... 54
Appendix 6: Recalculations between the previous and this current Devolved Administrations’ GHG
Inventory 59
A6.1 Introduction ............................................................................................................................................................................ 59
A6.2 Revisions and Updates to the Greenhouse Gas Inventories.................................................................................................... 59
Appendix 7: Supporting Data Tables and Graphs ......................................................................... 62
Appendix 8: Emissions and Removals of Greenhouse Gases from Land Use, Land Use Change and
Forestry (LULUCF) for England, Scotland, Wales and Northern Ireland: 1990-2014 ............................. 67
A8.1 Introduction ............................................................................................................................................................................ 67
A8.1.1 National Reporting .................................................................................................................................................................. 67
A8.1.2 UK Administration Reporting .................................................................................................................................................. 67
A8.1.3 The LULUCF sector................................................................................................................................................................... 68
A8.1.4 Changes to LULUCF Sector since the 1990-2013 inventory ..................................................................................................... 69
A8.2 LULUCF Emissions and Removals in England ........................................................................................................................... 70
A8.2.1 England LULUCF Trends ........................................................................................................................................................... 70
A8.2.2 England LULUCF Category Trends ........................................................................................................................................... 70
A8.2.3 England LULUCF comparison with 2013 inventory .................................................................................................................. 74
A8.3 LULUCF Emissions and Removals in Scotland .......................................................................................................................... 79
A8.3.1 Scotland LULUCF Trends .......................................................................................................................................................... 79
A8.3.2 Scotland LULUCF Category Trends .......................................................................................................................................... 80
A8.3.3 Scotland LULUCF comparison with 2013 inventory ................................................................................................................. 83
A8.4 LULUCF Emissions and Removals in Wales .............................................................................................................................. 87
A8.4.1 Wales LULUCF Trends .............................................................................................................................................................. 87
A8.4.2 Wales LULUCF Category Trends .............................................................................................................................................. 87
A8.4.3 Wales LULUCF comparison with 2013 inventory ..................................................................................................................... 92
A8.5 LULUCF Emissions and Removals in Northern Ireland ............................................................................................................. 96
A8.5.1 Northern Ireland LULUCF Trends ............................................................................................................................................ 96
A8.5.2 Northern Ireland LULUCF Category Trends ............................................................................................................................. 97
A8.5.3 Northern Ireland LULUCF comparison with 2013 inventory ................................................................................................. 101

Greenhouse Gas Inventories for England, Scotland, Wales and Northern Ireland: 1990-2014 iv
A8.6 LULUCF Summary Tables ....................................................................................................................................................... 105
A8.6.1 England (all units in kilotonnes of respective gases) ............................................................................................................. 105
A8.6.2 Scotland (all units in kilotonnes of respective gases) ............................................................................................................ 106
A8.6.3 Wales (all units in kilotonnes of respective gases) ................................................................................................................ 107
A8.6.4 Northern Ireland (all units in kilotonnes of respective gases) ............................................................................................... 108
A8.6.5 United Kingdom (all units in kilotonnes of respective gases) ................................................................................................ 109
A8.7 Kyoto Protocol LULUCF Summary Tables .............................................................................................................................. 110
A8.7.1 England .................................................................................................................................................................................. 111
A8.7.2 Scotland ................................................................................................................................................................................. 112
A8.7.3 Wales ..................................................................................................................................................................................... 113
A8.7.4 Northern Ireland.................................................................................................................................................................... 114
A8.7.5 United Kingdom ..................................................................................................................................................................... 115
A8.8 Data sources .......................................................................................................................................................................... 116
Appendix 9: Aviation Data in the EU ETS .................................................................................... 118
References ..................................................................................................................................... 120

Appendix 1: Uncertainties in the UK and Devolved Administrations’ GHG Inventory Estimates
Greenhouse Gas Inventories for England, Scotland, Wales and Northern Ireland: 1990-2014 5
Appendix 1: Uncertainties in the UK and Devolved Administrations’ GHG
Inventory Estimates
A1.1 Introduction The uncertainties in the UK Inventory are estimated using a Monte Carlo simulation. The UK National Inventory Report (NIR) (Brown, et al.,
2016) describes this approach in detail. The method involves estimating the uncertainties in the activity data and the emission factors for
all the emission source categories and then using a Monte Carlo simulation package to calculate the uncertainty in the emission totals.
In order to apply a similar approach to the Devolved Administrations’ (DA) greenhouse gas (GHG) inventories, it is necessary to estimate
uncertainties for the Devolved Administrations (DA) activity data (i.e. fuel consumption, production data). The same emission factors are
used in the DA inventories as in the UK Inventory, so it is assumed that the emission factor uncertainties are the same as for the UK.
In the UK Inventory uncertainties in the activity data are estimated on the basis of expert judgement. Making similar expert judgments for
each DA would be a time-consuming activity and would be prone to inconsistencies with the UK uncertainties. Moreover, for some sources,
no direct activity data is available at all, and it has been necessary to distribute the UK data using surrogate data (e.g. employment
statistics). In such cases, it is impossible to say whether the surrogate statistics are an accurate indicator. The uncertainties for activity in
the individual DAs when expressed as a percentage should be higher than that of the total UK uncertainty. This is due to a statistical
principle where, if the elements of a group have any independence from one another and are positive, the uncertainty of the sum of a
group is less than the sum of the uncertainties of each element in the group.
A1.2 Uncertainty Estimation Methodology The uncertainties in the DA GHG inventories are also estimated using a Monte Carlo simulation. For simplicity and consistency, the source
categories used are the same as those used in the UK GHG Inventory simulation. For each of these source categories, activity uncertainties
are derived for England, Scotland, Wales, Northern Ireland, and Unallocated based on the uncertainty for the UK total and the relative
contributions to emissions from each of the DAs for this source category using the following equation:
𝑈𝐴𝑖 = 𝑈𝐴𝑤𝑖
∑ |𝐸𝑖|𝑖
√∑ 𝑤𝑖2𝐸𝑖
2𝑖
Where 𝑈𝐴 is the uncertainty in the UK activity,
𝑖 is the DA,
𝑈𝐴𝑖 is the uncertainty in activity for DA 𝑖,
𝑤𝑖 is a weighting factor for DA 𝑖 representing the relative uncertainty in the activity,
𝐸𝑖 is the emission for each of the DA 𝑖.
When independence is assumed between the DAs’ activity estimates then this equation ensures that the sum of the DAs uncertainty is
consistent with the UK uncertainty. For the simplest case of 𝑤𝑖 = 1 for all 𝑖 this equation gives the DAs the same % uncertainty each, but
opting to use a weighting function attributes higher % uncertainties for small contributors and lower uncertainties to large contributors
using the following equation:
𝑤𝑖 =1
√𝐸𝑖4
For some key sources the calculated uncertainty was overwritten with expert judgement.
A1.3 Trend Uncertainty Analysis In order to estimate the uncertainty on the trend, it was necessary to make an estimate of the uncertainty in the base year (1990 for
carbon dioxide, methane and nitrous oxide, and 1995 for the F-gases). This estimate is made for the UK Inventory, as part of the analysis
presented in the National Inventory Report. Therefore, it was possible to make the DA uncertainty estimates using the method described
above in conjunction with the UK estimates for the base year.
In addition to the estimation of the uncertainty in each year, it was also necessary to consider correlations between sources across years.
Similar to the UK assessment of uncertainties emission factors are assumed to be correlated between years and activity data is
uncorrelated between years.

Appendix 1: Uncertainties in the UK and Devolved Administrations’ GHG Inventory Estimates
Greenhouse Gas Inventories for England, Scotland, Wales and Northern Ireland: 1990-2014 6
A1.4 Uncertainty Analysis Results As UK emissions are the sum of the DAs’ emissions, the estimates for the individual DAs will be more uncertain than for the UK total. The
DA uncertainties are estimated independently of the UK inventory uncertainties and there are subtle differences in the calculations and
assumptions made between these models, additionally any two runs of a Monte Carlo analysis will always give slightly different results (the
difference reducing with more iterations). This means that the uncertainties calculated for the UK in the DA inventory will be slightly
different than that for the UK in the UK inventory. Overall data quality and sector allocations are improving, but for some source sectors,
significant uncertainties remain, even at UK level.
The uncertainty estimates for the 1990-2014 DA GHG inventories are reported in Table A1. 1 below. The table presents the central
estimate from the Monte Carlo simulation for each GHG and for each DA, for the base year and the latest year and the estimated
uncertainty on the total. In addition, the central estimate of the trend (expressed as the percentage change from the base year) is
presented together with the 2.5 and 97.5 percentile estimates.
Table A1. 1: Estimated Uncertainties1 in the DA GHG Inventories: Base Years, 2014 and Trend
Base Year2 Latest Year (2014) Trend (Base Year to 2014)
Gas (kt CO2e) Central Estimate3
Uncertainty Introduced on total
Central Estimate
Uncertainty Introduced on total
Central Estimate3
2.5 Percentile
97.5 Percentile
England
Carbon Dioxide CO2 468,171 2% 324,949 2% -31% -32% -29%
Methane CH4 101,679 24% 35,132 16% -65% -87% -46%
Nitrous Oxide N2O 40,478 52% 14,949 41% -63% -129% -25%
HFC 18,855 9% 13,899 12% -26% -39% -13%
PFC 308 20% 129 26% -58% -82% -36%
SF6 1,140 4% 404 6% -65% -69% -60%
NF3 0 76% 0 91% -68% -166% -1%
Total 630,632 5% 389,462 3% -38% -44% -34%
Scotland
Carbon Dioxide CO2 52,596 9% 32,150 12% -39% -44% -35%
Methane CH4 17,729 32% 7,517 19% -58% -90% -32%
Nitrous Oxide N2O 4,148 30% 3,262 37% -21% -62% 18%
HFC 127 21% 1,327 29% 945% 646% 1254% PFC 116 46% 142 40% 23% -43% 92% SF6 36 25% 31 25% -14% -47% 20%
NF3 0 59% 0 55% -44% -118% 15% Total 74,751 10% 44,429 10% -41% -49% -33%
Wales
Carbon Dioxide CO2 43,778 5% 38,559 3% -12% -17% -8%
Methane CH4 10,191 27% 5,396 16% -47% -79% -26%
Nitrous Oxide N2O 2,203 31% 1,760 45% -20% -64% 22%
HFC 65 29% 656 40% 905% 582% 1375% PFC 172 28% 7 205% -96% -124% -67% SF6 83 14% 28 20% -66% -82% -50%
NF3 0 262% 0 206% -20% -377% 230% Total 56,493 6% 46,406 3% -18% -25% -12%
Northern Ireland
Carbon Dioxide CO2 16,561 9% 13,828 8% -17% -25% -9%
Methane CH4 5,630 31% 4,346 17% -23% -61% 3%
Nitrous Oxide N2O 2,363 34% 1,737 39% -26% -71% 14%
HFC 38 38% 411 52% 972% 539% 1650% PFC 1 555% - 0% -100% -610% -3% SF6 5 73% 5 66% 2% -100% 102%
N/ANF3 - 0% - 0% N/A N/A N/A Total 24,598 10% 20,327 7% -17% -29% -8%
Unallocated
Carbon Dioxide CO2 11,894 5% 12,701 3% 7% 0% 12%
Methane CH4 1,928 15% 1,090 17% -43% -51% -36%
Nitrous oxide N2O 249 89% 235 89% -5% -13% -2%
HFC - 0% - 0% N/A N/A N/A PFC - 0% - 0% N/A N/A N/A

Appendix 1: Uncertainties in the UK and Devolved Administrations’ GHG Inventory Estimates
Greenhouse Gas Inventories for England, Scotland, Wales and Northern Ireland: 1990-2014 7
Base Year2 Latest Year (2014) Trend (Base Year to 2014)
Gas (kt CO2e) Central Estimate3
Uncertainty Introduced on total
Central Estimate
Uncertainty Introduced on total
Central Estimate3
2.5 Percentile
97.5 Percentile
SF6 - 0% - 0% N/A N/A N/A
NF3 - 0% - 0% N/A N/A N/A Total 14,070 5% 14,026 3% 0% -6% 5%
UK
Carbon Dioxide CO2 593,000 2% 422,187 2% -29% -30% -27%
Methane CH4 137,157 23% 53,481 13% -61% -81% -43%
Nitrous Oxide N2O 49,441 44% 21,944 29% -56% -110% -24%
HFC 19,085 9% 16,292 11% -15% -28% -1% PFC 597 16% 278 24% -53% -74% -34% SF6 1,264 4% 468 5% -63% -67% -59%
NF3 1 46% 0 46% -52% -107% -6% Total 800,545 5% 514,651 3% -36% -40% -32%
Notes:
1) Uncertainty is defined as 1.96(standard deviation)/mean %, which closely approximates the 95% confidence interval.
2) Base years are 1990 for carbon dioxide (CO2), methane (CH4) and nitrous oxide (N2O); 1995 for NF3, HFCs, PFCs and SF6.
3) The uncertainty model takes emission estimates by gas for each source, applies an uncertainty distribution for that source and calculates a
statistical mean, presented above as the central estimate. The emissions data in this table are taken from the Monte Carlo model output. The
central estimates by gas for the base year and the latest inventory year are very similar but not identical to the emission estimates in the DA
inventories.
4) Where the central estimate says ‘0’ this does not mean that there are no emissions, but that emissions are rounded to 0. ‘-‘ is used to represent
no emissions.
A1.5 Uncertainty Model Improvements This year the approach to uncertainties that was adopted was developed for a project for Scottish Government. A report, ‘Development of
the Uncertainty Analysis of the Scottish GHG Inventory’ (Brown & Abbott, 2015) was prepared that explains the reasons for the different
approach, comparisons to the previous approach and scenarios that explored sensitivities and functionalities.
The most significant difference between the approaches is that the previous approach generally applied an additional ‘disaggregation’
uncertainty to the UK uncertainty to sources which were disaggregated using a proxy data source (e.g. population), which was determined
with expert judgement. The UK total uncertainty was calculated independently, and consistency between the UK and DAs was maintained
by deriving the England uncertainty distribution as the UK minus the other DAs. The approach used this year determines how much
additional uncertainty is required to maintain consistency with the total UK uncertainty and applies more to small contributors to total
emissions than to larger contributors. This approach treats all DAs in the same way and reduces the requirement for expert judgement (but
where it is thought appropriate expert judgement can still be used.

Appendix 2: Devolved Administrations’ GHG Inventory Compilation Methods and Data Sources
Greenhouse Gas Inventories for England, Scotland, Wales and Northern Ireland: 1990-2014 8
Appendix 2: Devolved Administrations’ GHG Inventory Compilation
Methods and Data Sources
This appendix describes the methodology used to derive the by source Devolved Administrations’ (DA) greenhouse gas (GHG) emission
estimates for each source.
A2.1 Introduction The UK Greenhouse Gas Inventory compiles national estimates of greenhouse gas emissions for submission to the UN Framework
Convention on Climate Change under the requirements of the Kyoto Protocol. The most recent version of the inventory, published in April
2016, presents UK greenhouse gas emission estimates for the period 1990 to 2014 (Brown, et al., 2016).
This report presents separate inventories of greenhouse gas emissions for England, Scotland, Wales and Northern Ireland for the years
1990, 1995 and 1998 to 2014 that are consistent with the 1990 to 2014 UK Greenhouse Gas Inventory.
The seven direct greenhouse gases are considered:
Carbon dioxide (CO2);
Methane (CH4);
Nitrous oxide (N2O);
Hydrofluorocarbons (HFCs);
Perfluorocarbons (PFCs);
Sulphur hexafluoride (SF6); and
Nitrogen trifluoride (NF3)
By source inventories allocate GHG emissions in the country that they are emitted, regardless of the end use of any fuel output or product
that creates the demand for the emitting activity. The by source estimates for each DA include emissions from fuel combustion (Energy),
industrial processes, agricultural practices (Agriculture), Land Use, Land Use Change and Forestry (LULUCF) and waste disposal (Waste).
National totals for DAs exclude emissions from international aviation and shipping (which are presented as memo items) and of carbon
dioxide from the burning of biofuels (which are considered to be renewable fuels from recently sequestered carbon). In addition, emissions
of GHGs from offshore oil and gas exploration and production are classified within this report as “Unallocated” emissions and are not
attributed to any of the DAs.
A2.2 Reporting Format The DA GHG inventories are presented in National Communication reporting format, in order that emissions align with policy analysis
requirements of the DA Governments. Within the discussion of inventory compilation methodology, source data and trends, the IPCC
sector nomenclature is used, as this enables information to be presented at a much greater level of detail, aligned with specific emission
sources. The mapping between National Communication and IPCC sector format reporting is summarised in the table in Appendix 5.
The UK Inventory also reports emissions from international marine and aviation bunkers separately, as memo items to the main UK
inventory dataset, in line with the reporting requirements of the United Nations Framework Convention on Climate Change (UNFCCC). DA
emission estimates for these international transport sources are not included within the DA totals in this report, but are available within
the supporting spreadsheet tables; the estimation methodology is described in the Transport section of this Appendix.
A2.3 General Approach The UK Inventory is based on UK statistics for activities producing greenhouse gas emissions. These include fuel consumption, industrial
production, agriculture, land use change and forestry and waste. In principle, it would be ideal to obtain a complete set of equivalent
statistics for each constituent country to compile each inventory.
Such a set of statistics is not available for all sources and for all constituent countries and hence it is necessary to disaggregate UK
emissions into the four constituent countries by an estimation procedure.
For most sources in the UK Inventory, the emission of a pollutant from a source is calculated from the general equation:
E Ae [Equation 1] where E = Emission of pollutant (tonnes) A = Activity (unit activity) e = Emission Factor (tonnes pollutant/unit activity)

Appendix 2: Devolved Administrations’ GHG Inventory Compilation Methods and Data Sources
Greenhouse Gas Inventories for England, Scotland, Wales and Northern Ireland: 1990-2014 9
The activity unit may be fuel combustion (tonnes), or production of product (tonnes) or numbers of animals. A modified equation is used in
the compilation of the Devolved Administration GHG inventories:
5
1j
j
ii
d
AedE [Equation 2]
where Ei = Emission (in tonnes) from either England (1),Scotland (2), Wales (3), Northern Ireland (4) or “Unallocated” (5) di = A driver representing the contribution of the region to UK emissions i = 1, 2, 3, 4, 5
The driver, di can be any one of:
1. The value of the activity data for the region. [For example, consumption of specific fuels or industrial production figures for the region.];
2. The fraction of the UK activity in the region; 3. The value of a surrogate activity data statistic in the region. Where the required activity is unavailable on a regional basis, a
surrogate value may be used. [For example, employment statistics or manufacturing output of a specific product, used as a surrogate for consumption data of a given fuel.]; and
4. In cases where the emissions are derived from a complex model, the driver will be the actual emission for the region calculated from the model.
The modified equation [2] ensures that the sum of the emissions from England, Scotland, Wales and Northern Ireland, plus any
“unallocated” (i.e. offshore) emissions, equals the total UK emission reported within the national inventory.
Where the driver is fuel consumption, then the sum of the drivers should add up to the UK consumption. However, in practice this may not
be the case if the data are taken from different sources or may be based on the financial rather than the calendar year. The estimation
procedure removes such discrepancies.
Thus the compilation of the greenhouse gas inventories for the constituent countries of the UK reduces to the estimation of a set of
drivers, each appropriate to emissions from a specific source. In compiling the 1990-2014 inventories, over 230 drivers have been
calculated.
Subsequent sections discuss the estimation of the drivers for each source category. Most of the detailed discussion is concentrated on the
more complex categories, whilst simpler sources are summarised in Table A2. 1 to A2. 14. The IPCC classification is used throughout (IPCC,
2006), and the following section provides a description of the abbreviations used throughout the Appendix 2 discussion.

Appendix 2: Devolved Administrations’ GHG Inventory Compilation Methods and Data Sources
Greenhouse Gas Inventories for England, Scotland, Wales and Northern Ireland: 1990-2014 10
A2.3.1 Summary of Abbreviations
BCA British Cement Association
BERR Department for Business Enterprise & Regulatory Reform
BGlass British Glass
CA Coal Authority
CAA Civil Aviation Authority
DAs Devolved Administrations
DARD Department of Agriculture and Rural Development (Northern Ireland)
DTI Department of Trade and Industry (now DECC)
DfT Department for Transport
DECC Department for Energy and Climate Change
Defra Department for Environment, Food and Rural Affairs
DETI Department of Enterprise, Trade and Investment (Northern Ireland)
DETR Department of Environment, Transport & the Regions
DFPNI Department of Finance and Personnel, Northern Ireland
DLTR Department for Local Government, Transport and the Regions
E England
EA The Environment Agency of England & Wales
EAF Electric Arc Furnace
EM Enviros March
EPER European Pollutant Emissions Register
EU ETS EU Emission Trading Scheme
IPCC Intergovernmental Panel on Climate Change
ISR Inventory of Statutory Releases (NI DoE)
ISSB Iron and Steel Statistics Bureau
LPG Liquefied petroleum gas
LRC London Research Centre
MAFF Ministry of Agriculture, Fisheries and Food (now Defra)
MPA Mineral Products Association
MSW Municipal Solid Waste
NA Not Available
NAEI National Atmospheric Emissions Inventory
NI DoE Northern Ireland Department of Environment
NIEA Northern Ireland Environment Agency
NIO Northern Ireland Office
NO Not occurring
OFMDFM Office of the First Minister and the Deputy First Minister (Northern Ireland)
ONS Office for National Statistics
OPG Other petroleum gas
PI Pollution Inventory of the Environment Agency of England & Wales
S Scotland
SEPA The Scottish Environment Protection Agency
SPRI Scottish Pollution Release Inventory
SSF Solid smokeless fuel
UKOOA UK Offshore Operators Association, now called “Oil & Gas UK”
UKPIA United Kingdom Petroleum Industry Association
WO Welsh Office
WS Welsh Statistics

Appendix 2: Devolved Administrations’ GHG Inventory Compilation Methods and Data Sources
Greenhouse Gas Inventories for England, Scotland, Wales and Northern Ireland: 1990-2014 11
A2.4 Energy Industries The drivers used for the energy industries are summarised in Table A2. 2. This shows the base sources used in the National Atmospheric
Emissions Inventory (NAEI) database, which correspond to the IPCC sources. The activity data used in the UK Inventory are shown together
with the drivers used in the inventories for the constituent countries for 1990, 1995 and 1998 to 2014. The derivation of drivers sometimes
differs between years depending on data availability.
A2.4.1 Electricity Production
Emissions are based on fuel consumption data provided by the major power generators in Great Britain and the Northern Ireland Office for
1990 to 1999: Scottish Power (2004), Scottish and Southern Energy (2004), Innogy (2004), (BCA, 2004) PowerTech (2004), AES Drax (2004).
From 2000 onwards, emissions data from the Pollution Inventory (EA, 2015a), the Scottish Pollution Release Inventory (SEPA, 2015a) and
the Northern Ireland Pollution Inventory (NIEA, 2015a) has been used to estimate DA emissions. For emissions in 2005 onwards, fuel use
and emissions data reported within the EU ETS (EA, 2015b; SEPA, 2015b; NIEA, 2015b) have been used to revise and update the annual fuel
emission factors that are applied within the UK GHGI, and the DA GHGI. The emissions data reported via the EU ETS are used to estimate
DA share of UK emissions, whilst maintaining the emission totals consistent with the UK GHGI data. Country-specific electricity generation
data (DECC, 2015b) are then used as a comparator against reported emissions, as a quality check for the power station emissions data.
Emissions from plant generating electricity from municipal solid waste combustion are less certain for pre-1999, but all the plant are known
to be in England for 1990-98 and so the emissions will correspond to the UK emissions. Since 1999, two plants have been commissioned in
Scotland, at Lerwick and Dundee and emissions estimations are based on emissions data reported to SEPA.
A small number of plants generate heat rather than electricity. Some of these generating plants burn poultry litter, or meat and bone meal,
and these are all located in England. The distribution of landfill gas and sewage gas generation is assumed to correspond to the distribution
of landfill sites and sewage treatment plant.

Appendix 2: Devolved Administrations’ GHG Inventory Compilation Methods and Data Sources
Greenhouse Gas Inventories for England, Scotland, Wales and Northern Ireland: 1990-2014 12
Table A2. 1: Energy Industries (Base Year – 1990)
IPCC Category NAEI Sources Activity: Fuel Consumption Data used for deriving DA estimates from UK totals / Comments
Electricity Production Power Stations Coal, oil, natural gas Consumption data from Power Generators
Unrefined natural gas NO
Sewage gas Sewage methane recovered
Landfill gas As landfill methane
Orimulsion, MSW, poultry litter and tyres All plant in England
Petroleum Refining Refineries All fuels UKPIA CO2 emission estimates for pre-1997
Manufacture of Solid Fuels
Coke Production Colliery Methane All such plant assumed to be in England
Coke Oven gas, natural gas Coal feed to coke ovens, ISSB, WS, DTI
Coke Coke breeze consumption, ISSB
Blast Furnace gas Coke consumed in blast furnaces, ISSB
SSF Production All fuels Coal feed to SSF plant, DTI, WS
Other Energy Industries
Collieries All other fuels Deep mined coal production, data from British Coal Authority
Coke oven gas All such plant assumed to be in England
Gas Production Colliery methane Deep mined coal production, data from British Coal Authority
LPG and Natural gas DA share of aggregate data from EU ETS installations for natural gas use from 2005
Upstream oil and gas / Gas Separation Plant
Unrefined natural gas, LPG, OPG Estimates for terminals extrapolated from operator estimates within EEMS data in 1998
Nuclear Natural gas All plant in England

Appendix 2: Devolved Administrations’ GHG Inventory Compilation Methods and Data Sources
Greenhouse Gas Inventories for England, Scotland, Wales and Northern Ireland: 1990-2014 13
Table A2. 2: Energy Industries (1995; 1998 to 2014)
IPCC Category NAEI Sources Activity: Fuel Consumption Data used for deriving DA estimates from UK totals / Comments
Electricity Production Power Stations
Coal, oil, natural gas Emissions data and fuel consumption data from Power Generators; PI, EPER & NIPI data from 2000 onwards; EU ETS data from 2005 onwards.
Unrefined natural gas Some power facilities have used this fuel since 1995. Data provided by plant operators.
Sewage gas Sewage methane recovered
Landfill gas As landfill methane
Orimulsion, MSW, poultry litter From 1999, some MSW plant now also in Scotland.
Petroleum Refining Refineries All fuels UKPIA CO2 emission estimates for pre-1997. Pollution Inventory CO2 emission estimates for 1998. UKPIA data for 1999 onwards. EU ETS data from 2008 onwards. Deviations from DUKES fuel use allocations have been made for petroleum coke and Other Petroleum Gases (OPG), using EU ETS activity data instead.
Manufacture of Solid Fuels
Coke Production
Colliery Methane All such plant assumed to be in England.
Coke oven gas Coal feed to coke ovens, ISSB, WS, DTI and (since 1999) PI data. 2005 onwards: EU ETS, CCA and PI data analysis
Natural gas Coal feed to coke ovens, ISSB, WS, DTI and (since 1999) PI data
Coke Coke breeze consumption, ISSB.
Blast Furnace gas Coke Consumed in Blast Furnaces, ISSB. 2005 onwards: EU ETS, CCA and PI data analysis
SSF Production All fuels Coal feed to SSF plant, DECC, WS.
Other Energy Industries
Collieries All other fuels Deep mined coal production, data from British Coal Authority.
Coke oven gas (1995 – current) No such plant operating.
Gas Production
Colliery methane Deep mined coal production, data from British Coal Authority.
LPG and Natural gas EU ETS installation data for natural gas use from 2005 onwards. All other years estimated based on the aggregate DA share from the 2005 EU ETS data.
Upstream oil and gas Unrefined natural gas, LPG, OPG (1995 – current) Oil & Gas UK EEMS CO2 estimates for terminals, DECC activity data. EU ETS data for terminals.
Nuclear Natural gas (1995 – current) Data not available.

Appendix 2: Devolved Administrations’ GHG Inventory Compilation Methods and Data Sources
Greenhouse Gas Inventories for England, Scotland, Wales and Northern Ireland: 1990-2014 14
A2.4.2 Petroleum Refining
UKPIA have provided a site-by-site breakdown of UK refining emissions for 1997 and 1999 – 2014 (UKPIA, 2015), presenting the emissions
of a range of pollutants from combustion, process and fugitive sources. In addition, UKPIA have advised that refinery throughput did not
vary significantly between 1990 and 1997. The EU ETS data also provides (from 2008 onwards) a comprehensive scope of refinery
emissions broken down by process and fuel, and these data are used to derive emission factors for fuel oil, natural gas and other
petroleum gases (OPG) use in refineries within the UK and DA GHG inventories.
In the 1990-2014 GHG inventory, the activity data reported in the EU ETS (EA, 2015a) for petroleum coke and other petroleum gases (OPG)
use in refineries has been used in preference to activity data reported in DUKES. Emissions for 1998 are based on carbon dioxide emissions
reported in the Pollution Inventory (EA, 2000).
A2.4.3 Manufacture of Solid Fuels
This category comprises the production of coke and solid smokeless fuel (SSF). Country-specific data on coke ovens in the iron and steel
industry are reported in detail by ISSB (2015), and emissions data for integrated steel works are reported via the PI and EU ETS (EA, 2015b).
Three coke ovens in England and Wales are not attached to an integrated iron and steel facility, and the consumption of coal by these
ovens is estimated from WO (1998) and UK data (DECC, 2015a). The Welsh statistics are only available to 1993, so these data are used as
an estimate of the Welsh non-iron and steel coking coal consumption in 1995. For 1998 to 2014, the non-iron and steel coking coal
consumption data is apportioned between England and Wales using carbon dioxide emissions for the particular sites reported in the
Pollution Inventory (EA, 2015a) and EU ETS (EA, 2015b).
The generic driver for coke oven fuel consumption is the regional consumption of coking coal (ISSB, 2015). This driver is also used for
natural gas consumption through the time series and coke oven gas consumption until 2004, and from 2005 data on coke oven gas
emissions from the EU ETS are used (EA, 2015b). Some coke ovens use blast furnace gas as fuel and the availability depends on blast
furnace gas capacity (see Industrial Processes); emissions from blast furnace gas use are apportioned across DAs using regional data on
coke consumption in blast furnaces (ISSB, 2015) until 2004 and from 2005 data on BFG emissions from the EU ETS (EA, 2015b).Small
amounts of colliery methane are consumed in the manufacture of solid fuels and this was judged to occur entirely in England where coking
occurs in close proximity to deep mining. Small amounts of coke breeze are also used, and this has been disaggregated using data on other
coke consumption from ISSB.
The estimation of emissions from SSF production is rather uncertain, as limited fuel use data are available from processes across the UK.
Moreover, many of these are the new briquetting processes rather than coking processes and produce negligible emissions. For SSF plant
operating in England and Wales, it is possible to estimate regional consumption using UK data (DECC, 2015a) and Welsh data (WO, 1998).
Welsh data for 1995 has been estimated, whilst all SSF coking plant still operating since 1998 are known to be in England. Thus the driver
used is coal consumed by SSF plant.
A2.4.4 Other Energy Industries
This category consists of a number of small emissions from collieries, the gas industry, the nuclear fuel industry and emissions from the
upstream oil and gas exploration and production sector which comprises offshore rigs and vessels as well as onshore terminals. In the DA
inventories, emissions from oil and gas terminals and offshore rigs and vessels are based on data provided by DECC (2015e). Installation-
specific data are only available for post-1995, and until 1998 these data are incomplete and inconsistent across the time series, so are
disregarded. Emissions for 1990 are extrapolated based on 1998 operator-reported data; previous use of data from the mid-1990s has now
been disregarded, due to new research in the UK GHGI to address outlier implied emission factors for combustion and flaring of gaseous
fuels.
Emissions from gas separation plant are from combustion of process off-gases (mainly ethane) in terminals, which are reported by facility
operators within emission estimates under EEMS (DECC, 2015e); the emission factor for these emissions reflects that the “OPG” in these
terminals is predominantly ethane rather than the mixture of gases derived from refineries that is also known as “OPG”. Data on LPG and
OPG use at oil and gas terminals is reported within EU ETS (SEPA, 2015b & EA, 2015b) and these data are used to directly inform the DA
GHGI estimates from 2005 onwards, with the DA split for earlier years is extrapolated back from EU ETS data.
Emissions from gas combustion at installations linked to the gas supply network comprise activities at compressor stations, LNG terminals
and other above ground installations. The UK GHGI estimates were previously based on the sector natural gas allocation in DUKES.
However, a large number of the larger sites (compressor sites, LNG terminals) report their fuel use and emissions to the EU ETS. Since 2008,
the reported fuel use and emissions from these large sites in EU ETS exceeds that reported within DUKES and the UK GHGI, indicating that

Appendix 2: Devolved Administrations’ GHG Inventory Compilation Methods and Data Sources
Greenhouse Gas Inventories for England, Scotland, Wales and Northern Ireland: 1990-2014 15
there is a small gas misallocation within DUKES. Therefore in the 1990-2014 UK GHGI, the gas use data from EU ETS have been used to
estimate the UK sector emissions, and the DA split has been derived directly from the data in EU ETS (EA, 2015b; SEPA, 2015b); to retain
the overall natural gas use energy balance for the UK, an equal and opposite reduction in gas use in “unclassified industry” (which is
reported within IPCC 1A2g) was applied.
The EU ETS data are used for each year from 2005 onwards. For 1990-2004, the DA share of the gas use is estimated based on the 2005 EU
ETS totals. These estimates are uncertain: the UK data are an under-report; the EU ETS data only cover the larger sites on the network and
may not be representative of the overall DA split of activity; the 1990-2004 data are extrapolated from more recent data, assuming that
the DA trends follow the UK-wide trend.
Other sources are minor and are covered in Table A2. 2.
A2.5 Manufacturing Industries and Construction The drivers used to estimate DA-specific fuel consumption from these sectors are summarised in Table A2. 4.
A2.5.1 Iron and Steel
The ISSB (2015) provides annual report of detailed regional consumption of fuel by the steel industry and these data are used to inform
regional iron and steel sector consumption of fuels such as natural gas which is used across many of the smaller production sites in the UK.
Access to the detailed data for the steel sector from the Climate Change Agreement reporting system (Personal Communication: Hodges,
2013), has provided clarifications on fuel use and site allocations within the Ricardo point source dataset, to complement the EU ETS
dataset (EA, 2015b) which provides details for the highest-emitting sources in the iron and steel sector including the integrated steelworks.
In addition, consultation with Tata Steel (Personal Communication: Mick Briggs and Bob Lewis, 2013) and the ISSB (Personal
Communication: Donna Leach and Sophie Fatoba, 2013) during 2013 has led to a series of revisions to the activity data, fuel compositional
data used in the mass balance method used in the UK GHGI, and the resolution of emissions data across different units within each of the
UK integrated steelworks. This research was part of a UK inventory improvement programme research task commissioned by DECC1
(Ricardo-AEA, 2014).
Energy use and emissions data for the integrated steelworks has been used to derive the DA estimates from 2005 onwards for the
combustion of coke, blast furnace gas and coke oven gas in blast furnaces, sinter plant, iron and steel combustion plant and in iron and
steel flaring sources. Prior to 2005, the ISSB regional energy statistics are used for those sources and fuels.
The consumption of coke by sinter plant is estimated as the non-blast furnace coke consumption (as this is the main other use of coke). The
consumption of coke oven gas is distributed as proportional to ISSB regional figures for coal feed to coke ovens, whilst the consumption of
blast furnace gas is distributed as proportional to ISSB regional figures for coke feed to blast furnaces. The production of these gases is
estimated to be proportional to the fuel used as feedstock.
The ISSB reports the general consumption of coal, fuel oil, gas oil, LPG and natural gas by the primary iron and steel industry. This is a
narrower definition than that used by DECC, which includes foundries and finishing plant, and therefore the DECC data used in the UK GHGI
is higher than the ISSB data. Nevertheless, the regional ISSB data is used as a surrogate, since the distribution of the wider steel industry is
directly linked to that of the primary industry, and the emissions from the secondary plant are considerably lower than the primary plant.
A2.5.2 Other Industry
DECC sub-national energy use data (DECC, 2015b), are based on local electricity and gas consumption patterns, as part of a project to
develop Local Authority carbon dioxide emissions data. These statistics use local electricity and gas use data from the National Grid and the
gas supply network operators (formerly Transco). Solid and liquid fuel use is calculated using point source consumption data (for major
industrial sites), and a complex modelling process to distribute remaining UK fuel allocations that uses employment and population data,
and takes account of smoke control zones and the patterns of gas and electricity consumption.
1 GHG Inventory Research: Use of EU ETS Data - Iron and Steel Sector: Review of UK data on emissions of GHGs from the Iron and Steel sector to utilise EU
ETS data in the national inventory

Appendix 2: Devolved Administrations’ GHG Inventory Compilation Methods and Data Sources
Greenhouse Gas Inventories for England, Scotland, Wales and Northern Ireland: 1990-2014 16
Table A2. 3: Manufacturing Industry and Construction (Base Year – 1990)
IPCC Category NAEI Sources Activity: Fuel Consumption Data used for deriving DA estimates from UK totals / Comments
Iron & Steel Sinter Plant Coke-breeze Other coke consumption, ISSB
Iron & Steel Blast furnace gas Coke consumed in blast furnaces, ISSB, WO
Coke oven gas Coal feed to coke ovens, ISSB, WS
Coke Coke consumed in blast furnaces, ISSB, WO
Other fuels Regional fuel use data (ISSB): fuel oil, gas oil, LPG, coal, natural gas.
Other Industrial
combustion
Non-ferrous metals All fuels Emissions analysis for 2013: Pollution Inventory (EA, SEPA, NIEA 2014a), EU ETS (EA, SEPA, NIEA 2014b)
IDBR and employment data (ONS, 2013). Overall analysis of the 1A2b, c, d, e, f and g sectors used to
constrain the DA totals to previous 1A2 DA estimates, using 1A2g Other Industry as residual.
Food and drink All fuels
Paper and Pulp All fuels
Chemicals (Energy) All fuels (except OPG)
Chemicals (IPPU) OPG Petrochemical plant capacity, emissions per unit capacity on site-specific data from PI/SPRI data, applying UK average to Welsh estimates.
Other Industry All oils Sub-national oil consumption, DECC
LPG Sub-national energy statistics, DECC
Lubricants Sub-national energy data, DECC, less estimate of road transport use. (Reported as industrial process.)
Natural gas Natural gas consumed, data from Transco
Colliery Methane Deep mined coal production, British Coal Authority
Coal, coke Sub-national energy statistics, DECC
Coke oven gas Coal feed to coke ovens, ISSB, WO, WS
SSF Sub-national energy statistics, DECC
Wood GDP data.
Cement Coal, oil, gas, petrocoke, tyres, waste oil
Regional cement capacity, BCA
Ammonia (combustion) Natural Gas All such plant are located in England
Autogenerators Coal All such plant are located in England
Natural gas (Data sources exactly as per “Other Industry” above)
Other-Industry: Off-road Gas oil, petrol Industrial employment data (ONS)

Appendix 2: Devolved Administrations’ GHG Inventory Compilation Methods and Data Sources
Greenhouse Gas Inventories for England, Scotland, Wales and Northern Ireland: 1990-2014 17
Table A2. 4: Manufacturing Industry and Construction (1995; 1998 to 2014)
IPCC Category NAEI Sources Activity: Fuel Consumption Data used for deriving DA estimates from UK totals / Comments
Iron & Steel Sinter Plant Coke-breeze To 2004: Other coke consumption, ISSB. 2005 onwards: EU ETS data supplemented by information from Tata Steel (2015)
Iron & Steel Blast furnace gas To 2004: Coke use in blast furnaces, ISSB, WO. 2005 onwards: EU ETS data supplemented by information from Tata Steel (2015)
Coke oven gas To 2004: Coal feed to coke ovens, ISSB, WS. 2005 onwards: EU ETS data supplemented by information from Tata Steel (2015)
Coke To 2004: Coke use in blast furnaces, ISSB, WO. 2005 onwards: EU ETS data supplemented by information from Tata Steel (2015)
Other fuels Regional fuel use data (ISSB): fuel oil, gas oil, LPG, coal, natural gas supplemented by information from Tata Steel (2015)
Other Industrial combustion
Non-ferrous metals All fuels Emissions analysis for 2015: Pollution Inventory (EA, 2015a; SEPA, 2015a; NIEA, 2015a), EU ETS EA, 2015b; SEPA, 2015b; NIEA, 2015b) IDBR and employment data (ONS, 2013). Overall analysis of the 1A2b,c,d,e, f and g sectors used to constrain the DA totals to previous 1A2 DA estimates, using 1A2g Other Industry as residual. Coke use in NFM is now entirely allocated to the IPPU sector (Zinc production) and this is located only in England.
Food and drink All fuels
Paper and Pulp All fuels
Chemicals (Energy) All fuels (except OPG)
Chemicals (IPPU) OPG Petrochemical plant emissions from PI/SPRI and EU ETS. DECC data on Natural Gas Liquid deliveries used to interpolate where no emissions data.
Other Industry All oils Sub-national oil consumption, DECC
LPG Sub-national energy statistics, DECC
Lubricants Sub-national energy data, DECC, less estimate of road transport use. (Reported as industrial process.)
Natural gas Natural gas consumed, data from Transco (now UK National Grid) & (since 1995) from Phoenix Gas (NI). Sub-national energy statistics (DECC) and Ricardo point source data, analysed to minimise double-counting.
Colliery Methane Deep mined coal production, British Coal Authority
Coal, coke Sub-national energy statistics, DECC; Coal consumption, WO, NIO
Coke oven gas Coal feed to coke ovens, ISSB, WO, WS
SSF Sub-national energy statistics, DECC
Wood GDP data.
Cement All fuels Regional cement capacity, BCA; For 2002 onwards, based on emissions reported to the EU ETS, PI, SPRI and NIPI (reported to EA, NIEA and SEPA).
Ammonia (combustion) Natural Gas All such plant are located in England
Autogenerators Coal DECC sub-national energy statistics data on coal use by other power producers, Energy Trends December 2015.
Natural gas (Data sources exactly as per “Other Industry” above)
Other-Industry: Off-road Gas oil, petrol Industrial employment data. (ONS)

Appendix 2: Devolved Administrations’ GHG Inventory Compilation Methods and Data Sources
Greenhouse Gas Inventories for England, Scotland, Wales and Northern Ireland: 1990-2014 18
The DECC sub-national energy statistics are revised and improved each year through targeted sector research aimed at reducing
uncertainties in the modelling approach, and are now National Statistics. Previously the regional fuel use in these sectors has been
developed using a complex balance approach based on limited source data. The lack of consistent and comprehensive fuel use or fuel sales
data from across the DAs (especially for solid and liquid fuels) leads to significant potential errors in the distribution of UK fuel use across
the regions. Expert judgement and proxy data are used to address data gaps and inconsistencies in DA energy use data over the time
series; the DA emission estimates for earlier years in the inventory time series and the reported inventory trends are associated with higher
uncertainty than the data and trends reported in the UK GHG inventory, due to the lack of detailed DA energy balance data.
The DECC sub-national energy statistics are used to derive estimates for industry sector combustion of fuels such as fuel oil, gas oil and
coal. These data are based predominantly on analysis of available point source data, supplemented by production and employment
surveys, and in several sectors new data on building Display Energy Certificates and Energy Performance Certificates have been used to
provide a better indicator of DA energy use than the production or employment indices. Several industry sectors are now 100% covered
under EU ETS, such as the cement sector, and hence uncertainties in the DA GHGI estimates are much lower than previously for such
sources. To supplement EU ETS data, additional information from other pollution inventories (PI, SPRI, NIPI) are used to improve the
accuracy of the allocation of industrial combustion sources.
To reduce the risk of double-counting emissions, the mapping of area sources has been revised to remove the proxy data (i.e. employment
or production indices) associated with those major point sources that can be accurately allocated. The revision of mapping grids for the
area sources is conducted periodically as part of the NAEI work programme, with the industry data typically revised every 3-4 years. In
2011, new analysis was conducted to revise the grids for the emissions in year 2010, and these data are retained in the latest DA GHG
inventory. This revision to the DA estimates for industry sectors enables a more accurate representation of the emissions in recent years
following the recession, compared to the data presented in the 1990-2009 DA GHGI report which was based on area source analysis for the
year 2006. Furthermore in the 2010 mapping update, the industry sector was analysed at a greater level of detail to enable DA-specific
estimates to be derived for the non-ferrous metal (1A2b), chemicals (1A2c), paper and pulp (1A2d) and food, drink and tobacco (1A2e)
sectors.
Note that the sub-national energy statistics have only been produced by DECC since 2003, and complete data (i.e. all fuels) are only
available up to 2013, with gas and electricity data available up to 2014 within the DECC publication Energy Trends December 2015 (DECC,
2015b). The sub-national data are used to extrapolate estimates back across the time-series (assuming UK trends across all DAs) in many
instances where more detailed data for the earlier years is absent. Hence the emission estimates & trends from solid and liquid fuels within
the industrial combustion categories remain amongst the more uncertain estimates within the DA inventories, due to uncertainties from
the modelling approach to derive the source activity data and the back-casting of emission estimates for the earlier years.
Liquid Petroleum Gas (LPG) has a number of uses, primarily in sectors such as domestic use and the growing sector of LPG use in road
transport applications. Industrial use of LPG has been disaggregated based on DECC sub-national energy statistics (DECC, 2015b) for recent
years, maintaining the mass balance approach for the earlier years where complete data are available.
The driver for emissions from lubricant use is based on regional lubricant sales (DECC, 2015a) with England and Wales being disaggregated
based on regional manufacturing employment statistics (ONS, 2015). Under the 2006 IPCC Guidelines, the emissions from lubricant use are
now reported within the Industrial Processes and Product Use (IPPU) sector 2D, rather than within the Energy sector 1A2, as previously
reported under the 1996 IPCC Guidelines.
DECC (2015c) provides data on natural gas sales to consumers categorised by consumer size and region in Great Britain, excluding
consumption by large industrial users and power generators. Consumption data for gas use in Northern Ireland is supplied by Airtricity
(formerly Phoenix Gas) (2015) for 1999 onwards, Firmus Energy (2015) and Vayu Ltd. (2015). These data sources are used to assess the
overall gas use data for each country. Note however, that the DECC data are incomplete due to issues of commercial confidentiality for
several large gas using sites, and a series of assumptions are made to estimate the gas use at these “missing” sites. Furthermore, the local
authority gas use estimates do not cover a calendar year and are weather-corrected and are therefore not directly consistent with the
annual fuel use data by sector that are reported in DUKES, which are used to underpin the UK and DA GHG inventory emission estimates
from gas combustion. The overall gas use data for each country are uncertain as a result of these scope and reporting limitations.
The gas use within each economic sub-sector at country-level is then analysed based on the available data from the DECC sub-national
energy statistics, supplemented by estimates of major point source gas use derived from analysis of the EU ETS and pollution inventory
emissions data. Similar to the approach adopted for gas oil, fuel oil and coal, the analysis of point source data enables greater direct
allocation of gas use to industry or commercial sectors, reducing allocation uncertainties. Note that the driver determined for “other
industry” is also used for “autogenerators”. In Northern Ireland, supplementary information from gas suppliers provides a slightly more
detailed breakdown of gas use by end-user sector, and this has been used to revise the allocations between industrial and commercial
sectors across recent years.
Drivers for fuel consumption in cement kilns are based on annual regional clinker capacity data for 1990, 1995, 1998-2001 supplied by the
British Cement Association (BCA, 2004). These are applied to all fuels, with a correction factor applied to Northern Ireland to account for

Appendix 2: Devolved Administrations’ GHG Inventory Compilation Methods and Data Sources
Greenhouse Gas Inventories for England, Scotland, Wales and Northern Ireland: 1990-2014 19
the absence of natural gas. Where the UK estimate of fuel consumed in cement kilns has been revised for a given year, the regional
consumptions have also been revised. From 2002 onwards the emissions data reported to the PI, SPRI and NIPI are used to disaggregate UK
emissions (EA, 2009; SEPA, 2009; NIDoE, 2009), until 2008 where the EU ETS Phase II reporting scope covers all UK cement kiln sites. For
2008 onwards therefore, the EU ETS data (EA, 2015b; SEPA, 2015b; NIEA, 2015b) are used to derive the DA estimates, in order that local
fuel use patterns and emission factors are fully reflected within the DA GHG inventory data, and to maintain consistency between the EU
ETS and DA GHG inventory.
“Autogeneration” refers to electricity generation by industry for its own use. In the case of coal, until 2012 the use of coal in
autogeneration was dominated by a handful of plant based in England such as the Alcan power station at Lynemouth. Following the closure
of the Alcan production site, the use of coal in autogeneration is a much lesser source in the UK; the estimated distribution of emissions
from coal-fired autogeneration are taken from the DECC sub national energy stats for coal use by other generators (DECC, 2015b). Gas
autogeneration is distributed according to the other natural gas “other industry” driver.
As the UK and DA GHG inventories are now reported under the 2006 IPCC Guidelines, there are a small number of reporting re-allocations
evident in the industrial sector. Coke use in the non-ferrous metals sector was formerly reported as an energy emission within 1A2b, but
now is regarded as a process emission (i.e. coke being used as a reductant rather than fuel source) and hence under the 2006 IPCC
Guidelines the GHG emissions are now reported within the IPPU sector (2B). All such emissions are allocated to England, as they are
associated with the Britannia Zinc smelter that operated in England until 2000.
A2.6 Transport
The drivers used for transport are summarised in

Appendix 2: Devolved Administrations’ GHG Inventory Compilation Methods and Data Sources
Greenhouse Gas Inventories for England, Scotland, Wales and Northern Ireland: 1990-2014 20
Table A2. 6.
A2.6.1 Aviation
The disaggregation of the domestic aviation emissions uses a database of aircraft movement data from the Civil Aviation Authority, also
used in the compilation of the UK GHG inventory.
The CAA database includes details of individual flights (airport origin, destination, fuel type, plane type, engine type), covering both
domestic and international flights. Only domestic UK flights are included in the core DA GHG inventory data, as the DA inventory is aligned
with the territorial coverage of the UK statistical release, which excludes international aviation and flights to Crown Dependencies,
Overseas Territories and Gibraltar; however, for the purposes of reporting data to match the scope of Scottish Government GHG mitigation
targets, estimates of the DA share of these international flights are also made using the same method, i.e. allocating emissions from flights
to the DA of flight origin, using the CAA database. For England, Wales and Northern Ireland, these data are retained merely as memo items,
accounted separately from the by source inventory totals.
Estimates of emissions from take-off and landing cycles and aircraft cruise have been calculated. The protocol adopted for disaggregating
emissions across DAs is to assign all emissions from a flight to the DA of flight origin. For the 1990-2011 DA inventory, the method for
disaggregating the flights to Crown Dependencies, Overseas Territories and Gibraltar was improved to take proper account of available
information on flights to these destinations rather than merging the analysis with the UK-international flight data. This has an almost
negligible impact on all of the DA aviation estimates, but removes inconsistencies where it is known that there are no direct flight routes
between, for example, Scotland and Gibraltar.
The DA emission estimates for domestic and international aviation are associated with low uncertainty; the emission estimates are based
on a database of UK flight movements and detailed calculations of emissions from different phases of flights (take off, cruise, landing
cycles). Details of the aviation methodology can be found in the National Inventory Report (Brown, et al., 2016). The driver for emissions
from aircraft support vehicles is calculated based on aircraft movement data from the UK’s major airports (CAA, 2015). Emission estimates
for both domestic and international aviation are constrained at UK level by the fuel use data reported within the annual publication of
DUKES (DECC, 2015a). Annual aviation fuel sales in the UK therefore define the overall aviation emissions, in accordance with UNFCCC,
UNECE and IPCC inventory guidance.
A2.6.2 Navigation
Emissions from navigation (coastal shipping and fishing) are based on emission estimates within the UK GHGI that do not use the shipping
fuel use data reported within DUKES (DECC, 2015a), but instead uses data from a research study by AMEC Foster-Wheeler (formerly Entec)
under contract to Defra. The study calculated fuel consumption and emissions from shipping activities around UK waters using a bottom-up
procedure based on detailed shipping movement data for different vessel types, fuels and journeys (Entec, 2010). The total fuel delivery
statistics given in DUKES (marine bunker plus national navigation) are believed to be an accurate representation of the amount of fuel
made available for marine consumption, but there is more uncertainty in the ultimate distribution and use of the fuels for domestic and
international shipping consumption and hence the AMEC Foster-Wheeler study data are used.
The overall approach can be summarised as follows:
Fuel consumption and emissions for domestic journeys are taken from the AMEC Foster-Wheeler study based on detailed
movement data for 2007 in which AMEC Foster-Wheeler provided an uplift to their bottom-up estimates to take account of
missing vessel movements ;
Fuel consumption and emissions for fishing vessels are taken from the AMEC Foster-Wheeler study and reported separately
under 1A4ciii;
Estimates for domestic coastal shipping fuel consumption and emissions back-cast to 1990 and forecast to 2014 are used, which
are derived from applying trends in port movement data as proxies for changes in activities of different types of vessels;
Fuel consumption and emissions are calculated separately for naval shipping from data provided by the MoD (MoD, 2015);
Fuel consumption and emissions are calculated separately for inland waterways from estimates of vessel population and
activities;
Fuel consumption and emissions are calculated separately for fishing which takes place in non-UK waters by UK vessels;
Fuel consumption and emissions are calculated separately for shipping movements between the UK and Overseas Territories;

Appendix 2: Devolved Administrations’ GHG Inventory Compilation Methods and Data Sources
Greenhouse Gas Inventories for England, Scotland, Wales and Northern Ireland: 1990-2014 21
A reconciliation with fuels data in DUKES is made whereby the difference between the sum of the currently reported fuel
deliveries for marine bunkers and national navigation in DUKES and the sum of the fuel consumption estimate for domestic
coastal shipping taken from AMEC Foster-Wheeler, and the fuel consumption estimates for naval shipping, the UK’s inland
waterways, fishing outside UK waters and shipping movements between the Overseas Territories, is assigned to international
shipping.
From the UK inventory for domestic navigation, the disaggregation of emissions between each constituent country is based on port
movement data (DfT, 2015a). The same approach is taken for the allocation of the international shipping emissions to each DA. As with the
international aviation data, the Scottish Government GHG reduction targets take account of the Scottish share of international shipping,
whereas for England, Wales and Northern Ireland the international shipping data are merely a memo item that are accounted for separate
to the main DA by source dataset.
The DA emission estimates derived for domestic and international shipping are regarded as indicative, as there is limited data availability
for regional marine shipping fuel use.
No detailed dataset of domestic and international shipping movements is currently available, and hence emissions are assigned based on
the assumption that the total mass of port traffic per DA is a representative proxy to estimate shipping fuel sales and use in the ports and
waters around the DAs. Note that the sum of the DA shipping emission allocations are constrained by the UK fuel use data for the sector;
this method of estimation is therefore consistent with the principles of international inventory guidance, whereby emissions are allocated
to the country at the point of fuel sale.
[Note that in the reporting of the UK GHGI, the emission estimates for international aviation and shipping are reported as “memo items” to
the UK submission to the UNFCCC, and hence the approach taken for England, Wales and Northern Ireland is fully consistent with the UK
reporting commitments.]
A2.6.3 Road Transport
Carbon dioxide, methane and nitrous oxide are emitted from the exhaust of all road vehicles with internal combustion engines. Carbon
dioxide is the principal product of combustion and emissions are directly related to the fuel efficiency of the vehicle.
Methane is emitted as a result of the incomplete combustion of the fuel. Nitrous oxide is a by-product of the combustion process and
emitted from partial oxidation of nitrogen present in the air.
All these pollutants are emitted by different amounts from vehicles of similar size running on petrol and diesel fuel. For example, diesel
cars tend to be more fuel-efficient than petrol cars of a similar size, so their carbon emissions are lower. None of these pollutants are
subject to regulatory type-approval emission limits as are those which have an impact on air quality. However, emissions of GHGs are
affected by technologies introduced to reduce emissions of the regulated air quality pollutants. Methane emissions are lower from petrol
vehicles fitted with a three-way catalyst, although the reduction in emissions of this pollutant by the catalyst is not as efficient as it is for
other hydrocarbons. Measurements also suggest that a three-way catalyst, which is efficient at reducing NOx emissions, can actually
increase emissions of nitrous oxide, formed as a by-product of the catalyst NOx reduction process, but evidence suggests that this is mainly
a problem only for early generation catalyst cars.
Disaggregation of UK emissions across the DAs is based on local data from road traffic surveys run by the UK Department for Transport and
the Department for Regional Development in Northern Ireland. Vehicle kilometre figures for different vehicle types and road types are
combined with fuel consumption or emission factors. The vehicle kilometre data are also subject to uncertainty, but have shown a
consistent growth in traffic across all the regions up to 2007. In general, traffic levels have gone down slightly between 2007 and 2012, and
increased from 2012 to 2014.
It is worth noting that the IPCC Reference Manual states that “the CORINAIR (programme), with a view to the input requirements of
atmospheric dispersion models, applies the principle of territoriality (emission allocation according to fuel consumption) whereas the IPCC
is bound to the principle of political responsibility (allocation according to fuel sale). For the IPCC, countries with a big disparity between
emissions from fuel sales and fuel consumption have the option of estimating true consumption and reporting the emissions from
consumption and trade separately.” (IPCC, 1996).
UK emissions of carbon dioxide from road transport are reported to IPCC on the basis of fuel sales. However, basing road transport
emissions on fuel sales in each constituent country of the UK does not provide a representative picture of trends in road transport
emissions at regional level, due to issues of cross-border fuel sales (especially between Northern Ireland – Republic of Ireland) and sales
data accounting issues within the UK (e.g. “supermarket sales” in Scotland allocated to original point of sale in northern England).

Appendix 2: Devolved Administrations’ GHG Inventory Compilation Methods and Data Sources
Greenhouse Gas Inventories for England, Scotland, Wales and Northern Ireland: 1990-2014 22
Estimates based on fuel consumption calculated from traffic data in each DA are therefore regarded as a more representative approach,
and are consistent with the CORINAIR (now EMEP/EEA) guidance.

Appendix 2: Devolved Administrations’ GHG Inventory Compilation Methods and Data Sources
Greenhouse Gas Inventories for England, Scotland, Wales and Northern Ireland: 1990-2014 23
Table A2. 5: Transport (Base Year – 1990)
IPCC Category NAEI Sources Activity: Fuel Consumption Data used for deriving DA estimates from UK totals / Comments
Civil Aviation Domestic cruise; Domestic Take-off & Landing
Aviation Gasoline, Jet Gasoline
CAA database of flight information (CAA, 2015) Fuel consumption: Digest of UK Energy Statistics (1990)
Road Transport Road Transport Petrol, Diesel oil Road fuel sales, DECC; vehicle km, DfT Traffic data: National Traffic Census, DfT Dept of Regional Development (NI: 1990); this data is scaled based on the 2008 data from the Annual Road Traffic Estimates (2008-2013) (DRDNI, 2014) Fuel consumption: Digest of UK Energy Statistics (1990)
Railways Railways Gas oil The DfT Rail Emissions Model, calibrated against total train kilometres figures for 2009/10 taken from ORR’s National Rail Trends Yearbook. DA estimates from 2010 back-cast to 1990, assuming DAs follow UK trend. Fuel consumption: Digest of UK Energy Statistics (1990).
Navigation Coastal shipping Gas oil, Fuel oil Back calculated from 2007 estimates by Entec based on detailed shipping movements. Backcasting done from 2007 using trends in port movement data, DfT Maritime Statistics Fuel consumption: Digest of UK Energy Statistics (1990)
Other Aircraft Support Gas oil Regional aircraft movements, DfT Fuel consumption: Digest of UK Energy Statistics (1990)

Appendix 2: Devolved Administrations’ GHG Inventory Compilation Methods and Data Sources
Greenhouse Gas Inventories for England, Scotland, Wales and Northern Ireland: 1990-2014 24
Table A2. 6: Transport (1995; 1998 to 2014)
IPCC Category NAEI Sources Activity: Fuel Consumption Data used for deriving DA estimates from UK totals / Comments
Civil Aviation Domestic cruise; Domestic Take-off & Landing
Aviation Gasoline, Jet Gasoline
CAA database of flight information (CAA, 2015) Fuel consumption: Digest of UK Energy Statistics (DECC, 2015a)
Road Transport Road Transport Petrol, Diesel oil, LPG Vehicle km, DfT, NI DRD Emission factors: COPERT 4 v 11 (EEA, 2013) Fuel efficiency: COPERT 4 v11 (EEA, 2013) Composition of fleet: Vehicle Licensing Statistics Report, DfT (GB) Dept of Regional Development (NI). Traffic data: National Traffic Census, DfT (England, Scotland, Wales: 1990-2014) Annual Road Traffic Estimates for NI (2008-2013). 2014 data is estimated by scaling the 2013 NI data based on the 2013 to 2014 trend from the DfT National Traffic Census. Data for 1990-2007 is scaled based on the 2008 data from the Annual Road Traffic Estimates (2008-2013), using the following datasets: Dept of Regional Development (NI: 1990-1999), Traffic Census Report (NI: 2000), Vehicle Kilometres of Travel Survey of Northern Ireland Annual Report (NI: 2001), Traffic and Travel Information, DRDNI (NI: 2002- 2007). Fuel consumption: Digest of UK Energy Statistics (DECC, 2015a) Welsh Office fuels data (WO, 1998)
Railways Railways Gas oil The DfT Rail Emissions Model, calibrated against total train kilometres figures for 2009/10 taken from ORR’s National Rail Trends Yearbook. Fuel consumption: Digest of UK Energy Statistics (DECC, 2015a)
Navigation Coastal shipping Gas oil, Fuel oil Back calculated from 2007 estimates by AMEC Foster-Wheeler (formerly Entec based on detailed shipping movements. Backcasting and forewardcasting done from 2007 using trends in port movement data, DfT Maritime Statistics Fuel consumption: Digest of UK Energy Statistics (DECC, 2015a)
Other Aircraft Support Gas oil Regional aircraft movements, DfT Fuel consumption: Digest of UK Energy Statistics (DECC, 2015a)

Appendix 2: Devolved Administrations’ GHG Inventory Compilation Methods and Data Sources
Greenhouse Gas Inventories for England, Scotland, Wales and Northern Ireland: 1990-2014 25
Total emissions from road transport in each region are calculated from the following information:
Emission factors for different types of vehicles. In the case of carbon emissions, fuel consumption factors can be used because
the mass of carbon emitted is proportional to the mass of fuel consumed. Emission factors (g/km) and fuel consumption factors
depend on the vehicle type and fuel type (petrol or diesel) and are influenced by the drive cycle or average speeds on the
different types of roads;
Traffic activity, including distance and average speed travelled by each type of vehicle on each type of road;
Fleet composition in terms of the age of the fleet and the petrol/diesel mix. The age of the fleet determines the proportion of
vehicles manufactured in conformity with different exhaust emission regulations (which have been successively tightened over
the past 30 years); and
One of the defining factors for the inventories is the proportion of petrol cars fitted with a three-way catalyst since this became
mandatory for all new cars first registered in the UK from around August 1992, in accordance with EC Directive 91/441/EEC. The
proportion of cars and vans running on diesel fuel is also an important factor. The sensitivity to the age of the fleet will be much
less for the 1990 inventory because there were very few cars then fitted with catalysts and the difference in emissions from cars
made to the earlier emission standards was much smaller.
In the derivation of the 1990-2014 UK and DA GHG inventory estimates, no new data were provided by the Northern Ireland DRD regarding
road vehicle movements by vehicle type. Therefore the activity for road vehicles in Northern Ireland for the year 2014 were estimated by
Ricardo Energy and Environment based on the reported 2013-2014 GB road traffic trends, using DfT data, and applying the trend to
historical Northern Ireland data for 2013.
Emission factors
All the emission factors were consistent with those used in the latest UK Greenhouse Gas Emissions Inventory (yet to be published).
Emission factors for methane are now based on COPERT 4 v11 emission factors (EEA, 2013). Previously they were based on factors
developed by TRL on behalf of DfT, expressed as speed-related functions for cars and LGVs and single average factors for HGVs, buses and
motorcycles for urban, rural and motorways.
Nitrous oxide emission factors are based on the emission factors in COPERT 4 v11 (EEA, 2013). They are based on factors obtained from the
Emissions Inventory Guidebook (EEA, 2013). For petrol cars and LGVs, emission factors are provided for different Euro standards and
driving conditions (urban, rural, highway) with adjustment factors that take into account the vehicle’s accumulated mileage and the fuel
sulphur content; both of these tend to increase emission factors. For diesel cars and LGVs, bulk emission factors are provided for different
Euro standards and road types, with no fuel and mileage effects. The factors for HGVs and buses are provided for different Euro standards,
weight classes and driving conditions. The factors for motorcycles make no distinction between different Euro standards and road types.
The uncertainties in the CH4 and N2O factors can be expected to be quite large. However, the relative differences between emission factors
used for different technologies, Euro standards and fuels are likely to reflect realistic trends.
Fuel consumption factors are now based on fuel consumption factors based on COPERT 4 v11 (EEA, 2013), having previously been based on
the fuel consumption-speed relationships for detailed categories of vehicles compiled by TRL (on behalf of DfT). The COPERT 4 factors
included a method for passenger cars which applies a year-dependent ‘real-world’ correction to the average type-approval CO2 factor
weighted by new car sales in the UK from 2005-2014. The new car average type-approval CO2 factors for cars in different engine size bands
were provided by the Society of Motor Manufacturers and Traders (SMMT, 2015). The real-world uplift uses empirically-derived equations
in the Guidebook that take account of average engine capacity and vehicle mass. Previous versions of the inventory calibrated speed-fuel
consumption curves for HGVs and buses with independent data from DfT on the fuel efficiencies of these vehicles in the UK obtained from
surveys of haulage companies and bus operators’ fuel returns. However, DfT have recently found the data to be less complete than was
previously considered and therefore less suitable for use in the inventory.
Table A2. 7 shows the UK fleet-averaged fuel consumption factors used for the inventory broken down by year of emission, and vehicle typ.
Table A2. 8 shows the implied methane and nitrous oxide emission factors used for the inventory broken down by year of emission, and
vehicle type. The age-mileage functions provided by TRL are used to work out the accumulated mileage effects in the calculation of N2O
emission factors. These factors are weightings according to the distances travelled by the mix of Euro classes in the fleet each year as well
as the proportions of kilometres travelled at different speeds and therefore with different emission factors. These factors also include the
contribution from cold start emissions.
Age and composition of the fleet
Automatic Number Plate Recognition (ANPR) data provided by DfT (2015b) are used to define the UK’s vehicle fleet composition on the
road. The ANPR data has been collected between 2007 and 2011, 2013 over 256 sites in the UK on different road types (urban and rural
major/minor roads, and motorways) and regions. Measurements are made at each site on one weekday and one half weekend day in June,

Appendix 2: Devolved Administrations’ GHG Inventory Compilation Methods and Data Sources
Greenhouse Gas Inventories for England, Scotland, Wales and Northern Ireland: 1990-2014 26
capturing approximately 1.4-1.7 million observations from all the sites each year. The data cover various vehicle and road characteristics
such as fuel type, age of vehicle (which can be associated with its Euro standard), engine sizes, vehicle weight and road types.
The ANPR data is used to define fleet composition in two aspects:
Petrol and diesel mix in the car fleet on different road types (urban, rural and motorway). The ANPR data confirmed that there
is a preferential use of diesel cars on motorways, as well as on urban roads, although not to the extent. For Northern Ireland, the
ANPR data for 2010-2011, and 2013 shows that there was no major difference in the proportion of diesel cars observed on
different road types, and that the proportion was similar to that implied by the licensing data. It is assumed that there is no
preferential use of diesel cars, and that the petrol/diesel mix in car km follows the proportion as indicated by the licensing
statistics provided by DRDNI (2014).
Variations in age and Euro standard mix on different road types. The ANPR data tended to show that the diesel car, LGV and
HGV fleet observed on the road was rather newer than inferred from the licensing records and mileage surveys.
Previously, the results from above were combined with regional licensing statistics provided by DfT from their Driver and Vehicle Licensing
Agency database to define regional variation. The application of the DVLA data were based on a one-off analysis carried out in 2010,
combined with the fuel consumption factors based on the TRL/DfT source. Given the change of the fuel consumption factors (now based
on COPERT 4 methodology), the previous application of the DVLA data will no longer be valid and hence was not applied to the latest UK
and DA inventories.
Traffic data
The preferred indicators for road transport activity in emission inventories are traffic data in terms of vehicle kilometres travelled per year
disaggregated by vehicle and road type. For the NAEI, vehicle kilometre data for the road network in Great Britain are provided by DfT for
each vehicle type on roads classified as trunk, principal and minor roads in built-up areas (urban) and non-built-up areas (rural) and
motorways (DfT, 2015b; DfT, 2015c). These estimates are based on traffic counts from the rotating census and core census surveys.
A consistent time series of vehicle km data for 1993 to 2014 by road type and vehicle type for England, Wales and Scotland was provided
by DfT (DfT, 2015b). Vehicle km data for 1993 was scaled to derive the 1990 values for England, Wales and Scotland, based on the GB trend
between 1990 and 1993.
Vehicle kilometre data for Northern Ireland by vehicle type and road class are provided by DRDNI (2014). 2014 data was not available from
this source so this is estimated by scaling the 2013 NI data based on the 2013 to 2014 trend from the DfT National Traffic Census. Data for
1990-2007 is scaled based on the 2008 data from the DRDNI (2014)using the following datasets: Dept of Regional Development (NI: 1990-
1999), Traffic Census Report (NI: 2000), Vehicle Kilometres of Travel Survey of Northern Ireland Annual Report (NI: 2001), Traffic and Travel
Information, DRDNI (NI: 2002- 2007). Motorcycle vehicle km data were not available from the DRDNI and so they were derived based on
the ratio of motorcycles registered in Northern Ireland relative to GB each year. The ratios were then applied to the motorcycle vehicle km
activity data for GB.
Estimation of Emissions of Methane and Nitrous Oxide
Emissions of methane and nitrous oxide from road transport in the regions are calculated by combining the vehicle emission factors, fleet
composition data and vehicle kilometre data for the different vehicle, fuel and road types. The emissions from petrol and diesel vehicles in
each DA are normalised so that the totals across all DAs equal the UK emissions calculated for the pollutant and fuel type.
Estimation of Road Transport Carbon Dioxide Emissions
Road transport has been a very significant and growing source of carbon dioxide across all of the constituent countries of the UK.
For the purposes of the UK’s reporting to the UNFCCC on greenhouse gas emissions under the Kyoto Protocol, the UK is required to use
estimation and reporting methodologies that comply with IPCC guidance. The recommended methodology for estimation of carbon dioxide
emissions from road transport sources applies the principle of political responsibility for emissions, whereby fuel sales data are used as the
basis for the estimates. In this way, across a group of countries such as the Member States of the EU, there is no risk of double-counting
road transport carbon dioxide emissions due to the use of different estimation methodologies2.
Therefore, for the purposes of reporting to the UNFCCC and the determination of progress towards Kyoto Protocol emission reduction
targets, the UK uses fuel sales data as the basis for carbon dioxide emission estimates from road transport in the National Inventory
2 Note that the UK methodology for estimating emissions of methane and nitrous oxide from road transport sources is based on vehicle kilometre data, in
accordance with IPCC guidance.

Appendix 2: Devolved Administrations’ GHG Inventory Compilation Methods and Data Sources
Greenhouse Gas Inventories for England, Scotland, Wales and Northern Ireland: 1990-2014 27
Report. However, for the purposes of compiling the Devolved Administration GHG inventories, the use of regional fuel sales data is
problematic due to a couple of key issues:
Cross-border fuel sales - This factor is especially evident in Northern Ireland, where the price differential between fuel in the UK
and the Republic of Ireland may have encouraged purchase of fuel from outside of the UK (BERR: Personal Communication,
2004);
Supermarket fuel sales - Where a supermarket chain purchases its fuel from storage facilities in England and then sells the fuel in
other parts of the UK, the emissions from that fuel sold will be incorrectly attributed to England. Although this is known to be a
potential source of inconsistency in the reporting of regional fuel sales from supermarkets, it is also likely to be evident across
other economic sectors too (BERR: Personal Communication, 2004).
Adopting the IPCC estimation method of using fuel sales data in each DA produces carbon dioxide emission trends from road transport in
Northern Ireland and Scotland that buck the UK trend of increasing emissions with time, contrary to vehicle kilometre data that are
collected across the UK.
Table A2. 7: UK Fleet-averaged fuel consumption factors for road vehicles (in g fuel/km)
Source 1990 1995 2000 2005 2010 2013 2014
Petrol cars 56.3 55.8 54.8 54.9 54.0 52.3 51.6
Diesel cars 55.7 54.0 54.2 54.1 54.4 52.4 51.5
LGVs 77.9 78.7 77.6 74.8 74.6 73.5 72.7
HGVs 210 205 194 207 211 215 215
Buses and coaches 292 293 268 267 261 257 256
Mopeds and motorcycles 36.2 37.0 38.0 36.9 35.9 35.0 34.9
Table A2. 8: Methane and Nitrous Oxide Implied Emission Factors for Road Transport (in mg/km)
Pollutant Source 1990 1995 2000 2005 2010 2013 2014
CH4 Petrol cars 108.4 84.4 53.2 31.9 17.8 14.3 13.5
DERV cars 16.8 12.1 7.6 2.7 1.0 0.6 0.5
LGVs 76.7 51.9 24.8 7.4 2.8 1.8 1.6
HGVs 73.3 72.1 64.2 63.1 36.6 19.7 15.7
Buses and coaches 127.2 135.1 108.5 90.3 50.7 30.5 25.9
Mopeds and motorcycles 201.3 201.0 187.2 152.5 109.8 93.3 87.9
N2O Petrol cars 8.0 13.6 11.0 7.2 2.8 1.9 1.7
DERV cars - 1.9 3.7 5.8 6.3 6.4 6.4
LGVs 5.2 4.1 4.9 5.9 6.2 6.2 6.2
HGVs 30.0 23.9 13.4 8.1 17.2 31.3 34.4
Buses and coaches 30.0 25.3 15.4 8.8 13.7 20.7 23.2
Mopeds and motorcycles 1.9 1.9 1.9 1.9 1.9 2.0 2.0
In order to provide a more representative assessment of transport emission trends of carbon dioxide within the constituent countries of
the UK, the approach is either directly using regional vehicle km data to estimate road transport carbon dioxide emissions in each DA or
using regional vehicle km data as a means to proportion the total UK road transport carbon dioxide emissions between each DA region.
They are described in the following sections:
Disaggregation of UK Carbon Dioxide Emissions by DA: Constrained Method:
In this method the sum of the DA inventories for carbon dioxide are constrained to meeting the total of the UK inventory for road transport
which for carbon dioxide is derived from UK fuel sales data for petrol and DERV from DECC. The vehicle km data for each region are used to
provide an estimated allocation of the total UK road transport emissions across the constituent countries. In constraining to sum to the
national totals, this approach is consistent with that adopted across every other source sector in the DA GHG inventories.

Appendix 2: Devolved Administrations’ GHG Inventory Compilation Methods and Data Sources
Greenhouse Gas Inventories for England, Scotland, Wales and Northern Ireland: 1990-2014 28
However, the criticism of this method is that the presentation of results does not always provide a carbon dioxide emission trend for the DAs
that is directly consistent with the vehicle kilometre trend data, as the fluctuations in UK fuel data (from DECC) have a more significant impact
on the resultant emission trends.
Direct Calculation of DA Emissions: Unconstrained Method:
In this method, carbon dioxide emissions from constituent countries are derived directly from the regional vehicle km data and are not
constrained to the UK totals based on national fuel consumption data. This method removes any year to year fluctuations caused by the
normalisation process and enables the emission trends to mirror the smooth trends in vehicle km.
The difference in results between the constrained and unconstrained methods at DA level largely reflects the difference in the results at UK
level between bottom-up calculated fuel consumption using vehicle km data and fuel consumption factors and the fuel sales data in
DUKES. The reason for a disparity has previously been attributed to cross-border fuel sales (“fuel tourism”) although model uncertainty was
always emphasised as an additional, and probably a major explanation for the differences.
Any change in the methodologies or the factors used to calculate fuel consumption will affect the magnitude of the difference between
calculated fuel consumption at national level and sales figures from DUKES and so, in turn, it will affect the disparity between the DA
carbon dioxide emissions from the constrained and unconstrained approaches. In 2014, the bottom-up method underestimates petrol and
diesel consumption by 7.7% and 4.8% respectively.
The trend in road transport carbon dioxide emissions for each DA and the UK calculated by the constrained and unconstrained methods
across the time series is shown in Appendix 7. Note that in the table, figures labelled “vkm” refer to the unconstrained method; figures
labelled “Fuel sales” refer to the constrained method. Further details on the fuel consumption vs. fuel sales reconciliation issue and
normalisation procedure applied at UK level are given in Brown et al. (2016).
Note that emissions of methane and nitrous oxide both at UK level and for the DAs are calculated directly from vehicle km data and
emission factors, and then are also normalised to match the fuel sales data involved.
Disaggregation of Emissions from LPG fuel Use
All emissions from LPG-fuelled vehicles are disaggregated based on the supply infrastructure that has developed in recent years to provide
for this relatively new market. Information on LPG fuel supply stations was obtained from the Energy Saving Trust website, and the number
of stations per DA has been used as an activity parameter to distribute UK-based emission figures for LPG consumption across each DA. It is
hoped that in future years, actual LPG sales data by DA may become available to provide a more accurate methodology, though it should
be noted that consumption of LPG as a transport fuel is still very small in comparison with consumption of petrol and diesel and has been
declining from levels reached in 2008.
Emissions of methane and nitrous oxide from LPG consumption are calculated based on an estimate of the number of vehicles and
distances travelled using this fuel.
Carbon emissions of LPG and lubricants burnt in engines are very small relative to emissions from the combustion of petrol and DERV.
A2.6.4 Railways
In accordance with the UK inventory, diesel rail emissions are compiled for three journey types: freight, intercity and regional for the DA
regions. The allocation to different areas is based on information available from DfT’s Rail Emissions Model (REM). This information was
provided to the inventory team by direct communication with DfT (2012).
The REM covers all passenger train movements on the Great Britain rail network and provides engine kilometres by train class and by
strategic route and is based on detailed information from published passenger rail timetables and Network Rail. The passenger rail
movements cover 25 different train operating companies and have been calibrated against total train kilometres figures for 2009/10 taken
from ORR’s National Rail Trends Yearbook (ORR, 2010). The fuel consumption and emission factors were supplied to the REM by WS Atkins
Rail.
REM combines the passenger train activity data with the emission factor information to provide emission estimates for each strategic route
in Great Britain, which have then been allocated by the inventory team to England, Scotland and Wales. As outlined above, the most recent
year in REM is currently 2009/10 and it has been assumed that the same split between the regions applies to other years. The passenger
rail sector is fairly static and there are no large changes in emissions year to year and therefore in the absence of other data, this is a
reasonable assumption. With the current rail electrification programme, this will not however be appropriate going forward.

Appendix 2: Devolved Administrations’ GHG Inventory Compilation Methods and Data Sources
Greenhouse Gas Inventories for England, Scotland, Wales and Northern Ireland: 1990-2014 29
Activity data for Northern Ireland is provided directly by Translink (Stewart, 2012) and the emissions arising are calculated separately and
therefore this data is directly available from the UK inventory. Since 2002, the data provided covers passenger trains only as there has been
no freight activity in Northern Ireland since this date.
Limited freight data is currently available from REM. Therefore data from a previous version of REM has been used to calculate the split in
emissions by DA using the same approach as undertaken for passenger trains and then these figures have been applied to the 2014 UK
inventory data.
A2.7 Other Sectors
A2.7.1 Commercial & Institutional
Emissions estimates for the source categories “public administration” and “miscellaneous and commercial” have previously been based on
regional proxy activity data including GVA (as a broad indicator of economic activity across the DAs) or regional employment statistics.
Similar to the source categories for small-scale industry and the domestic sector, there is very little detailed solid or liquid fuel use data for
these sectors and hence the estimates are subject to greater uncertainty than well-documented sectors (i.e. energy-intensive industries).
The DECC sub-national energy statistics (DECC, 2015b), provide estimates of fuel use by Local Authority for each of these sectors, split by
solid fuel types and “oil”. These data are estimates that are based on (i) local electricity and gas meter data, and (ii) modelled estimates of
the distribution of solid and liquid fuels using proxy data, concessionary coal data and information on smoke control zones. The estimation
methodology follows a similar method to that described for other industrial combustion. For gas oil, coal and gas, the available point
source emissions data and fuel use data from EU ETS and the pollution inventories have been analysed to allocate emissions to the DAs.
The remaining emissions are allocated to the DAs using the energy modelling approach consistent with the DECC sub-national energy
statistics.
National gas sales data for the commercial sector were previously reported by (DTI, 2001), but for later years (1995 to date) UK National
Grid has provided data for regional gas use in the 73-732 MWh range. The UK National Grid source provides the closest data available for
commercial and institutional consumers, but the total is lower than UK data reported by DECC (2015a). These data are used to distribute
miscellaneous and public service gas use in GB.
Natural gas use data for Northern Ireland are supplied by Airtricity (formerly Phoenix Gas) for 1999 onwards (Airtricity, 2015), Firmus
Energy providing sales data for 2005 onwards (Firmus Energy, 2015) and Vayu Ltd providing sales data for 2010 onwards (Vayu, 2015). The
commercial consumption is used as an estimate for Northern Ireland miscellaneous and public service gas consumption. A more detailed
split of gas use across the domestic, commercial and industrial sectors in Northern Ireland in recent years has been provided by Airtricity,
and expert judgement has been used to estimate the overall allocation of gas use to these sectors from the total gas sales data for
Northern Ireland.
Consultation with DFPNI has led to the provision of detailed energy data from public sector energy reports from 2002 to 2009 and 2014,
covering all fuels (including electricity) used in public sector buildings in Northern Ireland. The Public Sector Energy Campaign (PSEC) data
have been used to replace previous estimates of fuel use in that sector, for most (but not all) fuels. The data scope covers building energy
use and is a close match to the DUKES category description, and therefore the data have been used directly to inform gas and solid fuel use
within the public sector in Northern Ireland. The reported gas oil use in the PSEC report is significantly higher than that currently reported
for the UK as a whole; in the UK GHGI programme, the limited data on gas oil has been identified as problematic and these data from PSEC
should now also be taken into consideration to help inform future gas oil allocations to the public sector. In the current NI inventory,
therefore, there is a small under-report in public sector emissions due to this discrepancy. However, for other fuels the use of the PSEC
data provides a more accurate estimate of sector emissions and trends.
Stationary combustion by the railway sector is classified as a commercial source. Consumption of burning oil, fuel oil, and coke is relatively
insignificant, and has therefore been allocated according to the diesel oil driver used for locomotives. Natural gas consumption for
electricity generation refers to the London Underground (Lotts Road power station – closed in 2001).
DECC (2015a) reports a small amount of solid waste (municipal, industrial & hospital) consumption for energy production in the
commercial and miscellaneous sectors. Little is known about the distribution of these installations, but the emissions have been distributed
using the split derived for MSW incinerators.
Table A2. 9: Other Sectors (Base Year – 1990)
IPCC Category NAEI Sources Activity: Fuel Consumption
Data used for deriving DA estimates from UK totals / Comments
Coal DECC Sub-national energy statistics

Appendix 2: Devolved Administrations’ GHG Inventory Compilation Methods and Data Sources
Greenhouse Gas Inventories for England, Scotland, Wales and Northern Ireland: 1990-2014 30
IPCC Category NAEI Sources Activity: Fuel Consumption
Data used for deriving DA estimates from UK totals / Comments
Commercial & Institutional
Miscellaneous, Public service
SSF DECC Sub-national energy statistics
Natural gas Commercial Sales, DECC.
Landfill gas Landfill methane emissions
Sewage gas Sewage methane recovered
fuel oil, gas oil DECC Sub-national energy statistics
MSW As MSW incinerators
Burning oil DECC Sub-national energy statistics
Railways (Stationary)
Oils and coal Sub-national oil consumption, DECC
Natural gas Assumed as all England
Residential Domestic
Wood3 Domestic wood mapping grid
Peat Domestic peat consumption data, CEH
SSF, coke, LPG Sub-national energy statistics, NI HECA, DECC & Housing Condition Survey data, census data
Natural gas Domestic Gas data, DECC
Burning oil, gas oil, Sub-national energy statistics (oil), DECC & Housing Condition Survey data, NI HECA, census data
Coal, anthracite Sub-national energy statistics (coal, anthracite), DECC & Housing Condition Survey data, NI HECA, census data
Fuel oil Regional population, ONS
House & Garden DERV, petrol Regional dwellings, ONS
Agriculture, Forestry & Fishing
Agriculture – stationary combustion
coal, coke, natural gas
Agricultural employment, MAFF
burning oil, gas oil, fuel oil
DECC Sub-national energy statistics
Straw3 Wheat production, MAFF
Agricultural mobile machinery
Gas oil, petrol Agricultural off-road mapping grid
3 Used to calculate non-CO2 emissions

Appendix 2: Devolved Administrations’ GHG Inventory Compilation Methods and Data Sources
Greenhouse Gas Inventories for England, Scotland, Wales and Northern Ireland: 1990-2014 31
Table A2. 10: Other Sectors (1995; 1998 to 2014)
IPCC Category NAEI Sources Activity: Fuel Consumption
Data used for deriving DA estimates from UK totals / Comments
Commercial & Institutional
Miscellaneous, Public service
Coal DECC Sub-national energy statistics, point source data and energy modelling data, including EU ETS data and PI/SPRI/NIPI data, PSEC data.
SSF DECC Sub-national energy statistics
Natural gas
Natural gas consumed (DECC, 2015a), Airtricity, Firmus, Vayu, PSEC data. GB estimates from point source data (including EU ETS) and energy modelling data (including Display Energy Certificate data, employment and IDBR data)
Landfill gas Landfill methane emissions
Sewage gas Sewage methane recovered
Fuel oil, gas oil DECC Sub-national energy statistics, analysis of point source data and energy modelling data, including EU ETS, PI/SPRI/NIPI data, PSEC data
MSW As MSW incinerators
Burning oil DECC Sub-national energy statistics, PSEC data (DFPNI, 2015)
Railways (Stationary)
Oil and coal Regional gas oil consumption, Network Rail (GB) and Translink (NI)
Natural gas Assumed as all England
Residential Domestic
Wood4 Domestic wood mapping grid
Peat Domestic peat consumption data, CEH
SSF, coke, LPG Sub-national energy statistics (SSF), DECC, 2011 mapping grid, scaled using Housing Condition Survey data, NI HECA, DEMScot model, census data
Natural gas Domestic Gas sub-national split for GB from DECC, Transco & UK gas network operators, Data from Airtricity, Vayu Ltd. and Firmus Energy (NI)
Burning oil, gas oil, Sub-national energy statistics (oil) from DECC, 2011 mapping grid scaled using Housing Condition Survey data, NI HECA, DEMScot model, census.
Coal, anthracite Sub-national energy statistics (coal, anthracite), DECC, 2011 mapping grid scaled using Housing Condition Survey data, NI HECA, DEMScot model, census.
Fuel oil Regional population, ONS
House & Garden DERV, petrol Regional dwellings, ONS
Agriculture, Forestry & Fishing
Agriculture – stationary combustion
coal, coke, natural gas
Agricultural employment, MAFF/Defra
burning oil, gas oil, fuel oil
DECC Sub-national energy statistics
Straw4 Wheat production, MAFF/Defra
Agricultural mobile machinery
Gas oil, petrol Agricultural off-road mapping grid
4 Used to calculate non-CO2 emissions

Appendix 2: Devolved Administrations’ GHG Inventory Compilation Methods and Data Sources
Greenhouse Gas Inventories for England, Scotland, Wales and Northern Ireland: 1990-2014 32
A2.7.2 Residential
Annual gas use data estimates for the residential sector are provided by the gas suppliers in Northern Ireland (Airtricity, 2015; Firmus
Energy, 2015; Vayu Ltd, 2015) and these data have been used to estimate the residential emissions in 2014. The gas use estimates for
Scotland, Wales and England are derived from the DECC sub-national energy statistics (DECC, 2015b) which presents a breakdown of gas
use by Local Authority for the domestic and non-domestic sectors. Whilst the DECC sub-national energy statistics data are not directly
consistent with the published UK gas use statistics for the sector, the DA share from these GB data are used to inform the gas use and
emissions in Scotland, Wales and England corrected to the DUKES annual domestic gas data minus the Northern Ireland gas supplier
estimates. Domestic natural gas consumption data is estimated for GB using the split presented in the DECC sub-national energy statistics
for 2005 onwards (DECC, 2015b) whilst data for earlier years draws upon regional data obtained from Transco and other GB gas supply
network operators.
The domestic sector DA method for the non-gas fuels does introduce uncertainty to the overall sector estimates, especially for Northern
Ireland where the gas grid is limited and hence a higher proportion of the sector relies upon solid and liquid fuels. The maps and peat data
only provide snapshots of analysis for the latest year and where large revisions to previous mapping grid data are evident, the DA inventory
compilation must consider the impacts on time-series consistency for the sector as a whole. In order to enable a sector-wide quality check
on the time-series data for the sector, estimates of the energy allocations in the sector across all fuels were derived (including estimated
electricity use in each DA in the domestic sector).
Using the time series of population data, the energy use estimates per capita were calculated, in order to review the relative energy
intensity per head across the time series for each DA. This is a quality check of limited usefulness given the variability in housing stock, fuel
availability (e.g. on gas grid or not) climatic considerations and inter-annual variations of factors such as fuel price and average
temperature which will all affect the local energy use in the sector. Further research is recommended to further develop the domestic
sector dataset for each of the DAs, as this is a sector where DA policy levers can have a large impact and currently the evidence base for the
energy use in the sector is uncertain.
The domestic sector emission estimates for non-gas fuels were revised in the 1990-2013 DA GHGI dataset to reflect the improvements
made in energy and emissions modelling from the full integration of the 2011 census data from all UK households, which has now become
available for all countries. The census data has provided much more detail regarding the primary and secondary fuel use by household, and
together with records of houses built in each DA, on- and off-gas-grid, the estimates of fuel-specific energy use have been extrapolated
back and forth to cover the 2005-2014 dataset required for Local Authority level emissions reporting. This approach is used for coal,
anthracite, gas oil and burning oil. The estimates from 2005 have been extrapolated back across the time series to reflect the overall
estimated energy demand for each DA, constrained by the UK fuel use totals in DUKES.
The consumption of fuel oil by the domestic sector is a very small amount, and is distributed simply according to population (ONS, 2015).
Domestic use of wood is estimated across the time-series using the latest mapping grid information on wood use (NAEI, 2011). Domestic
peat use estimates by DA are provided by the Centre for Ecology & Hydrology and were updated significantly in the 1990-2014 inventory
(Personal Communication: CEH, 2015).
A2.7.3 Agriculture, Forestry & Fisheries
Emissions from solid fuel use in the agriculture sector are not very significant, whilst regional gas use data in this sector are not available
for Great Britain; in Northern Ireland the gas suppliers do provide an estimate of gas use in the agriculture sector and these data are used
directly to inform Northern Ireland emission estimates for gas use, whilst in GB the emissions from agricultural sources are allocated on the
basis of regional employment figures from Defra (2015a).
Work by Ricardo Energy & Environment to derive a more detailed split of regional off-road fuel use (i.e. mainly gas oil use in tractors and
other mobile machinery) has utilised research to determine the regional distribution of different land uses and farm types (pasture, arable,
forestry). These data have been combined with data on the intensity of mobile machinery use by farm type (tractor hours per hectare of
arable land, tractor hours per head of livestock), annually reviewed and updated in the NAEI cycle and reported in the NIR and IIR, to derive
an agricultural off-road mapping grid to estimate geographical distribution of fuel use in the sector (Murrells, et al., 2011) (Netcen, 2004)
(Tsagatakis, et al., 2013). These data have been used to estimate DA GHG emissions from agricultural mobile machinery.

Appendix 2: Devolved Administrations’ GHG Inventory Compilation Methods and Data Sources
Greenhouse Gas Inventories for England, Scotland, Wales and Northern Ireland: 1990-2014 33
A2.7.4 Military
Emissions from military aircraft and naval vessels are allocated across the DAs based on regional GVA data (ONS, 2015). Army vehicle
emissions are included within road transport data and other army emissions are included within public service categories but are not
clearly defined.
A2.8 Fugitive Emissions from Fuels
A2.8.1 Coal Mining
Methane emissions arise from coal mining activities. Emissions from operating mines are estimated based on the amounts of deep mined
and open cast coal produced. DA inventory estimates are based on regional coal production derived from a number of sources: Coal
Authority (2015), BGS (2015), WO (1998), SO (1999), BERR (1996, Personal Communications). A small emission occurs from coal storage
and transport, which is based on deep mined coal production. Data suggests that only small amounts of coal are transported outside of the
region of production and no attempt has been made to allow for this. Hence coal storage and transport emissions are distributed according
to deep-mined production (Coal Authority, 2015).
DA estimates of methane emissions from abandoned coal mines are based on research undertaken by WSP (2011) on behalf of DECC,
which uses a site-specific approach to estimating the methane content of seams, and rates of water ingress and methane emissions.
A2.8.2 Solid Fuel Transformation
For coke ovens, three fugitive emissions are estimated:
A ‘residual’ emission of CO2 which reflects the difference between the carbon input to the coke oven and the carbon content of the coke and coke-oven gas produced;
Emissions from the flaring of coke-oven gas;
Emissions of methane from the process.
These are disaggregated based on the regional consumption of coking coal and site-specific fuel use data from EU ETS (for 2005 onwards),
as discussed in Section A2.2.3. For solid smokeless fuel (SSF) plant, the only fugitive emissions estimated are the ‘residual’ CO2 emission
and some process methane. The driver used is that for regional consumption of coal by SSF plant (see Section A2.2.3). It is known that
some petroleum coke is used in SSF production but the amount is uncertain. The same driver is applied to the petroleum coke
consumption.
A2.8.3 Oil and Natural Gas
All emissions from the oil & gas exploration and production industry that occur offshore are reported within the DA GHGI data as
unallocated. Emissions from onshore oil and gas terminals in England, Wales and Scotland and from a small number of on-shore oil and gas
fields, are based on operator reported data.
The estimates of terminal flaring and venting emissions are based on DECC (2015d) EEMS data for 1995, 1998-2014. Data is unavailable for
1990, so these are extrapolated based on flaring volumes reported in 1998 as the earliest year of EEMS where data are complete and
consistent.
The 2000-2014 UK GHG inventories include a correction to account for flaring on onshore oil and gas fields excluded by the DECC EEMS
inventory. Onshore flaring volumes are obtained from DECC sources (DECC, 2015d). Their significance in the UK national GHG inventory is
minimal, but the data is more significant for the DA GHG inventories. Wytch Farm, which lies a few miles off the south coast of England, is
classified as on-shore for this purpose.
The DECC EEMS inventory data provides data for fugitive emissions of carbon dioxide and methane from terminals for 1998-2014. Methane
emissions arise from venting, oil storage and tanker loading and unloading, whilst carbon dioxide emissions arise from venting and
processes. The DA estimates from operator reporting in 1998 are used to back-cast the DA share of UK emission totals for fugitive sources
including: oil terminal storage, onshore oil loading, process emissions. Estimates provided by the trade association in 1999 (UKOOA, 1999)
are used to derive the DA share of UK emissions from venting sources in 1995, with the 1995 DA share used to back-cast to 1990. Flaring
volumes at oil and gas terminals and onshore production fields are available from DECC back to 1990.
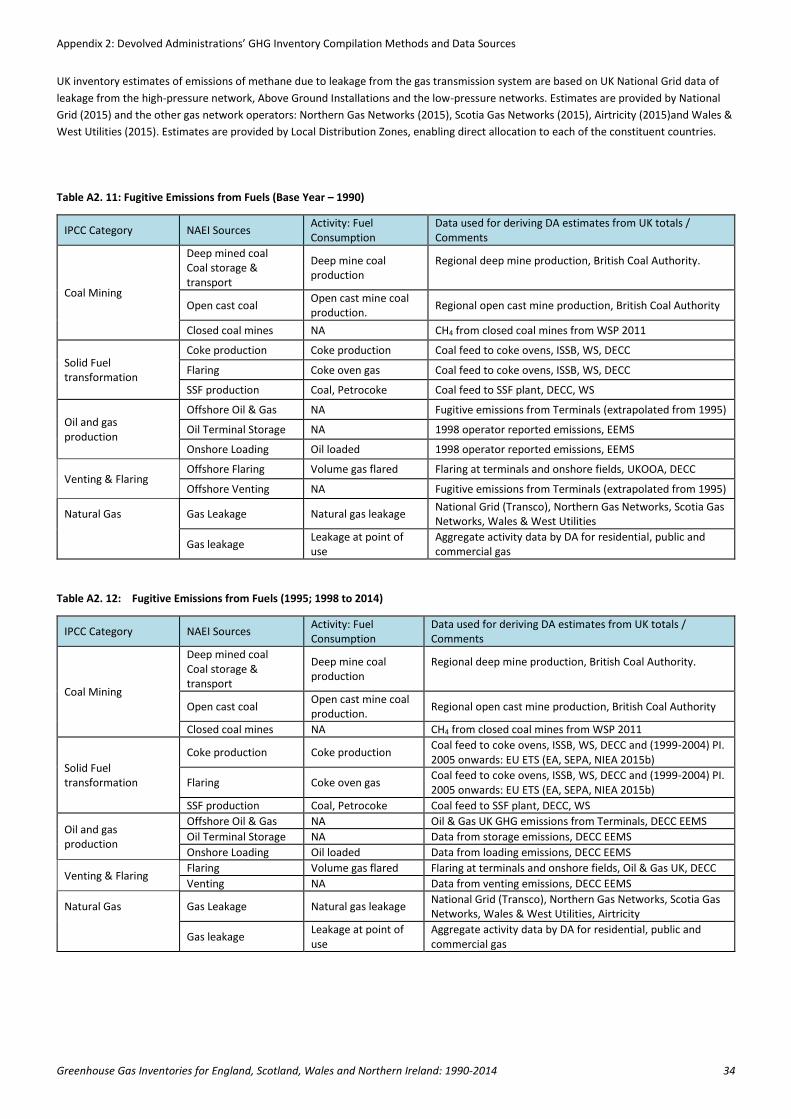
Appendix 2: Devolved Administrations’ GHG Inventory Compilation Methods and Data Sources
Greenhouse Gas Inventories for England, Scotland, Wales and Northern Ireland: 1990-2014 34
UK inventory estimates of emissions of methane due to leakage from the gas transmission system are based on UK National Grid data of
leakage from the high-pressure network, Above Ground Installations and the low-pressure networks. Estimates are provided by National
Grid (2015) and the other gas network operators: Northern Gas Networks (2015), Scotia Gas Networks (2015), Airtricity (2015)and Wales &
West Utilities (2015). Estimates are provided by Local Distribution Zones, enabling direct allocation to each of the constituent countries.
Table A2. 11: Fugitive Emissions from Fuels (Base Year – 1990)
IPCC Category NAEI Sources Activity: Fuel Consumption
Data used for deriving DA estimates from UK totals / Comments
Coal Mining
Deep mined coal Coal storage & transport
Deep mine coal production
Regional deep mine production, British Coal Authority.
Open cast coal Open cast mine coal production.
Regional open cast mine production, British Coal Authority
Closed coal mines NA CH4 from closed coal mines from WSP 2011
Solid Fuel transformation
Coke production Coke production Coal feed to coke ovens, ISSB, WS, DECC
Flaring Coke oven gas Coal feed to coke ovens, ISSB, WS, DECC
SSF production Coal, Petrocoke Coal feed to SSF plant, DECC, WS
Oil and gas production
Offshore Oil & Gas NA Fugitive emissions from Terminals (extrapolated from 1995)
Oil Terminal Storage NA 1998 operator reported emissions, EEMS
Onshore Loading Oil loaded 1998 operator reported emissions, EEMS
Venting & Flaring Offshore Flaring Volume gas flared Flaring at terminals and onshore fields, UKOOA, DECC
Offshore Venting NA Fugitive emissions from Terminals (extrapolated from 1995)
Natural Gas Gas Leakage Natural gas leakage National Grid (Transco), Northern Gas Networks, Scotia Gas Networks, Wales & West Utilities
Gas leakage Leakage at point of use
Aggregate activity data by DA for residential, public and commercial gas
Table A2. 12: Fugitive Emissions from Fuels (1995; 1998 to 2014)
IPCC Category NAEI Sources Activity: Fuel Consumption
Data used for deriving DA estimates from UK totals / Comments
Coal Mining
Deep mined coal Coal storage & transport
Deep mine coal production
Regional deep mine production, British Coal Authority.
Open cast coal Open cast mine coal production.
Regional open cast mine production, British Coal Authority
Closed coal mines NA CH4 from closed coal mines from WSP 2011
Solid Fuel transformation
Coke production Coke production Coal feed to coke ovens, ISSB, WS, DECC and (1999-2004) PI. 2005 onwards: EU ETS (EA, SEPA, NIEA 2015b)
Flaring Coke oven gas Coal feed to coke ovens, ISSB, WS, DECC and (1999-2004) PI. 2005 onwards: EU ETS (EA, SEPA, NIEA 2015b)
SSF production Coal, Petrocoke Coal feed to SSF plant, DECC, WS
Oil and gas production
Offshore Oil & Gas NA Oil & Gas UK GHG emissions from Terminals, DECC EEMS
Oil Terminal Storage NA Data from storage emissions, DECC EEMS
Onshore Loading Oil loaded Data from loading emissions, DECC EEMS
Venting & Flaring Flaring Volume gas flared Flaring at terminals and onshore fields, Oil & Gas UK, DECC
Venting NA Data from venting emissions, DECC EEMS
Natural Gas Gas Leakage Natural gas leakage National Grid (Transco), Northern Gas Networks, Scotia Gas Networks, Wales & West Utilities, Airtricity
Gas leakage Leakage at point of use
Aggregate activity data by DA for residential, public and commercial gas

Appendix 2: Devolved Administrations’ GHG Inventory Compilation Methods and Data Sources
Greenhouse Gas Inventories for England, Scotland, Wales and Northern Ireland: 1990-2014 35
A2.9 Industrial Processes These sources report process and fugitive emissions from industrial processes as opposed to the emissions from fuel combustion used to
provide energy to these processes. (Table A2. 2 covers combustion emissions.) The drivers used for process and fugitive industrial releases
are summarised in Table A2.11.
A2.9.1 Minerals Industries
Large emissions of carbon dioxide arise from the degradation of limestone used in cement and lime kilns. Cement emissions are estimated
from the production of cement clinker, with regional emission estimations based on plant capacity data supplied by the British Cement
Association5 (2004) for 1990 to 2001. From 2002 to 2007, the regional split is based on reported emissions from the PI, SPRI and NIPI,
whereas in 2008 to 2014 all cement sites now report under EU ETS and hence the emissions from combustion and process sources by site
are derived from EU ETS data (EA, 2015b; SEPA, 2015b; NIEA, 2015b). Through discussions with environmental regulators it has been
determined that lime calcination only occurs in England.
Limestone and dolomite are also used in iron and steel production. Information from operators indicates that it would be impossible to
identify all the different uses of limestone and dolomite in iron and steel making. The major use is in blast furnaces, and so emissions have
been disaggregated based upon regional iron production figures (ISSB, 2015).
Limestone, dolomite and soda ash are also used in glass production. Emissions were previously disaggregated using plant capacity and
carbon dioxide emissions data from British Glass for 1990, 1995, 1998 and subsequently extrapolated for 1999 and 2000. However, the
improvement of data supplied via the Pollution Inventory (EA, 2015a) has enabled more accurate disaggregation for the years 2000 and
2001. Historical data has therefore been revised where appropriate and the Pollution Inventory data now provides a more accurate
methodology for regional disaggregation of UK data from 2002 onwards.
The 2009 to 2014 EU ETS datasets contain a much greater coverage of sites and emission sources (combustion and process) from the glass
industry, which are now used to inform time series estimates of DA activity and emissions. Previously the DA allocation of emissions from
the glass sector was based on site information on production capacity, but access to fuel use data for 2009 to 2014 has enabled these
assumptions to be over-written with fuel-specific DA allocations.
The inventory also reports carbon dioxide and methane emissions from Fletton brick production, as introduced in 2000. These bricks are
made from Fletton clay which contains a significant amount of naturally occurring carbonaceous material and all such production occurs in
England.
A2.9.2 Chemical Production
The UK Inventory reports emissions of carbon dioxide from ammonia production; nitrous oxide from adipic acid production and nitrous
oxide from nitric acid production. Following the closure of a (nitric acid) fertiliser plant in Belfast in late 2001, all of the nitric acid, ammonia
and adipic acid plants are within England. Prior to that, plant capacities for nitric acid production facilities were used to estimate the split in
UK chemical production GHG sources. The adipic acid plant in England ceased production in 2009.
Table A2. 13: Industrial Processes (Base Year – 1990)
IPCC Category NAEI Sources Activity Data Data used for deriving DA estimates from UK totals / Comments
Cement Production Cement (decarbonising) Clinker production Regional cement production capacity, BCA
Lime Production Lime (decarbonising) Limestone consumption All such plant located in England
Limestone and Dolomite Use
Glass production Limestone and dolomite consumption
Regional glass production, British Glass
Blast Furnaces Limestone and dolomite consumption
Iron production, ISSB
Soda Ash Production and Use
Glass production Soda Ash Consumption Regional glass production, British Glass
Mineral Products: Other Fletton Brick Production Fletton Brick Production All such plant located in England
Ammonia Production Ammonia feedstock Natural gas feedstock and fuel All such plant located in England
5 Production capacity data are used for cement emissions as the actual annual production data from cement plant are commercially confidential.

Appendix 2: Devolved Administrations’ GHG Inventory Compilation Methods and Data Sources
Greenhouse Gas Inventories for England, Scotland, Wales and Northern Ireland: 1990-2014 36
IPCC Category NAEI Sources Activity Data Data used for deriving DA estimates from UK totals / Comments
Nitric Acid Production Nitric Acid Production Plant capacity Regional plant capacity
Adipic Acid Production Adipic Acid Production Adipic acid made All such plant located in England
Chemical Industry: Other Methanol Production Production of Methanol All such plant located in England
Petrochemical and carbon black production
Ethylene Production Production of Ethylene
Plant capacities, extrapolated back from PI /SPRI or EU ETS data
Carbon black production Production of carbon black
Ethylene dichloride production
Ethylene dichloride production
Acrylonitrile production Acrylonitrile production
Ethylene oxide production Ethylene oxide production
Chemical industry other NA
Titanium dioxide production Titanium dioxide production Coke oven coke / petcoke use All such plant located in England
Iron and Steel
Electric Arc Furnace EAF steel production Regional EAF production, ISSB
Flaring Blast furnace gas Coke consumed in blast furnaces, ISSB, WO
Zinc production Zinc production Coke oven coke use All plant in England
Aluminium Production Aluminium production Primary aluminium produced Regional aluminium plant capacity, ALCAN
SF6 Used in Aluminium and Magnesium Foundries
SF6 Cover gas NA Regional consumption & sales data, EM industry report 1999
Halocarbon & SF6 By-Product Emissions
Halocarbon Production NA All such plant are located in England.
Refrigeration and Air Conditioning
Refrigeration NA Regional population, ONS
Supermarket Refrigeration NA Regional GDP, ONS
Mobile Air conditioning NA Vehicle Registration data, AEAT industry report 2003
Foam Blowing Foams NA Regional population, ONS
Fire Extinguishers Fire fighting NA Regional population, ONS
Aerosols Metered Dose Inhalers NA Regional population, ONS
Aerosols (halocarbons) NA Regional population, ONS
Other Electronics NA Regional electronics plant consumption, EM industry report 1999
Training shoes NA Regional population, ONS
Military applications NA Regional population, ONS
Particle accelerators, NA Regional population, ONS
Electrical Insulation NA Regional electrical capacity, AEAT industry report 2003
N2O from product uses NA Regional population, ONS

Appendix 2: Devolved Administrations’ GHG Inventory Compilation Methods and Data Sources
Greenhouse Gas Inventories for England, Scotland, Wales and Northern Ireland: 1990-2014 37
Table A2. 14: Industrial Processes (1995; 1998 to 2014)
IPCC Category NAEI Sources Activity Data Data used for deriving DA estimates from UK totals / Comments
Cement Production Cement (decarbonising) Clinker production Point source data from EU ETS (2008 onwards), and the PI/SPRI/NIPI (EA, SEPA & NIEA).
Lime Production Lime (decarbonising) Limestone consumption All such plant located in England.
Limestone and Dolomite Use
Glass production Limestone and dolomite Regional glass production, BGlass. EU ETS (2009 onwards)
Blast Furnaces Limestone and dolomite Iron production, ISSB
Soda Ash Production and Use
Glass production Soda Ash Consumption Regional glass production, BGlass. EU ETS (2009 onwards)
Mineral Products: Other Fletton Brick Production Fletton Brick Production All such plant located in England
Ammonia Production Ammonia feedstock Natural gas feedstock All such plant located in England
Nitric Acid Production Nitric Acid Production Plant capacity Regional plant capacity, PI/SPRI/NIPI. Since 2002, all plant located in England.
Adipic Acid Production Adipic Acid Production Adipic acid made All such plant located in England
Chemical Industry: Other Methanol Production Production of Methanol All such plant located in England
Petrochemical and carbon black production
Ethylene Production Production of Ethylene
Plant Capacities, PI/SPRI/NIPI and EU ETS data. (All carbon black plant closed in 2009)
Carbon black production Production of carbon black
Ethylene dichloride production
Ethylene dichloride production
Acrylonitrile production Acrylonitrile production
Ethylene oxide production
Ethylene oxide production
Chemical industry other NA
Titanium dioxide production
Titanium dioxide production
Coke oven coke / petcoke use
All such plant located in England
Iron and Steel Electric Arc Furnace EAF steel production Regional EAF production, ISSB
Flaring Blast furnace gas Coke Consumed in blast furnaces, ISSB, WO
Zinc production Zinc production Coke oven coke use All plant in England
Aluminium Production Aluminium production Primary aluminium produced
UK plant production & emissions data, Alcan, Rio-Tinto, EA, SEPA
SF6 Used in Aluminium and Magnesium Foundries
SF6 Cover gas NA Regional consumption & sales data from industry reports compiled by EM & AEAT
Halocarbon & SF6 By-Product Emissions
Halocarbon Production NA All such plant are located in England.
Refrigeration and Air Conditioning
Refrigeration NA Regional population, ONS
Supermarket Refrigeration
NA Regional GDP, ONS
Mobile Air conditioning NA Vehicle Registration data, AEAT industry report 2003
Foam Blowing Foams NA Regional population, ONS
Fire Extinguishers Fire fighting NA Regional population, ONS
Aerosols Metered Dose Inhalers NA Regional population, ONS
Aerosols (halocarbons) NA Regional population, ONS
Other Electronics NA Regional electronics plant consumption, EM industry report 1999 & AEAT industry report 2003
Training shoes NA Regional population, ONS
Military applications NA Regional population, ONS
Particle accelerators, NA Regional population, ONS
Electrical Insulation NA Regional electrical capacity, AEAT industry report 2003
N2O production and bottling plant
NA All such plant are located in England (only operating since 2005).
N2O from product uses NA Regional population, ONS
The UK inventory reports emissions of GHGs from methanol production, ethylene production and the other chemical industry. Several
specific sectors of the chemical and petrochemical industry were split out for the first time in the 1990-2013 inventories due to the use of
the 2006 IPCC Guidelines; sources such as titanium dioxide and emissions from manufacture of ethylene oxide, ethylene dichloride, and

Appendix 2: Devolved Administrations’ GHG Inventory Compilation Methods and Data Sources
Greenhouse Gas Inventories for England, Scotland, Wales and Northern Ireland: 1990-2014 38
acrylonitrile are all now reported individually. The methanol plant is located in England, whilst ethylene production occurs in England,
Scotland and Wales. The chemical and petrochemical sector emissions are distributed based on data reported in the PI (EA, 2015a), SPRI
(SEPA, 2015a) and plant capacity. Emissions are extrapolated to 1990 and 1995 based on plant capacities. In many sectors, there are only
plants evident in England.
The emissions from the “other chemical industry” sector are disaggregated to England and Wales based on the site data in the Pollution
Inventory. Data on emissions from other chemical processes are not available for Scotland. Emissions of nitrous oxide from production and
bottling plant from one site operational in England since 2005 are based on emissions reported in the Pollution Inventory (EA, 2015a).
A2.9.3 Metal Production
In the iron and steel industry, emissions of carbon dioxide arise from electric arc furnaces through the consumption of the graphite anodes.
Regional data on steel production from electric arc furnaces is used to determine the regional drivers for this activity (ISSB, 2015).
The flaring of waste blast furnace gas is disaggregated according to the distribution of blast furnaces, using the driver derived for coal
consumption by blast furnaces (ISSB, 2015) up to 2004, and then using plant-specific data from the EU ETS for 2005 onwards (EA, 2015b;
SEPA, 2015b; NIEA, 2015b) verified using data from operators (Tata Steel, 2015).
Emissions of carbon dioxide from iron and steel making are estimated from a mass balance on the coke consumed in blast furnaces; the
blast furnace gas produced; the pig iron produced; the pig iron used in steel making and the crude steel produced. The emissions are
distributed using appropriate drivers for each source and sink taken from ISSB (2015) and on site-specific information for the integrated
steelworks taken from the EU ETS for 2005 onwards.
The electrolytic process used to produce aluminium results in a carbon dioxide emission as the petroleum coke anode is consumed.
Emission estimations are based on plant capacity data provided by Alcan (2015), for years up to 2002. The DA emissions data for 2003
onwards are based on PI and SPRI data (EA, 2015a; SEPA, 2015a). There have been some significant changes in the aluminium industry in
recent years, with the closure of the Kinlochleven plant in 2000, and the recent closures of the Anglesey Aluminium and then the
Lynemouth plant.
Emissions from zinc production were reported for the first time in the 1990-2013 DA GHG inventories, although the emissions are purely a
re-allocation due to revised methods in the 2006 IPCC Guidelines, which re-classifies use of coke oven coke use in zinc production to the
IPPU sector rather than as a fuel use in 1A2. All such manufacturing plant are known to have operated in England, and all were closed in
the late 1990s / early 2000s.
The anode baking process within aluminium production also results in emissions of PFCs, and estimates are provided by plant operators
(Rio Tinto Alcan, 2015).
A2.9.4 Use of Halocarbons and Sulphur Hexafluoride
The UK emissions of halocarbons and sulphur hexafluoride (SF6) were based on estimates from a model prepared initially by SKM Enviros
(1999). This model was updated by Ricardo (Haydock et al., 2003), with further updates at UK level for the refrigeration and air
conditioning sectors during 2008-9 (MacCarthy, 2010) and again during 2011 (Brown, et al., 2012). For some sources, the emission is equal
to the consumption of fluid (e.g. aerosols). For other sources the emissions occur during product manufacture, leakage during product
lifetime, and at product disposal (e.g. refrigerators). In these cases emissions are estimated from a time dependent model of the bank of
fluid held in products, accounting for unit production and disposal.
Data for HFC emissions from metered dose inhalers in the UK are now taken from NHS prescription records which are available for each DA
(Personal communication, Gluckman, 2014).
Supermarket refrigeration is regarded as sufficiently different from other refrigeration to warrant a separate study. Emissions are based on
a market review of the number and size of supermarkets in the regions, combined with discussions with gas manufacturers on the sales
into this sector. Discussions with supermarket owners also suggest that regional use could be approximately equated to sales volume,
which in turn could be approximated by regional GVA estimates, which have been obtained from ONS (2015). The DA GVA data are
therefore used to estimate the share of refrigeration emissions within the UK.
Air conditioning systems in cars began to use HFC134a from around 1993. Data is supplied by SMMT on regional sales of new cars. Initially,
installation of air conditioning was skewed towards company cars, which are broadly distributed according to population.
PFCs and SF6 are used to cushion the soles of some training shoes. Data have previously been gathered from discussions with
manufacturers. Sales figures for the devolved regions of the UK were not available, and therefore the regional split is made according to
population.

Appendix 2: Devolved Administrations’ GHG Inventory Compilation Methods and Data Sources
Greenhouse Gas Inventories for England, Scotland, Wales and Northern Ireland: 1990-2014 39
Sulphur hexafluoride is used in electrical switchgear within the electricity transmission system. UK estimates are based on discussions with
industry sources and summarised within the EM & Ricardo model. Regional estimates are determined through consultation with power
supply companies (NIE, Scottish Power & Scottish Electric, National Grid) and the Electricity Association.
For aerosols, the split by region is made on the basis of population, although use of these gases often has industrial applications. Making
the split using population has the advantage of making the data directly comparable with the figures for the baseline years of 1990 and
1995.
Other sources such as fire extinguishers are very small and are likely to be distributed with the general population.
Emissions of SF6 cover gas from magnesium production is based on regional sales and consumption data. This stable market is assessed
within the Ricardo model (AEA, 2004), with all production located in England & Wales.
Emissions data for regional emissions from semiconductor wafer manufacture are estimated from manufacturing data and consultation
with relevant trade associations, and incorporated within the Ricardo model (AEA, 2004). Within the 1990-2013 GHG inventories, for the
first time this source included emissions of NF3, which are estimated in the UK GHG inventory using a Tier 2 method from the 2006 IPCC
Guidelines. Other new minor sources include F-gases from military applications (AWACS), particle accelerators and N2O from product use,
all of which are disaggregated based on GVA.
A2.10 Agriculture Rothamsted Research provides all data and information pertaining to agricultural sources within the Devolved Administration emission
inventories. The UK inventory is disaggregated into the Devolved Administrations of England, Scotland, Wales and Northern Ireland, with
all default factors and emission factors carried over from the national inventory. The compilation of the emissions is carried out at DA level
and added up to national level.
A2.10.1 Agricultural Soils
Direct emissions of N2O from agricultural soils are estimated using the IPCC methodology (IPCC, 2006) and incorporating new country
specific emission factors (EFs) for some of the N2O sources as well as UK-specific parameters. The new EFs were derived from the Defra
funded project AC0116, with the same values applied to all the DAs.
The IPCC method involves estimating contributions from: the use of inorganic nitrogen fertilizers, application of livestock manures to land,
application of sewage sludge to land, urine and dung deposited by grazing animals in the field, crop residues returned to soils, net
mineralisation of soil organic matter, cultivation of histosols (organic soils). In addition to these, the following indirect emission sources are
estimated: emission of N2O from atmospheric deposition of agricultural NOx and NH3 and emissions of N2O from leaching and run-off of
agricultural nitrate.
Annual consumption of synthetic fertiliser is estimated based on crop areas from the DAs6 and application rates from the British Survey of
Fertiliser Practice (BSFP) plus country-specific data for Northern Ireland provided by Paul Caskie, (DARDNI). Production data for crops, used
in the calculation of N2O emissions from the ploughing in of crop residues, are taken from various sources.7 Emissions from inorganic N
application are estimated using a new country specific EF for the 1990-2014 inventory, derived from Defra projects AC0114/AC0116.
6 England: https://www.gov.uk/government/statistical-data-sets/structure-of-the-agricultural-industry-in-england-and-the-uk-at-june and Sarah Thompson
(DEFRA).
Scotland: http://www.gov.scot/Topics/Statistics/Browse/Agriculture-Fisheries/PubAbstract/Abstract2014; http://www.gov.scot/Publications/2014/10/6277/downloads and Graeme Kerr (The Scottish Government). Wales: http://gov.wales/statistics-and-research/survey-agricultural-horticulture/?lang=en and John Bleasdale (Welsh Government). Northern Ireland: http://www.dardni.gov.uk/index/statistics/crops-livestock-and-labour-numbers/statistics-farm-animal-populations.htm, Conor McCormack and Paul Caskie (DARDNI).
7 Data includes England, Wales, Scotland and Northern Ireland; Cereal and oilseed production for England, Wales, Scotland, Northern Ireland:
https://www.gov.uk/government/statistical-data-sets/structure-of-the-agricultural-industry-in-england-and-the-uk-at-june; Rye, mixed corn and triticale
production for England, Wales, Northern Ireland: https://www.gov.uk/government/uploads/system/uploads/attachment_data/file/364157/structure-
jun2013prov-UK-16oct14.pdf; Linseed, sugar beet, peas and beans (dry) production for England, Wales, Northern Ireland:
https://www.gov.uk/government/statistical-data-sets/agriculture-in-the-united-kingdom - chapter 7 crops; Vegetable production for England, Wales,
Northern Ireland: BHS vegetable survey, https://www.gov.uk/government/statistics/horticulture-statistics-2014; Potato and maize production for England
and Wales: Jim Holding (DEFRA): All other production data for Wales: John Bleasdale (Welsh Government); All other production data for Scotland: Nicola

Appendix 2: Devolved Administrations’ GHG Inventory Compilation Methods and Data Sources
Greenhouse Gas Inventories for England, Scotland, Wales and Northern Ireland: 1990-2014 40
Following the IPCC guidance, emissions from animal manures and slurries used as organic fertilizers are reported under agricultural soils
using IPCC Tier 2 methodology and country-specific data for the amount of manure nitrogen applied to the land. New country specific EFs
for the 1990-2014 inventory, derived from Defra projects AC0114/AC0116, are applied to different manure types.
The UK follows the IPCC 2006 Guidelines by using a nitrogen flow modelling approach which estimates that a significant proportion of the
total N excreted by animals in managed systems (liquid, deep bedding and poultry manure without bedding or poultry manure with
bedding), with the exception of daily spread, is lost prior to application to soils.
For sewage sludge applied to land the calculation involves estimating the amount of nitrogen contained per dry matter unit of sludge that
is applied to land and applying IPCC default EFs.
Emissions from urine and dung deposited by grazing animals are reported under agricultural soils according to IPCC 2006 Guidelines.
Emissions are calculated using new country-specific EFs for cattle grazing returns for the 1990-2014 inventory derived from Defra projects
AC0114/AC0116. No experimental data were available for sheep grazing returns, so a conservative approach was taken by which the EF for
cattle grazing returns has also been applied to sheep; IPCC 2006 Guidelines default EFs area 50% lower for sheep than for cattle grazing
returns.
Emissions from the ploughing in of crop residues are calculated using the IPCC methodology and IPCC default EFs. Emissions from
mineralisation refer to soil organic matter on land converted to cropland more than 20 years ago. The areas of cultivated histosols for each
DA were derived from a review undertaken as part of Defra project AC0114.
Indirect emissions of N2O from the atmospheric deposition of NH3 and NOx are estimated according to the 2006 IPCC guidelines using
country specific values for the fraction of N that is volatilised and IPCC default EFs for the indirect N2O emission. Indirect emissions of N2O
from leaching and runoff are estimated using country specific values for the fraction of N leached for inorganic fertilizer applications to
grassland and excretal returns from grazing livestock; for fertilizer to arable land, crop residues, sewage sludge and manure application to
land the default IPCC 2006 Guidelines values for FracLEACH are used. The method used corrects for the N content of manures used as fuel
(poultry bedding incineration).
Also reported are CO2 emissions from liming (data compiled by CEH) and from urea fertilizer application.
A2.10.2 Livestock Enteric Fermentation and Manure Management
The enteric CH4 emissions for dairy cattle (for dairy cows only) are estimated following the IPCC 2006 Tier 2 procedure, using country-
specific data for dairy cow live weight, milk yield, milk fat content, feed digestibility and activity (proportion of the year spent grazing) and
vary from year to year.
Livestock population data are reported annually as statistical outputs of the Devolved Administrations, based on the annual June
Agricultural Survey for each country38. Milk production and fat in milk are obtained from Agriculture in the UK (Defra, 2015b), with
common values used across the DAs.
Dairy cow live weights were provided by Eileen Wall/Tracey Pritchard (SRUC). Mature weights for the different dairy size categories were
obtained from an analysis of abattoir data (net carcase weight) from four abattoir companies across Great Britain for the years 2008-2013
combined with British Cattle Movement Society (BCMS) data (analysis conducted by Tracy Pritchard, SRUC). Combining the datasets using
eartag identification enabled carcase weight to be linked with breed, gender, age, whether the animal had produced calves and location.
Weighted means were obtained for all dairy females that had been slaughtered post-first calf, taking into account the average carcase
weight and number of animals in different age groups. A killing out percentage of 47% was applied to all breeds (Juniper et al., 2006),
although statistics are lacking on killing out percentage for different dairy breeds. The 1990-2007 time series and data for 2014 were
estimated by applying the ratio of the existing UK slaughter data to the estimated dairy liveweights for 2008-2013.
A country-specific value for the digestibility of feed (DE) of 74.5%, is used, expressed as a percentage of the gross energy, for dairy cows.
This value is on the high end of the range recommended by the IPCC (2006) for Western Europe of 55-75% for pasture fed animals, and is
Kerr (The Scottish Government); All other production data for Northern Ireland: http://www.dardni.gov.uk/index/statistics/crops-livestock-and-labour-
numbers/crop-areas-and-production-1981-onwards.htm and Conor McCormack (DARDNI).
8 Data derived as sum of totals for each Devolved Administration (i.e. England, Wales, Scotland and Northern Ireland), obtained from Devolved Administration statistical publications. June survey results: England: https://www.gov.uk/government/statistical-data-sets/structure-of-the-agricultural-industry-in-england-and-the-uk-at-june and Sarah Thompson (DEFRA); Scotland: http://www.gov.scot/Topics/Statistics/Browse/Agriculture-Fisheries/PubAbstract/Abstract2014; http://www.gov.scot/Publications/2014/10/6277/downloads and Graeme Kerr (The Scottish Government); Wales: http://gov.wales/statistics-and-research/survey-agricultural-horticulture/?lang=en and John Bleasdale (Welsh Government); Northern Ireland: http://www.dardni.gov.uk/index/statistics/crops-livestock-and-labour-numbers/statistics-farm-animal-populations.htm and Conor McCormack (DARDNI).

Appendix 2: Devolved Administrations’ GHG Inventory Compilation Methods and Data Sources
Greenhouse Gas Inventories for England, Scotland, Wales and Northern Ireland: 1990-2014 41
based on typical diets for cows over the lactating and non-lactating period, combining forage and concentrates, with energy values for the
various feeds according to MAFF (1990). The UK uses an energy balance approach to estimate the metabolisable energy (ME) requirement
for a dairy cow for a year including the lactating and non-lactating period. This accounts for the ME required for maintenance for the entire
year, the ME required for milk production during the lactating period and the ME required for pregnancy.
The UK has survey data on average concentrate feed use by dairy cows and use these data to derive the amount of energy supplied by
concentrates over the entire year. The value of typical concentrate use (not the required or recommended use) for a 7,000 litre yielding
cow of 0.29 kg concentrates per litre of milk (Nix, 2009) is derived from such survey data. This does not represent the amount of
concentrate feed required to meet the whole energy demand for milk production, but is the typical concentrate use on UK dairy farms for
that level of milk yield. The digestibility (DE as % of GE) value for concentrate feed (c. 82%) is derived from the typical mix of protein and
energy feed ingredients. Using this value, the annual ME requirement that has to be met from forage can then be derived. The relative
proportions of concentrate to forage DM intake per year estimated in this way are 29% concentrate and 61% forage.
The UK do not have detailed survey data on amounts of different forages consumed by dairy cows, so the proportional annual breakdown
(40% as fresh grass, 50% as grass silage, 10% as maize silage) is based on expert opinion (Bruce Cottrill, ADAS) taking into account the
proportion of time spent at grazing by dairy cows and the amount of maize grown in the UK. The UK benefits from a relatively warm and
wet maritime climate that is particularly suited to grassland production, as such grazing periods in the UK may be longer than those in
other European countries.
The UK is currently undertaking research to improve activity data on typical forage diets for a range of livestock production systems. The
digestibility values for the different forage components are taken from MAFF 1990 (UK Tables of Nutritive Value and Chemical Composition
of Feedingstuffs, 1990, Rowett Research Services Ltd). For grazed grass, the value used is not an average of all DE estimates for grass in this
database, but is the value specifically given by MAFF 1990 for ‘Fresh grass (grazed) – all species’, which is taken to be representative of the
annual average DE for grazed grass (compiled from a total of 244 samples taken throughout the grazing period, and includes grasses with
ME values ranging from 7.2 to 14.1, across a range of species including hybrid rye grasses, perennial rye grasses and Tall Fescue). While
some farms may specifically feed in-calf heifers and dry cows a poorer quality of forage, this is not considered typical for most dairy farms,
where the animals will be receiving forage of the same quality. Country-specific values for nitrogen excretion per head for the different
livestock types were derived from the report of Defra project WT0715NVZ (Defra, 2006) with interpretation by Cottrill and Smith (ADAS). N
excretion factors are kept in agreement with the UK NH3 inventory (Cottrill and Smith, ADAS, 2006), with common values used across the
DAs.
A Tier 2 methodology is used for the calculation of the enteric emissions from beef cows. Mature weights for the different beef size
categories were obtained from an analysis of abattoir data (net carcase weight) from four abattoir companies across Great Britain for the
years 2008-2013 combined with British Cattle Movement Society (BCMS) data (analysis conducted by Tracy Pritchard, SRUC). Combining
the datasets using eartag identification enabled carcase weight to be linked with breed, gender, age, whether the animal had produced
calves and location. Weighted means were obtained for all beef females that had been slaughtered post-first calf, taking into account the
average carcase weight and number of animals in different age groups. A killing out percentage of 50% was applied to all breeds (Minchin
et al., 2009), although statistics are lacking on killing out percentage for different beef breeds. The 1990-2007 time series and data for 2014
were estimated by applying the ratio of the existing UK slaughter data to the estimated beef live weights for 2008-2013. The digestibility
value for beef cows used by the UK is 65% for annual average feed composition. This value is based on expert opinion (Bruce Cottrill,
ADAS), reflecting the poorer quality diet that beef cows will generally receive in comparison with dairy cows.
A Tier 1 methodology is used for the calculation of the emissions from other cattle with default EFs (2006 IPCC Guidelines). The following
six groups are included: dairy heifers, beef heifers, dairy replacements > 1 year, beef all other > 1 year, dairy calves < 1 year, beef calves < 1
year.
The UK uses IPCC Tier 1 default EFs for enteric fermentation for all mature sheep (> 1 year old). The UK uses a country-specific EF for
enteric fermentation for lambs at 40% of that of an adult sheep (Sneath et al., 1997) together with a reduction factor reflecting the
reduced lifespan of lambs estimated by Wheeler et al. (2012) as 8.1 months. The animals under category ‘other sheep’ are largely barren
ewes that will be slaughtered at some time during the year. These are therefore assumed to be alive for 6 months of the year, which is
reflected in the emission calculation rather than the emission factor. These emission factors are assumed constant over the entire time
series. The UK EFs for pigs, goats, horses and deer are default IPCC (2006 IPCC Guidelines).
The CH4 emission factors for manure management are calculated following IPCC Tier 2 methodology using default IPCC data for volatile
solids (VS) and methane producing potential (Bo) parameters for each livestock type (except for dairy and beef cows, where a Tier 2
calculation is used to determine VS, and deer where a Tier 1 methodology and EF is used); country-specific data for the proportion of
manure from each livestock type managed according to the different animal waste management systems (AWMS) and IPCC default
methane conversion factors for the different AWMS (IPCC, 2000).
Calculation of N2O emissions from manure management follows IPCC (2006) methodology for each livestock category and subcategory,
using country-specific data for nitrogen excretion by the different livestock types and for the proportion of manure managed according to

Appendix 2: Devolved Administrations’ GHG Inventory Compilation Methods and Data Sources
Greenhouse Gas Inventories for England, Scotland, Wales and Northern Ireland: 1990-2014 42
the different AWMS, and default IPCC emission factors for the different AWMS (IPCC, 2006). Country-specific values for nitrogen excretion
per head for the different livestock types were derived from the report of Defra project WT0715NVZ (Defra, 2006) with interpretation by
Cottrill and Smith (ADAS).
Indirect N2O emissions from manure management comprise country-specific values for N loss due to volatilisation of NH3 and NOx,
disaggregated by AWMS. Emissions of N2O from the leaching/runoff associated with the storage of deep bedding as field heaps have been
estimated using IPCC methodology (IPCC 2006 guidelines) with a country specific FracLEACH value of 0.03 (Nicholson, et al., 2011).
Emissions from the combustion of poultry bedding for electricity generation are reported under power stations. Emissions occurring during
storage of poultry bedding that will later be used for energy generation are included in the agricultural inventory (tonnage of poultry
bedding incinerated obtained directly from EPR, Teresa Wachter Fuel Operations Manager, Energy Power Resources Limited, a total of
462,000 tonnes for 2014).
A2.10.3 Reasons for changes
There were a number of changes in the inventory for this submission:
The default IPCC values for the parameters FracGasMS, FracGasF, FracGasM and FracLossMS have been replaced by country-specific
values;
The default IPCC emission factor EF1 has been replaced by country-specific values for direct N2O emissions from inorganic
fertilizer applications and manure application to soils;
The default IPCC emission factor EF3 has been replaced by country-specific values for direct N2O emissions from urine and dung
deposited by grazing animals;
The default IPCC values for the parameter FracLeach has been replaced by country-specific values according to N source and land
use.
Further details can be found in Appendix 6.
A2.10.4 Planned improvements to the inventory
The UK GHG agricultural inventory is undergoing large improvements in order to better quantify the emissions and reduce uncertainty. A
consortia of a wide range of scientific expertise has been put together to fulfil the requirements for improving the UK GHG agricultural
inventory. As part of this planned programme of improvement, a number of revisions were made to the inventory model for this reporting
year.
Beyond improvements already implemented, the agriculture improvement plan comprises:
1. Restructuring the inventory to improve spatial and temporal disaggregation and incorporation of Tier 2 methodology in
those areas where both measurement and activity data are available. This work will also to allow the inventory to reflect the
effect of mitigation strategies[1].
2. Data mining to collate and review existing experimental agricultural data to deliver a set of country specific (Tier 2)
emission factors and supporting farm practice data to enable an improved mapping of N2O and CH4 emissions for the United
Kingdom with an assessment of uncertainty (Defra project AC0114).
3. Tier 2 methodology for enteric CH4 estimates for all cattle and sheep categories (Defra projects AC0114/AC0115).
4. Further analysis of UK-specific measurement data on direct N2O emissions, to develop country-specific emission factors
responsive to agro-climatic gradients (EF1, EF3).
6. Development of country-specific EFs for N2O from animal manure management systems from existing data[1].
7. Assessment of the effect of mitigation strategies, specifically the use of nitrification inhibitors and optimising fertiliser
timing on N2O emission from soils (DEFRA projects AC0116 and AC0213)
[1] (DEFRA Agricultural GHG R&D Platfom – www.ghgplatform.org.uk)

Appendix 2: Devolved Administrations’ GHG Inventory Compilation Methods and Data Sources
Greenhouse Gas Inventories for England, Scotland, Wales and Northern Ireland: 1990-2014 43
Rothamsted Research provides all data and information pertaining to agricultural sources within the Devolved Administration emission
inventories.
The UK inventory is disaggregated into the Devolved Administrations of England, Scotland, Wales and Northern Ireland, with all default
factors and emission factors carried over from the national inventory. The compilation of the emissions is carried out at DA level and added
up to national level.
A2.11 Land Use, Land Use Change & Forestry (LULUCF) The Land Use, Land Use Change and Forestry (LULUCF) sector includes carbon stock changes, emissions of greenhouse gases (carbon
dioxide (CO2), methane (CH4) and nitrous oxide (N2O)) by sources and removals of CO2 by sinks from land use, land use change and forestry
(LULUCF) activities. Removals of CO2 are conventionally presented as negative quantities.
The current LULUCF inventory methods use a combination of top-down and bottom-up approaches, based on activity data for each of the
Devolved Administrations and the UK as a whole. As a result of this approach, estimates of emissions and removals from LULUCF activities
are produced at the DA and UK scale. The description of the DA GHG inventory methodology and emission estimates are included in
Appendix 8. Detailed information on the data and methods used in the LULUCF inventory can be found in Appendix 8.
A2.12 Waste
A2.12.1 Solid Waste Disposal on Land
In the UK Inventory, emissions are estimated based on a model of methane production in landfill sites. The generation of methane is
assumed to follow a first order model with different decay rates for different types of waste. The model requires data on waste disposals
and waste composition from 1945 onwards.
The UK GHGI waste model was revised and updated during the 1990-2013 inventory cycle. The methodology for calculating methane
production in landfill sites was updated. Waste composition and commercial and industrial waste data were updated, along with updated
assumptions about the combustion of methane in landfill gas engines and the approach to flaring at un-reporting sites, drawing upon
evidence from research by Defra and the Environment Agency. The revisions to the assumptions in the UK landfill model regarding
methane utilisation were provided in detail within the UK GHG National Inventory Report published in 2015.
The Ricardo team provided a suite of DA-specific waste sector datasets that were incorporated into the landfill model revision funded by
Defra during the 1990-2009 UK GHGI cycle. Consultation with waste sector experts during 2010 led to the collation of new information
from recent waste survey and compositional studies including: MSW composition (Scotland WRAP study, Wales WRAP study), public sector
waste arisings survey (Wales), Commercial & Industrial & Agricultural waste fate studies (Wales), Northern Ireland waste compositional
study and Commercial & Industrial waste sector report.
The current model retains much of the design and functionality of the previous GHGI waste model; due to a lack of detailed local data, it is
assumed that the level of methane recovery is the same in each region.
Data from the www.WasteDataFlow.org website are used to estimate DA landfill activity. The Waste Data Flow website is used by Local
Authorities to track progress towards waste sector objectives. Reports from the Waste Data Flow organisation have been reviewed, and
these provide a more detailed split of waste disposal options undertaken in the DAs, with ultimate fate of municipal waste recorded
against numerous options, primarily: recycling, landfill and incineration.
The detailed methodology for determining DA emission estimates from landfills was revised by Defra in the 1990-2010 inventory cycle to
derive estimates of landfill methane emissions by country. The method makes use of disaggregated waste arising and compositional
analysis data to reflect better the individual country emissions, rather than taking UK aggregate emission estimates and scaling.
Following the update to MELMod (released in the 2011 inventory submission), we now have a much more disaggregated understanding of
the waste quantity assumptions fed into different MELMod categories. The underlying data, as well as references, that fed into the 2011
revision is discussed in depth in a separate report (Hogg, et al., 2011). Estimates of country-specific landfill tonnages are derived by:
- Using the data on Local Authority Collected Waste (LACW, previously known as MSW). There is no annual data on the quantity
and composition of landfilling. For each country, however, there are periodic surveys of waste composition, as well as
quarterly/annual data on quantity of waste landfilled, and the quantity/composition of recycling.

Appendix 2: Devolved Administrations’ GHG Inventory Compilation Methods and Data Sources
Greenhouse Gas Inventories for England, Scotland, Wales and Northern Ireland: 1990-2014 44
These sources are combined to produce a best estimate of the quantity of different types of waste landfilled. The data are
uncertain due to the limited nature and frequency of compositional surveys; however, the data on landfilling and recycling of
materials is considered to be associated with low uncertainty.
Country-specific data were revised back to 1995 within the UK model update in the 1990-2010 inventory. Data for 2011 onwards
are derived based on a projection from 2010.
- Data are less frequent and complete for commercial and industrial (C&I) waste; DA-specific data have been used where available,
whilst UK average data have been used to fill data gaps in other DAs.
The quantity of different types of landfilling was computed from compositional data, landfill site returns, landfill tax data and
data on the composition and destination of construction and demolition (which is required to determine what element of
construction and demolition waste is methane-producing).
The overall input to MELMod was not done on a country-by-country basis due to the data limitations.
The DA estimates are based on available data that were used within the UK MELMod model used in the 1990-2014 UK GHGI. The following
section explains the method.
Local Authority Collected Waste (LACW)
- LACW estimates of landfilling by waste type are available for each country from 1995 onwards.
- The time series of data were extrapolated back from 1995 and forward where necessary to 2014;
- The data time series was extrapolated back from 1995 for each country by applying the UK figures in MELMod pre-1995 to each
country’s share of overall LACW landfilling in 1995.
Commercial and Industrial Waste (C&I9)
- DA-specific C&I waste data is very limited or not available at all; the method uses the available estimates of overall UK
compositions of C&I (and C&D) waste landfilled in different years, based on waste surveys, and combines the UK-wide data with
DA-specific estimates of total landfilling of commercial, and industrial, waste for given years (interpolated from the available
survey evidence).
- Using the country-specific estimate of landfilling of commercial and industrial waste, and applying the estimated UK C&I landfill
composition allows a calculation of country specific estimates of the quantity and type of waste landfilled.
- Due to data limitations, the Eunomia revision only went as far back as 1997. A similar backwards extrapolation to that for LACW
was performed, according to each country’s relative share of combined commercial and industrial landfilling in 1997.
- As the C&I estimates are not country-specific in the revision, forward projections to 2014 are estimated on a country basis by
taking the most recent year’s data (at the time of the revision) – 2008/09 – for each country’s share of commercial, and
industrial, landfilling, and multiplying by the assumed overall UK composition for that year.
- The estimation of country-specific C&D landfilling (which feeds into the ‘C&I’ section of MELMod) followed the same process as
set out above for C&I.
Methane capture and combustion in landfill gas flares and engines was calculated on a national basis from data on electricity generation
from landfill gas (obtained from DUKES) and from site-specific data provided by the regulatory authorities. It was assumed that the
proportion of gas collected for each DA was the same as the proportion calculated as being collected on a national basis.
A2.12.2 Biological Treatment of Solid Waste
Emissions of methane and nitrous oxide from composting of MSW, anaerobic digestion (AD) and Mechanical Biological Treatment (MBT) of
MSW were introduced into the UK GHG inventory for 2013 using a Tier 1 methodology as specified in the 2006 IPCC Guidelines. The DA
estimates have been derived from the UK GHGI totals, based on the % share of UK population in each DA. This was identified as an
appropriate approach in view of the scale of emissions from this sector.
9 Also includes construction and demolition waste in MELMod.

Appendix 2: Devolved Administrations’ GHG Inventory Compilation Methods and Data Sources
Greenhouse Gas Inventories for England, Scotland, Wales and Northern Ireland: 1990-2014 45
Activity data for this sector was derived from annual organics recycling reports, published between 1998 and 2012 by:
The Waste and Resources Action Programme (WRAP - 2012, 2010 & 2009)
The Association for Organics Recycling (2008, 2007 & 2006)
The Composting Association (2005, 2004, 2003, 2001, 1999 & 1998)
Where necessary (e.g. for intervening years between published reports), activity data were interpolated between published values.
Emission factors for composting and anaerobic digestion are taken from IPCC (2006) default emission factors. The emission factor for
mechanical biological treatment is assumed to be the same as for anaerobic digestion.
A2.12.3 Waste Water Handling
Nitrous oxide emissions from waste-water handling are based on population statistics for the UK (ONS, 2015) whilst methane emission
estimates are based on operator reported data on treatment activities from water companies in England and Wales and from Scottish
Water and Northern Ireland Water Service , all via an UKWIR data reporting mechanism. Methane emission factors for water treatment
and sewage sludge treatment and disposal options are derived from operator information provided for the UK GHGI compilation process
(UKWIR, 2015).
There was significant improvement to the UK GHGI methodology for this source during the 1990-2013 cycle, with almost 100% coverage of
major UK water companies now reporting emission estimates to the NAEI/GHGI work programme. For the first time in the 1990-2013 DA
inventory dataset, methane emissions from private waste-water treatment facilities (e.g. septic tanks) were also included, based on
bottom-up data from each country on the number of installations or permits for septic tanks that are recorded by the water companies.
The UK estimates are based on a default IPCC methodology using UK-specific per capita Biochemical Oxygen Demand (BOD) and estimated
population using private waste water management systems.
Estimates of emissions from industrial waste water treatment are distributed across the DAs based on the dataset from water companies
outlined above.
A2.12.4 Waste Incineration
The UK Inventory reports emissions from the incineration of sewage sludge, municipal solid waste and some chemical waste. DA estimates
are based on DEFRA (2015a) which reports data for the amount waste incinerated for Scotland, Northern Ireland and England & Wales.
Emission drivers from MSW Incinerators for 1990-1995 are based on capacity data for individual incinerators taken from RCEP (1993). It is
assumed there were no significant changes between 1990 and 1995. Estimates for recent years are based on plant capacity data (Patel,
2000). All of the larger MSW incinerator plant have been re-fitted during the late 1990s to generate electricity and are therefore reported
as power stations. A handful of smaller waste incinerators (municipal, industrial and clinical) are used for district heating and are reported
as commercial or miscellaneous. The disaggregation of these smaller, heat-generating plants is based on the same driver as for larger MSW
incinerators, as there is no specific source of information that provides a more satisfactory estimation of the regional split. The total
consumption of these incinerators is reported within the Digest of UK Energy Statistics (DECC, 2015a).
Emissions from clinical waste incineration are allocated to the regions based on a set of plant capacity data for 1998. Emissions data from
chemical waste incineration are available for England and Wales only, based on data taken from the Pollution Inventory (EA, 2015a), and
these data are used for the DA estimates also. Some chemical waste incineration takes place in Scotland but no emissions data are
available, and hence the emissions contributed from this source are currently omitted from the Scottish inventory data. No chemical
incinerators have been identified in Northern Ireland.
Appendix 3: Methods Used for Calculating End User Emissions
Greenhouse Gas Inventories for England, Scotland, Wales and Northern Ireland: 1990-2014 46
Appendix 3: Methods Used for Calculating End User Emissions
A3.1 Introduction Emissions of GHGs reported under international conventions are typically on a “by source” basis. This means that the emissions are
allocated to the source sector at the point of their release. For example, emissions from refining oils are allocated to the refineries, and
emissions from the combustion of fuel in vehicles are allocated to the relevant transport sector.
This section of the report presents emissions on an “end user” basis. In this case, all emissions associated with energy supply (e.g. power
generation, coal mining, oil and gas extraction, refineries) are allocated to the final users of the energy. In the above example, the
emissions from the refineries would be reallocated to all oil users, including within the transport sector. Therefore, the main usefulness of
end user emission inventories is to present a more representative picture of emissions due to consumption, rather than production. End
user inventories are needed in order to reflect the full impact of energy efficiency policies as they show the emissions associated with
sector consumption of all fuels, including emissions associated with electricity use.
The scope of the emissions allocated within these Devolved Administration (DA) end user inventories is bounded by the definition of the
“UK” emissions, as applied in the main DA by source inventories. The sum of the DA end user emissions equals the sum of the DA by source
emissions. GHG emissions associated with fuel imports (e.g. electricity imported from the EU and consumed in the UK) are not reported
within these data. However, the emissions of GHGs associated with the refining of fuels that are subsequently exported are included in
these DA inventories, as the emissions are produced at source within the UK energy supply industry. An example of this is for international
aviation and shipping; whilst the greenhouse gas (GHG) emissions from the direct use of petroleum fuels in those “memo item” sources are
excluded from the end user inventories, the emissions associated with the supply of fuels to those sectors (i.e. upstream oil extraction and
refinery emissions within the UK) are included in the DA end user inventories.
A3.2 End User Methodology The method for calculating UK emissions on an end user basis is described in Annex 9 of the National Inventory Report (Brown et al., 2015).
The calculation uses an iterative approach, carried out in a database. As an overview, the approach is summarised in the three steps below:
1. Emissions are calculated for each sector for each fuel.
2. Emissions from fuel and electricity producers are then distributed to those sectors that use the fuel according to the energy content of
the fuel they use (these sectors can include other fuel producers).
3. By this stage in the calculation, emissions from final users will have increased and those from fuel and electricity producers will have
decreased. The sum of emissions from fuel producers and power stations in a particular year as a percentage of the total emissions is
then calculated. If this percentage, for any year, exceeds a predetermined value (e.g. 1% or 0.01%) the process continues at Step 2. If
this percentage matches or is less than the predetermined value, the calculation is finished.
Convergence of this iterative approach is likely, as the fuel flows to the final users are much greater than fuel flows amongst the fuel
producers. This calculation results in a table of emissions for the UK on an end user basis. Emissions from the energy supply sector are
decreased to a very small number, and emissions within the end user sectors are increased.
DA end user estimates are then calculated by disaggregating the UK level estimates, in the same way as the DA source inventories are
produced. The estimates for direct fuel use in the end use sectors, and emissions from energy supply, are therefore consistent with the DA
source inventories.
In order to allocate the energy supply emissions to all sources, additional estimates have been required for the disaggregation of electricity
use, and for the exports10 category. Table A3. 1 summarises the data used to derive DA estimates for sector-specific electricity use and
exports.
10 Exports refers to the emissions associated with the production of fuel or electricity which is then exported from the UK, or used as fuels for international
aviation or shipping.

Appendix 3: Methods Used for Calculating End User Emissions
Greenhouse Gas Inventories for England, Scotland, Wales and Northern Ireland: 1990-2014 47
Table A3. 1: Summary of DA Data used to Derive Sector Estimates for Electricity Use and Exports
Assumptions for Electricity and Exports
Source Name Activity Name
Description
Public sector Electricity
Northern Ireland public sector electricity use for 2003 onwards is taken from the Northern Ireland Public Sector Energy Campaign (DFPNI, 2015), whilst the DA share of GB activity is derived from analysis of the Inter-Departmental Business Register for 2003 onwards. The 1990 estimates for all DAs are based on economic indicators from previous studies using the REEIO model.
Miscellaneous industrial / commercial
Electricity The DA share of UK activity is derived from analysis of the Inter-Departmental Business Register for 2003 onwards, whereas the 1990 estimates are based on economic indicators from previous studies using the REEIO model.
Domestic Electricity
Country-specific domestic electricity use in GWh, is taken from analysis within DECC Energy Trends December 2015 (for 2004-2008), DECC sub-national energy statistics March 2015 for 2008 onwards, DUKES 1991 data (for 1989) for 1990, and REEIO GVA data for 2000.Scotland 1990 data are estimated by back-casting reported trends in domestic electricity use from the Scottish Housing Condition Survey. England, Wales and Northern Ireland data retain the % share from the REEIO analysis. No Northern Ireland data were available in the December 2015 Energy Trends, however, so the Northern Ireland domestic electricity in 2014 was estimated assuming that the domestic sector share of total NI electricity consumption was the same as in 2011.
Iron and steel - combustion plant, and Blast Furnaces
Electricity Country-specific electricity use data for 2003 onwards is derived from ISSB regional energy statistics (ISSB, 2015), and 1990 electricity use is estimated from ISSB regional production statistics.
Railways Electricity The DfT Rail Emission Model indicates that there are no electrified lines in Wales or Northern Ireland, and has been used to estimate the UK share of total rail electricity use in England and Scotland.
Gas production Electricity
Overall annual gas throughput via each of the Low Pressure Distribution Zones has been used as an indicator of regional electricity use in this sector. The LDZ throughput data are available from the gas network operators (National Grid, 2015; Northern Gas Networks, 2015; Wales and West Utilities, 2015; Scotia Gas, 2015).
Refineries - combustion
Electricity Carbon dioxide emissions from refineries are used to estimate the DA share of UK sector electricity consumption (UKPIA, 2015).
Collieries - combustion
Electricity Regional coal production data are used to estimate the DA share of UK electricity use by collieries. (UK Coal Authority, 2015)
Exports Electricity DA data on electricity exports are published within the periodic DECC publication “Energy Trends”, Table ET5.6.
Other industrial combustion
Electricity
For 2003 onwards, the “other industry” estimate of DA electricity use is derived by difference using the DECC Energy Trends DA totals for electricity sales and the estimates for other sectors. The 1990 estimates are calculated by difference, using 1989 regional electricity sales data scaled to 1990 UK electricity totals.
Non-ferrous metals (combustion)
Electricity Electricity use estimates by DA are based on analysis of the DA share of the economic sector from the Inter-Departmental Business Register for 2010, with the 2010 DA split applied across all years.
Chemicals (combustion)
Electricity Electricity use estimates by DA are based on analysis of the DA share of the economic sector from the Inter-Departmental Business Register for 2010, with the 2010 DA split applied across all years.
Pulp, paper and print (combustion)
Electricity Electricity use estimates by DA are based on analysis of the DA share of the economic sector from the Inter-Departmental Business Register for 2010, with the 2010 DA split applied across all years.
Food, drink and tobacco
Electricity Electricity use estimates by DA are based on analysis of the DA share of the economic sector from the Inter-Departmental Business Register for 2010, with the 2010 DA split applied across all years.
Agriculture - stationary combustion
Electricity
For Northern Ireland, estimated electricity use is based on DETI (2010) which provides electricity use estimates for the sector in 2005; the estimates for other years in Northern Ireland have been scaled on the UK sector electricity trends. For GB, employment on Agricultural Holdings data is used to estimate the DA share of GB sector electricity use for all years.
Exports
ATF, Burning Oil, DERV, Fuel Oil, Gas Oil, Petrol
In each year, the DA share of carbon dioxide emissions from refineries is used as an indicator of DA oil exports.
Exports Coke Regional data on coal consumed in coke ovens from ISSB statistics, DUKES, and WDig Hist Stats are used to estimate the DA share of coke exports.
Exports SSF Regional data on SSF production, based on reported or estimated annual plant production by site are used to estimate the DA share of SSF exports.

Appendix 3: Methods Used for Calculating End User Emissions
Greenhouse Gas Inventories for England, Scotland, Wales and Northern Ireland: 1990-2014 48
A3.3 Revisions to End User Inventory Data and Methodology The DA end user method was updated for the 1990-2013 DA GHG inventory report, with data and method improvements to further develop
the DA end user estimates, to build upon new information and data. Since this update there have not been any changes to the End User
inventory methods.
A3.3.1 End User Analysis by National Communication Sector
Analysis of the outputs from the updated DA end user model is presented below, with details provided for the National Communication
sectors where the end user approach has the greatest impact compared to the by source inventories. More detail is provided within each
of the DA chapters of this report.
Note that the application of UK-wide factors to derive end user emission estimates for electricity consumption in the UK has a notable
impact on the re-distribution of power sector emissions from the by source inventory dataset, and affects the comparisons with overall DA
source emissions. For example, the power sector emissions in Scotland in the by source inventory are lower per unit GWh generated than
the rest of the UK, but a UK-wide factor is applied to all UK electricity consumption.
Business
The business sector includes industrial and commercial energy use sources, in addition to a number of non-energy sources such as the use
of fluorinated gases. Across the UK in 2014 the end user estimates for the business sector are 183% that reported in the by source
inventories, i.e. almost double the emissions are allocated to the business sector once the upstream energy processing emissions are
allocated on to the users of refined fuels and electricity. This doubling of emissions on an end user basis increases the significance of the
sector in the overall inventory; in 2014 in the by source inventory the business sector represents 17% of national GHG emissions, but on an
end user basis this increases to 31%, highlighting the importance of the sector for energy efficiency policy implementation.
The high percentage increase in the end users data compared to the by source data indicates the large contribution of the electricity
component in the DA end user estimates. The use of electricity for heating, lighting and operating equipment has a marked effect on the
emissions attributed to this sector, when compared to the emissions in the by source inventories which only include estimates from direct
fuel use in the sector.
Residential Sector
The residential sector includes emissions from domestic fuel combustion and electricity use, in addition to smaller emissions from the
breakdown of consumer products, accidental vehicle fires, and HFC emissions from the use of aerosols and metered dose inhalers. The
non-fuel combustion sources are unchanged between the by source and end user approaches.
In 2014 the UK end user estimates for the residential sector are 183% that reported in the by source inventories, due to the additional
emissions allocated from the upstream energy process sectors to deliver the refined fuels and electricity that are consumed in the sector.
The percentage increase in the end users emissions data compared to the by source data is predominantly due to the additional
contribution of the electricity component in the DA end user estimates, although emissions associated with the extraction and processing
of solid and petroleum fuels will also contribute.
Similar to the business sector above, much higher emissions on an end user basis increases the significance of the residential sector in the
overall inventory; in 2014 in the by source inventory the residential sector represents 12% of national GHG emissions, but on an end user
basis this increases to 23%, highlighting the importance of the residential sector for energy efficiency policy implementation.
The domestic sector estimates of electricity use in 1990 for each DA are based on sales data from regional electricity companies for 1989,
scaled to the 1990 UK domestic electricity use total, with the Scottish estimates derived (as noted above) from Scottish Housing Condition
Survey data. In addition, the sub-national energy statistics published by DECC for recent years within the periodic publication Energy
Trends, provides domestic sector estimates of electricity use for each DA. Therefore, these sector estimates are associated with lower
uncertainty than many of the other sectors.
Public Sector
This sector contains emissions from the combustion of fuel, and electricity use, within the public sector. The percentage increase in the end
users data compared to the by source data for the public sector is 191%, similar to that reported for the business sector and for the same
reasons, i.e. the high use of electricity as a fuel in the sector to provide heating, lighting cooking etc. Despite the large increase, the sector
as a whole remains a modest overall contributor to the national inventory totals: even on an end user basis, in 2014 the UK public sector
only represents 3% of the national GHG emissions total.

Appendix 3: Methods Used for Calculating End User Emissions
Greenhouse Gas Inventories for England, Scotland, Wales and Northern Ireland: 1990-2014 49
Transport
The transport category includes all emissions from road transport, rail (including stationary sources), national navigation and coastal shipping,
domestic aviation, military aviation and coastal shipping.
In many end user sectors, the fuel mix within each DA will vary and hence the impact of the end users approach will also vary quite
markedly as the additional emissions associated with different fuel groups combine to derive the total end user estimate. In the transport
sector, however, the majority of the fuels used are derived from petroleum processing (with the exception being combustion in the rail
sector), and hence the effects of the end user method can be seen in isolation for the petroleum sector. The end user estimates in recent
years are a steady but gradually declining 14-12% higher than the by source estimates, reflecting the additional emissions from upstream
oil extraction and the oil refining sector.
Other Sectors
Emissions from the Land Use, Land Use Change and Forestry (LULUCF) and Waste Management sectors are unchanged between the by
source and end user approaches, since there are no emissions from energy use allocated to these sources. The end user increment within
the Industrial Process sector is limited to the use of fuels in ammonia production (feedstock use of natural gas), and iron and steel (where
emissions are allocated to process use, rather than combustion) and results in a 5% increase on an end user basis. For Agriculture, the
increase in emissions using the end user approach is limited to the emissions from energy use within the sector and results in a 4.2%
increase on an end user basis.
A3.3.1 Summary of End User Data for Wales “Electricity Only” Emissions
The allocation of emissions from electricity use in the end user inventories is of specific interest for the reporting of progress against GHG
reduction targets for the Welsh Government; the Climate Change Strategy for Wales (2010) has established emission reduction targets that
address the scope of devolved powers for the Welsh Government, and this requires analysis of the impact of the operation of the UK
electricity supply grid. Therefore we present here a summary of the end user emissions that are allocated from the use of electricity in
Wales during 2006 to 2014, as the Welsh Government targets use a baseline from 2006 onwards. Note that these data exclude the by
source emission estimates and the component of the end user dataset that relates to the use of solid fuels, natural gas and petroleum
fuels.
Table A3. 2: Wales End User Electricity Only Emissions, 2006 -2014, MtCO2e
NC Category 2006 2007 2008 2009 2010 2011 2012 2013 2014
Agriculture 0.30 0.30 0.30 0.27 0.28 0.26 0.27 0.24 0.22
Business 6.57 6.35 6.17 5.18 5.36 5.08 5.39 5.10 4.46
Energy Supply 0.00 0.00 0.00 0.00 0.00 0.00 0.00 0.00 0.00
Exports 0 0 0 0 0 0 0.07 1.11 1.14
Industrial Process 0.01 0.01 0.01 0.01 0.01 0.01 0.01 0.01 0.005
Public 0.49 0.51 0.50 0.45 0.44 0.41 0.45 0.40 0.33
Residential 3.36 3.14 3.05 2.82 2.86 2.58 2.86 2.62 2.23
Transport 0.001 0.001 0.001 0.000 0.000 0.001 0.001 0.001 0.002
Wales Total 10.73 10.30 10.03 8.72 8.95 8.33 9.05 9.46 8.38

Appendix 4: Emission Analysis and Methods used for Devolved Administrations’ Traded and Non-Traded Emissions
Greenhouse Gas Inventories for England, Scotland, Wales and Northern Ireland: 1990-2014 50
Appendix 4: Emissions Analysis and Methods used for Devolved
Administrations’ Traded and Non-Traded Emissions
A4.1 Background The data analysis and reporting of greenhouse gas (GHG) emission inventories in the UK – both at the national and sub-national level – is
coming under increasing scrutiny for the purposes of energy and climate change policy development, evaluation and appraisal. In recent
years the GHG inventory improvement programme has focussed on developing close consistency with emissions data from new data
reporting systems from UK-wide policy mechanisms such as the European Union Emissions Trading System (EU ETS).
For the UK to achieve progress in emission reductions across the economy, a detailed understanding of the scope, level and trend of non-
traded GHG emissions (i.e. those emission sources that are not within the EU ETS) is needed to support evidence-based policy development
within the climate change strategies and programmes implemented by the Department of Energy and Climate Change (DECC) and the
governments of Scotland, Wales and Northern Ireland; good quality GHG emissions data by source will enable the DAs to design and
implement devolved policy mechanisms that are effective and cost-effective in achieving GHG reduction targets, to complement the
actions through reserved UK-level policies and measures.
The analysis of the emissions and trends in the non-traded sector are of particular relevance for the Welsh Government, as the GHG
reductions targets in Wales exclude the emissions from sites in EU ETS.
A4.1.1 UK Context: The Greenhouse Gas Effort Sharing Decision
In December 2008, the Greenhouse Gas (GHG) Effort Sharing Decision (ESD) was agreed as part of the EU 2020 Climate and Energy package
of measures; the ESD sets EU Member State GHG reduction targets for the economic sectors that are not covered by the EU Emissions
Trading System.
The UK target under the ESD equates to a reduction in emissions in the non-ETS sections of the UK economy of 16% below 2005 levels, by
2020. Furthermore the ESD includes a binding annual emissions reduction trajectory from 2013 to 2020 to keep the EU on track to meet its
emissions reduction targets over that period, monitoring and evaluation provisions and flexibility mechanisms to enable Member States to
cost-effectively meet their targets.
Each Member State has autonomy over which policy measures to use to meet their national targets, and in the UK the national
mechanisms will be governed by the Climate Change Act, the Energy Act, the Renewable Energy Strategy and the Low Carbon Transition
Plan.
At the national level, the UK GHG inventory has been subject to a detailed review by the European Commission, to assess data quality of
the traded and non-traded components of the UK inventory. This review has focussed on the veracity of the current baseline inventory
totals for 2005 and 2008-2010 and the level of consistency between data reported through the EU ETS and the GHG inventory.
A4.1.2 Non-Traded Emissions in the UK
Non-traded GHG emission sources in the UK comprise:
small-scale fuel combustion sources in the industrial, agricultural, commercial, public and residential sectors;
transport emissions11;
Agricultural process emissions;
Land Use Change and Forestry emissions / sinks;
Waste sector emissions.
The small-scale fuel combustion sources are usually sources where comprehensive accurate data on energy use and / or emissions are not
available at DA level. DA emissions in the traded sector are much more certain, since the mechanism for trading requires site-specific
11 Note that aircraft emissions are traded, but the entire transport sector is excluded from the traded/non-traded analysis

Appendix 4: Emission Analysis and Methods used for Devolved Administrations’ Traded and Non-Traded Emissions
Greenhouse Gas Inventories for England, Scotland, Wales and Northern Ireland: 1990-2014 51
reporting of detailed emissions, activity and emission factor data. The current approach to deriving the non-traded fuel combustion emission
estimates is therefore by difference from the total DA GHG inventory for energy emissions and the EU ETS emissions data:
Non-traded emissions = total emissions – traded emissions
The DA GHG inventory data are derived from the UK GHG inventory data, which in turn is linked directly (for high emitting, energy-
intensive sites, such as those within the EU ETS) to industry-specific fuel allocations within the Digest of UK Energy Statistics (DUKES).
Through research with DECC energy statisticians, the UK GHG inventory team has integrated EU ETS activity and emission factor data into
national energy statistics and GHG inventory estimates in order that close consistency has been achieved in the UK between the EU ETS
and GHG inventory; inconsistencies between the inventory and EU ETS remain for a number of sources, but overall the data quality for the
non-traded sector in the UK has improved greatly in recent years.
The estimates derived for the traded and non-traded sectors of the DA GHG inventories presented in this report are for the years 2008 to
2014 only, as the earlier years of EU ETS data covering 2005 to 2007 were during Phase 1 of the scheme when a more limited scope of
installations was included. Comparison of data from Phase I and Phase II/III is therefore of little value. Phase III of the EU ETS started in
2013, with a slightly increased scope of reporting compared with Phase II (2008-12). As a result, EU ETS data for 2013 onwards included
emissions from some additional industrial combustion installations (e.g. roadstone coating plant) and certain industrial process sources
were also included for the first time.
A4.2 Data Quality and Reporting Format Issues The EU ETS site data have been analysed to allocate fuels and sites to align with inventory criteria, in consultation with DECC DUKES energy
statisticians and EU ETS regulatory experts from the Environment Agency of England and Wales, Natural Resources Wales, the Scottish
Environment Protection Agency and the Northern Ireland Environment Agency.
Sector activity data (fuel use, mineral use) from the 2014 EU ETS are analysed against the data reported in the national energy statistics
within DUKES, and EU ETS fuel quality information by sector are used within the derivation of UK GHGI estimates for several high-emitting
sectors. However, direct comparison of EU ETS data and alignment with DUKES sectors and GHG inventory IPCC sector reporting format is
problematic for a number of reasons:
Disparity between EU ETS and national activity statistics. The activity data from EU ETS are generally considered to be of good
quality, having been subject to a rigorous data checking and verification process. Comparisons with UK energy statistics are
therefore potentially very useful in revealing any areas of under- or over-estimation in the national statistics. However, for most
economic sectors, the EU ETS does not cover 100% of sites and fuel use in the UK, and therefore the sum of EU ETS activity data
for most sectors is expected to be lower than the national statistics published by DECC DUKES (for energy use). This is indeed
what is generally found, and so we can conclude that there is no evidence of any problems in DUKES for these sectors. The
comparison between EU ETS and DUKES is more informative in the case of sectors where we expect all, or nearly all sites to be
covered by EU ETS e.g. for power stations, refineries etc. Here the EU ETS data should be the same or similar to that given in the
UK energy statistics. In fact, there are a number of instances where the EU ETS fuel use data are higher than the data reported
within DUKES, and so EU ETS data are therefore used within the UK and DA GHG inventory compilation, deviating from the
national statistics. Examples include refinery and industrial use of other petroleum gases (OPG), upstream oil and gas use of
liquefied petroleum gas (LPG) and OPG.
Differences in scope and definitions between IPCC sectors and EU ETS reporting. IPCC reporting requires that a distinction is
made between fuel combustion emissions and process emissions, and all emissions from all sources need to be captured. The
scope of EU ETS reporting is not always comprehensive, i.e. emissions from some sources on site may be excluded from EU ETS
data. Furthermore, the reporting format of the EU ETS does not explicitly separate the GHG emission sources between different
activities on site. These scope and reporting limitations make it very difficult to either directly use in, or reconcile the reported
data with the IPCC format emissions calculated and presented within the UK and DA GHG inventories.
As a result of these data format and data quality issues, the derivation of traded and non-traded emission estimates requires:
(i) IPCC sector aggregation or division, altering the detail of the IPCC sector reporting format, to match the level of detail
available from EU ETS reporting for specific industries. Examples include the division of 1A1c to enable data to then be
aggregated with other IPCC sectors for iron and steel sector reporting (1A1c coke production, aggregated with 1A2a, 2A3
and 2C1), oil & gas sector reporting (1A1c gas use, aggregated with 1B2c flaring and venting), leaving 1A1c (gas production)
and 1A1c (other energy industries) to be reported separately. In addition, cement combustion (1A2f_cement) must be
reported aggregated with the decarbonisation sources (2A1) to enable comparison against EU ETS.
(ii) Calculation of non-traded DA GHGI data such that the data inconsistencies between DUKES and EU ETS fuel use are
minimised, removing the inconsistencies by (in most cases) assuming that the EU ETS data for a given sector are the more
accurate estimates.

Appendix 4: Emission Analysis and Methods used for Devolved Administrations’ Traded and Non-Traded Emissions
Greenhouse Gas Inventories for England, Scotland, Wales and Northern Ireland: 1990-2014 52
The comparison between reported EU ETS emissions and the DA GHG inventory data are presented by (amended) IPCC sector. [Note that
the data presented in the tables below have been rounded to 3 or 4 significant figures, and the data may not always appear to be fully
consistent as a result.]
Detailed tables showing the full DA traded and non-traded emission estimates for 2008-2014, including detail of the additional end user
emissions from use of electricity and non-electricity fuels, are provided in the supporting MS Excel spreadsheet.
A4.2.1 Devolved Administrations’ Traded and Non-Traded GHG Emission Estimates (2008-2014)
The traded and non-traded emission estimates for each of the DAs for 2008 to 2014 are summarised in the tables below. In each case, data
are presented for:
Annual total traded GHG emissions;
Annual total non-traded GHG emissions;
Annual total GHG inventory emissions;
Non-traded sector percentage share of the total GHG inventory.
Table A4. 1: Devolved Administrations’ Traded and Non-Traded Emission Estimates, 2008-2014
Country Emissions scope (all units: kt CO2e)
2008 2009 2010 2011 2012 2013 2014
ENGLAND
Traded Emissions 193,390 168,549 169,373 160,313 169,199 160,906 140,102
Non-Traded Emissions 303,891 282,965 290,579 264,084 269,734 261,865 249,141
Total inventory emissions 497,280 451,514 459,952 424,397 438,933 422,771 389,242
Traded Share 38.9% 37.3% 36.8% 37.8% 38.5% 38.1% 36.0%
SCOTLAND
Traded Emissions 23,765 21,962 24,041 20,056 20,349 19,441 17,002
Non-Traded Emissions 35,040 32,402 32,451 29,593 29,972 29,344 27,425
Total inventory emissions 58,805 54,364 56,492 49,648 50,322 48,785 44,426
Traded Share 40.4% 40.4% 42.6% 40.4% 40.4% 39.9% 38.3%
WALES
Traded Emissions 26,611 21,846 24,069 22,616 24,705 29,644 26,191
Non-Traded Emissions 24,068 22,080 22,725 21,009 21,150 20,776 20,211
Total inventory emissions 50,679 43,926 46,794 43,625 45,855 50,420 46,402
Traded Share 52.5% 49.7% 51.4% 51.8% 53.9% 58.8% 56.4%
N IRELAND
Traded Emissions 5,864 4,332 4,627 4,383 4,505 4,708 4,480
Non-Traded Emissions 16,546 16,499 17,127 16,046 16,200 16,243 15,846
Total inventory emissions 22,409 20,831 21,754 20,429 20,705 20,951 20,327
Traded Share 26.2% 20.8% 21.3% 21.5% 21.8% 22.5% 22.0%
UNALLOCATED
Traded Emissions 15,231 15,064 15,124 13,356 12,341 12,400 11,003
Non-Traded Emissions 1,850 2,102 1,942 1,971 2,326 1,932 3,024
Total inventory emissions 17,081 17,166 17,067 15,327 14,667 14,332 14,026
Traded Share 89.2% 87.8% 88.6% 87.1% 84.1% 86.5% 78.4%
UNITED KINGDOM
Traded Emissions 264,861 231,753 237,234 220,723 231,099 227,098 198,777
Non-Traded Emissions 381,394 356,049 364,825 332,704 339,383 330,161 315,646

Appendix 4: Emission Analysis and Methods used for Devolved Administrations’ Traded and Non-Traded Emissions
Greenhouse Gas Inventories for England, Scotland, Wales and Northern Ireland: 1990-2014 53
Country Emissions scope (all units: kt CO2e)
2008 2009 2010 2011 2012 2013 2014
Total inventory emissions 646,255 587,801 602,059 553,427 570,482 557,260 514,424
Traded Share 41.0% 39.4% 39.4% 39.9% 40.5% 40.8% 38.6%
A4.2.2 Analysis of Emissions 2008-2014
The DA traded and non-traded emission estimates illustrate the regional differences in the EU ETS coverage and significance in
the context of the overall DA inventories, which indicates the level of opportunity for DA policy actions in the non-traded sector.
Note that the traded share percentages in the table above are influenced by the impact of Land Use, Land Use Change and
Forestry (LULUCF) sources and sinks on the overall DA inventories; in both Wales and (especially) Scotland there is a net carbon
sink in the LULUCF sector which reduces the net GHG inventory emissions total in the table above. Hence the higher traded share
percentage for Wales and Scotland is somewhat misleading in the context of GHG emissions in energy and industrial process
sources.
Note that there are considerable uncertainties in the DA inventory estimates due to the limited energy consumption data by DA.
Therefore whilst it may be useful to consider the relative opportunity for DA policy action in future mitigation efforts across
different sectors by looking at the non-traded data in more detail, there is an underlying need for greater (energy) data gathering
at DA level to improve the evidence base for policy development.
The UK traded share was 41% in 2008, down to 39-40% in 2009 to 2011. The inventory data indicates that as the recession
affected the economy in 2008-9, the traded emissions declined at a greater rate (down 13% 2008-9) than the non-traded
emissions (down 7% 2008-9). As the economy then picked up in 2009-10 combined cold winters at the start and end of 2010, the
non-traded emissions grew at a slightly greater rate (up 2.5%) than the traded sector emissions (up 2.4%). Between 2010 and
2011, both the traded and non-traded sectors have reduced by around 7-9% and then increased between 2011 and 2012, with
traded emissions increasing by almost 5% and non-traded by 2%. In 2013, traded emissions fell slightly, by 2%, with a greater fall
in non-traded emissions, down 3%. However, in 2014 a notable drop in traded emissions of 12% is almost entirely due to a sharp
decline in the quantity of coal used in the generation of electricity, with the closure of two coal fired power stations. Non-traded
emissions also fell by around 4% in 2014, due in part to lower reported fuel use across the economy.
The Northern Ireland inventory has a much higher non-traded element compared to GB, with only 22% of inventory emissions
within the EU ETS in 2014, compared to the 39% UK average; this reflects the lower level of heavy industry in Northern Ireland,
where there are no refineries, oil & gas terminals or iron and steel works for example. Analysis of the 2014 EU ETS data shows
that Northern Ireland has a 2.5% share of the power sector traded emissions, whilst the only sectors where Northern Ireland has
a higher share are in the cement sector (3.9% of UK sector traded emissions), glass sector (4.5% of UK sector emissions), food and
drink sector (4.4% of UK sector emissions) and the other industrial combustion sector (3.3% of UK sector traded emissions) in
2014.
In Northern Ireland, the non-traded share of GHG emissions declined by less than 1% between 2008-2009, and then grew by
around 4% in 2009-10; note that there is greater uncertainty in the non-traded emission estimates in Northern Ireland due to the
much greater reliance on solid and liquid fuel use within the economy, the estimates of which are more uncertain than those for
metered fuels (gas, electricity). Nevertheless, this notably lower reduction in the non-traded share in Northern Ireland in 2008-9
and lesser growth in 2009-10 may reflect the greater impact on emissions related to the energy-intensive industries evident in
GB, where a lesser demand for fuels within a shrinking UK economy would be expected to have a knock-on effect to ancillary
services to the energy sector (for example, a reduction in energy and heavy industry transport-related emissions, which are
within the non-traded sector). In recent years, trends in the non-traded sector are broadly similar to the UK but typically showing
smaller decreases or increases; in 2014 the Northern Ireland non-traded share declined around 1% compared to 4.4%% across
the UK.
The data for Wales show that the coverage of the EU ETS is consistently higher than the UK average, which reflects the high share
of heavy industries in Wales; Wales exports electricity to England and has a high percentage of UK refinery capacity and iron and
steel manufacture. As a result, the non-traded sector in Wales (which is the focus for WG Climate Change Strategy policy actions
and targets) is around 44% of total GHG emissions, compared to the UK average of around 61% of emissions in the non-traded
sector.
In 2007 (the last year of Phase I of the EU ETS) the non-traded share of Wales carbon dioxide emissions was estimated to be
around 48% of the total inventory; the expansion of the coverage of sites and sources within EU ETS in Phase II of the scheme
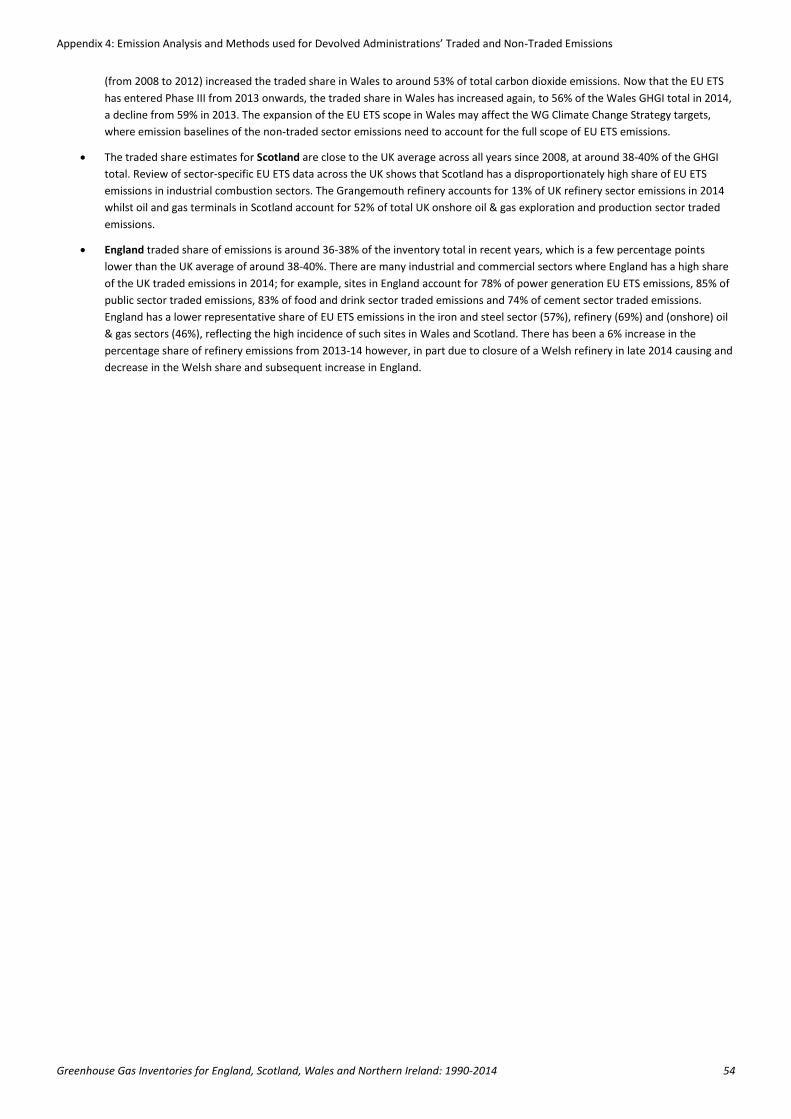
Appendix 4: Emission Analysis and Methods used for Devolved Administrations’ Traded and Non-Traded Emissions
Greenhouse Gas Inventories for England, Scotland, Wales and Northern Ireland: 1990-2014 54
(from 2008 to 2012) increased the traded share in Wales to around 53% of total carbon dioxide emissions. Now that the EU ETS
has entered Phase III from 2013 onwards, the traded share in Wales has increased again, to 56% of the Wales GHGI total in 2014,
a decline from 59% in 2013. The expansion of the EU ETS scope in Wales may affect the WG Climate Change Strategy targets,
where emission baselines of the non-traded sector emissions need to account for the full scope of EU ETS emissions.
The traded share estimates for Scotland are close to the UK average across all years since 2008, at around 38-40% of the GHGI
total. Review of sector-specific EU ETS data across the UK shows that Scotland has a disproportionately high share of EU ETS
emissions in industrial combustion sectors. The Grangemouth refinery accounts for 13% of UK refinery sector emissions in 2014
whilst oil and gas terminals in Scotland account for 52% of total UK onshore oil & gas exploration and production sector traded
emissions.
England traded share of emissions is around 36-38% of the inventory total in recent years, which is a few percentage points
lower than the UK average of around 38-40%. There are many industrial and commercial sectors where England has a high share
of the UK traded emissions in 2014; for example, sites in England account for 78% of power generation EU ETS emissions, 85% of
public sector traded emissions, 83% of food and drink sector traded emissions and 74% of cement sector traded emissions.
England has a lower representative share of EU ETS emissions in the iron and steel sector (57%), refinery (69%) and (onshore) oil
& gas sectors (46%), reflecting the high incidence of such sites in Wales and Scotland. There has been a 6% increase in the
percentage share of refinery emissions from 2013-14 however, in part due to closure of a Welsh refinery in late 2014 causing and
decrease in the Welsh share and subsequent increase in England.

Appendix 5: Mapping between Source Name, IPCC Category and National Communication
Greenhouse Gas Inventories for England, Scotland, Wales and Northern Ireland: 1990-2014 55
Appendix 5: Mapping between Source Name, IPCC Category and National
Communication
The table below presents a mapping between source name, IPCC category and National Communication category used to categorise
emissions/removals for England, Wales, Scotland, Northern Ireland and un-allocated (emissions from the off-shore industry and its
terminals producing oil and gas).
Table A5. 1: Mapping between Source Name, IPCC Category and National Communication
Sector Graph Categories IPCC sectors Source Name
Energy Supply
Electricity production 1A1ai Public Electricity & Heat Production Miscellaneous industrial/commercial combustion
Power stations
Public sector combustion
2A4d Other process uses of carbonates:
other Power stations - FGD
Gas production 1B2b1 Gas exploration Upstream Gas Production - Offshore Well Testing
1B2b3 Gas processing Upstream Gas Production - process emissions
1B2b4 Gas transmission and storage Gas leakage
Upstream Gas Production - Gas terminal storage
1B2b5 Gas distribution Gas leakage
Liquid fuel production 1A1b Petroleum Refining Refineries - combustion
1B2a1 Oil exploration Upstream Oil Production - Offshore Well Testing
1B2a2 Oil Production Petroleum processes
Upstream Oil Production - process emissions
1B2a3 Oil transport Upstream Oil Production - Offshore Oil Loading
Upstream Oil Production - Onshore Oil Loading
1B2a4 Oil refining/storage Upstream Oil Production - Oil terminal storage
Offshore industry 1B2c Flaring Gas Upstream Gas Production - flaring
1B2c Flaring Oil Upstream Oil Production - flaring
1B2c Venting Gas Upstream Gas Production - venting
1B2c Venting Oil Upstream Oil Production - venting
Fuel production 1A1ci Manufacture of solid fuels Coke production
Solid smokeless fuel production
1A1cii Oil and gas extraction Upstream Gas Production - fuel combustion
Upstream oil and gas production - combustion at gas
separation plant
Upstream Oil Production - fuel combustion
1A1ciii Other energy industries Collieries - combustion
Gas production
Nuclear fuel production
Town gas manufacture
1B1ai Underground mines: Abandoned Closed Coal Mines
1B1ai Underground mines: Mining
activities Deep-mined coal
1B1ai Underground mines: Post-mining
activities Coal storage and transport
1B1aii Surface mines: Mining activities Open-cast coal
1B1b Solid Fuel Transformation Charcoal production
Coke production
Iron and steel - flaring
Solid smokeless fuel production
Transport Aircraft and airports 1A3a Domestic aviation Aircraft - domestic cruise
Aircraft - domestic take-off and landing
1A3eii Other Transportation Aircraft - support vehicles
Other transport 1A3c Railways Rail - coal
Railways - freight
Railways - intercity
Railways - regional
1A3d Domestic navigation Inland goods-carrying vessels
Motorboats / workboats (e.g. canal boats, dredgers, service
boats, tourist boats, river boats)
Personal watercraft e.g. jet ski
Sailing boats with auxiliary engines
Shipping - coastal
1A4ai Commercial/Institutional Railways - stationary combustion

Appendix 5: Mapping between Source Name, IPCC Category and National Communication
Greenhouse Gas Inventories for England, Scotland, Wales and Northern Ireland: 1990-2014 56
Sector Graph Categories IPCC sectors Source Name
1A4ciii Fishing Fishing vessels
1A5b Other: Mobile Aircraft - military
Shipping - naval
2D1 Lubricant Use Marine engines
Road transport 1A3bi Cars Road transport - cars - cold start
Road transport - cars - motorway driving
Road transport - cars - rural driving
Road transport - cars - urban driving
1A3bii Light duty trucks Road transport - LGVs - cold start
Road transport - LGVs - motorway driving
Road transport - LGVs - rural driving
Road transport - LGVs - urban driving
1A3biii Heavy duty trucks and buses Road transport - buses and coaches - motorway driving
Road transport - buses and coaches - rural driving
Road transport - buses and coaches - urban driving
Road transport - HGV articulated - motorway driving
Road transport - HGV articulated - rural driving
Road transport - HGV articulated - urban driving
Road transport - HGV rigid - motorway driving
Road transport - HGV rigid - rural driving
Road transport - HGV rigid - urban driving
1A3biv Motorcycles Road transport - mopeds (<50cc 2st) - urban driving
Road transport - motorcycle (>50cc 2st) - rural driving
Road transport - motorcycle (>50cc 2st) - urban driving
Road transport - motorcycle (>50cc 4st) - motorway driving
Road transport - motorcycle (>50cc 4st) - rural driving
Road transport - motorcycle (>50cc 4st) - urban driving
1A3bv Other road transport Road transport - all vehicles LPG use
2D1 Lubricant Use Road vehicle engines
2D3 Non-energy products from fuels and
solvent use: Other Road transport - urea
Residential Aerosols and metered dose inhalers and other household products
2D2 Non-energy products from fuels and solvent use: Paraffin wax use
Non-aerosol products - household products
2F4a Metered dose inhalers Metered dose inhalers
2F4b Aerosols: Other Aerosols - halocarbons
Other residential 5B1a composting municipal solid waste Composting (household)
5C2.2b Non-biogenic: Other Accidental fires - dwellings
5C2.2b Non-biogenic: Other Accidental
fires (vehicles) Accidental fires - vehicles
Residential combustion 1A4bi Residential stationary Domestic combustion
1A4bii Residential: Off-road House and garden machinery
Business Industrial combustion of fuels
1A2b Non-Ferrous Metals Autogeneration - exported to grid
Autogenerators
Non-Ferrous Metal (combustion)
1A2c Chemicals Chemicals (combustion)
1A2d Pulp Paper Print Pulp, Paper and Print (combustion)
1A2e food processing beverages and
tobacco Food & drink, tobacco (combustion)
1A2f Non-metallic minerals Cement production - combustion
Lime production - non decarbonising
Other industrial combustion
1A2gvii Off-road vehicles and other
machinery Industrial off-road mobile machinery
1A2gviii Other manufacturing industries
and construction Autogeneration - exported to grid
Autogenerators
Other industrial combustion
1A4ai Commercial/Institutional Miscellaneous industrial/commercial combustion
2B1 Chemical Industry: Ammonia
production Ammonia production - combustion
2B8g Petrochemical and carbon black
production: Other Chemicals (combustion)
2D1 Lubricant Use Industrial engines
Other industrial combustion
Iron and steel - combustion 1A2a Iron and steel Blast furnaces
Iron and steel - combustion plant
Other business 2D4 Other NEU Non Energy Use: petroleum coke

Appendix 5: Mapping between Source Name, IPCC Category and National Communication
Greenhouse Gas Inventories for England, Scotland, Wales and Northern Ireland: 1990-2014 57
Sector Graph Categories IPCC sectors Source Name
2G2 Particle accelerators Particle accelerators
2G3a Medical applications N2O use as an anaesthetic
5C2.2b Non-biogenic: Other Accidental fires - other buildings
Refrigeration and air conditioning
2E1 Integrated circuit or semiconductor Electronics - HFC
Electronics - NF3
2F1a Commercial refrigeration Commercial Refrigeration
2F1b Domestic refrigeration Domestic Refrigeration
2F1c Industrial refrigeration Industrial Refrigeration
2F1d Transport refrigeration Refrigerated Transport
2F1e Mobile air conditioning Mobile Air Conditioning
Use of fluorinated gases 2F1f Stationary air conditioning Stationary Air Conditioning
2F2a Closed foam blowing agents Foams
Foams HFCs for the 2006 GLs
2F2b Open foam blowing agents One Component Foams
2F3 Fire Protection Firefighting
2F5 Solvents Precision cleaning - HFC
2F6b Other Applications: Contained-
Refrigerant containers Refrigerant containers
2G1 Electrical equipment Electrical insulation
2G2 Military applications AWACS
2G2e Electronics and shoes Electronics - PFC
Electronics - SF6
Sporting goods
2G2e Tracer gas SF6 used as a tracer gas
Public Public 1A4ai Commercial/Institutional Public sector combustion
Industrial Process
Cement production 2A1 Cement Production Cement - decarbonising
Chemical industry 2B1 Ammonia Production Ammonia production - feedstock use of gas
2B10 Chemical Industry: Other Chemical industry - general
2B2 Nitric Acid Production Nitric acid production
2B3 Adipic Acid Production Adipic acid production
2B6 Titanium dioxide production Chemical industry - titanium dioxide
2B7 Soda Ash Production Chemical industry - soda ash
2B8a Methanol production Chemical industry - methanol
2B8b Ethylene Production Chemical industry - ethylene
2B8c Ethylene Dichloride and Vinyl
Chloride Monomer Chemical Industry - ethylene dichloride
2B8d Ethylene Oxide Chemical industry - ethylene oxide
2B8e Acrylonitrile Chemical industry - acrylonitrile
2B8f Carbon black production Chemical industry - carbon black
2B9a1 Fluorchemical production: By-
product emissions Halocarbons production - by-product
2B9b3 Fluorchemical production: Fugitive
emissions Halocarbons production - fugitive
2C3 Aluminium Production Primary aluminium production - PFC emissions
2G4 Other product manufacture and use Chemical Industry – other process sources
Iron and steel 2C1a Steel Basic oxygen furnaces
Electric arc furnaces
Ladle arc furnaces
2C1b Pig iron Iron and steel - flaring
2C1d Sinter Sinter production
Other processes 2A2 Lime Production Lime production - decarbonising
2A3 Glass production Glass - general
2A4a Other process uses of carbonates:
ceramics Brick manufacture - all types
Brick manufacture - Fletton
2C3 Aluminium Production Primary aluminium production - general
2C4 Magnesium production Magnesium cover gas
2C6 Zinc Production Non-ferrous metal processes
2G3b N2O from product uses: Other Other food - cream consumption
Agriculture Field burning of agricultural wastes
3F Field burning Field burning
Livestock 3A1 Enteric Fermentation dairy cattle Agriculture livestock - dairy cattle enteric
3A1 Enteric Fermentation non-dairy cattle Agriculture livestock - other cattle enteric
3A2 Enteric Fermentation sheep Agriculture livestock - sheep enteric
3A3 Enteric Fermentation swine Agriculture livestock - pigs enteric
3A4 Enteric Fermentation other: deer Agriculture livestock - deer enteric
3A4 Enteric Fermentation other: goats Agriculture livestock - goats enteric

Appendix 5: Mapping between Source Name, IPCC Category and National Communication
Greenhouse Gas Inventories for England, Scotland, Wales and Northern Ireland: 1990-2014 58
Sector Graph Categories IPCC sectors Source Name
3A4 Enteric Fermentation other: horses Agriculture livestock - horses enteric
3B1 Manure Management dairy cattle Agriculture livestock - dairy cattle wastes
3B1 Manure Management non-dairy
cattle Agriculture livestock - other cattle wastes
3B2 Manure Management sheep Agriculture livestock - sheep wastes
3B3 Manure Management swine Agriculture livestock - pigs wastes
3B4 Manure Management other: deer Agriculture livestock - deer wastes
3B4 Manure Management other: goats Agriculture livestock - goats wastes
3B4 Manure Management other: horses Agriculture livestock - horses wastes
3B4 Manure Management other: poultry Agriculture livestock - all poultry wastes
Agriculture livestock - broilers wastes
Agriculture livestock - laying hens wastes
Agriculture livestock - other poultry wastes
3B4 Other Agriculture livestock - manure leaching (indirect)
Agriculture livestock - manure liquid systems (indirect)
Agriculture livestock - manure other (indirect)
Agriculture livestock - manure solid storage and dry lot
(indirect)
Stationary and mobile combustion
1A4ci Agriculture/Forestry/Fishing: Stationary
Agriculture - stationary combustion
1A4cii Agriculture/Forestry/Fishing: Off-
road Agriculture - mobile machinery
2D1 Lubricant Use Agricultural engines
Fertilizer and urea application
3D Agricultural Soils Agricultural soils
3D1 Agricultural soils-
Mineralization/Immobilization Agricultural soils - Mineralization/Immobilization Associated with change in Soil Organic Matter
3G1 Liming - limestone Liming
3G2 Liming - dolomite Liming
3H Urea application Agriculture - application of urea
Land Use Change
Creation and maintenance of forests
4A2 Land converted to Forest Land Direct N2O emission from N fertilisation of forest land
4A Forest Land Forest Land - Drainage and rewetting and other management
of organic and mineral soils
4A1 Forest Land remaining Forest Land Forest Land remaining Forest Land - Biomass Burning -
Wildfires
Forest Land remaining Forest Land - Carbon stock change
4A2 5 Other land converted to Forest
Land Other land converted to Forest Land - Carbon stock change
4A2 4 Settlements converted to Forest
Land Settlements converted to Forest Land - Carbon stock change
4A2 2 Grassland converted to Forest Land Grassland converted to Forest Land - Carbon stock change
4A2 1 Cropland converted to Forest Land Cropland converted to Forest Land - Carbon stock change
Creation and maintenance of settlements
4E1 Settlements remaining Settlements Settlements remaining Settlements - Direct N2O emissions from N Mineralization/Immobilization
Settlements remaining Settlements - Carbon stock change
4E2 3 Grassland converted to Settlements Grassland converted to Settlements - Carbon stock change
Grassland converted to Settlements - Direct N2O emissions
from N Mineralization/Immobilization
4E2 2 Cropland converted to Settlements Cropland converted to Settlements - Carbon stock change
Cropland converted to Settlements - Direct N2O emissions
from N Mineralization/Immobilization
4E2 1 Forest Land converted to
Settlements Forest Land converted to Settlements - Carbon stock change
Forest Land converted to Settlements - Biomass Burning -
Controlled Burning
Forest Land converted to Settlements - Direct N2O emissions
from N Mineralization/Immobilization
Land converted to grass, crop and/or wetlands
4D2 Land converted to wetlands Land converted for Peat Extraction - Carbon stock change
Grassland converted to flooded land - Carbon stock change
4B2 2 Grassland converted to Cropland Grassland converted to Cropland - Carbon stock change
Grassland converted to Cropland - Direct N2O emissions
from N Mineralization/Immobilization
4B2 1 Forest Land converted to Cropland Forest Land converted to Cropland - Direct N2O emissions
from N Mineralization/Immobilization
Forest Land converted to Cropland - Biomass Burning -
Controlled Burning

Appendix 5: Mapping between Source Name, IPCC Category and National Communication
Greenhouse Gas Inventories for England, Scotland, Wales and Northern Ireland: 1990-2014 59
Sector Graph Categories IPCC sectors Source Name
Forest Land converted to Cropland - Carbon stock change
4C2 4 Settlements converted to Grassland Settlements converted to Grassland - Carbon stock change
4C2 3 Wetlands converted to Grassland Wetlands converted to Grassland - Carbon stock change
4C2 2 Cropland converted to Grassland Cropland converted to Grassland - Carbon stock change
4C2 1 Forest Land converted to Grassland Forest Land converted to Grassland - Direct N2O emissions
from N Mineralization/Immobilization
Forest Land converted to Grassland - Biomass Burning -
Controlled Burning
Forest Land converted to Grassland - Carbon stock change
Wood products 4G Harvested Wood Products HWP Produced and Exported - Carbon stock change
HWP Produced and Consumed Domestically - Carbon stock
change
4B1 Cropland remaining Cropland Cropland remaining Cropland - Biomass Burning - Wildfires
Cropland remaining Cropland - Carbon stock change
Land maintained as crops, grass or wetlands
4C1 Grassland remaining Grassland Grassland remaining Grassland - Direct N2O emissions from N Mineralization/Immobilization
Grassland remaining Grassland - Biomass Burning - Wildfires
Grassland remaining Grassland - Carbon stock change
4D1 Wetlands remaining wetlands Peat Extraction Remaining Peat Extraction - Carbon stock
change
4B Cropland Cropland - Drainage and rewetting and other management of
organic and mineral soils
4B2 4 Settlements converted to Cropland Settlements converted to Cropland - Carbon stock change
4C Grassland Grassland - Drainage and rewetting and other management
of organic and mineral soils
4D Wetlands Wetlands - Drainage and rewetting and other management
of organic and mineral soils
Waste Management
Biological treatment 5B1a composting municipal solid waste Total composting (non-household)
5B2a Anaerobic digestion municipal solid
waste Mechanical Biological Treatment
Anaerobic Digestion (other)
Landfill 5A1a Managed Waste Disposal sites
anaerobic Landfill
Waste incineration 5C1.1b Biogenic: Sewage sludge Incineration - sewage sludge
5C1.2a Non-biogenic: municipal solid
waste Incineration
5C1.2b Non-biogenic: Clinical waste Incineration - clinical waste
5C1.2b Non-biogenic: Other Chemical
waste Incineration - chemical waste
Waste-water handling 5D1 Domestic wastewater treatment Sewage sludge decomposition
Sewage sludge decomposition in private systems
5D2 Industrial wastewater treatment Industrial Waste Water Treatment
Exports International aviation Aviation Bunkers Aircraft - international cruise
Aircraft - international take-off and landing
Aircraft between UK and CDs - Cruise
Aircraft between UK and CDs - TOL
Aircraft between UK and Gibraltar - Cruise
Aircraft between UK and Gibraltar - TOL
Aircraft between UK and other OTs (excl Gib.) - Cruise
Aircraft between UK and other OTs (excl Gib.) - TOL
Aircraft engines
International shipping Marine Bunkers Shipping - international IPCC definition
Shipping between UK and Gibraltar
Shipping between UK and OTs (excl. Gib)

Appendix 6: Recalculations between the previous and this current Devolved Administrations’ GHG Inventory
Greenhouse Gas Inventories for England, Scotland, Wales and Northern Ireland: 1990-2014 60
Appendix 6: Recalculations between the previous and this current
Devolved Administrations’ GHG Inventory
This provides details of recalculations between 1990-2013 Devolved Administrations’ (DA) greenhouse gas (GHG) Inventory estimates
(Salisbury et al., 2015) and the latest 1990-2014 DA GHG Inventory estimates.
A6.1 Introduction Each year, the GHG inventories for England, Scotland, Wales and Northern Ireland are extended and updated. The time series of the
inventories are extended to include the latest inventory year, and the inventories are revised to reflect any new or amended activity or
emission factor data.
Data revisions may lead to changes to emission estimates for any year in the time-series. Core energy statistics (all DECC references) are
revised annually and hence historical data from DECC may be different from that used in the compilation of the previous inventory report.
Similarly, where new research has derived a more representative emission factor for a given activity, then the GHG time-series estimates
will be revised accordingly.
New data may become available due to the implementation of new regulations, or through the commissioning of bespoke research into
activities and emissions for a given source. For example, new data on fuel use and fuel quality across several source sectors has become
available for use in the UK and DA GHG inventories through the European Union Emissions Trading System (EU ETS).
The nature of emission inventories is such that improvements to data collection or estimation techniques will inevitably lead to some
revisions of historical data. Therefore, it is not appropriate to use data from previous reports and compare them with the figures in this
report, without taking account of any changes to either the emission estimation methodology or the source data.
As a consequence of the development of DA-specific climate change legislation and strategies to reduce GHG emissions in each of the DAs,
the emissions data and trends reported within the DA GHG inventories are coming under ever-greater scrutiny. The sensitivity of the DA
data to changes in activities within sectors from implemented action has been researched by recent climate change policy studies.
Measures, policies and strategies continue to be developed to reduce GHG emissions; some policies and measures impact upon one sector,
whilst others (e.g. promoting energy efficiency) may impact across many source sectors. Wales, Scotland, Northern Ireland and England
each have devolved responsibility to address GHG emissions, and there are an increasing range of country-specific statutory and policy
commitments.
To support the actions implemented within each country, the DA GHG inventories continue to be developed, aiming to provide an effective
and accurate reporting tool and reflect the impact upon emissions from the implementation of both devolved and reserved measures. The
programme of improvement for the DA inventories includes periodic review of the available source data and estimation methods, in
parallel with the programme of improvement to the UK GHG inventory.
A6.2 Revisions and Updates to the Greenhouse Gas Inventories In the derivation of the 1990-2014 DA GHGI datasets, the inventory methods and data sources for several GHG emission source sectors
have been revised and improved.
The main impacts of recalculations for each Devolved Administration are presented in the chapters of the main report. Full details of the
magnitude and reasons for changes are presented in the table below.

Appendix 6: Recalculations between the previous and this current Devolved Administrations’ GHG Inventory
Greenhouse Gas Inventories for England, Scotland, Wales and Northern Ireland: 1990-2014 61
Table A6. 1: Reasons for recalculations between last year’s (2015) and this year’s (2016) GHG estimates for 2013 and 1990, by Sector
England Scotland Wales Northern Ireland
IPCC Sector Reasons for change
Change in emissions for 1990 (ktCO2e)
Change in emissions for 2013 (ktCO2e)
Change in emissions for 1990 (ktCO2e)
Change in emissions for 2013 (ktCO2e)
Change in emissions for 1990 (ktCO2e)
Change in emissions for 2013 (ktCO2e)
Change in emissions for 1990 (ktCO2e)
Change in emissions for 2013 (ktCO2e)
Total -3,101 -5,261 -3,506 -1,839 -1,131 -278 -2,059 -1,401
-0.48% -1.13% -4.35% -3.47% -1.93% -0.54% -7.62% -6.12%
Agriculture
The most significant change in the agriculture sector is the implementation of UK-specific N2O emission factors for agricultural soils. Previously, the emission estimates were based on a standard non-UK specific value.
-4,360 -3,360 -1,160 -819 -783 -643 -729 -677
Business Recalculations are due to changes in DUKES: an increase in gas oil use in off-road machinery and a reduction in natural gas use in the commercial/industrial sector.
179 279 16 86 4 -140 7 15
Energy Supply
Very small recalculations in this sector are mainly due to an increase in the natural gas use in power stations. In Scotland in 2013, revised estimates of natural gas use in upstream oil and gas, and revisions to coal and MSW use in power stations has led to an overall decrease.
450 35 45 -33 58 93 50 27
Industrial Process
Very minor changes except in England where a new source of N2O from chemical production was added to the UK and DA GHG inventory in this submission. Emissions from sinter production in Wales in 2013 have been revised downwards slightly. Estimates for all DAs now include new (small) estimates of N2O emissions from use as a propellant in products such as squirty cream.
21 227 -2 4 -9 -27 1 1
Land Use Change
The most significant change is in the method for aggregating the output from the CARBINE model for Forest remaining Forest, allowing for the 20 year transition period, which was corrected to ensure that carbon stock changes were attributed to the correct reporting years. There was also a correction of the emissions factor for drainage of grassland on organic soil, which significantly reduces the emissions from this source
504 -1,585 -2,429 -974 -398 278 -1,398 -1,095
Public
Minor changes to estimates due to changes in fuel consumption. The most prominent is the reduction in emissions from the consumption of coal in Northern Ireland, due to provision of new PSEC data for 2013 and 2014.
-15 -38 -1 8 -1 -8 -1 -24

Appendix 6: Recalculations between the previous and this current Devolved Administrations’ GHG Inventory
Greenhouse Gas Inventories for England, Scotland, Wales and Northern Ireland: 1990-2014 62
England Scotland Wales Northern Ireland
IPCC Sector Reasons for change
Change in emissions for 1990 (ktCO2e)
Change in emissions for 2013 (ktCO2e)
Change in emissions for 1990 (ktCO2e)
Change in emissions for 2013 (ktCO2e)
Change in emissions for 1990 (ktCO2e)
Change in emissions for 2013 (ktCO2e)
Change in emissions for 1990 (ktCO2e)
Change in emissions for 2013 (ktCO2e)
Residential
Recalculations are due to an increase in DUKES in the amount of biomass and burning oil combusted in this sector, which is partially offset by a reduction in natural gas consumption. The impact of these changes across the DAs differs according to the relative significance of each fuel in the sector at the DA-level.
-136 -58 -38 35 -19 51 57 135
Transport
Recalculations are due to change from using Department for Transport factors derived by TRL for fuel consumption and methane, to using the continuously updated COPERT 4 factors recommended in international guidelines. In addition, updated activity data have been used for the 2013 estimates in Northern Ireland.
543 -76 99 60 37 126 -31 227
Waste Management Recalculations are mainly due to updates to the emission factor for domestic waste water treatment to align with international guidelines.
-301 -1,095 -27 -139 -15 -69 -12 -39
Exports These small recalculations are mainly due to changes in DUKES. 13 412 -8 -66 -4 63 -2 27

Appendix 7: Supporting Data Tables and Graphs
Greenhouse Gas Inventories for England, Scotland, Wales and Northern Ireland: 1990-2014 63
Appendix 7: Supporting Data Tables and Graphs
The following tables and graphs provide additional information to supplement the main report. This information is not available in the
inventory data distributed alongside this report.
Methane emissions from livestock by type (2014)
Energy generation data for each Devolved Administration by fuel type (2006-2014)
Generation of electricity from renewable sources for each Devolved Administration by source type (2014)
Carbon dioxide emissions data for the two methodological approaches presented for Road Transport (1990-2014)
Table A7. 1: Methane emissions from livestock by type (ktCO2e, 2014)
England Scotland Wales Northern Ireland
Cattle 11,921 3,734 2,462 3,405
Deer 10.8 3.54 0.51 1.31
Goats 10.8 0.60 1.42 0.43
Horses 382 37 47 17.1
Pigs 664 52.9 4.81 86.1
Poultry 62.4 7.52 4.16 9.63
Sheep 1,979 885 1,293 251
Table A7. 2: Energy generation data from Major Power Producers for each Devolved Administration by fuel type (GWh, 2006-2014)
2006 2007 2008 2009 2010 2011 2012 2013 2014
England 273,71
4 279,551 264,268 259,093 266,462 255,220 253,275 247,696 232,902
Coal 116,26
3 111,318 97,310 79,473 81,542 86,485 115,105 105,319 80,369
Gas 98,220 118,370 129,165 125,415 135,063 111,346 74,204 72,505 80,126
Nuclear 54,300 45,001 30,327 46,295 41,315 46,725 49,214 47,783 45,161
Oil 2,158 2,469 3,793 3,484 1,992 862 933 563 326
Renewables and Hydro
2,773 2,393 3,673 4,426 6,550 9,802 13,819 21,526 26,920
Northern Ireland 9,786 8,563 9,234 7,629 7,128 7,320 6,573 6,705 6,521
Coal 2,701 1,833 2,040 1,371 1,817 1,414 2,367 2,606 2,159
Gas 6,799 6,576 6,537 5,642 4,840 5,301 3,609 3,457 3,679
Nuclear 0 0 0 0 0 0 0 0 0
Oil 286 154 334 78 73 52 44 20 23 Renewables and Hydro
0 0 323 538 398 553 553 622 660
Scotland 44,343 41,338 44,055 44,198 43,401 44,275 44,214 46,158 42,382
Coal 17,488 13,802 11,591 11,896 14,653 10,728 11,867 10,802 10,152
Gas 8,346 8,938 9,822 7,430 6,618 6,227 3,680 3,497 880
Nuclear 14,141 12,344 15,079 16,681 15,293 16,892 17,050 18,498 16,633
Oil 914 379 431 278 206 160 155 161 181 Renewables and Hydro
3,454 5,875 7,132 7,913 6,631 10,268 11,462 13,200 14,536
Wales 29,576 27,111 33,563 27,762 27,646 22,741 21,242 20,740 15,607
Coal 8,859 5,121 9,364 6,547 5,929 6,170 10,824 11,478 7,478
Gas 13,272 15,461 16,059 14,111 15,227 9,880 4,737 3,432 4,187
Nuclear 7,010 5,684 7,080 6,122 5,532 5,364 4,141 4,326 1,953
Oil 0 0 0 0 0 0 0 0 0
Renewables and Hydro
435 845 1,060 982 958 1,327 1,540 1,504 1,989

Appendix 7: Supporting Data Tables and Graphs
Greenhouse Gas Inventories for England, Scotland, Wales and Northern Ireland: 1990-2014 64
Table A7. 3: Generation of electricity from renewable sources, GWh, 2014 (DECC, 2015g)
Hydro Wind Wave and
tidal Landfill gas
Sewage gas
Other bioenergy
Solar PV Total
England 98.8 16,429.1 0.1 4,256.7 773.4 15,080.3 3,447.1 40,085.4
Scotland 5,435.8 11,664.1 2.1 533.5 28.2 1,166.5 131.7 18,961.9
Wales 275.7 2,331.6 - 193.5 43.6 330.5 234.3 3,409.3
Northern Ireland 28.2 1,454.3 0.0 61.3 0.7 104.4 45.7 1,694.6
Note that the data above comprise generation of electricity from renewable sources from Major Power Producers (as summarised in Table
A7. 2 above) and also from other generators. The data are consistent with data presented in Table 2 on page 58 of the December 2015
Energy Trends publication from DECC (DECC, 2015b), and include the generation of electricity from: thermal renewables, hydro natural
flow, and non-thermal renewables. The data exclude generation of electricity from hydro pumped storage or use of wastes.

Appendix 7: Supporting Data Tables and Graphs
Greenhouse Gas Inventories for England, Scotland, Wales and Northern Ireland: 1990-2014 65
Table A7. 4: Carbon dioxide emissions data for the two methodological approaches presented for Road Transport (1990-2014)
England 1990 1995 1998 1999 2000 2001 2002 2003 2004 2005 2006 2007 2008 2009 2010 2011 2012 2013 2014
CO2 (vkm) Cars 51,345 53,009 55,405 56,352 56,011 56,878 58,088 57,904 58,468 58,072 58,710 58,673 57,480 56,677 54,356 54,114 53,390 52,306 52,321
LGVs 8,421 9,527 10,734 10,860 10,999 11,135 11,236 11,716 12,284 12,537 12,945 13,443 12,997 12,638 12,696 12,886 12,948 13,141 13,642
HGVs 14,289 14,281 14,979 15,115 15,128 15,246 15,582 15,785 16,414 16,420 16,542 16,694 15,901 14,325 14,522 14,290 14,220 14,347 14,576
Buses 3,573 3,818 3,870 3,839 3,646 3,581 3,568 3,715 3,638 3,598 3,680 3,725 3,360 3,290 3,291 3,038 2,870 2,919 2,893
Motorcycles 576 392 449 494 489 510 530 582 531 552 524 555 503 506 445 442 423 397 407
TOTAL 78,203 81,027 85,438 86,660 86,273 87,350 89,004 89,701 91,336 91,179 92,402 93,089 90,242 87,436 85,309 84,771 83,852 83,110 83,839
CO2 (fuel sales) Cars 58,914 59,216 61,692 62,853 62,625 62,548 63,808 62,734 63,008 63,055 62,542 62,694 61,002 59,084 57,250 56,717 56,480 55,436 55,873
LGVs 9,777 10,883 12,094 12,034 12,053 12,078 12,170 12,529 12,935 13,290 13,600 14,091 13,305 13,098 13,405 13,510 13,652 13,814 14,355
HGVs 16,982 16,618 16,982 16,704 16,463 16,472 16,820 16,836 17,216 17,348 17,342 17,454 16,203 14,836 15,337 14,982 14,989 15,070 15,319
Buses 4,246 4,443 4,387 4,242 3,968 3,869 3,852 3,963 3,815 3,801 3,858 3,894 3,424 3,407 3,476 3,185 3,026 3,067 3,040
Motorcycles 659 436 499 552 550 563 585 633 578 605 562 599 545 530 468 463 448 424 441
TOTAL 90,579 91,595 95,654 96,386 95,660 95,529 97,234 96,695 97,552 98,098 97,904 98,732 94,478 90,954 89,936 88,858 88,595 87,811 89,028
Scotland 1990 1995 1998 1999 2000 2001 2002 2003 2004 2005 2006 2007 2008 2009 2010 2011 2012 2013 2014
CO2 (vkm) Cars 4,908 5,066 5,279 5,345 5,314 5,401 5,601 5,617 5,693 5,652 5,822 5,827 5,729 5,667 5,422 5,375 5,352 5,260 5,256
LGVs 812 924 1,092 1,113 1,096 1,100 1,127 1,177 1,225 1,260 1,321 1,394 1,366 1,333 1,347 1,360 1,374 1,397 1,453
HGVs 1,480 1,451 1,496 1,495 1,482 1,474 1,491 1,569 1,644 1,684 1,745 1,791 1,733 1,581 1,591 1,557 1,577 1,588 1,569
Buses 495 508 516 514 492 489 504 521 483 479 490 518 485 480 491 456 440 453 452
Motorcycles 32 24 26 29 30 31 34 38 36 36 34 37 35 35 31 31 30 30 30
TOTAL 7,728 7,973 8,408 8,495 8,413 8,494 8,757 8,921 9,080 9,111 9,412 9,567 9,348 9,097 8,881 8,780 8,773 8,727 8,760
CO2 (fuel sales) Cars 5,633 5,665 5,881 5,960 5,937 5,937 6,150 6,084 6,132 6,134 6,200 6,224 6,074 5,907 5,711 5,634 5,661 5,573 5,611
LGVs 943 1,056 1,230 1,233 1,201 1,193 1,220 1,258 1,289 1,336 1,387 1,462 1,399 1,381 1,422 1,425 1,449 1,469 1,529
HGVs 1,759 1,689 1,696 1,652 1,612 1,593 1,610 1,673 1,724 1,779 1,829 1,872 1,765 1,638 1,680 1,632 1,662 1,668 1,649
Buses 588 591 585 568 535 528 544 555 507 507 514 542 494 497 518 479 464 476 475
Motorcycles 37 26 29 32 33 34 38 42 39 39 37 39 38 37 33 33 32 31 33
TOTAL 8,961 9,027 9,420 9,446 9,319 9,284 9,562 9,612 9,692 9,794 9,967 10,139 9,770 9,460 9,364 9,203 9,268 9,217 9,297

Appendix 7: Supporting Data Tables and Graphs
Greenhouse Gas Inventories for England, Scotland, Wales and Northern Ireland: 1990-2014 66
Table A7. 4 (continued): Carbon dioxide emissions data for the two methodological approaches presented for Road Transport (1990-2014)
Wales 1990 1995 1998 1999 2000 2001 2002 2003 2004 2005 2006 2007 2008 2009 2010 2011 2012 2013 2014
CO2 (vkm) Cars 3,128 3,223 3,354 3,413 3,390 3,448 3,573 3,600 3,684 3,640 3,734 3,755 3,689 3,610 3,453 3,428 3,379 3,334 3,365
LGVs 523 599 676 691 699 705 724 755 790 808 834 863 850 832 843 852 853 869 902
HGVs 792 765 810 779 754 745 756 752 789 804 802 829 795 707 703 681 678 682 680
Buses 227 227 226 227 219 214 215 223 213 211 222 225 207 204 203 184 175 181 180
Motorcycles 27 19 22 24 25 26 27 29 27 28 27 28 27 27 23 24 23 22 23
TOTAL 4,698 4,834 5,089 5,134 5,086 5,138 5,295 5,359 5,503 5,492 5,620 5,700 5,568 5,381 5,225 5,169 5,109 5,088 5,150
CO2 (fuel sales) Cars 3,590 3,604 3,738 3,805 3,785 3,788 3,921 3,897 3,963 3,946 3,974 4,007 3,904 3,762 3,637 3,593 3,574 3,531 3,591
LGVs 608 684 762 765 765 764 784 807 832 857 877 905 870 862 890 893 899 914 949
HGVs 941 891 918 861 821 805 816 802 828 850 841 867 810 733 742 714 715 717 715
Buses 270 264 257 251 238 231 232 238 223 223 233 235 211 211 215 193 185 190 189
Motorcycles 31 22 24 27 28 28 30 31 29 31 29 31 29 28 25 25 25 23 25
TOTAL 5,440 5,465 5,699 5,709 5,636 5,617 5,783 5,775 5,876 5,906 5,953 6,044 5,825 5,596 5,509 5,418 5,397 5,375 5,468
Northern Ireland 1990 1995 1998 1999 2000 2001 2002 2003 2004 2005 2006 2007 2008 2009 2010 2011 2012 2013 2014
CO2 (vkm) Cars 1,890 2,115 2,295 2,399 2,487 2,557 2,560 2,605 2,731 2,751 2,793 2,887 2,782 2,846 2,769 2,721 2,674 2,696 2,707
LGVs 143 159 169 175 180 182 249 254 241 242 276 270 311 318 277 265 271 262 273
HGVs 391 423 449 469 486 505 609 760 693 715 715 717 687 682 644 604 601 592 596
Buses 63 72 75 77 79 81 70 67 68 68 58 70 67 66 70 73 84 86 86
Motorcycles 7 7 9 10 10 10 11 15 14 15 14 16 14 14 12 11 10 9 9
TOTAL 2,494 2,776 2,995 3,129 3,242 3,334 3,500 3,702 3,746 3,791 3,857 3,960 3,860 3,925 3,773 3,674 3,641 3,645 3,671
CO2 (fuel sales) Cars 2,169 2,368 2,560 2,673 2,770 2,805 2,804 2,815 2,928 2,971 2,966 3,073 2,933 2,963 2,918 2,852 2,827 2,855 2,885
LGVs 170 185 191 193 197 197 270 272 253 256 290 283 317 329 293 278 286 275 287
HGVs 464 492 509 518 529 545 658 811 727 756 750 749 700 706 680 633 633 622 627
Buses 75 84 85 85 87 87 75 72 71 72 61 73 68 68 74 76 89 90 90
Motorcycles 8 7 10 11 11 11 12 17 15 16 16 17 15 15 13 12 11 10 10
TOTAL 2,886 3,136 3,354 3,479 3,593 3,645 3,819 3,985 3,994 4,071 4,082 4,195 4,033 4,081 3,978 3,852 3,847 3,852 3,899

Appendix 7: Supporting Data Tables and Graphs
Greenhouse Gas Inventories for England, Scotland, Wales and Northern Ireland: 1990-2014 67
Figure A7. 1: Road transport CO2 emission trends calculated by constrained and unconstrained methodologies and vehicle kilometres trends, 1990-201
0
50
100
150
200
250
300
350
400
450
500
0
20000
40000
60000
80000
100000
120000
1990 1998 2000 2002 2004 2006 2008 2010 2012 2014
bill
ion
vkm
Car
bo
n D
ioxi
de
(kto
nn
e)England
CO2 (vkm) CO2 (fuel sales) VKM
0
5
10
15
20
25
30
35
40
45
50
0
2000
4000
6000
8000
10000
12000
1990 1998 2000 2002 2004 2006 2008 2010 2012 2014
bill
ion
vkm
Car
bo
n D
ioxi
de
(kto
nn
e)
Scotland
CO2 (vkm) CO2 (fuel sales) VKM
0
5
10
15
20
25
30
0
1000
2000
3000
4000
5000
6000
7000
1990 1998 2000 2002 2004 2006 2008 2010 2012 2014
bill
ion
vkm
Car
bo
n D
ioxi
de
(kto
nn
e)
Wales
CO2 (vkm) CO2 (fuel sales) VKM
0.0
5.0
10.0
15.0
20.0
25.0
0
1000
2000
3000
4000
5000
1990 1998 2000 2002 2004 2006 2008 2010 2012 2014
bill
ion
vkm
Car
bo
n D
ioxi
de
(kto
nn
e)
Northern Ireland
CO2 (vkm) CO2 (fuel sales) VKM

Appendix 8: Emissions and Removals of Greenhouse Gases from LULUCF for England, Scotland, Wales and Northern Ireland: 1990-2014
Greenhouse Gas Inventories for England, Scotland, Wales and Northern Ireland: 1990-2014 68
Appendix 8: Emissions and Removals of Greenhouse Gases from Land
Use, Land Use Change and Forestry (LULUCF) for England,
Scotland, Wales and Northern Ireland: 1990-2014
A8.1 Introduction
A8.1.1 National Reporting
The Centre for Ecology and Hydrology (CEH), under contract to the Department of Energy and Climate Change (DECC) and previously
under contract to the Department for Environment Food and Rural Affairs (Defra), produces yearly estimates of greenhouse gas emissions
arising as a result of land-use, land use change and forestry activities.
Under international conventions, reporting is required for the United Nations Framework Convention on Climate Change (UNFCCC) and
its Kyoto Protocol (KP) at the UK, Overseas Territories and Crown Dependencies level, and at the UK level for the European Union
Monitoring Mechanism (EUMM). KP reporting consists of five year commitment periods commencing in 2008. The second commitment
period started in 2013 and there have been changes to the reporting framework and the activities that the UK has chosen to elect.
Reporting on afforestation, reforestation, deforestation and forest management is mandatory (carbon credits from forest management
are now constrained by a Forest Management Reference Level approach rather than a cap). The UK has also elected Cropland
Management, Grazing Land Management and Wetland Drainage and Rewetting. The UK has reported Cropland Management and Grazing
Land Management for the first time in the 1990-2014 KP inventory and a work programme to develop methods and datasets for reporting
Wetland Drainage and Rewetting is underway. UK-level estimates are reported in the national statistical release in February. KP data for
the individual UK administrations is included in section 7.
LULUCF emissions estimates are reported as part of the UK Greenhouse Gas Inventory Report (Brown et al., 2016). Chapter 6 and Annex
3.6 of the National Inventory Report contain information on the LULUCF sector, and Chapter 11 contains additional information on the
reporting of LULUCF activities for the Kyoto Protocol.
The current LULUCF inventory methods use a combination of top-down and bottom-up12 approaches, based on activity data for each of
the UK Devolved Administrations and England and the UK as a whole. As a result of this approach, separate estimates of emissions and
removals from LULUCF activities are produced for England, Scotland, Wales and Northern Ireland, and these are summed to give emissions
and removals at the UK scale.
A8.1.2 UK Administration Reporting
This report details net emissions and removals for each UK administration for the 1990-2014 inventory and provides an explanation of
changes since the previous edition of this report (1990-2013)13. In the main text, the trends in CO2 emissions/removals are presented and
discussed for each UK administration and each category within the LULUCF sector, along with total emissions of methane and nitrous
oxide.
Summary tables for 1990, 1995, 2000, 2005, 2010, 2013 and 2014 are given for each country in section 6, and for LULUCF
emissions/removals under the Kyoto Protocol in section 7. A full set of GHG emissions/removals and associated areas and annual land
use change matrices for each country are published with this report. The data sources used in the compilation of the inventory are
described in section 8.
12 A top-down approach takes UK level activity data and spatially disaggregates it to report at the Devolved Administration level whereas a bottom-up approach takes
individual spatially-disaggregated activity data and combines it to give a UK national total.
13 http://naei.defra.gov.uk/reports/reports?report_id=810

Appendix 8: Emissions and Removals of Greenhouse Gases from LULUCF for England, Scotland, Wales and Northern Ireland: 1990-2014
Greenhouse Gas Inventories for England, Scotland, Wales and Northern Ireland: 1990-2014 69
A8.1.3 The LULUCF sector
The Land Use, Land Use Change and Forestry (LULUCF) sector includes carbon stock changes and emissions of greenhouse gases (carbon
dioxide (CO2), methane (CH4) and nitrous oxide (N2O)) from land use, land use change and forestry activities. Increases in carbon stocks
(representing a removal of CO2 from the atmosphere) are conventionally presented as negative quantities. Total greenhouse gas emissions
are described as carbon dioxide equivalents (CO2e), using Global Warming Potentials (GWP) of 25 for CH4 and 298 for N2O (IPCC 2006
Guidelines). CO2 comprises the majority of emissions (96%) and all of the removals (100%) for LULUCF in the UK.
The LULUCF sector comprises six categories: Forest Land, Cropland, Grassland, Wetland, Settlements, Other Land and Harvested Wood
Products.
Emissions and removals from land use arise from management activities on that land category. Emissions from land use change occur
following a change from one land use category to another. This will have an immediate impact on the biomass carbon stocks and a more
gradual impact on soils carbon stocks (over decades or even centuries), resulting in CO2 being emitted or removed, depending on whether
carbon stocks increase or decrease. These emissions are reported under Land converted to X for each category. After twenty years, the
area of land moves from Land converted to X into Land remaining X for each category. For example, the Grassland remaining Grassland
area in 1990 contains areas that underwent conversion prior to 1970, as well as long-established grassland. The area of Land converted
to Grassland in 1990 contains the areas that were converted between 1971 and 1990. However, despite the transition between reporting
categories, emissions and removals as a result of historical land use change continue to occur (and are reported) after the twenty year
transition period.
The Forest land category includes carbon stock gains and losses and GHG emissions from forest management. Emissions from this category
are relatively small and arise from fertilisation or drainage of afforested land (N2O) and from wildfires (CH4 and N2O). Carbon stock gains
and losses in forests and harvested wood products are modelled using the Forest Research CARBINE forest carbon accounting model. The
model is able to represent all of the introduced and native plantation and naturally-occurring species relevant to the UK, the different
growth rates of forests and four broad classes of forest management (clear-fell with thinnings, clear-fell without thinnings, thinned but
not clear-felled and no timber production).
The Cropland category includes soil and biomass carbon stock changes and N2O emissions associated with N mineralisation from land
conversion to Cropland, soil and biomass carbon stock changes due to cropland management, CO2 emissions from cropland on drained
organic soils and GHG emissions from wildfires on cropland (rare). Cropland soils tend to have lower carbon stocks than soils under other
land uses, so land use change to cropland results in a loss of carbon. Biomass carbon stock changes from cropland management are
included in the 1990-2014 inventory for the first time.
The Grassland category includes soil and biomass carbon stock changes and N2O emissions associated with N mineralisation from land
conversion to Grassland, biomass carbon stock changes due to grassland management, CO2 emissions from improved grassland on drained
organic soils and GHG emissions from biomass burning (wildfires and controlled burning following deforestation to grassland). Land
conversion to grassland will either result in a loss or gain of carbon stocks, depending on the original land category, but the balance is a
net removal of CO2 from the atmosphere. Biomass carbon stock changes from grassland management are included in the 1990-2014
inventory for the first time. Land use change between the Cropland and Grassland categories is a large source on emissions/removals in
the inventory, reflecting the use of rotational land management: work is being undertaken to refine the modelling of land use change
using additional data sources.
The Wetland category estimates emissions from managed peatlands (GHGs emitted from current and abandoned sites of commercial
peat extraction) and emissions arising from water reservoir establishment since 1990. Emissions from peat extraction sites are on-site
emissions arising from site disturbance and off-site emissions from horticultural peat. Off-site emissions from fuel peat are estimated in
the Energy Sector under Residential emissions in 1A4b of the NIR. Approximately 90% of the volume of peat sold in the UK is for
horticultural use, most of which is sold via retail for domestic use, and to the horticultural industry for use as growing media for
commercial plant propagation. A work programme is underway to implement new IPCC guidance on wetland emissions and removals
which will improve reporting of emissions from wetlands and organic soils under other categories.
The Settlements category includes soil and biomass carbon stock changes and N2O emissions associated with N mineralisation from land
conversion to Settlements and GHG emissions from controlled burning following deforestation to settlements.
Carbon stock changes in the Harvested Wood Products category are reported by product type (sawn timber, particleboard and paper)
and by whether they are domestically consumed or exported (emissions from imports are not reported). Harvested wood products are
produced from standard forest management and as a result of deforestation of Forest land to other land categories. Harvested Wood
Products represent a temporary removal of CO2 from the environment, until they reach the end of their lifecycle and decay releasing CO2.
Harvested Wood Products trends reflect the demand for, and lifetime of, timber products and forest management regimes.
Appendix 8: Emissions and Removals of Greenhouse Gases from LULUCF for England, Scotland, Wales and Northern Ireland: 1990-2014
Greenhouse Gas Inventories for England, Scotland, Wales and Northern Ireland: 1990-2014 70
A8.1.4 Changes to LULUCF Sector since the 1990-2013 inventory
With every annual update of the greenhouse gas inventory, emissions and removals will vary for each year from 1990 onwards due to the
incorporation of new datasets and methodologies used to underpin the inventory. An overview of the improvements and data revisions
since the 1990-2013 inventory is provided in Table A8. 1.
The largest changes were in the Forest, Grassland and Harvested Wood Product categories, due to the revision of carbon stock changes
and harvested wood products arising from Forest remaining Forest areas, the addition of reporting biomass carbon stock changes from
grassland management and the revision of the emissions factor for drainage of grassland on organic soils. The land use change soils model
was also re-run with corrected deforestation areas, the methodology for calculating emissions from controlled burning was updated and
additional activity data and revised methods were used to estimate areas of peatland extraction.
A detailed description of the changes in method and datasets can be found in Annex 3.6 of the 1990-2014 National Greenhouse Gas
Inventory Report. In addition to methodology changes, other changes arise from updated activity data since the previous reporting year.
All changes to LULUCF categories are summarised in Table A8. 1.
Table A8. 1: Improvements in the source data and/or methodology
IPCC Sector Method and data revisions
4A Forest Land The method for aggregating the output from the CARBINE model for Forest remaining Forest was corrected so
that carbon stock changes are reported for the correct years.
4B Cropland Biomass carbon stock changes due to cropland management are included for the first time. The land use
change soils model was corrected to use deforestation reduction factors for reducing the estimates of
deforestation derived from the Countryside Survey pre 2000 and expert judgement deforestation areas post
2000. The methodology and emissions factors for calculating emissions from controlled burning following
deforestation were updated to follow the IPCC 2006 guidance.
4C Grassland Biomass carbon stock changes due to grassland management are included for the first time. The emission
factor used for grassland drainage was corrected. The land use change soils model was corrected to use
deforestation reduction factors for reducing the estimates of deforestation derived from the Countryside
Survey pre 2000 and expert judgement deforestation areas post 2000. The methodology and emissions factors
for calculating emissions from controlled burning following deforestation were updated to follow the IPCC
2006 guidance.
4D Wetlands The methodology for estimating areas of peat extraction has been updated following new datasets becoming
available and the methodology used for tracking areas converted to and from peat extraction was corrected to
rectify a previous inconsistency.
4E Settlements The land use change soils model was corrected to use deforestation reduction factors for reducing the
estimates of deforestation derived from the Countryside Survey pre 2000 and expert judgement deforestation
areas post 2000. The methodology and emissions factors for calculating emissions from controlled burning
following deforestation were updated to follow the IPCC 2006 guidance.
4G Harvested
Wood Products
The method for aggregating the output from the CARBINE model for Harvested Wood Products arising from
Forest remaining Forest was revised so that they are reported for the correct years.

Appendix 8: Emissions and Removals of Greenhouse Gases from LULUCF for England, Scotland, Wales and Northern Ireland: 1990-2014
Greenhouse Gas Inventories for England, Scotland, Wales and Northern Ireland: 1990-2014 71
A8.2 LULUCF Emissions and Removals in England
A8.2.1 England LULUCF Trends
The 1990-2014 Inventory shows England is a net sink of greenhouse gases from LULUCF activities since 2004 (Figure A8. 2:
Emissions and removals of all gases by category for the LULUCF sector in England 1990-2014
In 1990 the England LULUCF sector was a net source at 2.8 Mt CO2e remaining fairly constant until 1995, followed by a steady decline to
-2.9 Mt CO2e in 2014 (see section 6 for emissions / removals by LULUCF category and gas).
The main influences on the trend for the LULUCF sector in England are emissions from Cropland and Settlement, balanced by removals
from Forest land and Grassland. Emissions from Wetland (see section 2.2) are low for England relative to other emissions due to the
relatively small areas of peat extraction, as are removals from Harvested Wood Products (Figure A8. 2).
The largest emissions source in England is the Cropland category, but this has steadily declined since its peak of 6.7 Mt CO2e in 1995 to
5.1 Mt CO2e in 2014. Emissions from Cropland include those from land use change and cropland management activities affecting biomass
and soil carbon, biomass burning and drainage on organic soils. The Settlement category is a net source showing a declining trend from
4.1 Mt CO2e in 1990 to 3.0 Mt CO2e in 2014.
The Forest land and Grassland categories are net sinks throughout the whole time series from 1990 to 2014. Net removals from Forest
land were smallest in 1994 at -4.5 Mt CO2e , increasing to -6.3 Mt CO2e in 2010 and remaining fairly constant for the rest of the time
series.Net removals from Grassland have increased from -3.0 Mt CO2e in 1990 to -4.7 Mt CO2e in 2014.
Figure A8. 2: Emissions and removals of all gases by category for the LULUCF sector in England 1990-2014
A8.2.2 England LULUCF Category Trends
The Forest land category for England is a net sink for 1990-2014. Much of the sink arises from ancient broadleaf forests which have
undergone minimal or no management or harvesting. There is an increasing trend in net emissions from 1990-1994. This arises from
harvesting of conifers planted in the 1920-1930s coinciding with a reduction in conifer planting during the 1990s. Note that emissions

Appendix 8: Emissions and Removals of Greenhouse Gases from LULUCF for England, Scotland, Wales and Northern Ireland: 1990-2014
Greenhouse Gas Inventories for England, Scotland, Wales and Northern Ireland: 1990-2014 72
from wildfires show inter-annual variability (Figure A8. 2A). GHG emissions in the category (from wildfires, nitrogen fertilisation and N2O
emissions from drainage) are very small compared to the carbon sink in forest soils and biomass.
Figure A8. 2A: Emissions and removals of all gases by category for the 4A Forestry category in England 1990-2014
The Cropland category (see section A8.2.3) for England is a net, albeit shrinking, source between 1990 and 2014. Emissions arising from
Land converted to Cropland (carbon stock changes and N2O emissions from N mineralisation) are the largest contributor (Figure A8. 2B),
but reducing over time. These emissions are the result of recent conversion from grassland and other land uses, although the rate of land
use change to Cropland has decreased over time. Carbon emissions from drained cropland organic soils are a constant and significant
source. Emissions from Cropland remaining Cropland are increasing over time, as continuing carbon stock losses from historical land use
change move across from Land converted to Cropland sub-category after 20 years. The Cropland remaining Cropland category also
includes carbon stock changes in biomass and soil carbon arising from cropland management (e.g. inputs of fertiliser, manure and crop
residues, and change between cropland types). Other GHG emissions from biomass burning are insignificant.
The Grassland category (see section A8.2.3) for England is a net, increasing sink for 1990-2014. The main removals are due to land use
change, appearing in the Land converted to Grassland (recent) and Grassland remaining Grassland (historical) sub-categories, primarily
from conversion of Cropland to Grassland (Figure A8. 2C). Grassland remaining Grassland also now includes carbon sock change in
biomass from grassland management (e.g. change between shrubby and non-shrubby grassland types,). Carbon emissions from drained
organic soils under improved grassland are a constant source. GHG emissions from controlled burning following deforestation to
Grassland have increased since 2000, with restoration of forest to open habitats and construction for renewable energy generation.
There are a small amount of wildfire emissions reported in the time series (mainly heathland fires), with considerable inter-annual
variability.

Appendix 8: Emissions and Removals of Greenhouse Gases from LULUCF for England, Scotland, Wales and Northern Ireland: 1990-2014
Greenhouse Gas Inventories for England, Scotland, Wales and Northern Ireland: 1990-2014 73
Figure A8. 2B: Emissions and removals of all gases by category for the 4B Cropland category in England 1990-2014
Figure A8. 2C: Emissions and removals of all gases by category for the 4C Grassland category in England 1990-2014
The Wetland category (see section A8.2.3) is a minor and predominantly decreasing source in England (Figure A8. 2D). It has the largest
areas of commercial peat extraction in the UK but this area is decreasing due to reducing demand for horticultural peat, from 6.0 kha in
1990 to 4.5 kha in 2014. There are also insignificant contributions to emissions from land converted to peat extraction and to flooded land
(reservoirs).

Appendix 8: Emissions and Removals of Greenhouse Gases from LULUCF for England, Scotland, Wales and Northern Ireland: 1990-2014
Greenhouse Gas Inventories for England, Scotland, Wales and Northern Ireland: 1990-2014 74
Figure A8. 2D: Emissions and removals of all gases by category for the 4D Wetland category in England 1990-2014
The Settlements category (see section A8.2.3) is the second largest emissions source in England after Cropland. Most emissions are from
soil carbon stock losses following land use change on Land converted to Settlements (recent LUC) and Settlement remaining Settlement
(historic LUC) (Figure A8. 2E). There are also related N2O emissions from N mineralisation following land use change. There is a small and
declining amount of GHG emissions resulting from controlled biomass burning during deforestation to Settlement.
The Harvested Wood Products category (see section A8.2.3) is a decreasing net sink for England over 1990-2014 (Figure A8. 2F). It is
variable over time (the model is driven by both forest management and timber production statistics) and the majority of the products are
consumed domestically in the UK.
Figure A8. 2E: Emissions and removals of all gases by category for the 4E Settlement category in England 1990-2014

Appendix 8: Emissions and Removals of Greenhouse Gases from LULUCF for England, Scotland, Wales and Northern Ireland: 1990-2014
Greenhouse Gas Inventories for England, Scotland, Wales and Northern Ireland: 1990-2014 75
Figure A8. 2F: Emissions and removals of all gases by category for the 4G Harvested Wood Products category in England 1990-2014
A8.2.3 England LULUCF comparison with 2013 inventory
Net emissions from the LULUCF sector for England in the 1990-2014 inventory are slightly higher than the 1990-2013 inventory for 1990-
1995 and slightly lower for the remainder of the time period. These revised estimates reflect changes in estimated emissions from the
Forest, Grassland and Harvested Wood Products categories, arising from the revision of the CARBINE forest model output, the correction
of the grassland drainage emission factor and the inclusion of biomass carbon stock changes from grassland management. Compared to
the 1990-2013 Inventory, net emissions of greenhouse gases in the 1990-2014 inventory in 1990 have increased by 0.5 Mt CO2e, an
increase of 22% (Figure A8. 3). Removals in 2013 have increased by 1.6 Mt CO2e. Differences between the 2013 and 2014 inventories for
CO2e in each category are presented in Figure A8. 4A-F. Differences between the 2013 and 2014 inventories for non-CO2 for England are
presented in Figures A8. 5 and A8. 6.

Appendix 8: Emissions and Removals of Greenhouse Gases from LULUCF for England, Scotland, Wales and Northern Ireland: 1990-2014
Greenhouse Gas Inventories for England, Scotland, Wales and Northern Ireland: 1990-2014 76
Figure A8. 3: Changes in net emissions of all gases across all LULUCF categories 1990-2014 between the 2013 Inventory and 2014
Inventory for England
Net removals in the Forest Land category in England have changed in trend since the previous inventory due to the correction of the
CARBINE model output (Figure A8. 4A, see

Appendix 8: Emissions and Removals of Greenhouse Gases from LULUCF for England, Scotland, Wales and Northern Ireland: 1990-2014
Greenhouse Gas Inventories for England, Scotland, Wales and Northern Ireland: 1990-2014 77
Table A8. 2 for data revisions).
In the Cropland category (see section A8.2.3, A8.3.2, Figure A8. 4B) emissions for England are very similar between the 2013 and 2014
inventories. The addition of biomass carbon stock change arising from cropland management activities and the corrections to soil carbon
stock change and controlled burning emissions following deforestation all have a minor impact on the category overall.
In the Grassland category (see section A8.2.3, A8.3.2, Figure A8. 4C) estimates for net removals for England have increased over the time
series by an average of -1.1 Mt CO2e or 41%. The majority of the change arises from correction of the emissions factor for drainage of
grassland on organic soil, which significantly reduces the emissions from this source. The changes from deforestation soil and controlled
burning and the inclusion of biomass carbon stock change from grassland management also have an effect, but this is minor in comparison.
In the Wetland category (see section A8.2.3, A8.3.2, Figure A8.4D) estimates for emissions for England remain the same as the previous
inventory, with the exception of the 2013 value which now uses 2013 activity data instead of 2012 data rolled forward.
In the Settlements category (see section A8.2.3, A8.3.2, Figure A8.4E) estimates for emissions for England are very similar between the
2013 and 2014 inventories. The corrections to soil carbon stock change and controlled burning emissions following deforestation have a
minor impact on the category overall.
Net removals in the Harvested Wood products category in England have changed since the previous inventory (Figure A8.4F, see Table
A8. 1 for data revisions). This is a result of the revision to the output from the CARBINE model so that Harvested Wood Products from
Forest remaining Forest areas are now allocated to the correct year.
The CH4 emissions have changed slightly, due to using the 2006 IPPC guidance methodology and emissions factors for estimating emissions
from controlled burning following deforestation (Figure A8. 5). N2O emissions have increased slightly due to the change to controlled
burning methodology and the revision of the soil model output for deforested areas (as N2O emissions from N mineralisation due to land
use change are calculated from the soil model output).

Appendix 8: Emissions and Removals of Greenhouse Gases from LULUCF for England, Scotland, Wales and Northern Ireland: 1990-2014
Greenhouse Gas Inventories for England, Scotland, Wales and Northern Ireland: 1990-2014 78
Table A8. 2: Effects of improvements in the source data and/or methodology on Inventory data for England
IPCC Sector
Difference between 2014 and 2013 inventory
estimates, Gg CO2e
1990 2013
4A Forest Land 1881 -845
4B Cropland -21 33
4C Grassland -1012 -1044
4D Wetlands 0 56
4E Settlements 7 -7
4G Harvested Wood Products -392 222

Appendix 8: Emissions and Removals of Greenhouse Gases from LULUCF for England, Scotland, Wales and Northern Ireland: 1990-2014
Greenhouse Gas Inventories for England, Scotland, Wales and Northern Ireland: 1990-2014 79
Figure A8. 4A: Forest Land – England Figure A8. 4B: Cropland – England
Figure A8. 4C: Grassland – England Figure A8. 4D: Wetlands - England

Appendix 8: Emissions and Removals of Greenhouse Gases from LULUCF for England, Scotland, Wales and Northern Ireland: 1990-2014
Greenhouse Gas Inventories for England, Scotland, Wales and Northern Ireland: 1990-2014 80
Figure A8. 4E: Settlements - England Figure A8. 4F: Harvested Wood Products – England
Figure A8. 5: Changes in net emissions of CH4 only 1990-2014 between the 2013 Inventory and 2014 Inventory for England LULUCF
Figure A8. 6: Changes in net emissions of N2O only 1990-2014 between the 2013 Inventory and 2014 Inventory for England LULUCF.

Appendix 8: Emissions and Removals of Greenhouse Gases from LULUCF for England, Scotland, Wales and Northern Ireland: 1990-
2014
Greenhouse Gas Inventories for England, Scotland, Wales and Northern Ireland: 1990-2014 81
A8.3 LULUCF Emissions and Removals in Scotland
A8.3.1 Scotland LULUCF Trends
The 1990-2014 Inventory shows that Scotland was a net sink of greenhouse gases from LULUCF activities for the whole time series
(Figure A8.7). In 1990 net emissions from the LULUCF sector in Scotland were -2.3 Mt CO2e, declining steadily to -6.2 Mt CO2e in 2014
(see section A8.6 for emissions / removals by LULUCF category and gas).
The main influences on the trend for the LULUCF sector in Scotland are emissions from Cropland and Settlement, outweighed by
removals from Forest land and Grassland. Emissions from Wetland (see section A8.2.2) are low for Scotland relative to other emissions,
as are removals from Harvested Wood Products (Figure A8.7).
Cropland produces the largest emissions source in Scotland: this peaked at 7.0 Mt CO2e in 1999 and has since steadily reduced to 5.0
Mt CO2e in 2014. The Settlement category is a net source that has declined from a peak of 1.8 Mt CO2e in 1999 to 1.6 Mt CO2e in 2014.
Forest land is the largest net sink in Scotland, increasing from -8.4 Mt CO2 in 1990 to -10 Mt CO2 in 1999, then gradually decreasing to
-9.3 Mt CO2 in 2014. The Grassland net sink has overall increased gradually from -2.0 Mt CO2e in 1990 to -2.7 Mt CO2e in 2014.
Figure A8.7: Emissions and removals of all gases by category for the LULUCF sector in Scotland 1990-2014

Appendix 8: Emissions and Removals of Greenhouse Gases from LULUCF for England, Scotland, Wales and Northern Ireland: 1990-
2014
Greenhouse Gas Inventories for England, Scotland, Wales and Northern Ireland: 1990-2014 82
A8.3.2 Scotland LULUCF Category Trends
The Forest land category (see section A8.2.3) for Scotland is a net sink for 1990-2014 (Figure A8. 8A). The majority of the sink arises
from the large area of conifer plantation, which is subject to active forest management such as thinning and varying harvesting
rotations. Removals from the Land converted to Forest land decrease over the time series due to a declining rate of forest planting.
GHG emissions in the category (from wildfires, nitrogen fertilisation and N2O emissions from drainage) are very small compared to the
carbon sink in forest soils and biomass.
Figure A8. 8A: Emissions and removals of all gases by category for the 4A Forestry category in Scotland 1990-2014
The Cropland category (see section A8.2.3) for Scotland is a net source for 1990-2014. Land converted to Cropland (carbon stock
changes and N2O emissions from N mineralisation) accounts for the highest emissions from Cropland in Scotland for LULUCF (Figure
A8.8B). These emissions are the result of recent conversion from grassland and other land uses, although the rate of land use change
to Cropland has decreased over time. Emissions from Cropland remaining Cropland are increasing over time, as continuing carbon
stock losses from historical land use change move across from the Land converted to Cropland sub-category after 20 years. The
Cropland remaining Cropland category also includes biomass and soil carbon stock changes arising from cropland management (e.g.
inputs of fertiliser, manure and crop residues, and change between cropland types). Other GHG emissions from drained cropland
organic soils and from biomass burning are small.
The Grassland category (see section A8.2.3) for Scotland is a net sink for 1990-2014. Removals from carbon stock changes due to
land use change in Grassland remaining Grassland and Land converted to Grassland are slightly reduced by emissions from drained
organic soils under improved grassland and biomass burning (Figure A8. 8C). Grassland remaining Grassland also now includes
carbon sock change in biomass from grassland management (e.g. change between shrubby and non-shrubby grassland types,).
Emissions from biomass burning increased substantially after 2000, due to increased conversion from Forest land (deforestation of
conifers for habitat restoration and construction for renewable energy generation). Other sources of emissions (wildfires and N2O
emissions from N mineralisation following land use change) are insignificant.

Appendix 8: Emissions and Removals of Greenhouse Gases from LULUCF for England, Scotland, Wales and Northern Ireland: 1990-
2014
Greenhouse Gas Inventories for England, Scotland, Wales and Northern Ireland: 1990-2014 83
Figure A8. 8B: Emissions and removals of all gases by category for the 4B Cropland category in Scotland 1990-2014
Figure A8. 8C: Emissions and removals of all gases by category for the 4C Grassland category in Scotland 1990-2014
The Wetland category (see section A8.2.3) is a fluctuating source of emissions for Scotland (Figure A8. 8D). These emissions are
predominantly from commercial peat extraction, and this is largely dependent upon the weather and product demand, hence the
fluctuating trend. Between 1990 and 2014, the land area in Scotland undergoing commercial peat extraction fell from 1.7 kha to 1.4
kha. More than 85% of the volume of peat sold in Scotland was for the horticultural industry. There are also insignificant contributions
to emissions from land converted to peat extraction and to flooded land (reservoirs).

Appendix 8: Emissions and Removals of Greenhouse Gases from LULUCF for England, Scotland, Wales and Northern Ireland: 1990-
2014
Greenhouse Gas Inventories for England, Scotland, Wales and Northern Ireland: 1990-2014 84
Figure A8.8D: Emissions and removals of all gases by category for the 4D Wetland category in Scotland 1990-2014
The Settlements category (see section A8.2.3) is the second largest emissions source in Scotland, after Cropland. Most emissions are
from soil carbon stock losses following land use change on Land converted to Settlements (recent LUC) and Settlement remaining
Settlement (historic LUC) (Figure A8.8E). There are also related N2O emissions from N mineralisation following land use change. There
are a small amount of GHG emissions resulting from controlled biomass burning during deforestation to Settlement.
The Harvested Wood Products category (see section A8.2.3) is a net sink of CO2 for Scotland (Figure A8.8F). It is variable over time (the model is driven by both forest management and timber production statistics) and the majority of the products are consumed
domestically in the UK.
Figure A8.8E: Emissions and removals of all gases by category for the 4E Settlement category in Scotland 1990-2014

Appendix 8: Emissions and Removals of Greenhouse Gases from LULUCF for England, Scotland, Wales and Northern Ireland: 1990-2014
Greenhouse Gas Inventories for England, Scotland, Wales and Northern Ireland: 1990-2014 85
Figure A8.8F: Emissions and removals of all gases by category for the 4G Harvested Wood Products category in Scotland 1990-2014
A8.3.3 Scotland LULUCF comparison with 2013 inventory
Net removals from the LULUCF sector for Scotland in the 1990-2014 inventory are greater than the 1990-2013 inventory, although the
trend towards being an increasing sink is predominantly the same (Figure A8. 9). The revised estimates reflect changes in estimated
emissions from the Forest, Grassland and Harvested Wood Products categories, and to a lesser extent changes in the Settlement category.
Compared to the 1990-2013 inventory, net removals of greenhouse gases in the current inventory have increased by 2.4 Mt CO2e in 1990
and 1.0 Mt CO2e in 2013. Differences between the 2013 and 2014 inventories for CO2e in each category are presented in Figures A8. 10A-
F. Differences between the 2013 and 2014 inventories for non-CO2 emissions for Scotland are presented in Figures A8. 11 and A8. 12.
Figure A8.9: Changes in net removals of all gases 1990-2014 between the 2013 Inventory and 2014 LULUCF Inventory for Scotland

Appendix 8: Emissions and Removals of Greenhouse Gases from LULUCF for England, Scotland, Wales and Northern Ireland: 1990-2014
Greenhouse Gas Inventories for England, Scotland, Wales and Northern Ireland: 1990-2014 86
Net removals in the Forest Land category in Scotland have increased and changed in trend since the previous inventory due to the
correction of the CARBINE model output (Figure A8. 10A, see

Appendix 8: Emissions and Removals of Greenhouse Gases from LULUCF for England, Scotland, Wales and Northern Ireland: 1990-2014
Greenhouse Gas Inventories for England, Scotland, Wales and Northern Ireland: 1990-2014 87
Table A8. 2 for data revisions).
In the Cropland category (see sections A8.2.3, A8.4.2, Figure A8. 8B) estimates for emissions for Scotland have remained stable over the
time period (Figure A8. 10B). The addition of biomass carbon stock change arising from cropland management activities and the
corrections to soil carbon stock change and controlled burning emissions following deforestation all have a minor impact on the
category overall.
In the Grassland category (see sections A8.2.3, A8.4.2, Figure A8. 8C) estimates for net removals for Scotland have increased over the
time series by an average of 0.8 Mt CO2e or 58% (Table A8. 3, Figure 10C). The majority of the change arises from correction of the
emissions factor for drainage of grassland on organic soil, which significantly reduces the emissions from this source. The changes from
deforestation soil and controlled burning and the inclusion of biomass carbon stock change from grassland management also have an
effect, but this is minor in comparison. In the Wetland category (see sections A8.2.3, A8.4.2, Figure A8. 8D) estimates for emissions for
Scotland remain the same as the previous inventory, except for 2013 where updated peat extraction data has become available (Table
A8. 3, Figure A8.10D).
In the Settlements category (see sections A8.2.3, A8.4.2, Figure A8. 8E) estimates for emissions for Scotland have slightly increased by an
average of 1% for 1990-2013 (Table A8. 3, Figure A8. 10E). This is due to the corrections to soil carbon stock change and controlled burning
emissions following deforestation.
Net removals in the Harvested Wood products category in Scotland have changed increased by an average of 0.3 Mt CO2e since the
previous inventory (see Figure A8. 10F and Table A8. 1 for data revisions). This is a result of the revision to the output from the CARBINE
model so that Harvested Wood Products from Forest remaining Forest areas are now allocated to the correct year.
The CH4 emissions have decreased due to using the 2006 IPPC guidance methodology and emissions factors for estimating emissions from
controlled burning following deforestation (Figure A8. 11). N2O emissions have increased compared to the 1990-2013 inventory from
2000 onwards (Figure A8. 12). This is due to the change to controlled burning methodology and the revision of the soil model output for
deforested areas (as N2O emissions from N mineralisation due to land use change are calculated from the soil model output).
Table A8. 3: Effects of improvements in the source data and/or methodology on Inventory data for Scotland
IPCC Sector
Difference between 2014 and 2013 inventory
estimates, kt CO2e
1990 2013
4A Forest Land -1360 20
4B Cropland -1 8
4C Grassland -718 -834
4D Wetlands 0 105
4E Settlements 15.1 39
4G Harvested Wood Products -364 -310

Appendix 8: Emissions and Removals of Greenhouse Gases from LULUCF for England, Scotland, Wales and Northern Ireland: 1990-2014
Greenhouse Gas Inventories for England, Scotland, Wales and Northern Ireland: 1990-2014 88
Figure A8. 10A: Forest Land – Scotland Figure A8. 10B: Cropland - Scotland
Figure A8. 10C: Grassland – Scotland Figure A8. 10D: Wetlands - Scotland
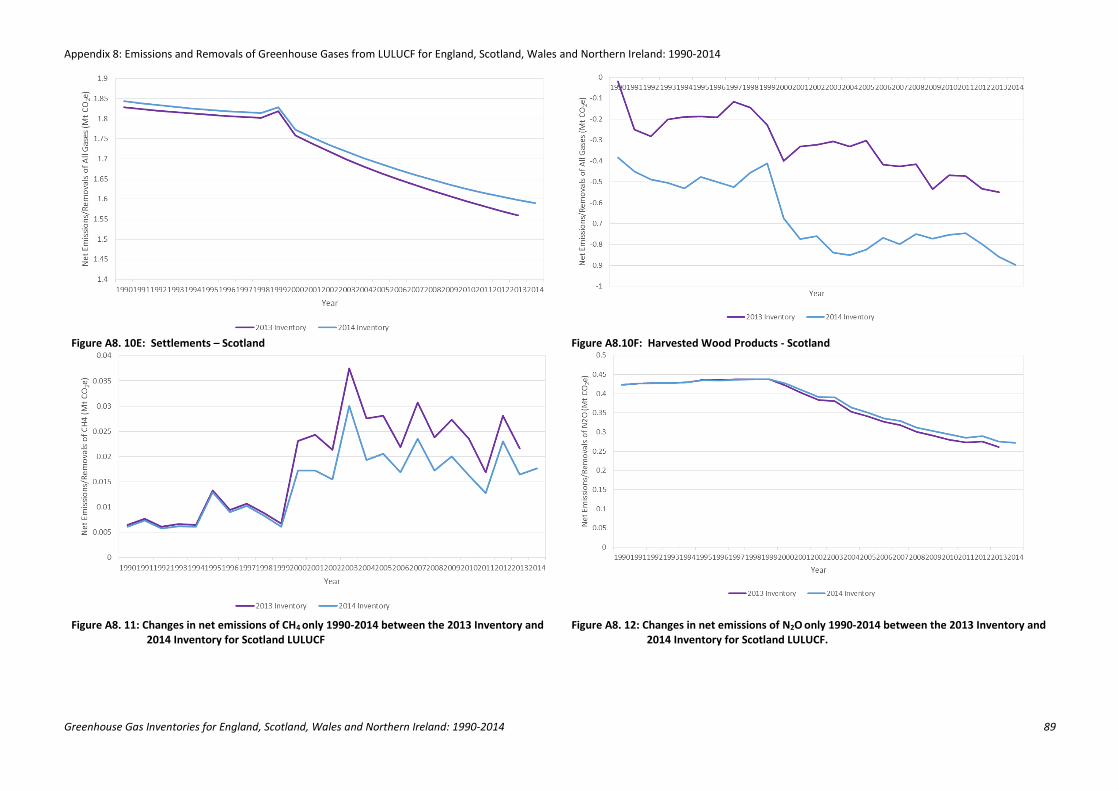
Appendix 8: Emissions and Removals of Greenhouse Gases from LULUCF for England, Scotland, Wales and Northern Ireland: 1990-2014
Greenhouse Gas Inventories for England, Scotland, Wales and Northern Ireland: 1990-2014 89
Figure A8. 10E: Settlements – Scotland Figure A8.10F: Harvested Wood Products - Scotland
Figure A8. 11: Changes in net emissions of CH4 only 1990-2014 between the 2013 Inventory and 2014 Inventory for Scotland LULUCF
Figure A8. 12: Changes in net emissions of N2O only 1990-2014 between the 2013 Inventory and 2014 Inventory for Scotland LULUCF.

Appendix 8: Emissions and Removals of Greenhouse Gases from LULUCF for England, Scotland, Wales and Northern Ireland: 1990-
2014
Greenhouse Gas Inventories for England, Scotland, Wales and Northern Ireland: 1990-2014 90
A8.4 LULUCF Emissions and Removals in Wales
A8.4.1 Wales LULUCF Trends
The 1990-2014 Inventory shows Wales was a small net sink of greenhouse gases from LULUCF activities from 1990-1998 and from 2003
onwards, rising to a small net source in between (Figure A8. 13). In 1990 Wales was a small sink at -0.3 Mt CO2e, rising to a peak source
in 2000 of 0.2 Mt CO2e and decreasing again to a sink of -0.3 Mt CO2e in 2014 (see section A8.6 for emissions / removals by LULUCF
category and gas).
The main influences on the trend for the LULUCF sector in Wales are emissions from Cropland and Settlement, outweighed by removals
from Forest land and Grassland. Emissions from Wetland (see section A8.2.2) are small for Wales relative to other emissions, as are
removals from Harvested Wood Products (Figure A8.13).
Cropland produces the largest emissions source in Wales: this peaked at 1.3 Mt CO2e in 1999 and has since steadily reduced to 0.9 Mt
CO2e in 2014. The Settlement category is a net source that has declined from a peak of 0.8 Mt CO2e in 1999 to 0.7 Mt CO2e in 2014.
The Forest land and Grassland categories are net sinks from 1990 to 2013. Forest land is generally a decreasing sink in Wales from -1.7
Mt CO2e in 1990 to -1.2 Mt CO2e in 2014. Between 1990 and 2014, Grassland net removals have fluctuated between -0.5 Mt CO2e and
-0.6 Mt CO2e.
Figure A8. 13: Emissions and removals for all gases by category for the LULUCF sector in Wales 1990-2014
A8.4.2 Wales LULUCF Category Trends
The Forest land category (see section A8.2.3) for Wales is a net sink for 1990-2014. The sink arises from a combination of broadleaf
forest (not subject to forest management) and conifer plantations (subject to active forest management such as thinning and varying
harvesting rotations). There has been a gradual decline in Land converted to Forest since 1990. GHG emissions in the category (from
wildfires, nitrogen fertilisation and N2O emissions from drainage) are very small compared to the carbon sink in forest soils and
biomass. (Figure A8. 14A). Forest wildfires show high inter-annual variability.

Appendix 8: Emissions and Removals of Greenhouse Gases from LULUCF for England, Scotland, Wales and Northern Ireland: 1990-
2014
Greenhouse Gas Inventories for England, Scotland, Wales and Northern Ireland: 1990-2014 91
Figure A8. 14A: Emissions and removals of all gases by category for the 4A Forestry category in Wales 1990-2014
The Cropland category (see section A8.2.3) for Wales is an emission source throughout the time series. Land converted to Cropland
(carbon stock changes and N2O emissions from N mineralisation) accounts for the highest emissions from Cropland in Wales for LULUCF
(Figure 14B), although these have been decreasing since 1999. Emissions from Cropland remaining Cropland are increasing over time,
as continuing carbon stock losses from historical land use change move across from the Land converted to Cropland sub-category after
20 years. The Cropland remaining Cropland category also includes biomass and soil carbon stock changes arising from cropland
management (e.g. inputs of fertiliser, manure and crop residues, and change between cropland types). Other GHG emissions from
drained cropland organic soils are small.
The Grassland category (see section A8.2.3) for Wales is a net sink for 1990-2014. Removals from carbon stock changes in Grassland
remaining Grassland and Land converted to Grassland are reduced by emissions from drained organic soils under improved grassland
and biomass burning (Figure A8.14C). Grassland remaining Grassland also now includes carbon sock change in biomass from
grassland management (e.g. change between shrubby and non-shrubby grassland types). Emissions from biomass burning increased
after 2000, this is due to increased conversion from Forest land (deforestation of conifers for habitat restoration). Other sources of
emissions (wildfires and N2O emissions from N mineralisation following land use change) are small.

Appendix 8: Emissions and Removals of Greenhouse Gases from LULUCF for England, Scotland, Wales and Northern Ireland: 1990-
2014
Greenhouse Gas Inventories for England, Scotland, Wales and Northern Ireland: 1990-2014 92
Figure A8. 14B: Emissions and removals of all gases by category for the 4B Cropland category in Wales 1990-2014
Figure A8. 14C: Emissions and removals of all gases by category for the 4C Grassland category in Wales 1990-2014
The Wetland category (see section A8.2.3) is a minor source for Wales (Figure A8.14D), with the smallest emissions from peat extraction
in the UK, at <0.001 Mt CO2e. The peak in 1991 is due to carbon stock losses resulting from reservoir construction (Trawsfynydd).
Between 1990-2014, approximately 0.3 kha was estimated to be emitting carbon dioxide as a result of historic commercial peat
extraction in Wales. There was no new peat extracted and sold in Wales for the horticultural industry.

Appendix 8: Emissions and Removals of Greenhouse Gases from LULUCF for England, Scotland, Wales and Northern Ireland: 1990-
2014
Greenhouse Gas Inventories for England, Scotland, Wales and Northern Ireland: 1990-2014 93
Figure A8. 14D: Emissions and removals of all gases by category for the 4D Wetland category in Wales 1990-2014
The Settlements category (see section A8. 2.3) is the second largest emissions source in Wales, after Cropland. Most emissions are
from soil carbon stock losses following land use change on Land converted to Settlements (recent LUC) and Settlement remaining
Settlement (historic LUC) (Figure A8. 14E). There are also related N2O emissions from N mineralisation following land use change. There
are a small amount of GHG emissions resulting from controlled biomass burning during deforestation to Settlement.
The Harvested Wood Products category (see section A8. 2.3) is a net sink of CO2 for Wales (Figure A8. 14F). It is variable over time (the
model is driven by both forest management and timber production statistics) and the majority of the products are consumed
domestically in the UK.
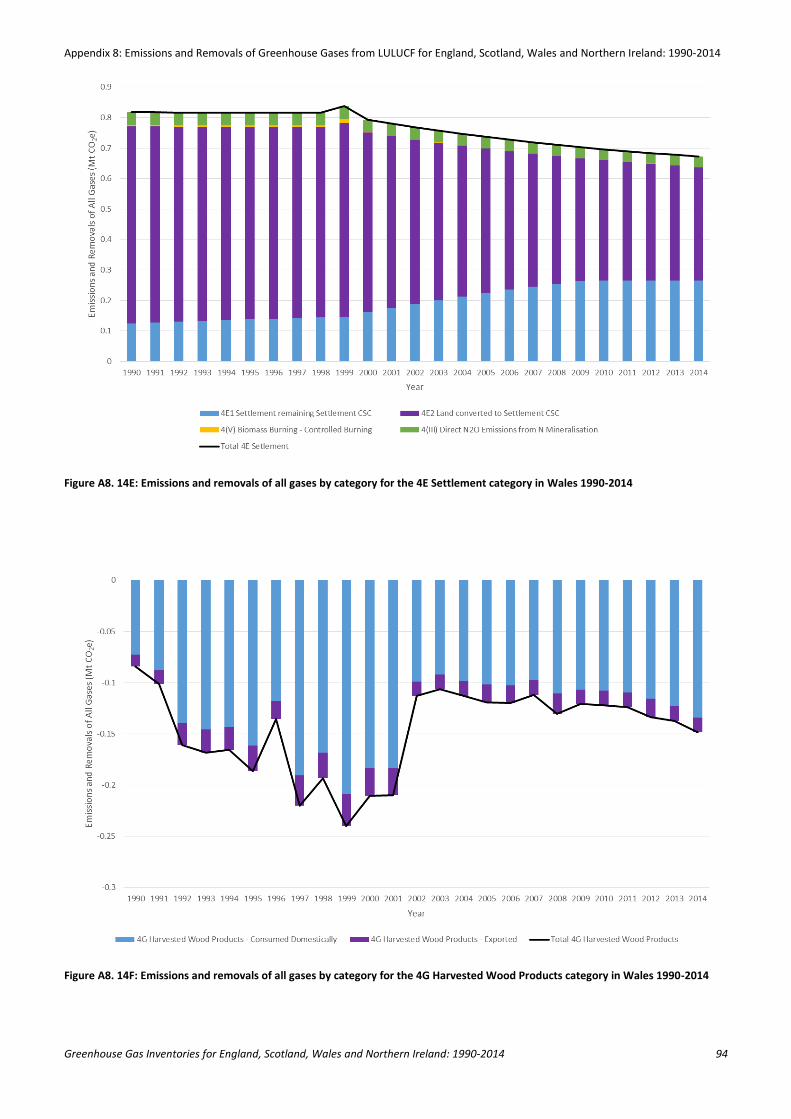
Appendix 8: Emissions and Removals of Greenhouse Gases from LULUCF for England, Scotland, Wales and Northern Ireland: 1990-2014
Greenhouse Gas Inventories for England, Scotland, Wales and Northern Ireland: 1990-2014 94
Figure A8. 14E: Emissions and removals of all gases by category for the 4E Settlement category in Wales 1990-2014
Figure A8. 14F: Emissions and removals of all gases by category for the 4G Harvested Wood Products category in Wales 1990-2014

Appendix 8: Emissions and Removals of Greenhouse Gases from LULUCF for England, Scotland, Wales and Northern Ireland: 1990-2014
Greenhouse Gas Inventories for England, Scotland, Wales and Northern Ireland: 1990-2014 95
A8.4.3 Wales LULUCF comparison with 2013 inventory
Net emissions from the LULUCF sector in Wales have changed from those in the 1990-2013 inventory but there is no clear pattern of net
increase or decrease (Figure A8. 15). The differences are due to a combination of changes predominantly from the Forest and Grassland
categories. Compared to the 1990-2013 inventory, net emissions of greenhouse gases in the current inventory have decreased by 0.4 Mt
CO2e in 1990 and increased by 0.3 Mt CO2e in 2013. Differences between the 2013 and 2014 inventories for CO2 in each category are
presented in Figure 16A-F. Differences between the 2013 and 2014 inventories for non-CO2 for Wales are presented in Figures A8. 17 and
A8. 18.
Figure A8. 15: Changes in net emissions and removals of all gases 1990-2014 between the 2013 Inventory and 2014 Inventory for
Wales
Net removals in the Forest Land category in Wales have reduced since the previous inventory due to the correction of the CARBINE
model output.
In the Cropland category (see sections A8. 2.3, A8. 5.2, Figure A8. 14B) estimates for emissions for Wales have changed little over the
time period (Table A8. 4, Figure A8. 16B). The addition of biomass carbon stock change arising from cropland management activities has
a minor impact on the category overall.
In the Grassland category (see sections A8.2.3, A8.5.2, Figure A8. 14C) estimates for removals in Wales have increased by an average of
7% in the 1990-2014 inventory over the time period (Figure A8. 16C). The majority of the change arises from correction of the emissions
factor for drainage of grassland on organic soil, which significantly reduces the emissions from this source. The changes from
deforestation soil and controlled burning and the inclusion of biomass carbon stock change from grassland management also have an
effect.
In the Wetland category (see sections A8.2.3, A8.5.2, Figure A8.14D) estimates for emissions for Wales are reduced by approximately 30%
compared to the previous inventory (Table A8. 4, Figure A8. 16D), although this emission source is very small, this large percentage change
only represents a very small change in absolute emissions . The change is due to the improvements to the methodology used for tracking
areas converted to and from peat extraction.
In the Settlements category (see section A8.2.3, A8.5.2, Figure A8.14E) estimates for emissions for Wales have very slightly increased. This
is due to the corrections to soil carbon stock change and controlled burning emissions following deforestation.
Net removals in the Harvested Wood products category in Wales have changed in trend since the previous inventory (see Figure A8. 16F
and Table A8. 1 for data revisions). This is a result of the revision to the output from the CARBINE model so that Harvested Wood Products
from Forest remaining Forest areas are now allocated to the correct year.
The CH4 emissions have changed slightly, due to using the 2006 IPPC guidance methodology and emissions factors for estimating emissions
from controlled burning following deforestation (Figure A8. 17). N2O emissions have increased slightly compared to the 1990-2013

Appendix 8: Emissions and Removals of Greenhouse Gases from LULUCF for England, Scotland, Wales and Northern Ireland: 1990-2014
Greenhouse Gas Inventories for England, Scotland, Wales and Northern Ireland: 1990-2014 96
inventory (Figure A8. 18). This is due to the change to controlled burning methodology and the revision of the soil model output for
deforested areas (as N2O emissions from N mineralisation due to land use change are calculated from the soil model output).
Table A8. 4: Effects of improvements in the source data and/or methodology on Inventory data for Wales
IPCC Sector
Difference between 2014 and 2013 inventory
estimates, kt CO2e
1990 2013
4A Forest Land -243 229
4B Cropland -1 28
4C Grassland -75 -33
4D Wetlands -0.1 -0.1
4E Settlements 2 17
4G Harvested Wood Products -80 38

Appendix 8: Emissions and Removals of Greenhouse Gases from LULUCF for England, Scotland, Wales and Northern Ireland: 1990-2014
Greenhouse Gas Inventories for England, Scotland, Wales and Northern Ireland: 1990-2014 97
Figure A8. 16A: Forest Land – Wales Figure A8. 16B: Cropland - Wales
Figure A8. 16C: Grassland – Wales Figure A8. 16D: Wetlands - Wales

Appendix 8: Emissions and Removals of Greenhouse Gases from LULUCF for England, Scotland, Wales and Northern Ireland: 1990-2014
Greenhouse Gas Inventories for England, Scotland, Wales and Northern Ireland: 1990-2014 98
Figure A8. 16E: Settlements – Wales Figure A8. 16F: Harvested Wood Products - Wales
Figure A8. 17: Changes in net emissions of CH4 only 1990-2014 between the 2013 Inventory and
2014 Inventory for Wales LULUCF
Figure A8. 18: Changes in net emissions of N2O only 1990-2014 between the 2013 Inventory and
2014 Inventory for Wales LULUCF.

Appendix 8: Emissions and Removals of Greenhouse Gases from LULUCF for England, Scotland, Wales and Northern Ireland: 1990-
2014
Greenhouse Gas Inventories for England, Scotland, Wales and Northern Ireland: 1990-2014 99
A8.5 LULUCF Emissions and Removals in Northern Ireland
A8.5.1 Northern Ireland LULUCF Trends
The 1990-2014 Inventory shows that Northern Ireland was a small net source of emissions of greenhouse gases from LULUCF activities
throughout the time period, with the exception of 1999 (Figure A8. 19). In 1990 Northern Ireland was a small source at 0.1 Mt CO2e,
falling to -0.002 Mt CO2e by 1999, then gradually increasing to a peak of 0.5 Mt CO2e in 2012; the net source in 2014 was 0.4 Mt CO2e.
The main influences on the LULUCF sector in Northern Ireland are emissions from Cropland and Settlement, and removals from Forest
and Grassland. Emissions from Wetland (see section A8.2.2) are low for Northern Ireland relative to other emissions, as are removals
from Harvested Wood Products (Figure A8. 19).
Cropland is the largest source of LULUCF emissions in Northern Ireland, although between 1990 and 2013 levels gradually decreased
from 1.4 Mt CO2e in 1990 to 1.2 Mt CO2e in 2014. The Settlement category is a net source of approximately 0.6 Mt CO2e for 1990-
1998, gradually increasing to 1.0 Mt CO2e in 2014. Wetlands are a small net source decreasing from 0.2 Mt CO2e in 1990 to 0.1 Mt
CO2e in 2014.
The size of the Forest land sink decreased from -0.8 Mt CO2e in 1990 to -0.6 Mt CO2e in 2014. Grassland has remained a relatively
constant sink of about -1.2 Mt CO2e. Removals from Harvested Wood Products have fluctuated slightly around an average of -0.08 Mt
CO2e.
Figure A8. 19: Emissions and removals for all gases by category for the LULUCF sector in Northern Ireland 1990-2014

Appendix 8: Emissions and Removals of Greenhouse Gases from LULUCF for England, Scotland, Wales and Northern Ireland: 1990-
2014
Greenhouse Gas Inventories for England, Scotland, Wales and Northern Ireland: 1990-2014 100
A8.5.2 Northern Ireland LULUCF Category Trends
The Forest land category (see section A8.2.2) for Northern Ireland is a net sink for 1990-2014. The majority of the sink arises from
broadleaf forest planted after 1900, estimates do not include pre-1900 forest. There has been a gradual decline in Land converted to
Forest since 1990. GHG emissions in the category (from wildfires, nitrogen fertilisation and N2O emissions from drainage) are generally
small compared to the carbon sink in forest soils and biomass (Figure A8. 20A). The exception is a spike in emissions from forest
wildfires in 2012. Emissions were significantly affected by a large wildfire in 2011 that spanned an area of 704ha, 14 times the average
for Northern Ireland and the greatest total forest wildfire area in the UK in 2011. Forest activity data uses fiscal years, so this event is
seen in the emission estimates for 2012.
Figure A8. 20A: Emissions and removals of all gases by category for the 4A Forestry category in Northern Ireland 1990-2014
The Cropland category (see section A8.2.3) for Northern Ireland is an emission source throughout the time period. Land converted to
Cropland (carbon stock changes and N2O emissions from N mineralisation, mostly from Grassland) accounts for the highest emissions
from Cropland in Northern Ireland (Figure A8. 20B), although these have decreased since 1990. Emissions from Cropland remaining
Cropland have gradually increased, as continuing carbon stock losses from historical land use change move across from the Land
converted to Cropland sub-category after 20 years. The Cropland remaining Cropland category also includes soil and biomass carbon
stock changes arising from cropland management (e.g. inputs of fertiliser, manure and crop residues, and change between cropland
types). Emissions from drained organic cropland soils area also included, although these are not large.
The Grassland category (see section A8.2.3) for Northern Ireland is now a net sink for 1990-2014. Removals from land conversion to
grassland (from Cropland) due to either historic change (reported in Grassland remaining Grassland) or recent conversion (Land
converted to Grassland) are slightly reduced by emissions from drained organic soils under improved grassland (Figure A8.20C).
Grassland remaining Grassland also now includes carbon stock change in biomass from grassland management (e.g. change between
shrubby and non-shrubby grassland types). Other sources of emissions (wildfires, N2O emissions from N mineralisation following land
use change and controlled burning following deforestation) are insignificant.

Appendix 8: Emissions and Removals of Greenhouse Gases from LULUCF for England, Scotland, Wales and Northern Ireland: 1990-
2014
Greenhouse Gas Inventories for England, Scotland, Wales and Northern Ireland: 1990-2014 101
Figure A8.20B: Emissions and removals of all gases by category for the 4B Cropland category in Northern Ireland 1990-2014
Figure A8.20C: Emissions and removals of all gases by category for the 4C Grassland category in Northern Ireland 1990-2014
The Wetland category (see section A8.2.3) is a net source for Northern Ireland (Figure A8.20D). In 1990 approximately 4.9 kha was
estimated to be emitting carbon dioxide as a result of commercial peat extraction. This has gradually decreased to 0.4 kha in 2010-
2014. An estimated 75% of the UK fuel peat extraction occurs in Northern Ireland. There were small N2O emissions (< 1%) from drainage
on peat extraction areas. No land (over a 1 km2 threshold) has been converted to flooded land (reservoirs) in Northern Ireland since
1990.

Appendix 8: Emissions and Removals of Greenhouse Gases from LULUCF for England, Scotland, Wales and Northern Ireland: 1990-
2014
Greenhouse Gas Inventories for England, Scotland, Wales and Northern Ireland: 1990-2014 102
Figure A8.20D: Emissions and removals of all gases by category for the 4D Wetland category in Northern Ireland 1990-2014
The Settlements category (see section A8.2.2) is the second largest LULUCF emissions source in Northern Ireland, after Cropland. Most
emissions are from soil carbon stock losses following land use change on Land converted to Settlements (recent LUC) and Settlement
remaining Settlement (historic LUC) (Figure 20E). There are also related N2O emissions from N mineralisation following land use change.
The majority of emissions are from Grassland converted to Settlements (71%). There are a small amount of GHG emissions resulting
from controlled biomass burning during deforestation to Settlements.
The Harvested Wood Products category (see section A8.2.3) is a net sink of CO2 for Northern Ireland (Figure A8.20F). It is variable over
time (the model is driven by both forest management and timber production statistics) and the majority of the products are consumed
domestically in the UK.

Appendix 8: Emissions and Removals of Greenhouse Gases from LULUCF for England, Scotland, Wales and Northern Ireland: 1990-2014
Greenhouse Gas Inventories for England, Scotland, Wales and Northern Ireland: 1990-2014 103
Figure A8.20E: Emissions and removals of all gases by category for the 4E Settlement category in Northern Ireland 1990-2014
Figure A8.20F: Emissions and removals of all gases by category for the 4G Harvested Wood Products category in Northern Ireland 1990-
2014

Appendix 8: Emissions and Removals of Greenhouse Gases from LULUCF for England, Scotland, Wales and Northern Ireland: 1990-2014
Greenhouse Gas Inventories for England, Scotland, Wales and Northern Ireland: 1990-2014 104
A8.5.3 Northern Ireland LULUCF comparison with 2013 inventory
The LULUCF sector in Northern Ireland for the 1990-2014 inventory is a small net source of GHG emissions. Compared to the 1990-2013
Inventory, net emissions have decreased by an average of 1.2 Mt CO2e per year (1.0-1.4 Mt CO2e) (Figure A8.21). The revised estimates
primarily reflect changes in estimated emissions from the Forest, Grassland and Harvested Wood Products categories, and to a lesser
extent changes in the Wetland and Settlement categories (although these have a greater effect on the second half of the time series).
Differences between the 2013 and 2014 inventories for CO2e in each category are presented in Figure 22A-F. Differences between the
2013 and 2014 inventories for non-CO2 emissions for Northern Ireland are presented in Figures A8.23 and A8.24.
Figure A8. 21: Changes in net emissions of all gases 1990-2014 between the 2013 Inventory and 2014 Inventory for Northern Ireland
Net removals in the Forest land category in Northern Ireland have reduced since the previous inventory (Figure A8. 22A) due to the
correction of the CARBINE model output (see Table A8. 1 for data revisions)
In the Cropland category (see sections A8.2.3, A8.6.2, Figure A8. 20B) estimates for emissions for Northern Ireland have changed little
over the time period (Table A8. 5, Figure A8.22B). The addition of biomass carbon stock change arising from cropland management
activities have a minor impact on the category overall.
The Grassland category (see sections A8.2.3, A8.6.2, Figure A8. 20C) for Northern Ireland has moved from being a small net source (0.06
Mt CO2e p.a. 1990-2013) to a net sink (-1.23 Mt CO2e p.a. 1990-2014) (Table A8. 5, Figure A8. 22C). The majority of the change arises
from correction of the emissions factor for drainage of grassland on organic soil, which significantly reduces the emissions from this
source. The changes from deforestation soil and controlled burning and the inclusion of biomass carbon stock change from grassland
management also have an effect.
In the Wetland category (see sections A8.2.2, A8.6.2, Figure A8. 20D) estimates for emissions for Northern Ireland are reduced
compared to the previous inventory by an average of 33% (greater towards the end of the time series) (Table A8. 5, Figure A8.22D). This
is due to more detailed activity data for peat extraction areas in Northern Ireland becoming available.
In the Settlements category (see sections A8.2.3, A8.6.2, Figure A8. 20E) estimates for emissions for Northern Ireland have very slightly
increased (Table A8. 5, Figure A8. 22E). This is due to the corrections to soil carbon stock change and controlled burning emissions
following deforestation.
Net removals in the Harvested Wood products category in Northern Ireland have increased by an average of 158% and changed in trend
since the previous inventory (see Figure A8. 22F and Table A8. 1 for data revisions). This is a result of the revision to the output from the
CARBINE model so that Harvested Wood Products from Forest remaining Forest areas are now allocated to the correct year.
The CH4 emissions have decreased slightly, due to using the 2006 IPPC guidance methodology and emissions factors for estimating
emissions from controlled burning following deforestation (Figure A8. 23). N2O emissions have increased slightly compared to the 1990-

Appendix 8: Emissions and Removals of Greenhouse Gases from LULUCF for England, Scotland, Wales and Northern Ireland: 1990-2014
Greenhouse Gas Inventories for England, Scotland, Wales and Northern Ireland: 1990-2014 105
2013 inventory (Figure A8. 24). This is due to the change to controlled burning methodology and the revision of the soil model output for
deforested areas (as N2O emissions from N mineralisation due to land use change are calculated from the soil model output).
Table A8. 5: Effects of improvements in the source data and/or methodology on Inventory data for Northern Ireland
IPCC Sector
Difference between 2014 and 2013 inventory
estimates, kt CO2e
1990 2013
4A Forest Land -57 240
4B Cropland -1 -1
4C Grassland -1294 -1287
4D Wetlands 6 -82
4E Settlements 2 26
4G Harvested Wood Products
-55 9

Appendix 8: Emissions and Removals of Greenhouse Gases from LULUCF for England, Scotland, Wales and Northern Ireland: 1990-2014
Greenhouse Gas Inventories for England, Scotland, Wales and Northern Ireland: 1990-2014 106
Figure A8. 22A: Forest Land - Northern Ireland Figure A8. 22B: Cropland – Northern Ireland
Figure A8. 22C: Grassland – Northern Ireland Figure A8. 22D: Wetlands – Northern Ireland
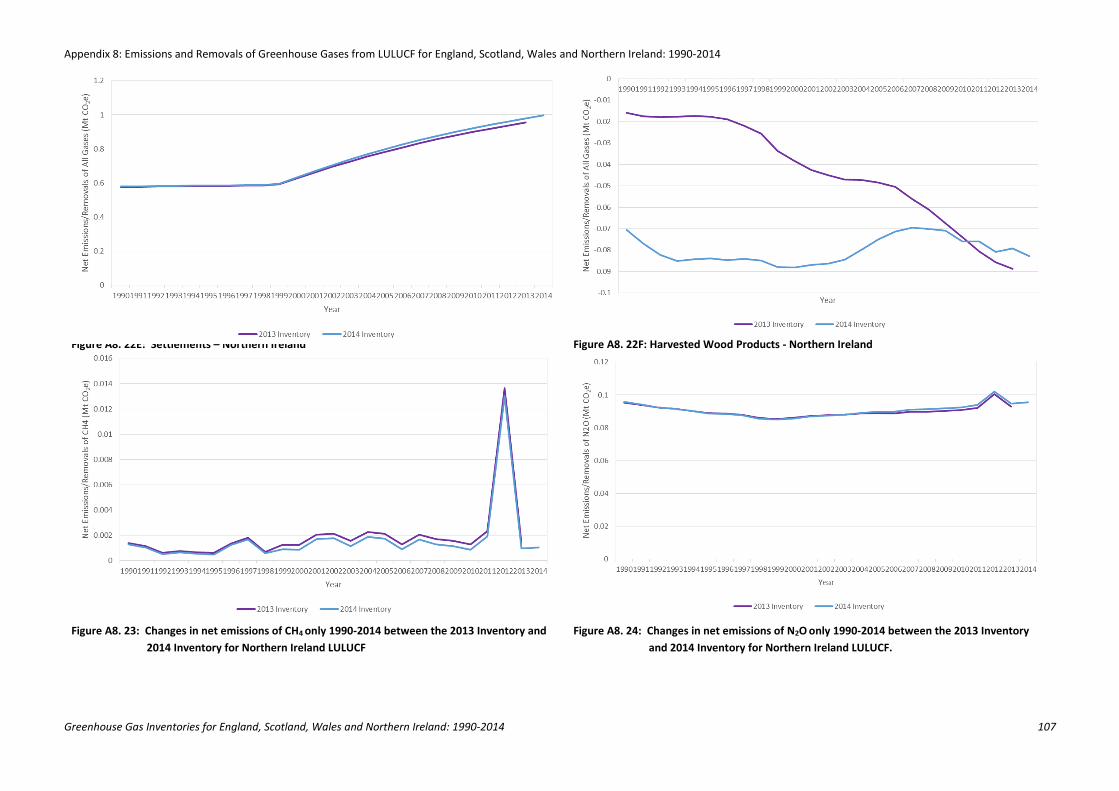
Appendix 8: Emissions and Removals of Greenhouse Gases from LULUCF for England, Scotland, Wales and Northern Ireland: 1990-2014
Greenhouse Gas Inventories for England, Scotland, Wales and Northern Ireland: 1990-2014 107
Figure A8. 22E: Settlements – Northern Ireland Figure A8. 22F: Harvested Wood Products - Northern Ireland
Figure A8. 23: Changes in net emissions of CH4 only 1990-2014 between the 2013 Inventory and
2014 Inventory for Northern Ireland LULUCF
Figure A8. 24: Changes in net emissions of N2O only 1990-2014 between the 2013 Inventory
and 2014 Inventory for Northern Ireland LULUCF.

Appendix 8: Emissions and Removals of Greenhouse Gases from LULUCF for England, Scotland, Wales and Northern Ireland: 1990-2014
Greenhouse Gas Inventories for England, Scotland, Wales and Northern Ireland: 1990-2014 108
A8.6 LULUCF Summary Tables
A8.6.1 England (all units in kilotonnes of respective gases)
Category 1990 1995 2000 2005 2010 2013 2014
A. Forest Land CO2e -4890.110 -4568.418 -5605.494 -5865.602 -6288.293 -6274.292 -6245.414
Carbon -1336.413 -1252.055 -1531.886 -1603.744 -1717.263 -1713.443 -1705.719
CH4 0.054 0.339 0.070 0.149 0.000 0.000 0.012
N2O 0.029 0.047 0.032 0.037 0.028 0.028 0.029
B. Cropland CO2e 6646.410 6716.660 6288.081 5703.607 5481.963 5303.239 5086.922
Carbon 1745.290 1768.051 1656.592 1510.919 1459.897 1413.856 1355.671
CH4 0.003 0.003 0.002 0.001 0.001 0.002 0.002
N2O 0.829 0.784 0.718 0.549 0.433 0.399 0.390
C. Grassland CO2e -2978.709 -3262.337 -3524.666 -3857.398 -4273.245 -4547.002 -4733.644
Carbon -814.611 -891.993 -965.632 -1056.982 -1170.498 -1243.262 -1293.060
CH4 0.164 0.167 0.348 0.396 0.384 0.233 0.127
N2O 0.014 0.014 0.024 0.028 0.030 0.019 0.015
D. Wetlands CO2e 266.897 374.871 299.269 221.312 110.623 158.712 158.681
Carbon 72.790 102.238 81.619 60.358 30.170 43.285 43.277
E. Settlements CO2e 4051.344 3746.063 3460.838 3236.688 3068.069 2983.509 2958.427
Carbon 1047.897 968.861 894.887 836.898 793.279 771.404 764.915
CH4 0.113 0.079 0.012 0.013 0.014 0.014 0.015
N2O 0.692 0.643 0.602 0.563 0.534 0.519 0.515
G. Harvested Wood Products CO2e
-312.931 -199.232 -25.769 -82.696 -69.741 -86.141 -76.204
Carbon -85.345 -54.336 -7.028 -22.553 -19.020 -23.493 -20.783
Total CO2e 2782.900 2807.606 892.259 -644.088 -1970.623 -2461.975 -2851.233

Appendix 8: Emissions and Removals of Greenhouse Gases from LULUCF for England, Scotland, Wales and Northern Ireland: 1990-2014
Greenhouse Gas Inventories for England, Scotland, Wales and Northern Ireland: 1990-2014 109
A8.6.2 Scotland (all units in kilotonnes of respective gases)
Category 1990 1995 2000 2005 2010 2013 2014
A. Forest Land CO2e -8379.098 -9011.003 -9771.922 -9690.018 -9792.379 -9421.709 -9272.933
Carbon -2292.637 -2467.816 -2672.851 -2651.453 -2677.511 -2578.703 -2537.517
CH4 0.042 0.306 0.069 0.156 0.000 0.197 0.134
N2O 0.088 0.101 0.090 0.094 0.084 0.096 0.094
B. Cropland CO2e 6525.647 6815.523 6790.562 5960.040 5382.815 5090.150 4968.086
Carbon 1698.553 1774.912 1771.236 1565.596 1422.978 1348.136 1316.330
CH4 0.000 0.000 0.001 0.002 0.002 0.002 0.002
N2O 0.999 1.032 0.993 0.737 0.554 0.493 0.475
C. Grassland CO2e -2017.110 -2194.701 -2199.220 -2258.314 -2453.042 -2715.989 -2730.012
Carbon -552.616 -601.084 -607.388 -624.914 -678.639 -748.547 -754.006
CH4 0.178 0.181 0.606 0.649 0.629 0.441 0.551
N2O 0.016 0.016 0.043 0.056 0.066 0.059 0.070
D. Wetlands CO2e 72.602 157.587 81.614 133.334 126.335 136.394 136.379
Carbon 19.666 42.871 22.178 36.286 34.378 37.121 37.117
N2O 0.002 0.001 0.001 0.001 0.001 0.001 0.001
E. Settlements CO2e 1843.848 1822.340 1772.353 1687.012 1625.460 1597.608 1589.380
Carbon 476.954 471.401 458.434 436.359 420.440 413.237 411.109
CH4 0.023 0.028 0.013 0.015 0.017 0.018 0.018
N2O 0.317 0.313 0.306 0.291 0.280 0.275 0.274
G. Harvested Wood Products CO2e
-383.001 -476.041 -675.631 -823.541 -754.435 -859.670 -897.026
Carbon -104.455 -129.829 -184.263 -224.602 -205.755 -234.455 -244.643
Total CO2e -2337.112 -2886.294 -4002.246 -4991.487 -5865.247 -6173.216 -6206.126

Appendix 8: Emissions and Removals of Greenhouse Gases from LULUCF for England, Scotland, Wales and Northern Ireland: 1990-2014
Greenhouse Gas Inventories for England, Scotland, Wales and Northern Ireland: 1990-2014 110
A8.6.3 Wales (all units in kilotonnes of respective gases)
Category 1990 1995 2000 2005 2010 2013 2014
A. Forest Land CO2e -1674.338 -1348.931 -1127.964 -1292.897 -1272.027 -1286.248 -1186.950
Carbon -457.548 -369.627 -308.600 -353.798 -349.238 -351.558 -326.595
CH4 0.013 0.087 0.018 0.038 0.138 0.000 0.187
N2O 0.010 0.014 0.010 0.011 0.017 0.009 0.020
B. Cropland CO2e 1181.387 1227.083 1210.953 1092.075 999.250 955.623 939.447
Carbon 307.848 319.935 316.070 286.984 264.023 252.918 248.743
CH4 0.000 0.000 0.000 0.000 0.000 0.000 0.000
N2O 0.177 0.181 0.175 0.134 0.105 0.095 0.092
C. Grassland CO2e -535.667 -607.720 -493.115 -525.334 -582.713 -575.313 -572.956
Carbon -147.068 -166.728 -136.739 -145.045 -160.726 -158.048 -158.581
CH4 0.070 0.071 0.181 0.140 0.130 0.086 0.168
N2O 0.006 0.006 0.013 0.010 0.011 0.007 0.014
D. Wetlands CO2e 0.240 0.240 0.240 0.240 0.240 0.240 0.240
Carbon 0.066 0.066 0.066 0.066 0.066 0.066 0.066
E. Settlements CO2e 817.610 816.158 793.830 737.260 696.326 678.250 672.863
Carbon 211.446 211.074 205.311 190.677 180.086 175.410 174.017
CH4 0.012 0.014 0.003 0.003 0.003 0.003 0.003
N2O 0.141 0.141 0.137 0.128 0.121 0.117 0.117
G. Harvested Wood Products CO2e
-84.012 -186.241 -210.533 -119.325 -121.955 -137.225 -148.389
Carbon -22.912 -50.793 -57.418 -32.543 -33.261 -37.425 -40.470
Total CO2e -294.780 -99.411 173.411 -107.981 -280.879 -364.672 -295.744
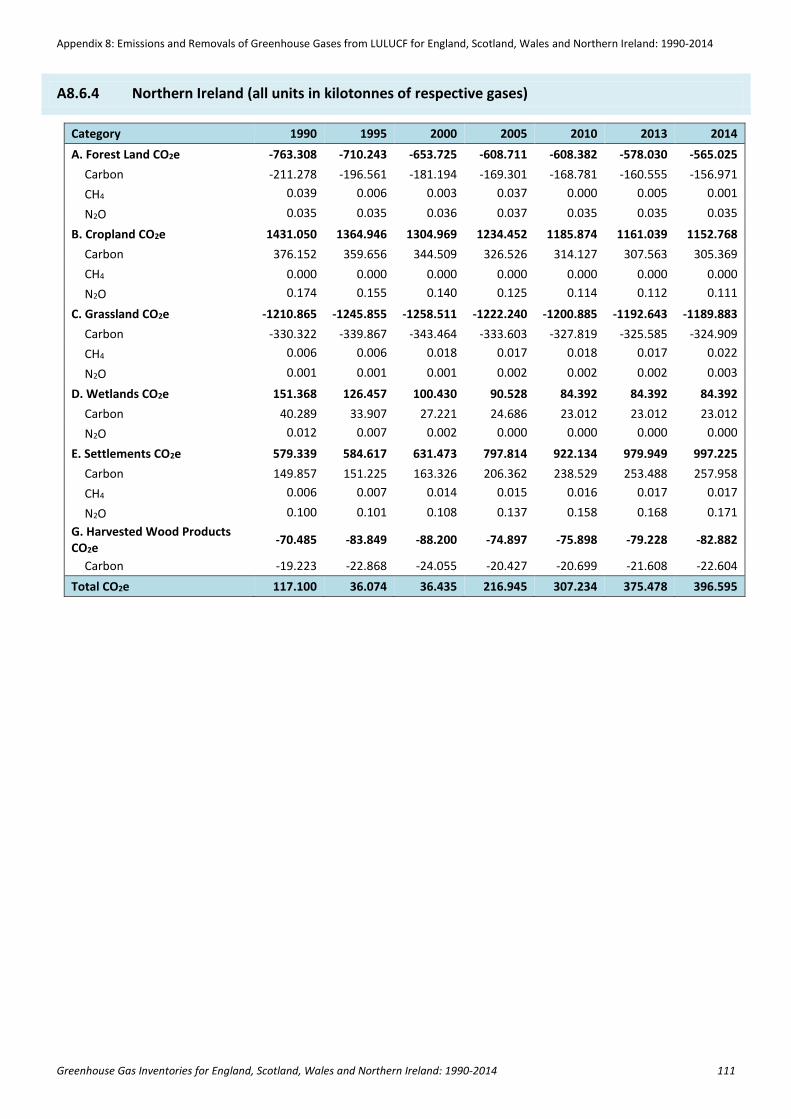
Appendix 8: Emissions and Removals of Greenhouse Gases from LULUCF for England, Scotland, Wales and Northern Ireland: 1990-2014
Greenhouse Gas Inventories for England, Scotland, Wales and Northern Ireland: 1990-2014 111
A8.6.4 Northern Ireland (all units in kilotonnes of respective gases)
Category 1990 1995 2000 2005 2010 2013 2014
A. Forest Land CO2e -763.308 -710.243 -653.725 -608.711 -608.382 -578.030 -565.025
Carbon -211.278 -196.561 -181.194 -169.301 -168.781 -160.555 -156.971
CH4 0.039 0.006 0.003 0.037 0.000 0.005 0.001
N2O 0.035 0.035 0.036 0.037 0.035 0.035 0.035
B. Cropland CO2e 1431.050 1364.946 1304.969 1234.452 1185.874 1161.039 1152.768
Carbon 376.152 359.656 344.509 326.526 314.127 307.563 305.369
CH4 0.000 0.000 0.000 0.000 0.000 0.000 0.000
N2O 0.174 0.155 0.140 0.125 0.114 0.112 0.111
C. Grassland CO2e -1210.865 -1245.855 -1258.511 -1222.240 -1200.885 -1192.643 -1189.883
Carbon -330.322 -339.867 -343.464 -333.603 -327.819 -325.585 -324.909
CH4 0.006 0.006 0.018 0.017 0.018 0.017 0.022
N2O 0.001 0.001 0.001 0.002 0.002 0.002 0.003
D. Wetlands CO2e 151.368 126.457 100.430 90.528 84.392 84.392 84.392
Carbon 40.289 33.907 27.221 24.686 23.012 23.012 23.012
N2O 0.012 0.007 0.002 0.000 0.000 0.000 0.000
E. Settlements CO2e 579.339 584.617 631.473 797.814 922.134 979.949 997.225
Carbon 149.857 151.225 163.326 206.362 238.529 253.488 257.958
CH4 0.006 0.007 0.014 0.015 0.016 0.017 0.017
N2O 0.100 0.101 0.108 0.137 0.158 0.168 0.171
G. Harvested Wood Products CO2e
-70.485 -83.849 -88.200 -74.897 -75.898 -79.228 -82.882
Carbon -19.223 -22.868 -24.055 -20.427 -20.699 -21.608 -22.604
Total CO2e 117.100 36.074 36.435 216.945 307.234 375.478 396.595

Appendix 8: Emissions and Removals of Greenhouse Gases from LULUCF for England, Scotland, Wales and Northern Ireland: 1990-2014
Greenhouse Gas Inventories for England, Scotland, Wales and Northern Ireland: 1990-2014 112
A8.6.5 United Kingdom (all units in kilotonnes of respective gases)
Category 1990 1995 2000 2005 2010 2013 2014
A. Forest Land CO2e -15706.854 -15638.595 -17159.106 -17457.227 -17961.081 -17560.279 -17270.322
Carbon -4297.877 -4286.060 -4694.531 -4778.296 -4912.793 -4804.258 -4726.803
CH4 0.149 0.738 0.160 0.380 0.138 0.202 0.334
N2O 0.162 0.196 0.168 0.180 0.165 0.169 0.178
B. Cropland CO2e 15784.494 16124.212 15594.565 13990.174 13049.902 12510.050 12147.223
Carbon 4127.843 4222.554 4088.407 3690.025 3461.026 3322.474 3226.112
CH4 0.003 0.003 0.003 0.003 0.003 0.004 0.004
N2O 2.178 2.152 2.026 1.544 1.206 1.099 1.067
C. Grassland CO2e -6742.351 -7310.614 -7475.513 -7863.287 -8509.885 -9030.947 -9226.496
Carbon -1844.618 -1999.673 -2053.224 -2160.545 -2337.682 -2475.442 -2530.557
CH4 0.418 0.425 1.153 1.203 1.161 0.777 0.869
N2O 0.036 0.037 0.081 0.096 0.109 0.088 0.102
D. Wetlands CO2e 491.107 659.155 481.552 445.416 321.591 379.739 379.692
Carbon 132.811 179.081 131.084 121.396 87.625 103.484 103.471
N2O 0.014 0.008 0.003 0.001 0.001 0.001 0.001
E. Settlements CO2e 7292.141 6969.179 6658.494 6458.773 6311.988 6239.316 6217.896
Carbon 1886.154 1802.561 1721.958 1670.297 1632.335 1613.538 1607.999
CH4 0.154 0.128 0.041 0.046 0.050 0.052 0.053
N2O 1.250 1.197 1.153 1.118 1.092 1.080 1.076
G. Harvested Wood Products CO2e
-850.429 -945.364 -1000.134 -1100.459 -1022.030 -1162.264 -1204.501
Carbon -231.935 -257.826 -272.764 -300.125 -278.735 -316.981 -328.500
Total CO2e 268.108 -142.025 -2900.141 -5526.611 -7809.515 -8624.386 -8956.508

Appendix 8: Emissions and Removals of Greenhouse Gases from LULUCF for England, Scotland, Wales and Northern Ireland: 1990-2014
Greenhouse Gas Inventories for England, Scotland, Wales and Northern Ireland: 1990-2014 113
A8.7 Kyoto Protocol LULUCF Summary Tables The first commitment period of the Kyoto Protocol ran from 2008-2012. The second commitment period is for 2013-2020. There have been
significant changes to reporting KP-LULUCF for the second period14: with the modification of categories, the inclusion of Harvested Wood
Products and the use of a Forest Management Reference Level rather than a Forest Management cap. The UK has also elected three
additional Article 3.4 activities: Cropland Management, Grazing Land Management and Wetland Drainage and Rewetting. Cropland
Management and Grazing Land Management have been reported for the first time in the 1990-2014 inventory. Methods and activity data
for Wetland Drainage and Rewetting (and additional components of Grazing Land Management) are being developed, so no estimates are
reported for this category at the present time.
The Forest Management Reference Level (FMRL) is a quantified amount against which a country can compare their performance during the
commitment period. The FMRL reflects expected emissions and removals from business-as-usual forest management (including policies in
place by December 2009). Removals in excess of the FMRL will result in a credit under the KP, whereas those below the FMRL will result in a
debit (this is calculated at the end of the commitment period over the entire period). The UK’s Forest Management Reference Level during
the second commitment period (2013-2020) is -3.442 Mt CO2e/yr, or -8.268 Mt CO2e/yr when harvested wood products are included. A
Technical Correction to the FMRL has been calculated to reflect the revised methods and activity data used for calculating emissions and
removals from Forest Management. The Technical Correction for the second commitment period (2013-2020) is -9.275 Mt CO2e/yr, or -5.658
Mt CO2e/yr when harvested wood products are included.
Note that the United Kingdom is the official Party to the Kyoto Protocol, so areas and emissions estimates are presented here for the
Devolved Administrations and England for information only.
14 A useful primer for the changes in the Kyoto Protocol reporting is Iversen P., Lee D., and Rocha M., (2014) “Understanding Land Use in the UNFCCC” http://www.climateandlandusealliance.org/uploads/PDFs/Understanding_Land_Use_in_the_UNFCCC.pdf

Appendix 8: Emissions and Removals of Greenhouse Gases from LULUCF for England, Scotland, Wales and Northern Ireland: 1990-2014
Greenhouse Gas Inventories for England, Scotland, Wales and Northern Ireland: 1990-2014 114
A8.7.1 England
England’s share of the FMRL and Technical Correction is approximately 34%, based on the average of the 2013 and 2014 Forest
Management net removals.
Activity 1990 2013 2014
3.3 Afforestation & Reforestation
Area, kha 4.335 103.054 105.708
Net carbon stock change, kt CO2 -14.442 -1240.090 -1298.119
GHG emissions from biomass burning, kt CO2e 0.077 0.000 0.417
Non-GHG emissions from drained and rewetted organic soils, kt CO2e
0.009 0.215 0.220
N2O emissions from N fertilization, kt CO2e 0.334 0.285 0.344
N2O emissions from N mineralisation, kt CO2e* 0.025 0.662 0.681
Harvested Wood Product kt CO2e 0.000 -3.019 -3.705
3.3 Deforestation Area, kha 0.622 18.020 18.327
Net carbon stock change, kt CO2 90.112 182.894 110.131
GHG emissions from biomass burning, kt CO2e 56.765 87.585 39.927
N2O emissions from N mineralisation, kt CO2e* 0.088 2.521 2.604
3.4 Forest Management
Area, kha 963.666 945.154 944.820
Net carbon stock change, kt CO2 -4848.754 -5018.511 -4954.085
GHG emissions from biomass burning, kt CO2e 17.001 0.000 3.314
Non-GHG emissions from drained and rewetted organic soils, kt CO2e
1.897 1.755 1.749
N2O emissions from N mineralisation, kt CO2e* 5.568 5.412 5.409
Harvested Wood Product kt CO2e NA -987.842 -956.017
3.4 Cropland management
Area, kha 4374.365 4305.903 4270.350
Net carbon stock change, kt CO2 -152.287 2858.576 2734.970
GHG emissions from biomass burning, kt CO2e 0.032 0.047 0.030
N2O emissions from N mineralisation, kt CO2e* 26.126 262.347 265.172
3.4 Grazing Land Management
Area, kha 6202.699 6153.432 6183.365
Net carbon stock change, kt CO2 -184.147 -2203.613 -2298.612
GHG emissions from biomass burning, kt CO2e 6.683 0.754 1.900
N2O emissions from N mineralisation, kt CO2e* 10.511 102.418 103.384
Area, kha 4.335 103.054 105.708
3.4 Wetlands Drainage and Rewetting
Under development
* The full title of this activity is “N2O emissions from N mineralisation/immobilisation due to carbon loss/gain associated with land-use
conversions and management change in mineral soils”

Appendix 8: Emissions and Removals of Greenhouse Gases from LULUCF for England, Scotland, Wales and Northern Ireland: 1990-2014
Greenhouse Gas Inventories for England, Scotland, Wales and Northern Ireland: 1990-2014 115
A8.7.2 Scotland
Scotland’s share of the FMRL and Technical Correction is approximately 53%, based on the average of the 2013 and 2014 Forest
Management net removals.
Activity 1990 2013 2014
3.3 Afforestation & Reforestation
Area, kha 14.341 208.385 216.136
Net carbon stock change, kt CO2 -3.568 -1666.986 -1788.655
GHG emissions from biomass burning, kt CO2e 0.190 13.114 9.308
Non-GHG emissions from drained and rewetted organic soils, kt CO2e
0.140 2.279 2.367
N2O emissions from N fertilization, kt CO2e 3.715 0.688 0.940
N2O emissions from N mineralisation, kt CO2e* 0.152 2.672 2.794
Harvested Wood Product kt CO2e 0.000 -18.765 -19.324
3.3 Deforestation Area, kha 0.233 27.832 29.104
Net carbon stock change, kt CO2 23.311 438.216 457.133
GHG emissions from biomass burning, kt CO2e 14.180 145.226 151.510
N2O emissions from N mineralisation, kt CO2e* 0.065 11.472 11.966
3.4 Forest Management
Area, kha 1068.541 1039.077 1037.732
Net carbon stock change, kt CO2 -8531.594 -7711.685 -7385.917
GHG emissions from biomass burning, kt CO2e 13.931 52.278 35.381
Non-GHG emissions from drained and rewetted organic soils, kt CO2e
10.277 9.084 8.996
N2O emissions from N mineralisation, kt CO2e* 11.205 10.653 10.621
Harvested Wood Product kt CO2e NA -1752.393 -1715.932
3.4 Cropland management
Area, kha 644.741 600.437 603.349
Net carbon stock change, kt CO2 309.126 3196.316 3166.262
GHG emissions from biomass burning, kt CO2e 0.000 0.000 0.000
N2O emissions from N mineralisation, kt CO2e* 34.285 279.094 279.851
3.4 Grazing Land Management
Area, kha 5712.808 5582.641 5571.468
Net carbon stock change, kt CO2 267.644 -629.715 -679.765
GHG emissions from biomass burning, kt CO2e 7.073 3.852 7.233
N2O emissions from N mineralisation, kt CO2e* 7.182 75.768 76.742
Area, kha 14.341 208.385 216.136
3.4 Wetlands Drainage and Rewetting
Under development
* The full title of this activity is “N2O emissions from N mineralisation/immobilisation due to carbon loss/gain associated with land-use
conversions and management change in mineral soils”

Appendix 8: Emissions and Removals of Greenhouse Gases from LULUCF for England, Scotland, Wales and Northern Ireland: 1990-2014
Greenhouse Gas Inventories for England, Scotland, Wales and Northern Ireland: 1990-2014 116
A8.7.3 Wales
Wales’s share of the FMRL and Technical Correction is approximately 9%, based on the average of the 2013 and 2014 Forest Management
net removals.
Activity 1990 2013 2014
3.3 Afforestation & Reforestation
Area, kha 0.559 12.051 12.360
Net carbon stock change, kt CO2 -0.066 -59.655 -65.858
GHG emissions from biomass burning, kt CO2e 0.009 0.000 2.875
Non-GHG emissions from drained and rewetted organic soils, kt CO2e
0.002 0.049 0.050
N2O emissions from N fertilization, kt CO2e 0.071 0.050 0.060
N2O emissions from N mineralisation, kt CO2e* 0.003 0.075 0.077
Harvested Wood Product kt CO2e 0.000 -1.074 -1.045
3.3 Deforestation Area, kha 0.079 4.792 5.033
Net carbon stock change, kt CO2 11.039 60.609 61.631
GHG emissions from biomass burning, kt CO2e 6.878 30.309 30.657
N2O emissions from N mineralisation, kt CO2e* 0.017 0.711 0.736
3.4 Forest Management
Area, kha 273.720 268.736 268.485
Net carbon stock change, kt CO2 -1686.049 -1200.559 -1159.588
GHG emissions from biomass burning, kt CO2e 4.490 0.000 59.579
Non-GHG emissions from drained and rewetted organic soils, kt CO2e
1.087 1.035 1.033
N2O emissions from N mineralisation, kt CO2e* 1.621 1.590 1.592
Harvested Wood Product kt CO2e NA -450.025 -437.215
3.4 Cropland management
Area, kha 239.528 185.881 187.500
Net carbon stock change, kt CO2 69.379 631.980 628.240
GHG emissions from biomass burning, kt CO2e 0.000 0.000 0.000
N2O emissions from N mineralisation, kt CO2e* 6.260 54.130 54.327
3.4 Grazing Land Management
Area, kha 1408.746 1433.214 1430.392
Net carbon stock change, kt CO2 9.496 -2.666 -7.961
GHG emissions from biomass burning, kt CO2e 3.320 0.420 4.670
N2O emissions from N mineralisation, kt CO2e* 3.167 33.676 34.132
Area, kha 0.559 12.051 12.360
3.4 Wetlands Drainage and Rewetting
Under development
* The full title of this activity is “N2O emissions from N mineralisation/immobilisation due to carbon loss/gain associated with land-use
conversions and management change in mineral soils”

Appendix 8: Emissions and Removals of Greenhouse Gases from LULUCF for England, Scotland, Wales and Northern Ireland: 1990-2014
Greenhouse Gas Inventories for England, Scotland, Wales and Northern Ireland: 1990-2014 117
A8.7.4 Northern Ireland
Northern Ireland’s share of the FMRL and Technical Correction is approximately 3%, based on the average of the 2013 and 2014 Forest
Management net removals.
Activity 1990 2013 2014
3.3 Afforestation & Reforestation
Area, kha 1.322 15.906 16.135
Net carbon stock change, kt CO2 -0.785 -179.479 -188.482
GHG emissions from biomass burning, kt CO2e 0.259 0.393 0.117
Non-GHG emissions from drained and rewetted organic soils, kt CO2e
0.161 2.200 2.233
N2O emissions from N fertilization, kt CO2e 0.457 0.016 0.025
N2O emissions from N mineralisation, kt CO2e* 0.021 0.327 0.333
Harvested Wood Product kt CO2e 0.000 -2.056 -2.281
3.3 Deforestation Area, kha 0.031 1.677 1.770
Net carbon stock change, kt CO2 4.059 51.923 53.557
GHG emissions from biomass burning, kt CO2e 2.427 12.225 12.384
N2O emissions from N mineralisation, kt CO2e* 0.015 1.781 1.856
3.4 Forest Management
Area, kha 67.523 65.805 65.709
Net carbon stock change, kt CO2 -775.017 -400.772 -382.855
GHG emissions from biomass burning, kt CO2e 12.962 1.234 0.358
Non-GHG emissions from drained and rewetted organic soils, kt CO2e
8.070 6.900 6.861
N2O emissions from N mineralisation, kt CO2e* 1.040 1.025 1.024
Harvested Wood Product kt CO2e NA -159.631 -150.473
3.4 Cropland management
Area, kha 168.492 119.419 117.126
Net carbon stock change, kt CO2 102.803 731.642 740.275
GHG emissions from biomass burning, kt CO2e 0.000 0.000 0.000
N2O emissions from N mineralisation, kt CO2e* 6.129 60.079 60.882
3.4 Grazing Land Management
Area, kha 1046.531 1050.618 1050.658
Net carbon stock change, kt CO2 -28.336 86.586 94.161
GHG emissions from biomass burning, kt CO2e 0.277 0.079 0.333
N2O emissions from N mineralisation, kt CO2e* 2.553 62.317 64.217
Area, kha 1.322 15.906 16.135
3.4 Wetlands Drainage and Rewetting
Under development
* The full title of this activity is “N2O emissions from N mineralisation/immobilisation due to carbon loss/gain associated with land-use
conversions and management change in mineral soils”

Appendix 8: Emissions and Removals of Greenhouse Gases from LULUCF for England, Scotland, Wales and Northern Ireland: 1990-2014
Greenhouse Gas Inventories for England, Scotland, Wales and Northern Ireland: 1990-2014 118
A8.7.5 United Kingdom
The UK’s Forest Management Reference Level during the second commitment period (2013-2020) is -3.442 Mt CO2e/yr, or -8.268 Mt
CO2e/yr when harvested wood products are included and the Technical Correction to the Forest Management Reference Level is -9.275 Mt
CO2e/yr, or -5.658 Mt CO2e/yr when harvested wood products are included.
Activity 1990 2013 2014
3.3 Afforestation & Reforestation
Area, kha 20.557 339.396 350.339
Net carbon stock change, kt CO2 -18.861 -3146.211 -3341.113
GHG emissions from biomass burning, kt CO2e 0.534 13.507 12.717
Non-GHG emissions from drained and rewetted organic soils, kt CO2e
0.312 4.742 4.870
N2O emissions from N fertilization, kt CO2e 4.577 1.039 1.370
N2O emissions from N mineralisation, kt CO2e* 0.202 3.736 3.886
Harvested Wood Product kt CO2e 0.000 -24.914 -26.355
3.3 Deforestation Area, kha 0.965 52.321 54.234
Net carbon stock change, kt CO2 128.520 733.643 682.452
GHG emissions from biomass burning, kt CO2e 80.250 275.346 234.478
N2O emissions from N mineralisation, kt CO2e* 0.185 16.485 17.163
3.4 Forest Management
Area, kha 2373.450 2318.772 2316.746
Net carbon stock change, kt CO2 -15841.414
-14331.526
-13882.444
GHG emissions from biomass burning, kt CO2e 48.385 53.511 98.632
Non-GHG emissions from drained and rewetted organic soils, kt CO2e
21.331 18.775 18.640
N2O emissions from N mineralisation, kt CO2e* 19.433 18.680 18.646
Harvested Wood Product kt CO2e NA -3349.892 -3259.636
3.4 Cropland management
Area, kha 5427.126 5211.640 5178.325
Net carbon stock change, kt CO2 329.022 7418.514 7269.747
GHG emissions from biomass burning, kt CO2e 0.032 0.047 0.030
N2O emissions from N mineralisation, kt CO2e* 72.800 655.649 660.232
3.4 Grazing Land Management
Area, kha 14370.784 14219.905 14235.883
Net carbon stock change, kt CO2 64.657 -2749.408 -2892.177
GHG emissions from biomass burning, kt CO2e 17.353 5.105 14.136
N2O emissions from N mineralisation, kt CO2e* 23.412 274.179 278.475
Area, kha 20.557 339.396 350.339
3.4 Wetlands Drainage and Rewetting
Under development
* The full title of this activity is “N2O emissions from N mineralisation/immobilisation due to carbon loss/gain associated with land-use
conversions and management change in mineral soils”

Appendix 8: Emissions and Removals of Greenhouse Gases from LULUCF for England, Scotland, Wales and Northern Ireland: 1990-2014
Greenhouse Gas Inventories for England, Scotland, Wales and Northern Ireland: 1990-2014 119
A8.8 Data sources Activity/
Dataset
Organisation Update
Frequency
Further details
4A Afforestation-
Forest Planting
Forestry Commission Annual National Inventory of Woodland and Trees: http://www.forestry.gov.uk/forestry/HCOU-54PG9U Forestry Statistics: http://www.forestry.gov.uk/statistics
4A Afforestation-
Forest Planting
Forestry Commission Quinquennial National Forest Inventory http://www.forestry.gov.uk/forestry/INFD-
89Q9TY
4A,4G CARBINE
model
Forest Research Annual The Forest Research carbon accounting model, CARBINE, calculates gains
and losses in pools of carbon in standing trees, litter and soil in conifer
and broadleaf forests and in harvested wood products. The model can
represent different forest management regimes and is driven by Forestry
Commission planting and management data.
http://www.forestry.gov.uk/fr/INFD-633DXB
4B/4C/4E
Deforestation –
Area data
Forestry Commission &
Forest Research
Annual Compiled from multiple data sources by forestry experts (Forestry
Commission felling licences, Ordnance Survey change data for non-rural
areas, Countryside Survey, National Forest Inventory forest loss, habitat
restoration, forest management plans).
4B/4C/4E Land
Use Change-
Countryside
Survey
Centre for Ecology &
Hydrology
Decadal
(1984, 1990,
1998, 2007).
GB: http://www.countrysidesurvey.org.uk
Northern Ireland Countryside Survey: http://www.ni-
environment.gov.uk/biodiversity/nh-research/nicountrysidesurvey-
2/nics_2007_results.htm
4B/4C/4E Land
Use Change-
Monitoring
Landscape
Change
Monitoring Landscape
Change
1947 and
1980
Historic land use change data for Great Britain. (Pre-1990 data for
Northern Ireland is compiled from Agricultural Census and Forest Service
data)
4B/4C/4E Land
Use Change -
Soils Data
James Hutton Institute/
Cranfield Soil and AgriFood
Institute (CSAI),
One off
dataset (2005)
Database of soil carbon density for the UK. Bradley, R. I., R. Milne, et al. (2005). "A soil carbon and land use database for the United Kingdom." Soil Use and Management 21(004): 363-369.
4B Cropland
Management/4C
Grassland
Management -
Agricultural
Census
Defra/DARDNI/Scottish
Government/Welsh
Government
Annual England:https://www.gov.uk/government/statistical-data-sets/structure-of-the-agricultural-industry-in-england-and-the-uk-at-june Scotland:http://www.scotland.gov.uk/Topics/Statistics/Browse/Agriculture-Fisheries/PubFinalResultsJuneCensus Wales: http://wales.gov.uk/statistics-and-research/survey-agricultural-horticulture/?lang=en#/statistics-and-research/survey-agricultural-horticulture/?tab=previous&lang=en Northern Ireland:http://www.dardni.gov.uk/index/statistics/statistical-reports/agricultural-census-ni.htm
4B Cropland
Management –
GB British Survey
of Fertiliser
Practice
Department for
Environment Food and
Rural Affairs
Annual https://www.gov.uk/government/collections/fertiliser-usage
4B/4C Drainage
on organic soils
ADAS (personal
communication)
One off
dataset
(2014).
Spatial extent of cultivated organic soils (on cropland and improved
grassland in all DAs)

Appendix 8: Emissions and Removals of Greenhouse Gases from LULUCF for England, Scotland, Wales and Northern Ireland: 1990-2014
Greenhouse Gas Inventories for England, Scotland, Wales and Northern Ireland: 1990-2014 120
Activity/
Dataset
Organisation Update
Frequency
Further details
4A/4B/4C
Wildfires – IRS
Data
Fire and Rescue Service Annual The fire Incidence and Reporting Systems (IRS) includes wildfires on all
land use categories for GB for 2010 onwards. Pre-2010 wildfire area has
been estimated using Forestry Commission and Forest Service data for
forest wildfires and extrapolation based on satellite proxy data for non-
forest wildfires. Non-forest wildfires in Northern Ireland are estimated
using the same rates of grassland burning as in Scotland and grassland
areas from the 2007 Countryside Survey.
4B/4C Drainage
on organic soils
ADAS (personal
communication)
One off
dataset.
Spatial extent of cultivated organic soils (on cropland and improved
grassland in all DAs)
4D Peat
Extraction –
Mineral
Extraction in
Great Britain
Office of National Statistics Annual Annual peat production in Great Britain is inferred from extractor sales
by volume https://www.gov.uk/government/statistics/mineral-
extraction-in-great-britain-2012
4D Peat
Extraction–
Directory of
Mines and
Quarries
British Geological Survey Every 3-4
years (latest
in 2014)
The directory gives the location of active commercial extraction sites in
GB. http://www.bgs.ac.uk/mineralsuk/mines/dmq.html. Current areas of
commercial extraction are measured from Google Earth satellite imagery
(approximately 2010 dates) using the site location data.
4D Peat
Extraction–
Extraction data
Northern Ireland
Scientific Reports Ad hoc
updates.
Cruickshank, M. M., and R. W. Tomlinson (1997), Carbon loss from UK peatlands for fuel and horticulture, in Carbon Sequestration in Vegetation and Soils, edited by M. G. R. Cannell, Department on Environment, London. Tomlinson, R. W. (2010). “Changes in the extent of peat extraction in
Northern Ireland 1990–2008 and associated changes in carbon loss.”
Applied Geography, 30: 294-301.
4D Flooded
Lands- Reservoir
construction
Environment
Agency/SEPA/Northern
Ireland personal
communication
Annual England and Wales: Public Register of Large Raised Reservoirs provided
by the Environment Agency.
Scotland: SEPA Water Body Classification database (of water bodies > 0.5
km2) and the associated Water Body data sheets.
It was established through discussion with local experts that no new large
reservoirs had been built in Northern Ireland since the 1950s.
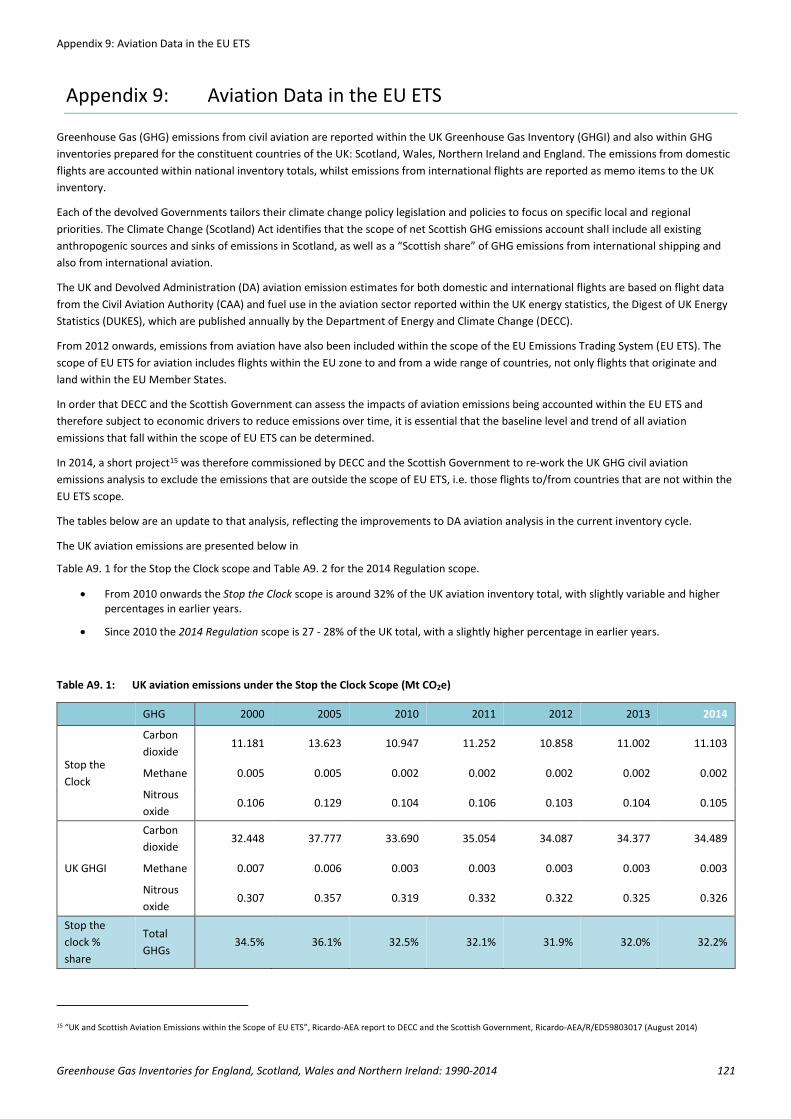
Appendix 9: Aviation Data in the EU ETS
Greenhouse Gas Inventories for England, Scotland, Wales and Northern Ireland: 1990-2014 121
Appendix 9: Aviation Data in the EU ETS
Greenhouse Gas (GHG) emissions from civil aviation are reported within the UK Greenhouse Gas Inventory (GHGI) and also within GHG
inventories prepared for the constituent countries of the UK: Scotland, Wales, Northern Ireland and England. The emissions from domestic
flights are accounted within national inventory totals, whilst emissions from international flights are reported as memo items to the UK
inventory.
Each of the devolved Governments tailors their climate change policy legislation and policies to focus on specific local and regional
priorities. The Climate Change (Scotland) Act identifies that the scope of net Scottish GHG emissions account shall include all existing
anthropogenic sources and sinks of emissions in Scotland, as well as a “Scottish share” of GHG emissions from international shipping and
also from international aviation.
The UK and Devolved Administration (DA) aviation emission estimates for both domestic and international flights are based on flight data
from the Civil Aviation Authority (CAA) and fuel use in the aviation sector reported within the UK energy statistics, the Digest of UK Energy
Statistics (DUKES), which are published annually by the Department of Energy and Climate Change (DECC).
From 2012 onwards, emissions from aviation have also been included within the scope of the EU Emissions Trading System (EU ETS). The
scope of EU ETS for aviation includes flights within the EU zone to and from a wide range of countries, not only flights that originate and
land within the EU Member States.
In order that DECC and the Scottish Government can assess the impacts of aviation emissions being accounted within the EU ETS and
therefore subject to economic drivers to reduce emissions over time, it is essential that the baseline level and trend of all aviation
emissions that fall within the scope of EU ETS can be determined.
In 2014, a short project15 was therefore commissioned by DECC and the Scottish Government to re-work the UK GHG civil aviation
emissions analysis to exclude the emissions that are outside the scope of EU ETS, i.e. those flights to/from countries that are not within the
EU ETS scope.
The tables below are an update to that analysis, reflecting the improvements to DA aviation analysis in the current inventory cycle.
The UK aviation emissions are presented below in
Table A9. 1 for the Stop the Clock scope and Table A9. 2 for the 2014 Regulation scope.
From 2010 onwards the Stop the Clock scope is around 32% of the UK aviation inventory total, with slightly variable and higher percentages in earlier years.
Since 2010 the 2014 Regulation scope is 27 - 28% of the UK total, with a slightly higher percentage in earlier years.
Table A9. 1: UK aviation emissions under the Stop the Clock Scope (Mt CO2e)
GHG 2000 2005 2010 2011 2012 2013 2014
Stop the
Clock
Carbon
dioxide 11.181 13.623 10.947 11.252 10.858 11.002 11.103
Methane 0.005 0.005 0.002 0.002 0.002 0.002 0.002
Nitrous
oxide 0.106 0.129 0.104 0.106 0.103 0.104 0.105
UK GHGI
Carbon
dioxide 32.448 37.777 33.690 35.054 34.087 34.377 34.489
Methane 0.007 0.006 0.003 0.003 0.003 0.003 0.003
Nitrous
oxide 0.307 0.357 0.319 0.332 0.322 0.325 0.326
Stop the
clock %
share
Total
GHGs 34.5% 36.1% 32.5% 32.1% 31.9% 32.0% 32.2%
15 “UK and Scottish Aviation Emissions within the Scope of EU ETS”, Ricardo-AEA report to DECC and the Scottish Government, Ricardo-AEA/R/ED59803017 (August 2014)

Appendix 9: Aviation Data in the EU ETS
Greenhouse Gas Inventories for England, Scotland, Wales and Northern Ireland: 1990-2014 122
Table A9. 2: UK aviation emissions under the 2014 Regulation Scope (Mt CO2e)
GHG 2000 2005 2010 2011 2012 2013 2014
2014 Regulation
Carbon dioxide 9.658 11.993 9.352 9.599 9.343 9.502 9.506
Methane 0.005 0.004 0.002 0.002 0.002 0.002 0.002
Nitrous oxide 0.091 0.113 0.088 0.091 0.088 0.090 0.090
UK GHGI
Carbon dioxide 32.448 37.777 33.690 35.054 34.087 34.377 34.489
Methane 0.007 0.006 0.003 0.003 0.003 0.003 0.003
Nitrous oxide 0.307 0.357 0.319 0.332 0.322 0.325 0.326
2014 Regulation % share Total GHGs 29.8% 31.8% 27.8% 27.4% 27.4% 27.6% 27.6%
The Scotland aviation emissions are presented below in Table A9. 3 for the Stop the Clock scope and Table A9. 4 for the 2014 Regulation scope.
From 2005 onwards the Stop the Clock scope is between 74-79% of the Scotland aviation inventory total.
Since 2010 the 2014 Regulation scope has been between 66-73% of the Scotland total.
Table A9. 3: Scotland aviation emissions under the Stop the Clock Scope (Mt CO2e)
GHG 2000 2005 2010 2011 2012 2013 2014
Stop the Clock
Carbon dioxide 1.223 1.503 1.185 1.260 1.222 1.256 1.248
Methane 0.001 0.001 0.000 0.000 0.000 0.000 0.000
Nitrous oxide 0.012 0.014 0.011 0.012 0.012 0.012 0.012
Scotland GHGI
Carbon dioxide 1.458 1.912 1.535 1.611 1.584 1.654 1.697
Methane 0.001 0.001 0.000 0.000 0.000 0.000 0.000
Nitrous oxide 0.014 0.018 0.015 0.015 0.015 0.016 0.016
Stop the clock % share Total GHGs 83.9% 78.6% 77.2% 78.2% 77.2% 75.9% 73.6%
Table A9. 4: Scotland aviation emissions under the 2014 Regulation Scope (Mt CO2e)
GHG 2000 2005 2010 2011 2012 2013 2014
2014 Regulation
Carbon dioxide 1.133 1.401 1.082 1.128 1.106 1.118 1.139
Methane 0.001 0.001 0.000 0.000 0.000 0.000 0.000
Nitrous oxide 0.011 0.013 0.010 0.011 0.010 0.011 0.011
Scotland GHGI
Carbon dioxide 1.458 1.912 1.535 1.611 1.584 1.697 1.654
Methane 0.001 0.001 0.000 0.000 0.000 0.000 0.000
Nitrous oxide 0.014 0.018 0.015 0.015 0.015 0.016 0.016
2014 Regulation %
share Total GHGs 77.7% 73.3% 70.5% 70.0% 69.8% 65.9% 68.9%

References
Greenhouse Gas Inventories for England, Scotland, Wales and Northern Ireland: 1990-2014 123
References
AEA (2004) Emissions and Projections of HFCs, PFCs and SF6 for the UK and Constituent Countries. Final Report prepared for the
Department for Environment, Food and Rural Affairs, 2nd Edition, June 2004, AEA Technology, Oxfordshire, UK.
AES Drax (2004) Power station fuel consumption, Personal Communication.
Airtricity (2015) Airtricity (formerly Phoenix Gas) Gas consumption and gas leakage data for 2014, Personal Communication.
BCA (2004) Personal Communcations with British Cement Association.
BGS (2015) United Kingdom Minerals Yearbook, British Geological Survey, Natural Environment Research Council.
Brown P. Cardenas L. MacCarthy J. Murrells T. Pang Y. Passant N. Thistlethwaite G. Thomson A. & Webb N. (2012) UK Greenhouse Gas
Inventory, 1990 to 2010, Annual report for submission under the Framework Convention on Climate Change, AEA Technology April 2012.
Brown P. Broomfield M. Buys G. Cardenas L. Kilroy E. MacCarthy J. Murrells T. Pang Y. Passant N. Ramirez Garcia. J Thislethwaite G. & Webb
N. (2016) Annual Report for Submission under Framework Convention on Climate Change. http://unfccc.int/files/national_reports
Brown P. & Abbott J. (2015) Development of the Uncertainity Analysis of the Scottish GHG Inventory.
CAA (2015) UK airport statistics 2014 – annual, CAA, 2015.
Coal Authority (2015) Regional Coal Production: open cast and deep mined, Personal Communication.
Cottrill & Smith (2006) Nitrogen excretion factors for the UK Ammonia Inventory, Cotteril and Smith, ADAS, 2006.
DECC (2015a) “Digest of UK Energy Statistics” Department of Energy & Climate Change, HMSO.
DECC (2015b) Energy Trends December 2015, articles on DA electricity generation and consumption patterns and the sub-national energy
statistics for 2003 to 2014.
DECC (2015c) Local gas use data by LDZ, Personal Communication.
DECC (2015d) Oil & Gas flaring and venting volume data by installation and gas landings information, Personal Communication.
DECC (2015e) Site-specific emission estimates from the Environmental Emissions Monitoring Systems (EEMS) for upstream oil and gas
installations, including terminals and offshore sites, personal communication.
DECC (2015f) Energy Trends March 2015, articles on DA electricity generation and consumption patterns and the regional energy statistics
for 2003 to 2014.
DECC (2015g) Regional Statistics 2003-2014: Generation, September 2015.
Defra (2006) Final report, Project WT0715NVZ, ‘Nitrogen output of livestock excreta’.
Defra (2015a) Agricultural Census Statistics for UK, Annual Reference Tables, Labour Force, DEFRA Agricultural Statistics website.
Defra (2015b) Agriculture in the UK 2014.
DETI (2010) Business Opportunities and Challenges Presented by Carbon Emissions Targets, Cambridge Econometrics, January 2010.
DFPNI (2015. Summary energy data from the Public Sector Energy Campaign, by fuel for 2012-2013..
DfT (2012) Personal communication with Alberto Pompermaier, Department for Transport (2012).
DfT (2015a) Maritime Statistics 2014.
DfT (2015b) Road traffic by vehicle type and road class, Great Britain. NAEI specific request to DfT.
DfT (2015c) Transport Statistics Great Britain.
DRDNI (2014) Annual Road Traffic Estimates, 2008 to 20134, Northern Ireland Statistics and Research Agency – covers the 2008-20134 road
traffic estimates.
DTI (2001) Development of UK Oil and Gas Resources, Department of Trade and Industry, The Stationary Office.
EA (2000) “COPERT III: Computer Programme to Calculate Emissions from Road Transport - Methodology and Emission Factors (Version
2.1)”, L. Ntziachristos and Z Samaras, European Topic Centre on Air Emissions, European Environment Agency, November 2000.
EA (2009) Pollution Inventory, Personal Communication (Stephanie Littler).

References
Greenhouse Gas Inventories for England, Scotland, Wales and Northern Ireland: 1990-2014 124
EA (2015a) Environment Agency, Database of emissions to atmosphere from authorised processes in England & Wales, as reported to the
Pollution Inventory including data for 1998-2014 (2015).
EA (2015b) Database of EU ETS operator data including fuel use, process details and emissions totals for 2014.
EEA (2013) EMEP/EEA air pollutant emission inventory guidebook 2013. http://www.eea.europa.eu/publications/emep-eea-guidebook-
2013
Entec (2010) UK Ship Emissions Inventory, Final Report to Defra, November 2010.
Firmus Energy (2015) Northern Ireland gas sales for domestic and commercial & industrial customers for 2014, Personal Communication.
Haydock et al. (2003) “Emissions & Projections of HFCs, PFCs and SF6 for the UK and Constituent Countries”, AEA Technology.
Hogg, D. Ballinger A. & Oonk, H. (2011) Inventory Improvement Project - UK Landfill Methane Emissions Model Final Report to Defra and
DECC http://randd.defra.gov.uk/Document.aspx?Document=9887_WR1124Finalreportincludingappendices.pdf
Innogy (2004) RWE Innogy, Power station annual fuel consumption, Personal Communication (2004).
IPCC (1996) Climate Change 1995, the Science of Climate Change, Contribution of Working Group 1 to the Second Assessment Report of
the Intergovernmental Panel on Climate Change, Ed. Houghton, JT, Cambridge University Press.
IPCC (2006) 2006 IPCC Guidelines for National Greenhouse Gas Inventories, IPCC National Greenhouse Gas Inventories Programme, IGES
Task Force on National Greenhouse Gas Inventories..
ISSB (2015) Iron & Steel Industry Annual Statistics for the UK, Consumption by Product by Region, Energy consumption by region in 2014.
Juniper D. T. Aikman P. C. Green C. & Phipps R. H. (2006) Finishing cull dairy cows for beef production.
MacCarthy J. (2010) Personal Communication from Joanna MacCarthy to provide updates to the UK F-gas model for emissions from
refrigeration and air conditioning.
MAFF (1990) UK Tables of nutritive value and chemical composition of feedingstuffs. Rowett Research Services Ltd, Greenburn Road,
Bucksburn, Aberdeen, AB2 9SB, UK.
Minchin W. Buckley F. Kenny D. A. Keane M. G. Shalloo L. & O'Donovan M. (2009) Prediction of cull cow carcass characteristics from
liveweight and body condition score measured pre slaughter. Irish Journal of Agriculture and Food Research 48:75-86.
MoD (2015) Personal Communication with Chris Cottle, MoD, August 2015.
Murrells T. et al. (2011) Definitions of Gas Oil and DERV and Allocations to Sectors in the UK Greenhouse Gas Inventory. AEA Report for
DECC under Task 5 of the 2011 UK GHG Inventory Improvement Programme. AEAT/ENV/R/3234, November 2011.
NAEI (2011) NAEI UK Emission Mapping Methodology, September 2010.
National Grid (2015) Natural gas leakage from high pressure, low pressure distribution systems and from Above Ground Installations.
Netcen (2004) “Non-Road Mobile Machinery Usage, Life and Correction Factors”, Report to the Department for Transport,
AEAT/ENV/R/1895, November 2004, https://uk-
air.defra.gov.uk/assets/documents/reports/cat15/0502141215_NRMM_report_Final_November_2004_3.pdf
Nicholson F. Rollett A. & Chambers B. (2011) Review of pollutant losses from solid manures stored in temporary field heaps. Defra project
WT1006, ADAS, 56 pp..
NIDoE (2009) Northern Ireland Environment Agency Pollution Inventory (PIV), Personal Communication (Hugh McGinn).
NIEA (2015a) Northern Ireland Environment Agency, Spreadsheet of emissions to atmosphere from authorised processes in Northern
Ireland, as reported to the Inventory of Statutory Releases (data for 2005-2013).
NIEA (2015b) Spreadsheet of EU ETS operator data including fuel use, process details and emissions totals, Personal Communication..
Northern Gas Networks (2015) Natural Gas leakage from LDZ and AGIs, Personal Communication.
ONS (2013) National Rail Trends Yearbook, http://dataportal.orr.gov.uk/displayreport/report/html/df2ac230-682c-4041-9b29-
8f4d4d732af7
ONS (2015) Datasets available pertaining to a wide range of industrial and population-related activities via the publications “Annual
Abstract of Statistics” and “Regional Trends”, Office for National Statistics.
ORR (2010) Office of Rail Regulation (ORR), Seventh Edition of the National Rail Trends Yearbook (2010)
http://webarchive.nationalarchives.gov.uk/20110207095927/rail-reg.gov.uk//upload/pdf/nrt-yearbook-2009-10.pdf

References
Greenhouse Gas Inventories for England, Scotland, Wales and Northern Ireland: 1990-2014 125
Patel (2000) Personal Communication, NETCEN, Culham.
PowerTech (2004) PowerTech (2004). Annual Power Station Fuel Consumption, Personal Communication.
RCEP (1993) Royal Commission on Environmental Pollution, 17th Report, Incineration of Waste, HMSO, London.
Ricardo-AEA (2014) GHG Inventory Research: Use of EU ETS Data - Iron and Steel Sector: Review of UK data on emissions of GHGs from the
Iron and Steel sector to utilise EU ETS data in the national inventory https://uk-
air.defra.gov.uk/assets/documents/reports/cat19/14050811
Rio Tinto Alcan (2015) Personal Communication to provide a breakdown of emissions by source at Alcan sites in 2014.
Scotia Gas Networks (2015) Natural Gas leakage from LDZ and AGIs, Personal Communication.
Scottish and Southern Energy (2004) Scottish and Southern Energy plc, Power Station Fuel Consumption, Personal Communication (2006).
Scottish Power (2004) Scottish Power plc, annual Power Station Fuel Consumption, Personal Communication (2006).
SEPA (2009) Scottish Pollutant Release Inventory (SPRI), Personal Communication (Don MacKay).
SEPA (2015a) Annual atmospheric emissions data for authorised processes in Scotland, from SEPA’s Pollution Release Inventory.
SEPA (2015b) Spreadsheet of EU ETS operator data including fuel use, process details and emissions totals.
SKM Enviros (1999) “UK Emissions of HFCs, PFCs, and SF6 and Potential Emission Reduction Options”. March Consulting Group, 1999..
SMMT (2015) Personal communication with Tim Bruin, Society of Motor Manufacturers and Traders, September 2015.
Sneath R. W. Chadwick D. R. Phillips V. R. & Pain B. F. (1997) A UK Inventory of Methane/Nitrous Oxide Emissions from Farmed Livestock.
Contract reports (2) to MAFF, projects WA0604/5, SRI, IGER & ADAS.
SO (1999) Scottish Energy Statistics, Paper supplied by G Winter, Scottish Office.
Stewart (2012) Translink data provided to Ricardo-AEA by David Stewart in October 2012.
Tata Steel (2015) Detailed breakdown of emissions by source from the Tata Steel integrated steelworks in 2014, Personal Communications.
Tsagatakis I. Brace S. Passant N. & Cooke S. (2013) UK Emission Mapping Methodology 2011. A report of the National Atmospheric
Emissions Inventory. Ricardo-AEA.
UKOOA (1999) Personal communication from P Russell, UKOOA (Environment Committee).
UKPIA (2015) Breakdown of UK refinery emissions, by site and estimated for combustion and process sources, Personal Communication,
United Kingdom Petroleum Industry Association.
UKWIR (2015) GHG emissions data reported by water companies in England, Wales, Scotland and Northern Ireland in 2013..
Vayu Ltd (2015) Northern Ireland gas sales for domestic and commercial & industrial customers for 2014, Personal Communication.
Wales & West Utilities (2015) Natural Gas leakage from LDZ and AGIs, Personal Communication.
Wheeler, Wright & Phillips (2012) Average age of lambs at slaughter, Personal Communication.
WO (1998) Digest of Welsh Historical Statistics 1974-1996, The Welsh Office.
WSP (2011) Update of Estimated Methane Emissions from UK Abandoned Coal Mines.


