Embed Size (px)
Citation preview
Greater Kuparuk Area (GKA) Alpine Field
Corrosion Programs Overview
April 7, 2003
Commitment to Corrosion Monitoring 3rd Annual Report to the Alaska Department of Environmental Conservation
Prepared by ConocoPhillips Corrosion Team
Table of Contents
1.0 Overview 2.0 Significant Changes to Corrosion Programs 3.0 Program Status Summary
3.1 Year 2002 Overview a. Monitoring & Mitigation b. Well Line Inspection c. Cross-Country Line Inspection d. External (Weld-Pack) Program e. Below Grade Piping Program f. Other Structural Concerns g. Spills/Incidents
3.2 Year 2003 Forecast
a. Monitoring & Mitigation b. Well Line Inspection c. Cross-Country Line Inspection d. External (Weld-Pack) Program e. Below Grade Piping Program f. Other
Appendix A Corrosion Monitoring Exception Data and External
Corrosion Inspection/Leak/Save Results Appendix B Glossary of Terms used in this Report
Page 2 Final 04/07/03
1.0 OVERVIEW There are over $4MMM in capital assets in the Greater Kuparuk Area (GKA). Over the past few years, the corrosivity of the produced fluids at Kuparuk has increased to a level that has the potential to cause internal corrosion damage to the facilities. The corrosivity is increasing as water production and H2S levels increase. External corrosion has also become a potential problem on aging pipeline systems. Effective management of corrosion at Kuparuk is critical to maintain environmental and facility integrity, reduce field operating costs, and to extend the life of the field infrastructure to meet future needs. Alpine is ConocoPhillips' newest development and the largest onshore oil field discovered in North America in the past decade. Alpine has a gross processing capacity of 100,000 BOPD. The Alpine development produces from a pad area of 97 acres, and has 2 Drill Sites. The corrosion management system used at Kuparuk is also being applied to the new Alpine field. The purpose of this 3rd Annual Report is to communicate the details of the individual programs that implement the ConocoPhillips Alaska Corrosion Strategy. In addition to the requirements of the North Slope Charter Agreement between ConocoPhillips Alaska, Inc., BP Exploration (Alaska), and the Alaska Department of Environmental Conservation, previous reporting requirements pertaining to the Below Grade Piping Program will be incorporated into this and future North Slope Charter Corrosion Reports. Because of the large amount of data from corrosion monitoring and corrosion inspections, Appendix A has been added. Appendix A contains corrosion coupon exception data and external corrosion inspection and leak/save historical results. A glossary of terms used in this report is included as Appendix B. 2.0 SIGNIFICANT ENHANCEMENTS TO CORROSION PROGRAMS
• Developed a corrosion inhibitor-screening lab in the Bartlesville technology center. In doing so we
established our lab qualification testing protocols for use of Rotating Cylinder Autoclave (RCA), Interfacial Tension measurements (IFT) and Total Organic Carbon (TOC) analysis. In addition we established a method for evaluation of lab data generated during testing using statistics, allowing us to better rank performance between inhibitors for selection to actual field-testing.
• Started Corrosion Inhibitor injection at Alpine CD1 Drill Site Cross Country Line. • Initiated a Turbulent Flow Survey (TFS) on cross-country three-phase oil lines. This program is
designed to schedule fittings, such as elbows and tees, for recurring inspection based on flow characteristics, which may cause velocity assisted corrosion damage. The TFS supplements our RTR inspection program, which is designed to find internal damage in straight runs of pipe.
• Implemented use of Intrinsically safe UT machine.
• Initiated the CUI Buffer Spike test on 76 test locations during summer of 2002.
Page 3 Final 04/07/03
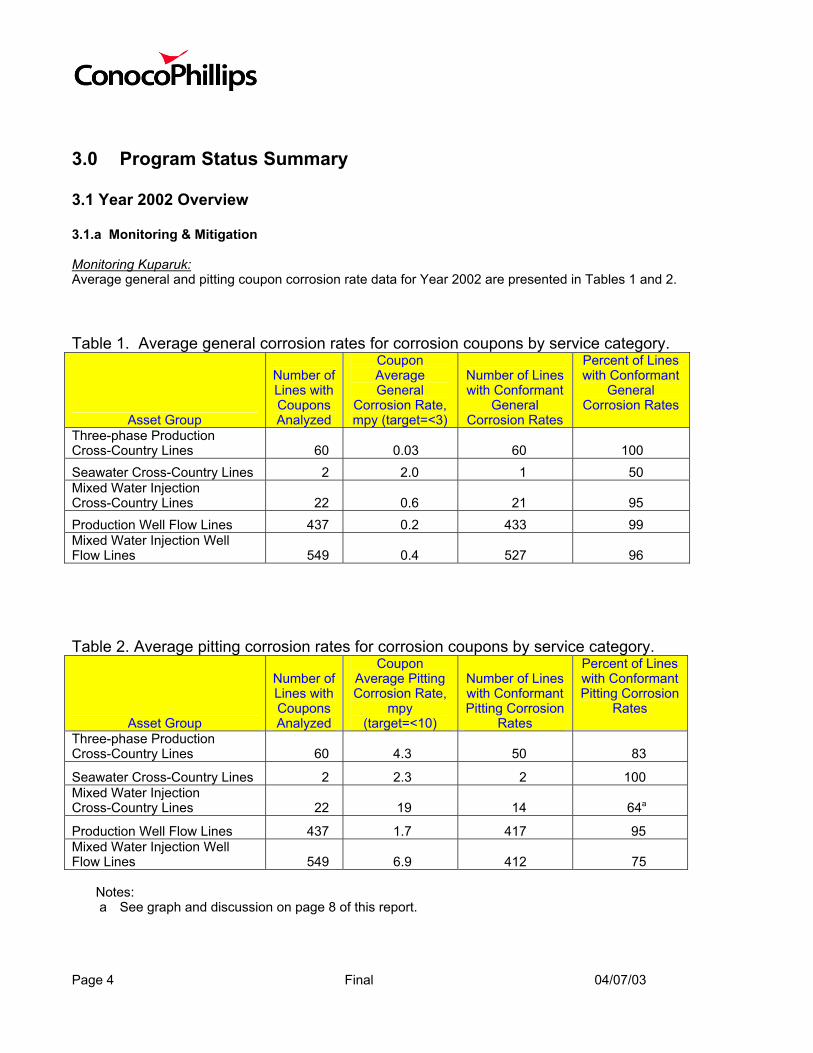
3.0 Program Status Summary 3.1 Year 2002 Overview 3.1.a Monitoring & Mitigation Monitoring Kuparuk: Average general and pitting coupon corrosion rate data for Year 2002 are presented in Tables 1 and 2. Table 1. Average general corrosion rates for corrosion coupons by service category.
Asset Group
Number of Lines with Coupons Analyzed
Coupon Average General
Corrosion Rate, mpy (target=<3)
Number of Lines with Conformant
General Corrosion Rates
Percent of Lines with Conformant
General Corrosion Rates
Three-phase Production Cross-Country Lines 60 0.03 60 100 Seawater Cross-Country Lines 2 2.0 1 50 Mixed Water Injection Cross-Country Lines 22 0.6 21 95 Production Well Flow Lines 437 0.2 433 99 Mixed Water Injection Well Flow Lines 549 0.4 527 96 Table 2. Average pitting corrosion rates for corrosion coupons by service category.
Asset Group
Number of Lines with Coupons Analyzed
Coupon Average Pitting Corrosion Rate,
mpy (target=<10)
Number of Lines with Conformant Pitting Corrosion
Rates
Percent of Lines with Conformant Pitting Corrosion
Rates
Three-phase Production Cross-Country Lines 60 4.3 50
83
Seawater Cross-Country Lines 2 2.3 2 100 Mixed Water Injection Cross-Country Lines 22 19 14
64a
Production Well Flow Lines 437 1.7 417 95 Mixed Water Injection Well Flow Lines 549 6.9 412
75
Notes:
a See graph and discussion on page 8 of this report.
Page 4 Final 04/07/03
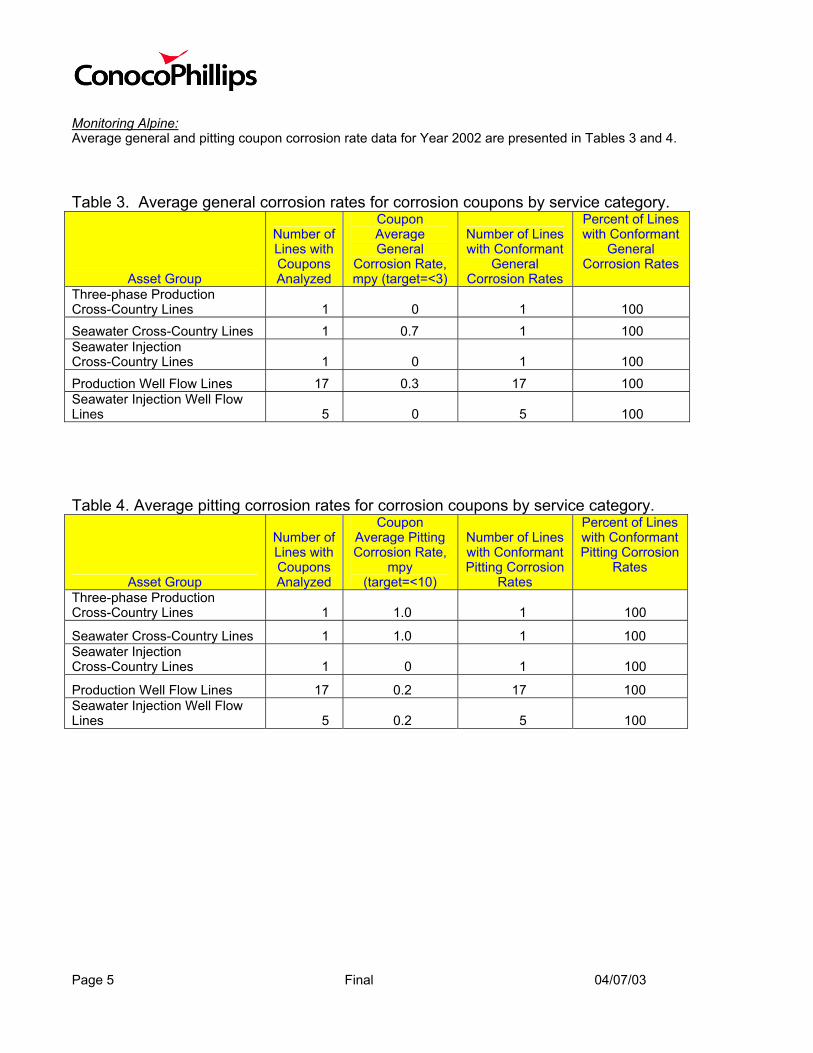
Monitoring Alpine: Average general and pitting coupon corrosion rate data for Year 2002 are presented in Tables 3 and 4. Table 3. Average general corrosion rates for corrosion coupons by service category.
Asset Group
Number of Lines with Coupons Analyzed
Coupon Average General
Corrosion Rate, mpy (target=<3)
Number of Lines with Conformant
General Corrosion Rates
Percent of Lines with Conformant
General Corrosion Rates
Three-phase Production Cross-Country Lines 1 0 1 100 Seawater Cross-Country Lines 1 0.7 1 100 Seawater Injection Cross-Country Lines 1 0 1 100 Production Well Flow Lines 17 0.3 17 100 Seawater Injection Well Flow Lines 5 0 5 100 Table 4. Average pitting corrosion rates for corrosion coupons by service category.
Asset Group
Number of Lines with Coupons Analyzed
Coupon Average Pitting Corrosion Rate,
mpy (target=<10)
Number of Lines with Conformant Pitting Corrosion
Rates
Percent of Lines with Conformant Pitting Corrosion
Rates
Three-phase Production Cross-Country Lines 1 1.0 1
100
Seawater Cross-Country Lines 1 1.0 1 100 Seawater Injection Cross-Country Lines 1 0 1
100
Production Well Flow Lines 17 0.2 17 100 Seawater Injection Well Flow Lines 5 0.2 5
100
Page 5 Final 04/07/03
0
5
10
15
20
25
30
198
5
198
6
198
7
198
8
198
9
199
0
199
1
199
2
199
3
199
4
199
5
199
6
199
7
199
8
199
9
200
0
200
1
200
2
Pull Year
Cor
rosi
on R
ate
(mpy
)
Overall_MPY Pitting_MPY
Three-phase Production Cross Country Line Coupons
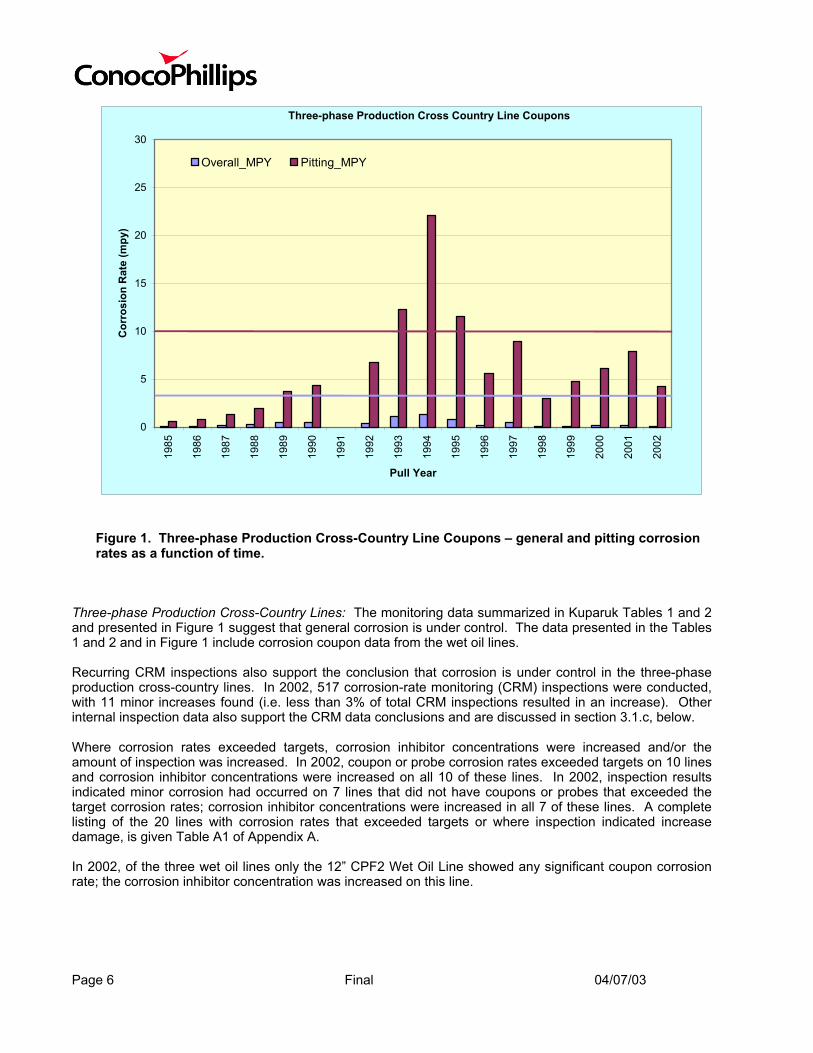
Figure 1. Three-phase Production Cross-Country Line Coupons – general and pitting corrosion rates as a function of time.
Three-phase Production Cross-Country Lines: The monitoring data summarized in Kuparuk Tables 1 and 2 and presented in Figure 1 suggest that general corrosion is under control. The data presented in the Tables 1 and 2 and in Figure 1 include corrosion coupon data from the wet oil lines. Recurring CRM inspections also support the conclusion that corrosion is under control in the three-phase production cross-country lines. In 2002, 517 corrosion-rate monitoring (CRM) inspections were conducted, with 11 minor increases found (i.e. less than 3% of total CRM inspections resulted in an increase). Other internal inspection data also support the CRM data conclusions and are discussed in section 3.1.c, below. Where corrosion rates exceeded targets, corrosion inhibitor concentrations were increased and/or the amount of inspection was increased. In 2002, coupon or probe corrosion rates exceeded targets on 10 lines and corrosion inhibitor concentrations were increased on all 10 of these lines. In 2002, inspection results indicated minor corrosion had occurred on 7 lines that did not have coupons or probes that exceeded the target corrosion rates; corrosion inhibitor concentrations were increased in all 7 of these lines. A complete listing of the 20 lines with corrosion rates that exceeded targets or where inspection indicated increase damage, is given Table A1 of Appendix A. In 2002, of the three wet oil lines only the 12” CPF2 Wet Oil Line showed any significant coupon corrosion rate; the corrosion inhibitor concentration was increased on this line.
Page 6 Final 04/07/03
0
5
10
15
20
25
30
198
5
198
6
198
7
198
8
198
9
199
0
199
1
199
2
199
3
199
4
199
5
199
6
199
7
199
8
199
9
200
0
200
1
200
2
Pull Year
Cor
rosi
on R
ate
(mpy
)
Overall_MPY Pitting_MPY
Sea Water Cross Country Line Coupons
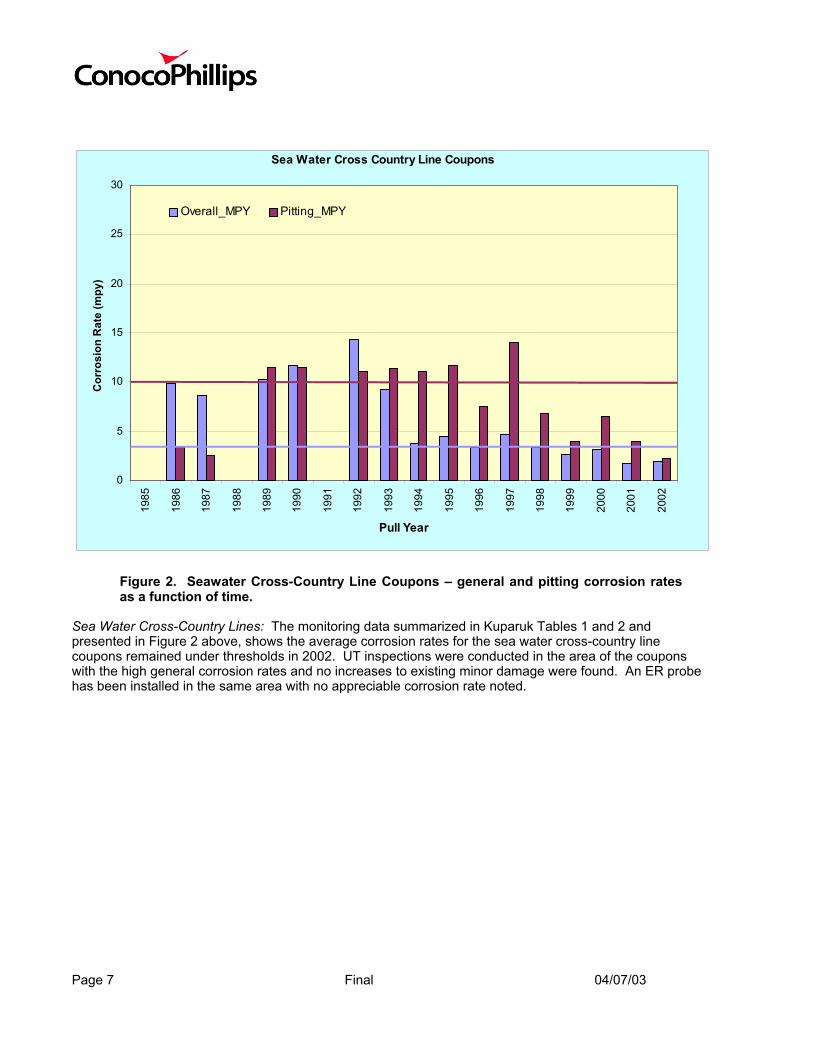
Figure 2. Seawater Cross-Country Line Coupons – general and pitting corrosion rates as a function of time.
Sea Water Cross-Country Lines: The monitoring data summarized in Kuparuk Tables 1 and 2 and presented in Figure 2 above, shows the average corrosion rates for the sea water cross-country line coupons remained under thresholds in 2002. UT inspections were conducted in the area of the coupons with the high general corrosion rates and no increases to existing minor damage were found. An ER probe has been installed in the same area with no appreciable corrosion rate noted.
Page 7 Final 04/07/03
0
5
10
15
20
25
30 1
985
198
6
198
7
198
8
198
9
199
0
199
1
199
2
199
3
199
4
199
5
199
6
199
7
199
8
199
9
200
0
200
1
200
2
Pull Year
Cor
rosi
on R
ate
(mpy
)
Overall_MPY Pitting_MPY
Water Injection Cross Country Line Coupons
Pitting 3.4 mpy Avg excluding CPF2
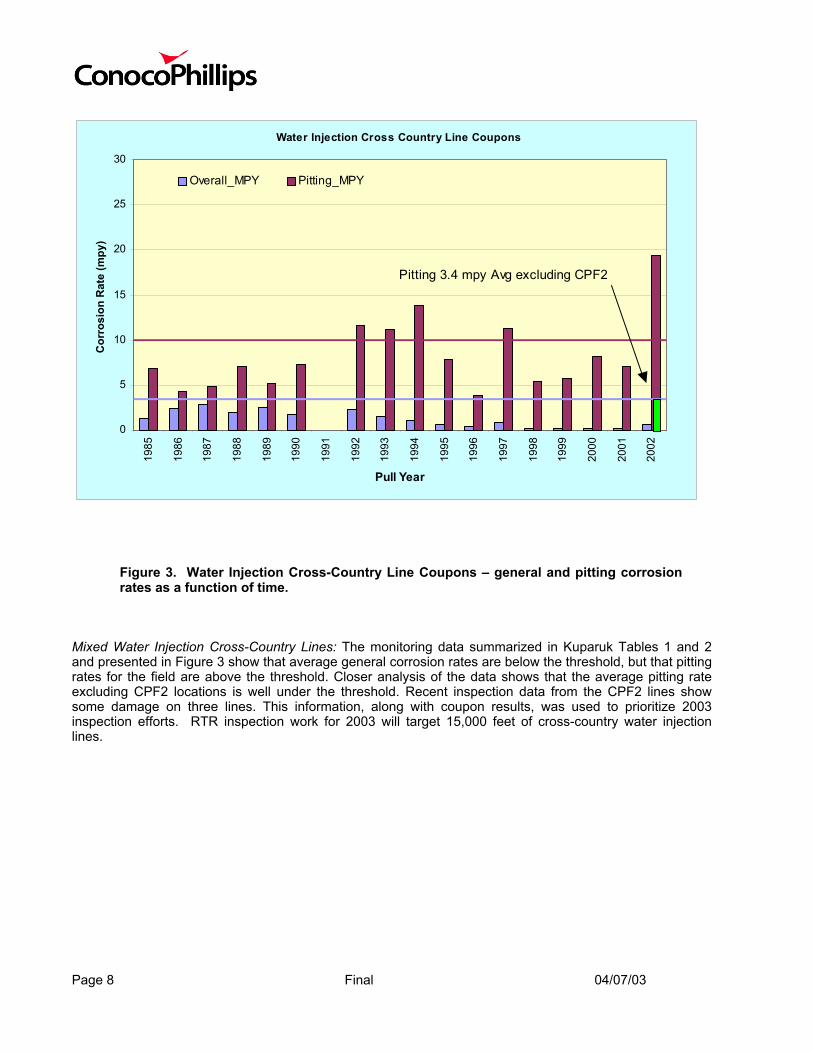
Figure 3. Water Injection Cross-Country Line Coupons – general and pitting corrosion rates as a function of time.
Mixed Water Injection Cross-Country Lines: The monitoring data summarized in Kuparuk Tables 1 and 2 and presented in Figure 3 show that average general corrosion rates are below the threshold, but that pitting rates for the field are above the threshold. Closer analysis of the data shows that the average pitting rate excluding CPF2 locations is well under the threshold. Recent inspection data from the CPF2 lines show some damage on three lines. This information, along with coupon results, was used to prioritize 2003 inspection efforts. RTR inspection work for 2003 will target 15,000 feet of cross-country water injection lines.
Page 8 Final 04/07/03
0
5
10
15
20
25
3019
85
1986
1987
1988
1989
1990
1991
1992
1993
1994
1995
1996
1997
1998
1999
2000
2001
2002
Pull Year
Cor
rosi
on R
ate
(mpy
)
Overall_MPY Pitting_MPY
Produced Crude Well Line Coupons
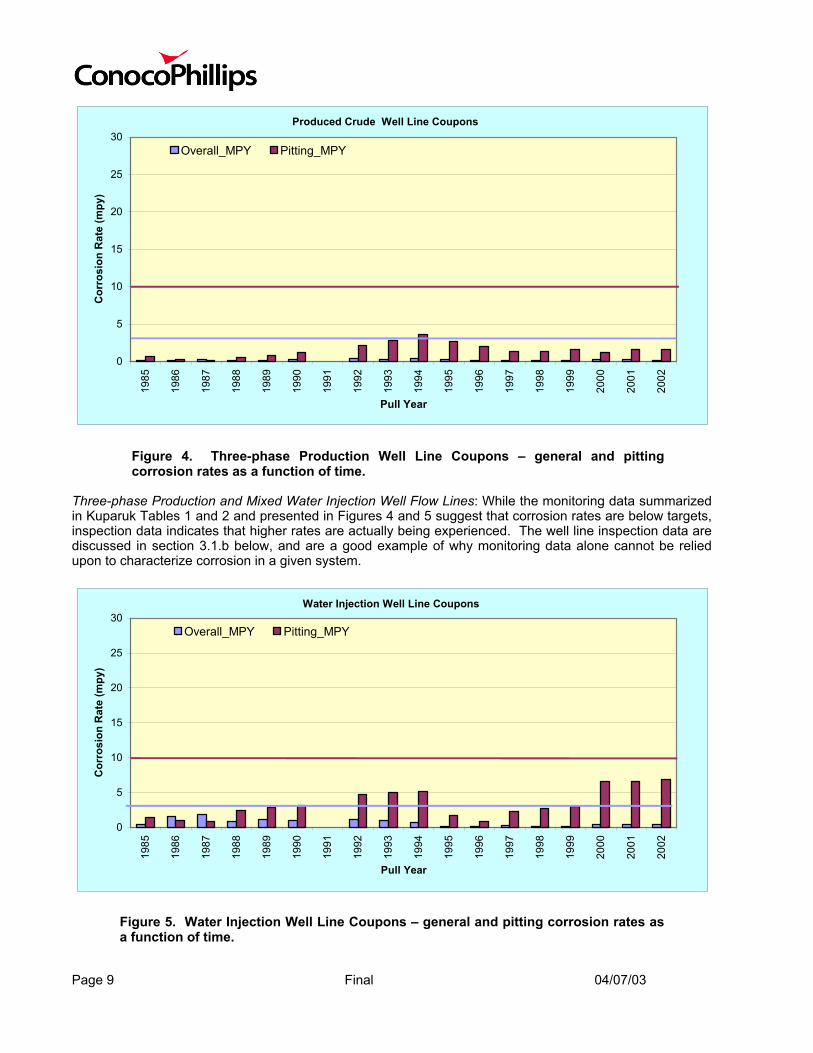
Figure 4. Three-phase Production Well Line Coupons – general and pitting corrosion rates as a function of time.
Three-phase Production and Mixed Water Injection Well Flow Lines: While the monitoring data summarized in Kuparuk Tables 1 and 2 and presented in Figures 4 and 5 suggest that corrosion rates are below targets, inspection data indicates that higher rates are actually being experienced. The well line inspection data are discussed in section 3.1.b below, and are a good example of why monitoring data alone cannot be relied upon to characterize corrosion in a given system.
0
5
10
15
20
25
30
1985
1986
1987
1988
1989
1990
1991
1992
1993
1994
1995
1996
1997
1998
1999
2000
2001
2002
Pull Year
Cor
rosi
on R
ate
(mpy
)
Overall_MPY Pitting_MPY
Water Injection Well Line Coupons
Figure 5. Water Injection Well Line Coupons – general and pitting corrosion rates as a function of time.
Page 9 Final 04/07/03
Mitigation: In first quarter 2002, the field was converted from Cortron 2000-25 to Cortron RU-276 based on poor performance of the 2000-25. One new inhibitor VX6789 was tested at DS1R; the test yielded good monitoring data, however the inhibitor did not out-perform the incumbent inhibitor.
0
500
1000
1500
2000
2500
3000
3500
4000
11/9
912
/99
1/00
2/00
3/00
4/00
5/00
6/00
7/00
8/00
9/00
10/0
011
/00
12/0
01/
012/
013/
014/
015/
016/
017/
018/
019/
0110
/01
11/0
112
/01
1/02
2/02
3/02
4/02
5/02
6/02
7/02
8/02
9/02
10/0
211
/02
12/0
2
GPD
-50
-40
-30
-20
-10
0
10
20
% D
iffer
ence
Target GPD Actual GPD% Difference
Field Wide Corrosion Inhibitor Usage
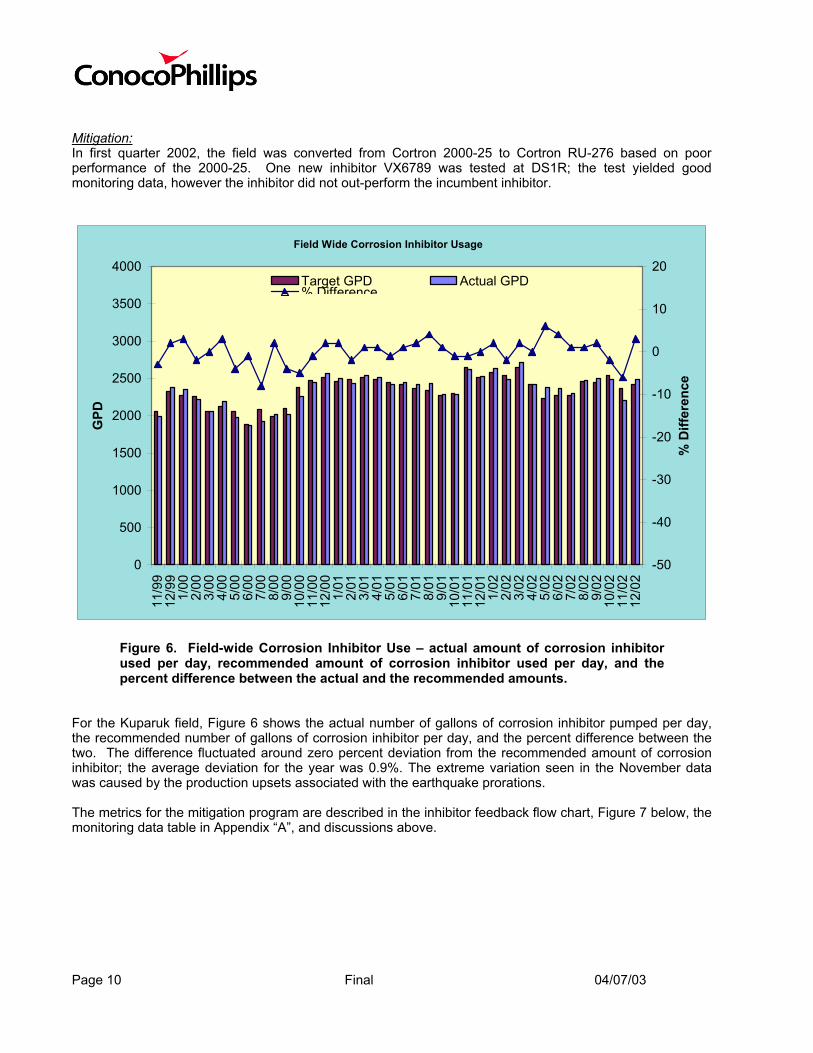
Figure 6. Field-wide Corrosion Inhibitor Use – actual amount of corrosion inhibitor used per day, recommended amount of corrosion inhibitor used per day, and the percent difference between the actual and the recommended amounts.
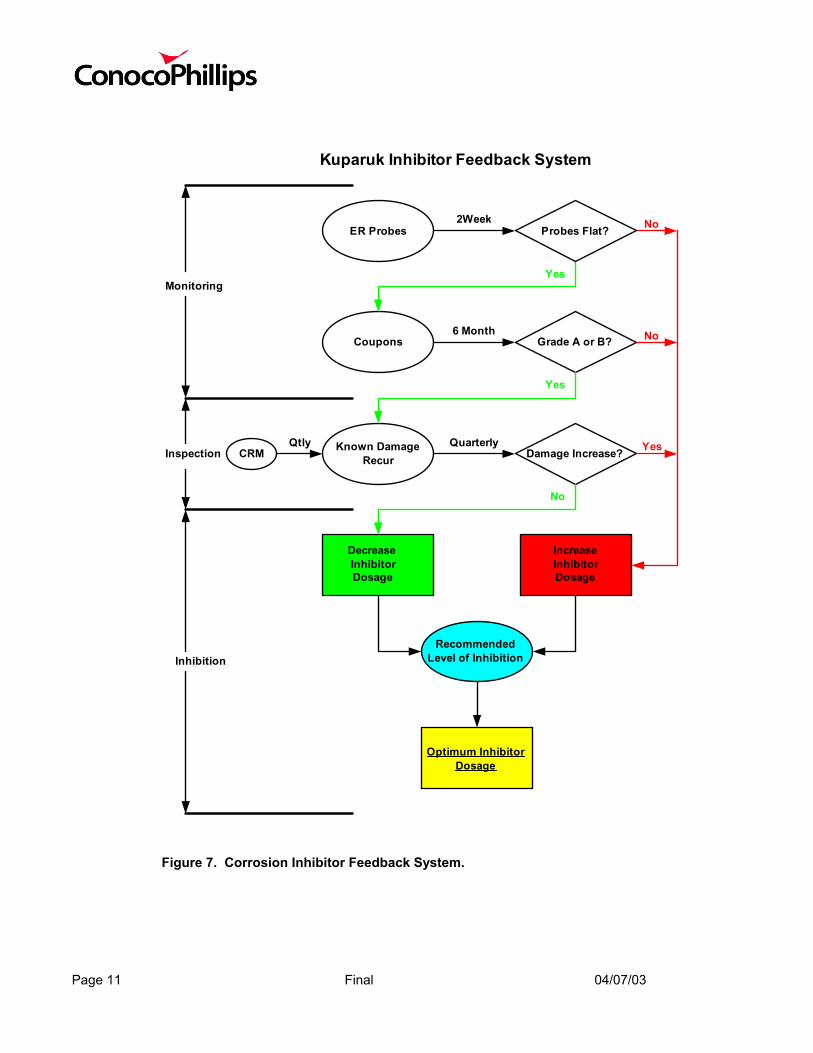
For the Kuparuk field, Figure 6 shows the actual number of gallons of corrosion inhibitor pumped per day, the recommended number of gallons of corrosion inhibitor per day, and the percent difference between the two. The difference fluctuated around zero percent deviation from the recommended amount of corrosion inhibitor; the average deviation for the year was 0.9%. The extreme variation seen in the November data was caused by the production upsets associated with the earthquake prorations. The metrics for the mitigation program are described in the inhibitor feedback flow chart, Figure 7 below, the monitoring data table in Appendix “A”, and discussions above.
Page 10 Final 04/07/03
Known DamageRecur Damage Increase?
Coupons Grade A or B?
Probes Flat?2Week
6 Month
Quarterly
Yes
Yes
Kuparuk Inhibitor Feedback System
CRMQtly
No
Monitoring
Inspection
IncreaseInhibitorDosage
DecreaseInhibitorDosage
RecommendedLevel of Inhibition
Optimum InhibitorDosage
Inhibition
ER Probes Probes Flat?
No
No
Yes
Figure 7. Corrosion Inhibitor Feedback System.
Page 11 Final 04/07/03
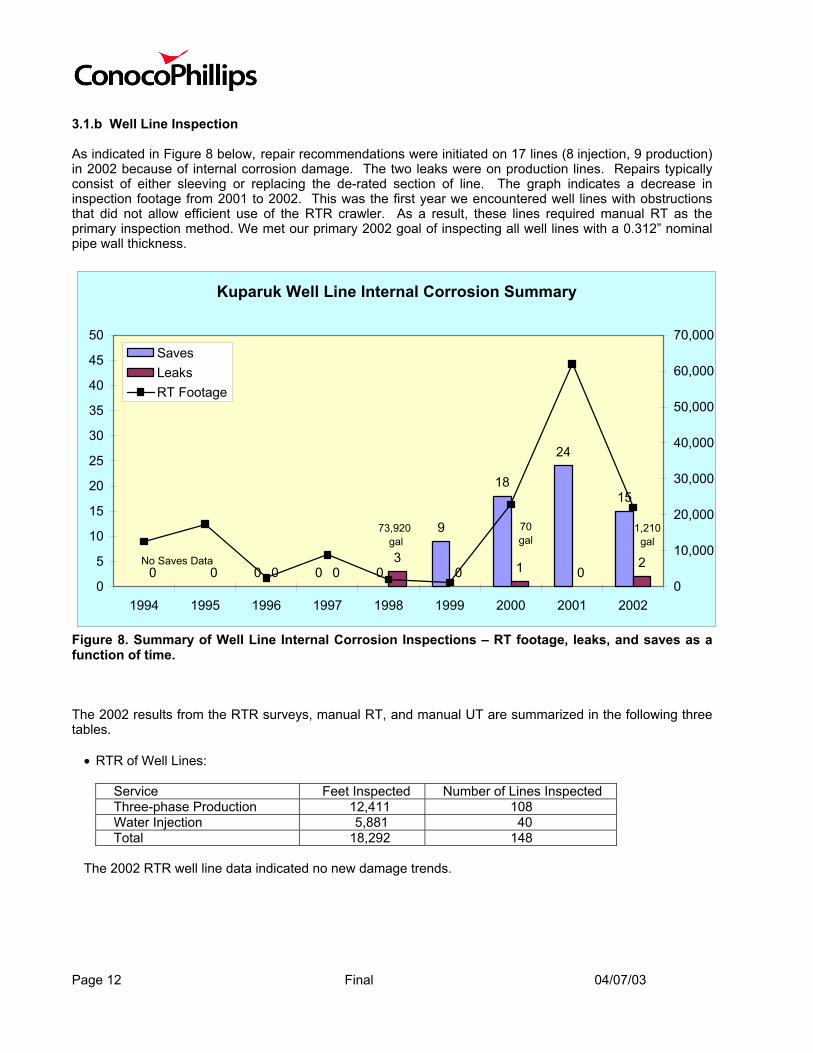
3.1.b Well Line Inspection As indicated in Figure 8 below, repair recommendations were initiated on 17 lines (8 injection, 9 production) in 2002 because of internal corrosion damage. The two leaks were on production lines. Repairs typically consist of either sleeving or replacing the de-rated section of line. The graph indicates a decrease in inspection footage from 2001 to 2002. This was the first year we encountered well lines with obstructions that did not allow efficient use of the RTR crawler. As a result, these lines required manual RT as the primary inspection method. We met our primary 2002 goal of inspecting all well lines with a 0.312” nominal pipe wall thickness.
Kuparuk Well Line Internal Corrosion Summary
0 0 0
9
18
24
15
0 0 0 03
0 1 02
0
5
10
15
20
25
30
35
40
45
50
1994 1995 1996 1997 1998 1999 2000 2001 20020
10,000
20,000
30,000
40,000
50,000
60,000
70,000SavesLeaksRT Footage
73,920 gal
70 gal
No Saves Data
1,210 gal
Figure 8. Summary of Well Line Internal Corrosion Inspections – RT footage, leaks, and saves as a function of time. The 2002 results from the RTR surveys, manual RT, and manual UT are summarized in the following three tables.
• RTR of Well Lines:
Service Feet Inspected Number of Lines Inspected Three-phase Production 12,411 108 Water Injection 5,881 40 Total 18,292 148
The 2002 RTR well line data indicated no new damage trends.
Page 12 Final 04/07/03
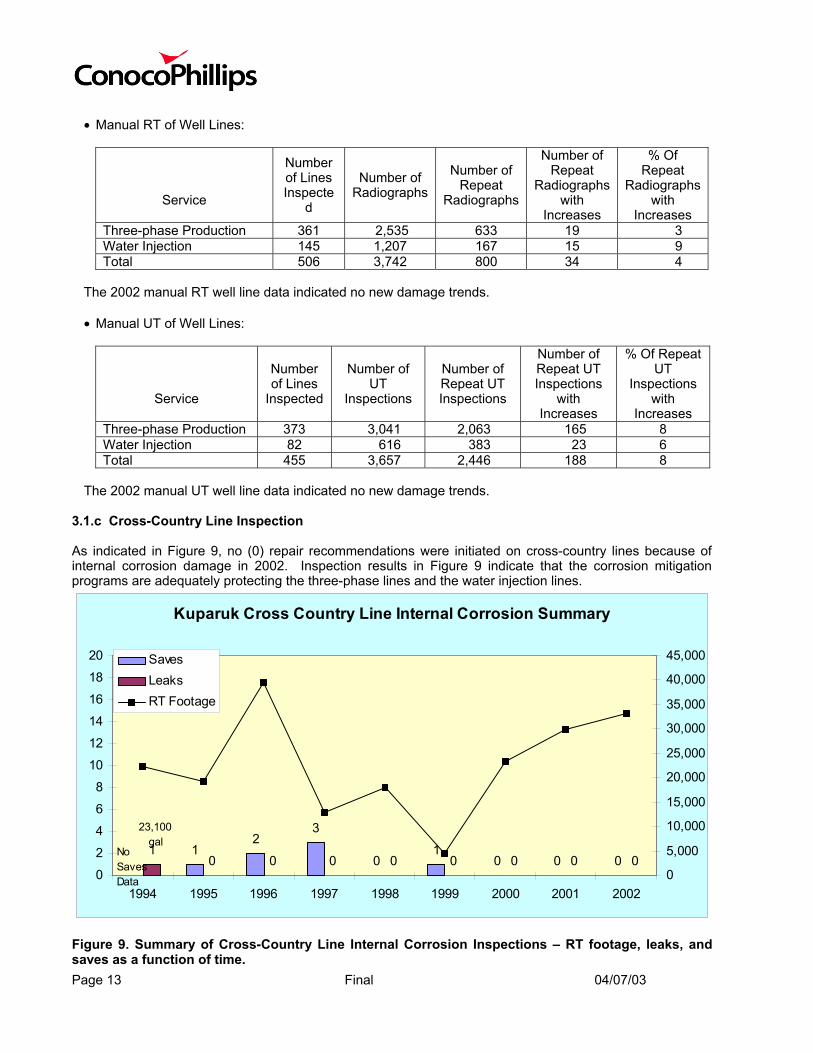
• Manual RT of Well Lines:
Service
Number of Lines Inspecte
d
Number of Radiographs
Number of Repeat
Radiographs
Number of Repeat
Radiographs with
Increases
% Of Repeat
Radiographs with
Increases Three-phase Production 361 2,535 633 19 3 Water Injection 145 1,207 167 15 9 Total 506 3,742 800 34 4
The 2002 manual RT well line data indicated no new damage trends.
• Manual UT of Well Lines:
Service
Number of Lines
Inspected
Number of UT
Inspections
Number of Repeat UT Inspections
Number of Repeat UT Inspections
with Increases
% Of Repeat UT
Inspections with
Increases Three-phase Production 373 3,041 2,063 165 8 Water Injection 82 616 383 23 6 Total 455 3,657 2,446 188 8
The 2002 manual UT well line data indicated no new damage trends.
3.1.c Cross-Country Line Inspection As indicated in Figure 9, no (0) repair recommendations were initiated on cross-country lines because of internal corrosion damage in 2002. Inspection results in Figure 9 indicate that the corrosion mitigation programs are adequately protecting the three-phase lines and the water injection lines.
Kuparuk Cross Country Line Internal Corrosion Summary
12
3
01
0 0 01
0 0 0 0 0 0 0 00
2
4
6
8
10
12
14
16
18
20
1994 1995 1996 1997 1998 1999 2000 2001 20020
5,000
10,000
15,000
20,000
25,000
30,000
35,000
40,000
45,000SavesLeaksRT Footage
23,100gal
No Saves Data
Figure 9. Summary of Cross-Country Line Internal Corrosion Inspections – RT footage, leaks, and saves as a function of time. Page 13 Final 04/07/03
The 2002 results from the RTR surveys, manual RT, and manual UT are summarized in the following three tables:
• RTR of Cross Country (CC) Lines:
Service Feet Inspected Number of Lines Inspected Three-phase Production 14,858 11 Water Injection 15,086 5 Total 29,944 16
The 2002 RTR CC line data indicated no new damage trends • Manual RT of CC Lines:
Service
Number of Lines Inspecte
d
Number of Radiographs
Number of Repeat
Radiographs
Number of Repeat
Radiographs with
Increases
% of Repeat Radiographs
with Increases
Three-phase Production 229 2,869 500 10 2 Water Injection 10 292 14 4 29 Total 239 3,161 514 14 3
The four increases in the water injection system were the first identified in this system to date. These four increases were confined to two of the ten WI lines inspected in 2002 (2EDCWI had three increases and 3GFB2WI had one increase). It should be noted that manual RT is limited to those lines that are less than or equal to 10” outside diameter. For water injection service lines that are too large to effectively RT, Kuparuk relies on spot UT. Smart pigging is not an economical option at this time.
• Manual UT of CC lines:
Service
Number of Lines
Inspected
Number of UT
Inspections
Number of Repeat UT Inspections
Number of Repeat UT Inspections
with Increases
% Of Repeat UT Inspections with Increases
Three-phase Production 105 933 600 18 3 Water Injection 28 112 9 1 11 Total 133 1,045 609 19 2
The one increase in the water injection system was the first identified in this system to date. The 2002 manual UT data supports the RT data (above) by reporting an increase in the 2EDCWI line.
Page 14 Final 04/07/03
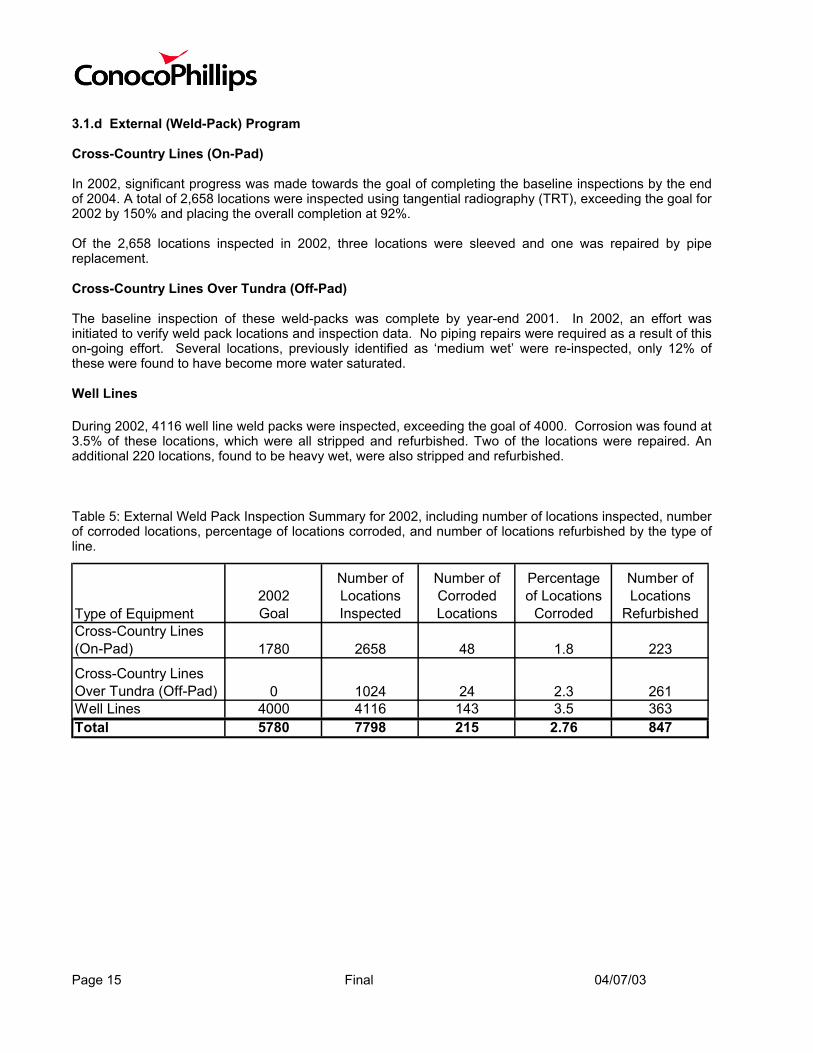
3.1.d External (Weld-Pack) Program Cross-Country Lines (On-Pad) In 2002, significant progress was made towards the goal of completing the baseline inspections by the end of 2004. A total of 2,658 locations were inspected using tangential radiography (TRT), exceeding the goal for 2002 by 150% and placing the overall completion at 92%. Of the 2,658 locations inspected in 2002, three locations were sleeved and one was repaired by pipe replacement. Cross-Country Lines Over Tundra (Off-Pad) The baseline inspection of these weld-packs was complete by year-end 2001. In 2002, an effort was initiated to verify weld pack locations and inspection data. No piping repairs were required as a result of this on-going effort. Several locations, previously identified as ‘medium wet’ were re-inspected, only 12% of these were found to have become more water saturated. Well Lines During 2002, 4116 well line weld packs were inspected, exceeding the goal of 4000. Corrosion was found at 3.5% of these locations, which were all stripped and refurbished. Two of the locations were repaired. An additional 220 locations, found to be heavy wet, were also stripped and refurbished. Table 5: External Weld Pack Inspection Summary for 2002, including number of locations inspected, number of corroded locations, percentage of locations corroded, and number of locations refurbished by the type of line. T Cro (On-Pa Cro Ov W T
ype of Equipment2002 Goal
Number ofLocationsInspected
Number ofCorrodedLocations
Percentageof Locations
Corroded
Number ofLocations
Refurbishedss-Country Lines
d) 1780 2658 48 1.8 223
ss-Country Lineser Tundra (Off-Pad) 0 1024 24 2.3 261ell Lines 4000 4116 143 3.5 363
otal 5780 7798 215 2.76 847
Page 15 Final 04/07/03
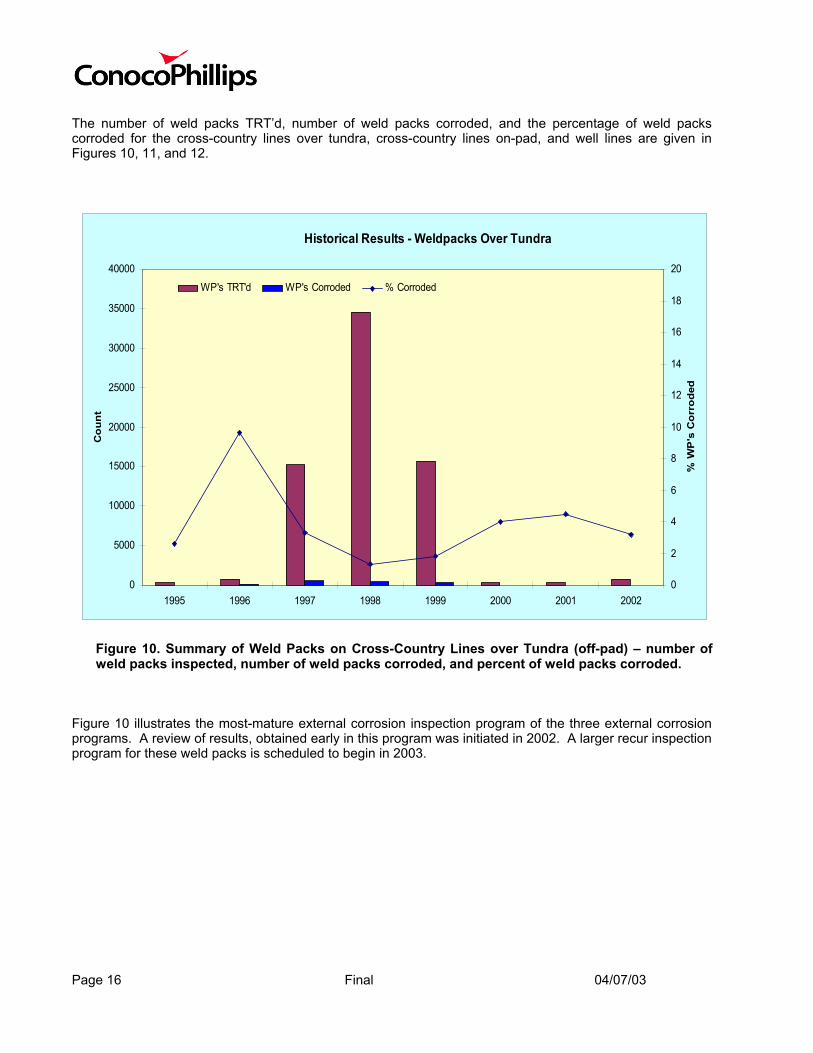
The number of weld packs TRT’d, number of weld packs corroded, and the percentage of weld packs corroded for the cross-country lines over tundra, cross-country lines on-pad, and well lines are given in Figures 10, 11, and 12.
0
5000
10000
15000
20000
25000
30000
35000
40000
1995 1996 1997 1998 1999 2000 2001 2002
Co
unt
0
2
4
6
8
10
12
14
16
18
20
% W
P's
Co
rro
ded
WP's TRT'd WP's Corroded % Corroded
Historical Results - Weldpacks Over Tundra
Figure 10. Summary of Weld Packs on Cross-Country Lines over Tundra (off-pad) – number of weld packs inspected, number of weld packs corroded, and percent of weld packs corroded.
Figure 10 illustrates the most-mature external corrosion inspection program of the three external corrosion programs. A review of results, obtained early in this program was initiated in 2002. A larger recur inspection program for these weld packs is scheduled to begin in 2003.
Page 16 Final 04/07/03
0
500
1000
1500
2000
2500
3000
3500
4000
4500
1995 1996 1997 1998 1999 2000 2001 2002
Coun
t
0
5
10
15
20
25
30
% W
P's
Corr
oded
WP's TRT'd WP's Corroded % Corroded
Historical Results - Weldpacks CC On-Pad
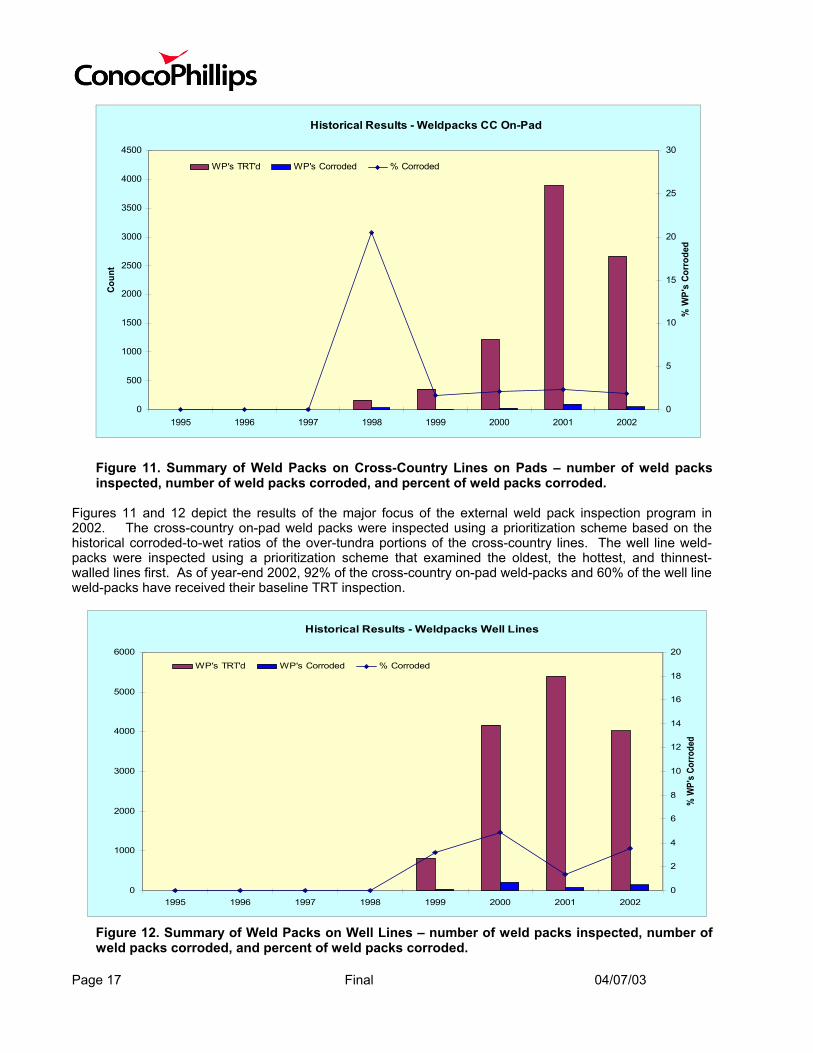
Figure 11. Summary of Weld Packs on Cross-Country Lines on Pads – number of weld packs inspected, number of weld packs corroded, and percent of weld packs corroded.
Figures 11 and 12 depict the results of the major focus of the external weld pack inspection program in 2002. The cross-country on-pad weld packs were inspected using a prioritization scheme based on the historical corroded-to-wet ratios of the over-tundra portions of the cross-country lines. The well line weld-packs were inspected using a prioritization scheme that examined the oldest, the hottest, and thinnest-walled lines first. As of year-end 2002, 92% of the cross-country on-pad weld-packs and 60% of the well line weld-packs have received their baseline TRT inspection.
un
t
Co
0
1000
2000
3000
4000
5000
6000
1995 1996 1997 1998 1999 2000 2001 20020
2
4
6
8
10
12
14
16
18
20
% W
P's
Corro
ded
WP's TRT'd WP's Corroded % Corroded
Historical Results - Weldpacks Well Lines
Figure 12. Summary of Weld Packs on Well Lines – number of weld packs inspected, number of weld packs corroded, and percent of weld packs corroded.
Page 17 Final 04/07/03
CUI Buffer Spike Test: A test of “CUI Buffer Spikes” was initiated on 76 locations. The sodium phosphate salt contained in these spikes dissolves in wet insulation and raises the pH to 10. Prior to installation of these spikes, wet insulation measurements fell within a consistent 6 to 7 pH range. Corrosion of carbon steel is minimized in alkaline conditions.
3.1.e Below Grade Piping Program In 2001, ADEC and ConocoPhillips Alaska, Inc., agreed to consolidate the Below Grade Piping Program report with the Commitment to Corrosion Monitoring Report. This section details the inventory and survey of below grade locations and the results of Specialty Testing. The plans for future inspections are given in section 3.2.e. The Alaska Department of Environmental Conservation (ADEC) regulations under 18 AAC 75.080 apply to the Kuparuk oilfield facilities operated by ConocoPhillips Alaska, Inc. (CPAI). To meet the requirements of 18 AAC 75.080, CPAI submitted their corrosion control program for below-grade piping in early 1998. The program also included a field-wide inventory of all below-grade piping in the Kuparuk field. ADEC approved the program in written correspondence dated October 26, 1998.
3.1.e (1) Inventory and Survey of Below Grade Locations CPAI has 416 locations of below grade “oil” piping in the GKA and Alpine oil fields. Of these locations, one is contained in an utilidor. The remaining locations are cased lines, the majority of which are either road or caribou crossings. In addition to the “oil” piping, PAI has 243 significant below grade locations with lines in other services. Utilidor Line Inspection Status: The one line in an utilidor (below-grade identification number 286) was inspected in 1999 and again in 2002. The 2002 radiographic inspection showed no change in the damage identified in the 1999 inspection. Cased Lines Inspection Status: The annual visual survey of all the cased lines was conducted in 2002. The purpose of the survey was to identify, rectify, and report local conditions (e.g., debris found in casings and culverts, pipe insulation in contact with soil) that require remedial action. Results and Remedial Action: Of all the below-grade oil lines, 43 locations were found to have pipe in direct contact with soil and/or gravel/soil or debris in the casing. All 43 were remediated in 2002.
Page 18 Final 04/07/03
3.1.e (2) Results of Specialty Testing Inspection Status: In 2002, we completed the PTI/TWI inspections on all remaining priority one locations. Both the long-range ultrasonic system technology from The Welding Institute (TWI) and the electromagnetic wave pulse system from Profile Technologies, Inc. (PTI) were used. Testing with PTI was limited to those lines without a significant risk for internal corrosion. PTI is used to find external electromagnetic anomalies such as external corrosion, but cannot find internal corrosion. The TWI technology was applied to lines with a risk for internal corrosion. TWI was also used to evaluate any positive indications detected by PTI, since PTI finds electromagnetic anomalies and is prone to finding false positives. In addition to using TWI’s long-range ultrasonic system technology, CPAI evaluated the torsional wave inspection technique from TWI. CPAI has determined that the torsional wave technique is not superior to the TWI long-range ultrasonic system and CPAI will not use the torsional wave technique unless further improvements are made. Results and Remedial Action: Tables 6 and 7 show the results of the specialty testing performed by PTI and TWI, respectively. Table 6. Results from the PTI inspections by service.
Service
Number of Cased Pipes
Inspected
Inconclusive Results (I)(b)
Number without any Electromagnetic Anomalies (N)
Number of Electromagnetic Anomalies (E)
Number of Significant
Electromagnetic Anomalies (S)
Oil(a) 53 3 30 10 10 Other 81 1 59 15 6 Total 134 4 89 25(c) 16(c)
Notes: (a) Oil service is defined as natural gas liquids (NGL), oil sales, three-phase production, two-phase production (wet oil), Produced Water, and Mixed Water. (b) One gas line inconclusive scheduled for TWI inspection in 2003. One NGL location excavated, with no de-rating damage found. One line was abandoned and one line was inspected with TWI. (c) All “S” and “E” locations were inspected with TWI, except for two pipes with “E” that will be inspected with TWI in 2003. The two pipes with “E” in 2002 that were not inspected by TWI in 2002 were:
- ID #533 (3RWI) was added to the 2003 TWI inspection list. - ID #573 (STP-to-3-SW) was added to the 2003 TWI inspection list.
Page 19 Final 04/07/03
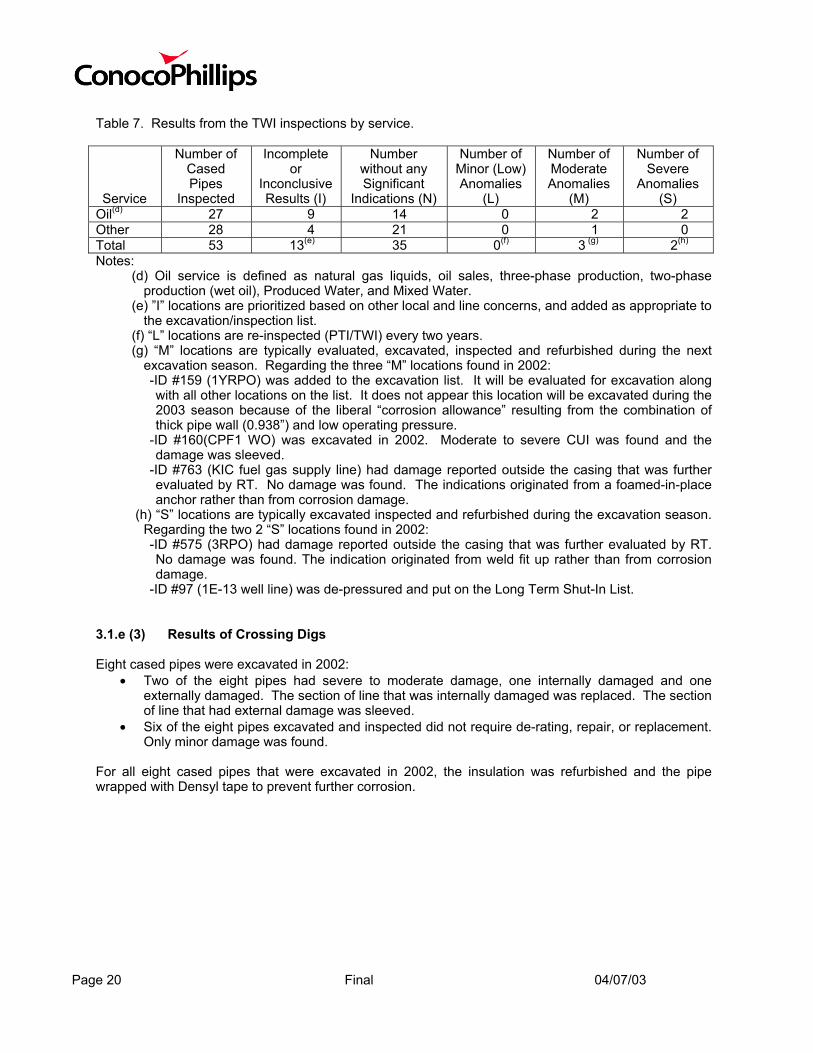
Table 7. Results from the TWI inspections by service.
Service
Number of Cased Pipes
Inspected
Incomplete or
Inconclusive Results (I)
Number without any Significant
Indications (N)
Number of Minor (Low) Anomalies
(L)
Number of Moderate Anomalies
(M)
Number of Severe
Anomalies (S)
Oil(d) 27 9 14 0 2 2 Other 28 4 21 0 1 0 Total 53 13(e) 35 0(f) 3 (g) 2(h)
Notes: (d) Oil service is defined as natural gas liquids, oil sales, three-phase production, two-phase
production (wet oil), Produced Water, and Mixed Water. (e) ”I” locations are prioritized based on other local and line concerns, and added as appropriate to
the excavation/inspection list. (f) “L” locations are re-inspected (PTI/TWI) every two years. (g) “M” locations are typically evaluated, excavated, inspected and refurbished during the next
excavation season. Regarding the three “M” locations found in 2002: -ID #159 (1YRPO) was added to the excavation list. It will be evaluated for excavation along with all other locations on the list. It does not appear this location will be excavated during the 2003 season because of the liberal “corrosion allowance” resulting from the combination of thick pipe wall (0.938”) and low operating pressure.
-ID #160(CPF1 WO) was excavated in 2002. Moderate to severe CUI was found and the damage was sleeved.
-ID #763 (KIC fuel gas supply line) had damage reported outside the casing that was further evaluated by RT. No damage was found. The indications originated from a foamed-in-place anchor rather than from corrosion damage.
(h) “S” locations are typically excavated inspected and refurbished during the excavation season. Regarding the two 2 “S” locations found in 2002: -ID #575 (3RPO) had damage reported outside the casing that was further evaluated by RT. No damage was found. The indication originated from weld fit up rather than from corrosion damage.
-ID #97 (1E-13 well line) was de-pressured and put on the Long Term Shut-In List. 3.1.e (3) Results of Crossing Digs Eight cased pipes were excavated in 2002:
• Two of the eight pipes had severe to moderate damage, one internally damaged and one externally damaged. The section of line that was internally damaged was replaced. The section of line that had external damage was sleeved.
• Six of the eight pipes excavated and inspected did not require de-rating, repair, or replacement. Only minor damage was found.
For all eight cased pipes that were excavated in 2002, the insulation was refurbished and the pipe wrapped with Densyl tape to prevent further corrosion.
Page 20 Final 04/07/03
3.1.f Other Structural Concerns Subsidence: Existing Well Upgrade Program
• In 2002, 45 floors with riser piping supports were installed in well houses at Drill Sites 1A, 1D, 2T, 3F, 3O, and 3Q. Well house floors are supported by the well conductor and provide table riser piping supports.
• In 2002, 44 heat tubes were installed at Drill Sites 1C, 1D, 1R, 2K, 2N, and 2T. Heat tubes are used to keep the ground frozen or to re-freeze the ground where it has been thawed.
New Wells & Producer to Water Injection Well Conversions
• In 2002, nine new wells brought on line had heat tubes, and floors with permanent pipe supports, installed. Three new wells were installed with insulated conductors.
• In 2002, all 13 existing producers converted to water injection wells were upgraded to include heat tubes. Previously, these wells had installed conductor-supported floors.
Wind-Induced Vibration:
• As a result of the DS2X 8" MI line failure that occurred in December 2001, Kuparuk evaluated the need for vibration dampeners on existing pipelines. The line that failed is oriented one-degree outside the design wind direction envelope designated for Kuparuk in 1991. We identified six other lines that fall within the design wind direction envelope but did not have dampeners installed. One of these six lines has had tuned vibration absorbers (TVA’s) installed. The design of TVA’s for two of these six lines is complete and installation is scheduled. The remaining three lines at DS 3N are on the edge of the wind fan; strain gauges will be attached on all three of these lines and the movement of the lines will be monitored.
• An annual inspection of all pipeline vibration dampener (PVD) locations is conducted to verify integrity of the PVD’s. This information is sent to the facilities for corrective action. Typically, corrective action consists of replacement of worn elastomers and reinstallation of PVD weights.
3.1.g Corrosion and Structural-Related Spills/Incidents
• 2A-18 Internal Corrosion Production Well Line Leak – 4/07/02 – The six-inch production line serving well 2A-18 failed because of internal corrosion just above a corrosion access fitting. Total spill volume was 1200 gallons of product (8% oil and 92% produced water) that was confined to the pad. No other locations on this line required repair. Similar locations on 283 other lines were inspected and no repairs were required because of a similar corrosion mechanism.
• 2T-13 Internal Corrosion Production Well Line Leak – 7/25/02 – The six-inch production line serving
well 2T-13 failed because of internal corrosion in a straight-run section of pipe; the failure was caused by under-deposit corrosion in the low-velocity pipeline. Total spill volume was 10 gallons of product (41% oil and 59% produced water) that was confined to pad. All well lines (34) at DS 2T were inspected, with no damage found on 28 well lines. Six well lines showed damage similar to 2T-13, but no de-rating damage was found; one section of another well line, though not de-rated, has also been recommended for replacement.
• No leaks were caused by external corrosion in 2002.
• No leaks were caused by wind-induced vibration in 2002.
• No leaks were caused by subsidence in 2002.
Figures 8 and 9, and Figure A1 in Appendix A show the number of leaks and the volumes of leaks as a function of time. Figure 8 depicts the leaks caused by internal corrosion for the well lines. Figure 9 depicts the leaks caused by internal corrosion for the cross-country lines. Figure A1 shows the leaks caused by external corrosion for cross-country lines, well lines, and below-grade piping locations.
Page 21 Final 04/07/03
3.2 Year 2003 Forecast 3.2.a Monitoring & Mitigation
• Test new corrosion inhibitors in an effort to improve corrosion inhibition technology. Testing of Champion 2002-49a is underway in the DS1R cross-country line.
• Test schmoo-be-gone in the water injection system for DS1E.
• Implement wellhead chemical injection systems for the production well lines at Drill Sites 1A, 1H, 1Y,
and 2T.
• Continue analysis of the CPF2 mixed water and associated systems to determine the cause of higher corrosion rates.
3.2.b Well Line Inspection Complete baseline inspection of all six-inch OD, 0.312” and 0.375” wall-thickness well lines that are six years of age or older. 3.2.c Cross-Country Line Inspection The following enhancements/modifications are planned for 2003:
•
•
RTR ~15,000 feet of cross country lines in 2003 concentrating on water injection lines.
Complete inspection of elevation-change elbows scheduled as part of the Cross-Country Line Turbulent Flow Survey.
3.2.d External (Weld-Pack) Program
Complete evaluation of the initial CUI Buffer Spike test and determine the way forward. Cross-country lines over tundra:
• Complete recur TRT inspections on approximately 1500 CUI locations; use results to help establish a prioritization scheme for future recurring inspection schedule and continue to monitor Denso tape protocol.
• Complete approximately 100 TRT inspections on the Tarn weld pack design established in 1997.
• Complete visual inspections of Medium Wet weld packs in saddles on large diameter sea water lines. Strip, inspect and refurbish these directly without performing TRT inspections because of the lengthy shot times involved.
For cross-country lines on-pad, inspect half of the remaining weld packs without a baseline inspection. This supports the goal of YE 2004 completion.
For well lines, inspect approximately 17% of the remaining weld packs without a baseline inspection. This supports the goal of YE 2005 completion.
Page 22 Final 04/07/03
3.2.e Below Grade Piping Program
• Visually inspect all of the cased lines. The appropriate PAI field department will be notified of any corrective actions that need to be taken early enough to complete clean out and re-inspection during the summer.
• Initiate recurring PTI/TWI inspections of priority-1 cased lines.
• Complete the first-pass inspection of the remaining priority-2 cased lines using visual inspection and
gas sniffing procedures as noted in our ADEC approved procedure. • Complete excavations of five-to-nine lines in road crossing for visual inspection, refurbishment and
repair, as necessary.
• Continue to work with PTI/TWI and ConocoPhillips R&D to refine inspection data reduction and interpretation.
3.2.f Other
• Continue enhancements to the Kuparuk Corrosion Database.
• Continue Alpine piping layout and piping information database development.
• Continue to evaluate, and prioritize subsidence mitigation efforts at the existing drill sites.
Page 23 Final 04/07/03
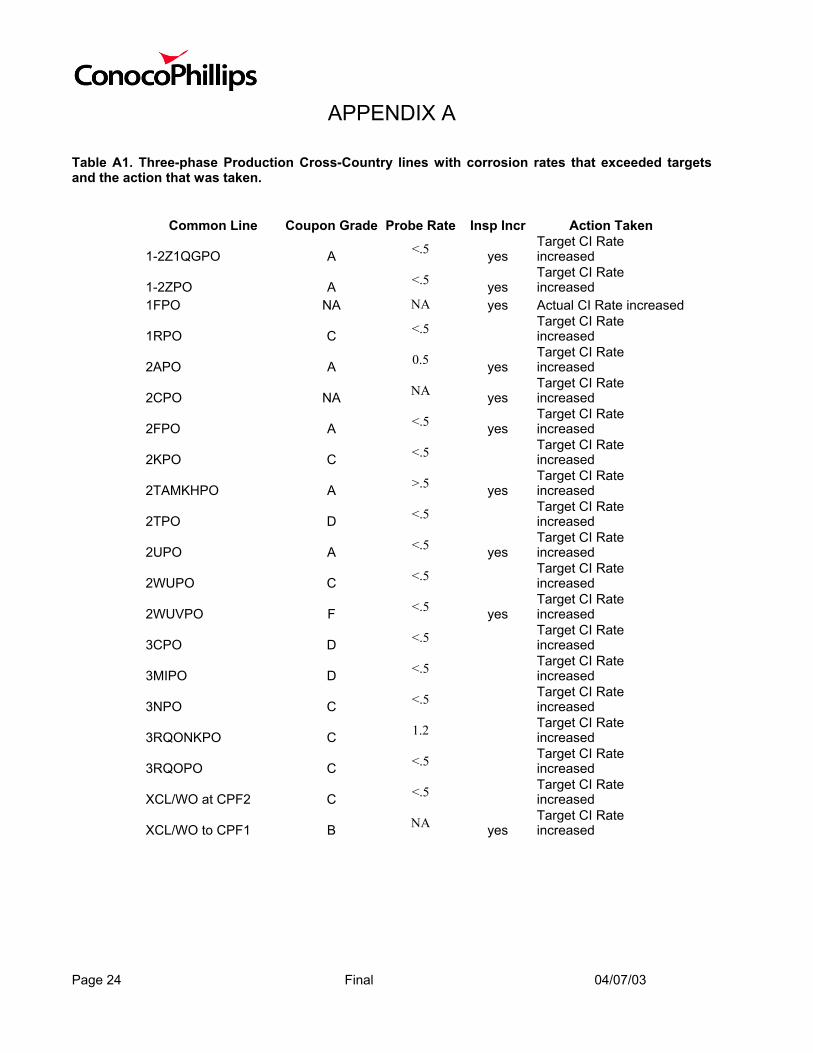
APPENDIX A Table A1. Three-phase Production Cross-Country lines with corrosion rates that exceeded targets and the action that was taken.
Common Line Coupon Grade Probe Rate Insp Incr Action Taken
1-2Z1QGPO A <.5 yes Target CI Rate increased
1-2ZPO A <.5 yes Target CI Rate increased
1FPO NA NA yes Actual CI Rate increased
1RPO C <.5 Target CI Rate increased
2APO A 0.5 yes Target CI Rate increased
2CPO NA NA yes Target CI Rate increased
2FPO A <.5 yes Target CI Rate increased
2KPO C <.5 Target CI Rate increased
2TAMKHPO A >.5 yes Target CI Rate increased
2TPO D <.5 Target CI Rate increased
2UPO A <.5 yes Target CI Rate increased
2WUPO C <.5 Target CI Rate increased
2WUVPO F <.5 yes Target CI Rate increased
3CPO D <.5 Target CI Rate increased
3MIPO D <.5 Target CI Rate increased
3NPO C <.5 Target CI Rate increased
3RQONKPO C 1.2 Target CI Rate increased
3RQOPO C <.5 Target CI Rate increased
XCL/WO at CPF2 C <.5 Target CI Rate increased
XCL/WO to CPF1 B NA yes Target CI Rate increased
Page 24 Final 04/07/03
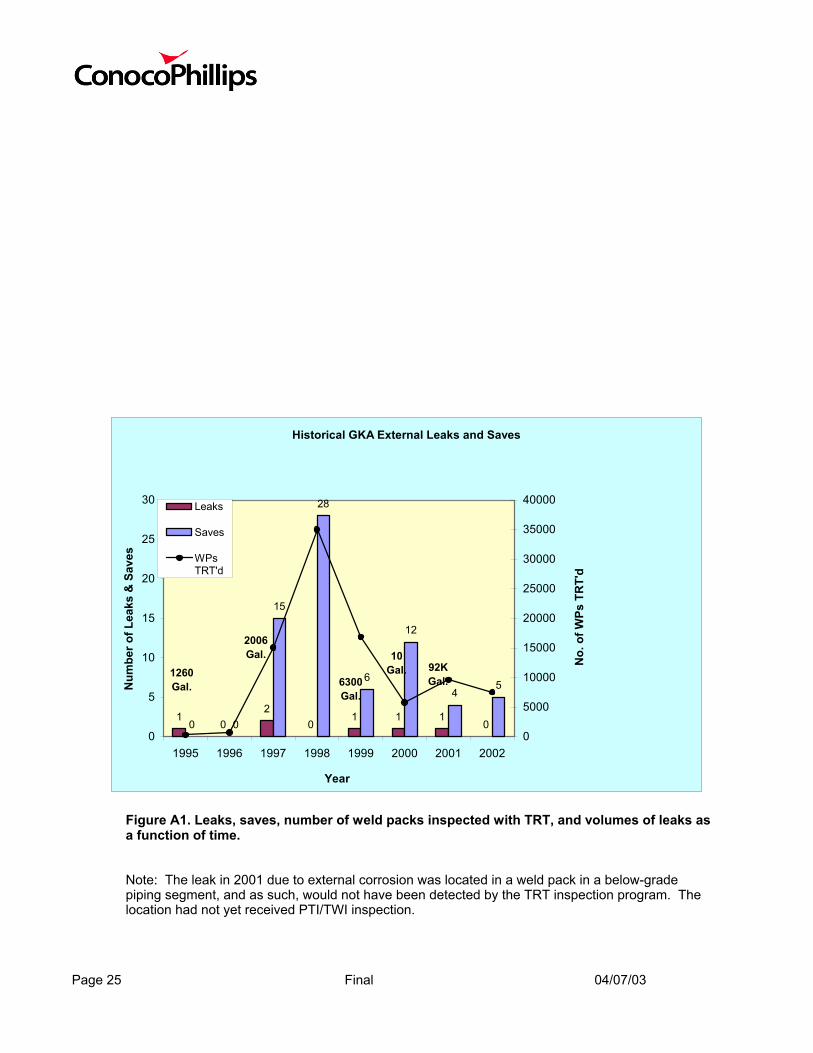
Historical GKA External Leaks and Saves
10
20
1 1 100 0
15
28
6
12
45
0
5
10
15
20
25
30
1995 1996 1997 1998 1999 2000 2001 2002
Year
Num
ber o
f Lea
ks &
Sav
es
0
5000
10000
15000
20000
25000
30000
35000
40000
No.
of W
Ps T
RT'
d
Leaks
Saves
WPsTRT'd
1260Gal.
2006Gal.
6300Gal.
10Gal. 92K
Gal.
Figure A1. Leaks, saves, number of weld packs inspected with TRT, and volumes of leaks as a function of time. Note: The leak in 2001 due to external corrosion was located in a weld pack in a below-grade piping segment, and as such, would not have been detected by the TRT inspection program. The location had not yet received PTI/TWI inspection.
Page 25 Final 04/07/03
Page 26 Final 04/07/03
APPENDIX B Glossary
Equipment Classification:
• Well Line – Pipe from the wellhead to the Drill Site manifold. For production wells, a well line handles the flow from a single well prior to commingling with fluids from other wells and transportation to the Central Processing Facility. For water injection wells, a well line handles the water flow going from a common manifold to a single wellhead.
• Cross-Country Line – Pipe from the Drill Site manifold to the Central Processing Facility (CPF). • Below-Grade Location – That portion of a single pipeline, which crosses underneath a road or
other earthen feature at a single location. The linear extent of the location consists of the length of pipeline between casing ends.
Service Definitions:
• Three-phase Production – Basic reservoir fluids (oil, water, and gas) produced from down hole through to the CPF. Typically sees changes in temperature and pressure only from reservoir changes and are essentially un-separated.
• Seawater (SW) – Water from the Beaufort Sea that has been treated at the Seawater Treatment Plant (STP). Note that seawater treatment at the Kuparuk STP consists of filtration, oxygen stripping using produced gas, and biociding.
• Produced Water (PW) – The water separated at the CPF from three-phase production. • Mixed Water (MW) – Produced water and seawater that have been commingled. • Gas – Generic term for the different gas systems that transport dry (no liquids) gas between
facilities. Includes fuel gas, artificial lift gas, and miscible Injectant. • Produced Oil – The liquid hydrocarbon separated at the CPF from three-phase production.
Inspection Terminology:
• CRM – Corrosion rate monitoring. • UT- Ultrasonic testing • RT – Radiographic testing • RTR – Real time radiographic testing • TRT – Tangential radiographic testing • PTI – Profile Technologies Inc. (Electro magnetic inspection) • TWI – The Welding Institute (Long range UT)\ • KDR – Known damage recur inspection
Page 27 Final 04/07/03