Embed Size (px)
Citation preview
Math 1: Algebra, Geometry and Statistics
Ms. Sheppard-Brick 617.596.4133 http://lps.lexingtonma.org/Page/2434
Name: Date:
1
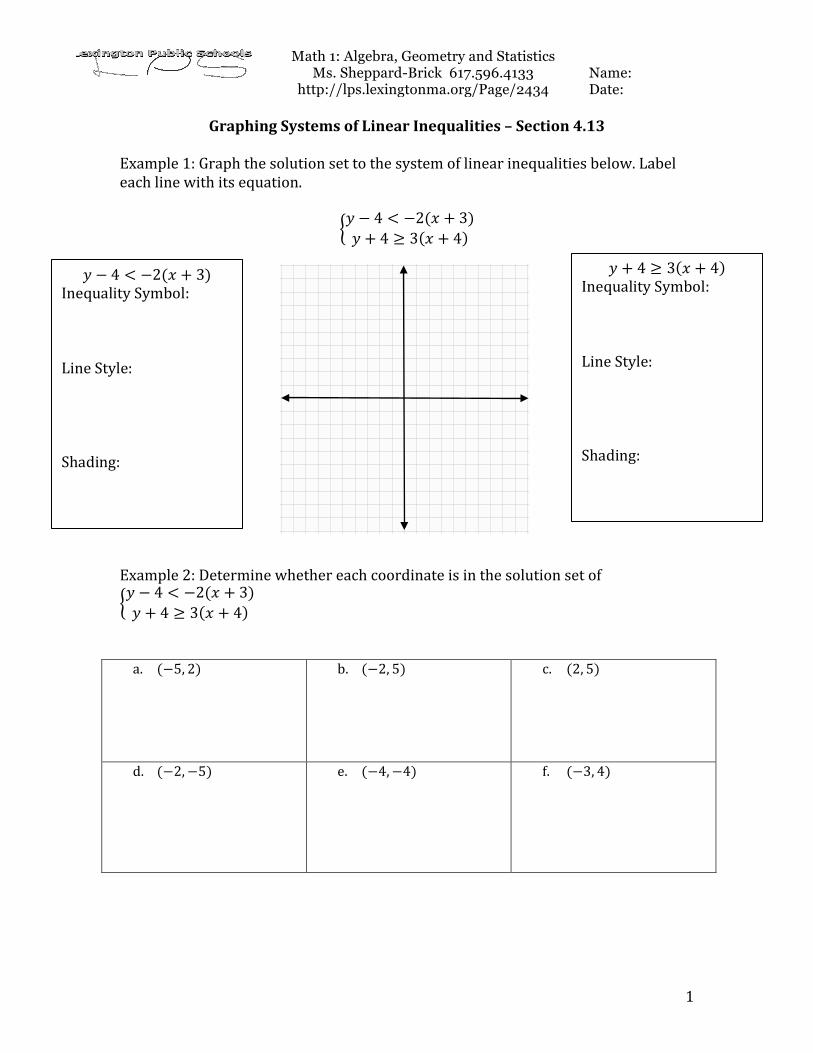
Graphing Systems of Linear Inequalities – Section 4.13 Example 1: Graph the solution set to the system of linear inequalities below. Label each line with its equation.
𝑦 − 4 < −2(𝑥 + 3)𝑦 + 4 ≥ 3 𝑥 + 4
Example 2: Determine whether each coordinate is in the solution set of 𝑦 − 4 < −2(𝑥 + 3)𝑦 + 4 ≥ 3 𝑥 + 4
a. (−5, 2) b. (−2, 5) c. (2, 5)
d. (−2,−5) e. (−4,−4) f. (−3, 4)
𝑦 + 4 ≥ 3(𝑥 + 4) Inequality Symbol: Line Style: Shading:
𝑦 − 4 < −2(𝑥 + 3) Inequality Symbol: Line Style: Shading:
Math 1: Algebra, Geometry and Statistics
Ms. Sheppard-Brick 617.596.4133 http://lps.lexingtonma.org/Page/2434
Name: Date:
2
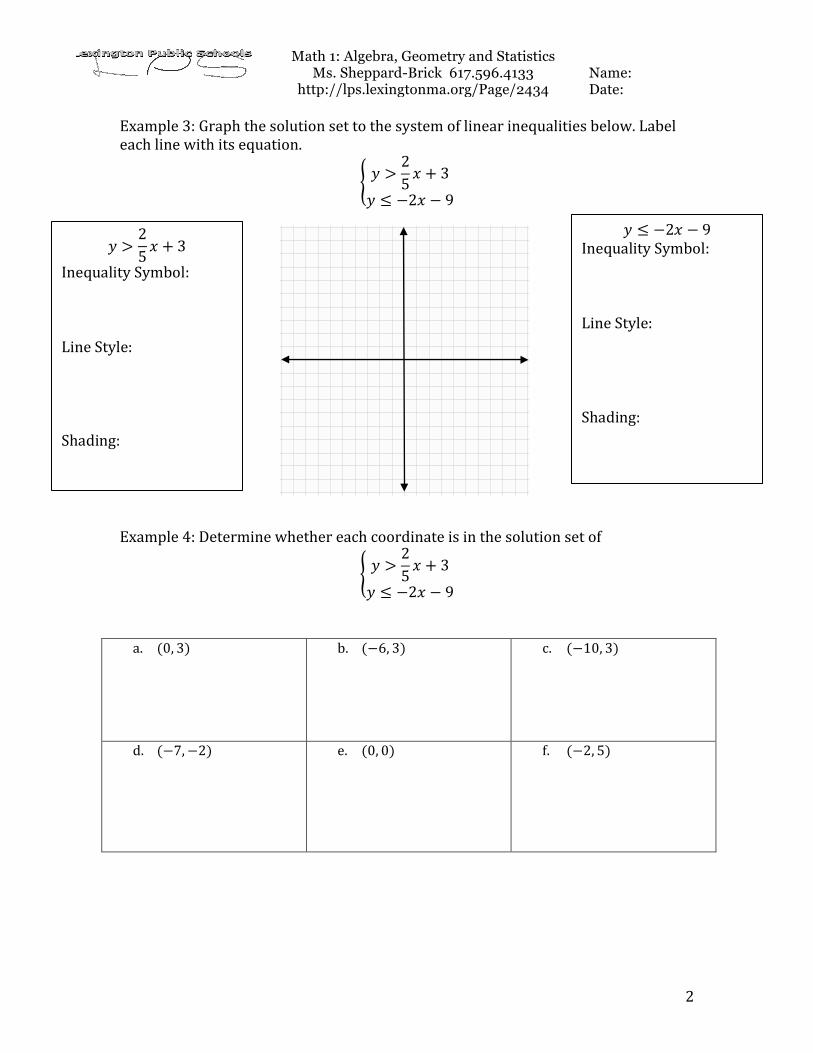
Example 3: Graph the solution set to the system of linear inequalities below. Label each line with its equation.
𝑦 >25𝑥 + 3
𝑦 ≤ −2𝑥 − 9
Example 4: Determine whether each coordinate is in the solution set of
𝑦 >25𝑥 + 3
𝑦 ≤ −2𝑥 − 9
a. (0, 3) b. (−6, 3) c. (−10, 3)
d. (−7,−2) e. (0, 0) f. (−2, 5)
𝑦 ≤ −2𝑥 − 9 Inequality Symbol: Line Style: Shading:
𝑦 >25 𝑥 + 3
Inequality Symbol: Line Style: Shading:
Math 1: Algebra, Geometry and Statistics
Ms. Sheppard-Brick 617.596.4133 http://lps.lexingtonma.org/Page/2434
Name: Date:
3
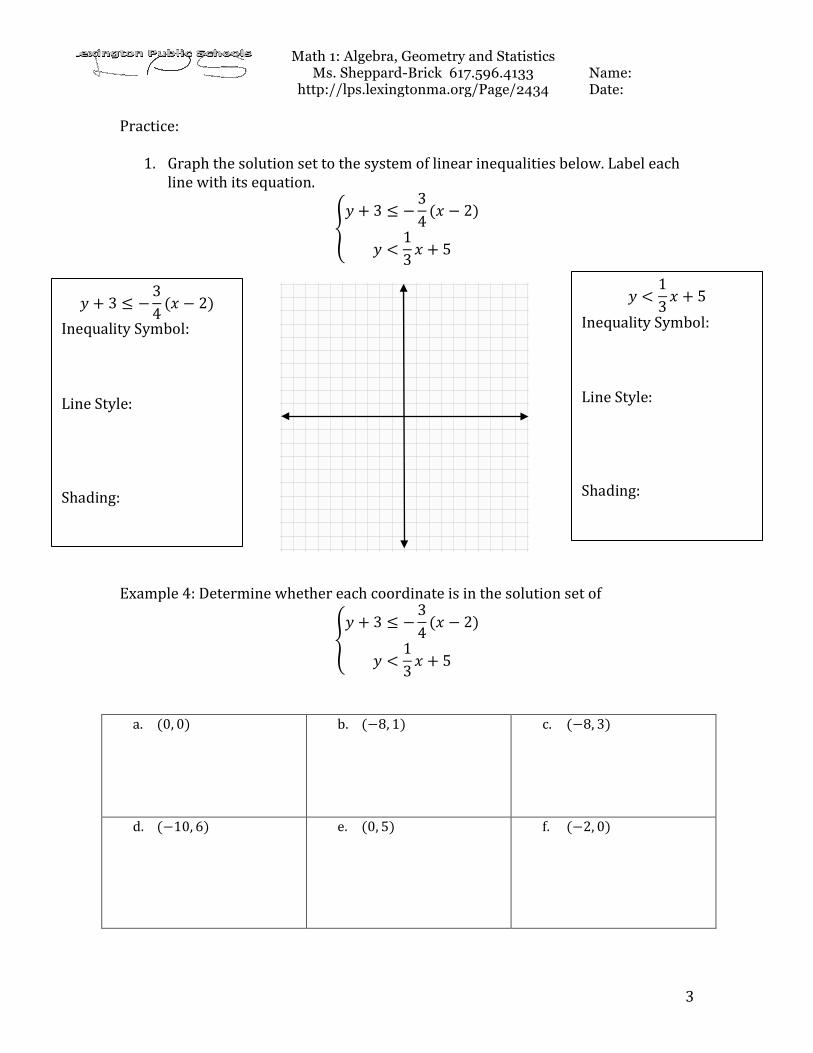
Practice:
1. Graph the solution set to the system of linear inequalities below. Label each line with its equation.
𝑦 + 3 ≤ −34(𝑥 − 2)
𝑦 <13 𝑥 + 5
Example 4: Determine whether each coordinate is in the solution set of
𝑦 + 3 ≤ −34(𝑥 − 2)
𝑦 <13 𝑥 + 5
a. (0, 0) b. (−8, 1) c. (−8, 3)
d. (−10, 6) e. (0, 5) f. (−2, 0)
𝑦 <13 𝑥 + 5
Inequality Symbol: Line Style: Shading:
𝑦 + 3 ≤ −34 (𝑥 − 2)
Inequality Symbol: Line Style: Shading: