Embed Size (px)
Citation preview

Graphical User Interface for Software
Defined Network Cloud Simulator
By
Xiaohui Ji
Under the supervision of
Professor Rajkumar Buyya
and
Dr. Amir Vahid Dastjerdi
A minor project thesis submitted in partial
fulfilment of the requirement for the degree of
Master of Information Technology
November 2014
Cloud Computing and Distributed Systems (CLOUDS) Laboratory
Department of Computing and Information Systems
The University of Melbourne, Australia

ii
Graphical user interface development for software defined
network simulation in cloud environments
Xiaohui Ji
Supervisors: Prof. Rajkumar Buyya and Dr. Amir Vahid Dastjerdi
ABSTRACT
With the prosperity of cloud computing, various simulation tools, such as CloudSim, are
developed to experiment ever-changing user requirement and system supply before deploying a
system into real-world scenarios. However, there is no existing cloud simulation tool to support
Software Defined Network (SDN), which provides programmable networking paradigm. To
implement SDN into the cloud simulation environment, this project develops a visualised
extension based on the CloudSim framework that supports SDN simulation in cloud
environment and provides graphical user interface for networking topology management.

iii
Declaration
I certify that
this thesis does not incorporate without acknowledgement any
material previously submitted for a degree or diploma in any
university; and that to the best of my knowledge and belief it does
not contain any material previously published or written by another
person where due reference is not made in the text,
where necessary I have received clearance for this research from the
University's Ethics Committee and have submitted all required data
to the Department,
the thesis is less than 6,000 words in length excluding text in images,
table, bibliographies and appendices.
Signature___________________
Date___________________

iv
Acknowledgement
I would like to express my deep gratitude towards my supervisors,
Professor Rajkumar Buyya and Dr. Amir Vahid Dastjerdi. Prof. Buyya provides an
opportunity to work on this project and inspiration and motivation to pursue an
academic career. In addition, Dr. Vahid provides me the full guidance and
encouragement during the work. His committed supervision with helpful
feedbacks, sparkling ideas and technological advices encourages and leads me to
complete this project successfully.
I thank Dr. Rodrigo N. Calheiros, for giving good advice, which inspired
me a lot during software development. I also thank to Mr Jongmin Son, he
patiently and continually explained source code and concepts to me.
In addition, I thank to my partner Dr. Yan Xu, for proofreading of this
thesis with her sharp insight toward the technology.
Finally, I would like to appreciate all my friends and family for their
unconditional support. They always listen to me whenever I suffer from
disappointment and difficulties and encourage me to complete the degree.
Xiaohui Ji
Melbourne, Australia
November 2014

v
Table of Contents
1 INTRODUCTION ............................................................................................................................. 1
1.1 Motivation................................................................................................................................ 1
1.2 Software Target ....................................................................................................................... 2
2 RELATED WORK ........................................................................................................................... 3
2.1 Software Defined Network ...................................................................................................... 4
2.2 Cloud-based Simulation Tools................................................................................................. 6
2.3 Java Swing ............................................................................................................................... 7
3 DEVELOPMENT OF GUI ................................................................................................................ 8
3.1 GUI Design .............................................................................................................................. 8
3.1.1 Architecture Design ......................................................................................................... 8
3.1.2 Java Graph Visualisation Library Design ........................................................................ 9
3.1.3 Framework Layer Design ............................................................................................... 10
3.1.4 Business Layer Design ................................................................................................... 11
3.1.5 Interface Layer Design ................................................................................................... 12
3.2 Implementation ...................................................................................................................... 13
3.2.1 GUI Project IDE and Structure ...................................................................................... 13
3.2.2 The implementation of Graph Visualisation Library ..................................................... 14
3.2.3 Implementation of Canvas Mode ................................................................................... 14
3.2.4 Execution Mode ............................................................................................................. 17
4 PERFORMANCE EVALUATION ............................................................................................... 18
4.1 Case study 1 - creating network topology ............................................................................. 18
4.2 Case study 2 - Executing SDN Simulation ............................................................................ 21
5 CONCLUSION AND FUTURE DIRECTIONS................................................................................... 21
REFERENCE LIST ................................................................................................................................. 23

vi
List of Tables
Table 1. Attributes of physical network topology. ................................................................................ 18
Table 2. Attributes of virtual network topology.................................................................................... 19
Table 3. Configuration files. ................................................................................................................. 21

vii
List of Figures
Figure 1. SDN architecture. .................................................................................................................... 4
Figure 2. Graphical User Interface architecture. .................................................................................... 9
Figure 3. Class diagram of graph visualisation library. ........................................................................ 10
Figure 4. Software sequence diagram. .................................................................................................. 12
Figure 5. GUI project structure. ............................................................................................................ 13
Figure 6. Canvas and Execution mode. ................................................................................................. 14
Figure 7. GUI toolbar. ........................................................................................................................... 15
Figure 8. Add Physical Node dialog. .................................................................................................... 15
Figure 9. Add Physical Edge dialog...................................................................................................... 16
Figure 10. Saving and loading network topology. ................................................................................ 16
Figure 11. Configuration file selection. ................................................................................................ 17
Figure 12. SDN simulation process. ..................................................................................................... 18
Figure 13. Creating network topologies. ............................................................................................... 20
Figure 14. Physical network topology file. ........................................................................................... 20
Figure 15. Virtual network topology file. ............................................................................................. 20
Figure 16. The simulation result. .......................................................................................................... 21

1
1 INTRODUCTION
Cloud computing is deemed to represent the next-generation computing paradigm in
addition to cluster computing and grid computing. It is treated as 5th utility following after
water, electricity, gas, and telephony [1], which works like commodity, and delivers
computing as service based on pay-as-you-go schema. By using cloud computing, users can
be provided with a variety of services without considering technical issues such as hardware
construction, software installation, system maintenance and management. These services can
be tailored elastically and dynamically at different levels, such as Infrastructure as a Service
(IaaS), Platform as a Service (PaaS), and Software as a Service (SaaS), to fulfil varied
requirements. In order to implement cloud computing, virtualization technology is applied to
dynamically partition every single server into multiple isolated virtual machines, resulting in
increased hardware utilization, minimised cost and reduced energy consumption.
However, due to the diverse criteria of a system and the ever-changing user requirements,
the performance assessment of resource allocation policies and application scheduling
algorithms under cloud environments is often challenging and complicated [2]. In this case,
various simulation tools are developed to conduct performance assessment in a cost effective,
efficient, and elastic way. CloudSim is such simulation platform which provides powerful
and comprehensive components and features to model cloud, virtual machine (VM), and
cloud market [2]. There are many extensions developed on the top of the CloudSim
framework to fulfil diverse simulation tasks. For example, CloudAnalyst is a visualised
extension developed based on CloudSim. It provides graphical user interface (GUI), real time
analysis, and dynamic configuration, which largely simplifies the simulation procedure and
performance evaluation process [3]. CloudAnalyst also enables the users who have no
experience on programming to perform simulation tasks.
1.1 Motivation
Currently, with the best of our knowledge, there is no simulation tool for cloud
infrastructure, which has the functionalities to support Software Defined Networking (SDN).
It is thus desirable to develop a visualized extension based on the CloudSim framework that
supports SDN simulation and provides graphical user interface for networking design. As a
virtualised and programmable network, SDN represents the next generation networking
management paradigm [4]. In traditional network, the forwarding device is tightly coupled

2
with controller by providing limited management interface, which leads to manual, complex
and time-consuming reconfiguration. While SDN separates the software controller from
forwarding devices, which provides unified programmable interface for different types of
network devices such as switches and routers. By using this interface, the network engineer
can develop applications to achieve automatic reconfiguration. SDN has been widely used in
many fields. Especially in cloud computing, SDN provides effective methodology for
scalable, efficient, and virtualised network resource management. By implementing SDN,
virtual machines can automatically conduct management for updating, reconfiguration, and
failure recovery [5]. Particularly, it is helpful for energy conservation by reducing traffic
switches consumption and virtual machine (VM) migration [4].
1.2 Software Target
With the motivation, the following targets come up that make us to begin this project.
Visualised network topology generator
Can we tailor a graphical library or framework dedicated to simplify cloud-
based, including SDN, simulation process?
Can we use graphical graph editor to manage network topology without typing
into text editor directly?
Can we use unified format to improve reusability of network topology?
Simple and unified graphical user interface (GUI)
Can we provide user friendly graphical interface?
Can we simplify simulation execution by using drag-and-drop mode?
This project aims to develop a visualised extension built on the top of the CloudSim
framework that supports the SDN simulation in cloud environment and provides the graphical
user interface for networking topology design. Particularly, this development makes
following contributions.
Integrating the visualized SDN features into cloud simulation platform.
Building a GUI which simplifies and accelerates the process of physical and virtual
network topology design especially for people with no knowledge of programming.
Provisioning convenient graphical editor to create, modify, save and load network
topology.
Reducing the learning cost and facilitating the toolkit popularity.

3
2 RELATED WORK
As a promising next-generation computing paradigm, Cloud computing has been widely
accepted by research communities, governments and industries. Many mature cloud
computing products and platforms built including Amazon EC2, Google AppEngine,
Microsoft Azure and Manjrasoft Aneka [6]. It aims to provide cost friendly, elastic, scaling
and pay-on-demand computing resources for fulfilling various types of user requirements.
That is, the computing resources, such as compute, storage, and networking, are to be
delivered and paid on the basis of usage. Although the idea of Cloud computing has been
widely recognized, it is still an evolving technology. One major concern or gap that needs to
be addressed is effective and scalable network resource management [7].
There are several challenging issues existing in the virtual networking management. The
first issue is how to handle the network dynamicity. Typical cloud networking architectures
provide a "one size fit all" paradigm for meeting the diverse requirements of a cloud.
However, there is an increasing requirement of the cloud users to specify their own
bandwidths for improving the user flexibility. Besides, the change of the network
management requirement may also be caused by dynamic network configuration, the design
of network topology, different forwarding protocols, and multiple security policies. To deal
with these changing requirements, the development of a programmable network paradigm is
highly required. The second issue is how to solve the connectivity problem between data
centres. It is necessary when an enterprise user needs to work with multiple cloud providers.
To solve this problem, the network paradigm should orchestrate the coexistence among
several cloud and network providers. The third issue is how to deal with the limitations of the
existing networking protocols. The widely used protocols, including Spanning Tree Protocol
(STP), Shortest-Path Bridging (SPB), Routing Information Protocol (RIP), Border Gateway
Protocol (BGP), Open Shortest Path First (OSPF), and Intermediate System to Intermediate
System (IS-IS) are not scalable enough for dynamic network management and Virtual
Machine (VM) migration among multiple cloud networks. Thus, a network paradigm with
high scalability and programmability is essentially needed.
To address the challenging issues in the virtual networking management, Software
Defined Network (SDN), as an emerging network paradigm and promising solution that
enables networks programmable, easily partitionable, and virtualisable is introduced [8].

4
2.1 Software Defined Network
The concept of Software Defined Network (SDN) has been introduced since 1996. It is
driven by the need to provide user programmable networking management [9]. As defined by
Open Networking Foundation, SDN is "is a networking architecture where the control and
data planes are decoupled, network intelligence and state are logically centralised, and the
underlying network infrastructure is abstracted from the applications" [8]. The SDN
architecture involves a control plane, a data plane, and a networking operating system (NOS),
as shown in Figure 1.
Data plane
Link, switching,
Forwarding, routing
Application
Programming
Interface (API)
OS
Network Device
API
Control plane
Network topology ACLs,
Forwarding and routing
QoS, link management
SDN stack
Application
Figure 1. SDN architecture.
Different from traditional networks, the control plane in SDN is moved out of the
individual network device and into the separate and centralised controller, allowing the
network manager to implement control changes by simply changing the control program [10].
This programmable control plane is the most important aspect of SDN. It improves the
scalability and flexibility of managing the service user requirements, optimises the routing
policies, and enables reactively and proactively control of flow entries.
The main characteristics of SDN include centralisation of the control plane,
programmability of the control plane, and standardisation of application programming
interface (API) [9] [10]. The centralisation of the control plane allows a global view of the
entire network from a single logical point. The control can be dynamically adjusted based on
state changes, which is much faster than a distributed control. The programmability of the
control plane allows the network to be virtually divided into several sub-networks. The sub-
networks share the same hardware infrastructure but implement different policies. The

5
programmability also enables flow-based control, which significantly reduces the traffic
between the control plane and data plane. SDN turns the vendor-specific API into
standardised API to enable common network services. SDN contains three types of APIs,
which are Southbound API, northbound API, and east-west API [11]. Southbound API is the
most important API that communicates between the control plane and data plane. Developed
by Open Networking Foundation, OpenFlow is one of the most popular and widely applied
southbound APIs [8]. It is initially applied into campus network by providing programmable
network protocol in different switches and routers [12]. Northbound API is used to
communicate between the control plane and application layer. East-west API allows
communications between neighbouring control planes.
SDN has shown some advantages in network management, network heterogeneity, and
cost control management [13]. Regarding network management, currently, the number of
networking devices are growing fast and the networking device itself is getting more
complicated by integrating more functionality. SDN greatly simplifies the network design,
operation, and network devices by using centralised control. Unlike traditional networking
management tools such Simple Network Management Protocol (SNMP), SDN applies
policy-based management strategy to manage networking devices in an intelligent, dynamic,
and flexible manner. In terms of network heterogeneity, SDN aims to build a unified and
heterogeneous network strategy, which allows network products from multiple venders to
communicate and co-work with each other. In this case, users or customers will not have to
be tightly bound to only one vender. With regard to the cost control management, SDN can
reduce the development cost and the network operating cost. By using SDN, complicated
control softwares can be extracted from the control plane. Venders will then get free from the
development and maintenance of a huge number of code workings. Since SDN allows
switching services among multiple venders, it also largely reduces the operating cost.
As a widely accepted network paradigm, SDN can be applied into various fields,
including enterprise networks, infrastructure-based wireless access networks, optical
networks, home and small business networks, and especially for data centre [4]. As an
underlying infrastructure for cloud computing, data centre is developing at a high speed.
However, to reconfigure a network in data centre is time-consuming, which poses a
challenging issue at networking management in data centre [13]. The networking
management should have ability to respond quickly to changing requirements, to recovery
from catastrophic events, and to reduce time consumption for VM configuration. SDN is

6
believed having such ability to address this issue by providing programmable, scalable, and
intelligent network management. For large-scale data centres, energy consumption is another
concern. SDN is able to find the minimum power network subset which will meet the
network routing requirements and turns off the unnecessary switches [4].
In order to implement SDN for improving networking management, especially under
cloud environment, it is necessary to set up and to tear down experimental platform quickly.
To achieve this, simulation is one of the best choices.
2.2 Cloud-based Simulation Tools
As aforementioned, the utilisation of simulation tools is a reasonable solution for
conducting large-scale, repetitive, dynamical evolving and expensive experiment [2] [14]. In
regard to cloud computing, experiments conducted on real infrastructure are not only
extremely expensive due to a huge amount of investment has to be made in purchasing
hardware, renting room, building and maintaining data centre, but also time consuming as a
lot of time will be used to configure experimental environment and wait for results. In this
case, it is desirable to have an efficient, productive, easy-to-deploy, and extensible simulation
tool for conducting cloud-based experiments. In this paper, CloudSim, as an outstanding
cloud-based simulation tool is used.
Traditional simulators, such as GridSim, SimGrid, OptorSim and GangSim, have been
used for many years for grid modelling and simulating platforms [14]. However, none of
them fully support cloud computing because cloud is built on the top of virtualisation
technology and pay-as-service, including Software as a Service (SaaS), Platform as a Service
(PaaS) and Infrastructure as a Service (IaaS). Developed for cloud computing simulation,
CloudSim provides an open-source, generalised, and extensible simulation framework [15].
Experiments based on CloudSim will concentrate on model building, algorithm design, and
data analysis rather than deployment and configuration.
In addition to CloudSim, there are some other existing works should be mentioned,
including Mininet [16], Simulation Program for Elastic Computing Infrastructure (SPECI)
[17] and iCanCloud [18].
Mininet provides a powerful interactive Command Line Interface (CLI) for developing a
virtual network with hosts, links, and switches on a single machine. The single machine can
be VM in cloud environment or native laptop or PC. Mininet is compatible with Linux and

7
convenient to migrate to real hardware. It also supports OpenFlow and SDN, by which we
can implement software defined switches.
SPECI is a cloud-based simulation platform characterised by providing predictive
modelling for large-scale and hierarchical data centre. Cloud services hosted in this type of
data centre are connected by the subscription network. Currently, the newest version of
SPECI is SPECI-2.
iCanCloud is another cloud-based simulation platform based on OMNET and MPI and
written by C++. It supports both graphical modelling and command-line modelling.
iCanCloud is devoted to "predicting the trade-off between cost and performance" of
applications in specific hardware. In this case, users will be given reasonable output which
helps for decision making in purchasing cloud services. By using the global hypervisor
function that provided by iCanCloud, users can customise brokering policies. In addition,
iCanCloud also supports modelling Amazon instances.
With CloudSim, SDN features could be enabled under cloud simulation environment. To
this end, it is essential to integrate SDN into CloudSim by which programmable network
management strategies could be implemented. To facilitate SDN implementation, graphical
user interface (GUI) should be orchestrated for SDN at the same time. GUI not only provides
ability to create and update visualised physical and virtual network topology, but also
establishes general and user friendly operation and execution environment. The main
objective of this project is to orchestrate specific GUI for visualising and accelerating SDN
simulation under cloud environment.
2.3 Java Swing
This project uses Java Swing as the GUI development framework. Swing is part of
Oracle's Java Foundation Classes (JFC), which provides a general GUI for Java programs
[20]. Compared with its predecessor Abstract Window Toolkit (AWT), Swing aims to
provide a more advanced set of GUI components. In addition to common components such as
buttons, check boxes and labels, Swing provides several advanced components such as
tabbed panel, scroll panes, trees, tables, and lists. Another new feature about Swing is its
ability to override the native host operating system (OS)'s GUI controls for displaying itself.
Swing 'paints' its controls using the Java 2D APIs, rather than calling a native user interface
toolkit. More importantly, Swing is a lightweight, platform-independent, and customizable
framework [21]. With this Swing, the developer can customise domain-specific components

8
by overriding the default implementations. Equipped with these advanced features, Swing is
selected to tailor and implement SDN-specific or cloud-specific graphical components in this
project.
3 DEVELOPMENT OF GUI
Based on the concepts of SDN, CloudSim, and Swing, this project develops a GUI for
visualising SDN in order to facilitate the networking topology management and SDN
execution. This Section discusses the architecture of the GUI together with the components
and methods of implementing the GUI.
3.1 GUI Design
GUI design has three aspects, including high-level architecture design, java graph
visualisation library design, and detailed component design.
3.1.1 Architecture Design
Figure 2 shows the GUI architecture developed in this project. The GUI architecture
consists of three layers, which are framework layer, business layer, and interface layer. The
framework layer defines general, fundamental, reusable, and non-business logic components.
It extracts common graphical elements and functions, and encapsulates them into independent
classes. Well designed framework will dramatically improve the reusability of SDN and
CloudSim and reduce redundant codes. The business layer is responsible for defining
software business logic by invoking components from the framework layer. Core software
functionality is implemented at this layer such as executing simulation. The top interface
layer is used to interact with users by defining a user friendly interface and by optimising the
composition of graphical components such as menu, tool bar, and canvas for drawing
network topology. Business logic is invoked by the interface layer. The objective of this
project is to implement five parts of this architecture, including ‘Graph Visualisation Library’,
‘GraphView’, ‘Execution’, ‘File IO’, and ‘Graphical User Interface’. In particular, the ‘Graph
Visualisation Library’ is the key part for drawing network topology.

9
CloudSim
SDN
Java Swing
Graph
Visualisation
Library
Graphical User Interface
GraphView Execution File IO
Interface
Layer
Framework
Layer
Business
Layer
Figure 2. Graphical User Interface architecture.
3.1.2 Java Graph Visualisation Library Design
To develop a reusable graph visualisation library is essential for visualising network
topology of SDN. The most commonly method is to import a thirty-party graph visualisation
library, such as JGraphX [22], JGraphT [23], JUNG [24] and GraphStream [25].
JGraphX is a Swing-based Java graph visualisation library, which originated from JGraph
library. JGraphX facilitates the development of graph applications, including workflow editor,
organisational chart, business process modelling tool, UML tool, and network/telecoms
visualisation. In addition, it supports import, export, and automatically layout [22].
JGraphT provides a free, simple, and type-safe Java graph library. Compared with
JGraphX, JGraphT focuses on providing mathematical graph modelling and graph algorithm.
It supports directed and undirected graph with weight, edge multiplicity, ‘read-only’ graph,
listenable graph, and sub-graph [23].
JUNG is another prevalent Java universal network/graph framework. It supports graph
modelling, analysis, extensibility and visualisation. In addition to support general graph
modelling, such as directed and undirected graphs, multi-modal graphs, graphs with parallel
edges, and hyper graphs, it also supports annotating graphs, nodes, and relations with
metadata, which is beneficial for data analysis [24].
GraphStream is a recommended Java graph visualisation library especially for dynamic
graphs. GraphStream supports dynamical graph evolution in time, such as node addition,
node deletion, edge addition, edge deletion and attribute management. Besides, it also
supports import, export, measure and layout graph elements [25].

10
Although these existing thirty-party libraries are widely used, some of their features are
not suitable for meeting the objective of this project. To develop a lightweight SDN-specific
graphical library for fulfilling SDN features under cloud environment, I develop the graph
visualisation library by Java Swing. The library is extendable and can be customised to
incorporate more functionality.
3.1.3 Framework Layer Design
The framework layer consists of two independent parts which are separated by dotted line,
as shown in Figure 2. The right part is composed of two sub-parts, SDN and CloudSim.
Developed by CLOUD lab, CloudSim is the cloud-based fundamental simulation framework
[15]. Mr. Jongmin Son integrates SDN features into the CloudSim to provide programmable
networking management. The left part aims to encapsulate SDN-specific graphical
components, including types of nodes, edge, graph and coordinates, and the graph
visualisation library built by Java Swing. It aims to implement common graphical
components for visualising SDN.
+setSize()
+getSize() : long
+setPes()
+getPes() : int
+setMips()
+getMips() : long
+setRam()
+getRam() : int
-size : long
-pes : int
-mips : long
-ram : int
VmNode
+setIops()
+getIops() : long
+setUpports()
+getUpports() : int
+setDownports()
+getDownports() : int
+setBw()
+getBw() : long
-iops : long
-upports : int
-downports : int
-bw : long
SwitchNode
+getX() : int
+getY() : int
+setX()
+setY()
-x : int
-y : int
Coordinates
+getName() : string
+setName()
+getType() : string
+setType()
+setCoordinate(in coord : Coordinates)
+getCoordinate() : Coordinates
-name : string
-type : string
-coord : Coordinates
Node
+getNode() : Node
+getBandwidth() : long
+getLatency() : double
+getInfo() : object
-dest : Node
-latency : double
-name : string
-bandwidth : long
Edge
+setPes()
+getPes() : int
+setMips()
+getMips() : long
+setRam()
+getRam() : int
+setStorage()
+getStorage() : long
+setBw()
+getBw() : long
-pes : int
-mips : long
-ram : int
-storage : long
-bw : long
HostNode
+setAdjacencyList()
+getAdjacencyList() : object
+addEdge(in key : Node, in value : Edge)
+addNode(in node : Node)
+removeEdge(in key : Node, in value : Edge)
+removeNode(in key : Node)
-adjacencyList : object
Graph
<<uses>>
<<uses>> <<uses>>
Figure 3. Class diagram of graph visualisation library.
11
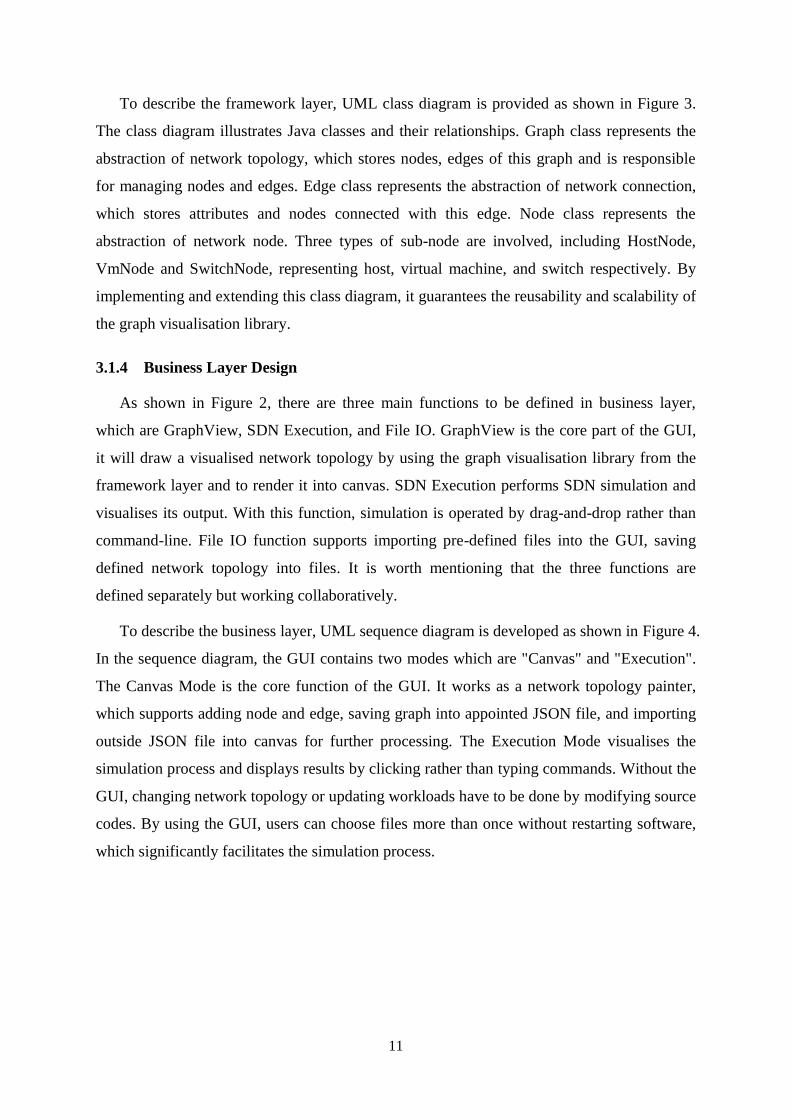
To describe the framework layer, UML class diagram is provided as shown in Figure 3.
The class diagram illustrates Java classes and their relationships. Graph class represents the
abstraction of network topology, which stores nodes, edges of this graph and is responsible
for managing nodes and edges. Edge class represents the abstraction of network connection,
which stores attributes and nodes connected with this edge. Node class represents the
abstraction of network node. Three types of sub-node are involved, including HostNode,
VmNode and SwitchNode, representing host, virtual machine, and switch respectively. By
implementing and extending this class diagram, it guarantees the reusability and scalability of
the graph visualisation library.
3.1.4 Business Layer Design
As shown in Figure 2, there are three main functions to be defined in business layer,
which are GraphView, SDN Execution, and File IO. GraphView is the core part of the GUI,
it will draw a visualised network topology by using the graph visualisation library from the
framework layer and to render it into canvas. SDN Execution performs SDN simulation and
visualises its output. With this function, simulation is operated by drag-and-drop rather than
command-line. File IO function supports importing pre-defined files into the GUI, saving
defined network topology into files. It is worth mentioning that the three functions are
defined separately but working collaboratively.
To describe the business layer, UML sequence diagram is developed as shown in Figure 4.
In the sequence diagram, the GUI contains two modes which are "Canvas" and "Execution".
The Canvas Mode is the core function of the GUI. It works as a network topology painter,
which supports adding node and edge, saving graph into appointed JSON file, and importing
outside JSON file into canvas for further processing. The Execution Mode visualises the
simulation process and displays results by clicking rather than typing commands. Without the
GUI, changing network topology or updating workloads have to be done by modifying source
codes. By using the GUI, users can choose files more than once without restarting software,
which significantly facilitates the simulation process.

12
UI
Alt
Select Mode
Graph HostNode SDNRunSwitchNode EdgeVmNode
Show Interface
Add HostNode
Add SwitchNode
Add VmNode
Update Graph
Draw HostNode
Update Graph
Draw SwitchNode
Draw VmNode
Update Graph
Add Edge
Draw Edge
Update Graph
[Mode= Canvas]
Save Graph
[Mode= Execution]
Run
Execute SDN Simulation
Present Result
Import Physical Topology
Import Virtual Topology
Import Workload background
Import Workload
File IO
Graph Transition
Create JSON
Figure 4. Software sequence diagram.
3.1.5 Interface Layer Design
In order to deliver a user friendly GUI, some principles should be followed, including
defining clear entry and exit points, keeping software logic consistent, following widely
accepted conventions, responding with proper feedback, prompting assistance and visualising
software content [26]. Among them, to design the GUI with consistent logic is relatively
more important but not easy to implement. The consistent logic will help user easily identify
software logic pattern and accelerate software learning. In addition, it is also necessary to
visualise text content to perceptual form, which will provide users with a more friendly and
straightforward interface.

13
3.2 Implementation
The GUI is implemented by using Java Swing to produce user friendly, reusable and
SDN-specific functionality. This Section discusses the GUI implementation, including
project integrated development environment (IDE), project structure, Graph Visualisation
Library, Canvas Mode, and Execution Mode.
3.2.1 GUI Project IDE and Structure
Within java application development, Eclipse Integrated Development Environment (IDE)
is the most prevalent Java IDE that provides an open-source, extensible, plug-in based, cross-
platform, multilingual programming workspace [27].
Based on the GUI architecture, the following three packages are added into current
CloudSim, as shown in Figure 5.
org.cloudbus.cloudsim.sdn.graph.core,
org.cloudbus.cloudsim.sdn.graph.dialog, and
org.cloudbus.cloudsim.sdn.graph.example.
Figure 5. GUI project structure.

14
The package 'core' defines the types of components for network topology visualisation,
including Graph, GraphView, Node, Edge, Coordinates, and Bridge. GraphView is extended
from JPanel, which is used to draw network topology. Graph is an abstraction of network
topology which is composed of Node and Edge. Coordinates represents the specific location
for each node which is used to draw node into canvas. Bridge works as a connection between
JSON file and visualised graph, by which the graph entity can be transformed into JSON
format and vice versa. The package 'dialog' defines the GUI project functions, including
adding node, adding edge and executing simulation. The package 'example' defines the GUI
project entry point, by which users can create network topological graph, save graph, load
graph and execute simulation in a visualised way.
3.2.2 The implementation of Graph Visualisation Library
The implementation of Graph Visualisation Library is the core part of this project. It
implements foundation classes for creating network topology, mainly including Graph,
GraphView, Node, Edge, Coordinates and Bridge. GraphView is extended from JPanel,
which is used to draw network topology. Graph is an abstraction of network topology which
is composed of Node and Edge. Three types of nodes are defined, including HostNode,
SwitchNode and VmNode, to represent host, switch and virtual machine respectively.
Coordinates represents specific location for each node which is used to draw node into canvas.
Bridge works as a connection between JSON file and visualised graph, by which graph entity
can be transformed to JSON format and vice versa.
3.2.3 Implementation of Canvas Mode
Based on the design of the business layer presented in Section 3.1.4, the Canvas and
Execution modes are implemented into the CloudSim SDN by Java Swing [27]. As shown in
Figure 6, the two modes can be displayed under the View function.
Figure 6. Canvas and Execution mode.

15
Canvas mode is developed to build network topology, by which user can add node, add
edge, save and load network topology. The node represents SDN components, including
server, virtual machine and switch, and the edge represents network connection. Figure 7
shows the toolbar of GUI under the Canvas mode. The first four buttons (Add Physical Node,
Add Physical Edge, Save, and Load) of the toolbar are used for creating physical network
topology. The next four buttons (Add Virtual Node, Add Virtual Edge, Save, and Load) of
the toolbar are used for creating virtual network topology.
Figure 7. GUI toolbar.
Take creating a physical network topology as an example. The Add Physical Node button
will open a dialog, as shown in Figure 8, by which users can add a new node into the network
topology. The information in terms of the unique node name, bandwidth, input/output
operations per second (IOPS), upports, downports, and node type are required to fill in the
dialog. Specifically, the node type includes host (i.e. server host), edge and core (i.e. switch).
Figure 8. Add Physical Node dialog.

16
By clicking the Add Physical Edge button, a dialog will appear to allow users to add a
new edge in the network topology, as shown in Figure 9. For example, two nodes 'switch2'
and 'host2' is selected from the dropdown lists, and the latency of the edge between the two
nodes is defined as 1.01. An Edge object will be created and saved in the Graph object. If
there is no node, these two dropdown list will show empty.
Figure 9. Add Physical Edge dialog.
Figure 10 shows the saving and loading of network topology by using the Save and Load
buttons. To convert network topology object into JSON object or vice versa, a ‘bridge class’
is defined. The JSON object is then saved as JSON file.
Figure 10. Saving and loading network topology.

17
3.2.4 Execution Mode
Execution mode is developed to visually execute SDN simulation. As SDN simulation is
based on four configuration files, which are physical network topology, virtual network
topology and two workload files. They are imported into GUI by Java chooser, which is
shown in Figure 11. With Java chooser, users can choose configuration files dynamically
instead of putting the files at fixed directory or changing the source code when the files are
changed.
Figure 11. Configuration file selection.
If the configuration files are chosen correctly, the play button will be activated. If not, it
will keep inactive to protect simulator from unexpected crash. The play button is used to start
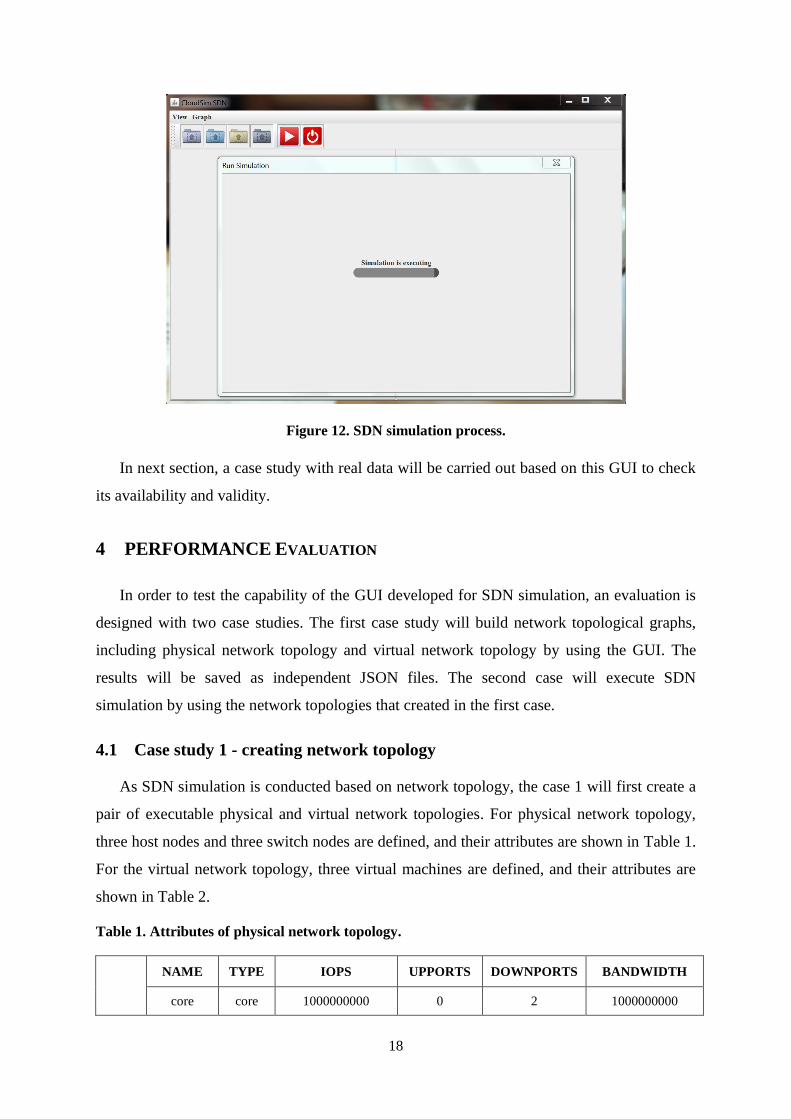
up SDN simulation by opening the 'Run Simulation' dialog, as shown in Figure 12. As the
simulation may consume for a long time, a progress bar is applied to show the running
process. Finally, the simulation result will be displayed in a text field, by which users can
review the running details visually and conveniently, and do not need to check it in a console
window.
18
Figure 12. SDN simulation process.
In next section, a case study with real data will be carried out based on this GUI to check
its availability and validity.
4 PERFORMANCE EVALUATION
In order to test the capability of the GUI developed for SDN simulation, an evaluation is
designed with two case studies. The first case study will build network topological graphs,
including physical network topology and virtual network topology by using the GUI. The
results will be saved as independent JSON files. The second case will execute SDN
simulation by using the network topologies that created in the first case.
4.1 Case study 1 - creating network topology
As SDN simulation is conducted based on network topology, the case 1 will first create a
pair of executable physical and virtual network topologies. For physical network topology,
three host nodes and three switch nodes are defined, and their attributes are shown in Table 1.
For the virtual network topology, three virtual machines are defined, and their attributes are
shown in Table 2.
Table 1. Attributes of physical network topology.
NAME TYPE IOPS UPPORTS DOWNPORTS BANDWIDTH
core core 1000000000 0 2 1000000000

19
Nodes
edge1 edge 1000000000 1 4 1000000000
edge2 edge 1000000000 1 4 1000000000
NAME TYPE PES MIPS RAM STORAGE BANDWIDTH
host01 host 1 30000000 10240 10000000 200000000
host02 host 1 30000000 10240 10000000 200000000
host03 host 1 30000000 10240 10000000 200000000
Links
SOURCE DESTINATION LATENCY
core edge1 0.5
core edge2 0.5
edge1 host01 0.5
edge1 host02 0.5
edge2 host03 0.5
Table 2. Attributes of virtual network topology.
Nodes
NAME TYPE SIZE PES MIPS RAM
vm01 vm 1000 1 30000000 512
vm02 vm 1000 1 30000000 512
vm03 vm 1000 1 30000000 512
Links
NAME SOURCE DESTINATION BANDWIDTH
132 vm03 vm02 66000000
121 vm02 vm01 66000000
default vm01 vm02
default vm02 vm01
default vm02 vm03
default vm03 vm02
Based on Tables 2 and 3, the physical network topology (seen as the left part of Figure
13), and virtual network topology (seen as the right part of Figure 13) are created by using the
functions of GUI. Finally, the two topologies are saved as two JSON files, as shown in
Figures 14 and 15.

20
Figure 13. Creating network topologies.
Figure 14. Physical network topology file.
Figure 15. Virtual network topology file.

21
4.2 Case study 2 - Executing SDN Simulation
To start up SDN simulation, four configuration files are loaded as shown in Table 3. The
first two JSON files are defined by the first case. The two CVS files are given by default,
which represent the workloads of this case.
Table 3. Configuration files.
File Name Description Format
physical.json Physical network topology file JSON
virtual.json Deployment file (virtual network topology) JSON
workload_10sec_100.csv Workload background file CVS
workload_10sec_100_default.csv Workload file CVS
The play button will be activated after the configuration files are loaded correctly. The
running time depends on the complexity of the network topology and workloads. If the
simulation completes correctly, the simulation result will be displayed as shown in Figure 16.
Figure 16. The simulation result.
5 CONCLUSION AND FUTURE DIRECTIONS
This project developed a GUI for SDN simulation under cloud environments. The GUI is
based on CloudSim framework with SDN features integrated. It is developed by using Java

22
Swing, and implemented with an SDN-specific graph visualization library. This library
provides foundational components for drawing and managing network topological graph,
including node, edge, bridge, graph and graphview. The GUI provides two modes for
supporting SDN simulation, which are Canvas Mode and Execution Mode. The Canvas Mode
is used to manage network topology and the Execution Mode is used to execute SDN
simulation.
This project addressed two important aspects: GUI design and implementation. For the
GUI design, the high-level structures and style of the GUI is defined as the GUI architecture.
The architecture includes three layers, including framework layer, business layer and
interface layer, are elaborated by using UML class diagram and sequence diagram. For the
GUI implementation, the project presented the main components of GUI, including project
IDE, Graph Visualisation Library, Canvas Mode, and Execution Mode. Instead of importing
a third-party library, a SDN-specific graph visualisation library is developed, which is
extensible for integrating more SDN features. The design and implementation of the GUI
under cloud environment that can visualise SDN simulation contributes to the development of
the CloudSim framework. It will facilitate the integration of the SDN features with the cloud-
based networking management.
For future works, researchers and practitioners may consider address the following
unsolved issues. The first issue is the operability of GUI may be improved by implementing a
toolbox, such as Microsoft Visual Studio IDE. Such a toolbox will simplify the network
topology management significantly by using only the drag and drop functions. Thus the
interface complexity of using dialogs will be largely reduced. Another issue is to visualise the
whole SDN simulation process. In this way, all the changes and movements of components in
CloudSim can be monitored, and more ideally the simulation can also be paused or resumed
at specific state.

23
REFERENCE LIST
[1] R. Buyya, C. S. Yeo, S. Venugopal, J. Broberg and I. Brandic, "Cloud computing and emerging
IT platforms: Vision, hype, and reality for delivering computing as the 5th utility," Future
Generation Computer Systems, vol. 25, no. 6, pp. 599-616, 2009.
[2] R. Buyya, R. Ranjan and R. Calheiros, "Modeling and simulation of scalable Cloud computing
environments and the CloudSim toolkit: Challenges and opportunities," in High Performance
Computing & Simulation, 2009. HPCS '09. International Conference on , Leipzig, Germany,
2009.
[3] B. Wickremasinghe, R. Calheiros and R. Buyya, "CloudAnalyst: A CloudSim-Based Visual
Modeller for Analysing Cloud Computing Environments and Applications," in Advanced
Information Networking and Applications (AINA), 2010 24th IEEE International Conference on ,
Perth, WA , 2010.
[4] B. Nunes, M. Mendonca, X.-N. Nguyen, K. Obraczka and T. Turletti, "A Survey of software-
defined networking: past, present, and future of programmable networks," Communications
Surveys & Tutorials, IEEE, vol. 16, no. 3, pp. 1617 - 1634 , 2014.
[5] S. Baset, L. Wang, B. Tak, C. Pham and C. Tang, "Toward achieving operational excellence in a
cloud," IBM Journal of Research and Development, vol. 58, no. 2/3, pp. 4:1 - 4:11 , 2014.
[6] R. Buyya, C. Vecchiola and S. Selvi, Mastering Cloud Computing: Foundations and Applications
Programming, Waltham,MA: Morgan Kaufmann, 2013.
[7] S. Azodolmolky, P. Wieder and R. Yahyapour, "SDN-Based Cloud Computing Networking," in
Transparent Optical Networks (ICTON), 2013 15th International Conference on, Cartagena,
2013.
[8] O. N. Foundation, "Software-defined networking: The new norm for networks," 13 4 2012.
[Online]. Available: https://www.opennetworking.org/images/stories/downloads/sdn-
resources/white-papers/wp-sdn-newnorm.pdf. [Accessed 19 10 2014].
[9] S. Sezer, S. Scott-Hayward, P. Chouhan, B. Fraser, D. Lake, J. Finnegan, N. Viljoen, M. Miller
and N. Rao, "Are we ready for SDN? Implementation challenges for software-defined networks,"
Communications Magazine, IEEE, vol. 51, no. 7, pp. 36-43, 2013.
[10] R. Jain and S. Paul, "Network virtualization and software defined networking for cloud
computing: a survey," Communications Magazine, IEEE, vol. 51, no. 11, pp. 24-31, 2013.
[11] M. Jammal, T. Singh, A. Shami, R. Asal and Y. Li, "Software-Defined Networking: State of the
Art and Research Challenges," Computer Networks, vol. 72, pp. 74-98, 2014.
[12] N. McKeown, T. Anderson, H. Balakrishnan, G. Parulkar, L. Peterson, J. Rexford, S. Shenker

24
and J. Turner, "OpenFlow: enabling innovation in campus networks," ACM SIGCOMM
Computer Communication Review, vol. 38, no. 2, pp. 69-74, 2008.
[13] P. Goransson and C. Black, Software Defined Networks: A Comprehensive Approach, Waltham,
MA: Morgan Kaufmann, an imprint of Elsevier, 2014.
[14] R. N. Calheiros, R. Ranjan, A. Beloglazov, C. A. F. D. Rose and R. Buyya, "CloudSim: a toolkit
for modeling and simulation of cloud computing environments and evaluation of resource
provisioning algorithms," Software—Practice & Experience, ACM, vol. 41, no. 1, pp. 23-50,
2011.
[15] C. L. U. o. Melbourne, "CloudSim: A Framework for Modeling and Simulation of Cloud
Computing Infrastructures and Services," Cloudbus.org, 2014. [Online]. Available:
http://www.cloudbus.org/cloudsim/. [Accessed 18 10 2014].
[16] Mininet, "Mininet: An Instant Virtual Network on your Laptop (or other PC)," [Online].
Available: http://mininet.org/. [Accessed 2014 11 3].
[17] S. Ilango Leonardo and C. Dave, "SPECI-2: An open-source framework for predictive simulation
of cloud-scale data-centres," 2011. arXiv:1106.5465v1.
[18] A. Núñez, J. Vázquez-Polettim, A. Caminero, G. Castañé, J. Carretero and I. Llorente,
"iCanCloud: A Flexible and Scalable Cloud Infrastructure Simulator," Grid Computing, vol. 10,
no. 1, pp. 185-209, 2012.
[19] Oracle, "About the JFC and Swing,"" Oracle, 2014. [Online]. Available:
http://docs.oracle.com/javase/tutorial/uiswing/start/about.html. [Accessed 19 10 2014].
[20] P. Conrod and L. Tylee, Learn Java Gui Applications: A Jfc Swing Tutorial, Maple Valley, WA:
Kidware Software; 7th Full Color edition, 2013.
[21] JGraph, "jGraphX," JGraph Ltd, 2014. [Online]. Available: https://github.com/jgraph/jgraphx.
[Accessed 20 10 2014].
[22] B. Naveh, "JGraphT," 2014. [Online]. Available: http://jgrapht.org/. [Accessed 20 10 2014].
[23] J. F. D. Team, "JUNG-Java Universal Network/Graph Framework," 2010. [Online]. Available:
http://jung.sourceforge.net/. [Accessed 20 10 2014].
[24] G. Team, "GraphStream-A Dynamic Graph Library," 2014. [Online]. Available:
http://graphstream-project.org/. [Accessed 20 10 2014].
[25] B.-E. Adream and M. Zender, "User Interface Design Principles for Interaction Design," Design
Issues, vol. 24, no. 3, pp. 85-107, 2008.
[26] Eclipse, "Eclipse desktop & web IDE," Eclipse Foundation, 2014. [Online]. Available:
https://www.eclipse.org/ide/. [Accessed 23 10 2014].
[27] J. Zukowski, The definitive guide to Java Swing, Berkeley, CA: Apress, 2005.

25


![PayPass User Interface Application Approval Guide · Compliant with MasterCard User Interface or Wallet Application Requirements as defined in [PayPass on Mobile Requirements] and](https://img.dokumen.tips/doc/110x75/5e7c8680dc88601adb0d9e69/paypass-user-interface-application-approval-guide-compliant-with-mastercard-user.jpg)
