Embed Size (px)
Citation preview
Graph preprocessing
Introduction Noise removal and data enhancement problem Noise removal and data enhancement on binary data Noise removal and data enhancement on graph data Noise removal and data enhancement tools Current research problems Future directions
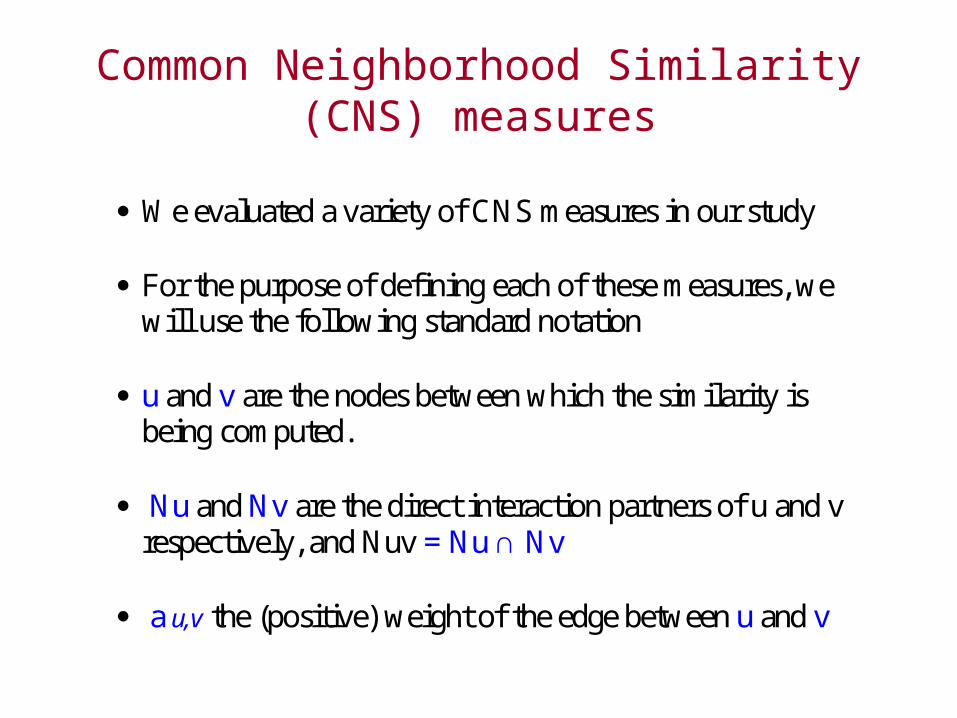
Common Neighborhood Similarity (CNS) measures
We evaluated a variety of CNS measures in our study For the purpose of defining each of these measures, we
will use the following standard notation
u and v are the nodes between which the similarity is being computed.
Nu and Nv are the direct interaction partners of u and v
respectively, and Nuv = Nu ∩ Nv
a u,v the (positive) weight of the edge between u and v
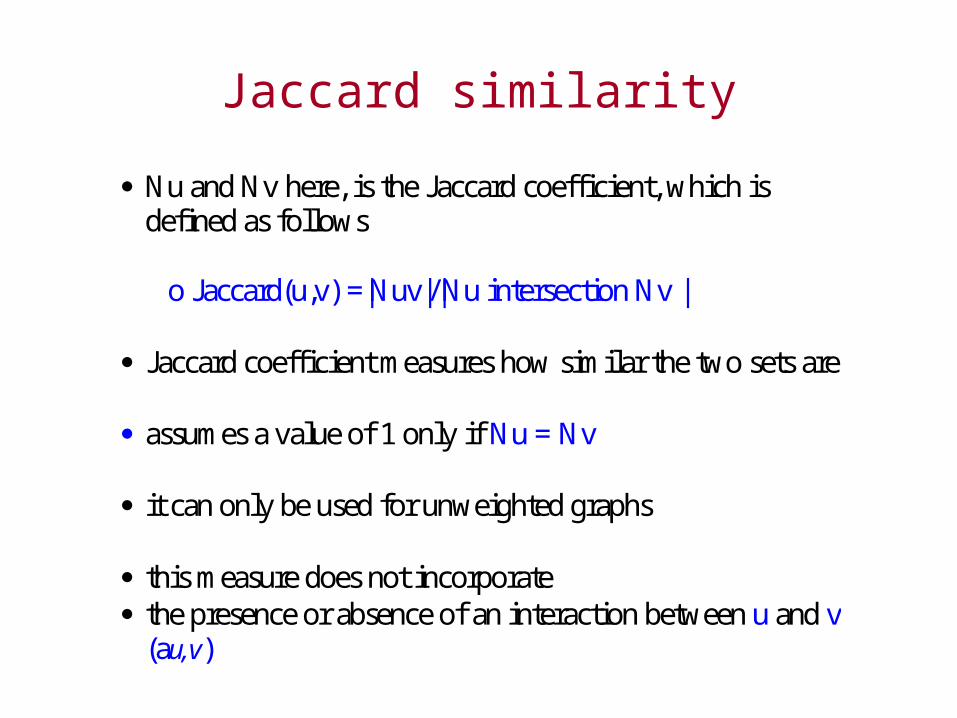
Jaccard similarity
Nu and Nv here, is the Jaccard coefficient, which is defined as follows
o Jaccard(u,v) =|Nuv|/|Nu intersection Nv |
Jaccard coefficient measures how similar the two sets are
assumes a value of 1 only if Nu = Nv
it can only be used for unweighted graphs
this measure does not incorporate the presence or absence of an interaction between u and v
(au,v)
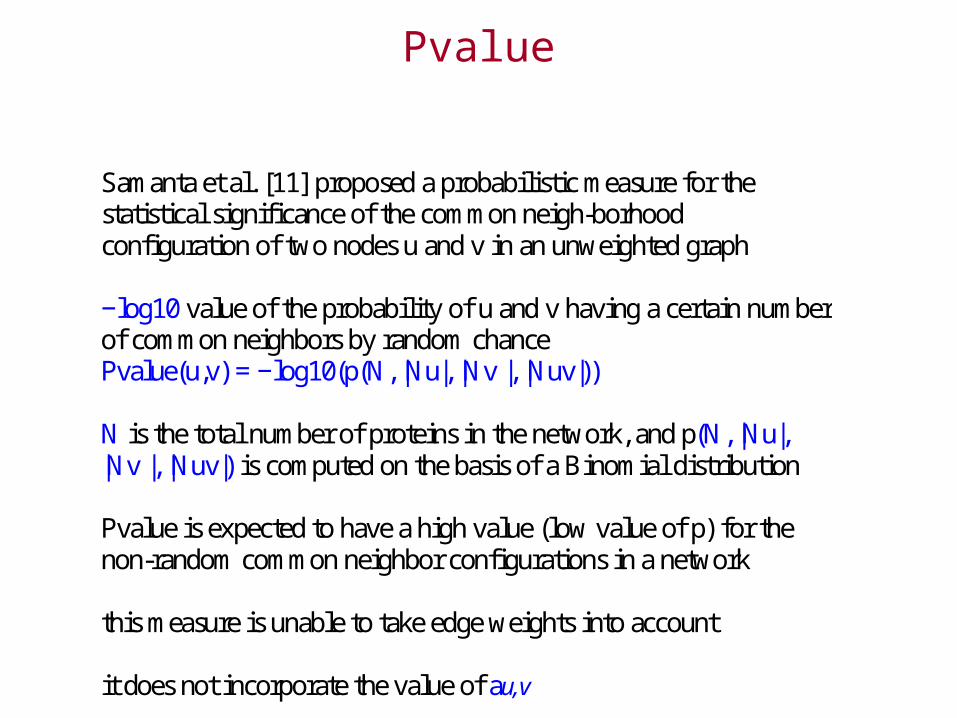
Pvalue
Samanta et al. [11] proposed a probabilistic measure for the statistical significance of the common neigh-borhood configuration of two nodes u and v in an unweighted graph −log10 value of the probability of u and v having a certain number of common neighbors by random chance Pvalue(u,v) = −log10(p(N, |Nu|, |Nv |, |Nuv|)) N is the total number of proteins in the network, and p(N, |Nu|, |Nv |, |Nuv|) is computed on the basis of a Binomial distribution Pvalue is expected to have a high value (low value of p) for the non-random common neighbor configurations in a network this measure is unable to take edge weights into account it does not incorporate the value of au,v
Functional Similarity (FS)
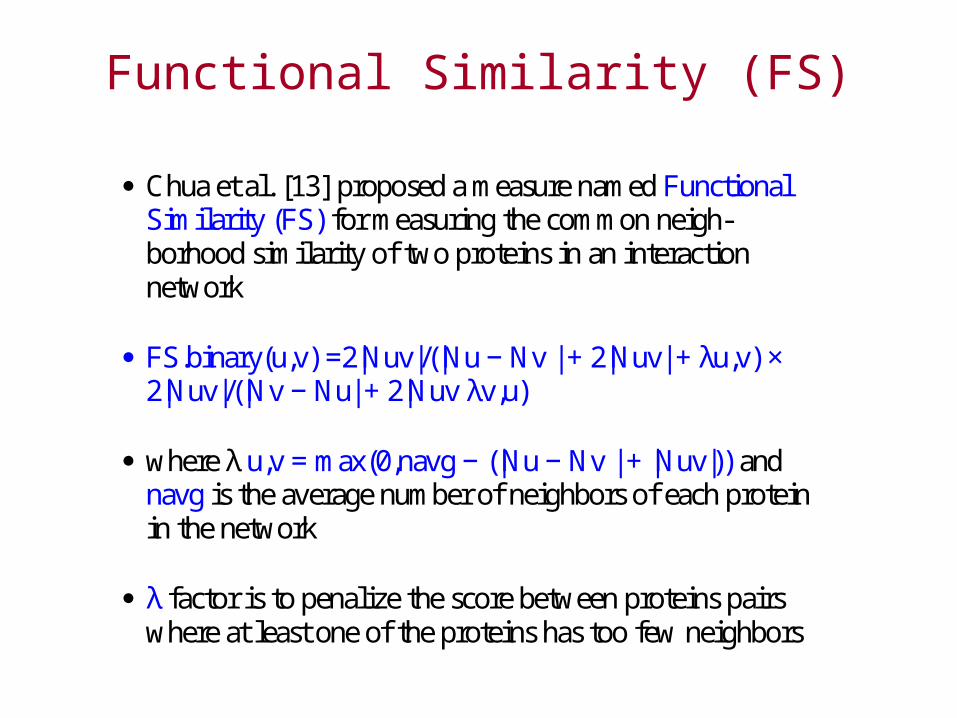
Chua et al. [13] proposed a measure named Functional Similarity (FS) for measuring the common neigh-borhood similarity of two proteins in an interaction network
FS.binary(u,v) =2|Nuv|/(|Nu − Nv | + 2|Nuv| + λu,v) ×
2|Nuv|/(|Nv − Nu| + 2|Nuv λv,u)
where λ u,v = max(0,navg − (|Nu − Nv | + |Nuv|)) and navg is the average number of neighbors of each protein in the network
λ factor is to penalize the score between proteins pairs
where at least one of the proteins has too few neighbors
Topological Overlap Measure (TOM)
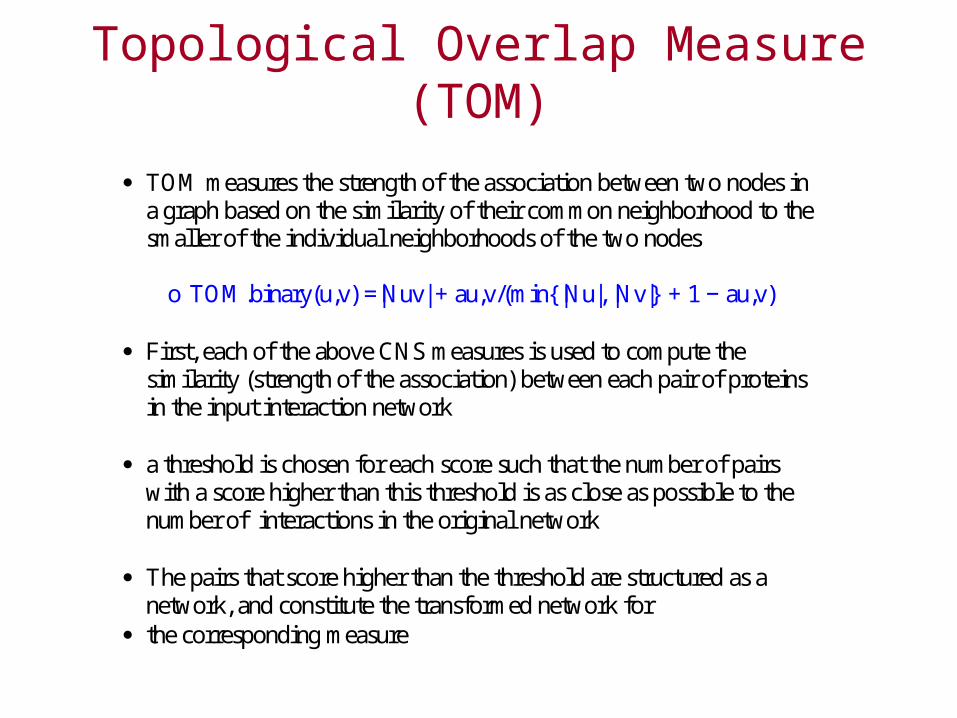
TOM measures the strength of the association between two nodes in a graph based on the similarity of their common neighborhood to the smaller of the individual neighborhoods of the two nodes
o TOM.binary(u,v) =|Nuv| + au,v/(min{|Nu|, |Nv|} + 1 − au,v)
First, each of the above CNS measures is used to compute the
similarity (strength of the association) between each pair of proteins in the input interaction network
a threshold is chosen for each score such that the number of pairs
with a score higher than this threshold is as close as possible to the number of interactions in the original network
The pairs that score higher than the threshold are structured as a network, and constitute the transformed network for
the corresponding measure
Pair-wise H-Confidence
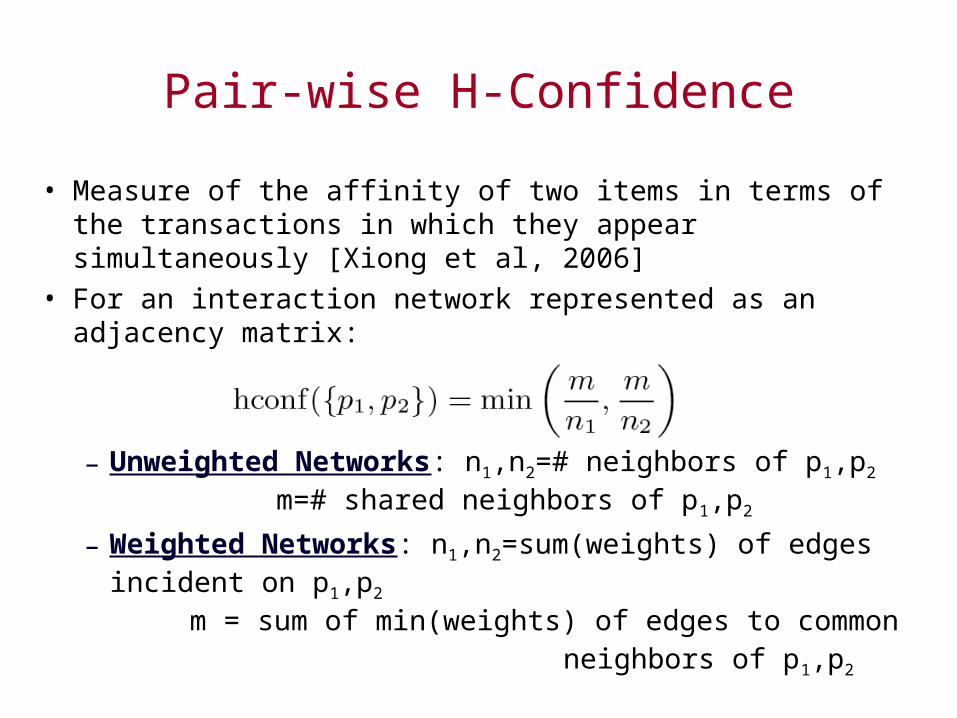
• Measure of the affinity of two items in terms of the transactions in which they appear simultaneously [Xiong et al, 2006]
• For an interaction network represented as an adjacency matrix:
– Unweighted Networks: n1,n2=# neighbors of p1,p2
m=# shared neighbors of p1,p2
– Weighted Networks: n1,n2=sum(weights) of edges incident on p1,p2
m = sum of min(weights) of edges to common neighbors of p1,p2
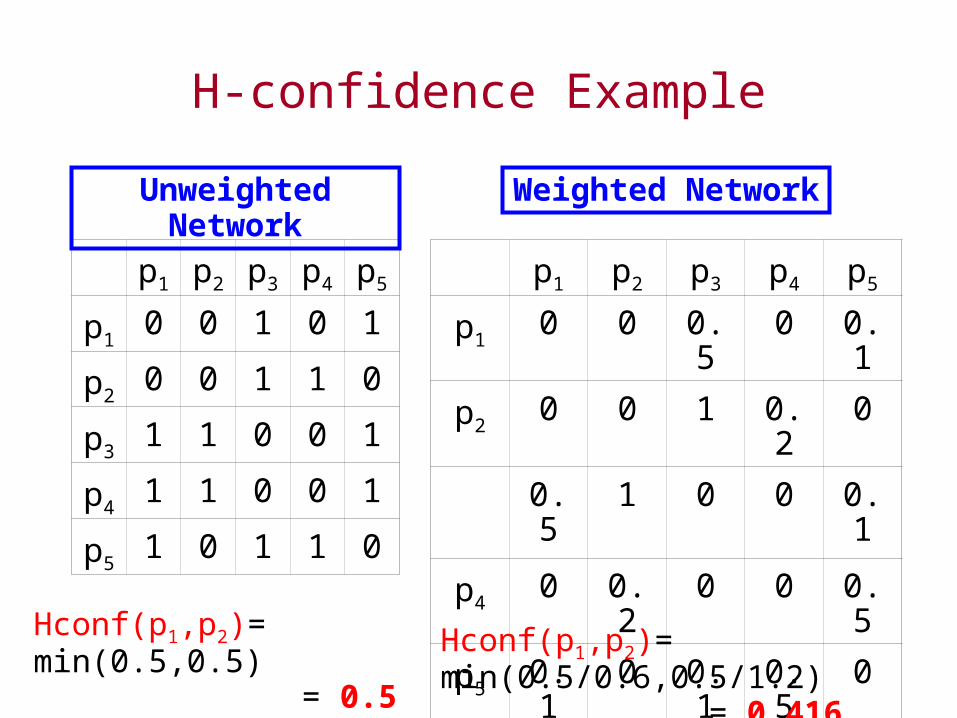
H-confidence Example
p1 p2 p3 p4 p5
p10 0 1 0 1
p20 0 1 1 0
p31 1 0 0 1
p41 1 0 0 1
p51 0 1 1 0
p1 p2 p3 p4 p5
p10 0 0.5 0 0.1
p20 0 1 0.2 0
p
3
0.5 1 0 0 0.1
p40 0.2 0 0 0.5
p50.1 0 0.1 0.5 0
Unweighted Network Weighted Network
Hconf(p1,p2)= min(0.5,0.5) = 0.5
Hconf(p1,p2)= min(0.5/0.6,0.5/1.2) = 0.416
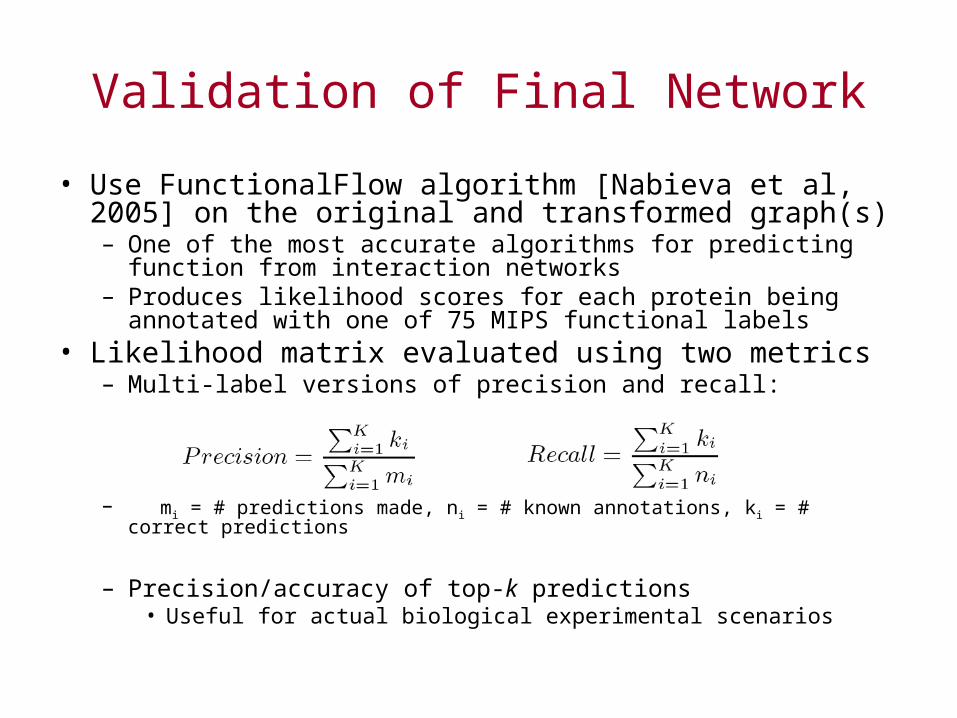
Validation of Final Network
• Use FunctionalFlow algorithm [Nabieva et al, 2005] on the original and transformed graph(s)– One of the most accurate algorithms for predicting function from
interaction networks– Produces likelihood scores for each protein being annotated with one
of 75 MIPS functional labels• Likelihood matrix evaluated using two metrics
– Multi-label versions of precision and recall:
– mi = # predictions made, ni = # known annotations, ki = # correct predictions
– Precision/accuracy of top-k predictions• Useful for actual biological experimental scenarios

Test Protein Interaction Networks
• Three yeast interaction networks with different types of weighting schemes used for experiments– Combined
• Composed from Ito, Uetz and Gavin (2002)’s data sets• Individual reliabilities obtained from EPR index tool of DIP• Overall reliabilities obtained using a noisy-OR
– [Krogan et al, 2006]’s data set• 6180 interactions between 2291 annotated proteins• Edge reliabilities derived using machine learning techniques
– DIPCore [Deane et al, 2002]• ~5K highly reliable interactions in DIP• No weights assigned: assumed unweighted
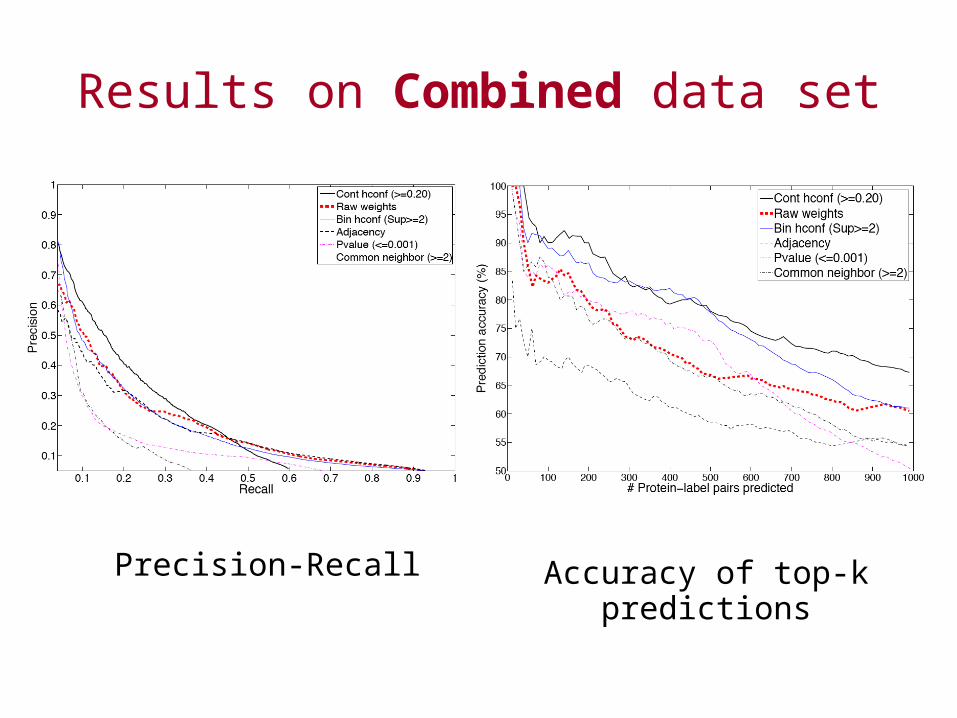
Results on Combined data set
Precision-Recall Accuracy of top-k predictions
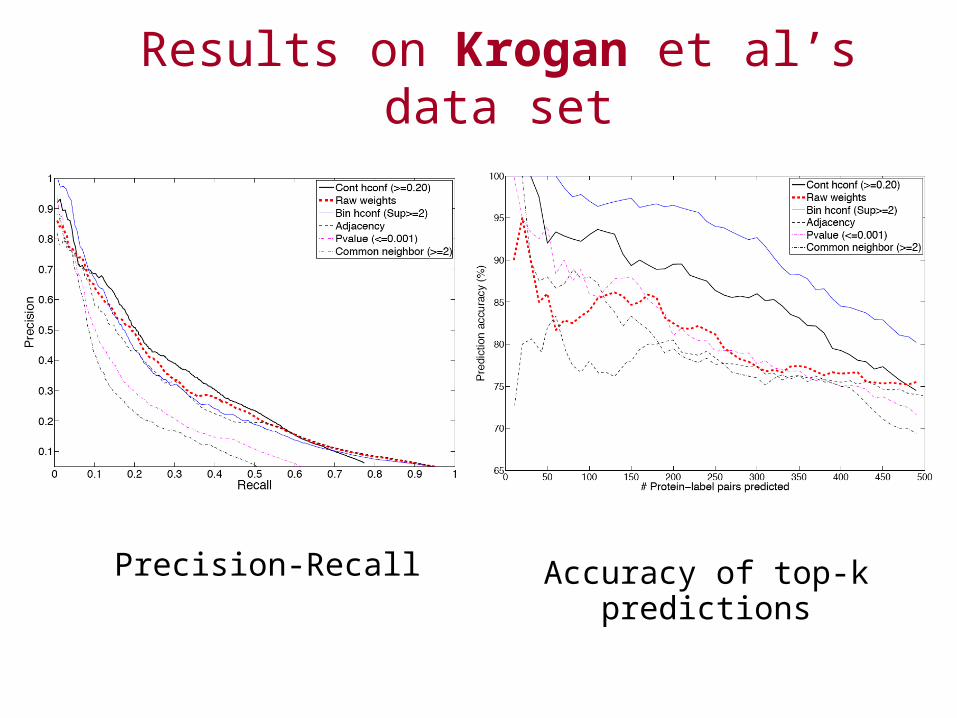
Results on Krogan et al’s data set
Precision-Recall Accuracy of top-k predictions
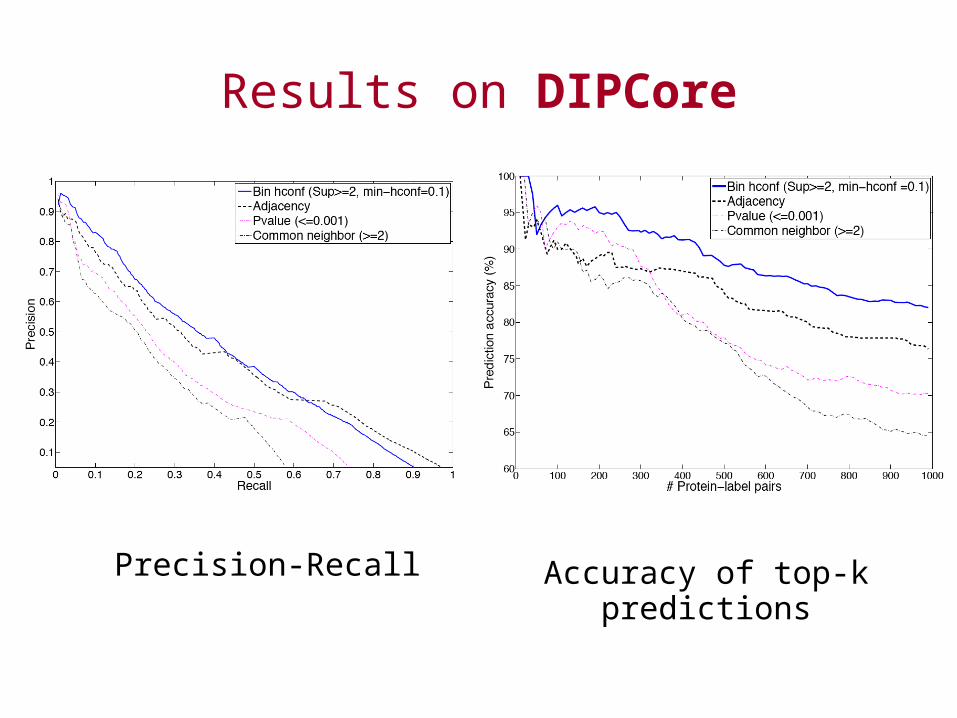
Results on DIPCore
Precision-Recall Accuracy of top-k predictions
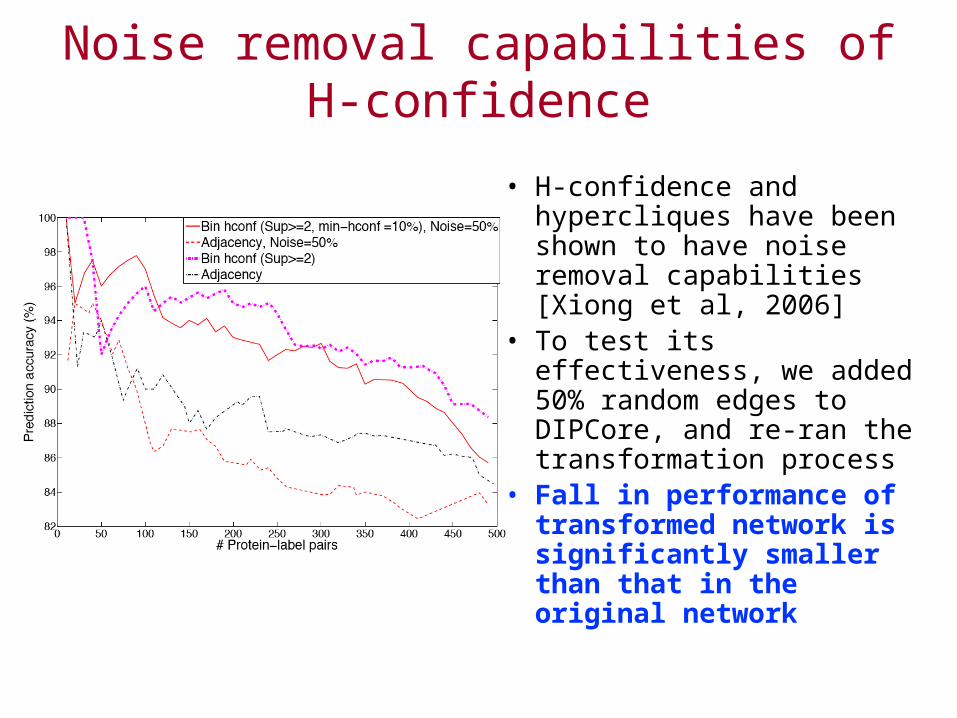
Noise removal capabilities of H-confidence
• H-confidence and hypercliques have been shown to have noise removal capabilities [Xiong et al, 2006]
• To test its effectiveness, we added 50% random edges to DIPCore, and re-ran the transformation process
• Fall in performance of transformed network is significantly smaller than that in the original network
Summary of Results
• H-confidence-based transformations generally produce more accurate and more reliably weighted interaction graphs: Validated function prediction
• Generally, the less reliable the weights assigned to the edges in the raw network, the greater improvement in performance obtained by using an h-confidence-based graph transformation.
• Better performance of the h-confidence-based graph transformation method is indeed due to the removal of spurious edges, and potentially the addition of biologically viable ones and effective weighting of the resultant set of edges.
Conclusions and future directions different protein function prediction algorithms are run on the
original as well as the transformed networks
Nabieva et al.’s FunctionalFlow algorithm
o neighborhood-based algorithm inspired by Schwikowski et al.’s function prediction algorithm
o The predictions from both these algorithms are evaluated within
a five-fold cross-validation setup by computing the Area Under the ROC Curve (AUC) score for each class separately
o common neighborhood similarity information is that it can be
used for filtering out noisy or spurious interactions in a network
evaluated the use of a variety of common neighborhood similarity (CNS) measures to quantify the relationship of two proteins based on their common neighborhood
used them within the framework of graph transformation for the task
of pre-processing protein interaction networks

Conclusions and future directions
validation of the noisy edges removed and the functional linkages added to the network during the graph transformation process using experimental PPI
assessment methods examine how the CNS measures evaluated here perform for other types of network data, such as genetic interaction networks which have their own characteristics, such as the presence of both positively and negatively weighted edges
it is possible to develop hybrid CNS measures that
combine the best properties of all these measures
References (I)
• [Pandey et al, 2006] Gaurav Pandey, Vipin Kumar and Michael Steinbach, Computational Approaches for Protein Function Prediction: A Survey, TR 06-028, Department of Computer Science and Engineering, University of Minnesota, Twin Cities
• [Pandey et al, 2007] G. Pandey, M. Steinbach, R. Gupta, T. Garg and V. Kumar, Association analysis-based transformations for protein interaction networks: a function prediction case study. KDD 2007: 540-549
• [Xiong et al, 2005] XIONG, H., HE, X., DING, C., ZHANG, Y., KUMAR, V., AND HOLBROOK, S. R. 2005. Identification of functional modules in protein complexes via hyperclique pattern discovery. In Proc. Pacific Symposium on Biocomputing (PSB). 221–232.
• [Xiong et al, 2006a] XIONG, H., TAN, P.-N., AND KUMAR, V. 2003. Hyperclique Pattern Discovery, Data Mining and Knowledge Discovery, 13(2):219-242
• [Xiong et al, 2006b] XIONG, H., PANDEY, G., STEINBACH, M., AND KUMAR, V. 2006, Enhancing Data Analysis with Noise Removal, IEEE TKDE, 18(3):304-319
• [Xiong et al, 2006c] Hui Xiong, Michael Steinbach, and Vipin Kumar, Privacy Leakage in Multi-relational Databases: A Semi-supervised Learning Perspective, VLDB Journal Special Issue on Privacy Preserving Data Management , Vol. 15, No. 4, pp. 388-402, November, 2006
• [Xiong et al, 2004] Hui Xiong, Michael Steinbach, Pang-Ning Tan and Vipin Kumar, HICAP: Hierarchical Clustering with Pattern Preservation, SIAM Data Mining 2004
• [Tan et al, 2005] TAN, P.-N., STEINBACH, M., AND KUMAR, V. 2005. Introduction to Data Mining. Addison-Wesley.• [Nabieva et al, 2005] NABIEVA, E., JIM, K., AGARWAL, A., CHAZELLE, B., AND SINGH, M. 2005. Whole-proteome
prediction of protein function via graph-theoretic analysis of interaction maps. Bioinformatics 21, Suppl. 1, i1–i9.• [Deng et al, 2003] DENG, M., SUN, F., AND CHEN, T. 2003. Assessment of the reliability of protein–protein interactions
and protein function prediction. In Pac Symp Biocomputing. 140–151.• [Gavin et al, 2002] A. Gavin et al. Functional organization of the yeast proteome by systematic analysis of protein complexes ,
Nature, 415:141-147, 2002• [Hart et al, 2006] G Traver Hart, Arun K Ramani and Edward M Marcotte, How complete are current yeast and human
protein-interaction networks, Genome Biology, 7:120, 2006
References (II)
• [Brun et al, 2003] BRUN, C., CHEVENET, F.,MARTIN, D.,WOJCIK, J., GUENOCHE, A., AND JACQ, B. 2003. Functional classification of proteins for the prediction of cellular function from a protein-protein interaction network. Genome Biology 5, 1, R6
• [Samanta et al, 2003] SAMANTA, M. P. AND LIANG, S. 2003. Predicting protein functions from redundancies in large-scale protein interaction networks. Proc Natl Acad Sci U.S.A. 100, 22, 12579–12583
• [Salwinski et al, 2004] Salwinski L, Miller CS, Smith AJ, Pettit FK, Bowie JU, Eisenberg D (2004) The Database of Interacting Proteins: 2004 update. NAR 32 Database issue:D449-51, http://dip.doe-mbi.ucla.edu/
• [Gavin et al, 2006] Gavin et al, 2006, Proteome survey reveals modularity of the yeast cell machinery, Nature 440, 631-636• [Deane et al, 2002] Deane CM, Salwinski L, Xenarios I, Eisenberg D (2002) Protein interactions: Two methods for
assessment of the reliability of high-throughput observations. Mol Cell Prot 1:349-356