Embed Size (px)
Citation preview
1446 PHYTOPATHOLOGY
Virology
Grapevine leafroll-associated virus 1 Occurs as Genetically Diverse Populations
Olufemi J. Alabi, Maher Al Rwahnih, Gandhi Karthikeyan, Sudarsana Poojari, Marc Fuchs, Adib Rowhani, and Rayapati A. Naidu
First, third, fourth, and seventh authors: Department of Plant Pathology, Irrigated Agriculture Research and Extension Center, Washington State University, Prosser 99350; second and sixth authors: Department of Plant Pathology, University of California, Davis 95616; and fifth author: Department of Plant Pathology and Plant-Microbe Biology, Cornell University, Geneva, NY 14456.
Current address of G. Karthikeyan: Department of Plant Pathology, Centre for Plant Protection Studies, Tamil Nadu Agricultural University, Coimbatore 641 003, India.
Accepted for publication 25 July 2011.
ABSTRACT
Alabi, O. J., Al Rwahnih, M., Karthikeyan, G., Poojari, S., Fuchs, M., Rowhani, A., and Naidu, R. A. 2011. Grapevine leafroll-associated virus 1 occurs as genetically diverse populations. Phytopathology 101:1446-1456.
The genetic diversity of 34 isolates of Grapevine leafroll-associated virus 1 (GLRaV-1) from different wine, table, and ornamental grape cultivars in California, New York, and Washington States in the United States was investigated. Segments of the heat-shock protein 70 homolog (HSP70h) gene, coat protein (CP) gene, coat protein duplicate 2 (CPd2) gene, and open reading frame 9 (p24) were amplified by reverse-tran-scription polymerase chain reaction, cloned, and sequenced. A pairwise comparison of nucleotide sequences revealed intra- and interisolate sequence diversity, with CPd2 and HSP70h being the most and the least divergent, respectively, among the four genomic regions studied. The normalized values for the ratio of nonsynonymous substitutions per
nonsynonymous site to synonymous substitutions per synonymous site indicated different purifying selection pressures acting on each of the four genomic regions, with the CP and CPd2 being subjected to the strongest and weakest functional constraints, respectively. A global phylogenetic analysis of sequences from the four genomic regions revealed segregation of GLRaV-1 isolates into three major clades and a lack of clearly defined clustering by geographical origin. In contrast, only two lineages were apparent when the CP and CPd2 gene sequences were used in phylo-genetic analyses. Putative recombination events were revealed among the HSP70h, CP, and p24 sequences. The genetic landscape of GLRaV-1 populations presented in this study provides a foundation for better understanding of the epidemiology of grapevine leafroll disease across grape-growing regions in the United States. In addition, this study will benefit grape clean plant programs across the country in improving the sanitary status of planting materials provided to nurseries and grape growers.
Since it was first recognized around the middle of the 19th
century, grapevine leafroll disease (GLRD) has gained a world-wide reputation as the most severe disease of grapevines (Vitis vinifera L.). Currently, GLRD accounts for ≈60% of the global losses of grape production due to virus diseases (31), and the impact of the disease on grapevine longevity and quality attributes of berries has been documented in several wine grape cultivars (22,26). GLRD is a complex viral disease producing distinct symptoms in red- and white-berried cultivars, and these symp-toms appear after véraison or the onset of ripening of berries (42). In red-berried cultivars, GLRD-affected grapevines show symp-toms consisting of green veins and interveinal reddening on ma-ture leaves at the bottom portions of canes. In contrast, corre-sponding leaves of white-berried cultivars show mild chlorosis or yellowing. In advanced stages, symptomatic leaves in both types of cultivars show downward rolling of leaf margins. Hence, the disease is called leafroll disease.
Eleven genetically distinct but morphologically similar grape-vine leafroll-associated viruses (GLRaVs,) (family Closteroviridae) have been reported in grapevines affected with GLRD (12,32). The first GLRaV discovered was Grapevine leafroll-associated
virus 1 (GLRaV-1) (genus Ampelovirus) (13). Subsequently, newly characterized GLRaVs were numbered serially as GLRaV-2, -3, -4, and so on in the order of the discovery of the viruses. The majority of GLRaVs (GLRaV-1, -3, -4, -5, -6, -9, and -10) and Grapevine leafroll-associated Carnelian virus (GLRaV-Cn) belong to the genus Ampelovirus while GLRaV-2 is assigned to the genus Closterovirus. GLRaV-7 remains unassigned to any of the genera in the family Closteroviridae and GLRaV-8 is no longer considered a valid species (5). Based on phylogenetic analyses of the complete coat protein (CP) and partial heat-shock protein 70 homolog (HSP70h) genes, grapevine-infecting ampelo-viruses were separated into subgroup I and II, with GLRaV-1 and -3 placed in subgroup II and the others in subgroup I (30).
The GLRaV-1 genome is ≈19.5 kb in size (10), although only ≈12,394 nucleotides from an Australian isolate are available in GenBank (AF195822). Based on the available sequence, the virus genome is organized into 10 open reading frames (ORFs), with each ORF encoding distinct proteins with different functions (10). GLRaV-1 is unique among the GLRaVs in that the virus pos-sesses two diverged copies of the CP gene, as opposed to one in other GLRaVs. In addition to spread via infected planting materials and through grafting of infected scion or rootstock, GLRaV-1 can also be spread by several species of mealybugs and scale insects (13,47).
In recent years, extensive sequence information about grape-vine viruses has been generated in different grape-growing re-gions around the world (GRSPaV: 1,36,39; GFLV: 35,41; GVA: 37). In this regard, very limited information is available in the
Corresponding author: R. A. Naidu; E-mail address: [email protected]
* The e-Xtra logo stands for “electronic extra” and indicates that the online versioncontains one supplementary table and one supplementary figure.
doi:10.1094 / PHYTO-04-11-0114 © 2011 The American Phytopathological Society
e-Xtra*
Vol. 101, No. 12, 2011 1447
literature about the genetic diversity of GLRaVs (11,19,53). This is particularly true with regard to GLRaV-1, the second most economically important virus after GLRaV-3 (13). The only study conducted on the molecular variability of GLRaV-1 suggested that the virus is composed of two groups of sequence variants based on the analysis of sequences derived from the central por-tion of the HSP70h gene of eight isolates from the Czech Repub-lic and Slovakia (23). Because knowledge of genetic variability of GLRaV-1 is essential for the development of reliable diagnostic assays in clean plant programs and for management of GLRD in vineyards, we analyzed the molecular variability of natural popu-lations of the virus collected from California, Washington, and New York, the three leading grape-growing states of the United States, relative to global isolates of GLRaV-1 that have been studied previously. For this purpose, we amplified, cloned, and sequenced the HSP70h, CP, coat protein duplicate 2 (CPd2), and ORF9 (p24) regions of the virus genome (Fig. 1) from 34 isolates. Our results showed a highly variable nature of GLRaV-1 with no geographic structuring and provided a foundation for better understanding the epidemiology of GLRD across grape-growing regions in the United States. The results also provided evidence for contrasting patterns of evolution among the four viral genes with distinct functions, thus offering avenues for further studies in understanding the evolution of GLRaV-1.
MATERIALS AND METHODS
GLRaV-1 isolates. GLRaV-1 isolates analyzed in this study were collected during 2005 to 2010 from different vineyards in the Yakima Valley of Washington State, Finger Lakes region of New York State, and grapevine collections maintained by the Foundation Plant Services (FPS), University of California, Davis. The isolates were collected from a variety of red- and white-
berried table and wine grapevine cultivars as well as from two ornamental grapevine cultivars. Isolates from Washington and New York were derived from own-rooted and grafted vines, re-spectively, growing on commercial vineyards, whereas isolates from California were obtained from own-rooted vines maintained at the FPS vineyard blocks. Available information indicates that the source grapevines of GLRaV-1 isolates at FPS came originally from grafted vines collected from different sources worldwide prior to being planted as own-rooted vines at the FPS vineyard blocks. In all, 34 GLRaV-1 isolates (14 from California, 9 from Washington, and 11 from New York) derived from 17 different grapevine cultivars were included in this study (Table 1). The virus derived from a single grapevine is considered as one isolate.
Sample preparation, total RNA extraction, and reverse-transcription polymerase chain reaction. Sample extraction and RNA isolations from petiole samples were done as described previously (1). To minimize possible variations due to uneven distribution of the virus in infected tissues, leaf petioles were randomly collected from different parts of individual vines and pooled for nucleic acid extractions. Primers were designed based on aligned sequences of GLRaV-1 isolates available in databases to amplify four distinct regions of the GLRaV-1 genome, includ-ing segments of the HSP70h, CP, and CPd2 genes and p24. The primer names, sequence, position on the GLRaV-1 genome, and expected size of amplified products are provided in Table 2. Total RNA extracts of samples from Washington and New York were used directly for one-tube single-step reverse-transcription poly-merase chain reaction (RT-PCR) assay (43) to amplify DNA frag-ments specific to the four genes of different GLRaV-1 isolates. Due to relatively low concentrations, total RNA extracts of samples from California were subjected to a two-step RT-PCR with cDNAs synthesized using random hexamers (300 ng/µl) (Invitrogen Corp., Carlsbad, CA) first and then using gene-
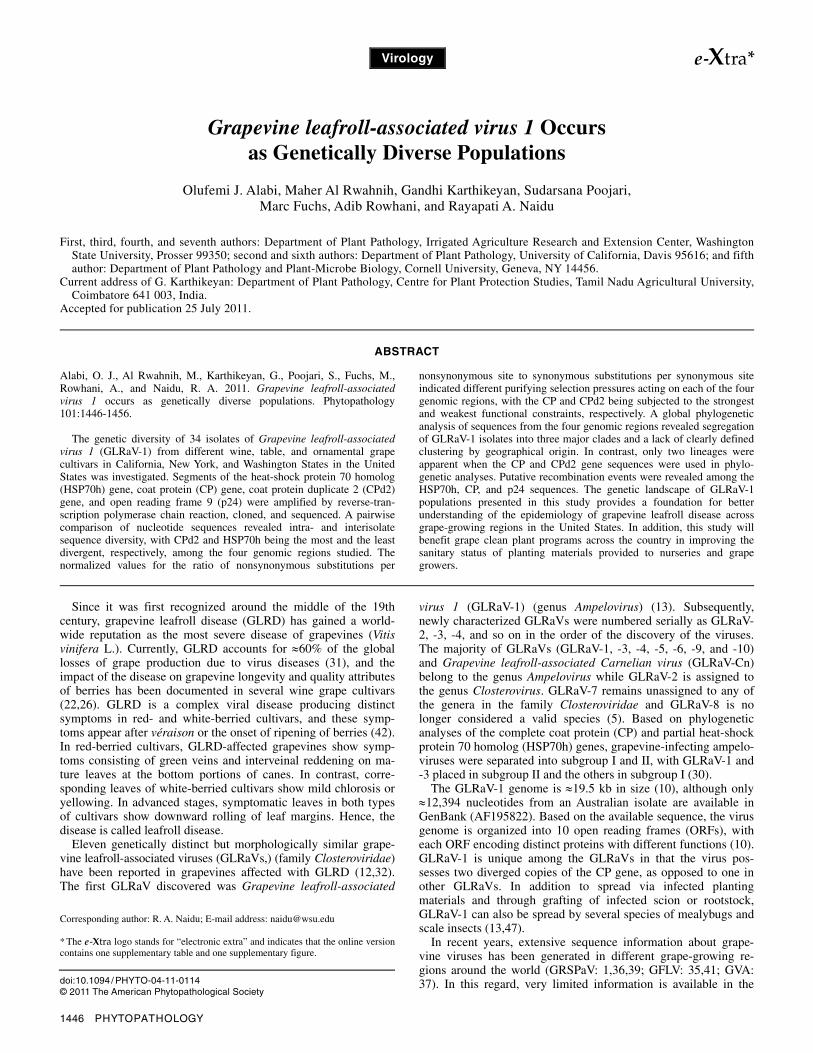
Fig. 1. Genome map of Grapevine leafroll-associated virus 1 (top) showing the positions of different open reading frames (open boxes) and their putative proteinproducts and (bottom) agarose gel electrophoresis of gene-specific reverse-transcription polymerase chain reaction (RT-PCR) products. Details of gene-specific primers used in RT-PCR, their approximate positions on the virus genome, and size of amplicons are provided in Table 2. The map is drawn based on12,394 nucleotide sequence of an isolate from Australia (AF195822). HEL, RNA helicase; POL, RNA polymerase; p7, 7-kDa protein; HSP70h, heat-shock protein 70 homolog; HSP90h, 90-kDa heat-shock protein homolog; CP, major capsid protein; CPd1, capsid protein duplicate 1; CPd2, capsid protein duplicate 2; p22,22-kDa protein; p24, 24-kDa protein; M1, 100-bp DNA ladder (Invitrogen Corp., Carlsbad, CA); +, sample from virus-infected grapevine; –, sample from virus-free grapevine; M2, 1-Kb Plus DNA ladder (Invitrogen Corp.).
1448 PHYTOPATHOLOGY
specific primers for PCR as described above. Size specificity of the amplicons were verified by resolving PCR products on 1.5% agarose gels prestained with GelRed followed by visualization under a UV-transilluminator (Biorad Universal Hood; Bio-Rad Laboratories, Hercules, CA).
Cloning, sequencing, and sequence analyses. Gene-specific amplicons from Washington and New York samples were cloned into pCR2.1 (Invitrogen Corp.) vector while those from California were first gel-eluted (Zymoclean kit; Zymo Research, Irvine, CA) prior to cloning into the PGEM-T Easy vector (Promega Corp., Madison, WI). All cloned products were transformed into Escherichia coli and plasmid DNA was purified from positive recombinant clones using the QIAprep spin miniprep kit (Qiagen
Inc., Valencia, CA). Initially, three independent clones per isolate were sequenced in both orientations and a consensus sequence was derived when the three independent clones showed ≥98% identities to exclude in vitro RT-PCR errors. This consensus was termed “unique sequence”. To investigate the possible occurrence of mixtures of distinct sequence variants within individual grapevines, additional clones were sequenced from isolates that showed <98% nucleotide sequence identity between the three initially sequenced clones. Multiple alignments of nucleotide and amino acid sequences were performed using CLUSTAL W (51) and MUSCLE (9), respectively, with default settings from MEGA5 software (50), and sequence identities were obtained using Vector NTI Advance 11 program (Invitrogen Corp.).
TABLE 1. Name, cultivar, GenBank accession number, and other details of isolates analyzed in this studya
Taxon ID Source Cultivar Cultivar type Genomic regionb GenBank accession number
CA2 California Marsanne White wine grape HSP70h, CPd2, p24 JF811882, JF811809, JF811778-9 CA3 California Marsanne White wine grape HSP70h, CPd2, p24 JF811883-4, JF811810-1, JF811776-7 CA6 California Black Seedless Table grape HSP70h, CP, CPd2, p24 JF811885-6, JF811850-1, JF811812-3,
JF811772-5 CA7 California Negrita-S2 Raisin, table, wine HSP70h, CP, CPd2, p24 JF811887-9, JF811852-3, JF811814-5, JF811771 CA8 California Cabernet Red wine grape HSP70h, CPd2 JF811890-1, JF811816-7 CA9 California Chardonnay White wine grape HSP70h, CPd2 JF811892-3 & JF811907, JF811818-20 CA10 California Chardonnay White wine grape CPd2 JF811790-2 CA11 California Zante Currat Wine, table, raisin HSP70h, CP, CPd2, p24 JF811862, JF811833-4, JF811793-6, JF811789 CA16 California Medaur - S1 Table grape HSP70h, CP, CPd2, p24 JF811863-4, JF811835-7, JF811797-9,
JF811786-8 CA17 California Cabernet Sauvignon Red wine grape HSP70h, CP, CPd2, p24 JF811865-8, JF811838-9, JF811800-1, JF811785 CA18 California Chardonnay White wine grape HSP70h, CP, CPd2, p24 JF811869-70, JF811840, JF811802-3, JF811784 CA20 California Audibert Red wine grape HSP70h, CP, CPd2, p24 JF811871-4, JF811841-5, JF811804-5, JF811783 CA21 California Chardonnay White wine grape HSP70h, CP, CPd2, p24 JF811875-8, JF811846-7, JF811806-7,
JF811781-2 CA22 California Pinot noir Red wine grape HSP70h, CP, CPd2, p24 JF811879-81, JF811848-9, JF811808, JF811780 WACV1 Washington Claret vine Ornamental grape HSP70h, CPd2, p24 HQ833473, HQ833475, HQ833477 WARR1 Washington Roger’s Red Jelly, wine,
ornamental grape HSP70h, CP, CPd2, p24
HQ833472, JF811861, HQ833474, HQ833476
WAPN1 Washington Pinot noir Red wine grape HSP70h, CPd2, p24 JF811894, JF811821, JF811770 WAPN2 Washington Pinot noir Red wine grape HSP70h, CPd2, p24 JF811895, JF811822, JF811769 WACS1 Washington Cabernet Sauvignon Red wine grape HSP70h, CPd2, p24 JF811903, JF811829, JF811755 WACH1 Washington Chardonnay White wine grape HSP70h, CPd2, p24 JF811901, JF811827, JF811759 WALM1 Washington Lemberger Table, red wine HSP70h, CP, CPd2, p24 JF811897, JF811858, JF811823, JF811763 WALM2 Washington Lemberger Table, red wine HSP70h, CP, CPd2, p24 JF811902, JF811859, JF811828, JF811757 WACH2 Washington Chardonnnay White wine grape HSP70h, CP, CPd2, p24 JF811904, JF811860, JF811830, JF811754 NYLM1 New York Lemberger Table, red wine grape HSP70h, CP, p24 JF811896, JF811854-5, JF811756 NYLM2 New York Lemberger Table, red wine grape p24 JF811758 & JF811766 NYLM5 New York Lemberger Table, red wine grape p24 JF811768 NYLM6 New York Lemberger Table, red wine grape p24 JF811767 NYLM3 New York Lemberger Table, red wine grape CP, p24 JF811856, JF811765 NYLM4 New York Lemberger Table, red wine grape CP, p24 JF811857, JF811764 NYCH2 New York Chardonnay White wine grape HSP70h, CPd2, p24 JF811900, JF811826, JF811760 NYCH4 New York Chardonnay White wine grape HSP70h, CPd2, p24 JF811898, JF811824, JF811762 NYCH5 New York Chardonnay White wine grape HSP70h, CPd2, p24 JF811899, JF811825, JF811761 NYCH1 New York Chardonnay White wine grape HSP70h, CPd2, p24 JF811905, JF811831, JF811753 NYCH3 New York Chardonnay White wine grape HSP70h, CPd2, p24 JF811906, JF811832, JF811752
a Details of cultivars were obtained from http://www.ngr.ucdavis.edu/varietyview, assessed on 29 December 2010. All the cultivars are of Vitis vinifera, with the exception of Roger’s Red (an interspecific hybrid between wild grape [V. californica] and V. vinifera ‘Alicante Bouschet’) and Claret vine (V. vinifera ‘Purpurea Nana’).
b HSP70h = heat-shock protein 70 homolog, CP = coat protein, CPd2 = coat protein duplicate 2 (CPd2), and p24 = open reading frame 9.
TABLE 2. Name, sequence, genomic position, and expected size of reverse-transcription polymerase chain reaction amplicons generated by gene-specific primers used for studying the genetic diversity of natural populations of Grapevine leafroll-associated virus 1 (GLRaV-1)
Target genea Primer name Sequence (5′–3′) Position on virus genomeb Product size (bp)
HSP70h GLRaV-1-HSP70h/F CAGGCGTCGTTTGTACTGTG 4,125–4,144 540 GLRaV-1 HSP70h/R TCGGACAGCGTTTAAGTTCC 4,645–4,664 … CP GLRaV-1-CP/F CGCGCTTGCAGAGTTTAAGTGGTT 6,957–6,980 734 GLRaV-1 CP/R TCCGTGCTGCATTGCAACTTTCTC 7,667–7,690 … CPd2 GLRaV-1-CPd2/F GTTACGGCCCTTTGTTTATTATGG 9,599–9,622 398 GLRaV-1-CPd2/R CGACCCCTTTATTGTTTGAGTATG 9,973–9,996 … p24 GLRaV-1-p24/F CGATGGCGTCACTTATACCTAAG 11,400–11,422 634 GLRaV-1-p24/R CACACCAAATTGCTAGCGATAGC 12,011–12,033 …
a HSP70h = heat-shock protein 70 homolog, CP = coat protein, CPd2 = coat protein duplicate 2 (CPd2), and p24 = open reading frame 9. b Positions of primers on the genome of GLRaV-1 are based on an isolate from Australia (GenBank accession number AF195822) and depicted in Figure 1.
Vol. 101, No. 12, 2011 1449
Phylogenetic analysis. Nucleotide sequences were aligned and evolutionary relationships among GLRaV-1 sequences inferred using the maximum likelihood (ML) (38), neighbor joining (NJ) (46), and minimum evolution (ME) (45) methods with 1,000 bootstrap replications. All these analyses were conducted in MEGA5. Corresponding sequences of GLRaV-1 isolates available (Supplementary Table 1) were included in these analyses and corresponding sequences of Little cherry virus 2 (AF531505) were used as outgroups.
Estimation of selection pressure on individual genes and population genetic parameters. Using aligned sequences of each data set, gene- and site-specific selection pressures were analyzed using the Datamonkey software (24) (http://www. datamonkey.org/). The ratio of nonsynonymous substitutions per nonsynonymous site (dN) to synonymous substitutions per synonymous site (dS) was calculated as an indicator of natural selection by using four methods for detecting sites under natural selection: single-likelihood ancestor counting, random-effects likelihood, fixed-effects likelihood, and internal fixed-effects likeli-hood. All four methods incorporate a general model of codon substitution, which rules out spurious results based on biased nucleotide frequencies (24). Depending on the statistically sig-nificant normalized dN-dS values (dN-dS divided by the total length of the appropriate tree), the selection pressure was con-sidered negative or purifying (dN-dS < 1), neutral (dN-dS = 1), or diversifying or positive (dN-dS > 1) for each data set. The average evolutionary divergence over sequence pairs was also calculated using the MEGA5 program for the entire gene-specific data set at the intraisolate level and, where possible, within and between the different phylogroups that were identified. The degree of genetic differentiation among gene-specific GLRaV-1 populations sampled from the three geographical areas (California, Washington, and New York) was calculated from Wright’s FST, for which values were 0 to 1.00. FST values can be interpreted as the proportion of genetic diversity that is due to diversity within groups to total diversity, and values of FST > 0.05 suggest a degree of differ-entiation among populations (54). The presence of subdivisions in each gene-specific GLRaV-1 population sampled from the three geographical areas (California, Washington, and New York) was determined from Hudson’s statistic of KST* and Snn (16,17). A value of Snn statistic close to 1 is indicative of high subpopulation differentiation while Snn ≤ 0.5 suggests that random exchange of genetic information has occurred among the different geographi-cal populations being compared (16,21). All three parameters (FST, KST*, and Snn) were estimated using DnaSP software version 5.10.01 (27). The DnaSP software was also used to perform Tajima’s D test of neutrality (49) for each sequence variant group and to examine selection on proteins between GLRaV-1 phylo-groups using the McDonald and Kreitman test of neutrality (34). Tajima’s D test compares nucleotide diversity with the number of segregating sites, which are expected to be equal if mutations are selectively neutral, whereas the McDonald and Kreitman test is a two-population neutrality test that compares the ratio of fixed nonsynonymous to synonymous differences to the ratio of polymorphic nonsynonymous to synonymous differences. For a given comparison of group-specific data set, significant Fisher’s and G-test statistics obtained from the McDonald and Kreitman table indicate that natural selection rather than random processes resulted in the evolution of the two sequence variant groups under comparison (8).
Phylogenetic networks and recombination analyses. Phylo-genetic networks (18) were constructed for each sequence data set because conflicting phylogenetic signals such as recombination and gene reassortments produce networks of sequences rather than strictly bifurcating evolutionary trees. We used the Neighbor-Net method implemented in SplitsTree v4.10 (18) to depict parallel edges between sequences when there are conflicting phylogenetic signals. A rapid screening for recombination events
in each sequence data set was performed using the single break-point scanning (SBP) and genetic algorithm recombination detec-tion (GARD) methods (25) implemented by the Datamonkey software (http://www.datamonkey.org/). Subsequently, sequences were checked for evidence of recombination using the suite of programs included in RDP v.3.44 software (33) with default parameters. Recombination patterns detected by four or more different programs were considered to be statistically significant events (40).
RESULTS
RT-PCR amplification of genomic segments of GLRaV-1 isolates. In total, 34 GLRaV-1 isolates—14 from California, 11 from New York, and 9 from Washington—were analyzed in this study (Table 1). Primers were designed based on consensus se-quences of GLRaV-1 isolates available in GenBank and used for RT-PCR amplification of the HSP70h, CP, CPd2, and p24 genes of ≈540, 734, 398, and 640 bp in size, respectively (Table 2; Fig. 1). A breakdown of amplified gene sequences by source showed a successful amplification of all four gene sequences from 13 isolates (9 from California and 4 from Washington), three gene sequences (HSP70h, CPd2, and p24) from 12 isolates (2 from California, 5 from Washington, and 5 from New York), an addi-tional three gene sequences (HSP70h, CP, and p24) from 1 New York isolate, two gene sequences (HSP70h and CPd2) from 2 California isolates, an additional two gene sequences (CP and p24) from 2 New York isolates, CPd2 from 1 California isolate, and p24 from 3 New York isolates (Table 1). Overall, HSP70h amplicons were obtained for 28 isolates, CP amplicons for 16 isolates, CPd2 amplicons for 28 isolates, and p24 amplicons for 31 isolates.
Nucleotide diversity among four genomic regions of GLRaV-1 isolates. Using the unique sequences derived from each of the genomic region as described above, genetic distances were estimated for each data set by implementing the appropriate models of best fit obtained with the aid of MEGA5 software. The results showed that the overall mean value of nucleotide diversity was 0.128 ± 0.010 for the HSP70h gene (63 sequences: Cali- fornia = 33, New York = 6, Washington = 9, and GenBank = 15), 0.161 ± 0.010 for the CP gene (33 sequences: California = 21, New York = 4, Washington = 4, and GenBank = 4), 0.202 ± 0.015 for the CPd2 gene (46 sequences: California = 31, New York = 5, Washington = 9, and GenBank = 1), and 0.168 ± 0.012 for the p24 gene (42 sequences: California = 19, New York = 12, Wash-ington = 9, and GenBank = 2). Thus, the CPd2 and HSP70h coding regions had the highest and lowest mean value of nucleo-tide diversity, respectively. These results are in agreement with findings of a previous study showing that coding sequences of many of the GLRaV-1-encoded genes are highly variable and that the CPd2 gene is particularly hypervariable (28).
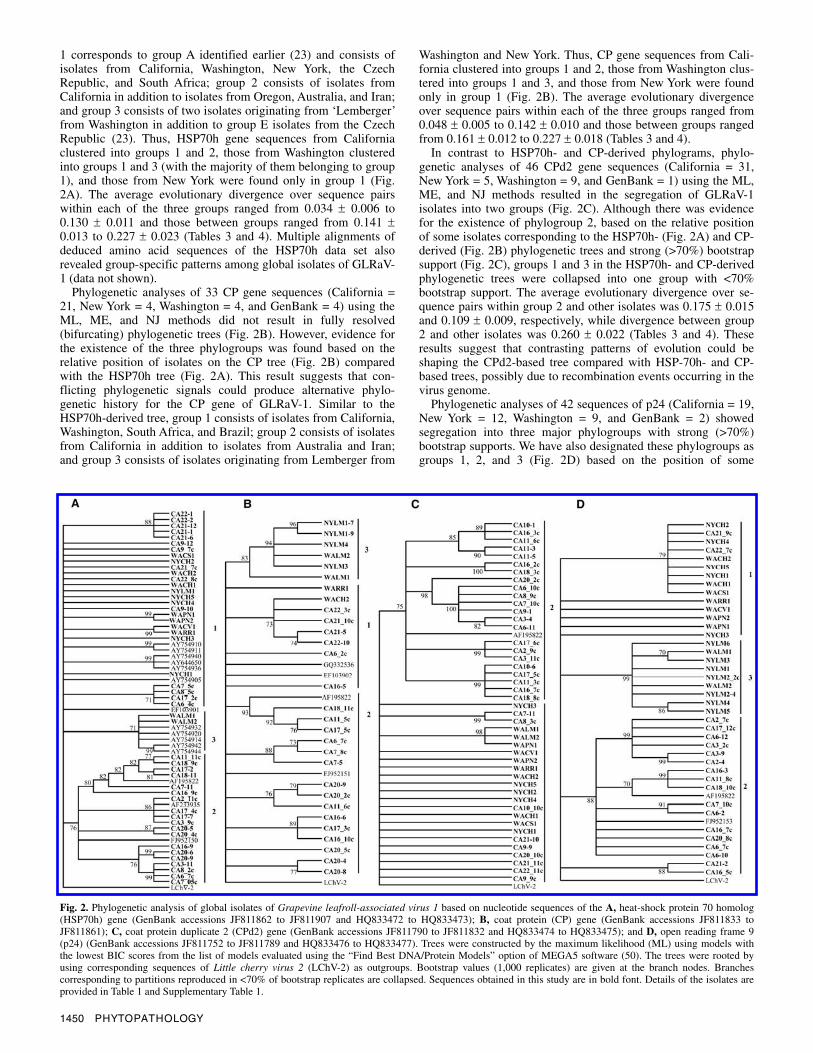
Phylogenetic analysis of GLRaV-1 isolates. To reconstruct the phylogeny of global GLRaV-1 isolates, nucleotide sequences corresponding to four distinct genomic regions of the isolates characterized in this study (Table 1) and those available in GenBank were used. The evolutionary model that best fitted alignments of each gene-specific data set was determined first using the “Find the best DNA/protein models” option of MEGA5 software (50). ML, ME, and NJ trees were then constructed using the model of best fit for each sequence data set. Comparatively similar trees were inferred using all three methods but only the ML phylogenetic trees are shown (Fig. 2).
The 63 HSP70h gene sequences (California = 33, New York = 6, Washington = 9, and GenBank = 15) segregated into three major phylogroups with strong (>70%) bootstrap supports (Fig. 2A). These phylogroups were designated as groups 1, 2, and 3, because no clear evidence of geographical delineation was found among GLRaV-1 sequences, as suggested previously (23). Group
1450 PHYTOPATHOLOGY
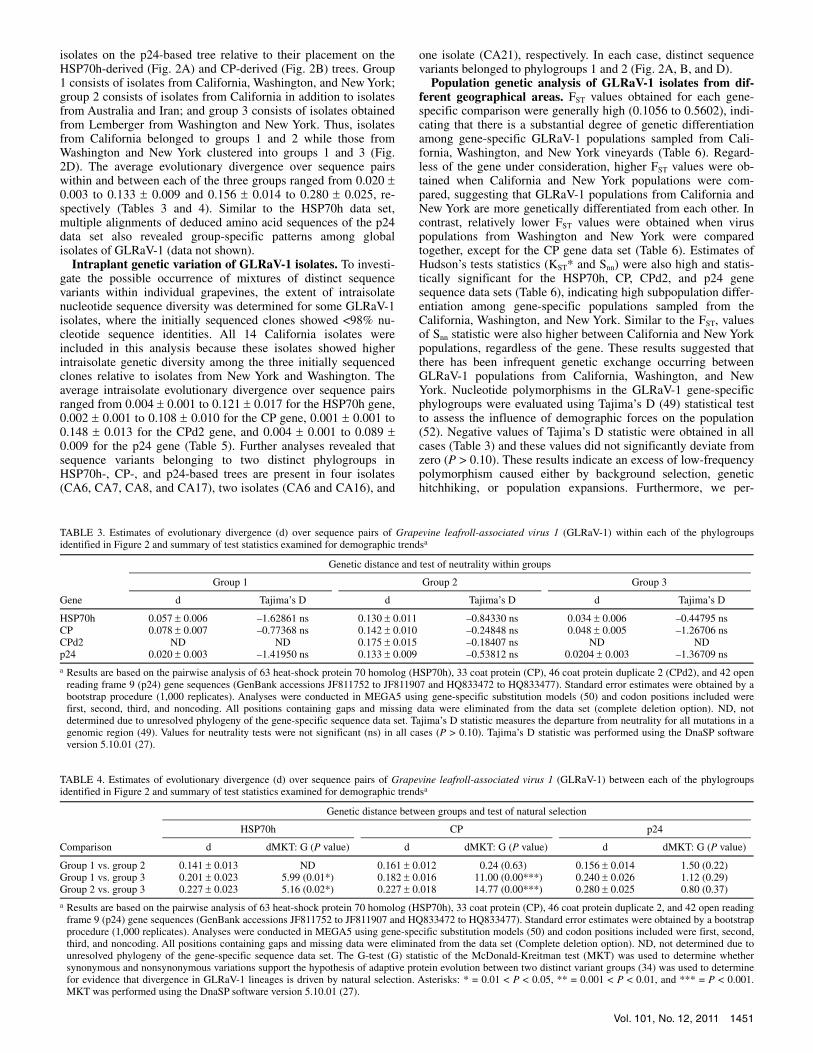
1 corresponds to group A identified earlier (23) and consists of isolates from California, Washington, New York, the Czech Republic, and South Africa; group 2 consists of isolates from California in addition to isolates from Oregon, Australia, and Iran; and group 3 consists of two isolates originating from ‘Lemberger’ from Washington in addition to group E isolates from the Czech Republic (23). Thus, HSP70h gene sequences from California clustered into groups 1 and 2, those from Washington clustered into groups 1 and 3 (with the majority of them belonging to group 1), and those from New York were found only in group 1 (Fig. 2A). The average evolutionary divergence over sequence pairs within each of the three groups ranged from 0.034 ± 0.006 to 0.130 ± 0.011 and those between groups ranged from 0.141 ± 0.013 to 0.227 ± 0.023 (Tables 3 and 4). Multiple alignments of deduced amino acid sequences of the HSP70h data set also revealed group-specific patterns among global isolates of GLRaV-1 (data not shown).
Phylogenetic analyses of 33 CP gene sequences (California = 21, New York = 4, Washington = 4, and GenBank = 4) using the ML, ME, and NJ methods did not result in fully resolved (bifurcating) phylogenetic trees (Fig. 2B). However, evidence for the existence of the three phylogroups was found based on the relative position of isolates on the CP tree (Fig. 2B) compared with the HSP70h tree (Fig. 2A). This result suggests that con-flicting phylogenetic signals could produce alternative phylo-genetic history for the CP gene of GLRaV-1. Similar to the HSP70h-derived tree, group 1 consists of isolates from California, Washington, South Africa, and Brazil; group 2 consists of isolates from California in addition to isolates from Australia and Iran; and group 3 consists of isolates originating from Lemberger from
Washington and New York. Thus, CP gene sequences from Cali-fornia clustered into groups 1 and 2, those from Washington clus-tered into groups 1 and 3, and those from New York were found only in group 1 (Fig. 2B). The average evolutionary divergence over sequence pairs within each of the three groups ranged from 0.048 ± 0.005 to 0.142 ± 0.010 and those between groups ranged from 0.161 ± 0.012 to 0.227 ± 0.018 (Tables 3 and 4).
In contrast to HSP70h- and CP-derived phylograms, phylo-genetic analyses of 46 CPd2 gene sequences (California = 31, New York = 5, Washington = 9, and GenBank = 1) using the ML, ME, and NJ methods resulted in the segregation of GLRaV-1 isolates into two groups (Fig. 2C). Although there was evidence for the existence of phylogroup 2, based on the relative position of some isolates corresponding to the HSP70h- (Fig. 2A) and CP-derived (Fig. 2B) phylogenetic trees and strong (>70%) bootstrap support (Fig. 2C), groups 1 and 3 in the HSP70h- and CP-derived phylogenetic trees were collapsed into one group with <70% bootstrap support. The average evolutionary divergence over se-quence pairs within group 2 and other isolates was 0.175 ± 0.015 and 0.109 ± 0.009, respectively, while divergence between group 2 and other isolates was 0.260 ± 0.022 (Tables 3 and 4). These results suggest that contrasting patterns of evolution could be shaping the CPd2-based tree compared with HSP-70h- and CP-based trees, possibly due to recombination events occurring in the virus genome.
Phylogenetic analyses of 42 sequences of p24 (California = 19, New York = 12, Washington = 9, and GenBank = 2) showed segregation into three major phylogroups with strong (>70%) bootstrap supports. We have also designated these phylogroups as groups 1, 2, and 3 (Fig. 2D) based on the position of some
Fig. 2. Phylogenetic analysis of global isolates of Grapevine leafroll-associated virus 1 based on nucleotide sequences of the A, heat-shock protein 70 homolog (HSP70h) gene (GenBank accessions JF811862 to JF811907 and HQ833472 to HQ833473); B, coat protein (CP) gene (GenBank accessions JF811833 to JF811861); C, coat protein duplicate 2 (CPd2) gene (GenBank accessions JF811790 to JF811832 and HQ833474 to HQ833475); and D, open reading frame 9 (p24) (GenBank accessions JF811752 to JF811789 and HQ833476 to HQ833477). Trees were constructed by the maximum likelihood (ML) using models withthe lowest BIC scores from the list of models evaluated using the “Find Best DNA/Protein Models” option of MEGA5 software (50). The trees were rooted byusing corresponding sequences of Little cherry virus 2 (LChV-2) as outgroups. Bootstrap values (1,000 replicates) are given at the branch nodes. Branchescorresponding to partitions reproduced in <70% of bootstrap replicates are collapsed. Sequences obtained in this study are in bold font. Details of the isolates areprovided in Table 1 and Supplementary Table 1.
Vol. 101, No. 12, 2011 1451
isolates on the p24-based tree relative to their placement on the HSP70h-derived (Fig. 2A) and CP-derived (Fig. 2B) trees. Group 1 consists of isolates from California, Washington, and New York; group 2 consists of isolates from California in addition to isolates from Australia and Iran; and group 3 consists of isolates obtained from Lemberger from Washington and New York. Thus, isolates from California belonged to groups 1 and 2 while those from Washington and New York clustered into groups 1 and 3 (Fig. 2D). The average evolutionary divergence over sequence pairs within and between each of the three groups ranged from 0.020 ± 0.003 to 0.133 ± 0.009 and 0.156 ± 0.014 to 0.280 ± 0.025, re-spectively (Tables 3 and 4). Similar to the HSP70h data set, multiple alignments of deduced amino acid sequences of the p24 data set also revealed group-specific patterns among global isolates of GLRaV-1 (data not shown).
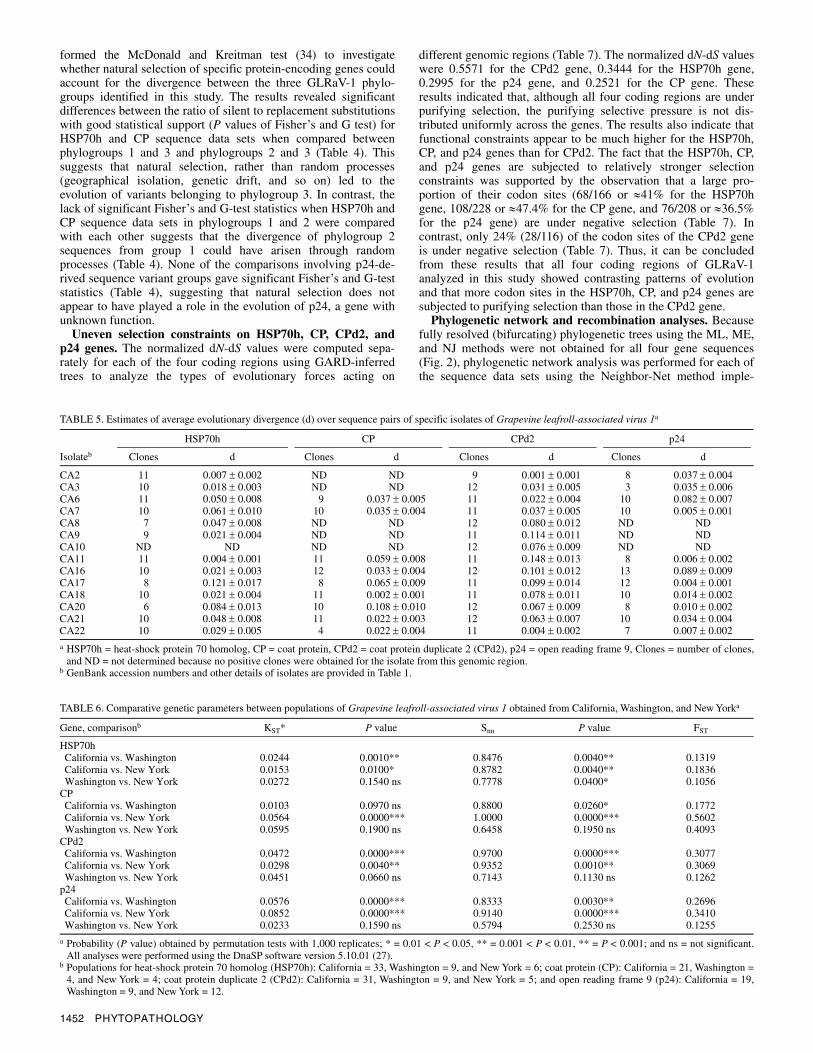
Intraplant genetic variation of GLRaV-1 isolates. To investi-gate the possible occurrence of mixtures of distinct sequence variants within individual grapevines, the extent of intraisolate nucleotide sequence diversity was determined for some GLRaV-1 isolates, where the initially sequenced clones showed <98% nu-cleotide sequence identities. All 14 California isolates were included in this analysis because these isolates showed higher intraisolate genetic diversity among the three initially sequenced clones relative to isolates from New York and Washington. The average intraisolate evolutionary divergence over sequence pairs ranged from 0.004 ± 0.001 to 0.121 ± 0.017 for the HSP70h gene, 0.002 ± 0.001 to 0.108 ± 0.010 for the CP gene, 0.001 ± 0.001 to 0.148 ± 0.013 for the CPd2 gene, and 0.004 ± 0.001 to 0.089 ± 0.009 for the p24 gene (Table 5). Further analyses revealed that sequence variants belonging to two distinct phylogroups in HSP70h-, CP-, and p24-based trees are present in four isolates (CA6, CA7, CA8, and CA17), two isolates (CA6 and CA16), and
one isolate (CA21), respectively. In each case, distinct sequence variants belonged to phylogroups 1 and 2 (Fig. 2A, B, and D).
Population genetic analysis of GLRaV-1 isolates from dif-ferent geographical areas. FST values obtained for each gene-specific comparison were generally high (0.1056 to 0.5602), indi-cating that there is a substantial degree of genetic differentiation among gene-specific GLRaV-1 populations sampled from Cali-fornia, Washington, and New York vineyards (Table 6). Regard-less of the gene under consideration, higher FST values were ob-tained when California and New York populations were com-pared, suggesting that GLRaV-1 populations from California and New York are more genetically differentiated from each other. In contrast, relatively lower FST values were obtained when virus populations from Washington and New York were compared together, except for the CP gene data set (Table 6). Estimates of Hudson’s tests statistics (KST* and Snn) were also high and statis-tically significant for the HSP70h, CP, CPd2, and p24 gene sequence data sets (Table 6), indicating high subpopulation differ-entiation among gene-specific populations sampled from the California, Washington, and New York. Similar to the FST, values of Snn statistic were also higher between California and New York populations, regardless of the gene. These results suggested that there has been infrequent genetic exchange occurring between GLRaV-1 populations from California, Washington, and New York. Nucleotide polymorphisms in the GLRaV-1 gene-specific phylogroups were evaluated using Tajima’s D (49) statistical test to assess the influence of demographic forces on the population (52). Negative values of Tajima’s D statistic were obtained in all cases (Table 3) and these values did not significantly deviate from zero (P > 0.10). These results indicate an excess of low-frequency polymorphism caused either by background selection, genetic hitchhiking, or population expansions. Furthermore, we per-
TABLE 4. Estimates of evolutionary divergence (d) over sequence pairs of Grapevine leafroll-associated virus 1 (GLRaV-1) between each of the phylogroups identified in Figure 2 and summary of test statistics examined for demographic trendsa
Genetic distance between groups and test of natural selection
HSP70h CP p24
Comparison d dMKT: G (P value) d dMKT: G (P value) d dMKT: G (P value)
Group 1 vs. group 2 0.141 ± 0.013 ND 0.161 ± 0.012 0.24 (0.63) 0.156 ± 0.014 1.50 (0.22) Group 1 vs. group 3 0.201 ± 0.023 5.99 (0.01*) 0.182 ± 0.016 11.00 (0.00***) 0.240 ± 0.026 1.12 (0.29) Group 2 vs. group 3 0.227 ± 0.023 5.16 (0.02*) 0.227 ± 0.018 14.77 (0.00***) 0.280 ± 0.025 0.80 (0.37)
a Results are based on the pairwise analysis of 63 heat-shock protein 70 homolog (HSP70h), 33 coat protein (CP), 46 coat protein duplicate 2, and 42 open readingframe 9 (p24) gene sequences (GenBank accessions JF811752 to JF811907 and HQ833472 to HQ833477). Standard error estimates were obtained by a bootstrap procedure (1,000 replicates). Analyses were conducted in MEGA5 using gene-specific substitution models (50) and codon positions included were first, second, third, and noncoding. All positions containing gaps and missing data were eliminated from the data set (Complete deletion option). ND, not determined due to unresolved phylogeny of the gene-specific sequence data set. The G-test (G) statistic of the McDonald-Kreitman test (MKT) was used to determine whether synonymous and nonsynonymous variations support the hypothesis of adaptive protein evolution between two distinct variant groups (34) was used to determinefor evidence that divergence in GLRaV-1 lineages is driven by natural selection. Asterisks: * = 0.01 < P < 0.05, ** = 0.001 < P < 0.01, and *** = P < 0.001. MKT was performed using the DnaSP software version 5.10.01 (27).
TABLE 3. Estimates of evolutionary divergence (d) over sequence pairs of Grapevine leafroll-associated virus 1 (GLRaV-1) within each of the phylogroups identified in Figure 2 and summary of test statistics examined for demographic trendsa
Genetic distance and test of neutrality within groups
Group 1 Group 2 Group 3
Gene d Tajima’s D d Tajima’s D d Tajima’s D
HSP70h 0.057 ± 0.006 –1.62861 ns 0.130 ± 0.011 –0.84330 ns 0.034 ± 0.006 –0.44795 ns CP 0.078 ± 0.007 –0.77368 ns 0.142 ± 0.010 –0.24848 ns 0.048 ± 0.005 –1.26706 ns CPd2 ND ND 0.175 ± 0.015 –0.18407 ns ND ND p24 0.020 ± 0.003 –1.41950 ns 0.133 ± 0.009 –0.53812 ns 0.0204 ± 0.003 –1.36709 ns
a Results are based on the pairwise analysis of 63 heat-shock protein 70 homolog (HSP70h), 33 coat protein (CP), 46 coat protein duplicate 2 (CPd2), and 42 openreading frame 9 (p24) gene sequences (GenBank accessions JF811752 to JF811907 and HQ833472 to HQ833477). Standard error estimates were obtained by a bootstrap procedure (1,000 replicates). Analyses were conducted in MEGA5 using gene-specific substitution models (50) and codon positions included were first, second, third, and noncoding. All positions containing gaps and missing data were eliminated from the data set (complete deletion option). ND, not determined due to unresolved phylogeny of the gene-specific sequence data set. Tajima’s D statistic measures the departure from neutrality for all mutations in a genomic region (49). Values for neutrality tests were not significant (ns) in all cases (P > 0.10). Tajima’s D statistic was performed using the DnaSP software version 5.10.01 (27).
1452 PHYTOPATHOLOGY
formed the McDonald and Kreitman test (34) to investigate whether natural selection of specific protein-encoding genes could account for the divergence between the three GLRaV-1 phylo-groups identified in this study. The results revealed significant differences between the ratio of silent to replacement substitutions with good statistical support (P values of Fisher’s and G test) for HSP70h and CP sequence data sets when compared between phylogroups 1 and 3 and phylogroups 2 and 3 (Table 4). This suggests that natural selection, rather than random processes (geographical isolation, genetic drift, and so on) led to the evolution of variants belonging to phylogroup 3. In contrast, the lack of significant Fisher’s and G-test statistics when HSP70h and CP sequence data sets in phylogroups 1 and 2 were compared with each other suggests that the divergence of phylogroup 2 sequences from group 1 could have arisen through random processes (Table 4). None of the comparisons involving p24-de-rived sequence variant groups gave significant Fisher’s and G-test statistics (Table 4), suggesting that natural selection does not appear to have played a role in the evolution of p24, a gene with unknown function.
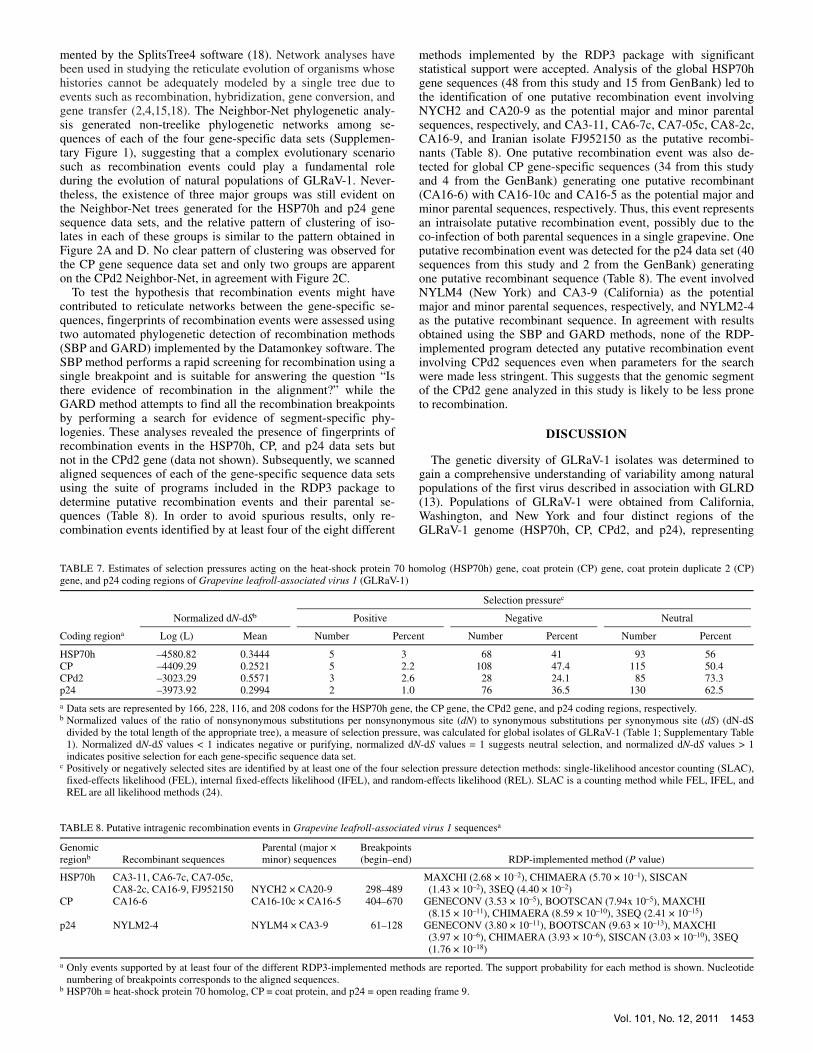
Uneven selection constraints on HSP70h, CP, CPd2, and p24 genes. The normalized dN-dS values were computed sepa-rately for each of the four coding regions using GARD-inferred trees to analyze the types of evolutionary forces acting on
different genomic regions (Table 7). The normalized dN-dS values were 0.5571 for the CPd2 gene, 0.3444 for the HSP70h gene, 0.2995 for the p24 gene, and 0.2521 for the CP gene. These results indicated that, although all four coding regions are under purifying selection, the purifying selective pressure is not dis-tributed uniformly across the genes. The results also indicate that functional constraints appear to be much higher for the HSP70h, CP, and p24 genes than for CPd2. The fact that the HSP70h, CP, and p24 genes are subjected to relatively stronger selection constraints was supported by the observation that a large pro-portion of their codon sites (68/166 or ≈41% for the HSP70h gene, 108/228 or ≈47.4% for the CP gene, and 76/208 or ≈36.5% for the p24 gene) are under negative selection (Table 7). In contrast, only 24% (28/116) of the codon sites of the CPd2 gene is under negative selection (Table 7). Thus, it can be concluded from these results that all four coding regions of GLRaV-1 analyzed in this study showed contrasting patterns of evolution and that more codon sites in the HSP70h, CP, and p24 genes are subjected to purifying selection than those in the CPd2 gene.
Phylogenetic network and recombination analyses. Because fully resolved (bifurcating) phylogenetic trees using the ML, ME, and NJ methods were not obtained for all four gene sequences (Fig. 2), phylogenetic network analysis was performed for each of the sequence data sets using the Neighbor-Net method imple-
TABLE 5. Estimates of average evolutionary divergence (d) over sequence pairs of specific isolates of Grapevine leafroll-associated virus 1a
HSP70h CP CPd2 p24
Isolateb Clones d Clones d Clones d Clones d
CA2 11 0.007 ± 0.002 ND ND 9 0.001 ± 0.001 8 0.037 ± 0.004 CA3 10 0.018 ± 0.003 ND ND 12 0.031 ± 0.005 3 0.035 ± 0.006 CA6 11 0.050 ± 0.008 9 0.037 ± 0.005 11 0.022 ± 0.004 10 0.082 ± 0.007 CA7 10 0.061 ± 0.010 10 0.035 ± 0.004 11 0.037 ± 0.005 10 0.005 ± 0.001 CA8 7 0.047 ± 0.008 ND ND 12 0.080 ± 0.012 ND ND CA9 9 0.021 ± 0.004 ND ND 11 0.114 ± 0.011 ND ND CA10 ND ND ND ND 12 0.076 ± 0.009 ND ND CA11 11 0.004 ± 0.001 11 0.059 ± 0.008 11 0.148 ± 0.013 8 0.006 ± 0.002 CA16 10 0.021 ± 0.003 12 0.033 ± 0.004 12 0.101 ± 0.012 13 0.089 ± 0.009 CA17 8 0.121 ± 0.017 8 0.065 ± 0.009 11 0.099 ± 0.014 12 0.004 ± 0.001 CA18 10 0.021 ± 0.004 11 0.002 ± 0.001 11 0.078 ± 0.011 10 0.014 ± 0.002 CA20 6 0.084 ± 0.013 10 0.108 ± 0.010 12 0.067 ± 0.009 8 0.010 ± 0.002 CA21 10 0.048 ± 0.008 11 0.022 ± 0.003 12 0.063 ± 0.007 10 0.034 ± 0.004 CA22 10 0.029 ± 0.005 4 0.022 ± 0.004 11 0.004 ± 0.002 7 0.007 ± 0.002
a HSP70h = heat-shock protein 70 homolog, CP = coat protein, CPd2 = coat protein duplicate 2 (CPd2), p24 = open reading frame 9, Clones = number of clones, and ND = not determined because no positive clones were obtained for the isolate from this genomic region.
b GenBank accession numbers and other details of isolates are provided in Table 1.
TABLE 6. Comparative genetic parameters between populations of Grapevine leafroll-associated virus 1 obtained from California, Washington, and New Yorka
Gene, comparisonb KST* P value Snn P value FST
HSP70h California vs. Washington 0.0244 0.0010** 0.8476 0.0040** 0.1319 California vs. New York 0.0153 0.0100* 0.8782 0.0040** 0.1836 Washington vs. New York 0.0272 0.1540 ns 0.7778 0.0400* 0.1056
CP California vs. Washington 0.0103 0.0970 ns 0.8800 0.0260* 0.1772 California vs. New York 0.0564 0.0000*** 1.0000 0.0000*** 0.5602 Washington vs. New York 0.0595 0.1900 ns 0.6458 0.1950 ns 0.4093
CPd2 California vs. Washington 0.0472 0.0000*** 0.9700 0.0000*** 0.3077 California vs. New York 0.0298 0.0040** 0.9352 0.0010** 0.3069 Washington vs. New York 0.0451 0.0660 ns 0.7143 0.1130 ns 0.1262
p24 California vs. Washington 0.0576 0.0000*** 0.8333 0.0030** 0.2696 California vs. New York 0.0852 0.0000*** 0.9140 0.0000*** 0.3410 Washington vs. New York 0.0233 0.1590 ns 0.5794 0.2530 ns 0.1255
a Probability (P value) obtained by permutation tests with 1,000 replicates; * = 0.01 < P < 0.05, ** = 0.001 < P < 0.01, ** = P < 0.001; and ns = not significant. All analyses were performed using the DnaSP software version 5.10.01 (27).
b Populations for heat-shock protein 70 homolog (HSP70h): California = 33, Washington = 9, and New York = 6; coat protein (CP): California = 21, Washington =4, and New York = 4; coat protein duplicate 2 (CPd2): California = 31, Washington = 9, and New York = 5; and open reading frame 9 (p24): California = 19,Washington = 9, and New York = 12.
Vol. 101, No. 12, 2011 1453
mented by the SplitsTree4 software (18). Network analyses have been used in studying the reticulate evolution of organisms whose histories cannot be adequately modeled by a single tree due to events such as recombination, hybridization, gene conversion, and gene transfer (2,4,15,18). The Neighbor-Net phylogenetic analy-sis generated non-treelike phylogenetic networks among se-quences of each of the four gene-specific data sets (Supplemen-tary Figure 1), suggesting that a complex evolutionary scenario such as recombination events could play a fundamental role during the evolution of natural populations of GLRaV-1. Never-theless, the existence of three major groups was still evident on the Neighbor-Net trees generated for the HSP70h and p24 gene sequence data sets, and the relative pattern of clustering of iso-lates in each of these groups is similar to the pattern obtained in Figure 2A and D. No clear pattern of clustering was observed for the CP gene sequence data set and only two groups are apparent on the CPd2 Neighbor-Net, in agreement with Figure 2C.
To test the hypothesis that recombination events might have contributed to reticulate networks between the gene-specific se-quences, fingerprints of recombination events were assessed using two automated phylogenetic detection of recombination methods (SBP and GARD) implemented by the Datamonkey software. The SBP method performs a rapid screening for recombination using a single breakpoint and is suitable for answering the question “Is there evidence of recombination in the alignment?” while the GARD method attempts to find all the recombination breakpoints by performing a search for evidence of segment-specific phy-logenies. These analyses revealed the presence of fingerprints of recombination events in the HSP70h, CP, and p24 data sets but not in the CPd2 gene (data not shown). Subsequently, we scanned aligned sequences of each of the gene-specific sequence data sets using the suite of programs included in the RDP3 package to determine putative recombination events and their parental se-quences (Table 8). In order to avoid spurious results, only re-combination events identified by at least four of the eight different
methods implemented by the RDP3 package with significant statistical support were accepted. Analysis of the global HSP70h gene sequences (48 from this study and 15 from GenBank) led to the identification of one putative recombination event involving NYCH2 and CA20-9 as the potential major and minor parental sequences, respectively, and CA3-11, CA6-7c, CA7-05c, CA8-2c, CA16-9, and Iranian isolate FJ952150 as the putative recombi-nants (Table 8). One putative recombination event was also de-tected for global CP gene-specific sequences (34 from this study and 4 from the GenBank) generating one putative recombinant (CA16-6) with CA16-10c and CA16-5 as the potential major and minor parental sequences, respectively. Thus, this event represents an intraisolate putative recombination event, possibly due to the co-infection of both parental sequences in a single grapevine. One putative recombination event was detected for the p24 data set (40 sequences from this study and 2 from the GenBank) generating one putative recombinant sequence (Table 8). The event involved NYLM4 (New York) and CA3-9 (California) as the potential major and minor parental sequences, respectively, and NYLM2-4 as the putative recombinant sequence. In agreement with results obtained using the SBP and GARD methods, none of the RDP-implemented program detected any putative recombination event involving CPd2 sequences even when parameters for the search were made less stringent. This suggests that the genomic segment of the CPd2 gene analyzed in this study is likely to be less prone to recombination.
DISCUSSION
The genetic diversity of GLRaV-1 isolates was determined to gain a comprehensive understanding of variability among natural populations of the first virus described in association with GLRD (13). Populations of GLRaV-1 were obtained from California, Washington, and New York and four distinct regions of the GLRaV-1 genome (HSP70h, CP, CPd2, and p24), representing
TABLE 7. Estimates of selection pressures acting on the heat-shock protein 70 homolog (HSP70h) gene, coat protein (CP) gene, coat protein duplicate 2 (CP)gene, and p24 coding regions of Grapevine leafroll-associated virus 1 (GLRaV-1)
Selection pressurec
Normalized dN-dSb Positive Negative Neutral
Coding regiona Log (L) Mean Number Percent Number Percent Number Percent
HSP70h –4580.82 0.3444 5 3 68 41 93 56 CP –4409.29 0.2521 5 2.2 108 47.4 115 50.4 CPd2 –3023.29 0.5571 3 2.6 28 24.1 85 73.3 p24 –3973.92 0.2994 2 1.0 76 36.5 130 62.5
a Data sets are represented by 166, 228, 116, and 208 codons for the HSP70h gene, the CP gene, the CPd2 gene, and p24 coding regions, respectively. b Normalized values of the ratio of nonsynonymous substitutions per nonsynonymous site (dN) to synonymous substitutions per synonymous site (dS) (dN-dS
divided by the total length of the appropriate tree), a measure of selection pressure, was calculated for global isolates of GLRaV-1 (Table 1; Supplementary Table 1). Normalized dN-dS values < 1 indicates negative or purifying, normalized dN-dS values = 1 suggests neutral selection, and normalized dN-dS values > 1 indicates positive selection for each gene-specific sequence data set.
c Positively or negatively selected sites are identified by at least one of the four selection pressure detection methods: single-likelihood ancestor counting (SLAC), fixed-effects likelihood (FEL), internal fixed-effects likelihood (IFEL), and random-effects likelihood (REL). SLAC is a counting method while FEL, IFEL, and REL are all likelihood methods (24).
TABLE 8. Putative intragenic recombination events in Grapevine leafroll-associated virus 1 sequencesa
Genomic regionb
Recombinant sequences
Parental (major × minor) sequences
Breakpoints (begin–end)
RDP-implemented method (P value)
HSP70h CA3-11, CA6-7c, CA7-05c, CA8-2c, CA16-9, FJ952150
NYCH2 × CA20-9
298–489
MAXCHI (2.68 × 10⁻²), CHIMAERA (5.70 × 10⁻¹), SISCAN (1.43 × 10⁻²), 3SEQ (4.40 × 10⁻²)
CP CA16-6 CA16-10c × CA16-5 404–670 GENECONV (3.53 × 10⁻⁵), BOOTSCAN (7.94x 10⁻⁵), MAXCHI (8.15 × 10⁻¹¹), CHIMAERA (8.59 × 10⁻¹⁰), 3SEQ (2.41 × 10⁻¹⁵)
p24 NYLM2-4 NYLM4 × CA3-9 61–128 GENECONV (3.80 × 10⁻¹¹), BOOTSCAN (9.63 × 10⁻¹³), MAXCHI (3.97 × 10⁻⁶), CHIMAERA (3.93 × 10⁻⁶), SISCAN (3.03 × 10⁻¹⁰), 3SEQ (1.76 × 10⁻¹⁸)
a Only events supported by at least four of the different RDP3-implemented methods are reported. The support probability for each method is shown. Nucleotidenumbering of breakpoints corresponds to the aligned sequences.
b HSP70h = heat-shock protein 70 homolog, CP = coat protein, and p24 = open reading frame 9.
1454 PHYTOPATHOLOGY
≈18.6% of the currently available 12,394 nucleotides of the GLRaV-1 genome (AF195822) were characterized by RT-PCR, cloning, and sequencing. Sequences of corresponding genomic regions of isolates for which information is available in GenBank were also included in these analyses. GLRaV-1 isolates charac-terized in our study were from wine (red- and white-berried), table (‘Black Seedless’ and ‘Medaur’), and ornamental (‘Roger’s Red’ and ‘Claret vine’) grapevine cultivars. Because the previous study focused solely on wine grape cultivars (23), our results from different types of grapevines have expanded the knowledge of GLRaV-1 variability for practical applications in grapevine cultivation.
The data presented in this study support the segregation of global GLRaV-1 isolates mainly into three distinct variant groups based on the partial HSP70h and entire p24 gene sequence data sets (Fig. 2A and D). Based on partial nucleotide sequences of the HSP70h gene, GLRaV-1 isolates were reported previously to consist of two distinct variant groups that were tentatively desig-nated as groups A (American-Australian) and E (European) (23). In contrast, we found no evidence for clearly defined geographi-cal structuring of GLRaV-1 isolates among the three phylogroups, designated in this study as groups 1, 2, and 3. Such a lack of geo-graphical structuring has also been reported for other grapevine viruses (1,19,53), possibly as a consequence of their dissemina-tion primarily through infected grapevine cuttings. An assessment of population genetic parameters showed considerably higher estimates of genetic distance between the three phylogroups rela-tive to lower genetic diversity values within each group (Tables 3 and 4), thus providing further support for the segregation of GLRaV-1 isolates into three phylogroups. Furthermore, results of the MacDonald and Kreitman test indicate that, although HSP70h and CP gene-derived sequence variants of phylogroup 3 could be “evolving” differently from group 1 and 2 variants due to natural selection, genetic isolation and random drift could be shaping phylogenetic separation of group 1 and 2 isolates from each other. However, the partitioning of GLRaV-1 sequences into the three groups is not apparent on the CP- and CPd2-derived phylogenetic trees (Fig. 2B and C), suggesting that conflicting phylogenetic signals such as recombination could exist within sequence data sets of both genes. The presence of such conflicting phylogenetic signals was also supported by reticulate networks existing especially among sequences of CP and CPd2 genes. Therefore, it would seem appropriate to use both the HSP70h and p24 gene sequences as the best representation of the phylogeny of GLRaV-1 variants, because both gene sequences provided mutually supportive phylogenies (Fig. 2).
Functional constraints on the evolution of the HSP70h, CP, CPd2, and p24 genes of GLRaV-1 were analyzed by determining the normalized dN-dS values, an indicator of natural selection. Our analyses indicate that the four genes are under strong selection pressure to preserve their encoded amino acid sequences and biological functions. The CP gene had the lowest mean nor-malized dN-dS values, suggesting that it is under stronger purify-ing selection pressure. In fact, 47.4 and 50.4% of the 228 CP codon sites were negatively and neutrally selected, respectively (Table 7). A recent study with GLRaV-3 has also indicated con-trasting patterns of selective pressures across genomic regions, with CP subjected to the strongest constraint (53). Because both GLRaV-1 and -3 are transmitted by species of mealybugs and scale insects (13,47), it is likely that functional constraints are imposed on the CP of these Ampelovirus spp. as reported for other insect-transmitted viruses (3,44). In addition, functional con-straints could be imposed on the CP due to its role in particle formation. In contrast, the CPd2 gene of GLRaV-1 had the highest normalized dN-dS value and only 24.1% of the 116 CPd2 codon sites were negatively selected (Table 7). Thus, it is likely that the CPd2 of GLRaV-1 is relatively flexible to accommodate nonsynonymous changes, in agreement with a previous study (28).
This study, together with the data from Komínek et al. (23), clearly showed that grapevines, due to their perennial nature, can harbor genetically diverse but closely related GLRaV-1 popula-tions, often termed “quasi-species”, in a single plant. These sequence variants, frequently generated owing to the error-prone nature of the viral RNA-dependent RNA polymerase (6,48), can accumulate with time due to clonal propagation and be dissemi-nated via cuttings into new areas, causing a sustained threat to the grapevine industry in the affected areas. The preponderance of such sequence variant mixtures in California isolates is note-worthy. Available information indicates that the source vines of California isolates were obtained initially from field-collected grafted grapevines from different sources within and outside of the United States prior to their establishment at the FPS as own-rooted vines. Therefore, it is likely that California isolates could be harboring distinct variants as mixed infections derived from mother plant scion cultivars and rootstocks, as exemplified recently with GRSPaV (1), thereby increasing the diversity of GLRaV-1 populations within a grapevine. The relatively high values of within-isolate genetic diversity observed for some of the California isolates analyzed in this study (Table 5) support this argument. Because grapevine is the only known natural host of GLRaV-1 and due to the lack of resistance to the virus in Vitis spp., this study, from a practical perspective, provides a founda-tion for optimizing diagnostic assays to intercept the dissemi-nation of new variants in clean plant programs as well as under-standing shifts in the genetic diversity of existing variants as a consequence of exchange of planting materials between the grape-growing regions and spread by resident mealybug or scale insect vector species present in local vineyard blocks.
A recent study has shown that viral variants can occur in a single perennial plant as spatially distributed populations (20). In this context, our study did not investigate whether GLRaV-1 variants occur as spatially separated variants within a grapevine to elucidate whether the spatial separation of different viral popu-lations may be a more common phenomenon in perennial hosts. Nevertheless, spatial separation patterns documented within a host tree for three different genera of viruses—Apple stem grooving virus in apple (29), Citrus tristeza virus in citrus (7), and Plum pox virus in peach (20)—would suggest that this may be a common phenomenon in perennial woody plant species such as grapevine, as opposed to the scarcity of such events documented in annual plants (14). Further investigations need to be conducted to under-stand the epidemiological significance and the fitness advantages of spatial separation of GLRaV-1 variants in different parts of an infected grapevine on transmission by mealybugs and scale insects.
In conclusion, this is the most comprehensive study of the genetic diversity of GLRaV-1 to date and our results provided evidence that GLRaV-1 occurs as genetically distinct variants in the three leading grapevine-producing states of the United States. The data also showed evidence for contrasting patterns of evolution in four viral genes with distinct functions, thus pro-viding a foundation for further studies in understanding the evolution of GLRaV-1. Although the biological and epidemio-logical implications of genetic diversity of GLRaV-1 are yet to be elucidated, the results contribute to an increased understanding of the spectrum of genetic diversity among GLRaVs and provide avenues for the development of robust strategies for mitigating the negative impacts of GLRD on the sustainability of the wine grape industry in the country. The knowledge of genetic variability in GLRaV-1 obtained in this study will also benefit grape clean plant programs across the country in improving the sanitary status of planting materials provided to nurseries and grape growers.
ACKNOWLEDGMENTS
This work was supported, in part, by Washington State University’s Agricultural Research Center and Extension Team-based internal
Vol. 101, No. 12, 2011 1455
competitive grants, Members of the Wine Advisory Committee of the Washington Wine Commission, United States Department of Agriculture (USDA) Agricultural Research Service Northwest Center for Small Fruits Research, USDA-NIFA Viticulture Consortium-West, and USDA-NIFA Specialty Crop Research Initiative Award Number 2009-51181-06027. PPNS number 0571, Department of Plant Pathology, College of Agri-cultural, Human, and Natural Resource Sciences, Agricultural Research Center Project Number WNPO 0616, Washington State University, Pullman 99164-6240. We thank R. Larsen and S. Adkins and the two anonymous reviewers for valuable suggestions.
LITERATURE CITED
1. Alabi, O. J., Martin, R. R., and Naidu, R. A. 2010. Sequence diversity, population genetics and potential recombination events in Grapevine rupestris stem pitting-associated virus in Pacific North-West vineyards. J. Gen. Virol. 91:265-276.
2. Bryant, D., and Moulton, V. 2004. NeighborNet: an agglomerative algorithm for the construction of phylogenetic networks. Mol. Biol. Evol. 21:255-265.
3. Chare, E. R., and Holmes, E. C. 2004. Selection pressures in the capsid genes of plant RNA viruses reflect mode of transmission. J. Gen. Virol. 85:3149-3157.
4. Codoñer, F. M., and Elena, S. F. 2008. The promiscuous evolutionary history of the family Bromoviridae. J. Gen. Virol. 89:1739-1747.
5. Dolja, V. V. 2009. New developments in understanding gene functions and evolution of the grapevine closteroviruses. Pages 29-31 in: Extended Abstr. 16th Meet. ICVG. Dijon, France.
6. Drake, J. W., and Holland, J. J. 1999. Mutation rates among RNA viruses. Proc. Natl. Acad. Sci. USA 96:13910-13913.
7. D’Urso, F., Ayllòn, M. A., Rubio, L., Sambade, A., Hermeso de Mendoza, A., Guerri, J., and Moreno, P. 2000. Contribution of uneven distribution of genomic RNA variants of Citrus tristeza virus (CTV) within the plant to changes in the viral population following aphid transmission. Plant Pathol. 49:288-294.
8. Ebel, G. D., Spielman, A., and Telford, S. R. III 2001. Phylogeny of North American Powassan virus. J. Gen. Virol. 82:1657-1665.
9. Edgar, R. C. 2004. MUSCLE: multiple sequence alignment with high accuracy and high throughput. Nucleic Acids Res. 32:1792-1797.
10. Fazeli, C. F., and Rezaian, M. A. 2000. Nucleotide sequence and organi-zation of ten open reading frames in the genome of Grapevine leafroll-associated virus 1 and identification of three subgenomic RNAs. J. Gen. Virol. 81:605-615.
11. Fuchs, M., Marsella-Herrick, P., Loeb, G. M., Martinson, T. E., and Hoch, H. C. 2009. Diversity of ampeloviruses in mealybug and soft scale vectors and in grapevine hosts from leafroll-affected vineyards. Phytopathology 99:1177-1184.
12. Ghanem-Sabanadzovic, N. A., Sabanadzovic, S., Uyemoto, J. K., Golino, D., and Rowhani, A. 2010. A putative new ampelovirus associated with grapevine leafroll disease. Arch. Virol. 155:1871-1876.
13. Habili, N., Komínek, P., and Little, A. 2007. Grapevine leafroll-associ-ated virus 1 as a common grapevine pathogen. Plant Viruses 1:63-68.
14. Hall, J. S., French, R., Hein, G. L., Morris, T. J., and Stenger, D. C. 2001. Three distinct mechanisms facilitate genetic isolation of sympatric Wheat streak mosaic virus lineages. Virology 282:230-236.
15. Holmes, E. C., Urwin, R., and Maiden, M. C. J. 1999. The influence of recombination on the population structure and evolution of the human pathogen Neisseria meningitidis. Mol. Biol. Evol. 16:741-749.
16. Hudson, R. R. 2000. A new statistic for detecting genetic differentiation. Genetics 155:2011-2014.
17. Hudson, R. R., Boos, D. D., and Kaplan, N. L. 1992. A statistical test for detecting geographic subdivision. Mol. Biol. Evol. 9:138-151.
18. Huson, D. H., and Bryant, D. 2006. Application of phylogenetic networks in evolutionary studies. Mol. Biol. Evol. 23:254-267.
19. Jarugula, S., Alabi, O. J., Martin, R. R., and Naidu, R. A. 2010. Genetic variability of natural populations of Grapevine leafroll-associated virus 2 in Pacific Northwest vineyards. Phytopathology 100:698-707.
20. Jridi, C., Martin, J.-F., Marie-Jeanne, V., Labonne, G., and Blanc, S. 2006. Distinct viral populations differentiate and evolve independently in a single perennial host plant. J. Virol. 80:2349-2357.
21. Kaye, A. C., Moyer, J. W., Parks, E. J., Cargone, I., and Cubeta, M. A. 2011. Population genetic analysis of Tomato spotted wilt virus on peanut in North Carolina and Virginia. Phytopathology 101:147-153.
22. Komar, V., Vigne, E., Demangeat, G., Lemaire, O., and Fuchs, M. 2010. Comparative performance analysis of virus-infected Vitis vinifera cv. Savagnin rose grafted onto three rootstocks. Am. J. Enol. Vitic. 61:68-73.
23. Komínek, P., Glasa, M., and Bryxiová, M. 2005. Analysis of the molecu-lar variability of Grapevine leafroll-associated virus 1 reveals the pres-
ence of two distinct virus groups and their mixed occurrence in grape-vines. Virus Genes 31:247-255.
24. Kosakovsky Pond, S. L., and Frost, S. D. W. 2005. Datamonkey: rapid detection of selective pressure on individual sites of codon alignments. Bioinformatics 21:2531-2533.
25. Kosakovsky Pond, S. L., Posada, D., Gravenor, M. B., Woelk, C. H., and Frost, S. D. 2006. GARD: A genetic algorithm for recombination detec-tion. Bioinformatics 22:3096-3098.
26. Lee, J., and Martin, R. R. 2009. Influence of grapevine leafroll associated viruses (GLRaV-2 and -3) on the fruit composition of Oregon Vitis vinifera L. cv. Pinot noir: Phenolics. Food Chem. 112:889-896.
27. Librado, P., and Rozas, J. 2009. DnaSP v5: A software for comprehensive analysis of DNA polymorphism data. Bioinformatics 25:1451-1452.
28. Little, A., Fazeli, C. F., and Rezaian, M. A. 2001. Hypervariable genes in Grapevine leafroll-associated virus 1. Virus Res. 80:109-116.
29. Magome, H., Yoshikawa, N., and Takahashi, T. 1998. Single-strand conformation polymorphism analysis of Apple stem grooving capillovirus sequence variants. Phytopathology 89:136-140.
30. Maliogka, V. I., Dovas, C. I., Lotos, L., Efthimiou, K., and Katis, N. I. 2009. Complete genome analysis and immunodetection of a member of a novel virus species belonging to the genus Ampelovirus. Arch. Virol. 154:209-218.
31. Martelli, G. P. 2000. Major graft-transmissible diseases of grapevines: Nature, diagnosis, and sanitation. Pages 231-236 in: Proc. 50th Anni-versary Annu. Meet. ASEV. Seattle.
32. Martelli, G. P. 2009. Grapevine virology highlights 2006-2009. Pages 15-23 in: Extended Abstr. 16th Meet. ICVG. Dijon, France.
33. Martin, D. P., Williamson, C., and Posada, D. 2005. RDP2: Recom-bination detection and analysis from sequence alignments. Bioinformatics 21:260-262.
34. McDonald, J. L., and Kreitman, M. 1991. Adaptive protein evolution at the Adh locus in Drosophila. Nature 351:652-654.
35. Mekuria, T. A., Gutha, L. R., Martin R. R., and Naidu R. A. 2009. Genome diversity and intra- and interspecies recombination events in Grapevine fanleaf virus. Phytopathology 99:1394-1402.
36. Meng, B., Rebelo, A. R., and Fisher, H. 2006. Genetic diversity analyses of grapevine Rupestris stem pitting-associated virus reveal distinct population structures in scion versus rootstock varieties. J. Gen. Virol. 87:1725-1733.
37. Murolo, S., Romanazzi, G., Rowhani, A., Minafra, A., La Notte, P., Branzanti, M. B., and Savino, V. 2008. Genetic variability and population structure of Grapevine virus A coat protein gene from naturally infected Italian vines. Eur. J. Plant Pathol. 120:137-145.
38. Nei, M., and Kumar, S. 2000. Molecular Evolution and Phylogenetics. Oxford University Press, New York.
39. Nolasco, G., Santos, C., Petrovic, N., Teixeira Santos, M., Cortez, I., Fonseca, F., Boben, J., Nazare Pereira, A. M., and Sequeria, O. 2006. Rupestris stem pitting associated virus isolates are composed by mixtures of genomic variants which share a highly conserved coat protein. Arch. Virol. 151:83-96.
40. Ohshima, K., Tomitaka, Y., Wood, J. T., Minematsu, Y., Kajiyama, H., Tomimura, K., and Gibbs, A. J. 2007. Patterns of recombination in Turnip mosaic virus genomic sequences indicate hotspots of recombination. J. Gen. Virol. 88:298-315.
41. Oliver, J. E., Vigne, E., and Fuchs, M. 2010. Genetic structure and molecular variability of Grapevine fanleaf virus populations. Virus Res. 152:30-40.
42. Rayapati, A. N., O’Neil, S., and Walsh, D. 2008. Grapevine leafroll disease. WSU Extension Bulletin. http://cru.cahe.wsu.edu/CEPubli-cations/eb2027e/eb2027e.pdf.
43. Rowhani, A., Biardi, L., Johnson, R., Saldarelli, P., Zhang, Y. P., Chin, J., and Green, M. 2000. Simplified sample preparation method and one-tube RT-PCR for grapevine viruses. Page 82 in: Extended Abstr. 13th Meet. Int. Counc. Study Virus-like Dis. Grapevine. Adelaide, Australia.
44. Rubio, L., Ayllón, M. A., Kong, P., Fernández, A., Polek, M., Guerri, J., Moreno, P., and Falk, B. W. 2001. Genetic variation of Citrus tristeza virus isolates from California and Spain: Evidence for mixed infections and recombination. J. Virol. 75:8054-8062.
45. Rzhetsky, A., and Nei, M. 1992. A simple method for estimating and testing minimum-evolution trees. Mol. Biol. Evol. 9:945-967.
46. Saitou, N., and Nei, M. 1987. The neighbor-joining method: A new method for reconstructing phylogenetic trees. Mol. Biol. Evol. 4:406-425.
47. Sforza, R., Boudon-Padieu, E., and Greif, C. 2003. New mealybug species vectoring Grapevine leafroll-associated viruses-1 and -3 (GLRaV-1 and -3). Eur. J. Plant Pathol. 109:975-981.
48. Steinhauer, D. A., Domingo, E., and Holland, J. J. 1992. Lack of evidence for proofreading mechanisms associated with an RNA virus polymerase. Gene 122:281-288.
49. Tajima, F. 1989. Statistical method for testing the neutral mutation hypothesis by DNA polymorphism. Genetics 123:585-595.

1456 PHYTOPATHOLOGY
50. Tamura, K., Peterson, D., Peterson, N., Stecher, G., Nei, M., and Kumar, S. 2011. MEGA5: Molecular evolutionary genetics analysis using maxi-mum likelihood, evolutionary distance, and maximum parsimony methods. Mol. Biol. Evol. Online publication. doi:10.1093/molbev/msr121.
51. Thompson, J. D., Higgins, D. G., and Gibson, T. J. 1994. CLUSTAL W: Improving the sensitivity of progressive multiple sequence alignment through sequence weighting, position-specific gap penalties and weight matrix choice. Nucleic Acids Res. 22:4673-4680.
52. Tsompana, M., Abad, J., Purugganan, M., and Moyer, J. W. 2005. The molecular population genetics of the Tomato spotted wilt virus (TSWV) genome. Mol. Ecol. 14:53-66.
53. Wang, J., Sharma, A. M., Duffy, S., and Almeida, R. P. 2011. Genetic diversity in the 3′ terminal 4.7-kb region of Grapevine leafroll-associated virus 3. Phytopathology 101:445-450.
54. Wright, S. 1951. The genetical structure of populations. Ann. Eugen. 15:323-354.