Embed Size (px)
Citation preview

GRAIN BOUNDARY CHEMISTRY AND INTERGRANULARCORROSION IN ALLOY 825
Y.-M Pan, D.S. Dunn, G.A. Cragnolino, and N. SridharCenter for Nuclear Waste Regulatory AnalysesSouthwest Research InstituteSan Antonio, TX
fi3,TRACT
Alloy 325, candidate material for radioactive high-level waste containers, was investigated '
assess its 't.'ienaimi stability and the time-temperature conditions for sensitization. Alloy speidmeus
with a caibon content of 0.01 wt. % in the mill-annealed and solution-anneaed conditions were
stldied after thermal exposure to temperatures in the range of 600 to 800C for periods of up t
1,0 hours. Sensitization was evaluated by using corrosion tests that were corre ated with grain
boundary chemistry analyses. Sensitized microstructures were found to contain M2 3Cctype c <ixbides
and a chromium-depleted region in the vicinity of the grain boundaries. Thermal aging t 7000 C for
100 hours resulted in the highest sensitization. Whereas low-ternperature aging at 640'C showed a
progressve development of sensitization with time, healing was found to occur after aging rat 800' C
for X hi Prs. The degree of sensitization quantified by an equivalent chromiun deleton zone size
correlates well to both the corrosion rate in the nitric acid test and Mhe repassi vation potential i..I a
cAloride-containing solution. Thermodynamic models were used to calculate the nteracial
99 0 111 990415 Ayd) /PDfP L'NSTEWt- iL P pDR
-..---- -1--- - -__'.____.__"____'__ -. 1 ----- -- ... _.1--___ .. " "-__--_--_-_ --- - �

GRAIN BOUNDARY CHEMISTRY AND INTERGRANULARCORROSION IN ALLOY 825
Y.-M Pan, D.S. Dunn, G.A. Cragnolino, and N. SridharCenter for Nuclear Waste Regulatory AnalysesSouthwest Research InstituteSan Antonio, TX
ABSTRACT
Alloy 825, a candidate material for radioactive high-level waste containers, was investigated to
assess its thermal stability and the time-temperature conditions for sensitization. Alloy specimens
with a carbon content of 0.01 wt. % in the mill-annealed and solution-annealed conditions were
studied after thermal exposure to temperatures in the range of 600 to 8000C for periods of up to
1,000 hours. Sensitization was evaluated by using corrosion tests that were correlated with grain
boundary chemistry analyses. Sensitized microstructures were found to contain M2: Ctype carbides
and a chromium-depleted region in the vi .ity of tU: Uz bou-idaries. Thermal a, -ig at 700C fo
100 hours resulted in the highest censitizatk.w. Whereas low-temperatuxe aging at 3400C sho-wed a
progressive development of sensitization w,-vn *time., heeingwas found to occ'ir after aging at 80.t
for 100 hours. The degree of sensidzizonp quantified by an equivalent chromirk depieo-'n -zcre size
correlates well to both the corrosion rate in the nitric acid test and the epassivatic tentkl in a
chloride-containing solution. Therlodynamic models were used to calculate the interfacial
1
9905110111 990415 'id KPDR WASTEWM-1I PDR

chromium concentration, chromium depletion profile, and the depletion zone width. Comparisons
between experimental measurements and model calculations indicate that reliable prediction depends
on the selection of key model parameters.
I. INTRODUCTION
The thermal stability of nuclear waste container materials is an important issue in the geological
disposal of high-level radioactive waste. Among the materials for containers in the proposed Yucca
Mountain (YM) repository, Ni-Cr-Fe-Mo and Ni-Cr-Mo alloys have been main candidates. One of
them, Alloy 825, is the focus of this study. Containers will be made by welding plates both
longitudinally and circumferentially. Currently, Alloy 22 is the main candidate material due to its
superior corrosion resistance. Even in stabilized Ni-Cr-Fe-Mo alloys, such as Alloy 825, welding
produces a heat affected zone in which grain boundary carbide precipitates and sensitization in a
narrow region close to the fusion boundary may occur. Changes in material microstructure and
microchemistry, particularly at grain boundaries, can affect mechanical properties due to thermal
embrittlement or decrease in corrosion resistance as a result of sensitization.
Intergranular corrosion has been known to occur for Ni-Cr-Fe-Mo alloys in specific
environments and can promote stress corrosion cracking and even disintegration at the grain
boundary. It is generally accepted that the principal feature responsible for this phenomenon in
stainless steels and Cr-bearing nickel alloys is the existence of a narrow chromium-depleted zone
adjacent to carbide precipitates in the grain boundary region. Extensive research has been conducted
2

to quantify the grain boundary chemistry of stainless steels (1,2) and other Ni-Cr-Fe alloys such as
Alloy 600.(3-6) However, very few studies exist in the literature on the development of chromium
depletion during the sensitization of Alloy 825. Raymond (7) has conducted one of these studies on
the mechanisms of sensitization and stabilization of Alloy 825. He found that the sensitivity to
intergranular corrosion of Alloy 825 can be attributed to the precipitation of Cr-rich carbides and the
formation of a Cr-depleted area adjacent to the grain boundary but no Cr concentration profile was
experimentally measured. Thus, determination of the chemistry in the vicinity of grain boundaries
is important in understanding the thermal stability of these alloys.
Energy dispersive X-ray spectroscopy with the analytical electron microscope (AEM) is one of
the few techniques available for analysis of grain boundary chemistry. The development of the AEM
with a finely focused electron probe has enabled sampling of very small volumes. Hall and Briante')
have systematically determined the Cr distribution in the vicinity of carbides as a function of
sensitization temperature and time in type 316LN austenitic stainless steels. Good agreement was
found between the AEM measurements and the results calculated from thermodynamic models.
Modeling of sensitization has been attempted both phenomenologically(8 ) and mechanistically.(9 0 )
Bruemmer("1) has reviewed the basic approaches to model sensitization. While phenomenological
modeling is based on the normalization of bulk compositional effects on intergranular corrosion,
mechanistic modeling considers the thermodynamics and kinetics of carbide precipitation and Cr
depletion profile evolution. Numerous investigators (1-6) have attempted to predict the development
of sensitization using these models. The success of these predictions was found to be dependent on
3

the selection of key parameters in the models such as activity coefficient, diffusion coefficient, and
the critical values of Cr depletion for intergranular corrosion to occur.
In the study documented in this paper, a combination of corrosion tests and AEM measurements
were employed to examine the factors affecting the sensitization of Alloy 825. Models predicting
sensitization by taking into account interfacial Cr concentration and Cr depletion profile were
correlated with experimental measurements.
II. EXPERIMENTAL PROCEDURES
Alloy 825, supplied by INCO Alloys International as a 12.5 mm thick plate in the hot-rolled and
mill-annealed (MA) condition, was used in this study. Its chemical composition is given in Table I
as Heat A. The microstructure of the as-received MA material was observed to have a dual grain size
with areas of large grains surrounded by areas of very small grains. (2) Whereas the grain boundaries
were found to be completely devoid of precipitates, a large number of small intragranular carbide
precipitates and large cuboidal particles within some of the grains were observed in the MA
microstructure. Specimens of Alloy 825 were solution-annealed (SA) at 1,200'C for 10 min
followed by fast quenching in cold water. The high-temperature treatment produced significant grain
growth and dissolution of the intragranular precipitates. The grain boundaries of the SA material
were found to be free of precipitates.
4
Both MA and SA specimens were then heat treated at various temperatures ranging from 600
to 800'C for 0.1 to 1,000 hours and still-air cooled. All specimens were then subjected to the
following corrosion tests: (1) ASTM A262 Practice C,('3 ) boiling 65 % HN0 3 for five 48 hours
periods; (2) ASTM A262 Practice D,(13 ) boiling 50 % H2SO4 + 42 g/L Fe2(SO4 )3-4H 20 for 120 hours;
(3) ASTM G-6 1,(' 4)cyclic potentiodynamic polarization (CPP) at a potential scan rate of 0.167 mV/s
in a 100 ppm Cl- solution at 950C. Both the nitric acid and CPP tests were performed using Heat A.
The sulfuric acid - ferric sulfate tests were conducted using a 3.1 mm thick plate also obtained from
INCO Alloys International. The composition of this plate is shown in Table I as Heat B. While the
first two tests were used to evaluate the susceptibility to intergranular corrosion, the third test was
undertaken to determine the repassivation potential (Em) for localized corrosion in a
chloride-containing environment relevant to the proposed YM repository. Selected specimens were
then cross-sectioned for metallographic observation.
AEM analyses were conducted to determine the composition of the grain boundary precipitates
and the associated Cr depletion using a Phillips EM420 scanning transmission electron microscope
(STEM). Thin-foil specimens were prepared by cutting slices about 1,000 prm thick from the heat-
treated material followed by mechanical thinning to 40 pm. Discs 3 mm in diameter were then
punched out and electropolished in ajet-polishing apparatus using a perchloric-ethanol mixture until
a small perforation was detected. At least two specimens for each heat treatment condition were
examined. The quantitative X-ray microanalyses were carried out using a 20 nm electron beam
diameter. The X-ray intensities were converted to concentration of species using the Cliff-Lorimer
procedure.(1 5) In this procedure, the ratio of concentration of species is assumed to be proportional
5
to the ratio of their X-ray intensities, because the X-ray fluorescence and absorption can be neglected
due to the small thickness of the sample. The relationship can be expressed as:
CkCNr CrNi 'N (1)
where Ccr and CNj refer to the concentrations of Cr and Ni, respectively, and ICr and INj refer to their
respective X-ray intensities. The factor, kCrNi, is calculated by conducting the analysis at a location
remote from the grain boundary and using the known bulk chemical composition of the alloy as
reference. Nickel, the main alloying element in Alloy 825, was used as the basis for calculating the
concentration of other alloying elements. Since in this investigation the characteristic intensity peaks
of the desired elements are far apart, the errors in concentrations were estimated from replicate
measurements rather than by the sum of relative errors (95 percent confidence interval/average
value) of k and I values as used by Goldstein and Williams.(5 ) The standard deviation (a) for the
measurement of Cr concentration was estimated to be 0.5 at. % and for Mo about 0.16 at. %.
III. EXPERIMENTAL RESULTS
A. Intergranular Corrosion Tests
According to ASTM A-262-93a, Standard Practice C, the evaluation of the susceptibility to
intergranular corrosion is made by calculating an average corrosion rate over the five 48 hours test
periods. In order to compare the data for different conditions, corrosion rates were normalized by
6

dividing the corrosion rate of the heat-treated specimens by that of the MA (0.107 mm/yr for Heat A)
and SA (0.1 16 mm/yr for Heat A and 0.100 mm/yr for Heat B) specimens, respectively. It has been
previously reported that sensitization of the thermally treated SA specimens was observed to occur
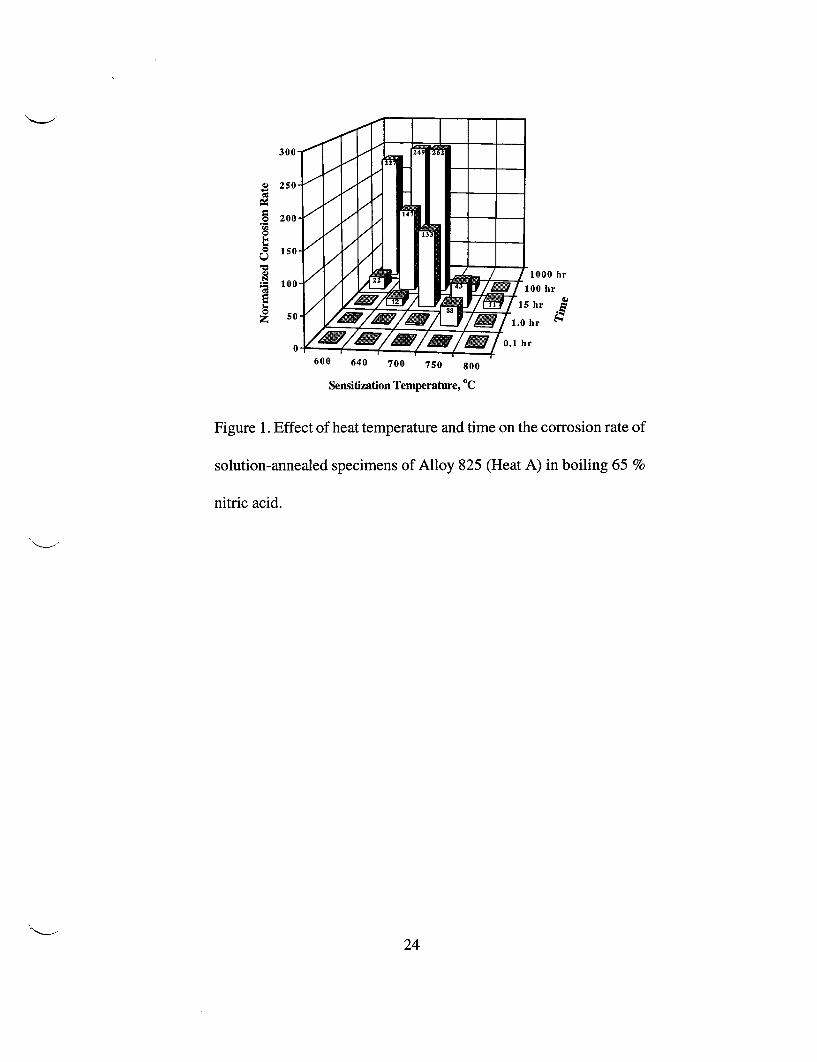
more readily than that of the MA specimens.('2 The normalized corrosion rates for the thermally
treated SA specimens of Heat A are shown in Figure 1. It can be seen that specimens heat treated at
7000C exhibited the highest corrosion rates for both time periods of 15 and 100 hours. The corrosion
rate increased with increasing heat treatment time for the lower aging temperatures of 600, 640, and
700'C, whereas a decrease was observed for the higher aging temperatures of 750 and 800'C. The
corrosion rate is calculated as uniform dissolution regardless of the localized morphology of the
attack following the procedures of the ASTM Standard. However, cross sections of the specimens
indicated the development of localized dissolution along the grain boundaries in the form of
intergranular corrosion. The extent of localized dissolution was also found to be greater for the
heat-treated SA specimens compared to the heat-treated MA specimens. No signs of localized attack
were detected in the SA specimen without additional thermal treatment.(12)
Results of the sulfuric acid-ferric sulfate tests using Heat B are shown in Figure 2. It is clearly
seen in Figure 2 that the maximum corrosion rate was observed in the specimen heat treated for
1,000 hours at 640 C. From Figures 1 and 2, it is apparent that the nitric acid test is much more
sensitive to grain boundary precipitation than the sulfuric acid-ferric sulfate test even though different
specimen heats were employed. The differences in the corrosion rates observed in these tests are the
result of the different sensitivities of these tests to grain boundary chemistry, as discussed by
Streicher.(' 6 ) The sulfuric acid-ferric sulfate test is sensitive to the extent of the Cr-depletion region,
7

both measured by its microstructural width and its minimum Cr concentration. The nitric acid test is
sensitive to Cr depletion, the precipitation of a-phase, and the presence of Cr6 , species in the test
solution. For sensitized microstructures that do not contain a-phase, the higher Cr-containing phases,
such as chromium carbide precipitates at the grain boundaries, have higher corrosion rates in nitric
acid solutions containing Cr6 '. If the grain boundary region has some level of Cr depletion as a result
of sensitization, preferential corrosion occurs initially in this region in nitric acid. Once a sufficient
concentration of Cr6 ' species is generated, accelerated corrosion occurs in the grain boundary where
there is an enriched Cr phase. The relatively low corrosion rate in sulfuric acid-ferric sulfate solution
seems to indicate a very narrow region of Cr depletion. This finding is in agreement with previous
results reported by Brown (17) for Alloy 825 with a higher carbon content (0.03 %) and slightly lower
Cr concentration (21.24 %).
A convenient method for displaying the data of the intergranular corrosion tests is the use of the
time-temperature-sensitization (TTS) diagram. The results for both heat-treated MA and SA
specimens from Heat A are shown in Figure 3. A value of 0.3 mm/yr was adopted as a boundary
between the sensitized and the nonsensitized regions of the diagram based on the previous work of
Raymond.(7 ) It should be emphasized, however, that the location of the boundary depends on the
solution composition and other environmental conditions that are used to perform the test (in this
case, ASTM A-262, Practice C). In a different environment, the sensitization domain may be reduced
or extended beyond that shown in Figure 3.
8

The effect of sensitization on localized corrosion of Alloy 825 was examined by measuring the
repassivation potential, Erp in a 100 ppm CY solution at 950C using CPP tests. The correlation
between the corrosion rate in the nitric acid test and the repassivation potential in chloride solution
is shown in Figure 4 as functions of sensitization temperature and time. As shown in Figure 4, a good
correlation exists between the E p measured in the chloride solution and the corrosion rate in boiling
nitric acid. The maximum corrosion rates observed in the specimens heat treated at 7000C coincide
with the minimum Erp values for both aging time periods of 15 and 100 hours. Heat-treatment
conditions that created a sensitized microstructure also resulted in a significant decrease in E,
indicating that the sensitized microstructure is less resistant to localized corrosion. Localized
corrosion in the form of pitting was observed to occur preferentially along the grain boundaries.( 12)
B. Grain Boundary Precipitation
Grain boundary precipitation was observed at all heat treatment temperatures and times
employed in this study. The microstructures of the grain boundary regions of the heat-treated
Alloy 825 Heat A are shown in Figures 5 through 8 for different aging conditions. The TEM images
in Figures 5 through 8 correspond to various aging time periods at 640, 700, 750, and 8000C,
respectively. Electron diffraction analysis of the grain boundary precipitates confirmed that the crystal
structure was M23 C6-type carbide within an austenitic matrix oriented to a [001] zone axis, as shown
in the diffraction pattern insert in Figure 7a. The globular M23C6 -type carbide precipitates observed
in this study are similar to those previously reported for this alloy.(7) The chemical composition of the
grain boundary carbides measured in thin-foil specimens is presented in Table II for two
9

electropolishing solutions. Surface chemistry artifacts in Alloy 825 and variations of the grain
boundary chemistry in relation to the electrolytes used for electropolishing were observed. The
chromium content of the carbides for the perchloric acid-polished specimens is substantially higher
than that for the nitric acid-polished specimens and consistent with previous findings!" 8 ) Whereas
M23C6 carbide precipitates in type 31 6LN stainless steels had about 65 wt. % Cr,M1) those in Alloy 825
can be up to 75 wt. % Cr.' 8 ) A detailed discussion concerning the effect of electropolishing in nitric
acid solution has been published elsewhere.(9)
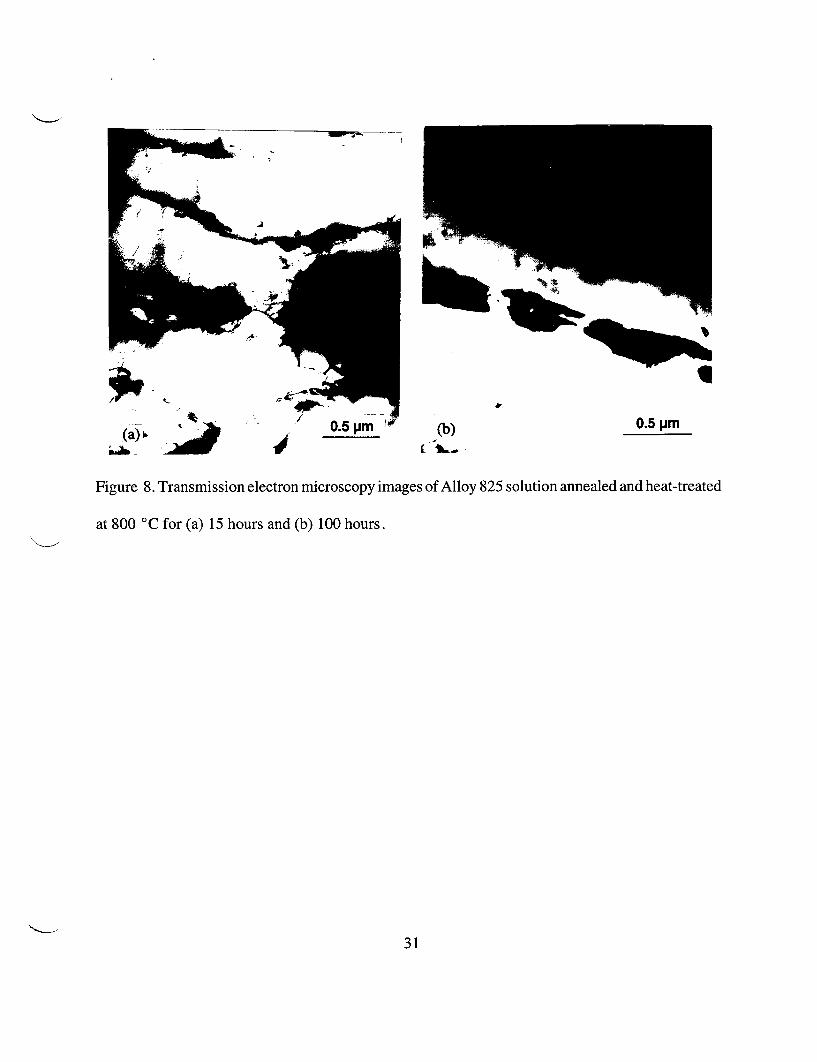
The effect of heat treatment temperature and time on grain boundary precipitation is also clearly
shown in Figures 5 through 8. It was observed that the size of the carbide precipitates increases with
increasing aging temperature; however, their density decreases significantly. A low aging temperature
of 640'C produced finer, but more numerous, grain boundary precipitates (Figure 5). The size of
precipitates increased substantially upon aging at 8000 C (Figure 8). A similar trend was also observed
regarding the effect of aging time as revealed in Figure 5 for three different aging periods. The
precipitate morphology after a 1,000-hour treatment at 640'C became coarse and discrete, quite
different from that corresponding to aging for shorter times.
C. Chromium Depletion Profiles
Chromium depletion profiles were obtained across grain boundaries between precipitates.
Several grain boundary areas were examined on duplicate specimens with the same treatment.
Figures 9 through 12 show representative profiles for 640, 700, 750, and 800'C, respectively, at
10

various aging times. The minimum of the grain boundary Cr concentrations are listed in Table III for
the same thermal treatments. Significant chromium depletion occurred for most of the
time/temperature combinations employed. A pronounced Cr depletion was observed at 700'C, and
also at lower temperatures for the most prolonged treatments. Variations in the Cr concentration
profiles due to preferential electropolishing were also observed during TEM thin-foil specimen
preparation of Alloy 825 using nitric acid and perchloric acid solutions. The Cr-depleted zone
observed in specimens electropolished in perchloric acid solution was found to be significantly deeper
and wider than that in specimens electropolished in nitric acid solution. (19)
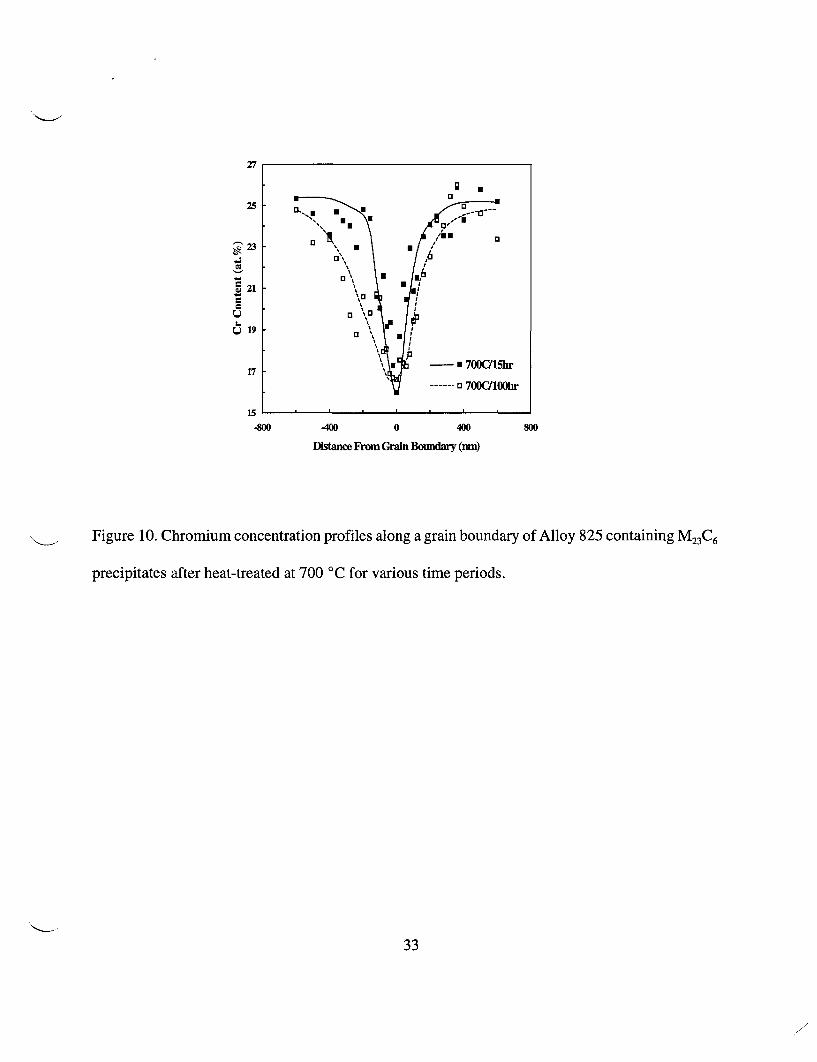
A significant effect of aging time on the grain boundary depletion of Cr was also observed.
For an aging temperature of 700 'C, while longer aging time did not appreciably affect the minimum
Cr concentration (Table I), a widening of the depleted zone is noted in Figure 10. However, at
800'C, while the minimum Cr concentration slightly increased with increasing aging time, the
depletion width decreased slightly, as shown in Figure 12. An intermediate behavior without an
apparent change in both the width of the depleted zone and the minimum Cr concentration, is noted
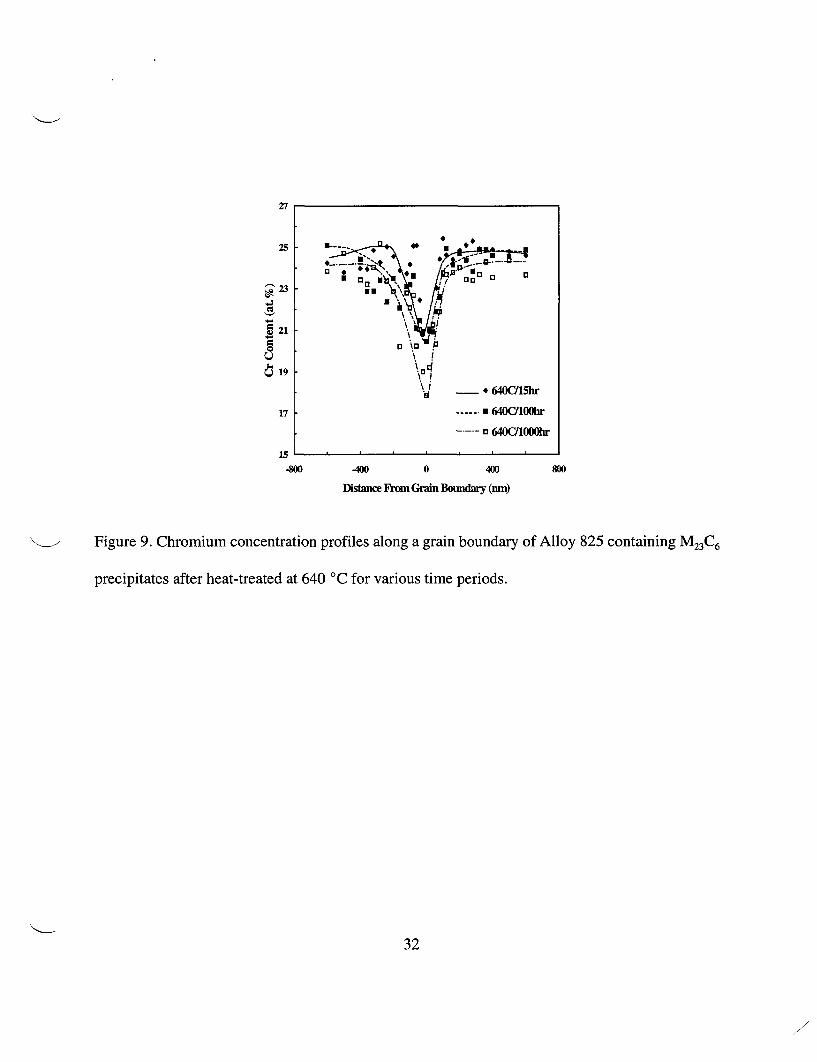
at 750'C (Figure 11). Contrary to the high aging temperature, at 640'C the minimum Cr
concentration gradually decreased with increasing time, while the depletion width increased
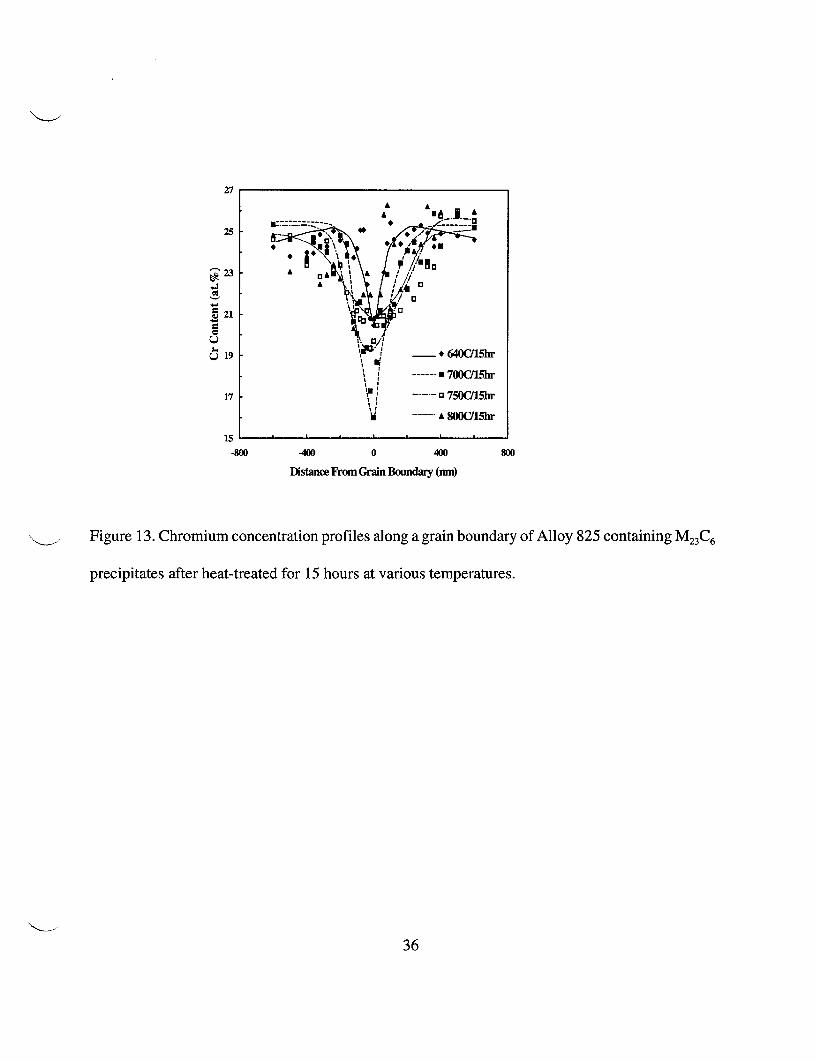
(Figure 9). The effect of aging temperature on the grain boundary depletion of Cr is shown in
Figures 13 and 14 for aging times of 15 and 100 hours, respectively. In both time periods aging at
700'C produced the lowest grain boundary Cr concentration, and aging for 100 hours resulted in the
widest depletion.
11

In some specimens, Mo depletion was also observed, but the observations were not entirely
consistent. It is possible that the small concentration of Mo present in the alloy did not permit an
accurate analysis of the profile with the instrument used in this investigation. The relative error in the
determination of the Mo content in the matrix is close to 30 %. It must be noted, however, that
carbide precipitates consistently exhibited higher Mo contents than the matrix.
IV. DISCUSSION
A. Kinetics of Sensitization
The results of this study essentially confirm the findings reported by Raymond (7) regarding
the temperature range for sensitization and the location of the "nose" in the TTS diagram for
Alloy 825. The thermally treated SA material exhibited a much higher degree of sensitization than
that of the MA material. This was rationalized by Raymond in terms of the redissolution of matrix
M23C6 carbides with the resulting increase in the soluble carbon content of the matrix and
reprecipitation of these carbides along the grain boundaries. However, for a material
solution-annealed at 1,204'C and then heat-treated at 940'C for 1 hour (temperature of the current
stabilizing treatment for MA samples), Raymond found a much larger sensitization domain, in terms
of time and temperature, than that found in the current investigation. The simplest explanation for the
greater degree of sensitization of the material studied by Raymond is related to the higher carbon
content of the original composition of Alloy 825. Raymond tested a heat with a carbon content of
0.03 wt. %, whereas the heat used in the present study contained only 0.01 wt. %. The effect of the
12
higher carbon content on the sensitization of Alloy 825 is understandable in terms of chromium
depletion as determined by the equilibrium chromium concentration at the carbide-matrix interface.
From the corrosion rates of the SA specimens heat treated for 15 hours at temperatures
ranging from 600 to 700'C, an activation energy of approximately 292.6 kJ/mole was calculated by
plotting corrosion rates as a function of the reciprocal of temperature. This value is relatively close
to the activation energy for matrix diffusion of chromium in nickel-based alloys such as Alloy 600
(Ni-15%Cr-6%Fe) which is 277.7 kJ/mole 20 ) and Alloy 800 (32%Ni-21%Cr-45%Fe) with a value
of 287.4 kJ/mole. 2 1 Data for binary Ni-Cr alloys reported by Pruthi et al.(20) also indicate that the
activation energy increases with increasing chromium content, reaching about 290.4 kJ/mole for
Ni-29.7%Cr. This effect of the chromium content on the activation energy for chromium diffusion
may be the reason of the value for the activation energy obtained in the present study, since the
chromium content of Alloy 825 is comparable to that of Alloy 800. It appears that the corrosion rates
measured in the thermally-treated SA samples can be related, at least qualitatively, to the degree of
sensitization, as given by the level of chromium depletion and the width of the depleted zone. The
width of the depleted zone is proportional to 2(Dt)v2, where D is the matrix diffusion coefficient of
chromium at the temperature of interest and t is time. The activation energy and preexponential
factors for Cr diffusion in Alloy 825, adopted from the study by Paul et al., (21) are 287.4 kJ/mol and
3.24 cm2/s, respectively. Chromium depletion width can be estimated assuming a critical Cr level of
21 at. % as compared to the 24.6 at. % for the Cr content in the bulk. Figure 15 shows a comparison
of measured depletion zone widths with the calculated results for various temperatures. The
13

calculation generally predicts depletion zone widths for the heat treatments used in this study with
the exception of 800'C, temperature at which significant Cr replenishing takes place in a short time.
The high activation energy for Cr diffusion indicates a very strong temperature dependence.
A decrease in temperature from 600 to 4000C implies a decrease of at least five orders of magnitude
in the rate of the controlling process if there is no change in the mechanism with respect to that
prevailing in the 600 to 700'C range. This implies that heat treatments extended for more than
18 years will be required at 400'C to obtain the degree of sensitization observed in the
high-temperature range. In order to study the thermal stability of Alloy 825 at temperatures closer to
those expected under repository conditions within a realistic time frame, it would be necessary to
enhance metallurgical processes responsible for sensitization, such as carbide precipitation and
chromium diffusion. This may be accomplished by introducing a higher dislocation density in the
y-phase matrix of SA samples through cold work prior to the sensitization treatments. Park et al.(22)
found that cold work preceding heat treatment accelerates the precipitation of M7C3 carbides in
Alloy 600. The effect of cold work on thermal stability is also important from a practical point of
view. Surface and near-surface areas of the high-level radioactive waste containers could be affected
by cold work arising from sudden mechanical loads, impingement by wall-rock shear offsets, and
other interactions leading to localized plastic deformation. Initial investigations using U-bend
specimens of SA material, however, did not indicate any effect of cold work on sensitization
kinetics. 23 ) This may indicate that the amount of cold work in the U-bend was inadequate or
sensitization of Alloy 825 is relatively insensitive to prior cold work.
14
B. Modeling of Grain Boundary Chemistry
Modeling of Cr depletion kinetics in single phase fcc Ni-Cr-Fe alloys has been attempted by
numerous investigators and reviewed by Bruemmer.(l1 ) The formation of M23C6 carbide which is the
prevailing carbide in most of these alloys, is represented by the following overall reaction:
M 23C 6 23 M+6 C (2)
where M is mostly Cr, but may contain some Mo, Ni, and Fe. The equilibrium constant for this
reaction, that decreases with decreasing temperature (11), is written as:
K =exp AG~ _ a M23C6 (3)RT) (a m)2(a C) 6
Since the activity of the carbide can be assumed to be equal to 1 under standard conditions, a higher
carbon content in the alloy implies a lower chromium activity or concentration at the interface. The
activities in Eq. (3) can be written in terms of the appropriate concentrations as:
acr* = YCr*Xcr*; a = zyX, (4)
where the M is replaced by an equivalent Cr concentration, Cr*, that includes the effect of Mo. The
ys are the activity coefficients, and the Xs are the concentrations of the corresponding elements. The
activity coefficient of carbon in solid-solution has been reviewed by Hillert and Qui(24) and Natesan
and Kassner. 25 ) The activity coefficient for Cr can be calculated either by the approach of the pairwise
15
interaction parameters as given by Was and Kruger(3) or by using empirical equations as employed
by Bruemmer.( I)
The minimum Cr concentration in Alloy 825 was calculated using the value for the
equilibrium constant from the work by Richardson. 26 ) The value for the activity coefficient of carbon
was calculated using the formulation of Natesan and Kassner. 25 ) Insufficient information is available
for determining the activity coefficients for chromium. Activity coefficients were estimated on the
basis of the Cr activity vs. temperature equation given by Bruemmer,(11) adjusted by using the
interfacial concentration measured at 600 C. Figure 16 compares the measured Cr minimums with
the calculated values as a function of temperature. A good agreement between the calculated results
and the measurements is found for all aging temperatures with the exception of specimens treated at
640 C for 15 and 100 hours. It is apparent that equilibrium was not reached for these heat treatment
times, although it occurred in 1,000 hours. Another possible reason for this discrepancy may be the
morphology of carbides in the specimens aged at lower temperatures. The carbides were small, and
more continuously distributed along the grain boundaries. Hence, it was difficult to find a grain
boundary area devoid of precipitation in order to determine accurately the interfacial Cr
concentration. The electron beam partially intersected the overlying carbides affecting the results of
the chemical analysis. Data for M23C6 carbides indicate that the equilibrium Cr concentration at the
matrix-carbide interface decreases with decreasing temperature.1) The experimental results shown
in Figure 16 are consistent with this prediction over the temperature range of 800 to 6000C.
16

Whereas the chromium concentration at the carbide/matrix interface is thermodynamically
determined, the profile of the chromium concentration gradient is dominated by diffusional factors.
The depletion zone width has been predicted to increase with aging temperature from 600'C to
700'C for both austenitic stainless steel (M23C 6carbides)" 1 ) and Alloy 600 (M7C3 carbides)(3). Beyond
this temperature, the depletion zone width increases, but the minimum Cr concentration also
increases. Thus, the total volume of depleted material below a certain critical Cr concentration
decreases. These predictions are essentially confirmed by the present set of experiments.
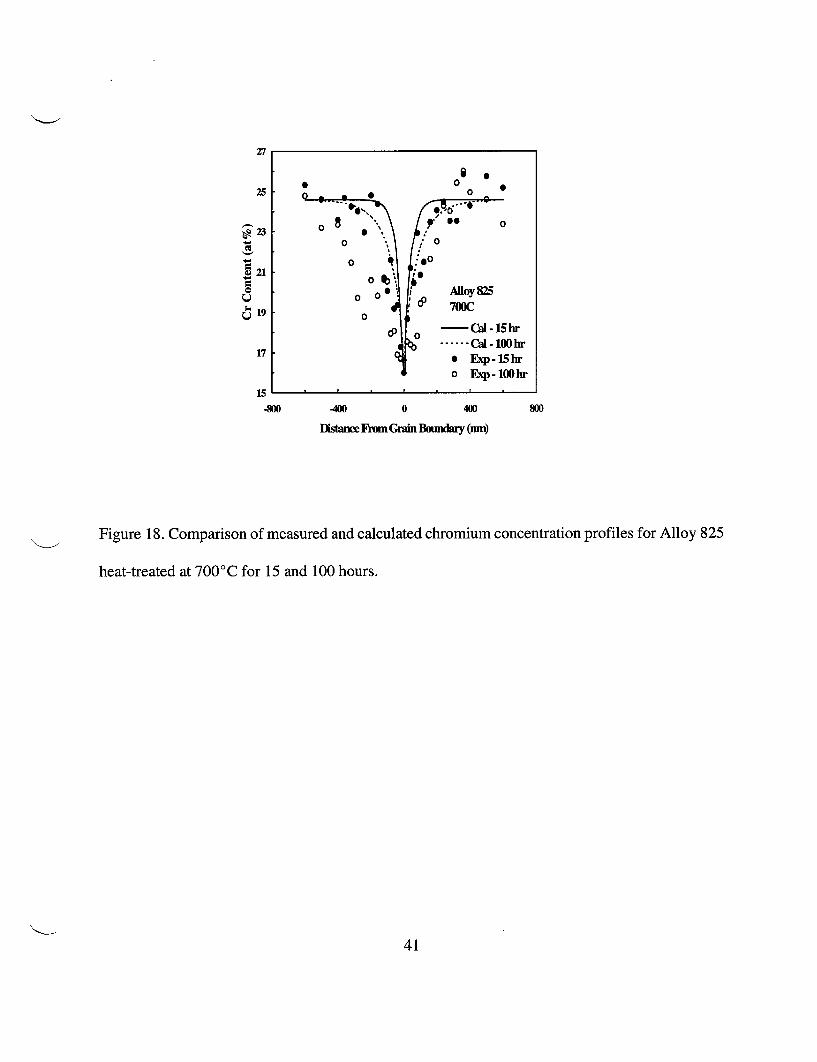
Modeling of chromium concentration profiles was performed based on the equations given
by Hall and Briant.() The minimum Cr content for each calculated profile was chosen to match the
experimental measurement, rather than the calculated equilibrium value. The calculated profiles for
Alloy 825 annealed for 15 hours at various temperatures are presented in Figure 17. The calculated
profiles at 700'C are shown in Figure 18 superimposed on the experimental data. The model seems
to not fully account for the broadening of the Cr depleted region after long aging times. The
discrepancies may be attributed to the diffusion coefficient values chosen for the calculations. The
effect of increasing the diffusion coefficient is shown in Figure 19 for the specimen aged at 700'C
for 15 hours. The Cr depletion width from the experimental data is in agreement with that of the
calculated profile using a diffusion coefficient an order of magnitude larger than the literature
value.(21 )
17
C. Grain Boundary Chemistry and Intergranular Corrosion
The effects of heat treatment temperature and time on corrosion rates in boiling 65 % nitric
acid may be better understood if combined with the results of the STEM analyses. For this purpose,
the size of the chromium depletion zone and the level of Cr were considered together as an equivalent
Cr depletion zone width, as suggested by Was et al.(27) The area of the depletion profiles below
various Cr concentrations was calculated. This area was then divided by the bulk Cr concentration
to obtain an equivalent width of the Cr depletion zone (in nanometers). The corrosion rate in boiling
65 % nitric acid is plotted as a function of the equivalent Cr depletion size for various Cr levels in
Figure 20. A good correlation was obtained between the corrosion rate and depletion size below a Cr
concentration of 21 at. %, suggesting that the corrosion rate is determined by the size of the depletion
zone below a critical Cr concentration of about 21 at. % (about 19 wt. %). In contrast, the corrosion
rate in boiling nitric acid did not correlate well with the minimum Cr concentration at the grain
boundaries. For example, both aging treatments at 700'C, for 15 and 100 hours, showed the same
minimum Cr concentration, but the latter treatment resulted in significantly higher sensitization as
measured in the nitric acid test.
The effect of Cr depletion zone size on the Ep is shown in Figure 21. The correlation is not
as good as that for the corrosion rate in nitric acid. This poorer correlation presumably arises from
the fact that localized corrosion resistance is a function of both Cr and Mo. The STEM analyses of
Mo did not indicate significant depletion, although the carbide analyses showed higher Mo. This
observation may be due to a lack of resolution of the Mo analyses, low Mo concentrations, or the
18

result of a very narrow Mo profile. Another possibility is that a linear correlation of Cr depletion to
E p is not valid. It can be observed in Figure 21 that below a depletion zone size of about 5 nm, the
Erp levels off, indicating that pitting takes place mostly in the matrix.
Sensitization of Alloy 825 may be initiated during either fabrication from plates or closure
welding of containers. Annealing of both types of welds may be possible. The closure weld must be
annealed in a manner whereby the temperature of the contained spent fuel assemblies is maintained
below 350TC. The advanced conceptual design for the proposed YM repository includes a thick steel
outer disposal overpack. The heat generated during the welding closure of the outer disposal overpack
may also induce growth of any grain boundary precipitates and the concurrent increase in the width
of the associated Cr-depletion zones. Depending on the thermal loading of the repository,
sensitization may continue after final disposal. The results of Erp measurements on sensitized
Alloy 825 confirm that the existence of Cr-depletion zones decreases the resistance of the material
to localized corrosion in a potential repository environment. While the presence of a thick steel
overpack may galvanically protect the Alloy 825 inner disposal overpack from localized corrosion
even after the outer barrier is breached, it is apparent that the Cr-depletion zones and carbide
precipitates may act as local anodes and undermine the integrity of the waste package.
V. CONCLUSIONS
The following conclusions can be drawn from this investigation:
19
1. Alloy 825 with a very low carbon content (-0.01 wt %) is still susceptible to sensitization. Both
grain boundary M23C6 precipitation and significant chromium depletion in the vicinity of the
carbides are present for all heat treatment temperatures ranging from 600 to 8000C.
2. The effects of heat treatment on chromium depletion profiles are related to the development of
the sensitization process. The most severe sensitization was observed after aging at 700 'C for 100
hours. Contrary to the progressive severity of sensitization with time at low temperatures,
replenishing of the depleted region was observed to occur for high temperature heat treatments.
3. The nitric acid test was found to be much more sensitive to grain boundary chemistry than the
sulfuric acid-ferric sulfate test. The observed differences in the corrosion rates of the sensitized
Alloy 825 can be attributed to preferential intergranular corrosion as a result of microchemistry
variations in the grain boundary region. Sensitization prompts localized corrosion along grain
boundaries and decreases Ep in chloride containing solutions.
4. The degree of sensitization in Alloy 825 was quantified and correlated well with the corrosion test
results in boiling nitric acid using an equivalent chromium depletion zone size below a chromium
concentration of 20-21 at. %. Model predictions are strongly dependent on the selection of key
modeling parameters.
5. The sensitization process was found to be strongly dependent on temperature, with an apparent
activation energy of approximately 292 kJ/mole in the 600 to 700'C range, which indicates that
very prolonged heat treatment are required to induce sensitization at lower temperatures.
20
ACKNOWLEDGMENTS
The authors wish to thank Messrs. W. J. Machowski and H. G. Saldana for conducting corrosion
experiments and TEM specimen preparation. This paper was prepared to document the work
performed at the Center for Nuclear Waste Regulatory Analyses (CNWRA) for the U.S. Nuclear
Regulatory Commission (NRC), Office of Nuclear Materials Safety and Safeguards, Division of
Waste Management, under Contract No. NRC-02-97-009. This paper is an independent product of
the CNWRA and does not necessarily reflect the views or the regulatory position of the NRC.
21
REFERENCES
1. E. L. Hall and C. L. Briant: Metall. Trans., 1984, vol. 13A, pp. 793-811.
2. S. M. Bruemmer and L. A. Charlot: Scripta Met., 1986, vol. 20, pp. 1019-1024.
3. G. S. Was and R. M. Kruger: Acta Metall., 1985, vol. 33, pp. 841-854.
4. G. S. Was: Corrosion,1990, vol. 46, pp. 319-330.
5. E. L. Hall and C. L. Briant: Metall. Trans., 1985, vol. 16A, pp. 1225-1236.
6 J. J. Kai, G. P. Yu, C. H. Tsai, M. N. Liu, and S. C. Yao: Metall. Trans., 1989, vol. 20A, pp.
2057-2067.
7. E. L. Raymond: Corrosion, 1968, vol. 24, pp. 180-188.
8. V. Cihal: Intergranular Corrosion of Cr-Ni Stainless Steel, Unieux Conference, 1969.
9. C. Stawstrom and M. Hillert: J. Iron Steel Inst., 1969, vol. 207, pp. 77-85.
10. C. S. Tedmon, Jr., D. A. Vermilyea, and J. H. Rosolowski: J. Electrochemical Soc., 1969, vol.
118,pp. 192- 202.
11. S. M. Bruemmer: Corrosion, 1990, vol. 46, pp. 698-709.
12. G. Cragnolino and N. Sridhar: Long Term Stability of High-Level Nuclear Waste Container
Materials: I - Thermal Stability of Alloy 825, Center for Nuclear Waste Regulatory Analyses,
CNWRA 93-003, San Antonio, TX, 1993.
13. American Society for Testing and Materials. Standard A 262-93a, ASTM Annual Book of
Standards, vol. 3.02, ASTM, Philadelphia, PA, 1993, pp. 1-16.
14. American Society for Testing and Materials. Standard G 61, ASTM Annual Book of Standards,
vol. 3.02, ASTM, Philadelphia, PA, 1993, pp. 231-235.
22

15. J. I. Goldstein and D. B. Williams: Quantitative Microanalysis with High Spatial Resolution, The
Metals Society, London, 1981, p.5.
16. M. A. Streicher: Intergranular Corrosion of Stainless Alloys, ASTM STP 656, American Society
for Testing and Materials, Philadelphia, PA, 1978, p. 3.
17. M. H. Brown: Corrosion, 1969, vol. 25, pp. 438-443.
18. M. A. Shaikh, M. Iqbal, M. Ahmad, J. I. Akhtar, and K. A. Shoaib: J. Mater. Sci. Lett., 1992, vol.
1 1, p.1 00 9 .
19. Y.-M. Pan, N. Sridhar, D. S. Dunn, and G. A. Cragnolino: J. Mater. Sci. Lett., 1996, vol. 15, pp.
522-524.
20. D. D. Pruthi, M. S. Anand, and R. P. Agarwala: J. Nucl. Mater., 1977, vol. 64, pp. 206-2 10.
21. A. R. Paul, K. N. G. Kaimal, M. C. Naik, and S. R. Dharwadkar: J. Nucl. Mater., 1994, vol. 217,
pp. 75-81.
22. J. M. Park, W. S. Ryu, and Y. H. Kang: J. Nucl. Mater., 1994, vol. 209, pp. 221-225.
23. N. Sridhar, G. Cragnolino, and D. S. Dunn: Experimental Investigation of Failure Processes of
High-Level Nuclear Waste Container Materials, Center for Nuclear Waste Regulatory Analyses,
CNWRA 95-010, San Antonio, TX, 1995.
24. M. Hillert and C. Qiu: Metall. Trans., 1991, vol. 22A, pp. 2187-2198.
25. K. Natesan and T. F. Kassner: Metall. Trans., 1973, vol. 4, pp. 2557-2566.
26. F. D. Richardson: J. Iron Steel Inst., 1953, vol. 175, pp. 33-5 1.
27. G. S. Was, H. H. Tischner, and R. M. Latanision: Metall. Trans., 1981, vol. 12A, pp. 1397-1408.
23
300 ::0-)
0
:l / z /: _ 79t~~~~~~15 hr z50- / E//.0 hr
o 0m e /_ 0.1 hr600 640 700 750 800
Sensitization Temperature, 0C
Figure 1. Effect of heat temperature and time on the corrosion rate of
solution-annealed specimens of Alloy 825 (Heat A) in boiling 65 %
nitric acid.
24

0
i 10-1 hr
N l~~~~~~~~~~~~~~O whr qj
z /
600 640 750 8wO
Setization Tenperatnm, 0C
Figure 2. Effect of heat treatment temperture and time on
the corrosion rate of solution-annealed specimens of Alloy
825 (Heat B) in boiling sulfuric acid plus ferric sulfate.
25

950MA SA
900 [] A <0.3 mm/yra A 0.3 - 1.5 mm/yr
850 _ A >1.5 mm/yr
V 800 A A&- - in----A.0.3 - 1.5 m~yr
= 750 -_ I mSos~~~~~ >1. mm/yr
v 700 -_ [ AfE ~< 0.3 milyr gd
Ez650 - M mTI "O&v v
600 -_ L m ] '
550 LA LA LA
500 I l 0.1 1 10 100 1000
Time, hours
Figure 3. Time-temperature-sensitization diagram
for heat treated mill-annealed and
solution-annealed Alloy 825 specimens (Heat A).
Corrosion rates determined in boiling 65 % nitric
acid.
26

220 40
15 hr+ 100 hrO - 15 hr
; 180 \ S Bo30
140 20
0~~~~~~
%~~~~~~
C4 100 . / , < 10
60 - o - , b0 g 0550 600 650 700 750 800 850
Sensitization Temperature, 0C
Figure 4. Comparison of the repassivation potential (in solid lines), Erp, measured at a scan rate of
0.167 mV/s, in a 100 ppm chloride solution at 95 0C and the corrosion rate (in dashed lines) in 65 %
nitric acid, for specimens of Heat B.
27

Figure 5. Transmission electron microscopy images of Alloy 825 solution annealed and heat-treated
at 640 C for (a) 15 hours, (b) 100 hours, and (c) 1,000 hours.
28

- ____ - _ ___ % *4,V
t - I"
-11 11 1-0*I
i.
I .I
YFSO~~2 pmf VSWS . PM',~~~~_ (bi ;
Figure 6. Transmission electron microscopy images of Alloy 825 solution annealed and heat-treated
at 7000 C for (a) 15 hours and (b) 100 hours.
29

0.2 pm ~~~~~~~~~0.5 p
Figure 7. Transmission electron microscopy images of Alloy 825 solution annealed and heat-treated
at 7500 C for (a) 15 hours and (b) 100 hours.
30
(a) _______ 0.5 PM
Figure 8. Transmission electron microscopy images of Alloy 825 solution annealed and heat-treated
at 800 C for (a) 15 hours and (b) 100 hours.
31
27
V19. n
\dl * 640C/ld5hr
17 - ----- * 640C/lO~hr
15 2.3 . . .
1
400 400 0 400 800
Dstance PromGrain Miundary (n)
Figure 9. Chromium concentration profiles along a grain boundary of Alloy 825 containing M23C6
precipitates after heat-treated at 640 C for various time periods.
32
27
.
250
U~~~~~~
U :, U of
- O 400 0 400 Do
DamFnGi BaRde (n
Figure 10. Chromium concentration profiles along a grain boundary of Alloy 825 containing M23C6
precipitates after heat-treated at 700 C for various time periods.
33

27
* X
25 1
'23 N '
~21 U
L)19
17 75OCthr
----- a 75OC40Ohr
15 . . . . . .
-800 400 0 400 800
Distance From Grain Boundary (ni)
Figure 11. Chromium concentration profiles along a grain boundary of Alloy 825 containing M23C6
precipitates after heat-treated at 750 C for various time periods.
34

27
A A A A
25
A~~~~
21A
19
A 800C/l5hr17 ----- A 80GI0
1S~~~~~~~~~~~~. . . . . .lL.
15
800 400 0 400 oo
Distance Fron Grain Bmndry (nM)
Figure 12. Chromium concentration profiles along a grain boundary of Alloy 825 containing M23C6
precipitates after heat-treated at 800 'C for various time periods.
35
27A
A
25
~23 A A \ i u
21
c 19 . '015ha
---- 0 70001l5thr
17 a -- 75-C15hr
~A C15hr
15-800 400 0 400 800
Distce FRu Grain Boyday (nm)
Figure 13. Chromium concentration profiles along a grain boundary of Alloy 825 containing M23C6
precipitates after heat-treated for 15 hours at various temperatures.
36

27
.
~~'23 A U A A-P
23
o 3
19 -4 \0r -640lO600hr
' ------ 7000h
17 . 7-OC -OOhr
A 8i0jCjj.~jp
15
--800 400 0 400 800
Distance FhPm Grain Boundary (nm)
Figure 14. Chromium concentration profiles along a grain boundary of Alloy 825 containing M23C6
precipitates after heat-treated for 100 hours at various temperatures.
37

-
10000
Depion XMdth At 21 at% Cr
e 100
I /0C750C
N
.....................
C~~~~~~~~~~~~0 lo
-- 600C ~ ~ ~ 0 00
63 800 C
10.1 1 10 100 1000
Uha Tratnent Tam (h)
Figure 15. Comparison of measured and calculated chromium depletion widths.
38

26
24
22
20 . a X
18
14 . hr*100 hr
12 * hr
10
500 600 700 800 900
Annealing Teiuerature CQ
Figure 16. Comparison of measured and calculated chromium minimums.
39

27
25
Q 19 5 I - - r
1, ~~640 C.17 - - - 700 c- I: 750C- El - -- 800c
15 . . . . . .-800 400 0 400 800
nsa iviGrain Bmid (m^
Figure 17. Calculated chromium concentration profiles for Alloy 825 heat-treated for 15 hours at
various temperatures.
40
Z7
*o S0 -
25 0 -
IS~~~~--S
0 0~230 8 .
400 40~0 0 40 0
- ~~0 .:0
21 q :e0 ACloy 825
00at-treae at o700C~19 0
* Qd-15twr
17 * Exp- 5 hr
0 ExP -lO0br15I
.80 -400 0 400 800
asW Ru~nCran Bwnxar (mn)
Figure 18. Comparison of measured and calculated chromium concentration profiles for Alloy 825
heat-treated at 700'C for 15 and 100 hours.
41

250
15 D~~~~=3.24 exp(-27.RI. * ----....D=[324 e)-297A4Wlx0
13 I .
-800 400 0 400 800
- ~Figure 19. Effect of diffusion coefficient on calculated chromium concentration profiles for Alloy
825 heat-treated at 700'C for 15 hours.
42

0 25% Cr, r2= 0.75 * 20% Cr, r2 = 0.96
* 23 % Cr, r2 = .90 519% Cr, r2 = 0.99
+ 21% Cr.r 2 = 0.99 A 17% Cr40- I I I I
19% 20%Cr Cr 21% Cr 23% Cr
, 30 \ *-t 20- /" 25% Cr
20
l o -
0
0 20 40 60Equivalent Cr Depletion Size, mm
Figure 20. Corrosion rates in boiling 65 % nitric
acid as a function of equivalent chromium
depletion zone size (nm) below various Cr levels
for Alloy 825 after solution annealing followed by
various heat treatments.
43

20 25% Cr, r2 = 0.67 * 20% Cr, r2 = 0.72
* 23% Cr, r2 = 0.66 E 19% Cr, r2 = 0.99
0 21% Cr r2 = 0.85 A 17% Cr300-
200 .. -
100 - 25% Cr
2 \ * 021%cr * 019% 20% 23% CrCr Cr
0- l I
0 20 40 60Equivalent Cr Depletion Size, nm
Figure 21. Repassivation potential in a 100 ppm
chloride solution at 95 0C as a function of
equivalent chromium depletion zone size (nm)
below various Cr levels for Alloy 825 after
solution annealing followed by various heat
treatments.
44
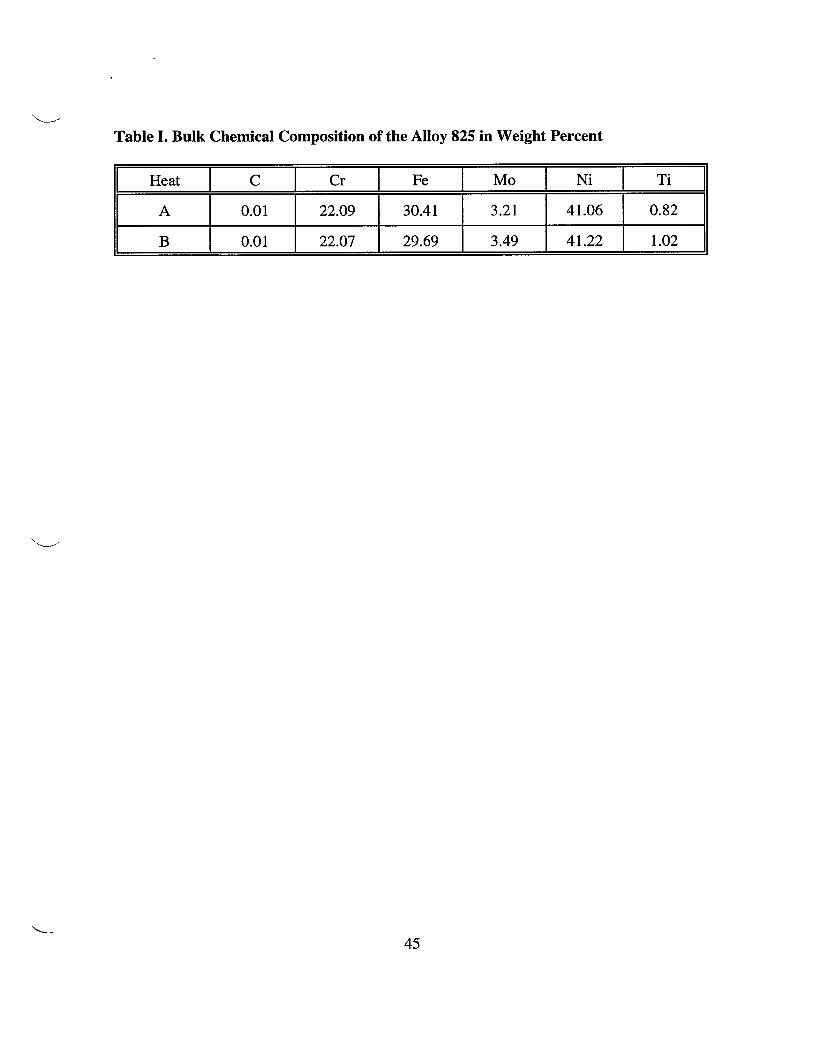
Table I. Bulk Chemical Composition of the Alloy 825 in Weight Percent
[ Heat I C I Cr I Fe I Mo I Ni I Ti
A 0.01 22.09 30.41 3.21 41.06 0.82
| _B 0.01 1 22.07 29.69 3.49 41.22 1.02
45

Table II. Chemical Composition of Grain Boundary Carbides in Atomic Percent (The + SignIndicates the 95 Percent Confidence Interval)
I Polishing Solution _ Fe Ni I Cr MO [ Perchloric Acid 10.1 2.2 9.9 ± 2.5 71.9 ± 4.7 j 4.7 ±0.9
Nitric Acid 27.2 ± 1.0 36.4 ±1.7 | 31.0 ± 2.1 2.1 0.3
46
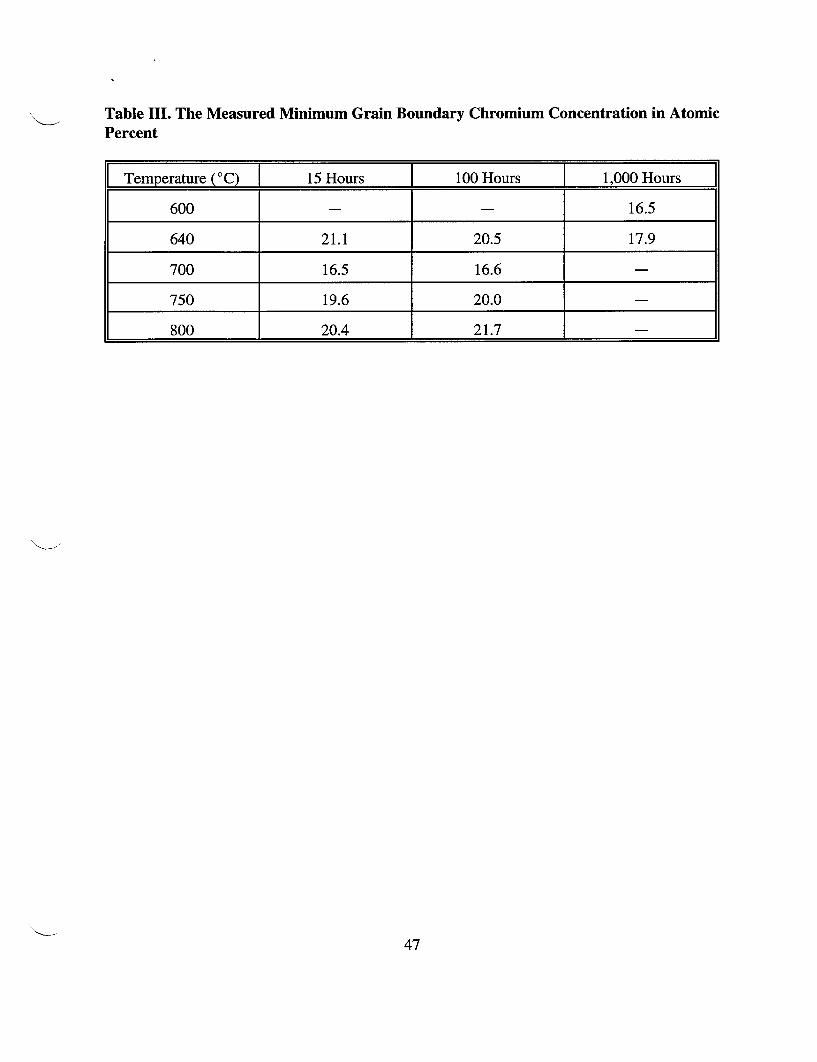
Table III. The Measured Minimum Grain Boundary Chromium Concentration in AtomicPercent
[ Temperature (C) | 15 Hours I 100 Hours I 1,000 Hours
600 16.5
640 21.1 20.5 17.9
700 16.5 16.6 _
750 19.6 20.0 _
. 800 20.4 21.7 _ .
47
FIGURE CAPTIONS
Figure 1. Effect of heat treatment temperature and time on the corrosion rate of solution-annealed
specimens of Alloy 825 (Heat A) in boiling 65 % nitric acid.
Figure 2. Effect of heat treatment temperature and time on the corrosion rate of solution-annealed
specimens of Alloy 825 (Heat B) in boiling sulfuric acid plus ferric sulfate.
Figure 3. Time-temperature-sensitization diagram for heat treated mill-annealed and
solution-annealed Alloy 825 specimens (Heat A). Corrosion rates determined in boiling 65% nitric
acid.
Figure 4. Comparison of the repassivation potential (in solid lines), EV, measured at a scan rate of
0.167 mV/s, in a 100 ppm chloride solution at 950 C and the corrosion rate (in dashed lines) in 65 %
nitric acid, for specimens of Heat B.
Figure 5. Transmission electron microscopy images of Alloy 825 solution annealed and heat-treated
at 640 C for (a) 15 hours, (b) 100 hours, and (c) 1,000 hours.
Figure 6. Transmission electron microscopy images of Alloy 825 solution annealed and heat-treated
at 700'C for (a) 15 hours and (b) 100 hours.
48

Figure 7. Transmission electron microscopy images of Alloy 825 solution annealed and heat-treated
at 750'C for (a) 15 hours and (b) 100 hours.
Figure 8. Transmission electron microscopy images of Alloy 825 solution annealed and heat-treated
at 800 C for (a) 15 hours and (b) 100 hours.
Figure 9. Chromium concentration profiles along a grain boundary of Alloy 825 containing M23C6
precipitates after heat-treated at 640 C for various time periods.
Figure 10. Chromium concentration profiles along a grain boundary of Alloy 825 containing M23C6
precipitates after heat-treated at 700 C for various time periods.
Figure 11. Chromium concentration profiles along a grain boundary of Alloy 825 containing M23C6
precipitates after heat-treated at 750 C for various time periods.
Figure 12. Chromium concentration profiles along a grain boundary of Alloy 825 containing M23C6
precipitates after heat-treated at 800 0C for various time periods.
Figure 13. Chromium concentration profiles along a grain boundary of Alloy 825 containing M23C6
precipitates after heat-treated for 15 hours at various temperatures.
49

Figure 14. Chromium concentration profiles along a grain boundary of Alloy 825 containing M23C6
precipitates after heat-treated for 100 hours at various temperatures.
Figure 15. Comparison of measured and calculated chromium depletion widths.
Figure 16. Comparison of measured and calculated chromium minimums.
Figure 17. Calculated chromium concentration profiles for Alloy 825 heat-treated for 15 hours at
various temperatures.
Figure 18. Comparison of measured and calculated chromium concentration profiles for Alloy 825
heat-treated at 700'C for 15 and 100 hours.
Figure 19. Effect of diffusion coefficient on calculated chromium concentration profiles for Alloy 825
heat-treated at 7000C for 15 hours.
Figure 20. Corrosion rates in boiling 65 % nitric acid as a function of equivalent chromium depletion
zone size (nm) below various Cr levels for Alloy 825 after solution annealing followed by various
heat treatments.
50

Figure 21. Repassivation potential in a 100 ppm chloride solution at 95 0C as a function of equivalent
chromium depletion zone size (nm) below various Cr levels for Alloy 825 after solution annealing
followed by various heat treatments.
51