Embed Size (px)
Citation preview
Graduate Survey
REPORT
MT. San Antonio College
Research & Institutional Effectiveness
October 1, 2014
Prepared by Annel D. Medina, PhD, Research & Institutional Effectiveness,
Educational Research Assessment Analyst.
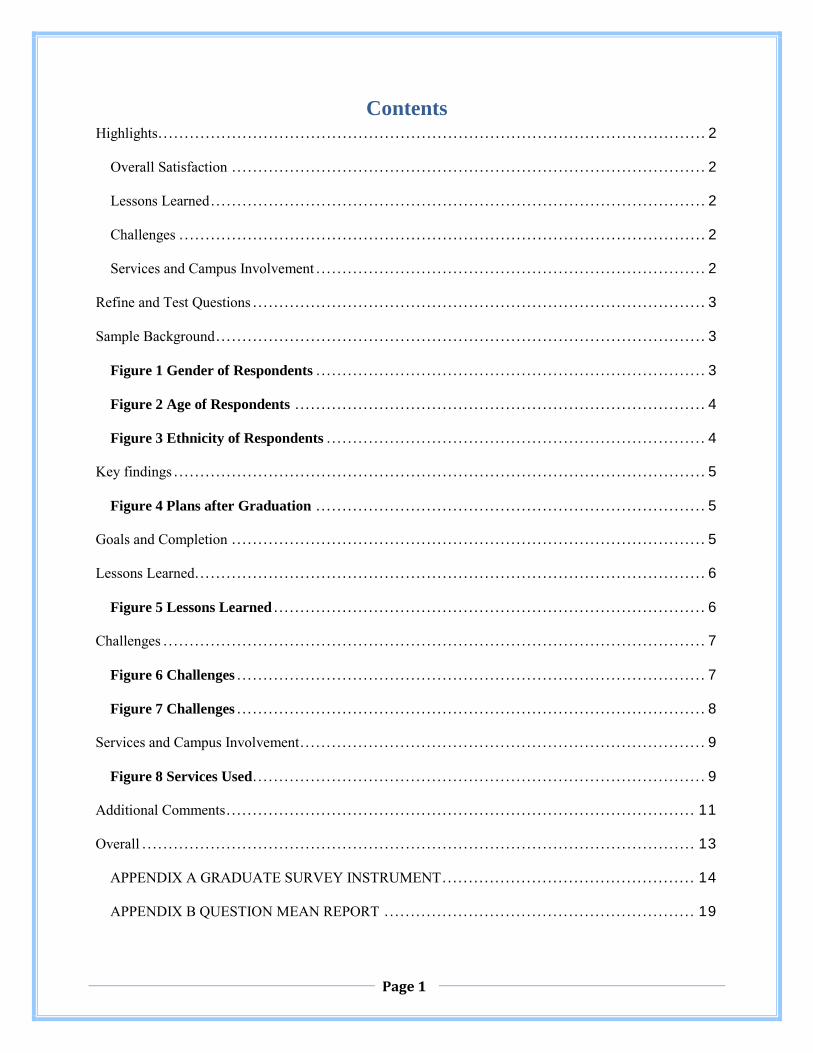
Contents Highlights ........................................................................................................ 2
Overall Satisfaction .......................................................................................... 2
Lessons Learned .............................................................................................. 2
Challenges .................................................................................................... 2
Services and Campus Involvement .......................................................................... 2
Refine and Test Questions ...................................................................................... 3
Sample Background ............................................................................................. 3
Figure 1 Gender of Respondents .......................................................................... 3
Figure 2 Age of Respondents .............................................................................. 4
Figure 3 Ethnicity of Respondents ........................................................................ 4
Key findings ..................................................................................................... 5
Figure 4 Plans after Graduation .......................................................................... 5
Goals and Completion .......................................................................................... 5
Lessons Learned ................................................................................................. 6
Figure 5 Lessons Learned .................................................................................. 6
Challenges ....................................................................................................... 7
Figure 6 Challenges ......................................................................................... 7
Figure 7 Challenges ......................................................................................... 8
Services and Campus Involvement ............................................................................. 9
Figure 8 Services Used ...................................................................................... 9
Additional Comments ......................................................................................... 11
Overall ......................................................................................................... 13
APPENDIX A GRADUATE SURVEY INSTRUMENT ................................................ 14
APPENDIX B QUESTION MEAN REPORT ........................................................... 19
Page 1
Highlights Overall Satisfaction
• Most respondents (88.22%, N=297) reported that they were satisfied with their experiences at Mt. SAC.
• In the open-ended comments section, respondents were generally satisfied with their teachers, support staff, counselors, and tutoring.
Lessons Learned • Respondents were not as confident with “Asking questions in class” (3.95 Average),
“Getting together with other students” (3.85 Average), and “Understanding current political and environmental issues” (3.83 Average).
Challenges • Students reported higher ratings amongst Financial Aid Issues (3.51 Average), Time
management and balancing work, school, and family (3.73 Average).
Services and Campus Involvement • Respondents did not use many of the services offered on campus. Highest users selected
Counseling/Advising in the Counseling Center (94%), Pell Grant/Board of Governor’s Fee Waiver (79%), and Math/MARC (69%).
• Lowest service used included Associate Student Government (14%), Campus Clubs (33%), Performance Groups, Competition Teams/Department (17%), Bridge (18%), Honors (12%), and Calworks (7%). However of the services used, a majority of respondents expressed satisfaction (Combined 3, 4, 5 ratings) with the Counseling Center (87%), Pell Grant/Board of Governor’s Fee Waiver (82%), Math/MARC (73%), Writing Center (65%), and Library Research Assistance (66%).
Page 2
Refine and Test Questions
After discussion at SP&S, a workgroup (Vice President of Student Services Audrey Yamagata-Noji, Counselor Alina Hernandez, and Educational Research Assessment Analyst Annel Medina) met over the course of 2013-14 to discuss and refine the Graduate Survey Questionnaire. Conducting a pilot study in March 2014, a group of students completed the questionnaire and then provided the workgroup with feedback to revise the survey. The survey instrument includes questions related to demographics (e.g. graduation term, gender, age, ethnicity, plans after graduation), goals and completion (e.g. educational goals, post-degree plans), lessons learned (e.g. critical thinking skills, future goals, etc.), challenges (e.g. financial issues, insufficient places to study on campus), and the use and rating of services and campus involvement (counseling services, financial aid, tutoring, student life/activities, and student services programs).
Sample Background
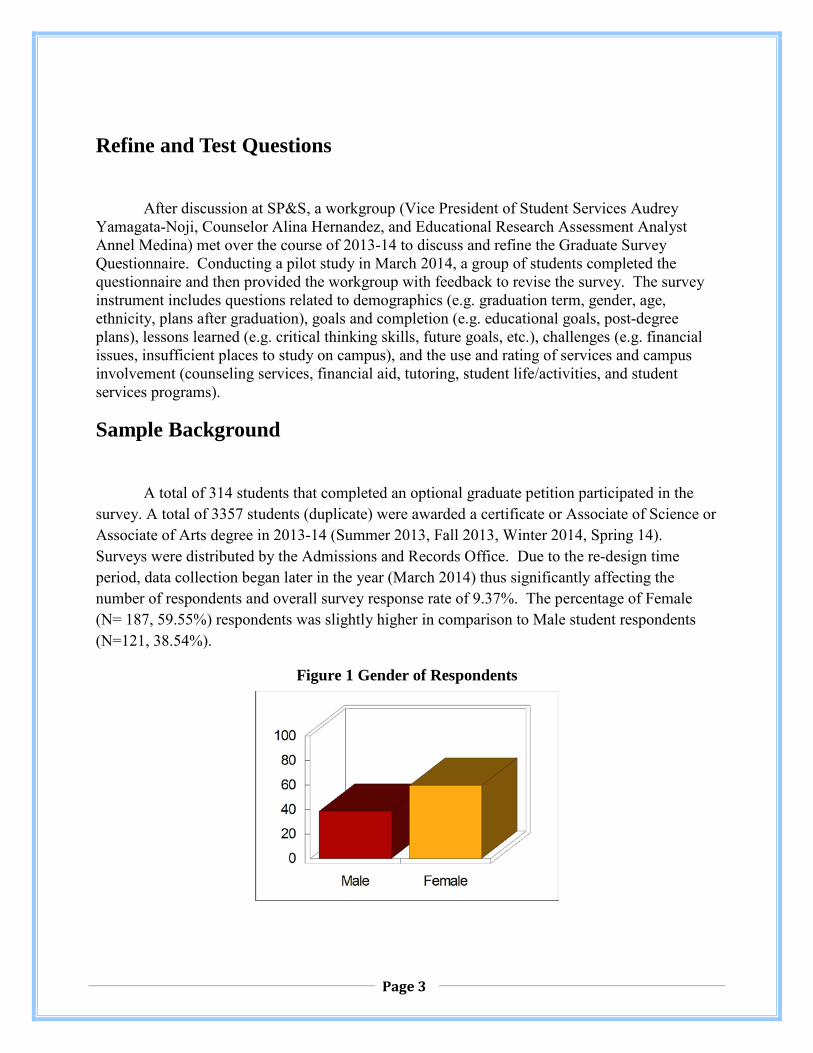
A total of 314 students that completed an optional graduate petition participated in the survey. A total of 3357 students (duplicate) were awarded a certificate or Associate of Science or Associate of Arts degree in 2013-14 (Summer 2013, Fall 2013, Winter 2014, Spring 14). Surveys were distributed by the Admissions and Records Office. Due to the re-design time period, data collection began later in the year (March 2014) thus significantly affecting the number of respondents and overall survey response rate of 9.37%. The percentage of Female (N= 187, 59.55%) respondents was slightly higher in comparison to Male student respondents (N=121, 38.54%).
Figure 1 Gender of Respondents
Page 3
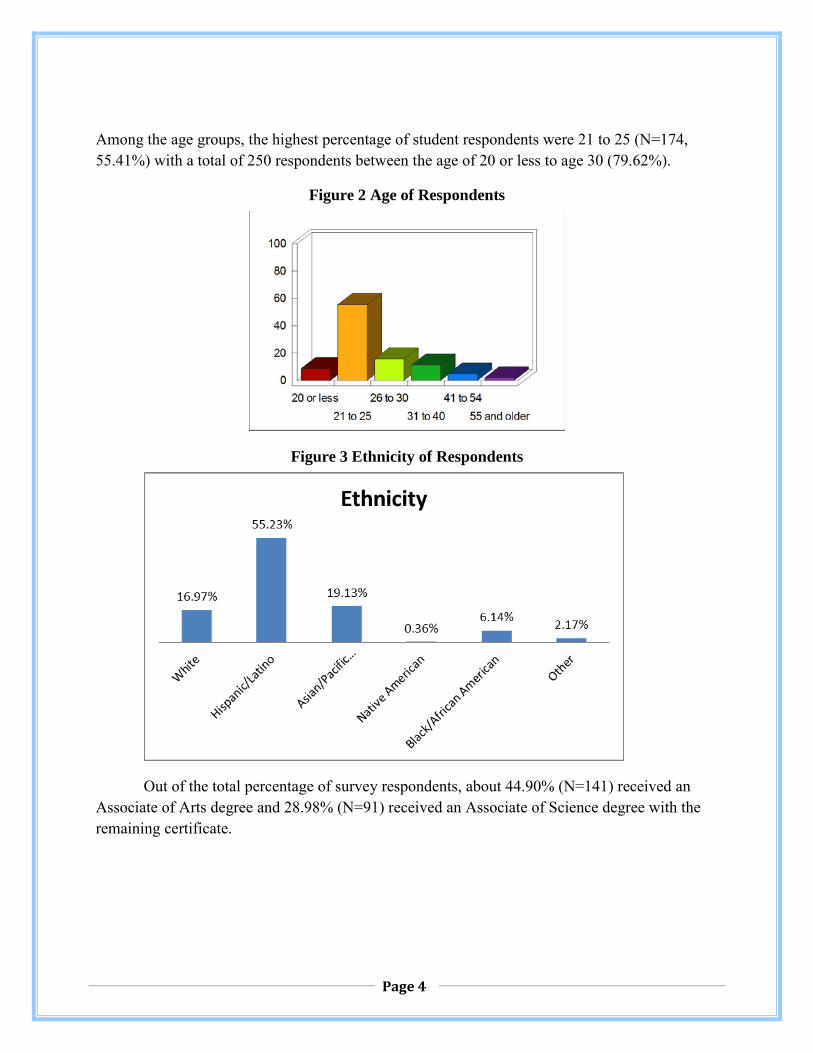
Among the age groups, the highest percentage of student respondents were 21 to 25 (N=174, 55.41%) with a total of 250 respondents between the age of 20 or less to age 30 (79.62%).
Figure 2 Age of Respondents
Figure 3 Ethnicity of Respondents
Out of the total percentage of survey respondents, about 44.90% (N=141) received an Associate of Arts degree and 28.98% (N=91) received an Associate of Science degree with the remaining certificate.
Page 4
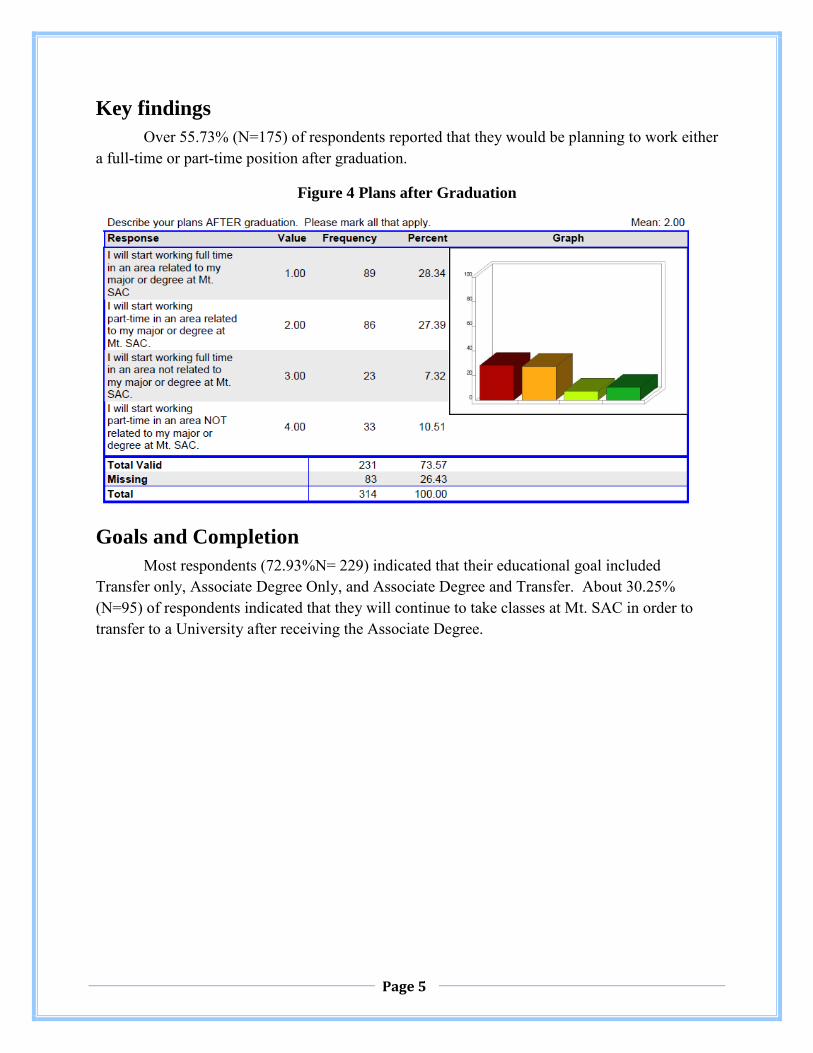
Key findings Over 55.73% (N=175) of respondents reported that they would be planning to work either a full-time or part-time position after graduation.
Figure 4 Plans after Graduation
Goals and Completion Most respondents (72.93%N= 229) indicated that their educational goal included
Transfer only, Associate Degree Only, and Associate Degree and Transfer. About 30.25% (N=95) of respondents indicated that they will continue to take classes at Mt. SAC in order to transfer to a University after receiving the Associate Degree.
Page 5
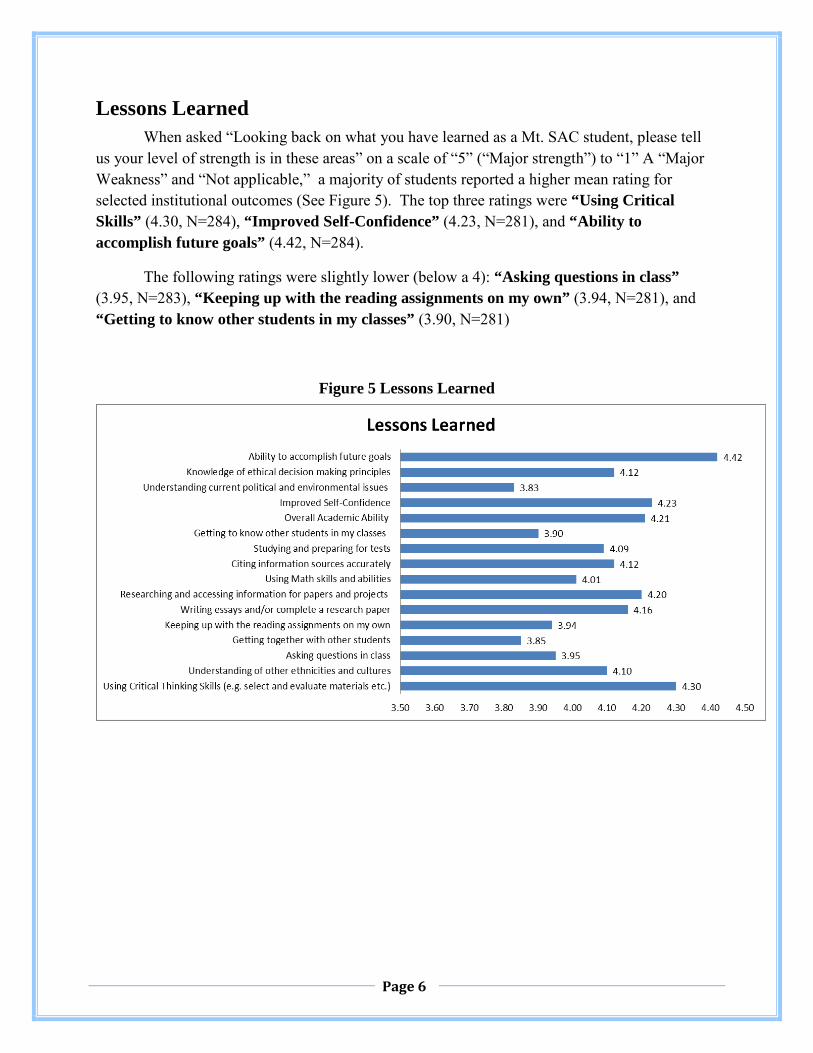
Lessons Learned When asked “Looking back on what you have learned as a Mt. SAC student, please tell
us your level of strength is in these areas” on a scale of “5” (“Major strength”) to “1” A “Major Weakness” and “Not applicable,” a majority of students reported a higher mean rating for selected institutional outcomes (See Figure 5). The top three ratings were “Using Critical Skills” (4.30, N=284), “Improved Self-Confidence” (4.23, N=281), and “Ability to accomplish future goals” (4.42, N=284).
The following ratings were slightly lower (below a 4): “Asking questions in class” (3.95, N=283), “Keeping up with the reading assignments on my own” (3.94, N=281), and “Getting to know other students in my classes” (3.90, N=281)
Figure 5 Lessons Learned
Page 6
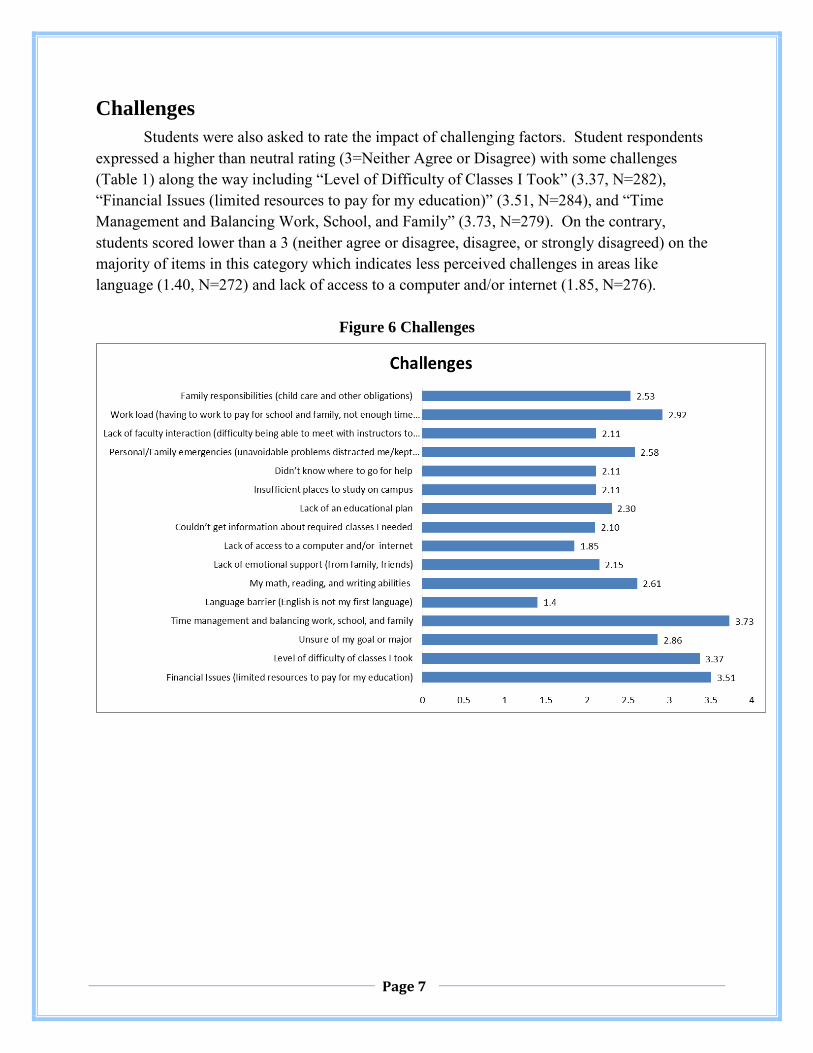
Challenges Students were also asked to rate the impact of challenging factors. Student respondents expressed a higher than neutral rating (3=Neither Agree or Disagree) with some challenges (Table 1) along the way including “Level of Difficulty of Classes I Took” (3.37, N=282), “Financial Issues (limited resources to pay for my education)” (3.51, N=284), and “Time Management and Balancing Work, School, and Family” (3.73, N=279). On the contrary, students scored lower than a 3 (neither agree or disagree, disagree, or strongly disagreed) on the majority of items in this category which indicates less perceived challenges in areas like language (1.40, N=272) and lack of access to a computer and/or internet (1.85, N=276).
Figure 6 Challenges
Page 7
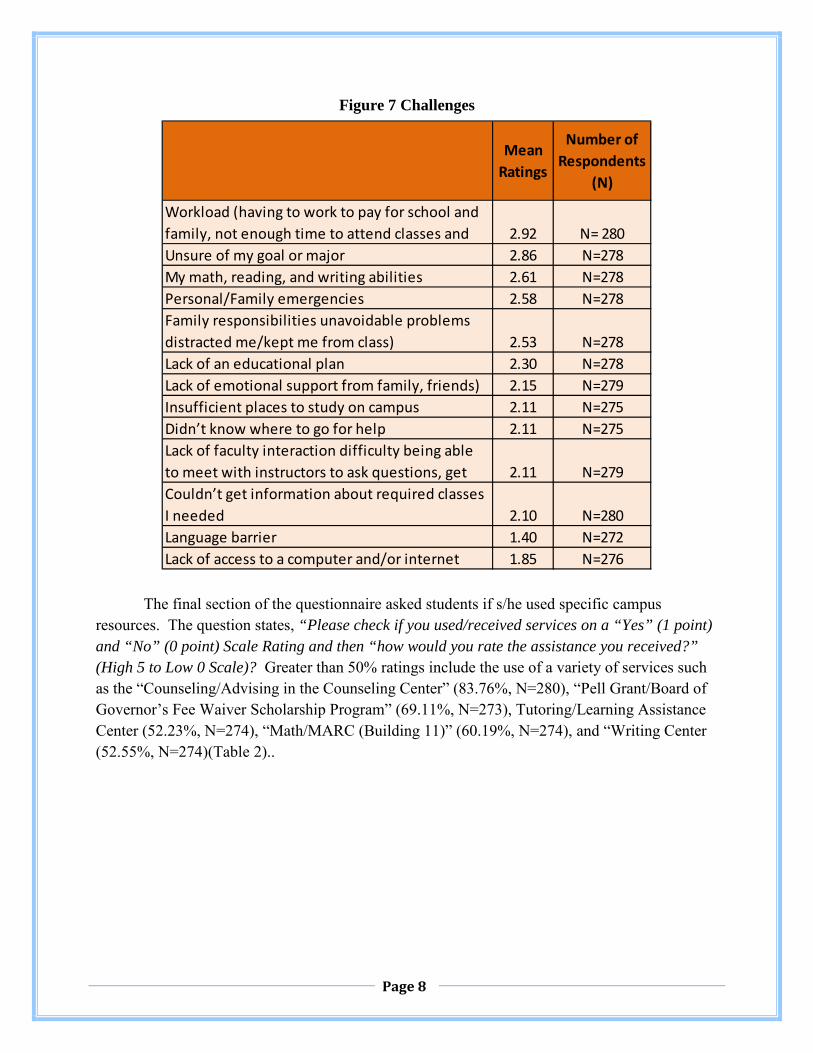
Figure 7 Challenges
Mean Ratings
Number of Respondents
(N)
Workload (having to work to pay for school and family, not enough time to attend classes and 2.92 N= 280Unsure of my goal or major 2.86 N=278My math, reading, and writing abilities 2.61 N=278Personal/Family emergencies 2.58 N=278Family responsibilities unavoidable problems distracted me/kept me from class) 2.53 N=278Lack of an educational plan 2.30 N=278Lack of emotional support from family, friends) 2.15 N=279Insufficient places to study on campus 2.11 N=275Didn’t know where to go for help 2.11 N=275Lack of faculty interaction difficulty being able to meet with instructors to ask questions, get 2.11 N=279Couldn’t get information about required classes I needed 2.10 N=280Language barrier 1.40 N=272Lack of access to a computer and/or internet 1.85 N=276
The final section of the questionnaire asked students if s/he used specific campus resources. The question states, “Please check if you used/received services on a “Yes” (1 point) and “No” (0 point) Scale Rating and then “how would you rate the assistance you received?” (High 5 to Low 0 Scale)? Greater than 50% ratings include the use of a variety of services such as the “Counseling/Advising in the Counseling Center” (83.76%, N=280), “Pell Grant/Board of Governor’s Fee Waiver Scholarship Program” (69.11%, N=273), Tutoring/Learning Assistance Center (52.23%, N=274), “Math/MARC (Building 11)” (60.19%, N=274), and “Writing Center (52.55%, N=274)(Table 2)..
Page 8
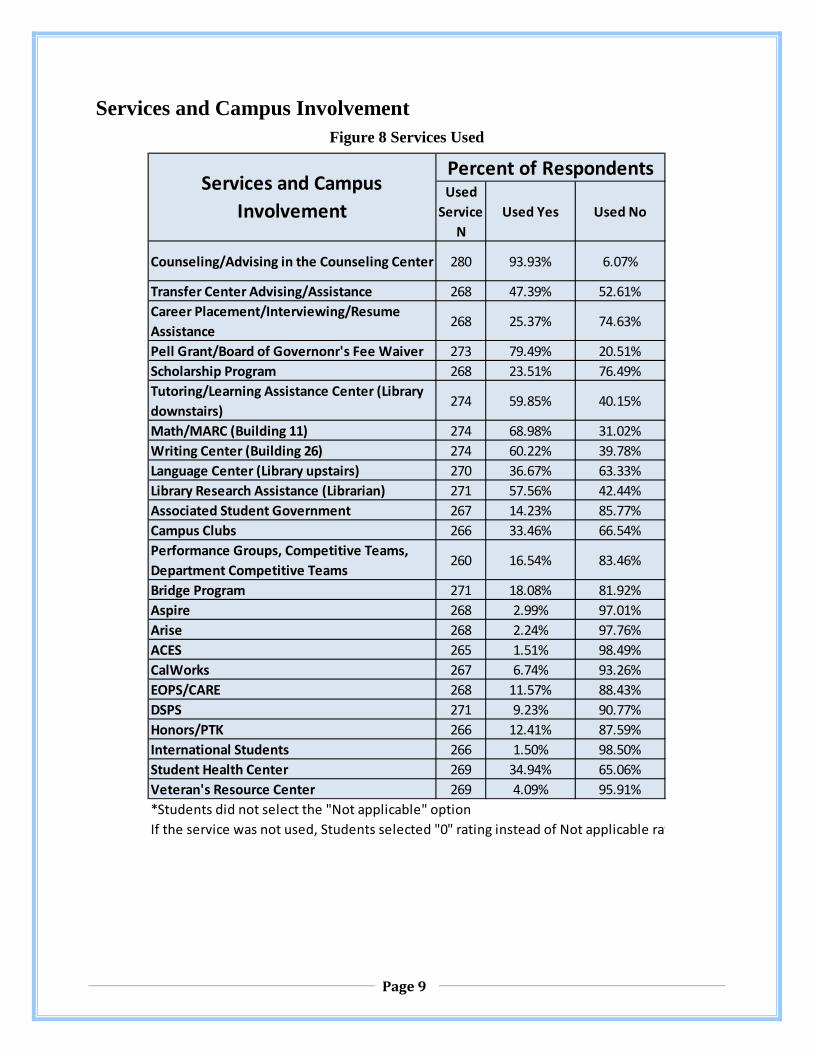
Services and Campus Involvement Figure 8 Services Used
Used Service
NUsed Yes Used No
Counseling/Advising in the Counseling Center 280 93.93% 6.07%
Transfer Center Advising/Assistance 268 47.39% 52.61%Career Placement/Interviewing/Resume Assistance
268 25.37% 74.63%
Pell Grant/Board of Governonr's Fee Waiver 273 79.49% 20.51%Scholarship Program 268 23.51% 76.49%Tutoring/Learning Assistance Center (Library downstairs)
274 59.85% 40.15%
Math/MARC (Building 11) 274 68.98% 31.02%Writing Center (Building 26) 274 60.22% 39.78%Language Center (Library upstairs) 270 36.67% 63.33%Library Research Assistance (Librarian) 271 57.56% 42.44%Associated Student Government 267 14.23% 85.77%Campus Clubs 266 33.46% 66.54%Performance Groups, Competitive Teams, Department Competitive Teams
260 16.54% 83.46%
Bridge Program 271 18.08% 81.92%Aspire 268 2.99% 97.01%Arise 268 2.24% 97.76%ACES 265 1.51% 98.49%CalWorks 267 6.74% 93.26%EOPS/CARE 268 11.57% 88.43%DSPS 271 9.23% 90.77%Honors/PTK 266 12.41% 87.59%International Students 266 1.50% 98.50%Student Health Center 269 34.94% 65.06%Veteran's Resource Center 269 4.09% 95.91%*Students did not select the "Not applicable" optionIf the service was not used, Students selected "0" rating instead of Not applicable rat
Services and Campus Involvement
Percent of Respondents
Page 9
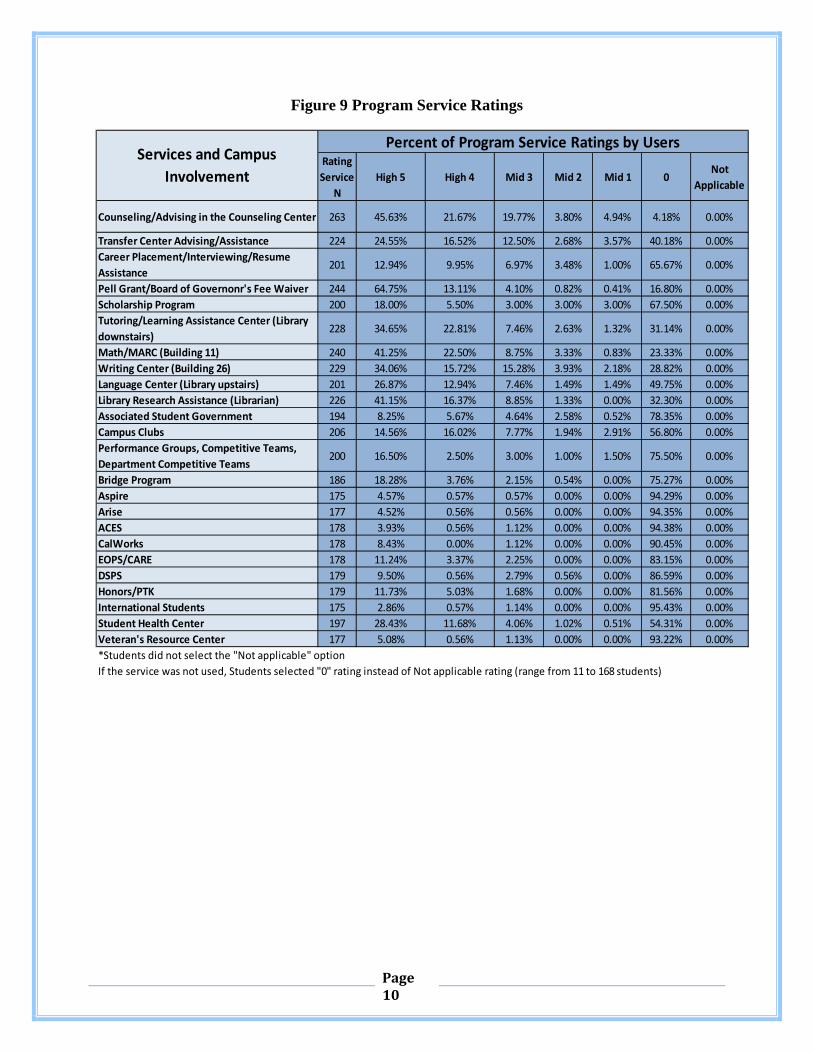
Figure 9 Program Service Ratings
Rating Service
NHigh 5 High 4 Mid 3 Mid 2 Mid 1 0
Not Applicable
Counseling/Advising in the Counseling Center 263 45.63% 21.67% 19.77% 3.80% 4.94% 4.18% 0.00%
Transfer Center Advising/Assistance 224 24.55% 16.52% 12.50% 2.68% 3.57% 40.18% 0.00%Career Placement/Interviewing/Resume Assistance
201 12.94% 9.95% 6.97% 3.48% 1.00% 65.67% 0.00%
Pell Grant/Board of Governonr's Fee Waiver 244 64.75% 13.11% 4.10% 0.82% 0.41% 16.80% 0.00%Scholarship Program 200 18.00% 5.50% 3.00% 3.00% 3.00% 67.50% 0.00%Tutoring/Learning Assistance Center (Library downstairs)
228 34.65% 22.81% 7.46% 2.63% 1.32% 31.14% 0.00%
Math/MARC (Building 11) 240 41.25% 22.50% 8.75% 3.33% 0.83% 23.33% 0.00%Writing Center (Building 26) 229 34.06% 15.72% 15.28% 3.93% 2.18% 28.82% 0.00%Language Center (Library upstairs) 201 26.87% 12.94% 7.46% 1.49% 1.49% 49.75% 0.00%Library Research Assistance (Librarian) 226 41.15% 16.37% 8.85% 1.33% 0.00% 32.30% 0.00%Associated Student Government 194 8.25% 5.67% 4.64% 2.58% 0.52% 78.35% 0.00%Campus Clubs 206 14.56% 16.02% 7.77% 1.94% 2.91% 56.80% 0.00%Performance Groups, Competitive Teams, Department Competitive Teams
200 16.50% 2.50% 3.00% 1.00% 1.50% 75.50% 0.00%
Bridge Program 186 18.28% 3.76% 2.15% 0.54% 0.00% 75.27% 0.00%Aspire 175 4.57% 0.57% 0.57% 0.00% 0.00% 94.29% 0.00%Arise 177 4.52% 0.56% 0.56% 0.00% 0.00% 94.35% 0.00%ACES 178 3.93% 0.56% 1.12% 0.00% 0.00% 94.38% 0.00%CalWorks 178 8.43% 0.00% 1.12% 0.00% 0.00% 90.45% 0.00%EOPS/CARE 178 11.24% 3.37% 2.25% 0.00% 0.00% 83.15% 0.00%DSPS 179 9.50% 0.56% 2.79% 0.56% 0.00% 86.59% 0.00%Honors/PTK 179 11.73% 5.03% 1.68% 0.00% 0.00% 81.56% 0.00%International Students 175 2.86% 0.57% 1.14% 0.00% 0.00% 95.43% 0.00%Student Health Center 197 28.43% 11.68% 4.06% 1.02% 0.51% 54.31% 0.00%Veteran's Resource Center 177 5.08% 0.56% 1.13% 0.00% 0.00% 93.22% 0.00%*Students did not select the "Not applicable" optionIf the service was not used, Students selected "0" rating instead of Not applicable rating (range from 11 to 168 students)
Services and Campus Involvement
Percent of Program Service Ratings by Users
Page 10
Additional Comments
Most respondents did not provide additional open ended comments (See Figure 10 Open Ended Comment Responses by Suggested Priorities). However students (122 Number) did provide some additional recommendations and/or comments. A total of 72 individuals out of the 122 responses described their experience with Mt. SAC in a positive manner. Respondents were generally satisfied with their teachers, support staff, counselors, and tutoring. Conversely, students also described some suggestions in terms increasing the number of counseling staff, requiring students to visit with a counselor at least once a semester, producing consistent information between counselors, and increasing appointment availability with counselors. Students reported lower levels of satisfaction with campus parking, class offerings, financial aid processing times, study locations, and campus food offerings.
Page 11
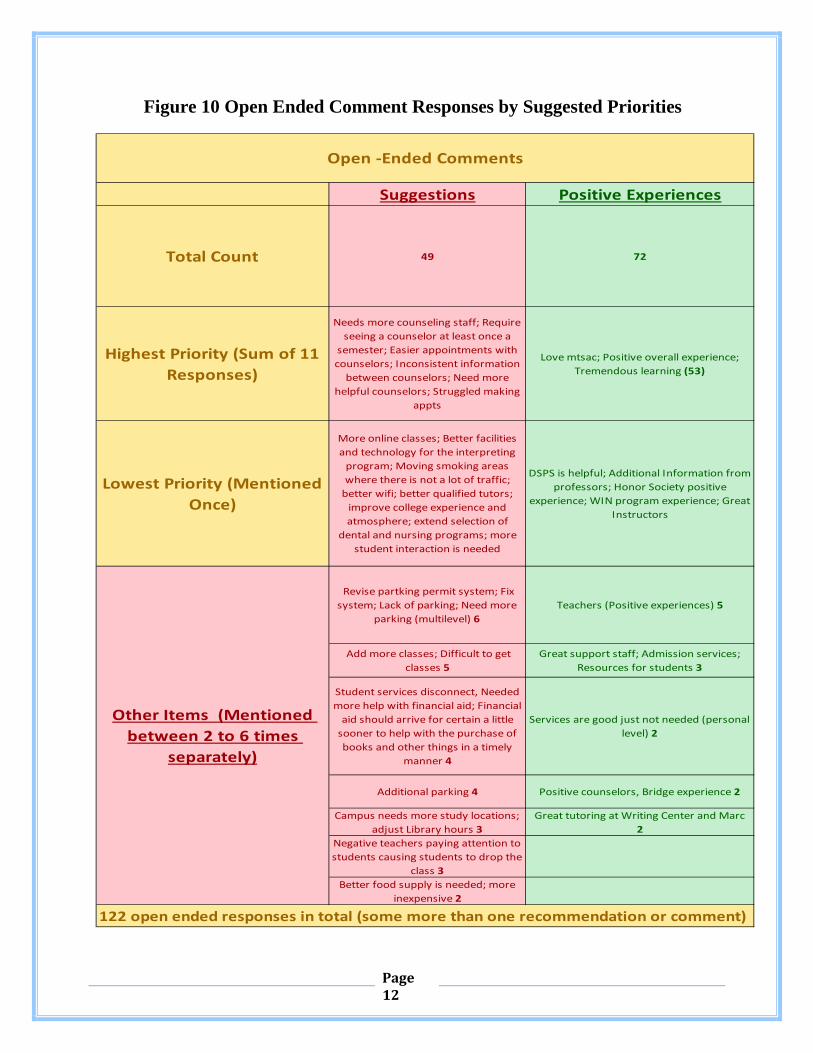
Figure 10 Open Ended Comment Responses by Suggested Priorities
Suggestions Positive Experiences
Total Count 49 72
Highest Priority (Sum of 11 Responses)
Needs more counseling staff; Require seeing a counselor at least once a
semester; Easier appointments with counselors; Inconsistent information
between counselors; Need more helpful counselors; Struggled making
appts
Love mtsac; Positive overall experience; Tremendous learning (53)
Lowest Priority (Mentioned Once)
More online classes; Better facilities and technology for the interpreting
program; Moving smoking areas where there is not a lot of traffic;
better wifi; better qualified tutors; improve college experience and atmosphere; extend selection of
dental and nursing programs; more student interaction is needed
DSPS is helpful; Additional Information from professors; Honor Society positive
experience; WIN program experience; Great Instructors
Revise partking permit system; Fix system; Lack of parking; Need more
parking (multilevel) 6Teachers (Positive experiences) 5
Add more classes; Difficult to get classes 5
Great support staff; Admission services; Resources for students 3
Student services disconnect, Needed more help with financial aid; Financial
aid should arrive for certain a little sooner to help with the purchase of books and other things in a timely
manner 4
Services are good just not needed (personal level) 2
Additional parking 4 Positive counselors, Bridge experience 2
Campus needs more study locations; adjust Library hours 3
Great tutoring at Writing Center and Marc 2
Negative teachers paying attention to students causing students to drop the
class 3Better food supply is needed; more
inexpensive 2
Other Items (Mentioned between 2 to 6 times
separately)
122 open ended responses in total (some more than one recommendation or comment)
Open -Ended Comments
Page 12
Overall • Taking another look at the Services and Campus Involvement section, other items that
performed slightly lower (below .5) could potentially be due to the structure of the survey which if the service did not apply to them then students appeared to select “O” instead of the “Not applicable” option. This option impacted the results in a negative manner.
• Institutional outcome ratings like Critical Thinking (Mean=4.30, N= 284), Essay Writing
(Mean=4.16, N=284), and Math Skills (Mean 4.01, N=284) described some of the learning taking place.
Thank you to the workgroup (Vice President of Student Services Audrey Yamagata-Noji, Counselor Alina Hernandez, and Educational Research Assessment Analyst Annel Medina) and
Admissions and Records Assistant Director Patricia Montoya.
Page 13
APPENDIX A GRADUATE SURVEY INSTRUMENT
Page 14
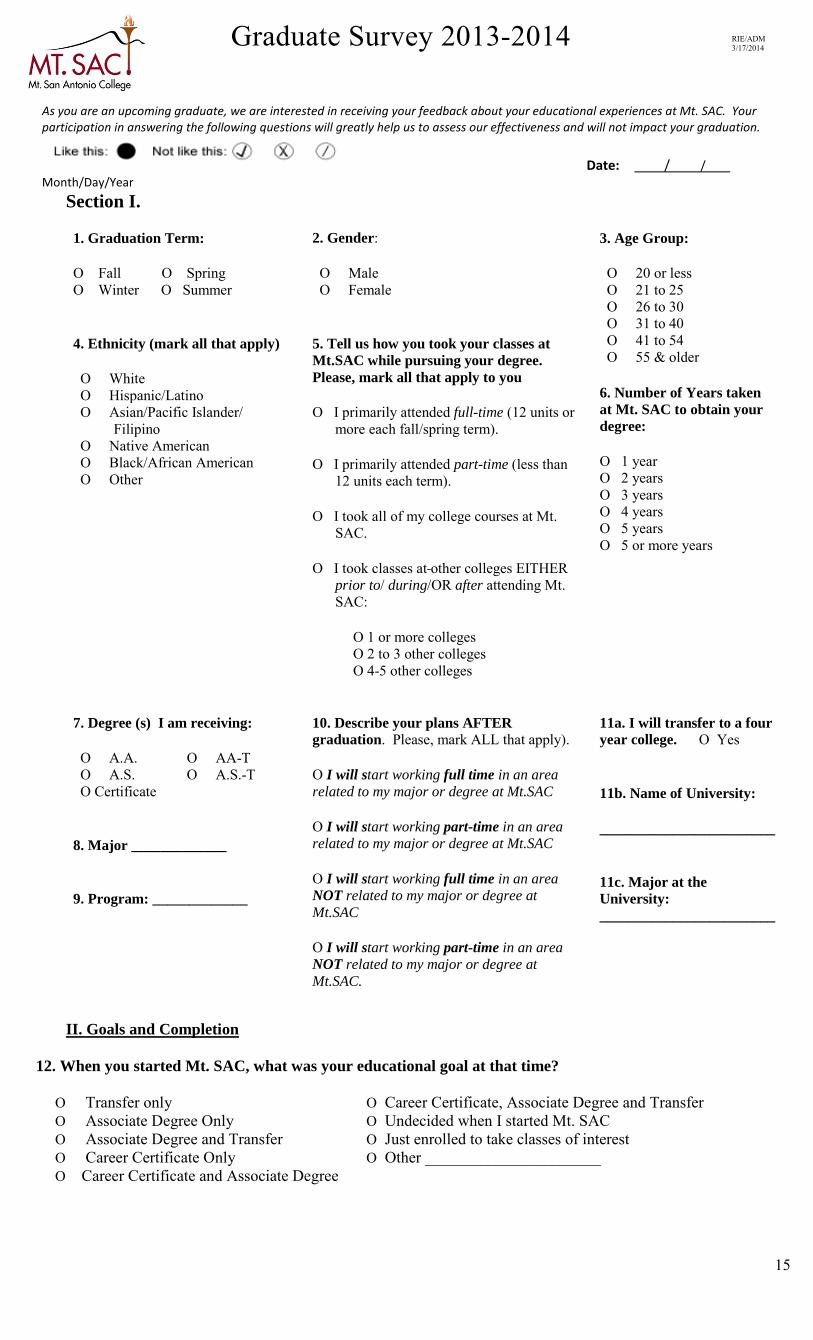
Graduate Survey 2013-2014
As you are an upcoming graduate, we are interested in receiving your feedback about your educational experiences at Mt. SAC. Your participation in answering the following questions will greatly help us to assess our effectiveness and will not impact your graduation.
Date: / / Month/Day/Year
Section I.
1. Graduation Term:
O Fall O Spring O Winter O Summer
4. Ethnicity (mark all that apply)
O White O Hispanic/Latino O Asian/Pacific Islander/
Filipino O Native American O Black/African American O Other
2. Gender:
O Male O Female
5. Tell us how you took your classes atMt.SAC while pursuing your degree. Please, mark all that apply to you
O I primarily attended full-time (12 units or more each fall/spring term).
O I primarily attended part-time (less than 12 units each term).
O I took all of my college courses at Mt. SAC.
O I took classes at other colleges EITHER prior to/ during/OR after attending Mt. SAC:
O 1 or more colleges O 2 to 3 other colleges O 4-5 other colleges
3. Age Group:
O 20 or less O 21 to 25 O 26 to 30 O 31 to 40 O 41 to 54 O 55 & older
6. Number of Years takenat Mt. SAC to obtain your degree:
O 1 year O 2 years O 3 years O 4 years O 5 years O 5 or more years
7. Degree (s) I am receiving:
O A.A. O AA-T O A.S. O A.S.-T O Certificate
8. Major _____________
9. Program: _____________
10. Describe your plans AFTERgraduation. Please, mark ALL that apply).
O I will start working full time in an area related to my major or degree at Mt.SAC
O I will start working part-time in an area related to my major or degree at Mt.SAC
O I will start working full time in an area NOT related to my major or degree at Mt.SAC
O I will start working part-time in an area NOT related to my major or degree at Mt.SAC.
11a. I will transfer to a four year college. O Yes
11b. Name of University:
________________________
11c. Major at the University: ________________________
II. Goals and Completion
12. When you started Mt. SAC, what was your educational goal at that time?
O Transfer only O Career Certificate, Associate Degree and Transfer O Associate Degree Only O Undecided when I started Mt. SAC O Associate Degree and Transfer O Just enrolled to take classes of interest O Career Certificate Only O Other ______________________ O Career Certificate and Associate Degree
RIE/ADM 3/17/2014
15
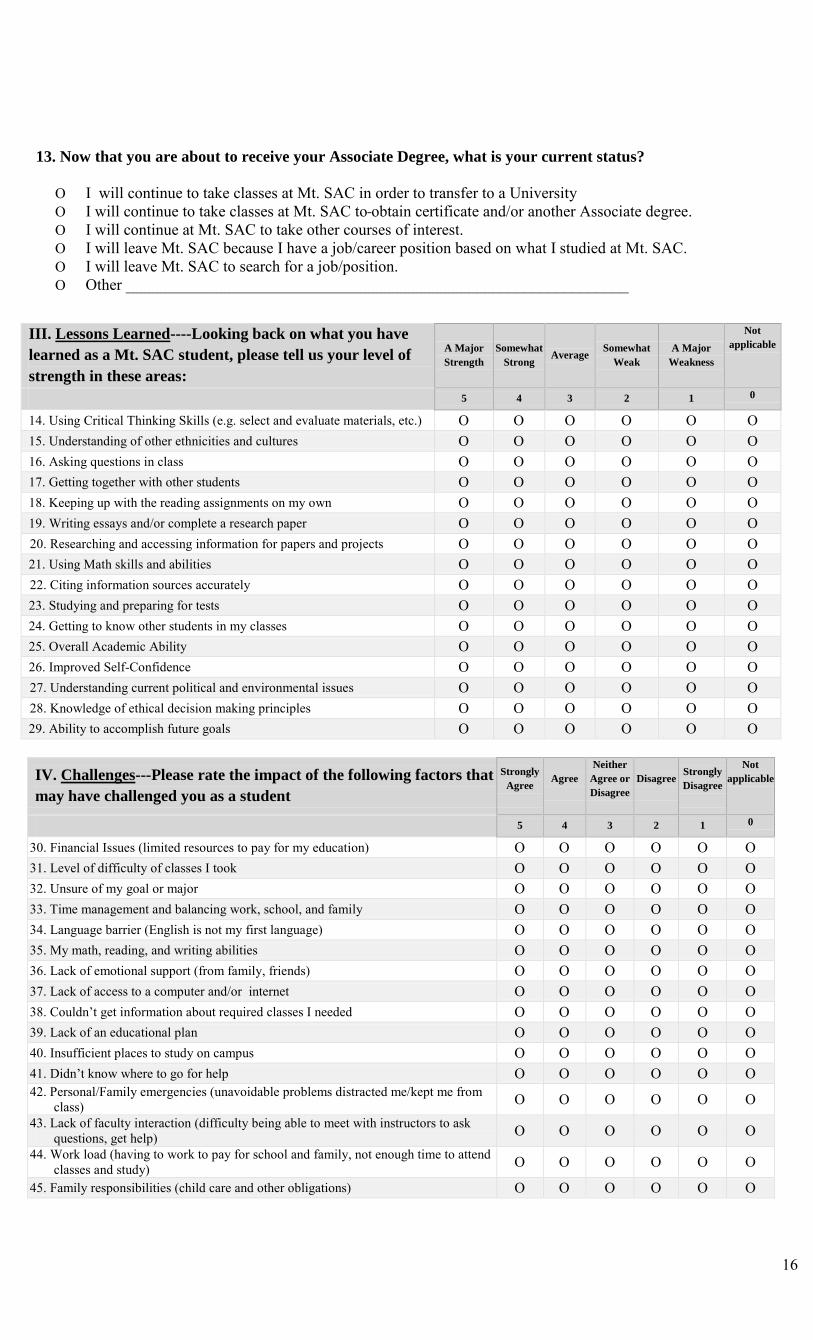
13. Now that you are about to receive your Associate Degree, what is your current status?
O I will continue to take classes at Mt. SAC in order to transfer to a University O I will continue to take classes at Mt. SAC to obtain certificate and/or another Associate degree. O I will continue at Mt. SAC to take other courses of interest. O I will leave Mt. SAC because I have a job/career position based on what I studied at Mt. SAC. O I will leave Mt. SAC to search for a job/position. O Other _______________________________________________________________
III. Lessons Learned----Looking back on what you havelearned as a Mt. SAC student, please tell us your level of strength in these areas:
A Major Strength
Somewhat Strong
Average Somewhat Weak
A Major Weakness
Not applicable
5 4 3 2 1 0
14. Using Critical Thinking Skills (e.g. select and evaluate materials, etc.) O O O O O O 15. Understanding of other ethnicities and cultures O O O O O O 16. Asking questions in class O O O O O O 17. Getting together with other students O O O O O O 18. Keeping up with the reading assignments on my own O O O O O O 19. Writing essays and/or complete a research paper O O O O O O 20. Researching and accessing information for papers and projects O O O O O O 21. Using Math skills and abilities O O O O O O 22. Citing information sources accurately O O O O O O 23. Studying and preparing for tests O O O O O O 24. Getting to know other students in my classes O O O O O O 25. Overall Academic Ability O O O O O O 26. Improved Self-Confidence O O O O O O 27. Understanding current political and environmental issues O O O O O O 28. Knowledge of ethical decision making principles O O O O O O 29. Ability to accomplish future goals O O O O O O
IV. Challenges---Please rate the impact of the following factors thatmay have challenged you as a student
Strongly Agree Agree
Neither Agree or Disagree
Disagree Strongly Disagree
Not applicable
5 4 3 2 1 0
30. Financial Issues (limited resources to pay for my education) O O O O O O 31. Level of difficulty of classes I took O O O O O O 32. Unsure of my goal or major O O O O O O 33. Time management and balancing work, school, and family O O O O O O 34. Language barrier (English is not my first language) O O O O O O 35. My math, reading, and writing abilities O O O O O O 36. Lack of emotional support (from family, friends) O O O O O O 37. Lack of access to a computer and/or internet O O O O O O 38. Couldn’t get information about required classes I needed O O O O O O 39. Lack of an educational plan O O O O O O 40. Insufficient places to study on campus O O O O O O 41. Didn’t know where to go for help O O O O O O 42. Personal/Family emergencies (unavoidable problems distracted me/kept me from
class) O O O O O O 43. Lack of faculty interaction (difficulty being able to meet with instructors to ask
questions, get help) O O O O O O 44. Work load (having to work to pay for school and family, not enough time to attend
classes and study) O O O O O O 45. Family responsibilities (child care and other obligations) O O O O O O
16
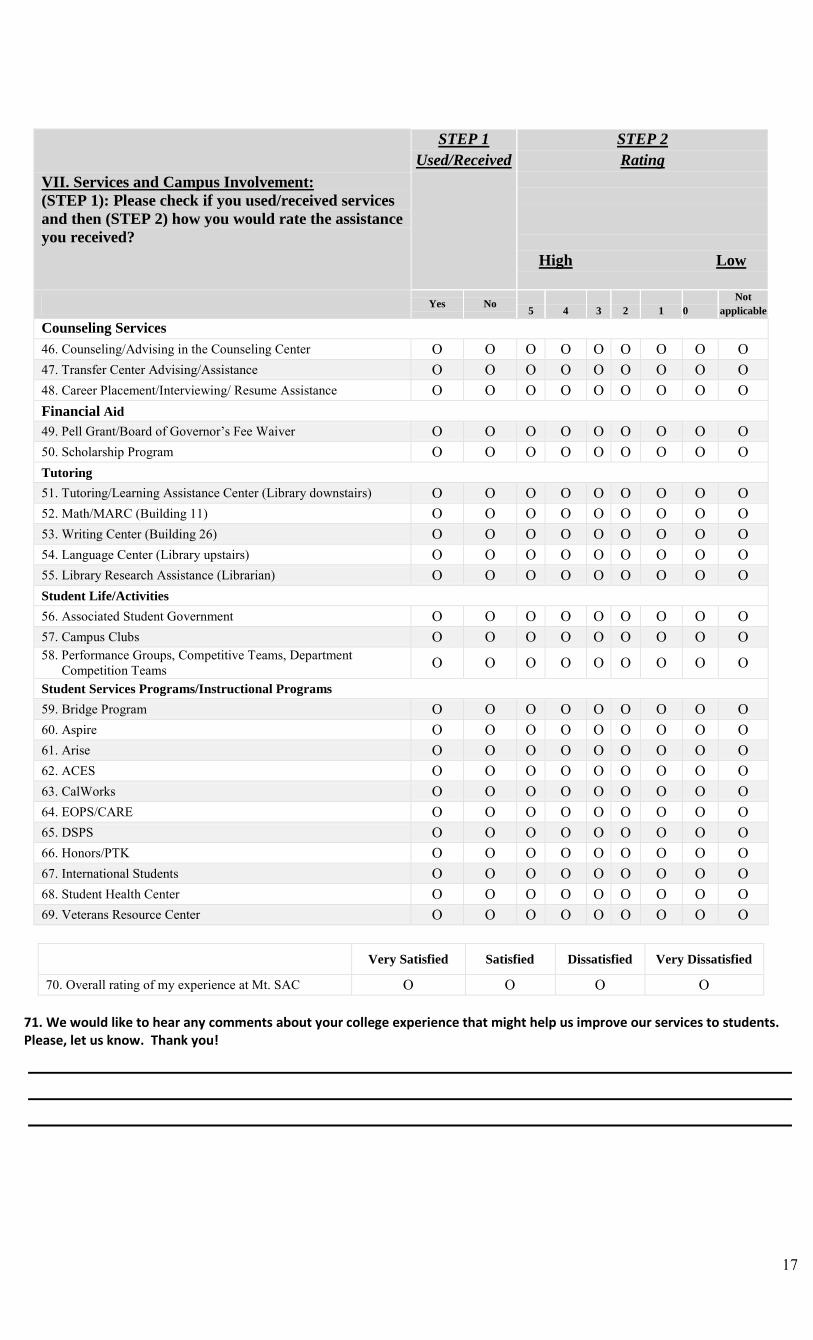
VII. Services and Campus Involvement:(STEP 1): Please check if you used/received services and then (STEP 2) how you would rate the assistance you received?
STEP 1 Used/Received
STEP 2 Rating
High Low
Yes No 5 4 3 2 1 0 Not
applicable
Counseling Services
46. Counseling/Advising in the Counseling Center O O O O O O O O O 47. Transfer Center Advising/Assistance O O O O O O O O O 48. Career Placement/Interviewing/ Resume Assistance O O O O O O O O O Financial Aid 49. Pell Grant/Board of Governor’s Fee Waiver O O O O O O O O O 50. Scholarship Program O O O O O O O O O Tutoring 51. Tutoring/Learning Assistance Center (Library downstairs) O O O O O O O O O 52. Math/MARC (Building 11) O O O O O O O O O 53. Writing Center (Building 26) O O O O O O O O O 54. Language Center (Library upstairs) O O O O O O O O O 55. Library Research Assistance (Librarian) O O O O O O O O O Student Life/Activities 56. Associated Student Government O O O O O O O O O 57. Campus Clubs O O O O O O O O O 58. Performance Groups, Competitive Teams, Department
Competition Teams O O O O O O O O O Student Services Programs/Instructional Programs 59. Bridge Program O O O O O O O O O 60. Aspire O O O O O O O O O 61. Arise O O O O O O O O O 62. ACES O O O O O O O O O 63. CalWorks O O O O O O O O O 64. EOPS/CARE O O O O O O O O O 65. DSPS O O O O O O O O O 66. Honors/PTK O O O O O O O O O 67. International Students O O O O O O O O O 68. Student Health Center O O O O O O O O O 69. Veterans Resource Center O O O O O O O O O
Very Satisfied Satisfied Dissatisfied Very Dissatisfied
70. Overall rating of my experience at Mt. SAC O O O O
71. We would like to hear any comments about your college experience that might help us improve our services to students.Please, let us know. Thank you!
17

Graduation Ceremony
The Mt. SAC Commencement Ceremony is scheduled for June.
Please share with us any interesting, unusual, noteworthy facts or accomplishments related to your graduation from Mt. SAC. This will help us in preparing a report about this year’s graduating class. For example, are you graduating along with another immediate family member? Are you a current employee of Mt. SAC? If you are over 50, do you mind sharing your age and any other information (number of children, grandchildren, etc.)? Have you recently returned from active military duty?
If you were interested in having us share the above information during the graduation ceremony, let us know how we could contact you. Please, provide for us the following information:
Name: Address: City/Zip: Phone (work) Phone (home) Phone (cell) Email
O I plan to attend. O I do not plan to attend.
18
APPENDIX B QUESTION MEAN REPORT
Page 19
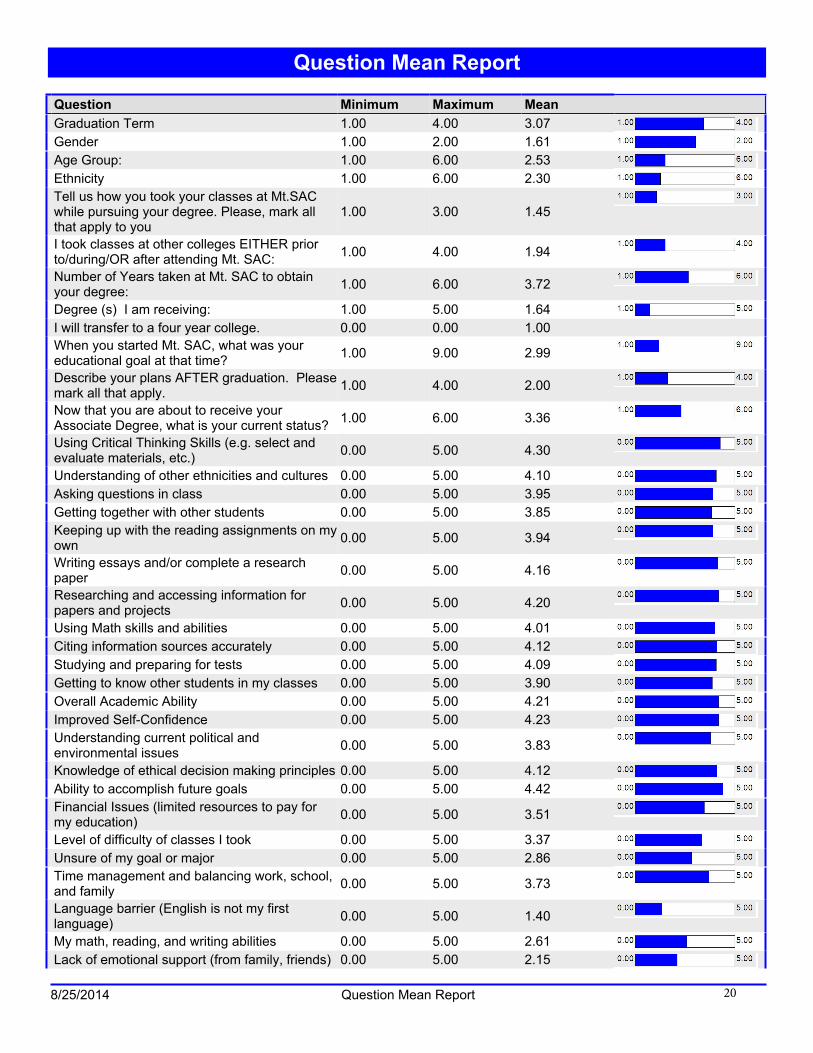
MeanQuestion Minimum MaximumGraduation Term 3.074.001.00Gender 1.612.001.00Age Group: 2.536.001.00Ethnicity 2.306.001.00Tell us how you took your classes at Mt.SACwhile pursuing your degree. Please, mark allthat apply to you
1.453.001.00I took classes at other colleges EITHER priorto/during/OR after attending Mt. SAC: 1.944.001.00Number of Years taken at Mt. SAC to obtainyour degree: 3.726.001.00Degree (s) I am receiving: 1.645.001.00I will transfer to a four year college. 1.000.000.00When you started Mt. SAC, what was youreducational goal at that time? 2.999.001.00Describe your plans AFTER graduation. Pleasemark all that apply. 2.004.001.00Now that you are about to receive yourAssociate Degree, what is your current status? 3.366.001.00Using Critical Thinking Skills (e.g. select andevaluate materials, etc.) 4.305.000.00Understanding of other ethnicities and cultures 4.105.000.00Asking questions in class 3.955.000.00Getting together with other students 3.855.000.00Keeping up with the reading assignments on myown 3.945.000.00Writing essays and/or complete a researchpaper 4.165.000.00Researching and accessing information forpapers and projects 4.205.000.00Using Math skills and abilities 4.015.000.00Citing information sources accurately 4.125.000.00Studying and preparing for tests 4.095.000.00Getting to know other students in my classes 3.905.000.00Overall Academic Ability 4.215.000.00Improved Self-Confidence 4.235.000.00Understanding current political andenvironmental issues 3.835.000.00Knowledge of ethical decision making principles 4.125.000.00Ability to accomplish future goals 4.425.000.00Financial Issues (limited resources to pay formy education) 3.515.000.00Level of difficulty of classes I took 3.375.000.00Unsure of my goal or major 2.865.000.00Time management and balancing work, school,and family 3.735.000.00Language barrier (English is not my firstlanguage) 1.405.000.00My math, reading, and writing abilities 2.615.000.00Lack of emotional support (from family, friends) 2.155.000.00
Question Mean Report
Question Mean Report 208/25/2014
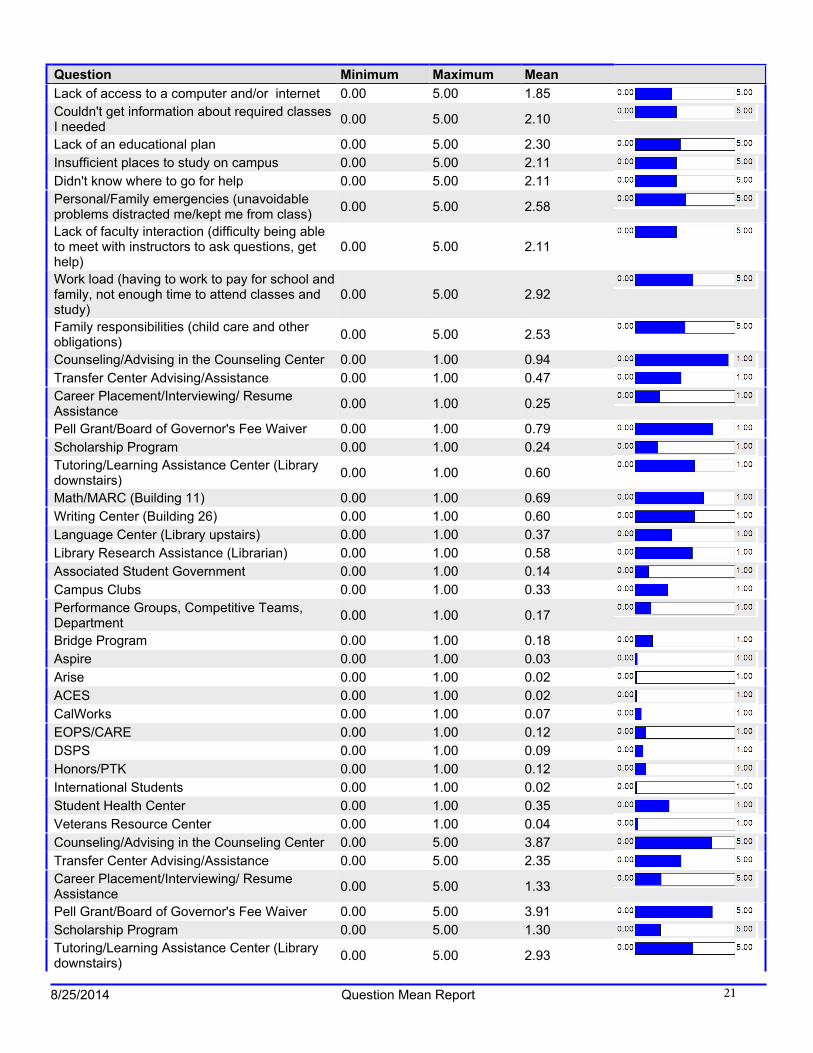
MeanQuestion Minimum MaximumLack of access to a computer and/or internet 1.855.000.00Couldn't get information about required classesI needed 2.105.000.00Lack of an educational plan 2.305.000.00Insufficient places to study on campus 2.115.000.00Didn't know where to go for help 2.115.000.00Personal/Family emergencies (unavoidableproblems distracted me/kept me from class) 2.585.000.00Lack of faculty interaction (difficulty being ableto meet with instructors to ask questions, gethelp)
2.115.000.00Work load (having to work to pay for school andfamily, not enough time to attend classes andstudy)
2.925.000.00Family responsibilities (child care and otherobligations) 2.535.000.00Counseling/Advising in the Counseling Center 0.941.000.00Transfer Center Advising/Assistance 0.471.000.00Career Placement/Interviewing/ ResumeAssistance 0.251.000.00Pell Grant/Board of Governor's Fee Waiver 0.791.000.00Scholarship Program 0.241.000.00Tutoring/Learning Assistance Center (Librarydownstairs) 0.601.000.00Math/MARC (Building 11) 0.691.000.00Writing Center (Building 26) 0.601.000.00Language Center (Library upstairs) 0.371.000.00Library Research Assistance (Librarian) 0.581.000.00Associated Student Government 0.141.000.00Campus Clubs 0.331.000.00Performance Groups, Competitive Teams,Department 0.171.000.00Bridge Program 0.181.000.00Aspire 0.031.000.00Arise 0.021.000.00ACES 0.021.000.00CalWorks 0.071.000.00EOPS/CARE 0.121.000.00DSPS 0.091.000.00Honors/PTK 0.121.000.00International Students 0.021.000.00Student Health Center 0.351.000.00Veterans Resource Center 0.041.000.00Counseling/Advising in the Counseling Center 3.875.000.00Transfer Center Advising/Assistance 2.355.000.00Career Placement/Interviewing/ ResumeAssistance 1.335.000.00Pell Grant/Board of Governor's Fee Waiver 3.915.000.00Scholarship Program 1.305.000.00Tutoring/Learning Assistance Center (Librarydownstairs) 2.935.000.00
Question Mean Report 218/25/2014
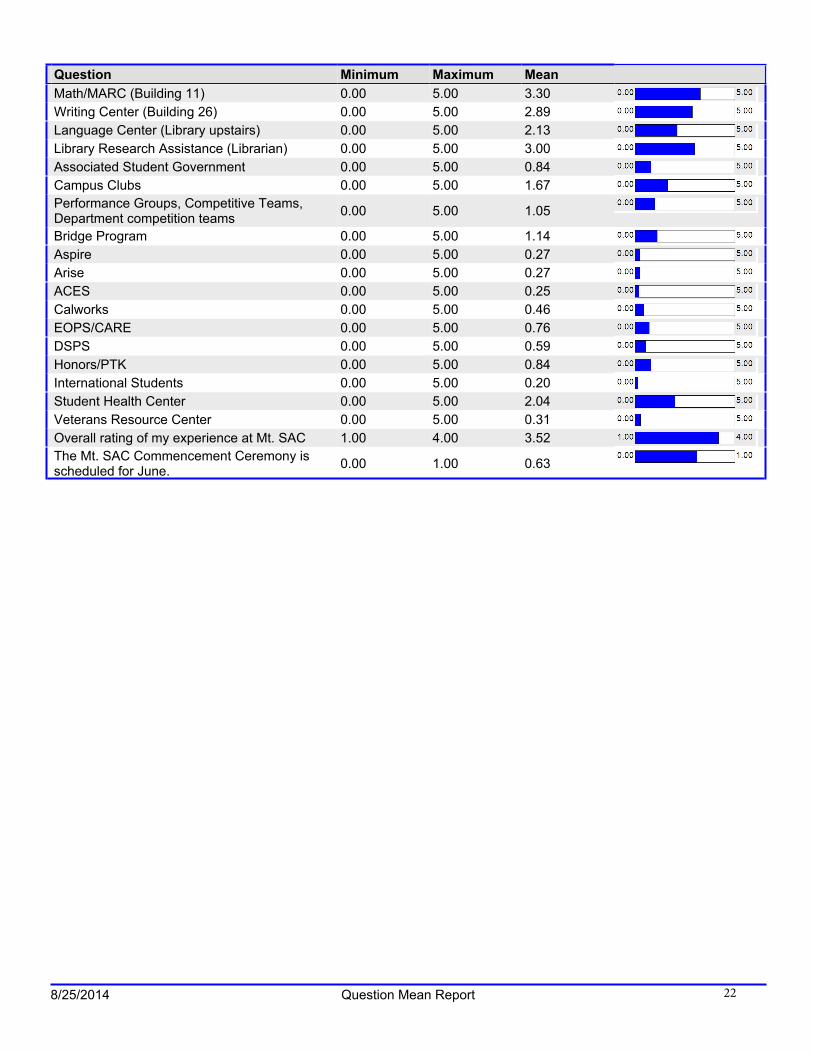
MeanQuestion Minimum MaximumMath/MARC (Building 11) 3.305.000.00Writing Center (Building 26) 2.895.000.00Language Center (Library upstairs) 2.135.000.00Library Research Assistance (Librarian) 3.005.000.00Associated Student Government 0.845.000.00Campus Clubs 1.675.000.00Performance Groups, Competitive Teams,Department competition teams 1.055.000.00Bridge Program 1.145.000.00Aspire 0.275.000.00Arise 0.275.000.00ACES 0.255.000.00Calworks 0.465.000.00EOPS/CARE 0.765.000.00DSPS 0.595.000.00Honors/PTK 0.845.000.00International Students 0.205.000.00Student Health Center 2.045.000.00Veterans Resource Center 0.315.000.00Overall rating of my experience at Mt. SAC 3.524.001.00The Mt. SAC Commencement Ceremony isscheduled for June. 0.631.000.00
Question Mean Report 228/25/2014