Embed Size (px)
Citation preview

Graduate Enrollment and Degrees:1999 to 2009

Graduate Enrollment and Degrees: 1999 to 2009
Nathan E. BellDirector, Research and Policy Analysis
Council of Graduate Schools
The CGS/GRE Survey of Graduate Enrollment and Degrees is jointly sponsored by:
Council of Graduate Schools Graduate Record Examinations Board

The CGS/GRE Survey of Graduate Enrollment and Degrees is jointly sponsored by the Council ofGraduate Schools (CGS) and the Graduate Record Examinations Board (GRE). Conducted annuallysince 1986, the survey is designed to provide information about applications to graduate school, gradu-ate student enrollment, and graduate degrees and certificates conferred. A PDF version of this surveyreport is available on the CGS website at www.cgsnet.org (click “CGS Research” on the main menu). Alsoavailable on the CGS website is a companion report with data tables on first-time and total enrollment byfine field and demographics. For more information about the survey or the survey reports, please contact:
Council of Graduate SchoolsOne Dupont Circle, NW, Suite 230Washington, DC 20036-1173www.cgsnet.org
Nathan E. Bell(202) [email protected]
Graduate Record Examinations ProgramEducational Testing ServiceRosedale RoadPrinceton, NJ 08541-6000www.ets.org/gre
Carol A. Hawkes(609) [email protected]
Suggested citation:
Bell, N. (2010). Graduate Enrollment and Degrees: 1999 to 2009. Washington, DC: Council ofGraduate Schools.
Copyright © 2010 Council of Graduate Schools, Washington, DC
ALL RIGHTS RESERVED. No part of this work covered by the copyright herein may be reproducedor used in any form by any means—graphic, electronic, or mechanical, including photocopying,recording, taping, Web distribution, or information storage and retrieval systems—without the priorwritten permission of the Council of Graduate Schools, One Dupont Circle, NW, Suite 230,Washington, DC 20036-1173.
Printed in the United States

Table of Contents
List of Figures and Tables .......................................................................................................................................................................................................ii
Acknowledgments ...................................................................................................................................................................................................................vi
Executive Summary ................................................................................................................................................................................................................vii
Chapter 1 Introduction, Data, and Methods..........................................................................................................................................................................1
Introduction ..........................................................................................................................................................................................................................1
Methodology.........................................................................................................................................................................................................................1
Data......................................................................................................................................................................................................................................1
Report Contents ...................................................................................................................................................................................................................3
Chapter 2 Graduate Applications, First-Time Enrollment, and Total Enrollment, Fall 2009, and Degrees Conferred, 2008-09 ..................................5
Graduate Applications..........................................................................................................................................................................................................5
First-Time Graduate Enrollment...........................................................................................................................................................................................6
Total Graduate Enrollment .................................................................................................................................................................................................11
Graduate Certificates and Degrees ...................................................................................................................................................................................16
Data Tables ........................................................................................................................................................................................................................19
Chapter 3 Trends in Graduate Applications, First-Time Enrollment, Total Enrollment, and Degrees Conferred, 1999 to 2009................................49
Trends in Graduate Applications........................................................................................................................................................................................49
Trends in First-Time Graduate Enrollment.........................................................................................................................................................................50
Trends in Total Graduate Enrollment .................................................................................................................................................................................56
Trends in Graduate Certificates and Degrees ...................................................................................................................................................................62
Data Tables ........................................................................................................................................................................................................................67
Appendix A 2009 CGS/GRE Survey of Graduate Enrollment and Degrees Survey Instrument ....................................................................................96
Appendix B CGS/GRE Survey of Graduate Enrollment and Degrees Taxonomy of Fields of Study ...........................................................................97

Figure 2.1 Graduate Application Acceptance Rates by Carnegie Classification and Degree Level, Fall 2009........................................................................5
Figure 2.2 Graduate Application Acceptance Rates by Broad Field and Degree Level, Fall 2009 ..........................................................................................6
Figure 2.3 First-Time Graduate Enrollment by Carnegie Classification and Attendance Status, Fall 2009 .............................................................................7
Figure 2.4 First-Time Graduate Enrollment by Broad Field and Gender, Fall 2009 .................................................................................................................7
Figure 2.5 First-Time Graduate Enrollment by Broad Field and Attendance Status, Fall 2009................................................................................................8
Figure 2.6 First-Time Graduate Enrollment by Broad Field and Degree Level, Fall 2009 .......................................................................................................8
Figure 2.7 First-Time Graduate Enrollment by Carnegie Classification and Citizenship, Fall 2009 .........................................................................................9
Figure 2.8 First-Time Graduate Enrollment by Broad Field and Citizenship, Fall 2009 .........................................................................................................10
Figure 2.9 First-Time Graduate Enrollment by Citizenship, Race/Ethnicity, and Gender, Fall 2009 ......................................................................................10
Figure 2.10 U.S. Citizen and Permanent Resident First-Time Graduate Enrollment by Race/Ethnicity, Fall 2009................................................................10
Figure 2.11 U.S. Citizen and Permanent Resident First-Time Graduate Enrollment by Race/Ethnicity and Broad Field, Fall 2009 .....................................11
Figure 2.12 Total Graduate Enrollment by Carnegie Classification and Attendance Status, Fall 2009..................................................................................12
Figure 2.13 Total Graduate Enrollment by Broad Field and Gender, Fall 2009......................................................................................................................12
Figure 2.14 Total Graduate Enrollment by Broad Field and Attendance Status, Fall 2009 ....................................................................................................13
Figure 2.15 Total Graduate Enrollment by Broad Field and Degree Level, Fall 2009 ............................................................................................................13
Figure 2.16 Total Graduate Enrollment by Carnegie Classification and Citizenship, Fall 2009..............................................................................................14
Figure 2.17 Total Graduate Enrollment by Broad Field and Citizenship, Fall 2009................................................................................................................14
Figure 2.18 Total Graduate Enrollment by Citizenship, Race/Ethnicity, and Gender, Fall 2009.............................................................................................15
Figure 2.19 U.S. Citizen and Permanent Resident Total Graduate Enrollment by Race/Ethnicity, Fall 2009 ........................................................................15
Figure 2.20 U.S. Citizen and Permanent Resident Total Graduate Enrollment by Race/Ethnicity and Broad Field, Fall 2009 .............................................15
Figure 2.21 Doctoral Degrees Awarded by Broad Field, 2008-09 ..........................................................................................................................................16
Figure 2.22 Master’s Degrees Awarded by Broad Field, 2008-09 ..........................................................................................................................................17
Figure 2.23 Graduate Certificates Awarded by Broad Field, 2008-09 ....................................................................................................................................17
Figure 2.24 Graduate Certificates Awarded by Broad Field and Gender, 2008-09 ................................................................................................................17
Figure 2.25 Master’s Degrees Awarded by Broad Field and Gender, 2008-09 ......................................................................................................................18
Figure 2.26 Doctoral Degrees Awarded by Broad Field and Gender, 2008-09 ......................................................................................................................18
List of Figures and Tables
Chapter 2 Figures
ii

Table 2.1 Applications for Admission to Graduate School by Institution Type, Carnegie Classification, and Degree Level, Fall 2009 .................................19
Table 2.2 Applications for Admission to Graduate School by Broad Field and Degree Level, Fall 2009 ...............................................................................21
Table 2.3 First-Time Graduate Enrollment by Institution Type, Carnegie Classification, Gender, and Attendance Status, Fall 2009....................................22
Table 2.4 First-Time Graduate Enrollment by Broad Field, Gender, and Attendance Status, Fall 2009 ................................................................................24
Table 2.5 First-Time Graduate Enrollment by Gender, Attendance Status, and Broad Field, Fall 2009 ................................................................................25
Table 2.6 First-Time Graduate Enrollment by Broad Field and Degree Level, Fall 2009 .......................................................................................................26
Table 2.7 First-Time Graduate Enrollment by Degree Level, Gender, and Broad Field, Fall 2009 ........................................................................................27
Table 2.8 First-Time Graduate Enrollment by Institution Type, Carnegie Classification, and Citizenship, Fall 2009 .............................................................28
Table 2.9 First-Time Graduate Enrollment by Broad Field and Citizenship, Fall 2009 ...........................................................................................................29
Table 2.10 First-Time Graduate Enrollment by Citizenship, Race/Ethnicity, and Gender, Fall 2009......................................................................................30
Table 2.11 First-Time Graduate Enrollment by Broad Field and Race/Ethnicity, Fall 2009 (U.S. Citizens and Permanent Residents Only) ........................31
Table 2.12 Total Graduate Enrollment by Institution Type, Carnegie Classification, Gender, and Attendance Status, Fall 2009 ..........................................32
Table 2.13 Total Graduate Enrollment by Broad Field, Gender, and Attendance Status, Fall 2009.......................................................................................34
Table 2.14 Total Graduate Enrollment by Gender, Attendance Status, and Broad Field, Fall 2009.......................................................................................35
Table 2.15 Total Graduate Enrollment by Broad Field and Degree Level, Fall 2009..............................................................................................................36
Table 2.16 Total Graduate Enrollment by Degree Level, Gender, and Broad Field, Fall 2009...............................................................................................37
Table 2.17 Total Graduate Enrollment by Institution Type, Carnegie Classification, and Citizenship, Fall 2009....................................................................38
Table 2.18 Total Graduate Enrollment by Broad Field and Citizenship, Fall 2009..................................................................................................................39
Table 2.19 Total Graduate Enrollment by Citizenship, Race/Ethnicity, and Gender, Fall 2009 ..............................................................................................40
Table 2.20 Total Graduate Enrollment by Broad Field and Race/Ethnicity, Fall 2009 (U.S. Citizens and Permanent Residents Only).................................41
Table 2.21 Graduate Degrees and Certificates Awarded by Degree Level, Carnegie Classification and Institution Type, 2008-09......................................42
Table 2.22 Graduate Degrees and Certificates Awarded by Degree Level and Broad Field, 2008-09 ..................................................................................44
Table 2.23 Graduate Certificates Awarded by Broad Field and Gender, 2008-09..................................................................................................................45
Table 2.24 Master’s Degrees Awarded by Broad Field and Gender, 2008-09........................................................................................................................46
Table 2.25 Doctoral Degrees Awarded by Broad Field and Gender, 2008-09........................................................................................................................47
Chapter 2 Tables
iii

Figure 3.1 Trends in Graduate Applications by Carnegie Classification, Fall 1999 to Fall 2009 . . . . . . . . . . . . . . . . . . . . . . . . . . . . . . . . . . . . . . . . . . . . . .49
Figure 3.2 Percent Change in Graduate Applications by Broad Field, Fall 2008 to Fall 2009 . . . . . . . . . . . . . . . . . . . . . . . . . . . . . . . . . . . . . . . . . . . . . . .50
Figure 3.3 Trends in First-Time Graduate Enrollment by Carnegie Classification, Fall 1999 to Fall 2009 . . . . . . . . . . . . . . . . . . . . . . . . . . . . . . . . . . . . . .51
Figure 3.4 Trends in First-Time Graduate Enrollment Citizenship and Race/Ethnicity, Fall 1999 to Fall 2009 . . . . . . . . . . . . . . . . . . . . . . . . . . . . . . . . . . .51
Figure 3.5 Average Annual Percentage Change in First-Time Graduate Enrollment by Citizenship,
Race/Ethnicity and Gender, Fall 1999 to Fall 2009 . . . . . . . . . . . . . . . . . . . . . . . . . . . . . . . . . . . . . . . . . . . . . . . . . . . . . . . . . . . . . . . . . . . . . . . . . . . . .52
Figure 3.6 Average Annual Percentage Change in First-Time Graduate Enrollment by Broad Field, Fall 1999 to Fall 2009 . . . . . . . . . . . . . . . . . . . . . . . .52
Figure 3.7 Average Annual Percentage Change in First-Time Graduate Enrollment by Broad Field and Attendance Status, Fall 1999 to Fall 2009 . . . . .53
Figure 3.8 Average Annual Percentage Change in First-Time Graduate Enrollment by Broad Field and Citizenship, Fall 1999 to Fall 2009 . . . . . . . . . . .54
Figure 3.9 Average Annual Percentage Change in First-Time Graduate Enrollment by Broad Field and Race/Ethnicity, Fall 1999 to Fall 2009 . . . . . . . .54
Figure 3.10 Average Annual Percentage Change in First-Time Graduate Enrollment by Broad Field and Gender, Fall 1999 to Fall 2009 . . . . . . . . . . . . .55
Figure 3.11 Percentage Change in First-Time Graduate Enrollment by Broad Field and Degree Level, Fall 2008 to Fall 2009 . . . . . . . . . . . . . . . . . . . . .56
Figure 3.12 Trends in Total Graduate Enrollment by Carnegie Classification, Fall 1999 to Fall 2009 . . . . . . . . . . . . . . . . . . . . . . . . . . . . . . . . . . . . . . . . .57
Figure 3.13 Trends in Total Graduate Enrollment Citizenship and Race/Ethnicity, Fall 1999 to Fall 2009 . . . . . . . . . . . . . . . . . . . . . . . . . . . . . . . . . . . . . .57
Figure 3.14 Average Annual Percentage Change in Total Graduate Enrollment by Citizenship, Race/Ethnicity and Gender, Fall 1999 to Fall 2009 . . . . .58
Figure 3.15 Average Annual Percentage Change in Total Graduate Enrollment by Broad Field, Fall 1999 to Fall 2009 . . . . . . . . . . . . . . . . . . . . . . . . . . .58
Figure 3.16 Average Annual Percentage Change in Total Graduate Enrollment by Broad Field and Attendance Status, Fall 1999 to Fall 2009 . . . . . . . .59
Figure 3.17 Average Annual Percentage Change in Total Graduate Enrollment by Broad Field and Citizenship, Fall 1999 to Fall 2009 . . . . . . . . . . . . . .60
Figure 3.18 Average Annual Percentage Change in Total Graduate Enrollment by Broad Field and Race/Ethnicity, Fall 1999 to Fall 2009 . . . . . . . . . . .60
Figure 3.19 Average Annual Percentage Change in Total Graduate Enrollment by Broad Field and Gender, Fall 1999 to Fall 2009 . . . . . . . . . . . . . . . . .61
Figure 3.20 Percentage Change in Total Graduate Enrollment by Broad Field and Degree Level, Fall 2008 to Fall 2009 . . . . . . . . . . . . . . . . . . . . . . . . .62
Figure 3.21 Trends in Graduate Degrees Awarded by Institution Type, 1998-99 to 2008-09 . . . . . . . . . . . . . . . . . . . . . . . . . . . . . . . . . . . . . . . . . . . . . . . .63
Figure 3.22 Trends in Graduate Degrees Awarded by Gender and Degree Level, 1998-99 to 2008-09 . . . . . . . . . . . . . . . . . . . . . . . . . . . . . . . . . . . . . . .64
Figure 3.23 Average Annual Percentage Change in Master’s Degrees Awarded by Broad Field, 1998-99 to 2008-09 . . . . . . . . . . . . . . . . . . . . . . . . . . . .65
Figures 3.24 Average Annual Percentage Change in Master’s Degrees Awarded by Broad Field and Gender, 1998-99 to 2008-09 . . . . . . . . . . . . . . . . .65
Figure 3.25 Average Annual Percentage Change in Doctoral Degrees Awarded by Broad Field, 1998-99 to 2008-09 . . . . . . . . . . . . . . . . . . . . . . . . . . . .66
Figure 3.26 Average Annual Percentage Change in Doctoral Degrees Awarded by Broad Field and Gender, 1998-99 to 2008-09 . . . . . . . . . . . . . . . . . .66
iv
Chapter 3 Figures

Table 3.1 Applications for Admission to Graduate School by Institution Type, Carnegie Classification, and Degree Level, 1999 to 2009 . . . . . . . . . . . . . 67
Table 3.2 Applications for Admission to Graduate School by Broad Field, 1999 to 2009 . . . . . . . . . . . . . . . . . . . . . . . . . . . . . . . . . . . . . . . . . . . . . . . . . . . 68
Table 3.3 First-Time Graduate Enrollment by Institution Type and Carnegie Classification, 1999 to 2009. . . . . . . . . . . . . . . . . . . . . . . . . . . . . . . . . . . . . . 69
Table 3.4 First-Time Graduate Enrollment by Citizenship and Race/Ethnicity, 1999 to 2009 . . . . . . . . . . . . . . . . . . . . . . . . . . . . . . . . . . . . . . . . . . . . . . . . 71
Table 3.5 First-Time Graduate Enrollment by Citizenship, Race/Ethnicity, and Gender, 1999 to 2009. . . . . . . . . . . . . . . . . . . . . . . . . . . . . . . . . . . . . . . . . 72
Table 3.6 First-Time Graduate Enrollment by Broad Field, 1999 to 2009 . . . . . . . . . . . . . . . . . . . . . . . . . . . . . . . . . . . . . . . . . . . . . . . . . . . . . . . . . . . . . . . 73
Table 3.7 First-Time Graduate Enrollment by Broad Field and Attendance Status, 1999 to 2009 . . . . . . . . . . . . . . . . . . . . . . . . . . . . . . . . . . . . . . . . . . . . 74
Table 3.8 First-Time Graduate Enrollment by Broad Field and Citizenship, 1999 to 2009 . . . . . . . . . . . . . . . . . . . . . . . . . . . . . . . . . . . . . . . . . . . . . . . . . . 75
Table 3.9 First-Time Graduate Enrollment by Broad Field and Race/Ethnicity, 1999 to 2009 (U.S. Citizens and Permanent Residents Only). . . . . . . . . . 76
Table 3.10 First-Time Graduate Enrollment by Broad Field and Gender, 1999 to 2009 . . . . . . . . . . . . . . . . . . . . . . . . . . . . . . . . . . . . . . . . . . . . . . . . . . . . 77
Table 3.11 First-Time Graduate Enrollment by Broad Field, Degree Level, and Gender, 2008 to 2009 . . . . . . . . . . . . . . . . . . . . . . . . . . . . . . . . . . . . . . . . 78
Table 3.12 Total Graduate Enrollment by Institution Type and Carnegie Classification, 1999 to 2009 . . . . . . . . . . . . . . . . . . . . . . . . . . . . . . . . . . . . . . . . . 79
Table 3.13 Total Graduate Enrollment by Citizenship and Race/Ethnicity, 1999 to 2009 . . . . . . . . . . . . . . . . . . . . . . . . . . . . . . . . . . . . . . . . . . . . . . . . . . . 81
Table 3.14 Total Graduate Enrollment by Citizenship, Race/Ethnicity, and Gender, 1999 to 2009 . . . . . . . . . . . . . . . . . . . . . . . . . . . . . . . . . . . . . . . . . . . . 82
Table 3.15 Total Graduate Enrollment by Broad Field, 1999 to 2009 . . . . . . . . . . . . . . . . . . . . . . . . . . . . . . . . . . . . . . . . . . . . . . . . . . . . . . . . . . . . . . . . . . 83
Table 3.16 Total Graduate Enrollment by Broad Field and Attendance Status, 1999 to 2009 . . . . . . . . . . . . . . . . . . . . . . . . . . . . . . . . . . . . . . . . . . . . . . . 84
Table 3.17 Total Graduate Enrollment by Broad Field and Citizenship, 1999 to 2009 . . . . . . . . . . . . . . . . . . . . . . . . . . . . . . . . . . . . . . . . . . . . . . . . . . . . . 85
Table 3.18 Total Graduate Enrollment by Broad Field and Race/Ethnicity, 1999 to 2009 (U.S. Citizens and Permanent Residents Only) . . . . . . . . . . . . . 86
Table 3.19 Total Graduate Enrollment by Broad Field and Gender, 1999 to 2009 . . . . . . . . . . . . . . . . . . . . . . . . . . . . . . . . . . . . . . . . . . . . . . . . . . . . . . . . 87
Table 3.20 Total Graduate Enrollment by Broad Field, Degree Level, and Gender, 2008 to 2009 . . . . . . . . . . . . . . . . . . . . . . . . . . . . . . . . . . . . . . . . . . . . 88
Table 3.21 Graduate Degrees and Certificates Awarded by Degree Level and Institution Type, 1998-99 to 2008-09 . . . . . . . . . . . . . . . . . . . . . . . . . . . . . 89
Table 3.22 Graduate Degrees and Certificates Awarded by Degree Level and Carnegie Classification, 1998-99 to 2008-09 . . . . . . . . . . . . . . . . . . . . . . 90
Table 3.23 Graduate Degrees and Certificates Awarded by Degree Level, Institution Type, and Gender, 1998-99 to 2008-09 . . . . . . . . . . . . . . . . . . . . . 91
Table 3.24 Graduate Degrees and Certificates Awarded by Degree Level, Carnegie Classification, and Gender, 1998-99 to 2008-09 . . . . . . . . . . . . . . . 92
Table 3.25 Graduate Certificates Awarded by Broad Field and Gender, 2007-08 to 2008-09 . . . . . . . . . . . . . . . . . . . . . . . . . . . . . . . . . . . . . . . . . . . . . . . 93
Table 3.26 Master’s Degrees Awarded by Broad Field and Gender, 1998-99 to 2008-09 . . . . . . . . . . . . . . . . . . . . . . . . . . . . . . . . . . . . . . . . . . . . . . . . . . 94
Table 3.27 Doctoral Degrees Awarded by Broad Field and Gender, 1998-99 to 2008-09 . . . . . . . . . . . . . . . . . . . . . . . . . . . . . . . . . . . . . . . . . . . . . . . . . . 95
v
Chapter 3 Tables
The CGS/GRE Survey of Graduate Enrollment and Degrees is conductedjointly by the Council of Graduate Schools (CGS) and the Graduate RecordExaminations Board (GRE). The GRE is overseen by staff of the EducationalTesting Service (ETS).
Completion of this report on the 2009 CGS/GRE Survey of GraduateEnrollment and Degrees would not have been possible without the valuablecontributions of many individuals. In particular, we would like to express ourappreciation for the efforts of ETS and the GRE program. We particularlywant to thank David Payne for his unwavering support and Dawn Piacentinofor her overall direction of the project at ETS.
We also want to recognize the important efforts of other ETS and CGS staff.Thank you to Carol Hawkes and Kathi Perlove of ETS for responding to
questions from institutional respondents and for processing survey respons-es, to Janice Goggins of CGS for management of the layout and publicationprocess for the final report, to Joshua Mahler of CGS for assisting with thedata collection for the survey and designing the report cover, and to RobertSowell of CGS for his advice and careful review of the report drafts and data.Thank you also to the members of the CGS Advisory Task Force onResearch and Information Services for feedback on the content and designof the printed report.
Finally, and most importantly, a very special thank you goes to the graduatedeans, institutional researchers, and other staff at the 699 colleges and uni-versities who completed the very complex CGS/GRE Survey of GraduateEnrollment and Degrees this year. We are extremely grateful for the time andefforts these and other persons gave to the survey project and report.
Acknowledgments
vi
Executive Summary
The CGS/GRE Survey of Graduate Enrollment and Degrees is jointly spon-sored by the Council of Graduate Schools (CGS) and the Graduate RecordExaminations Board (GRE). Conducted annually since 1986, the surveyprovides information about applications for admission to graduate school,first-time and total graduate student enrollment, and graduate degrees andcertificates conferred. The 2009 survey was sent to 806 colleges and uni-versities, and useable responses were received from 699 institutions, foran 87% response rate.
Graduate Applications
Institutions responding to the CGS/GRE Survey of Graduate Enrollmentand Degrees received nearly 1.7 million applications for admission to grad-uate programs for studies beginning in fall 2009. About 45% of all gradu-ate applications were accepted for admission, with a higher acceptancerate for applications to master’s degree and graduate certificate programsthan doctoral programs. Business, engineering, and social and behavioralsciences accounted for the largest numbers of graduate applications in fall2009.
Applications for admission to U.S. graduate schools increased 8.3%between fall 2008 and fall 2009. Between fall 1999 and fall 2009, graduateapplications grew at an average annual rate of 4.8%. Over the pastdecade, increases occurred in graduate applications in all broad fields. Theaverage annual increases were greatest in mathematics and computer sci-ences, health sciences, and arts and humanities.
First-Time Graduate Enrollment
Nearly 463,000 students enrolled for the first time in graduate certificate,education specialist, master’s, or doctoral programs for the fall term in2009 at the institutions responding to the survey. Nearly two-thirds of all
first-time graduate students were enrolled at public institutions, about one-third were at private, not-for-profit institutions, and the remainder were atprivate, for-profit institutions.
The broad fields of education, business, and health sciences enrolled thelargest numbers of first-time graduate students, with about half of all first-time students enrolled in one of these three broad fields. The majority of allfirst-time graduate students in fall 2009 (85%) were enrolled in programsleading to a master’s degree or a graduate certificate.
Sixty-four percent of all first-time graduate students were enrolled full-timein fall 2009. About 58% of all first-time graduate students in fall 2009 werewomen. Among first-time graduate students whose citizenship was known,83% were U.S. citizens and permanent residents and 17% were temporaryresidents. Nearly one-quarter of all first-time graduate students were mem-bers of U.S. citizen and permanent resident racial/ethnic minority groups.
First-time graduate enrollment increased 5.5% between fall 2008 and fall2009. The one-year increase was greater at public institutions than at pri-vate, not-for-profit institutions. First-time graduate enrollment hasincreased 4.7% annually on average since fall 1999.
Much of the growth in first-time graduate enrollment over the past decadehas been the result of growth among temporary residents, but fall 2009marks the first time since fall 2004 that first-time graduate enrollmentdecreased for temporary residents. Between fall 2008 and fall 2009, first-time graduate enrollment increased 6.0% among U.S. citizens and perma-nent residents, but fell 1.7% for temporary residents. Over the past decade,growth in first-time graduate enrollment among U.S. citizens and perma-nent residents has been greater for racial/ethnic minorities than for Whites.Women have also contributed to the growth in first-time enrollment, with a5.2% average annual increase since 1999, compared with a 4.2% average
vii
annual increase for men. Between fall 2008 and fall 2009, however, therate of increase was greater for men than for women—6.7% vs. 4.7%.
First-time graduate enrollment increased in all broad fields between fall2008 and fall 2009, as well as between fall 1999 and fall 2009. Between2008 and 2009, growth was fastest in public administration and services,health sciences, and biological and agricultural sciences, and between1999 and 2009, average annual increases were greatest in health sci-ences, education, and engineering.
Between fall 2008 and fall 2009, first-time graduate enrollment increasedfaster at the doctoral level that at the master’s degree and graduate certifi-cate level—6.3% vs. 5.1%.
Total Graduate Enrollment
The institutions responding to the survey enrolled a total of more than 1.8million students in graduate programs in fall 2009. Six out of ten graduatestudents were enrolled at public institutions, three out of ten were at pri-vate, not-for-profit institutions, and the remainder were at private, for-profitinstitutions.
More than half of all graduate students in fall 2009 were enrolled in pro-grams in education, business, or health sciences. About three-quarters ofall graduate students were enrolled in programs leading to a master’sdegree or a graduate certificate.
Fifty-six percent of all graduate students were enrolled full-time in fall 2009.About 59% of all graduate students in fall 2009 were women. Among grad-uate students whose citizenship was known, 85% were U.S. citizens andpermanent residents and 15% were temporary residents. One-quarter ofall graduate students were members of U.S. citizen and permanent resi-dent racial/ethnic minority groups.
Total graduate enrollment increased 4.7% between fall 2008 and fall 2009.The one-year increase was 3.8% at both public institutions and private, not-
for-profit institutions, compared with 13.5% at private, for-profit institutions.Graduate enrollment has increased 3.7% annually on average since fall 1999.
Much of the increase in total graduate enrollment over the past decade hasbeen the result of an increase in the number of temporary residents, but infall 2009, for the second year in a row, total graduate enrollment increasedfaster among U.S. citizens and permanent residents than among tempo-rary residents. The one-year increase for U.S. citizens and permanent res-idents was 4.8%, compared with a 1.1% gain for temporary residents.
Women have also contributed to the growth in graduate education over thepast decade, with average annual gains of 4.2% for women since 1999,compared with average annual gains of 3.0% for men. Between fall 2008and fall 2009, however, the growth for men outpaced that for women, withgains for men and women of 5.2% and 4.4%, respectively.
Total graduate enrollment increased at a faster rate for U.S. racial/ethnicminorities than for Whites in nearly every broad field over the past ten years.Among U.S. citizens and permanent residents between fall 1999 and fall2009, average annual increases in graduate enrollment ranged from a highof 9.5% for Blacks/African Americans to a low of 2.1% for Whites.
Total graduate enrollment increased in all broad fields between fall 2008and fall 2009, as well as between fall 1999 and fall 2009. Between 2008 and2009, growth was fastest in health sciences, public administration and serv-ices, and social and behavioral sciences, and between 1999 and 2009,average annual increases were greatest in health sciences, business, andengineering.
Between fall 2008 and fall 2009, total graduate enrollment increased fasterat the doctoral level than at the master’s degree and graduate certificatelevel—5.0% vs. 4.7%.
viii

Graduate Certificates and Degrees
The institutions responding to the survey awarded approximately 57,600doctoral degrees, 503,000 master’s degrees, and 27,000 graduate certifi-cates in 2008-09. Public institutions awarded the majority of the degreesawarded at both the doctoral and master’s levels, while private, not-for-profit institutions awarded the majority of the graduate certificates.
At the doctoral level, about 42% of all degrees awarded were in education,engineering, and biological and agricultural sciences. At the master’sdegree level, education and business were the largest broad fields,accounting for 51% of all master’s degrees awarded in 2008-09.
Women earned about two-thirds of the graduate certificates awarded in2008-09, 60% of the master’s degrees, and 50.4% of the doctorates.Academic year 2008-09 marked the first year ever that women earned themajority of the degrees awarded at the doctoral level.
Doctoral degree production increased 3.9% between 2007-08 and 2008-09, with stronger growth among women than men—6.3% vs. 1.0%. Overthe past decade, the average annual rate of increase for women also sur-passed that of men—5.5% vs. 2.1%. Between 1998-99 and 2008-09, doc-toral degree production increased in all broad fields. The average annualincreases were greatest in health sciences and mathematics and comput-er sciences.
Master’s degree production increased 4.3% between 2007-08 and 2008-09, with identical growth for women and men. Over the past ten years, theaverage annual rate of increase for women was 5.0% versus 3.5% formen. Between 1998-99 and 2008-09, master’s degree productionincreased in all broad fields except physical and earth sciences. Thelargest average annual increases were in business, health sciences, andsocial and behavioral sciences.
ix


Graduate Enrollment and Degrees: 1999 to 2009 1
Chapter 1Introduction, Data, and Methods
Introduction
The CGS/GRE Survey of Graduate Enrollment and Degrees is jointly spon-sored by the Council of Graduate Schools (CGS) and the Graduate RecordExaminations Board (GRE). Conducted annually since 1986, the survey isdesigned to provide information about applications for admission to gradu-ate school, graduate student enrollment, and graduate degrees and certifi-cates conferred. Both CGS and GRE believe that graduate education is avital part of U.S. higher education and that providing an annual examinationof trends in graduate enrollment and degrees, by field, level, and demo-graphics, is essential for understanding the graduate education enterprise.
Methodology
The CGS/GRE Survey of Graduate Enrollment and Degrees is sent elec-tronically each fall to the U.S.-based institutions that as of November eachyear are members of the Council of Graduate Schools or one of the fourregional graduate school associations—the Conference of SouthernGraduate Schools (CSGS), the Midwestern Association of GraduateSchools (MAGS), the Northeastern Association of Graduate Schools(NAGS), and the Western Association of Graduate Schools (WAGS).1
This year’s survey was sent to 806 colleges and universities. Useableresponses were received from 699 institutions, for an 87% response rate.The response rate among CGS members was even higher, at 92%. Whilethe total number of responding institutions represents about 37% of theapproximately 1,875 degree-granting colleges and universities in the United
1 While CGS also has member institutions in Canada and international affiliate members,the survey population for the CGS/GRE Survey of Graduate Enrollment and Degrees is lim-ited to graduate institutions in the United States. Data on graduate enrollment and degreesin Canadian institutions are published by the Canadian Association for Graduate Studiesand are available online at http://www.cags.ca.
States that offer graduate programs at the certificate level or above,2 theresponding institutions confer about 80% of the 630,000 master’s degreesand 90% of the 64,000 doctorates awarded each year by U.S. colleges anduniversities.3 Because the respondents represent such a large percentageof the degrees awarded at the graduate level in the United States, it is like-ly that the trends reported here are representative of overall national figures.
Data
The CGS/GRE Survey of Graduate Enrollment and Degrees collects dataon four aspects of graduate education:
Applications: Includes the number of completed applications for admissionto U.S. graduate schools for the fall term, the number of those applicationsaccepted for admission, and the number of applications not accepted. Dataare collected by fine field and level (master’s and “other” vs. doctoral). Theapplications data exclude individuals who applied as transfers or for read-mission.
First-Time Enrollment: Includes the number of students enrolled for thefirst time in graduate certificate, education specialist, master’s, or doctoralprograms for the fall term. Data are collected by fine field, level (master’sand “other” vs. doctoral), gender, race/ethnicity, citizenship, and enrollmentstatus (full-time/part-time).
2 Knapp, L.G., Kelly-Reid, J.E., and Ginder, S.A. (2009). Postsecondary Institutions andPrice of Attendance in the United States: Fall 2008, Degrees and Other Awards Conferred:2007-08, and 12-Month Enrollment: 2007-08. Washington, DC: National Center forEducation Statistics, Institute of Education Sciences, U.S. Department of Education. 3 Data on the number of graduate degrees conferred are for 2007-08 and come from theNational Science Foundation’s WebCASPAR Database (http://webcaspar.nsf.gov), usingdata from the U.S. Department of Education’s Integrated Postsecondary Education DataSystem (IPEDS). Final data from IPEDS for 2008-09 were not available at the time of thispublication.

2Graduate Enrollment and Degrees: 1999 to 2009
Total Enrollment: Includes the total number of students enrolled (first-timeand continuing students) in graduate certificate, education specialist, mas-ter’s, or doctoral programs for the fall term. Data are collected by fine field,level (master’s and “other” vs. doctoral), gender, race/ethnicity, citizenship,and enrollment status (full-time/part-time).
Degrees: Includes the number of master’s and doctoral degrees and post-baccalaureate certificates awarded in the United States in a given academ-ic year (July 1 through June 30). Degree data are collected by fine field,level (graduate certificate, master’s/other, and doctoral), and gender. Thesurvey does not collect degree data by race/ethnicity or citizenship.
For both first-time and total enrollment, master’s and “other” enrollment isdefined as the number of students enrolled in programs specifically leadingto the master’s degree and other non-doctoral programs, such as graduatecertificate programs and education specialist programs. Graduate certifi-cates are awards that require the completion of an organized program ofstudy generally equivalent to 15 to 18 credit hours beyond the bachelor’sdegree. Education specialist programs are generally equivalent to 30 to 45credit hours beyond the master’s degree. Doctoral enrollment is defined asthe number of students enrolled in programs leading directly to the doctor-al degree as well as the total number of students enrolled in doctoral pro-grams where a master’s degree is earned en route to the doctoral degree.
Full-time enrollment includes students enrolled for credit in graduate degreeprograms who are engaged full time in training activities in their field; theseactivities may embrace any appropriate combination of study, teaching, andresearch, depending on the responding institution’s own policy. Part-timeenrollment includes students enrolled in graduate degree programs who arenot pursuing graduate work full time as defined above.
The survey collects total data for each institution for the categories and vari-ables listed above, as well as data for up to 51 individual fields of study. Thisprinted report groups the data from the 51 fine fields of study into 11 broadfields. A special online report presents the fine field data for first-time and
total enrollment.4 For more information on the fine fields included in eachbroad field, see the CGS/GRE Survey of Graduate Enrollment and DegreesTaxonomy of Fields of Study in Appendix B.
The survey excludes students applying to, enrolled in, or graduating from first-professional programs. These programs are Chiropractic (D.C. or D.C.M.),Dentistry (D.D.S. or D.M.D.), Law (L.L.B., J.D.), Medicine (M.D.), Optometry(O.D.), Osteopathic Medicine (D.O.), Pharmacy (Pharm.D.), Podiatry (D.P.M.,D.P., or Pod.D.), Theology (M.Div., M.H.L., B.D., or Ordination), andVeterinary Medicine (D.V.M.). Data on all other graduate level programs arecollected, including programs in professional fields such as business.
The racial/ethnic data included in this report are collected from institutionalrecords that are based on graduate students’ self-reports. Accordingly, thenumber of students in any given racial/ethnic category is subject to individ-ual interpretation on the part of students as they complete registrationforms. The citizenship and race/ethnicity categories are defined as follows:
Temporary Resident—A person who is not a citizen, national, or perma-nent resident of the United States and who is in the country on a visa or tem-porary basis and does not have the right to remain indefinitely.
American Indian/Alaskan Native—A U.S. citizen or permanent residenthaving origins in any of the original peoples of North America who maintainscultural identification through tribal affiliation or community recognition.
Asian/Pacific Islander—A U.S. citizen or permanent resident having ori-gins in any of the original peoples of the Far East, Southeast Asia, the Indiansubcontinent, or the Pacific Islands, including for example, China, India,Japan, South Korea, the Philippines, Samoa, and Vietnam.
Black/African American—A U.S. citizen or permanent resident having ori-gins in any of the Black racial groups of Africa (except those of Hispanicorigin).
Hispanic/Latino—A U.S. citizen or permanent resident having origins inany of the original peoples of Puerto Rico, Mexico, Cuba, Central America,South America, or other Spanish culture, regardless of race.
4 The report, First-Time and Total Graduate Enrollment by Fine Field: 1999 to 2009, isavailable online at www.cgsnet.org (click “CGS Research” on the main menu).
Graduate Enrollment and Degrees: 1999 to 2009 3
White—A U.S. citizen or permanent resident having origins in any of theoriginal peoples of Europe, North Africa, or the Middle East (except thoseof Hispanic origin).
Other/Unknown—Includes U.S. citizens and permanent residents of twoor more races and individuals whose citizenship is not known.
In some sections of this report, data are presented by Carnegie classifica-tion, based on the 2005 Carnegie Classification of Institutions of HigherEducation, using the “basic” classification.5 The 33 “basic” classificationcategories are aggregated to five categories in this report as follows:
Research Universities (very high research activity)—universities withvery high research activity that award at least 20 doctorates per year.
Research Universities (high research activity)—universities with highresearch activity that award at least 20 doctorates per year.
Doctoral/Research Universities—other universities that award at least 20doctorates per year.
Master’s Colleges and Universities—institutions that award at least 50master's degrees and fewer than 20 doctorates per year.
Other—includes baccalaureate institutions awarding fewer than 50 mas-ter’s degrees or 20 doctorates per year, as well as institutions awardinggraduate degrees where a high concentration of degrees is in a single fieldor set of related fields (e.g. theological seminaries, medical schools, healthprofession schools, schools of engineering, etc.)
In some cases, survey respondents were unable to provide data for one ormore categories or variables. Thus, not all tables and figures in this reportinclude data from all 699 institutions that responded to the 2009 CGS/GRESurvey of Graduate Enrollment and Degrees.
A copy of the 2009 CGS/GRE Survey of Graduate Enrollment and Degreessurvey instrument is provided in Appendix A.
Report Contents
The tables and analysis that follow are divided into two chapters. BothChapter 2 and Chapter 3 begin with interpretative text and figures, and con-clude with data tables providing more detail on the information included ineach chapter.
Chapter 2 presents data and analysis on the numbers of applications foradmission to U.S. graduate schools for fall 2009 and application acceptancerates by broad field and degree level. It also highlights first-time and totalenrollment in fall 2009, with data presented by broad field, degree level, insti-tution type, Carnegie classification, attendance status, gender, race/ethnici-ty, and citizenship. The last part of Chapter 2 examines the numbers of grad-uate degrees and certificates conferred in the 2008-09 academic year (July1, 2008 through June 30, 2009). Degree data are presented by broad field,level, and gender.
Chapter 3 presents data and analysis on trends in graduate applications,first-time enrollment, total enrollment, and degrees conferred over the pastone, five, and ten years. For this report, the one-year trends are based ondata collected for 2008 and 2009; the five-year trends compare data collect-ed for 2004 and 2009; and the ten-year trends are based on data collectedfor 1999 and 2009. The trend data from these three time periods aredesigned to provide a more detailed comparison of the recent and longer-term trends in graduate education. Since the institutions responding to thesurvey differ slightly from year to year, the trend data are limited to institu-tions that responded to the CGS/GRE Survey of Graduate Enrollment andDegrees in both of the years being compared. The one-year trends includedata from 671 colleges and universities that responded to the CGS/GRESurvey of Graduate Enrollment and Degrees in both 2008 and 2009, the five-year trends include data from 540 institutions that responded to the survey inboth 2004 and 2009, and the ten-year trends include data from 531 institu-tions that responded in both 1999 and 2009. Restricting the analyses to thesame institutions in both years being examined ensures that the trends beingpresented are accurate and not a reflection of differing survey respondents.
5 For more information on the 2005 Carnegie Classification of Institutions of HigherEducation, see www.carnegiefoundation.org/classifications/index.asp.

4Graduate Enrollment and Degrees: 1999 to 2009
In addition to the information included in this publication, a companion datareport is available in PDF format on the CGS website, www.cgsnet.org(click “CGS Research” on the main menu). This report includes data tableson first-time and total enrollment by fine field and demographics.
This annual printed report and the online companion report are part of CGS’continuing efforts to provide information that is useful to graduate deans,other campus administrators, researchers, policy makers, and the media.Comments or suggestions for improving the report—or for additional typesof publications based on these data—are welcome.
Graduate Enrollment and Degrees: 1999 to 2009 5
Chapter 2Graduate Applications, First-Time Enrollment, and Total Enrollment, Fall 2009, and Degrees Conferred, 2008-09
This chapter presents data and analysis on the numbers of applications foradmission to U.S. graduate schools for fall 2009 and application acceptancerates by broad field and degree level. It also highlights first-time and totalenrollment in fall 2009, with data presented by broad field, degree level,institution type, Carnegie classification, attendance status, gender, race/eth-nicity, and citizenship. Additionally, the numbers of graduate degrees andcertificates conferred in the 2008-09 academic year (July 1, 2008 throughJune 30, 2009) are presented by broad field, level, and gender. The chap-ter concludes with the data tables referenced in the text.
Graduate Applications
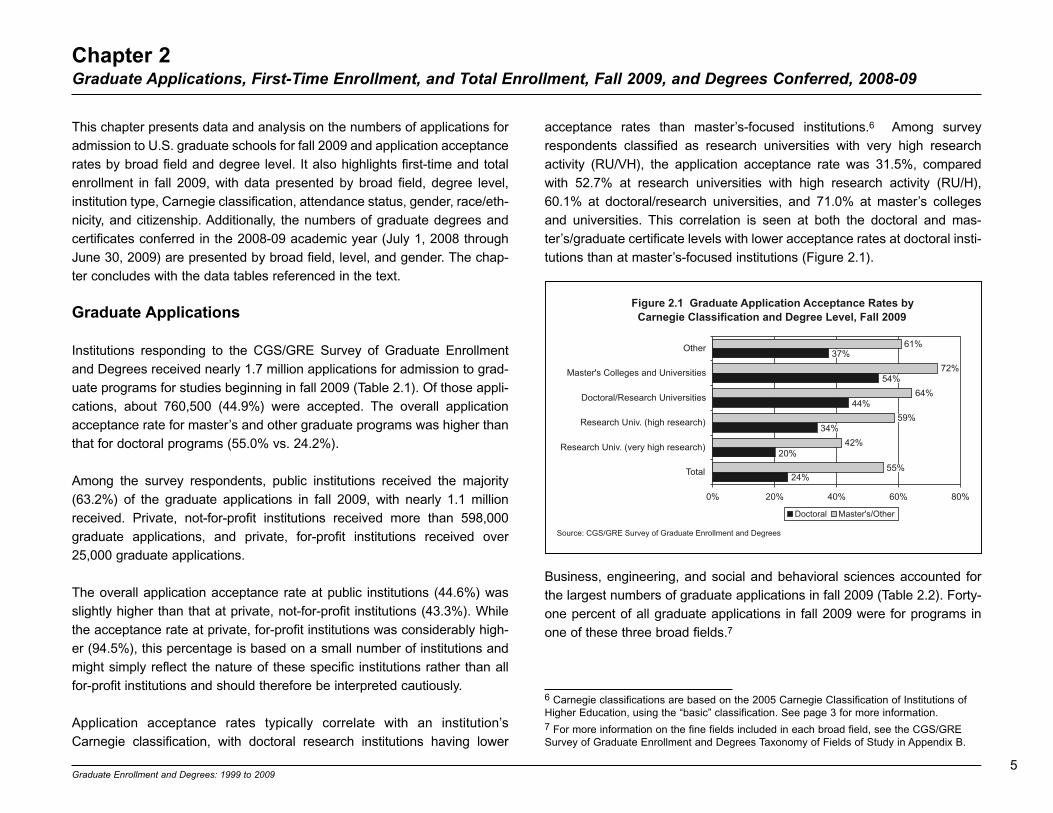
Institutions responding to the CGS/GRE Survey of Graduate Enrollmentand Degrees received nearly 1.7 million applications for admission to grad-uate programs for studies beginning in fall 2009 (Table 2.1). Of those appli-cations, about 760,500 (44.9%) were accepted. The overall applicationacceptance rate for master’s and other graduate programs was higher thanthat for doctoral programs (55.0% vs. 24.2%).
Among the survey respondents, public institutions received the majority(63.2%) of the graduate applications in fall 2009, with nearly 1.1 millionreceived. Private, not-for-profit institutions received more than 598,000graduate applications, and private, for-profit institutions received over25,000 graduate applications.
The overall application acceptance rate at public institutions (44.6%) wasslightly higher than that at private, not-for-profit institutions (43.3%). Whilethe acceptance rate at private, for-profit institutions was considerably high-er (94.5%), this percentage is based on a small number of institutions andmight simply reflect the nature of these specific institutions rather than allfor-profit institutions and should therefore be interpreted cautiously.
Application acceptance rates typically correlate with an institution’sCarnegie classification, with doctoral research institutions having lower
acceptance rates than master’s-focused institutions.6 Among surveyrespondents classified as research universities with very high researchactivity (RU/VH), the application acceptance rate was 31.5%, comparedwith 52.7% at research universities with high research activity (RU/H),60.1% at doctoral/research universities, and 71.0% at master’s collegesand universities. This correlation is seen at both the doctoral and mas-ter’s/graduate certificate levels with lower acceptance rates at doctoral insti-tutions than at master’s-focused institutions (Figure 2.1).
6 Carnegie classifications are based on the 2005 Carnegie Classification of Institutions ofHigher Education, using the “basic” classification. See page 3 for more information.7 For more information on the fine fields included in each broad field, see the CGS/GRESurvey of Graduate Enrollment and Degrees Taxonomy of Fields of Study in Appendix B.
Figure 2.1 Graduate Application Acceptance Rates byCarnegie Classification and Degree Level, Fall 2009
42%
64%
24%
20%
44%
72%
61%
0% 20% 40% 60% 80%
Total
Research Univ. (very high research)
Research Univ. (high research)
Doctoral/Research Universities
Master's Colleges and Universities
Other
Doctoral Master's/Other
Source: CGS/GRE Survey of Graduate Enrollment and Degrees
54%
37%
34%
55%
59%
Business, engineering, and social and behavioral sciences accounted forthe largest numbers of graduate applications in fall 2009 (Table 2.2). Forty-one percent of all graduate applications in fall 2009 were for programs inone of these three broad fields.7
6Graduate Enrollment and Degrees: 1999 to 2009
Figure 2.2 Graduate Application Acceptance Rates by Broad Field and Degree Level, Fall 2009
29%
17%32
%
27%
23%34
%
26%
50%
18%
21%
18%
57%
58%67
%
46%
48%
47%
75%
48%
49%
51%
39%
0%
20%
40%
60%
80%
Doctoral
Master's/Other
Source: CGS/GRE Survey of Graduate Enrollment and Degrees
Art
s &
H
uman
ities
Bus
ines
s
Edu
catio
n
Eng
inee
ring
Hea
lth
Sci
ence
s
Phy
sica
l &
Ear
th
Sci
ence
s
Pub
lic A
dmin
. &
Svc
s.
Soc
ial &
B
ehav
iora
l S
ci.
Oth
er F
ield
s
Bio
logi
cal &
A
gric
. Sci
.
Mat
h &
C
ompu
ter
Sci
.
At the doctoral level, social and behavioral sciences, engineering, and bio-logical and agricultural sciences were the three largest broad fields, repre-senting 49.3% of all doctoral applications. At the opposite end of the spec-trum, public administration and services, ‘other’ fields, and businessreceived the smallest numbers of applications, and together accounted forjust 8.2% of all doctoral applications.
At the master’s degree, graduate certificate, and education specialist level,business, education, and engineering were the three most popular broadfields, accounting for 46.2% of all master’s/other applications in fall 2009.Physical and earth sciences, biological and agricultural sciences, and pub-lic administration and services received the smallest numbers of applica-tions, comprising 10.4% of all master’s/other applications.
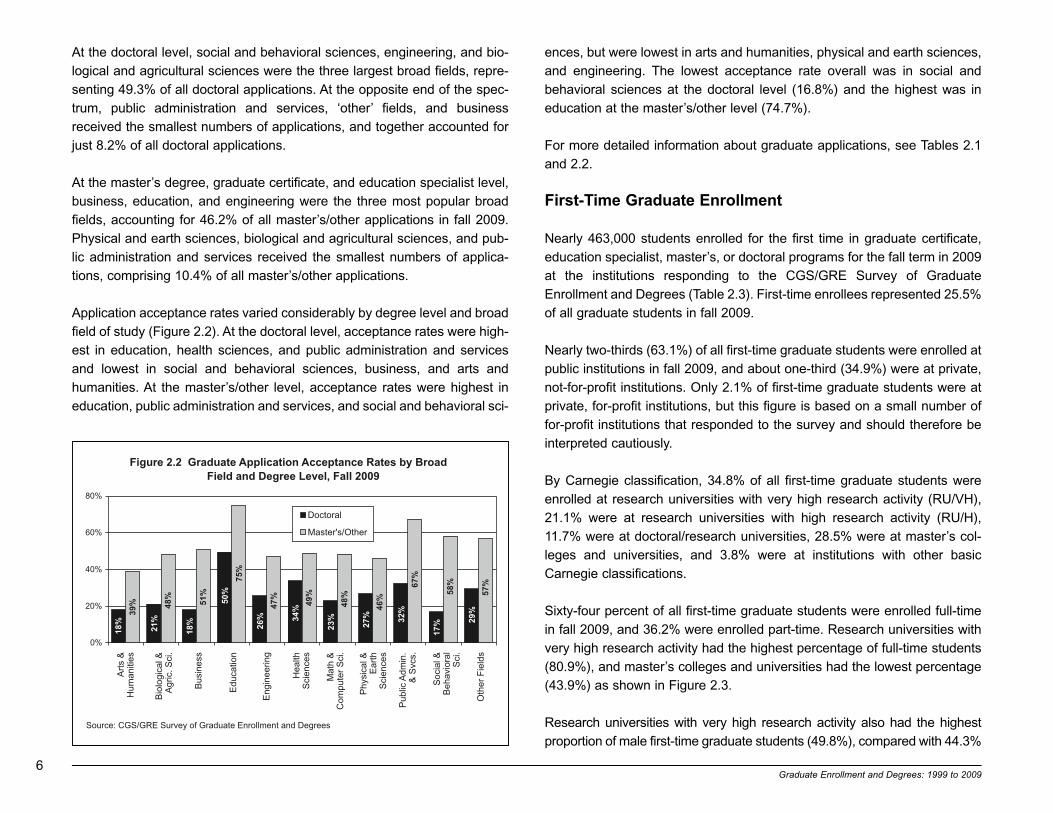
Application acceptance rates varied considerably by degree level and broadfield of study (Figure 2.2). At the doctoral level, acceptance rates were high-est in education, health sciences, and public administration and servicesand lowest in social and behavioral sciences, business, and arts andhumanities. At the master’s/other level, acceptance rates were highest ineducation, public administration and services, and social and behavioral sci-
ences, but were lowest in arts and humanities, physical and earth sciences,and engineering. The lowest acceptance rate overall was in social andbehavioral sciences at the doctoral level (16.8%) and the highest was ineducation at the master’s/other level (74.7%).
For more detailed information about graduate applications, see Tables 2.1and 2.2.
First-Time Graduate Enrollment
Nearly 463,000 students enrolled for the first time in graduate certificate,education specialist, master’s, or doctoral programs for the fall term in 2009at the institutions responding to the CGS/GRE Survey of GraduateEnrollment and Degrees (Table 2.3). First-time enrollees represented 25.5%of all graduate students in fall 2009.
Nearly two-thirds (63.1%) of all first-time graduate students were enrolled atpublic institutions in fall 2009, and about one-third (34.9%) were at private,not-for-profit institutions. Only 2.1% of first-time graduate students were atprivate, for-profit institutions, but this figure is based on a small number offor-profit institutions that responded to the survey and should therefore beinterpreted cautiously.
By Carnegie classification, 34.8% of all first-time graduate students wereenrolled at research universities with very high research activity (RU/VH),21.1% were at research universities with high research activity (RU/H),11.7% were at doctoral/research universities, 28.5% were at master’s col-leges and universities, and 3.8% were at institutions with other basicCarnegie classifications.
Sixty-four percent of all first-time graduate students were enrolled full-timein fall 2009, and 36.2% were enrolled part-time. Research universities withvery high research activity had the highest percentage of full-time students(80.9%), and master’s colleges and universities had the lowest percentage(43.9%) as shown in Figure 2.3.
Research universities with very high research activity also had the highestproportion of male first-time graduate students (49.8%), compared with 44.3%

Graduate Enrollment and Degrees: 1999 to 2009 7
Figure 2.4 First-Time Graduate Enrollment by Broad Field andGender, Fall 2009
42%
43%
45%
58%
25%
77%
21%
70%
61%
24%
38%
39%
58%
57%
55%
42%
75%
23%
79%
30%
39%
76%
62%
61%
0% 20% 40% 60% 80% 100%
Total
Arts and Humanities
Biological & Agric. Sci.
Business
Education
Engineering
Health Sciences
Math & Computer Sci.
Physical & Earth Sci.
Public Admin. & Svcs.
Social & Behavioral Sci.
Other Fields
Men Women
Source: CGS/GRE Survey of Graduate Enrollment and Degrees
in research universities with high research activity, 32.8% in doctoral/researchuniversities, 34.4% in master’s colleges and universities, and 40.4% in insti-tutions with other basic Carnegie classifications. Overall, 41.9% of all first-time graduate students in fall 2009 were men and 58.1% were women.
Collectively, 30.1% of all female first-time graduate students attendedresearch universities with very high research activity, compared with 41.4%of male first-time graduate students. Conversely, 32.2% of all female first-time graduate students attended master’s colleges and universities, com-pared with 23.5% of male first-time enrollees.
The broad fields of education, business, and health sciences enrolled thelargest numbers of first-time graduate students in fall 2009 (Table 2.4).Overall, 21.8% of all first-time enrollees were in education, 16.5% were inbusiness, and 10.6% were in health sciences. At the opposite end of thespectrum, just 2.6% of all first-time graduate students were in physical andearth sciences, 4.4% were in mathematics and computer sciences, and4.6% were in biological and agricultural sciences.
As shown in Figure 2.4, women comprised the largest shares of first-timeenrollees in health sciences (79.0%), public administration and services(76.0%), and education (74.9%). Fifty percent of all female first-time
enrollees in fall 2009 were in one of these three broad fields. Women com-prised the smallest shares of first-time enrollment in engineering (22.5%),mathematics and computer sciences (29.7%), and physical and earth sci-ences (39.4%), and just 7.4% of all female first-time enrollees were in oneof these three broad fields.
Men comprised the majority of first-time students in four broad fields in fall2009—engineering (77.5%), mathematics and computer sciences (70.3%),physical and earth sciences (60.6%), and business (58.2%). These fourbroad fields accounted for 50.1% of all male first-time enrollees.
While 63.8% of all first-time graduate students were enrolled full-time in fall2009, there was considerable variation by broad field (Figure 2.5). Physicaland earth sciences had the highest share of full-time enrollees (87.6%), fol-lowed by biological and agricultural sciences (84.5%), and social andbehavioral sciences (79.7%). In contrast, just 45.2% of all first-time gradu-ate students in education were enrolled full-time. The field of education wasthe only broad field in which more students were enrolled part-time than full-time in fall 2009.
Figure 2.3 First-Time Graduate Enrollment by Carnegie Classification and Attendance Status, Fall 2009
19%
71%
44%
58%
64%
81%
64%
29%
36%
36%
42%
56%
0% 20% 40% 60% 80% 100%
Total
Research Univ. (very high research)
Research Univ. (high research)
Doctoral/Research Universities
Master's Colleges and Universities
Other
Full-Time Part-Time
Source: CGS/GRE Survey of Graduate Enrollment and Degrees

8Graduate Enrollment and Degrees: 1999 to 2009
Among first-time enrollees in fall 2009, men were more likely to be enrolledfull-time than women—68.7% of men vs. 60.3% of women (Table 2.5).Engineering and public administration and services were the only two broadfields in which women were more likely to be enrolled full-time than men. Inengineering, 80.9% of female first-time enrollees were attending full-time,compared with 78.5% of male first-time enrollees, and in public administra-tion and services 67.8% of female first-time enrollees were attending full-time, compared with 64.8% of male first-time enrollees. In two broad fields(health sciences and ‘other’ fields) men were considerably more likely thantheir female counterparts to be attending full-time. In health sciences, 72.9%of male first-time enrollees versus 63.9% of female first-time enrollees wereattending full-time, and in ‘other’ fields, 63.7% of male first-time enrolleesversus 55.6% of female first-time enrollees were attending full-time.
The majority of all first-time graduate students in fall 2009 (84.9%) wereenrolled in programs leading to a master’s degree or a graduate certificate(Table 2.6). Just 15.1% of all first-time students were enrolled in doctoralprograms.
In business, nearly all first-time students were enrolled at the master’s/otherlevel (97.1%). As shown in Figure 2.6, high percentages of students were
also enrolled at the master’s/other level in public administration and servic-es (96.6%), ‘other’ fields (92.9%), and education (90.5%). The broad fieldswith the lowest percentages of students enrolled at the master’s/other levelwere physical and earth sciences (41.2%), biological and agricultural sci-ences (60.1%), and social and behavioral sciences (74.7%).
Among first-time students in programs leading to a master’s degree or agraduate certificate, students in the two largest broad fields (education andbusiness) collectively accounted for 42.5% of all first-time master’s degreeor graduate certificate students. In contrast, first-time students in doctoralprograms in education and business accounted for just 16.2% of all doc-toral students in fall 2009. At the doctoral level, the two largest fields weresocial and behavioral sciences and engineering, and collectively studentsin these two broad fields accounted for 28.3% of all first-time doctoral stu-dents.
As noted above, 58.1% of all first-time graduate students in fall 2009 werewomen, but women comprised a larger share of first-time enrollees at themaster’s degree and graduate certificate level (59.3%) than at the doctorallevel (51.2%). Despite the variation in their representation by level, womenstill comprised the majority of first-time graduate students at both levels.
Figure 2.6 First-Time Graduate Enrollment by Broad Fieldand Degree Level, Fall 2009
15%
22%
40%
9%
25%
18%
22%
59%
25%
7%
85%
78%
60%
97%
91%
75%
82%
78%
41%
97%
75%
93%
3%
3%
0% 20% 40% 60% 80% 100%
Total
Arts and Humanities
Biological & Agric. Sci.
Business
Education
Engineering
Health Sciences
Math & Computer Sci.
Physical & Earth Sci.
Public Admin. & Svcs.
Social & Behavioral Sci.
Other Fields
Doctoral Master's/Other
Source: CGS/GRE Survey of Graduate Enrollment and Degrees
Figure 2.5 First-Time Graduate Enrollment by Broad Field andAttendance Status, Fall 2009
64%
78%
84%
65%
45%
79%
66%
73%
88%
67%
80%
59%
36%
22%
16%
35%
55%
21%
34%
27%
12%
33%
20%
41%
0% 20% 40% 60% 80% 100%
Total
Arts and Humanities
Biological & Agric. Sci.
Business
Education
Engineering
Health Sciences
Math & Computer Sci.
Physical & Earth Sci.
Public Admin. & Svcs.
Social & Behavioral Sci.
Other Fields
Full-Time Part-Time
Source: CGS/GRE Survey of Graduate Enrollment and Degrees
Graduate Enrollment and Degrees: 1999 to 2009 9
Men comprised 40.7% of all master’s/other first-time students in fall 2009and 48.8% of all first-time doctoral enrollees (Table 2.7).
At the master’s degree and graduate certificate level, women accounted forthe largest share of first-time graduate students in health sciences (80.5%),followed by public administration and services (76.4%), and education(75.6%). Men comprised the largest share of students in engineering(78.1%), mathematics and computer sciences (69.2%), and business(58.3%). At the doctoral level, women were most highly represented inhealth sciences (72.0%), education (68.8%), and public administration andservices (64.8%). Men were most highly represented in engineering(75.6%), mathematics and computer sciences (74.3%), and physical andearth sciences (64.4%).
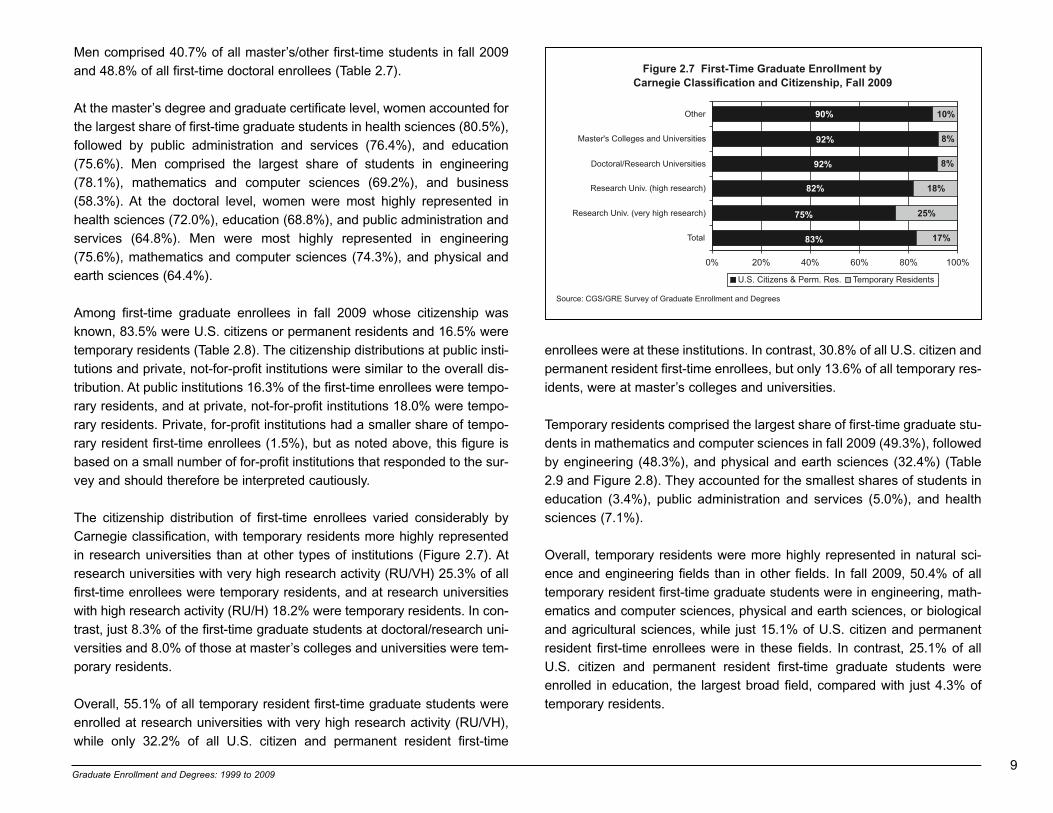
Among first-time graduate enrollees in fall 2009 whose citizenship wasknown, 83.5% were U.S. citizens or permanent residents and 16.5% weretemporary residents (Table 2.8). The citizenship distributions at public insti-tutions and private, not-for-profit institutions were similar to the overall dis-tribution. At public institutions 16.3% of the first-time enrollees were tempo-rary residents, and at private, not-for-profit institutions 18.0% were tempo-rary residents. Private, for-profit institutions had a smaller share of tempo-rary resident first-time enrollees (1.5%), but as noted above, this figure isbased on a small number of for-profit institutions that responded to the sur-vey and should therefore be interpreted cautiously.
The citizenship distribution of first-time enrollees varied considerably byCarnegie classification, with temporary residents more highly representedin research universities than at other types of institutions (Figure 2.7). Atresearch universities with very high research activity (RU/VH) 25.3% of allfirst-time enrollees were temporary residents, and at research universitieswith high research activity (RU/H) 18.2% were temporary residents. In con-trast, just 8.3% of the first-time graduate students at doctoral/research uni-versities and 8.0% of those at master’s colleges and universities were tem-porary residents.
Overall, 55.1% of all temporary resident first-time graduate students wereenrolled at research universities with very high research activity (RU/VH),while only 32.2% of all U.S. citizen and permanent resident first-time
enrollees were at these institutions. In contrast, 30.8% of all U.S. citizen andpermanent resident first-time enrollees, but only 13.6% of all temporary res-idents, were at master’s colleges and universities.
Temporary residents comprised the largest share of first-time graduate stu-dents in mathematics and computer sciences in fall 2009 (49.3%), followedby engineering (48.3%), and physical and earth sciences (32.4%) (Table2.9 and Figure 2.8). They accounted for the smallest shares of students ineducation (3.4%), public administration and services (5.0%), and healthsciences (7.1%).
Overall, temporary residents were more highly represented in natural sci-ence and engineering fields than in other fields. In fall 2009, 50.4% of alltemporary resident first-time graduate students were in engineering, math-ematics and computer sciences, physical and earth sciences, or biologicaland agricultural sciences, while just 15.1% of U.S. citizen and permanentresident first-time enrollees were in these fields. In contrast, 25.1% of allU.S. citizen and permanent resident first-time graduate students wereenrolled in education, the largest broad field, compared with just 4.3% oftemporary residents.
Figure 2.7 First-Time Graduate Enrollment by Carnegie Classification and Citizenship, Fall 2009
25%
83%
75%
82%
92%
92%
90%
8%
8%
17%
18%
10%
0% 20% 40% 60% 80% 100%
Total
Research Univ. (very high research)
Research Univ. (high research)
Doctoral/Research Universities
Master's Colleges and Universities
Other
U.S. Citizens & Perm. Res. Temporary Residents
Source: CGS/GRE Survey of Graduate Enrollment and Degrees
10Graduate Enrollment and Degrees: 1999 to 2009
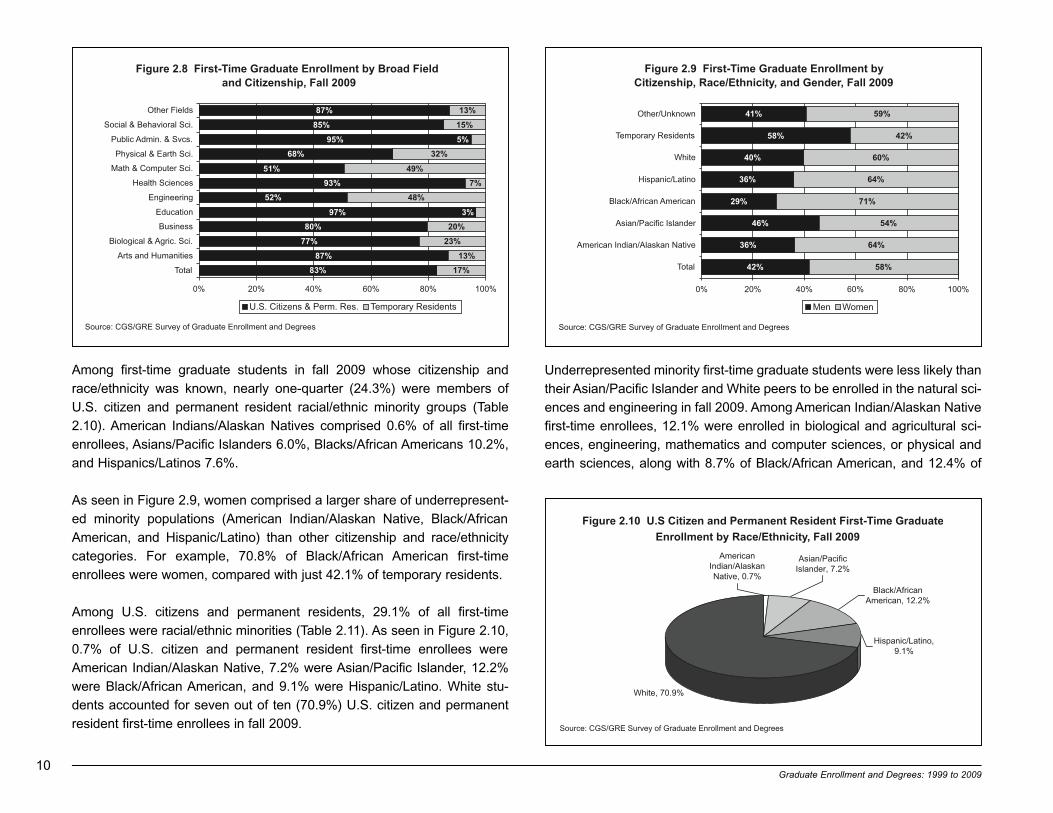
Among first-time graduate students in fall 2009 whose citizenship andrace/ethnicity was known, nearly one-quarter (24.3%) were members ofU.S. citizen and permanent resident racial/ethnic minority groups (Table2.10). American Indians/Alaskan Natives comprised 0.6% of all first-timeenrollees, Asians/Pacific Islanders 6.0%, Blacks/African Americans 10.2%,and Hispanics/Latinos 7.6%.
As seen in Figure 2.9, women comprised a larger share of underrepresent-ed minority populations (American Indian/Alaskan Native, Black/AfricanAmerican, and Hispanic/Latino) than other citizenship and race/ethnicitycategories. For example, 70.8% of Black/African American first-timeenrollees were women, compared with just 42.1% of temporary residents.
Among U.S. citizens and permanent residents, 29.1% of all first-timeenrollees were racial/ethnic minorities (Table 2.11). As seen in Figure 2.10,0.7% of U.S. citizen and permanent resident first-time enrollees wereAmerican Indian/Alaskan Native, 7.2% were Asian/Pacific Islander, 12.2%were Black/African American, and 9.1% were Hispanic/Latino. White stu-dents accounted for seven out of ten (70.9%) U.S. citizen and permanentresident first-time enrollees in fall 2009.
Figure 2.10 U.S Citizen and Permanent Resident First-Time Graduate
Enrollment by Race/Ethnicity, Fall 2009
Source: CGS/GRE Survey of Graduate Enrollment and Degrees
White, 70.9%
Asian/Pacific Islander, 7.2%
Black/African American, 12.2%
Hispanic/Latino, 9.1%
American Indian/Alaskan Native, 0.7%
Figure 2.9 First-Time Graduate Enrollment by Citizenship, Race/Ethnicity, and Gender, Fall 2009
42%
36%
46%
29%
36%
40%
58%
41%
58%
64%
54%
71%
64%
60%
42%
59%
0% 20% 40% 60% 80% 100%
Total
American Indian/Alaskan Native
Asian/Pacific Islander
Black/African American
Hispanic/Latino
White
Temporary Residents
Other/Unknown
Men Women
Source: CGS/GRE Survey of Graduate Enrollment and Degrees
Underrepresented minority first-time graduate students were less likely thantheir Asian/Pacific Islander and White peers to be enrolled in the natural sci-ences and engineering in fall 2009. Among American Indian/Alaskan Nativefirst-time enrollees, 12.1% were enrolled in biological and agricultural sci-ences, engineering, mathematics and computer sciences, or physical andearth sciences, along with 8.7% of Black/African American, and 12.4% of
Figure 2.8 First-Time Graduate Enrollment by Broad Fieldand Citizenship, Fall 2009
83%
87%
77%
80%
97%
52%
93%
51%
68%
95%
85%
87%
17%
13%
23%
20%
48%
7%
49%
32%
15%
13%
3%
5%
0% 20% 40% 60% 80% 100%
Total
Arts and Humanities
Biological & Agric. Sci.
Business
Education
Engineering
Health Sciences
Math & Computer Sci.
Physical & Earth Sci.
Public Admin. & Svcs.
Social & Behavioral Sci.
Other Fields
U.S. Citizens & Perm. Res. Temporary Residents
Source: CGS/GRE Survey of Graduate Enrollment and Degrees

Graduate Enrollment and Degrees: 1999 to 2009 11
Hispanic/Latino first-time graduate students. In comparison, 15.2% ofWhites and 27.8% of Asians/Pacific Islanders were enrolled in one of thesefour broad fields (Figure 2.11).
Asian/Pacific Islander first-time enrollees were less likely to be in educationfields than other U.S. citizens and permanent resident racial/ethnic groups.While 23.8% of American Indian/Alaskan Native, 29.4% of Black/AfricanAmerican, 28.1% of Hispanic/Latino, and 25.4% of White first-time enrolleeswere in education, just 12.0% of Asians/Pacific Islanders were. In contrast,Asian/Pacific Islander first-time enrollees were more likely to be enrolled inbusiness than other U.S. citizen and permanent resident racial/ethnic groups.
For more detailed information about first-time graduate enrollment, seeTables 2.3 through 2.11.
Total Graduate Enrollment
The institutions responding to the CGS/GRE Survey of GraduateEnrollment and Degrees enrolled a total of more than 1.8 million students ingraduate certificate, education specialist, master’s, or doctoral programs infall 2009 (Table 2.12). Six out of ten (59.6%) graduate students wereenrolled at public institutions in fall 2009, and three out of ten (31.1%) wereat private, not-for-profit institutions. The remainder (9.3%) were at private,for-profit institutions.8
By Carnegie classification, 31.2% of all graduate students were enrolled atresearch universities with very high research activity (RU/VH), 19.3% wereat research universities with high research activity (RU/H), 11.4% were atdoctoral/research universities, 33.5% were at master’s colleges and univer-sities, and 4.6% were at institutions with other basic Carnegie classifications.
Among the 699 institutions responding to the CGS/GRE Survey of GraduateEnrollment and Degrees, the mean number of graduate students per institu-
tion in fall 2009 was 2,596, and the median number of graduate students was1,387. Twenty-five percent of the respondents had fewer than 635 graduatestudents at their institution, and 25% had more than 3,370 graduate students.
More than half (56.2%) of all graduate students were enrolled full-time in fall2009, and 43.8% were enrolled part-time. Research universities with veryhigh research activity had the highest percentage of full-time students(73.1%), and master’s colleges and universities had the lowest percentage(44.4%) as shown in Figure 2.12.
Research universities with very high research activity also had the highestproportion of male graduate students (50.3%), compared with 44.6% inresearch universities with high research activity, 32.8% in doctoral/researchuniversities, 33.4% in master’s colleges and universities, and 36.0% in insti-tutions with other basic Carnegie classifications. Overall, 41.1% of all grad-uate students in fall 2009 were men and 58.9% were women.
Collectively, 28.2% of all female graduate students attended research uni-versities with very high research activity, compared with 39.4% of male grad-uate students. Conversely, 35.9% of all female graduate students attendedmaster’s colleges and universities, compared with 25.8% of male enrollees.
Figure 2.11 U.S. Citizen and Permanent Resident First-Time Graduate Enrollment by Race/Ethnicity and Broad Field, Fall 2009
12%
28%
9%
12%
15%
12%
8%
10%
12%
9%
11%
13%
12%
8%
12%
13%
23%
17%
16%
15%
24%
12%
29%
28%
25%
28%
16%
24%
24%
23%
0% 20% 40% 60% 80% 100%
American Indian/Alaskan Native
Asian/Pacific Islander
Black/African American
Hispanic/Latino
White
Natural Sciences & Engineering
Social & Behavioral Sciences
Health Sciences
Business
Education
All Other Fields
Source: CGS/GRE Survey of Graduate Enrollment and Degrees
8 As mentioned previously in this chapter, the response rate among for-profit institutionswas not as high as among public institutions and private, not-for-profit institutions. Whilemore for-profit institutions supplied data on total enrollment than on first-time enrollment andapplications, the figures for for-profit institutions in this section may not be representative ofthe entire universe of for-profit institutions in the United States.

12Graduate Enrollment and Degrees: 1999 to 2009
The broad fields of education, business, and health sciences enrolled thelargest numbers of graduate students in fall 2009 (Table 2.13). Overall,23.8% of all graduate students were in education, 17.6% were in business,and 10.2% were in health sciences. At the opposite end of the spectrum,just 3.2% of all graduate students were in physical and earth sciences, 4.2%were in mathematics and computer sciences, and 4.3% were in publicadministration and services.
As shown in Figure 2.13, women comprised the largest shares of enrolleesin health sciences (79.1%), education (74.9%), and public administrationand services (74.4%). Half (49.8%) of all female enrollees in fall 2009 werein one of these three broad fields. Women comprised the smallest shares oftotal graduate enrollment in engineering (22.3%), mathematics and com-puter sciences (28.9%), and physical and earth sciences (37.3%), and just7.2% of all female enrollees were in one of these three broad fields.
Men comprised the majority of graduate students in four broad fields in fall2009—engineering (77.7%), mathematics and computer sciences (71.1%),physical and earth sciences (62.7%), and business (54.3%). These fourbroad fields accounted for half (50.2%) of all male enrollees.
While 56.2% of all graduate students were enrolled full-time in fall 2009,attendance status varied by broad field (Figure 2.14). Physical and earthsciences had the highest share of full-time enrollees (81.5%), followed bybiological and agricultural sciences (78.1%), and social and behavioral sci-ences (70.4%). In contrast, just 40.8% of all graduate students in educationwere enrolled full-time. Education was the only broad field in fall 2009 inwhich the majority of all graduate students were enrolled part-time.
Among all graduate students in fall 2009, men were more likely to beenrolled full-time than women—60.3% of men vs. 54.4% of women (Table2.14). By broad field, men and women had similar rates of full-time atten-dance in all but three broad fields. In public administration and serviceswomen were more likely to be enrolled full-time than men—60.5% ofwomen were attending full-time, compared with 52.4% of men. In bothhealth sciences and ‘other’ fields, men were more likely to be enrolled full-time than women—68.2% of men and 60.8% of women in health sciences,and 54.5% of men and 46.4% of women in ‘other’ fields.
About three-quarters (75.7%) of graduate students in fall 2009 wereenrolled in programs leading to a master’s degree or a graduate certificate.One-quarter (24.3%) were enrolled in doctoral programs (Table 2.15).
Figure 2.13 Total Graduate Enrollment by Broad Fieldand Gender, Fall 2009
41%
43%
46%
54%
25%
78%
21%
71%
63%
26%
36%
39%
59%
57%
54%
46%
75%
22%
79%
29%
37%
74%
64%
61%
0% 20% 40% 60% 80% 100%
Total
Arts and Humanities
Biological & Agric. Sci.
Business
Education
Engineering
Health Sciences
Math & Computer Sci.
Physical & Earth Sci.
Public Admin. & Svcs.
Social & Behavioral Sci.
Other Fields
Men Women
Source: CGS/GRE Survey of Graduate Enrollment and Degrees
Figure 2.12 Total Graduate Enrollment by CarnegieClassification and Attendance Status, Fall 2009
27%
56%
73%
52%
53%
44%
52%
56%
47%
44%
48%
48%
0% 20% 40% 60% 80% 100%
Total
Research Univ. (very high research)
Research Univ. (high research)
Doctoral/Research Universities
Master's Colleges and Universities
Other
Full-Time Part-Time
Source: CGS/GRE Survey of Graduate Enrollment and Degrees

Graduate Enrollment and Degrees: 1999 to 2009 13
In business, nearly all graduate students were enrolled at the master’s/otherlevel (94.6%). As shown in Figure 2.15, high percentages of students werealso enrolled at the master’s/other level in public administration and servic-es (92.4%), ‘other’ fields (85.3%), and education (83.3%). The broad fieldswith the lowest percentages of students enrolled at the master’s/other levelwere physical and earth sciences (28.9%) and biological and agriculturalsciences (40.6%).
Among graduate students in programs leading to a master’s degree or agraduate certificate, students in the two largest broad fields (education andbusiness) collectively accounted for 48.7% of all master’s degree or gradu-ate certificate students. At the doctoral level, the two largest fields were edu-cation and social and behavioral sciences, and collectively students in thesetwo broad fields accounted for 30.5% of all doctoral students.
As noted, 58.9% of all graduate students in fall 2009 were women, but womencomprised a larger share of total enrollees at the master’s degree and grad-uate certificate level (61.3%) than at the doctoral level (51.4%). Despite thevariation in their representation by level, women still comprised the majority ofgraduate students at both levels. Men comprised 38.7% of all master’s/otherstudents in fall 2009 and 48.6% of all doctoral enrollees (Table 2.16).
At the master’s degree and graduate certificate level, women accounted forthe largest share of graduate students in health sciences (81.6%), followedby education (76.2%) and public administration and services (75.5%). Mencomprised the largest share of students in engineering (78.3%), mathemat-ics and computer sciences (69.4%), and physical and earth sciences(55.7%). At the doctoral level, women were most highly represented in healthsciences (70.7%), education (68.6%), and public administration and servic-es (62.1%). Men were most highly represented in engineering (76.8%),mathematics and computer sciences (74.8%), and physical and earth sci-ences (65.5%).
Among graduate students in fall 2009 whose citizenship was known, 84.5%were U.S. citizens or permanent residents and 15.5% were temporary resi-dents (Table 2.17). The citizenship distributions at public institutions and pri-vate, not-for-profit institutions were similar to the overall distribution. At bothpublic institutions and private, not-for-profit institutions 16.4% of the graduatestudents were temporary residents. Private, for-profit institutions had a small-er share of temporary resident graduate students (4.6%), but as previouslynoted this figure is based on a small number of for-profit institutions thatresponded to the survey, and should therefore be interpreted cautiously.
Figure 2.14 Total Graduate Enrollment by Broad Field andAttendance Status, Fall 2009
56%
68%
78%
56%
41%
69%
62%
63%
81%
58%
70%
50%
44%
32%
22%
44%
59%
31%
38%
37%
19%
42%
30%
50%
0% 20% 40% 60% 80% 100%
Total
Arts and Humanities
Biological & Agric. Sci.
Business
Education
Engineering
Health Sciences
Math & Computer Sci.
Physical & Earth Sci.
Public Admin. & Svcs.
Social & Behavioral Sci.
Other Fields
Full-Time Part-Time
Source: CGS/GRE Survey of Graduate Enrollment and Degrees
Figure 2.15 Total Graduate Enrollment by Broad Fieldand Degree Level, Fall 2009
24%
40%
59%
17%
40%
22%
34%
71%
8%
40%
15%
76%
60%
41%
95%
83%
60%
78%
66%
29%
92%
60%
85%
5%
0% 20% 40% 60% 80% 100%
Total
Arts and Humanities
Biological & Agric. Sci.
Business
Education
Engineering
Health Sciences
Math & Computer Sci.
Physical & Earth Sci.
Public Admin. & Svcs.
Social & Behavioral Sci.
Other Fields
Doctoral Master's/Other
Source: CGS/GRE Survey of Graduate Enrollment and Degrees

14Graduate Enrollment and Degrees: 1999 to 2009
The citizenship distribution of graduate students varied considerably byCarnegie classification, with temporary residents more highly represented inresearch universities than at other types of institutions (Figure 2.16). Atresearch universities with very high research activity (RU/VH) 25.5% of allgraduate students were temporary residents, and at research universities withhigh research activity (RU/H) 17.8% were temporary residents. In contrast,just 8.0% of graduate students at doctoral/research universities and 7.1% ofthose at master’s colleges and universities were temporary residents.
Overall, more than half (54.6%) of all temporary resident graduate studentswere enrolled at research universities with very high research activity(RU/VH), while only 29.2% of all U.S. citizen and permanent resident grad-uate students were at these institutions. In contrast, 33.8% of all U.S. citi-zen and permanent resident graduate students, but only 14.1% of all tem-porary residents, were at master’s colleges and universities.
Temporary residents comprised the largest share of graduate students inengineering in fall 2009 (48.5%), followed by mathematics and computersciences (45.9%), and physical and earth sciences (34.7%) (Table 2.18and Figure 2.17). They accounted for the smallest shares of students ineducation (3.2%), public administration and services (4.9%), and healthsciences (7.4%).
Overall, temporary residents were more highly represented in natural sci-ence and engineering fields than in other fields. In fall 2009, 54.0% of alltemporary resident graduate students were in engineering, mathematicsand computer sciences, physical and earth sciences, or biological and agri-cultural sciences, while just 15.3% of U.S. citizen and permanent residentgraduate students were in these fields. In contrast, 27.4% of all U.S. citizenand permanent resident graduate students were enrolled in education, thelargest broad field, compared with just 4.8% of temporary residents.
Among graduate students in fall 2009 whose citizenship and race/ethnicitywas known, one-quarter (24.7%) were members of U.S. citizen and perma-nent resident racial/ethnic minority groups (Table 2.19). AmericanIndians/Alaskan Natives comprised 0.6% of all graduate students,Asians/Pacific Islanders 5.5%, Blacks/African Americans 11.5%, andHispanics/Latinos 7.1%.
As seen in Figure 2.18, women comprised a larger share of underrepre-sented minority populations (American Indian/Alaskan Native, Black/AfricanAmerican, and Hispanic/Latino) than other citizenship and race/ethnicitycategories. For example, 72.1% of Black/African American graduate stu-dents were women, compared with just 41.1% of temporary residents.
Figure 2.17 Total Graduate Enrollment by Broad Fieldand Citizenship, Fall 2009
85%
86%
74%
85%
97%
52%
93%
54%
65%
95%
86%
89%
15%
14%
26%
15%
48%
7%
46%
35%
14%
11%
5%
3%
0% 20% 40% 60% 80% 100%
Total
Arts and Humanities
Biological & Agric. Sci.
Business
Education
Engineering
Health Sciences
Math & Computer Sci.
Physical & Earth Sci.
Public Admin. & Svcs.
Social & Behavioral Sci.
Other Fields
U.S. Citizens & Perm. Res. Temporary Residents
Source: CGS/GRE Survey of Graduate Enrollment and Degrees
Figure 2.16 Total Graduate Enrollment by CarnegieClassification and Citizenship, Fall 2009
25%
85%
75%
82%
92%
93%
92%
7%
8%
15%
18%
8%
0% 20% 40% 60% 80% 100%
Total
Research Univ. (very high research)
Research Univ. (high research)
Doctoral/Research Universities
Master's Colleges and Universities
Other
U.S. Citizens & Perm. Res. Temporary Residents
Source: CGS/GRE Survey of Graduate Enrollment and Degrees
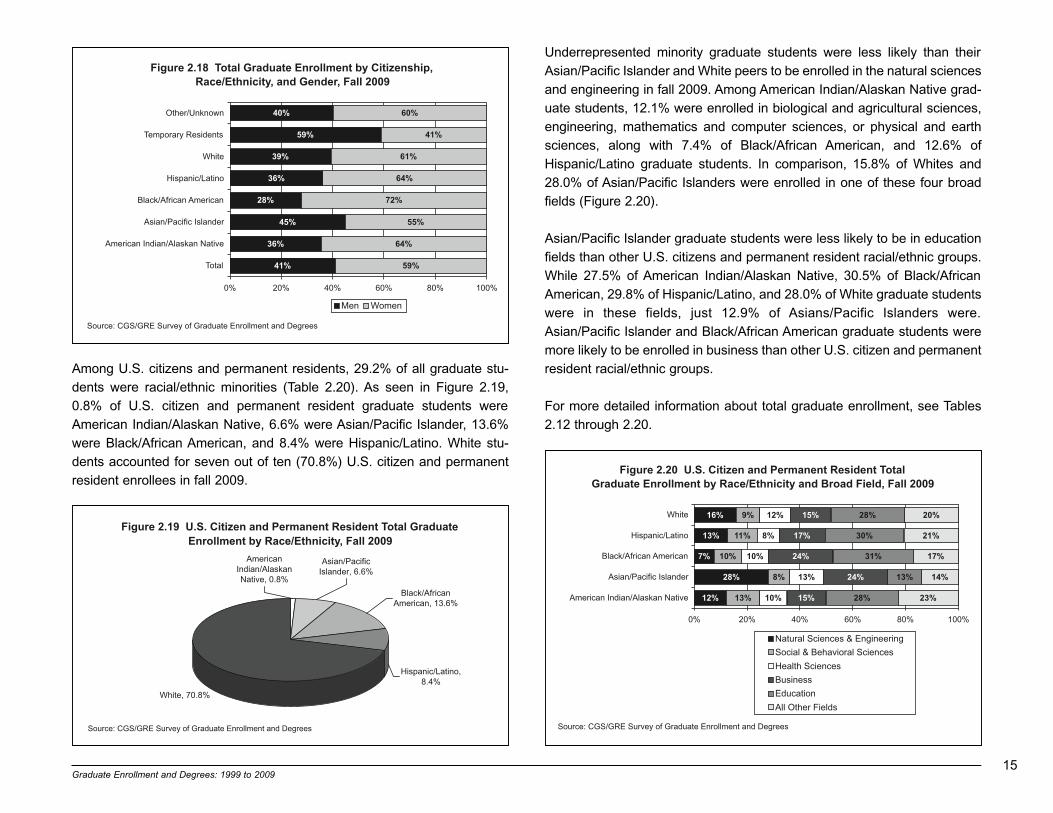
Underrepresented minority graduate students were less likely than theirAsian/Pacific Islander and White peers to be enrolled in the natural sciencesand engineering in fall 2009. Among American Indian/Alaskan Native grad-uate students, 12.1% were enrolled in biological and agricultural sciences,engineering, mathematics and computer sciences, or physical and earthsciences, along with 7.4% of Black/African American, and 12.6% ofHispanic/Latino graduate students. In comparison, 15.8% of Whites and28.0% of Asian/Pacific Islanders were enrolled in one of these four broadfields (Figure 2.20).
Asian/Pacific Islander graduate students were less likely to be in educationfields than other U.S. citizens and permanent resident racial/ethnic groups.While 27.5% of American Indian/Alaskan Native, 30.5% of Black/AfricanAmerican, 29.8% of Hispanic/Latino, and 28.0% of White graduate studentswere in these fields, just 12.9% of Asians/Pacific Islanders were.Asian/Pacific Islander and Black/African American graduate students weremore likely to be enrolled in business than other U.S. citizen and permanentresident racial/ethnic groups.
For more detailed information about total graduate enrollment, see Tables2.12 through 2.20.
Among U.S. citizens and permanent residents, 29.2% of all graduate stu-dents were racial/ethnic minorities (Table 2.20). As seen in Figure 2.19,0.8% of U.S. citizen and permanent resident graduate students wereAmerican Indian/Alaskan Native, 6.6% were Asian/Pacific Islander, 13.6%were Black/African American, and 8.4% were Hispanic/Latino. White stu-dents accounted for seven out of ten (70.8%) U.S. citizen and permanentresident enrollees in fall 2009.
Graduate Enrollment and Degrees: 1999 to 2009 15
Figure 2.18 Total Graduate Enrollment by Citizenship,Race/Ethnicity, and Gender, Fall 2009
41%
36%
45%
28%
36%
39%
59%
40%
59%
64%
55%
72%
64%
61%
41%
60%
0% 20% 40% 60% 80% 100%
Total
American Indian/Alaskan Native
Asian/Pacific Islander
Black/African American
Hispanic/Latino
White
Temporary Residents
Other/Unknown
Men Women
Source: CGS/GRE Survey of Graduate Enrollment and Degrees
Figure 2.19 U.S. Citizen and Permanent Resident Total GraduateEnrollment by Race/Ethnicity, Fall 2009
Source: CGS/GRE Survey of Graduate Enrollment and Degrees
White, 70.8%
Asian/Pacific Islander, 6.6%
Black/African American, 13.6%
Hispanic/Latino, 8.4%
American Indian/Alaskan Native, 0.8%
Figure 2.20 U.S. Citizen and Permanent Resident Total Graduate Enrollment by Race/Ethnicity and Broad Field, Fall 2009
12%
28%
7%
13%
16%
13%
8%
10%
11%
9%
10%
13%
10%
8%
12%
15%
24%
24%
17%
15%
28%
13%
31%
30%
28%
23%
14%
17%
21%
20%
0% 20% 40% 60% 80% 100%
American Indian/Alaskan Native
Asian/Pacific Islander
Black/African American
Hispanic/Latino
White
Natural Sciences & Engineering
Social & Behavioral Sciences
Health Sciences
Business
Education
All Other Fields
Source: CGS/GRE Survey of Graduate Enrollment and Degrees

16Graduate Enrollment and Degrees: 1999 to 2009
9 As mentioned previously in this chapter, the response rate among for-profit institutionswas not as high as among public institutions and private, not-for-profit institutions. Whilemore for-profit institutions supplied data on graduate certificates and degrees and totalenrollment than on first-time enrollment and applications, the degree data for for-profit institutions in this section may not be representative of the entire universe of for-profit institutions in the United States.
Graduate Certificates and Degrees
The institutions responding to the CGS/GRE Survey of GraduateEnrollment and Degrees awarded a total of more than 587,000 graduatecertificates and degrees in academic year 2008-09 (July 1, 2008 throughJune 30, 2009), including 57,599 doctoral degrees, 502,713 master’sdegrees, and 27,193 graduate certificates (Table 2.21).
At the doctoral level, public institutions awarded nearly two-thirds (65.9%) ofall degrees awarded in 2008-09; private, not-for-profit institutions awardedthree out of every ten (31.3%); and private, for-profit institutions awardedthe remaining 2.8% of all doctoral degrees.9 At the master’s level, 56.7% ofall degrees were awarded by public institutions, 34.6% by private, not-for-profit institutions, and 8.7% by private, for-profit institutions. At the graduatecertificate level, 43.5% were awarded by public institutions, 52.9% by pri-vate, not-for-profit institutions, and 3.7% by private, for-profit institutions.
By Carnegie classification, 61.8% of all doctoral degrees were awarded byresearch universities with very high research activity (RU/VH), 19.8% byresearch universities with high research activity (RU/H), 7.6% by doctor-al/research universities, 6.0% by master’s colleges and universities, and4.8% by institutions with other basic Carnegie classifications.
At the master’s degree level, the largest percentage of degrees were award-ed by master’s colleges and universities (38.3%), followed by research uni-versities with very high research activity (28.8%), research universities withhigh research activity (18.8%), doctoral/research universities (10.5%), andinstitutions with other basic Carnegie classifications (3.5%).
Master’s colleges and universities also awarded more graduate certificatesthan institutions with other Carnegie classifications, awarding 29.8% of allgraduate certificates conferred in 2008-09. Doctoral/research universities
awarded 28.9% of all graduate certificates conferred, research universitieswith high research activity (RU/H) awarded 21.3%, research universitieswith very high research activity (RU/VH) awarded 16.8%, and institutionswith other basic Carnegie classifications awarded 3.2%.
Among the institutions responding to the CGS/GRE Survey of GraduateEnrollment and Degrees that awarded one or more master’s degrees in2008-09, the mean number of master’s degrees awarded was 725, and themedian number of master’s degrees awarded was 403. Twenty-five percentof the respondents awarded fewer than 180 master’s degrees, and 25%awarded more than 921 master’s degrees each. Among the respondentsawarding one or more doctorates in 2008-09, the mean number of doctor-ates awarded was 133, and the median was 58. One-quarter of the respon-dents awarded fewer than 20 doctorates each, and 25% awarded 165 ormore doctorates each. At the graduate certificate level, the mean number ofcertificates awarded was 88, and the median was 27. One-quarter of therespondents each awarded fewer than 9 certificates, and 25% awardedmore than 67 certificates.
At the doctoral level, education accounted for the largest number of degreesin 2008-09, with 14.4% of the total, followed by engineering (14.0%), andbiological and agricultural sciences (13.6%) (Table 2.22 and Figure 2.21).Only 0.9% of the doctoral degrees awarded in 2008-09 were in public
Figure 2.21 Doctoral Degrees Awarded by Broad Field, 2008-09
Source: CGS/GRE Survey of Graduate Enrollment and Degrees
Other Fields, 3.6%
Physical & Earth Sci., 9.1%
Public Admin. & Services, 0.9%
Social & Behavioral Sciences, 13.5%
Math & Computer Sci.,
5.2%
Health Sciences, 13.0% Engineering, 14.0%
Biological & Agricultural
Sciences, 13.6%
Business, 3.0%
Education, 14.4%
Arts & Humanities, 9.5%

Graduate Enrollment and Degrees: 1999 to 2009 17
administration and services, and only 3.0% were in business. Natural sci-ences and engineering (biological and agricultural sciences, engineering,mathematics and computer sciences, and physical and earth sciences)accounted for 41.9% of all doctoral degrees.
At the master’s degree level, education and business were the largest broadfields, accounting for 27.2% and 24.1%, respectively, of the master’sdegrees awarded (Table 2.22 and Figure 2.22). The smallest broad field atthe master’s level was physical and earth sciences, accounting for just 1.4%of all master’s degrees awarded in 2008-09. The natural sciences and engi-neering (biological and agricultural sciences, engineering, mathematics andcomputer sciences, and physical and earth sciences) accounted for 15.4%of all master’s degrees, about one-third the size of the share of these broadfields at the doctoral level.
Education was also the largest broad field for graduate certificates, with46.6% of the total, followed by business (10.6%) (Table 2.22 and Figure 2.23).
Women earned about two-thirds (67.3%) of the graduate certificatesawarded in 2008-09, 60.4% of the master’s degrees, and 50.4% of the doc-torates (Tables 2.23, 2.24, and 2.25). Academic year 2008-09 marked thefirst year ever that women earned the majority of the degrees awarded atthe doctoral level.
At the graduate certificate level, women earned the majority of the certificatesawarded in all broad fields except engineering, mathematics and computersciences, and physical and earth sciences (Figure 2.24). Women earned thehighest percentages of the certificates awarded in health sciences (77.0%),education (73.0%), and public administration and services (71.8%).
Figure 2.22 Master's Degrees Awarded by Broad Field, 2008-09
Source: CGS/GRE Survey of Graduate Enrollment and Degrees
Other Fields, 6.6%
Physical & Earth Sci., 1.4%
Public Admin. & Services, 5.3%
Social & Behavioral Sciences, 7.1%
Math & Computer Sci.,
4.1%
Health Sciences, 8.6%
Engineering, 7.2%
Biological & Agricultural
Sciences, 2.7%
Business, 24.1%
Education, 27.2%
Arts & Humanities, 5.6%
Figure 2.23 Graduate Certificates Awarded by Broad Field, 2008-09
Source: CGS/GRE Survey of Graduate Enrollment and Degrees
Other Fields, 6.6%
Physical & Earth Sci., 0.8%
Public Admin. & Services, 3.3%
Social & Behavioral Sciences, 7.1%
Math & Computer Sci., 3.6%
Health Sciences, 9.9%
Engineering, 5.3%
Biological & Agricultural
Sciences, 2.4%
Business, 10.6%
Education, 46.6%
Arts & Humanities, 3.8%
Figure 2.24 Graduate Certificates Awarded by Broad Field andGender, 2008-09
33%
39%
44%
45%
27%
78%
23%
65%
61%
28%
39%
39%
67%
61%
56%
55%
73%
22%
77%
35%
39%
72%
61%
61%
0% 20% 40% 60% 80% 100%
Total
Arts and Humanities
Biological & Agric. Sci.
Business
Education
Engineering
Health Sciences
Math & Computer Sci.
Physical & Earth Sci.
Public Admin. & Svcs.
Social & Behavioral Sci.
Other Fields
Men Women
Source: CGS/GRE Survey of Graduate Enrollment and Degrees
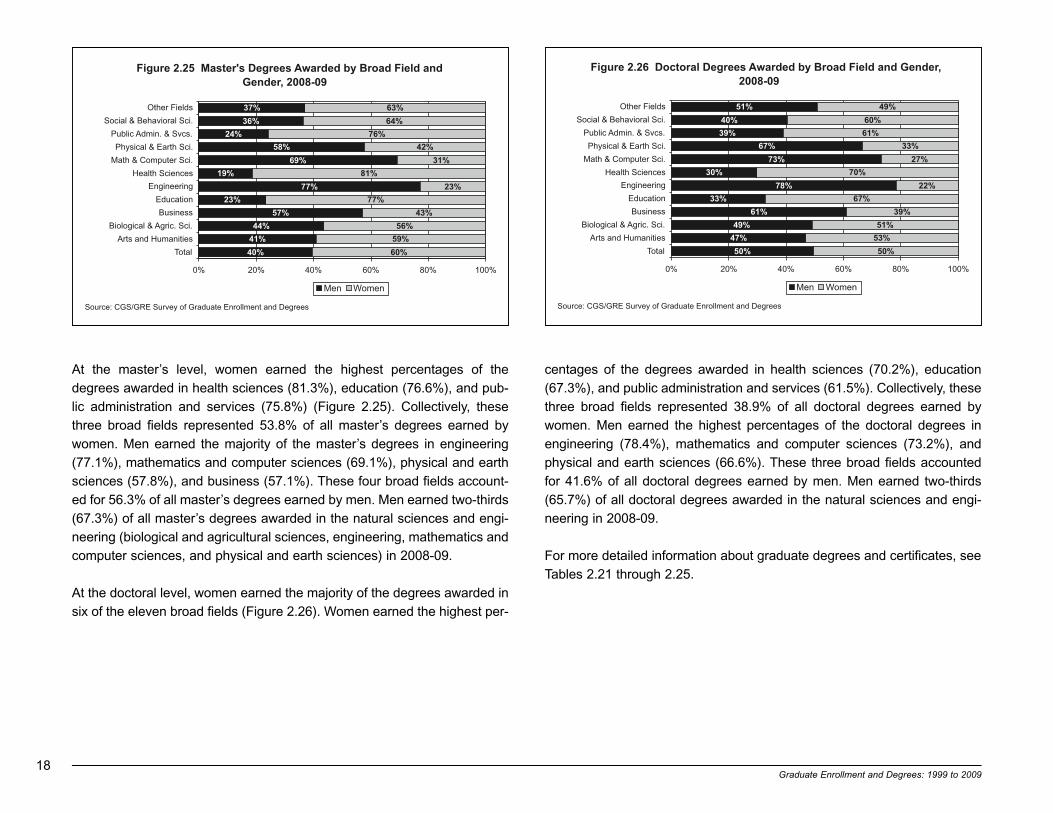
18Graduate Enrollment and Degrees: 1999 to 2009
At the master’s level, women earned the highest percentages of thedegrees awarded in health sciences (81.3%), education (76.6%), and pub-lic administration and services (75.8%) (Figure 2.25). Collectively, thesethree broad fields represented 53.8% of all master’s degrees earned bywomen. Men earned the majority of the master’s degrees in engineering(77.1%), mathematics and computer sciences (69.1%), physical and earthsciences (57.8%), and business (57.1%). These four broad fields account-ed for 56.3% of all master’s degrees earned by men. Men earned two-thirds(67.3%) of all master’s degrees awarded in the natural sciences and engi-neering (biological and agricultural sciences, engineering, mathematics andcomputer sciences, and physical and earth sciences) in 2008-09.
At the doctoral level, women earned the majority of the degrees awarded insix of the eleven broad fields (Figure 2.26). Women earned the highest per-
Figure 2.26 Doctoral Degrees Awarded by Broad Field and Gender,2008-09
50%
47%
49%
61%
33%
78%
30%
73%
67%
39%
40%
51%
50%
53%
51%
39%
67%
22%
70%
27%
33%
61%
60%
49%
0% 20% 40% 60% 80% 100%
Total
Arts and Humanities
Biological & Agric. Sci.
Business
Education
Engineering
Health Sciences
Math & Computer Sci.
Physical & Earth Sci.
Public Admin. & Svcs.
Social & Behavioral Sci.
Other Fields
Men Women
Source: CGS/GRE Survey of Graduate Enrollment and Degrees
Figure 2.25 Master's Degrees Awarded by Broad Field andGender, 2008-09
40%
41%
44%
57%
23%
77%
19%
69%
58%
24%
36%
37%
60%
59%
56%
43%
77%
23%
81%
31%
42%
76%
64%
63%
0% 20% 40% 60% 80% 100%
Total
Arts and Humanities
Biological & Agric. Sci.
Business
Education
Engineering
Health Sciences
Math & Computer Sci.
Physical & Earth Sci.
Public Admin. & Svcs.
Social & Behavioral Sci.
Other Fields
Men Women
Source: CGS/GRE Survey of Graduate Enrollment and Degrees
centages of the degrees awarded in health sciences (70.2%), education(67.3%), and public administration and services (61.5%). Collectively, thesethree broad fields represented 38.9% of all doctoral degrees earned bywomen. Men earned the highest percentages of the doctoral degrees inengineering (78.4%), mathematics and computer sciences (73.2%), andphysical and earth sciences (66.6%). These three broad fields accountedfor 41.6% of all doctoral degrees earned by men. Men earned two-thirds(65.7%) of all doctoral degrees awarded in the natural sciences and engi-neering in 2008-09.
For more detailed information about graduate degrees and certificates, seeTables 2.21 through 2.25.

Graduate Enrollment and Degrees: 1999 to 2009 19
Table 2.1 Applications for Admission to Graduate School by Institution Type, Carnegie Classification, and Degree Level, Fall 2009
Carnegie Classification andInstitution Type ** latoTlatoTlatoT
%9.44035,067333,496,1%0.55964,506550,001,1%2.42174,431267,655latoT
Public 354,050 93,959 26.5% 702,267 374,228 53.3% 1,071,051 477,503 44.6%
Private, not-for-profit 197,896 36,108 18.2% 377,350 211,769 56.1% 598,028 259,151 43.3%
Private, for-profit 4,816 4,404 91.4% 20,438 19,472 95.3% 25,254 23,876 94.5%
Research Universities (RU/VH) 427,809 86,020 20.1% 473,465 196,658 41.5% 908,020 285,669 31.5%
Public 274,923 65,980 24.0% 329,646 142,250 43.2% 604,569 208,230 34.4%
Private, not-for-profit 152,886 20,040 13.1% 143,819 54,408 37.8% 303,451 77,439 25.5%
Private, for-profit N/A N/A N/A N/A N/A N/A
Research Universities (RU/H) 80,123 27,018 33.7% 243,813 142,853 58.6% 328,380 173,081 52.7%
Public 56,200 19,941 35.5% 166,469 95,575 57.4% 227,113 118,726 52.3%
Private, not-for-profit 23,923 7,077 29.6% 77,344 47,278 61.1% 101,267 54,355 53.7%
Private, for-profit N/A N/A N/A N/A N/A N/A
Continued on the following page.
See notes at end of table.
TotalMaster's/Other *Doctoral
AcceptedApplications
AcceptedApplications
AcceptedApplications

20Graduate Enrollment and Degrees: 1999 to 2009
Table 2.1 (continued) Applications for Admission to Graduate School by Institution Type, Carnegie Classification, and Degree Level, Fall 2009
Doctoral/Research Universities 14,099 6,170 43.8% 87,513 56,170 64.2% 118,211 71,026 60.1%
Public 5,301 2,265 42.7% 38,098 24,863 65.3% 45,812 28,983 63.3%
Private, not-for-profit 8,798 3,905 44.4% 49,415 31,307 63.4% 72,399 42,043 58.1%
Private, for-profit A/N A/N A/N A/N A/N A/N
Master's Colleges and Universities 14,220 7,601 53.5% 259,894 188,268 72.4% 282,907 200,766 71.0%
Public 7,345 3,751 51.1% 157,175 107,087 68.1% 172,397 115,089 66.8%
Private, not-for-profit 5,825 2,830 48.6% 87,321 66,457 76.1% 94,062 69,933 74.3%
Private, for-profit S S S S S S
%8.25889,92518,65%8.06025,12073,53%4.73266,7115,02rehtO
Public 10,281 2,022 19.7% 10,879 4,453 40.9% 21,160 6,475 30.6%
Private, not-for-profit 6,464 2,256 34.9% 19,451 12,319 63.3% 26,849 15,381 57.3%
Private, for-profit S S S S S S
* Includes applications to graduate-level certificate and education specialist programs.
** See page 3 for information about the Carnegie Classification system. RU/VH = very high research acitivity. RU/H = high research activity.
Notes: Because not all institutions responded to all items, details may not sum to totals. N/A = Not applicable. S = Suppressed due to small number of institutional
respondents in this category.
Source: CGS/GRE Survey of Graduate Enrollment and Degrees
Carnegie Classification andInstitution Type ** latoTlatoTlatoT
TotalMaster's/Other *Doctoral
AcceptedApplications
AcceptedApplications
AcceptedApplications

Graduate Enrollment and Degrees: 1999 to 2009 21
Table 2.2 Applications for Admission to Graduate School by Broad Field and Degree Level, Fall 2009
Broad Field latoTlatoTlatoT
%9.44035,067333,496,1%0.55964,506550,001,1%2.42174,431267,655latoT
%5.03208,84521,061%8.83217,53569,19%1.81150,21456,66seitinamuH dna strA
Biological and Agricultural Sciences 67,762 14,397 21.2% 38,999 18,723 48.0% 107,266 33,392 31.1%
%5.74644,901832,032%8.05158,401972,602%0.81141,4299,22ssenisuB
%6.07721,511559,261%7.47683,101347,531%5.94445,21923,52noitacudE
%0.83587,77628,402%8.64465,45096,611%6.52880,22124,68gnireenignE
%9.44378,36581,241%8.84123,05331,301%8.33933,21794,63secneicS htlaeH
Mathematics and Computer Sciences 44,342 10,211 23.0% 61,330 29,670 48.4% 106,166 40,107 37.8%
Physical and Earth Sciences 53,971 14,476 26.8% 15,161 6,968 46.0% 69,699 21,748 31.2%
Public Administration and Services 3,660 1,186 32.4% 49,240 33,142 67.3% 53,268 34,672 65.1%
Social and Behavioral Sciences 109,496 18,343 16.8% 84,998 49,476 58.2% 195,525 68,203 34.9%
%8.25071,85032,011%7.65769,05129,98%3.92801,5814,71sdleiF rehtO
* Includes applications to graduate-level certificate and education specialist programs.
Notes: Because not all institutions responded to all items, details may not sum to totals. See Appendix B for the survey taxonomy.
Source: CGS/GRE Survey of Graduate Enrollment and Degrees
TotalMaster's/Other *Doctoral
AcceptedApplications
AcceptedApplications
AcceptedApplications

22Graduate Enrollment and Degrees: 1999 to 2009
Table 2.3 First-Time Graduate Enrollment by Institution Type, Carnegie Classification,Gender, and Attendance Status, Fall 2009
Total
%2.63179,561%8.36530,292%1.85917,862%9.14015,391027,264latoT
Public 291,751 123,483 42.4% 167,777 57.6% 184,882 63.6% 105,952 36.4%
Private, not-for-profit 161,262 67,750 42.0% 93,512 58.0% 99,924 63.5% 57,541 36.5%
Private, for-profit 9,707 2,277 23.5% 7,430 76.5% 7,229 74.5% 2,478 25.5%
Research Universities (RU/VH) 160,862 80,052 49.8% 80,810 50.2% 129,184 80.9% 30,598 19.1%
Public 113,717 55,130 48.5% 58,587 51.5% 90,526 79.6% 23,191 20.4%
Private, not-for-profit 47,145 24,922 52.9% 22,223 47.1% 38,658 83.9% 7,407 16.1%
Private, for-profit N/A N/A N/A N/A N/A
Research Universities (RU/H) 97,711 43,127 44.3% 54,178 55.7% 62,761 64.5% 34,544 35.5%
Public 72,095 31,644 44.1% 40,045 55.9% 45,852 64.0% 25,837 36.0%
Private, not-for-profit 25,616 11,483 44.8% 14,133 55.2% 16,909 66.0% 8,707 34.0%
Private, for-profit N/A N/A N/A N/A N/A
Continued on the following page.
See notes at end of table.
Part-TimeWomen emiT-lluFneM Carnegie Classification andInstitution Type *
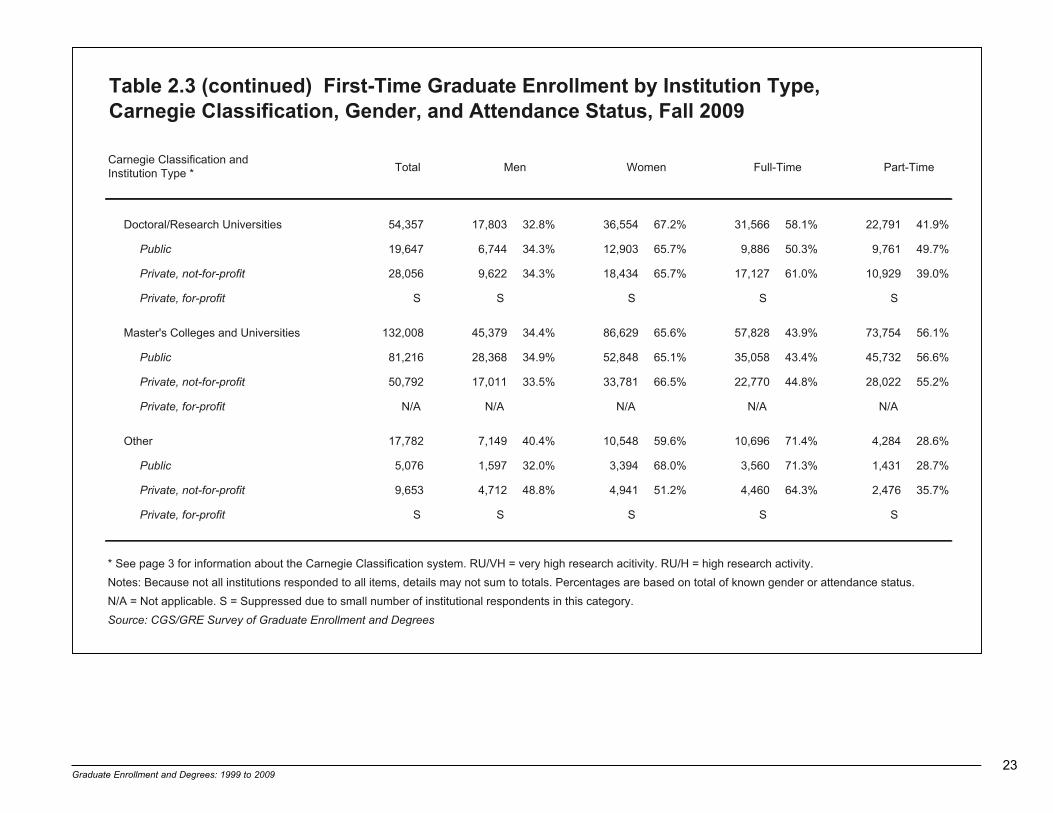
Graduate Enrollment and Degrees: 1999 to 2009 23
Table 2.3 (continued) First-Time Graduate Enrollment by Institution Type, Carnegie Classification, Gender, and Attendance Status, Fall 2009
Total
Doctoral/Research Universities 54,357 17,803 32.8% 36,554 67.2% 31,566 58.1% 22,791 41.9%
Public 19,647 6,744 34.3% 12,903 65.7% 9,886 50.3% 9,761 49.7%
Private, not-for-profit 28,056 9,622 34.3% 18,434 65.7% 17,127 61.0% 10,929 39.0%
Private, for-profit S S S S S
Master's Colleges and Universities 132,008 45,379 34.4% 86,629 65.6% 57,828 43.9% 73,754 56.1%
Public 81,216 28,368 34.9% 52,848 65.1% 35,058 43.4% 45,732 56.6%
Private, not-for-profit 50,792 17,011 33.5% 33,781 66.5% 22,770 44.8% 28,022 55.2%
Private, for-profit N/A N/A N/A N/A N/A
%6.82482,4%4.17696,01%6.95845,01%4.04941,7287,71rehtO
Public 5,076 1,597 32.0% 3,394 68.0% 3,560 71.3% 1,431 28.7%
Private, not-for-profit 9,653 4,712 48.8% 4,941 51.2% 4,460 64.3% 2,476 35.7%
Private, for-profit S S S S S
* See page 3 for information about the Carnegie Classification system. RU/VH = very high research acitivity. RU/H = high research activity.
Notes: Because not all institutions responded to all items, details may not sum to totals. Percentages are based on total of known gender or attendance status.
N/A = Not applicable. S = Suppressed due to small number of institutional respondents in this category.
Source: CGS/GRE Survey of Graduate Enrollment and Degrees
Part-TimeWomen emiT-lluFneM Carnegie Classification andInstitution Type *

24Graduate Enrollment and Degrees: 1999 to 2009
Table 2.4 First-Time Graduate Enrollment by Broad Field, Gender, and Attendance Status, Fall 2009
latoTdleiF daorB
%2.63179,561%8.36530,292%1.85917,862%9.14015,391027,264latoT
%8.12961,6%2.87511,22%5.75573,61%5.24021,21275,82seitinamuH dna strA
Biological and Agricultural Sciences 18,789 8,480 45.2% 10,275 54.8% 15,785 84.5% 2,899 15.5%
%2.53225,32%8.46142,34%8.14778,72%2.85688,83059,66ssenisuB
%8.45412,84%2.54677,93%9.47180,66%1.52680,22713,88noitacudE
%9.02503,7%1.97185,72%5.22739,7%5.77092,72072,53gnireenignE
%2.43526,41%8.56931,82%0.97448,33%0.12299,8068,24secneicS htlaeH
Mathematics and Computer Sciences 17,859 12,538 70.3% 5,294 29.7% 13,004 73.4% 4,724 26.6%
%4.21803,1%6.78242,9%4.93891,4%6.06444,6396,01secneicS htraE dna lacisyhP
Public Administration and Services 23,210 5,556 24.0% 17,607 76.0% 15,524 67.1% 7,621 32.9%
Social and Behavioral Sciences 36,151 13,660 37.8% 22,448 62.2% 28,650 79.7% 7,299 20.3%
%3.14069,41%7.85352,12%5.16962,22%5.83449,31912,63sdleiF rehtO
Notes: Because not all institutions responded to all items, details may not sum to totals. Percentages are based on total of known gender or attendance status.
See Appendix B for the survey taxonomy.
Source: CGS/GRE Survey of Graduate Enrollment and Degrees
Part-TimeFull-TimeWomenMen
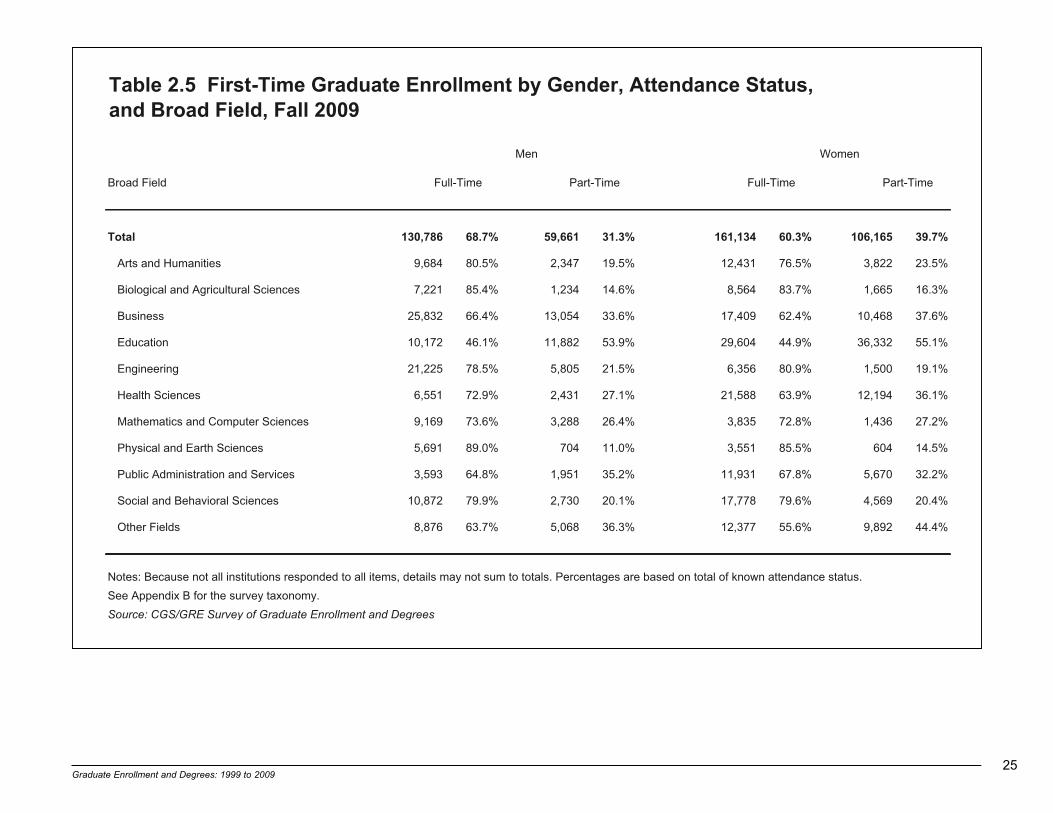
Graduate Enrollment and Degrees: 1999 to 2009 25
Table 2.5 First-Time Graduate Enrollment by Gender, Attendance Status,and Broad Field, Fall 2009
Broad Field
%7.93561,601%3.06431,161%3.13166,95%7.86687,031latoT
%5.32228,3%5.67134,21%5.91743,2%5.08486,9seitinamuH dna strA
Biological and Agricultural Sciences 7,221 85.4% 1,234 14.6% 8,564 83.7% 1,665 16.3%
%6.73864,01%4.26904,71%6.33450,31%4.66238,52ssenisuB
%1.55233,63%9.44406,92%9.35288,11%1.64271,01noitacudE
%1.91005,1%9.08653,6%5.12508,5%5.87522,12gnireenignE
%1.63491,21%9.36885,12%1.72134,2%9.27155,6secneicS htlaeH
Mathematics and Computer Sciences 9,169 73.6% 3,288 26.4% 3,835 72.8% 1,436 27.2%
%5.41406%5.58155,3%0.11407%0.98196,5secneicS htraE dna lacisyhP
%2.23076,5%8.76139,11%2.53159,1%8.46395,3secivreS dna noitartsinimdA cilbuP
%4.02965,4%6.97877,71%1.02037,2%9.97278,01secneicS laroivaheB dna laicoS
%4.44298,9%6.55773,21%3.63860,5%7.36678,8sdleiF rehtO
Notes: Because not all institutions responded to all items, details may not sum to totals. Percentages are based on total of known attendance status.
See Appendix B for the survey taxonomy.
Source: CGS/GRE Survey of Graduate Enrollment and Degrees
Part-Time
WomenMen
Part-Time emiT-lluFemiT-lluF
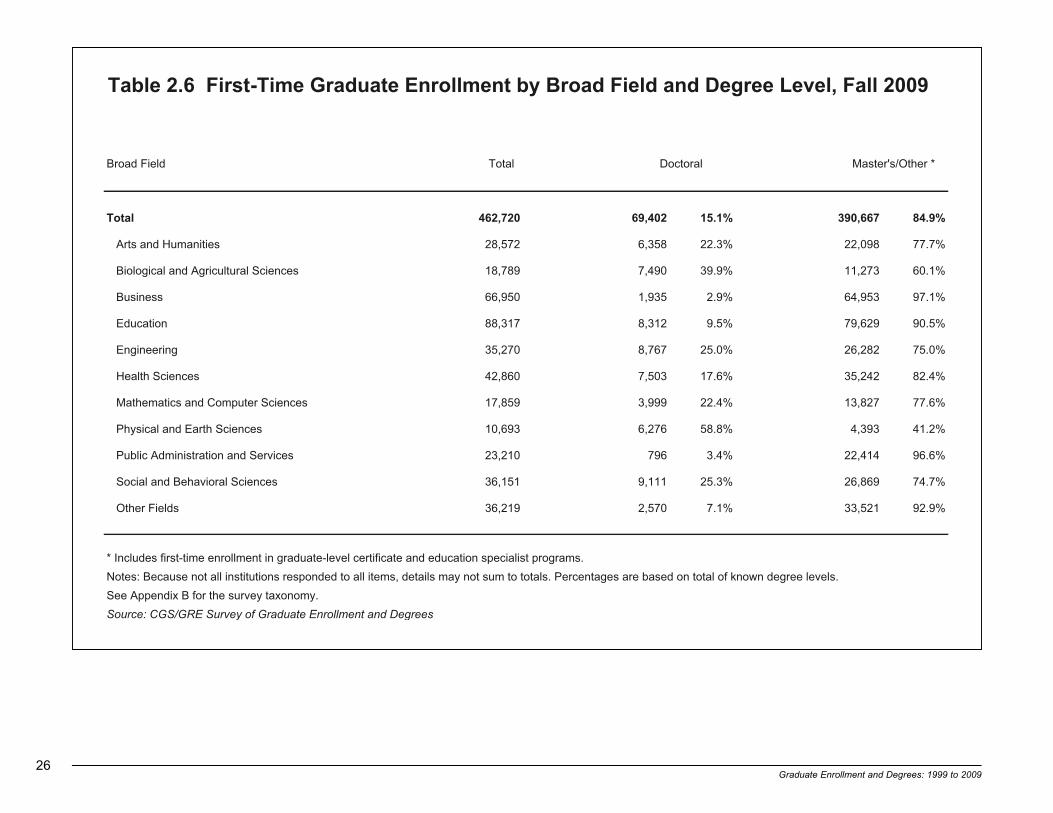
26Graduate Enrollment and Degrees: 1999 to 2009
Table 2.6 First-Time Graduate Enrollment by Broad Field and Degree Level, Fall 2009
latoTdleiF daorB
%9.48766,093%1.51204,96027,264latoT
%7.77890,22%3.22853,6275,82seitinamuH dna strA
%1.06372,11%9.93094,7987,81secneicS larutlucirgA dna lacigoloiB
%1.79359,46%9.2539,1059,66ssenisuB
%5.09926,97%5.9213,8713,88noitacudE
%0.57282,62%0.52767,8072,53gnireenignE
%4.28242,53%6.71305,7068,24secneicS htlaeH
%6.77728,31%4.22999,3958,71secneicS retupmoC dna scitamehtaM
%2.14393,4%8.85672,6396,01secneicS htraE dna lacisyhP
%6.69414,22%4.3697012,32secivreS dna noitartsinimdA cilbuP
%7.47968,62%3.52111,9151,63secneicS laroivaheB dna laicoS
%9.29125,33%1.7075,2912,63sdleiF rehtO
* Includes first-time enrollment in graduate-level certificate and education specialist programs.
Notes: Because not all institutions responded to all items, details may not sum to totals. Percentages are based on total of known degree levels.
See Appendix B for the survey taxonomy.
Source: CGS/GRE Survey of Graduate Enrollment and Degrees
Master's/Other *Doctoral

Graduate Enrollment and Degrees: 1999 to 2009 27
Table 2.7 First-Time Graduate Enrollment by Degree Level, Gender, and Broad Field, Fall 2009
Broad Field
%3.95425,132%7.04767,851%2.15354,53%8.84438,33latoT
%9.85169,21%1.14060,9%5.25043,3%5.74810,3seitinamuH dna strA
Biological and Agricultural Sciences 3,459 46.2% 4,029 53.8% 5,011 44.6% 6,230 55.4%
%7.14999,62%3.85767,73%9.34058%1.65580,1ssenisuB
%6.57480,06%4.42404,91%8.86417,5%2.13985,2noitacudE
%9.12757,5%1.87194,02%4.42041,2%6.57816,6gnireenignE
%5.08863,82%5.91058,6%0.27104,5%0.82201,2secneicS htlaeH
Mathematics and Computer Sciences 2,971 74.3% 1,028 25.7% 9,543 69.2% 4,257 30.8%
%1.54169,1%9.45383,2%6.53132,2%4.46340,4secneicS htraE dna lacisyhP
%4.67190,71%6.32672,5%8.46615%2.53082secivreS dna noitartsinimdA cilbuP
%4.36100,71%6.63528,9%5.85723,5%5.14487,3secneicS laroivaheB dna laicoS
%1.26918,02%9.73207,21%6.25843,1%4.74612,1sdleiF rehtO
* Includes first-time enrollment in graduate-level certificate and education specialist programs.
Notes: Because not all institutions responded to all items, details may not sum to totals. Percentages are based on total of known gender.
See Appendix B for the survey taxonomy.
Source: CGS/GRE Survey of Graduate Enrollment and Degrees
Women
Master's/Other *Doctoral
Women neMneM
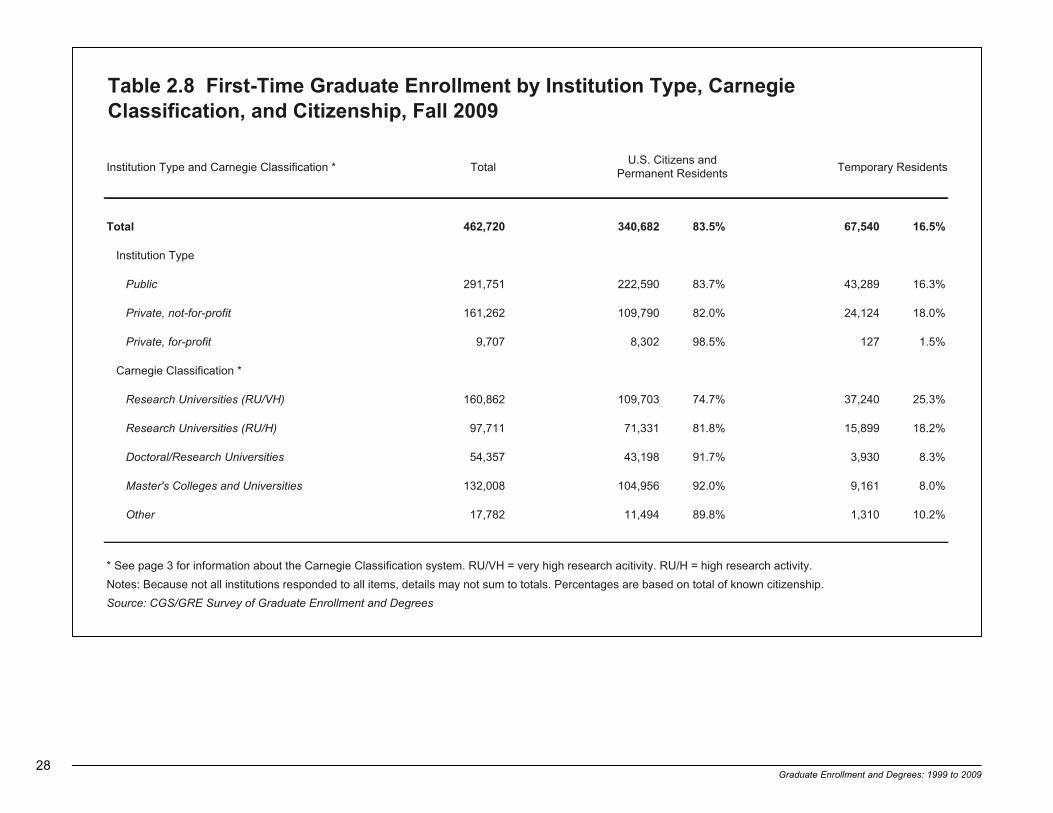
28Graduate Enrollment and Degrees: 1999 to 2009
Table 2.8 First-Time Graduate Enrollment by Institution Type, Carnegie Classification, and Citizenship, Fall 2009
Institution Type and Carnegie Classification * Total
%5.61045,76%5.38286,043027,264latoT
Institution Type
Public %3.61982,34%7.38095,222157,192
Private, not-for-profit %0.81421,42%0.28097,901262,161
Private, for-profit %5.1721%5.89203,8707,9
Carnegie Classification *
Research Universities (RU/VH) %3.52042,73%7.47307,901268,061
Research Universities (RU/H) %2.81998,51%8.18133,17117,79
Doctoral/Research Universities %3.8039,3%7.19891,34753,45
Master's Colleges and Universities %0.8161,9%0.29659,401800,231
Other %2.01013,1%8.98494,11287,71
* See page 3 for information about the Carnegie Classification system. RU/VH = very high research acitivity. RU/H = high research activity.
Notes: Because not all institutions responded to all items, details may not sum to totals. Percentages are based on total of known citizenship.
Source: CGS/GRE Survey of Graduate Enrollment and Degrees
Temporary ResidentsU.S. Citizens and
Permanent Residents
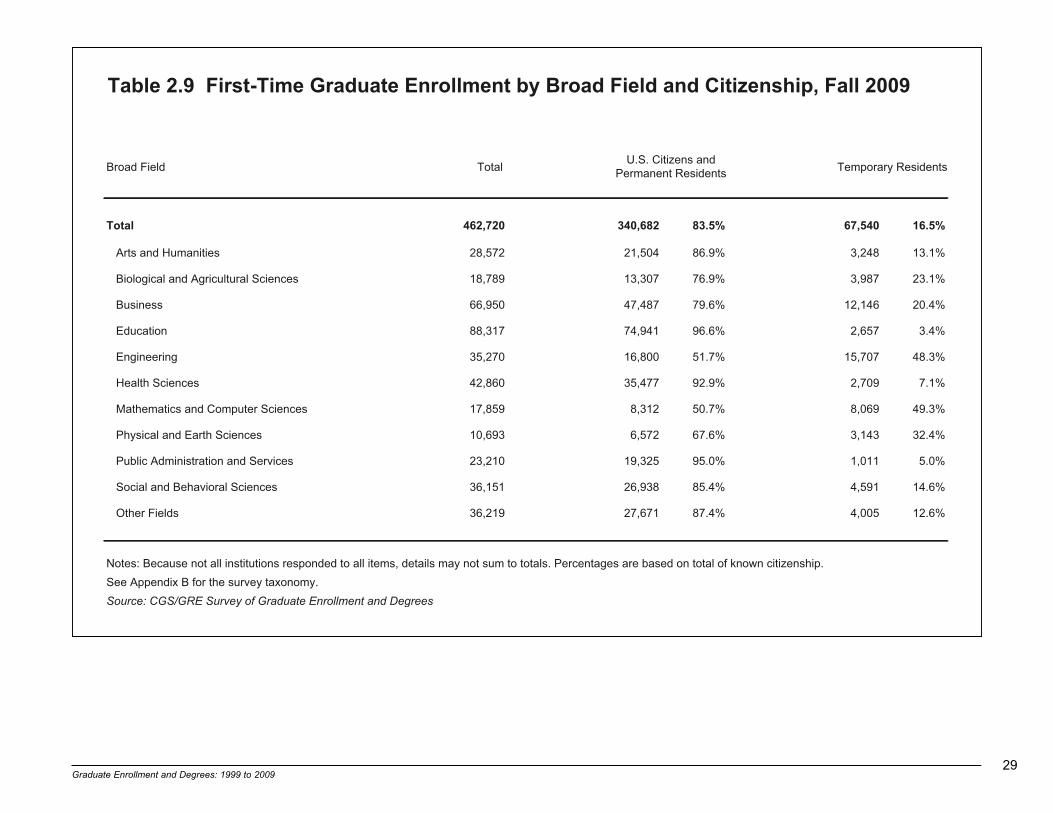
Graduate Enrollment and Degrees: 1999 to 2009 29
Table 2.9 First-Time Graduate Enrollment by Broad Field and Citizenship, Fall 2009
latoTdleiF daorB
%5.61045,76%5.38286,043027,264latoT
%1.31842,3%9.68405,12275,82seitinamuH dna strA
%1.32789,3%9.67703,31987,81secneicS larutlucirgA dna lacigoloiB
%4.02641,21%6.97784,74059,66ssenisuB
%4.3756,2%6.69149,47713,88noitacudE
%3.84707,51%7.15008,61072,53gnireenignE
%1.7907,2%9.29774,53068,24secneicS htlaeH
%3.94960,8%7.05213,8958,71secneicS retupmoC dna scitamehtaM
%4.23341,3%6.76275,6396,01secneicS htraE dna lacisyhP
%0.5110,1%0.59523,91012,32secivreS dna noitartsinimdA cilbuP
%6.41195,4%4.58839,62151,63secneicS laroivaheB dna laicoS
%6.21500,4%4.78176,72912,63sdleiF rehtO
Notes: Because not all institutions responded to all items, details may not sum to totals. Percentages are based on total of known citizenship.
See Appendix B for the survey taxonomy.
Source: CGS/GRE Survey of Graduate Enrollment and Degrees
Temporary ResidentsU.S. Citizens and
Permanent Residents

30Graduate Enrollment and Degrees: 1999 to 2009
Table 2.10 First-Time Graduate Enrollment by Citizenship, Race/Ethnicity, and Gender, Fall 2009
latoTyticinhtE/ecaR dna pihsnezitiC
%1.85917,862%9.14015,391027,264latoT
%4.16538,802%6.83080,131286,043stnediseR tnenamreP dna snezitiC .S.U
American Indian/Alaskan Native %7.36625,1%3.63178204,2
Asian/Pacific Islander %2.45981,31%8.54441,11163,42
Black/African American %8.07993,92%2.92690,21915,14
Hispanic/Latino %1.46978,91%9.53911,11210,13
White %2.06248,441%8.93058,59883,142
%1.24334,82%9.75660,93045,76stnediseR yraropmeT
%2.95290,72%8.04276,81887,54nwonknU/rehtO
Notes: Because not all institutions responded to all items, details may not sum to totals. Percentages are based on total of known gender within each citizenship
and race/ethnicity category. See page 2 for a description of each citizenship and race/ethnicity category. See Appendix B for the survey taxonomy.
Source: CGS/GRE Survey of Graduate Enrollment and Degrees
WomenMen

Graduate Enrollment and Degrees: 1999 to 2009 31
Table 2.11 First-Time Graduate Enrollment by Broad Field and Race/Ethnicity, Fall 2009 (U.S. Citizens and Permanent Residents Only)
Broad Field
%9.07883,142%1.9210,13%2.21915,14%2.7163,42%7.0204,2latoT
%8.97451,71%5.9350,2%4.5351,1%6.4389%7.0161seitinamuH & strA
Biological & Agricultural Sciences 82 0.6% 1,553 11.7% 857 6.4% 888 6.7% 9,927 74.6%
%8.76991,23%0.9962,4%0.21517,5%6.01040,5%6.0462ssenisuB
%3.27781,45%2.01576,7%3.31789,9%5.3216,2%6.0084noitacudE
%2.96026,11%8.7403,1%3.6160,1%3.61837,2%5.077gnireenignE
%5.37670,62%4.6082,2%2.11979,3%2.8129,2%6.0122secneicS htlaeH
Mathematics and Computer Sciences 44 0.5% 1,237 14.9% 767 9.2% 749 9.0% 5,515 66.3%
%7.08503,5%9.6554%0.4662%7.7505%6.014secneicS htraE dna lacisyhP
Public Administration & Services 200 1.0% 899 4.7% 3,632 18.8% 2,195 11.4% 12,399 64.2%
%5.86244,81%8.11971,3%4.21543,3%4.6727,1%9.0542secneicS laroivaheB & laicoS
%9.37154,02%3.8503,2%7.11622,3%4.5984,1%7.0002sdleiF rehtO
Notes: This table only includes U.S. citizens and permanent residents. See Table 2.9 for first-time enrollment by broad field for temporary residents.
Because not all institutions responded to all items, details may not sum to totals. Percentages are based on total of known race/ethnicity.
See page 2 for a description of each race/ethnicity category. See Appendix B for the survey taxonomy.
Source: CGS/GRE Survey of Graduate Enrollment and Degrees
WhiteHispanic/LatinoAmerican Indian/ Alaskan Native
Asian/Pacific Islander
Black/African American
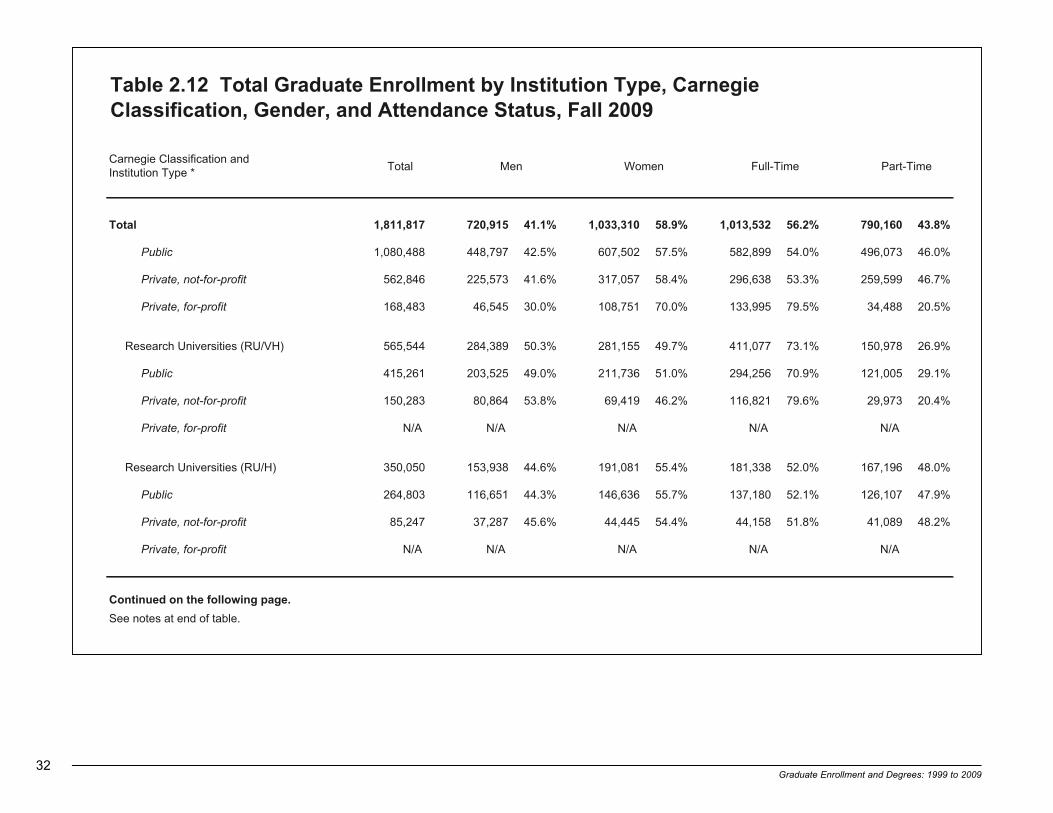
32Graduate Enrollment and Degrees: 1999 to 2009
Table 2.12 Total Graduate Enrollment by Institution Type, CarnegieClassification, Gender, and Attendance Status, Fall 2009
Total
%8.34061,097%2.65235,310,1%9.85013,330,1%1.14519,027718,118,1latoT
Public 1,080,488 448,797 42.5% 607,502 57.5% 582,899 54.0% 496,073 46.0%
Private, not-for-profit 562,846 225,573 41.6% 317,057 58.4% 296,638 53.3% 259,599 46.7%
Private, for-profit 168,483 46,545 30.0% 108,751 70.0% 133,995 79.5% 34,488 20.5%
Research Universities (RU/VH) 565,544 284,389 50.3% 281,155 49.7% 411,077 73.1% 150,978 26.9%
Public 415,261 203,525 49.0% 211,736 51.0% 294,256 70.9% 121,005 29.1%
Private, not-for-profit 150,283 80,864 53.8% 69,419 46.2% 116,821 79.6% 29,973 20.4%
Private, for-profit N/A N/A N/A N/A N/A
Research Universities (RU/H) 350,050 153,938 44.6% 191,081 55.4% 181,338 52.0% 167,196 48.0%
Public 264,803 116,651 44.3% 146,636 55.7% 137,180 52.1% 126,107 47.9%
Private, not-for-profit 85,247 37,287 45.6% 44,445 54.4% 44,158 51.8% 41,089 48.2%
Private, for-profit N/A N/A N/A N/A N/A
Continued on the following page.
See notes at end of table.
Part-TimeWomen emiT-lluFneM Carnegie Classification andInstitution Type *
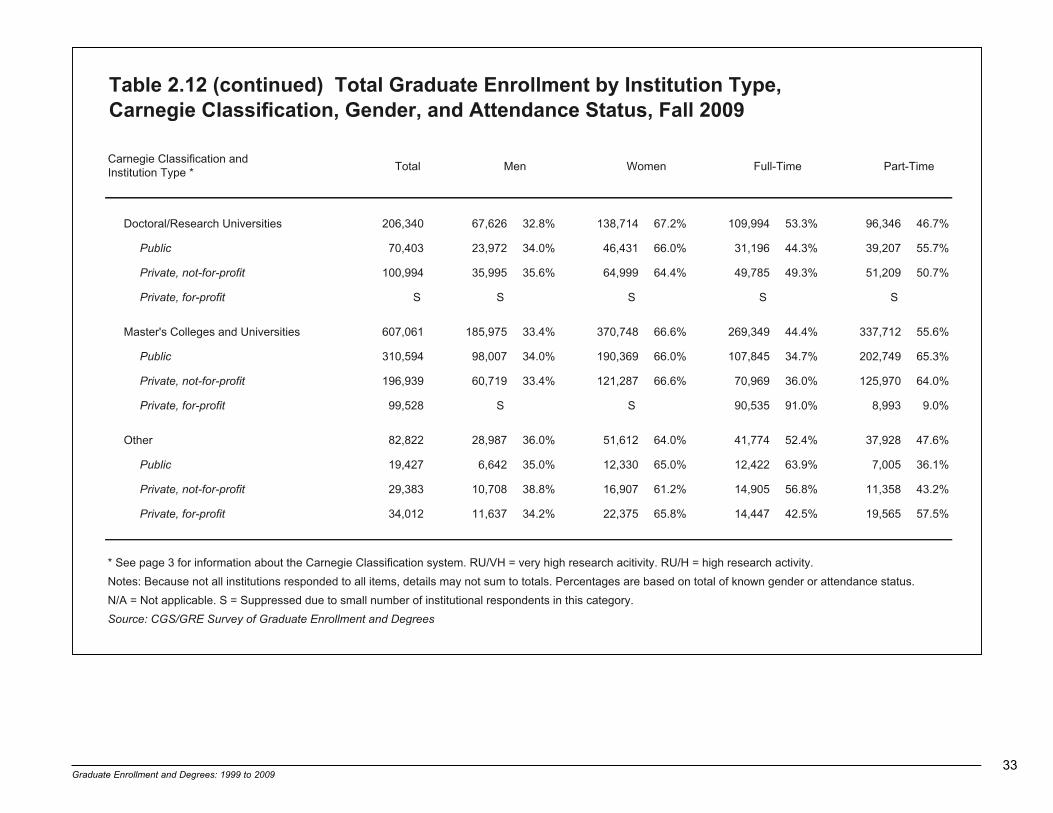
Graduate Enrollment and Degrees: 1999 to 2009 33
Table 2.12 (continued) Total Graduate Enrollment by Institution Type, Carnegie Classification, Gender, and Attendance Status, Fall 2009
Total
Doctoral/Research Universities 206,340 67,626 32.8% 138,714 67.2% 109,994 53.3% 96,346 46.7%
Public 70,403 23,972 34.0% 46,431 66.0% 31,196 44.3% 39,207 55.7%
Private, not-for-profit 100,994 35,995 35.6% 64,999 64.4% 49,785 49.3% 51,209 50.7%
Private, for-profit S S S S S
Master's Colleges and Universities 607,061 185,975 33.4% 370,748 66.6% 269,349 44.4% 337,712 55.6%
Public 310,594 98,007 34.0% 190,369 66.0% 107,845 34.7% 202,749 65.3%
Private, not-for-profit 196,939 60,719 33.4% 121,287 66.6% 70,969 36.0% 125,970 64.0%
Private, for-profit %0.9399,8%0.19535,09 S S825,99
%6.74829,73%4.25477,14%0.46216,15%0.63789,82228,28rehtO
Public 19,427 6,642 35.0% 12,330 65.0% 12,422 63.9% 7,005 36.1%
Private, not-for-profit 29,383 10,708 38.8% 16,907 61.2% 14,905 56.8% 11,358 43.2%
Private, for-profit 34,012 11,637 34.2% 22,375 65.8% 14,447 42.5% 19,565 57.5%
* See page 3 for information about the Carnegie Classification system. RU/VH = very high research acitivity. RU/H = high research activity.
Notes: Because not all institutions responded to all items, details may not sum to totals. Percentages are based on total of known gender or attendance status.
N/A = Not applicable. S = Suppressed due to small number of institutional respondents in this category.
Source: CGS/GRE Survey of Graduate Enrollment and Degrees
Part-TimeWomen emiT-lluFneM Carnegie Classification andInstitution Type *

34Graduate Enrollment and Degrees: 1999 to 2009
Table 2.13 Total Graduate Enrollment by Broad Field, Gender, and Attendance Status, Fall 2009
latoTdleiF daorB
%8.34061,097%2.65235,310,1%9.85013,330,1%1.14519,027718,118,1latoT
%9.13194,43%1.86005,37%3.75573,26%7.24664,64980,901seitinamuH dna strA
Biological and Agricultural Sciences 79,185 36,526 46.2% 42,572 53.8% 61,505 78.1% 17,247 21.9%
%8.34653,911%2.65650,351%7.54171,421%3.45803,741739,272ssenisuB
%2.95376,712%8.04590,051%9.47420,672%1.52263,29186,863noitacudE
%9.03686,83%1.96035,68%3.22901,82%7.77931,89734,621gnireenignE
%6.73805,95%4.26828,89%1.97812,521%9.02200,33875,851secneicS htlaeH
Mathematics and Computer Sciences 65,197 46,276 71.1% 18,770 28.9% 40,824 63.0% 23,972 37.0%
%5.81900,9%5.18385,93%3.73223,81%7.26397,03571,94secneicS htraE dna lacisyhP
Public Administration and Services 66,254 16,943 25.6% 49,287 74.4% 38,504 58.4% 27,434 41.6%
Social and Behavioral Sciences 143,225 51,295 35.9% 91,782 64.1% 100,393 70.4% 42,123 29.6%
%5.05403,65%5.94991,55%4.16973,86%6.83849,24705,111sdleiF rehtO
Notes: Because not all institutions responded to all items, details may not sum to totals. Percentages are based on total of known gender or attendance status.
See Appendix B for the survey taxonomy.
Source: CGS/GRE Survey of Graduate Enrollment and Degrees
Part-TimeFull-TimeWomenMen
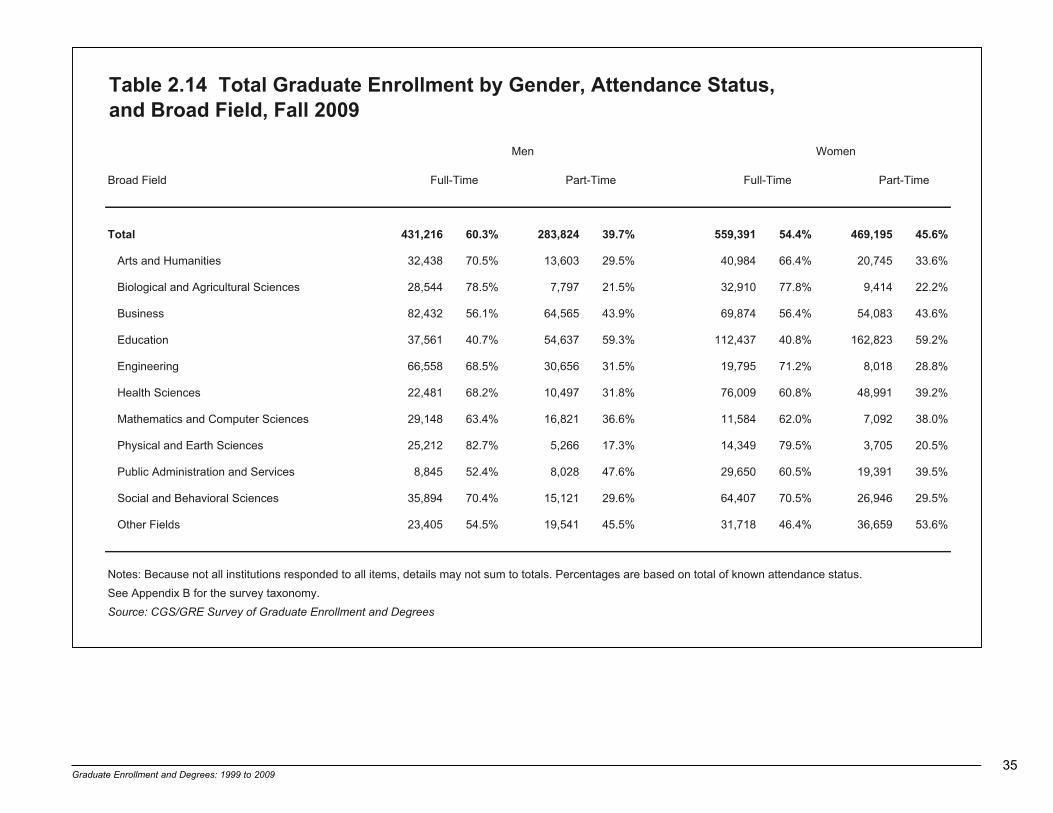
Graduate Enrollment and Degrees: 1999 to 2009 35
Table 2.14 Total Graduate Enrollment by Gender, Attendance Status,and Broad Field, Fall 2009
Broad Field
%6.54591,964%4.45193,955%7.93428,382%3.06612,134latoT
%6.33547,02%4.66489,04%5.92306,31%5.07834,23seitinamuH dna strA
Biological and Agricultural Sciences 28,544 78.5% 7,797 21.5% 32,910 77.8% 9,414 22.2%
%6.34380,45%4.65478,96%9.34565,46%1.65234,28ssenisuB
%2.95328,261%8.04734,211%3.95736,45%7.04165,73noitacudE
%8.82810,8%2.17597,91%5.13656,03%5.86855,66gnireenignE
%2.93199,84%8.06900,67%8.13794,01%2.86184,22secneicS htlaeH
Mathematics and Computer Sciences 29,148 63.4% 16,821 36.6% 11,584 62.0% 7,092 38.0%
%5.02507,3%5.97943,41%3.71662,5%7.28212,52secneicS htraE dna lacisyhP
%5.93193,91%5.06056,92%6.74820,8%4.25548,8secivreS dna noitartsinimdA cilbuP
%5.92649,62%5.07704,46%6.92121,51%4.07498,53secneicS laroivaheB dna laicoS
%6.35956,63%4.64817,13%5.54145,91%5.45504,32sdleiF rehtO
Notes: Because not all institutions responded to all items, details may not sum to totals. Percentages are based on total of known attendance status.
See Appendix B for the survey taxonomy.
Source: CGS/GRE Survey of Graduate Enrollment and Degrees
Part-Time
WomenMen
Part-Time emiT-lluFemiT-lluF

36Graduate Enrollment and Degrees: 1999 to 2009
Table 2.15 Total Graduate Enrollment by Broad Field and Degree Level, Fall 2009
latoTdleiF daorB
%7.57254,523,1%3.42475,424718,118,1latoT
%4.06364,56%6.93478,24980,901seitinamuH dna strA
%6.04370,23%4.95739,64581,97secneicS larutlucirgA dna lacigoloiB
%6.49518,752%4.5828,41739,272ssenisuB
%3.38173,503%7.61781,16186,863noitacudE
%0.06604,57%0.04413,05734,621gnireenignE
%7.77758,221%3.22892,53875,851secneicS htlaeH
%0.66218,24%0.43350,22791,56secneicS retupmoC dna scitamehtaM
%9.82761,41%1.17919,43571,94secneicS htraE dna lacisyhP
%4.29180,16%6.7850,5452,66secivreS dna noitartsinimdA cilbuP
%3.06799,58%7.93335,65522,341secneicS laroivaheB dna laicoS
%3.58392,49%7.41013,61705,111sdleiF rehtO
* Includes total enrollment in graduate-level certificate and education specialist programs.
Notes: Because not all institutions responded to all items, details may not sum to totals. Percentages are based on total of known degree levels.
See Appendix B for the survey taxonomy.
Source: CGS/GRE Survey of Graduate Enrollment and Degrees
Master's/Other *Doctoral

Graduate Enrollment and Degrees: 1999 to 2009 37
Table 2.16 Total Graduate Enrollment by Degree Level, Gender, andBroad Field, Fall 2009
Broad Field
%3.16510,118%7.83206,215%4.15420,812%6.84779,502latoT
%7.95930,93%3.04793,62%5.35259,22%5.64229,91seitinamuH dna strA
Biological and Agricultural Sciences 22,343 47.6% 24,594 52.4% 14,151 44.1% 17,922 55.9%
%8.54374,711%2.45732,931%1.54876,6%9.45511,8ssenisuB
%2.67026,232%8.32137,27%6.86489,14%4.13971,91noitacudE
%7.12363,61%3.87340,95%2.32486,11%8.67036,83gnireenignE
%6.18672,001%4.81185,22%7.07359,42%3.92543,01secneicS htlaeH
Mathematics and Computer Sciences 16,489 74.8% 5,564 25.2% 29,661 69.4% 13,080 30.6%
%3.44472,6%7.55398,7%5.43730,21%5.56288,22secneicS htraE dna lacisyhP
%5.57680,64%5.42599,41%1.26241,3%9.73619,1secivreS dna noitartsinimdA cilbuP
%6.66103,75%4.33696,82%3.06790,43%7.93634,22secneicS laroivaheB dna laicoS
%2.36185,95%8.63846,43%2.05381,8%8.94721,8sdleiF rehtO
* Includes total enrollment in graduate-level certificate and education specialist programs.
Notes: Because not all institutions responded to all items, details may not sum to totals. Percentages are based on total of known gender.
See Appendix B for the survey taxonomy.
Source: CGS/GRE Survey of Graduate Enrollment and Degrees
Women
Master's/Other *Doctoral
Women neMneM

38Graduate Enrollment and Degrees: 1999 to 2009
Table 2.17 Total Graduate Enrollment by Institution Type, Carnegie Classification, and Citizenship, Fall 2009
Institution Type and Carnegie Classification * Total
%5.51160,242%5.48500,323,1718,118,1latoT
Institution Type
Public 1,080,488 817,376 83.6% 160,431 16.4%
Private, not-for-profit %4.61509,57%6.38580,883648,265
Private, for-profit %6.4527,5%4.59445,711384,861
Carnegie Classification *
Research Universities (RU/VH) 565,544 386,660 74.5% 132,121 25.5%
Research Universities (RU/H) %8.71308,55%2.28218,752050,053
Doctoral/Research Universities %0.8496,41%0.29448,761043,602
Master's Colleges and Universities %1.7810,43%9.29306,744160,706
Other %9.7524,5%1.29680,36228,28
* See page 3 for information about the Carnegie Classification system. RU/VH = very high research acitivity. RU/H = high research activity.
Notes: Because not all institutions responded to all items, details may not sum to totals. Percentages are based on total of known citizenship.
Source: CGS/GRE Survey of Graduate Enrollment and Degrees
Temporary ResidentsU.S. Citizens and
Permanent Residents

Graduate Enrollment and Degrees: 1999 to 2009 39
Table 2.18 Total Graduate Enrollment by Broad Field and Citizenship, Fall 2009
latoTdleiF daorB
%5.51160,242%5.48500,323,1718,118,1latoT
%7.31180,31%3.68144,28980,901seitinamuH dna strA
%6.52918,81%4.47236,45581,97secneicS larutlucirgA dna lacigoloiB
%3.51598,53%7.48698,891739,272ssenisuB
%2.3625,01%8.69106,713186,863noitacudE
%5.84507,65%5.15512,06734,621gnireenignE
%4.7584,01%6.29759,031875,851secneicS htlaeH
%9.54674,72%1.45314,23791,56secneicS retupmoC dna scitamehtaM
%7.43327,51%3.56985,92571,94secneicS htraE dna lacisyhP
%9.4538,2%1.59693,55452,66secivreS dna noitartsinimdA cilbuP
%8.31392,71%2.68973,801522,341secneicS laroivaheB dna laicoS
%1.11249,01%9.88874,78705,111sdleiF rehtO
Notes: Because not all institutions responded to all items, details may not sum to totals. Percentages are based on total of known citizenship.
See Appendix B for the survey taxonomy.
Source: CGS/GRE Survey of Graduate Enrollment and Degrees
Temporary ResidentsU.S. Citizens and
Permanent Residents

40Graduate Enrollment and Degrees: 1999 to 2009
Table 2.19 Total Graduate Enrollment by Citizenship, Race/Ethnicity, and Gender, Fall 2009
latoTyticinhtE/ecaR dna pihsnezitiC
%9.85013,330,1%1.14519,027718,118,1latoT
%1.26962,518%9.73696,794500,323,1stnediseR tnenamreP dna snezitiC .S.U
American Indian/Alaskan Native %4.46944,6%6.53665,3070,01
Asian/Pacific Islander %0.55005,74%0.54539,83547,68
Black/African American %1.27578,821%9.72098,94103,971
Hispanic/Latino %8.36464,07%2.63230,04077,011
White 936,119 365,273 39.4% 561,981 60.6%
%1.14240,99%9.85898,141160,242stnediseR yraropmeT
%8.95845,301%2.04926,96822,471nwonknU/rehtO
Notes: Because not all institutions responded to all items, details may not sum to totals. Percentages are based on total of known gender within each citizenship and
race/ethnicity category. See page 2 for a description of each citizenship and race/ethnicity category. See Appendix B for the survey taxonomy.
Source: CGS/GRE Survey of Graduate Enrollment and Degrees
WomenMen

Graduate Enrollment and Degrees: 1999 to 2009 41
Table 2.20 Total Graduate Enrollment by Broad Field and Race/Ethnicity, Fall 2009 (U.S. Citizens and Permanent Residents Only)
Broad Field
%8.07911,639%4.8077,011%6.31103,971%6.6547,68%8.0070,01latoT
%4.08952,66%9.8533,7%3.5153,4%7.4558,3%8.0146seitinamuH & strA
Biological & Agricultural Sciences 427 0.8% 5,624 10.3% 3,183 5.8% 3,659 6.7% 41,739 76.4%
%2.36457,521%5.8379,61%2.81671,63%4.9507,81%6.0882,1ssenisuB
%8.27801,132%1.9949,82%2.41751,54%1.3789,9%8.0004,2noitacudE
%6.07505,24%6.7355,4%3.6877,3%1.51490,9%5.0582gnireenignE
%1.47799,69%1.6210,8%5.11890,51%6.7859,9%7.0298secneicS htlaeH
Mathematics and Computer Sciences 156 0.5% 4,704 14.5% 2,917 9.0% 2,256 7.0% 22,380 69.0%
%7.18081,42%2.6028,1%9.3141,1%6.7852,2%6.0091secneicS htraE dna lacisyhP
Public Administration & Services 619 1.1% 2,380 4.3% 11,260 20.3% 5,837 10.5% 35,300 63.7%
Social & Behavioral Sciences 1,107 1.0% 6,323 5.8% 15,534 14.3% 10,945 10.1% 74,470 68.7%
%5.57040,66%8.7718,6%8.01134,9%1.5674,4%8.0417sdleiF rehtO
Notes: This table only includes U.S. citizens and permanent residents. See Table 2.18 for total enrollment by broad field for temporary residents.
Because not all institutions responded to all items, details may not sum to totals. Percentages are based on total of known race/ethnicity.
See page 2 for a description of each race/ethnicity category. See Appendix B for the survey taxonomy.
Source: CGS/GRE Survey of Graduate Enrollment and Degrees
WhiteHispanic/LatinoAmerican Indian/ Alaskan Native
Asian/Pacific Islander
Black/African American

42Graduate Enrollment and Degrees: 1999 to 2009
Table 2.21 Graduate Degrees and Certificates Awarded by Degree Level, Carnegie Classification, and Institution Type, 2008-09
%0.001391,72%0.001317,205%0.001995,75latoT
Public 37,980 65.9% 284,899 56.7% 11,817 43.5%
Private, not-for-profit 18,028 31.3% 174,081 34.6% 14,375 52.9%
Private, for-profit 1,591 2.8% 43,733 8.7% 1,001 3.7%
%8.61275,4%8.82069,441%8.16585,53)HV/UR( seitisrevinU hcraeseR
Public 25,781 72.4% 102,206 70.5% 2,830 61.9%
Private, not-for-profit 9,804 27.6% 42,754 29.5% 1,742 38.1%
Private, for-profit A/N A/N A/N
%3.12387,5%8.81726,49%8.91114,11)H/UR( seitisrevinU hcraeseR
Public 8,484 74.3% 68,071 71.9% 3,311 57.3%
Private, not-for-profit 2,927 25.7% 26,556 28.1% 2,472 42.7%
Private, for-profit A/N A/N A/N
Continued on the following page.
See notes at end of table.
Master's Degrees setacifitreCseergeD larotcoD Carnegie Classification andInstitution Type *
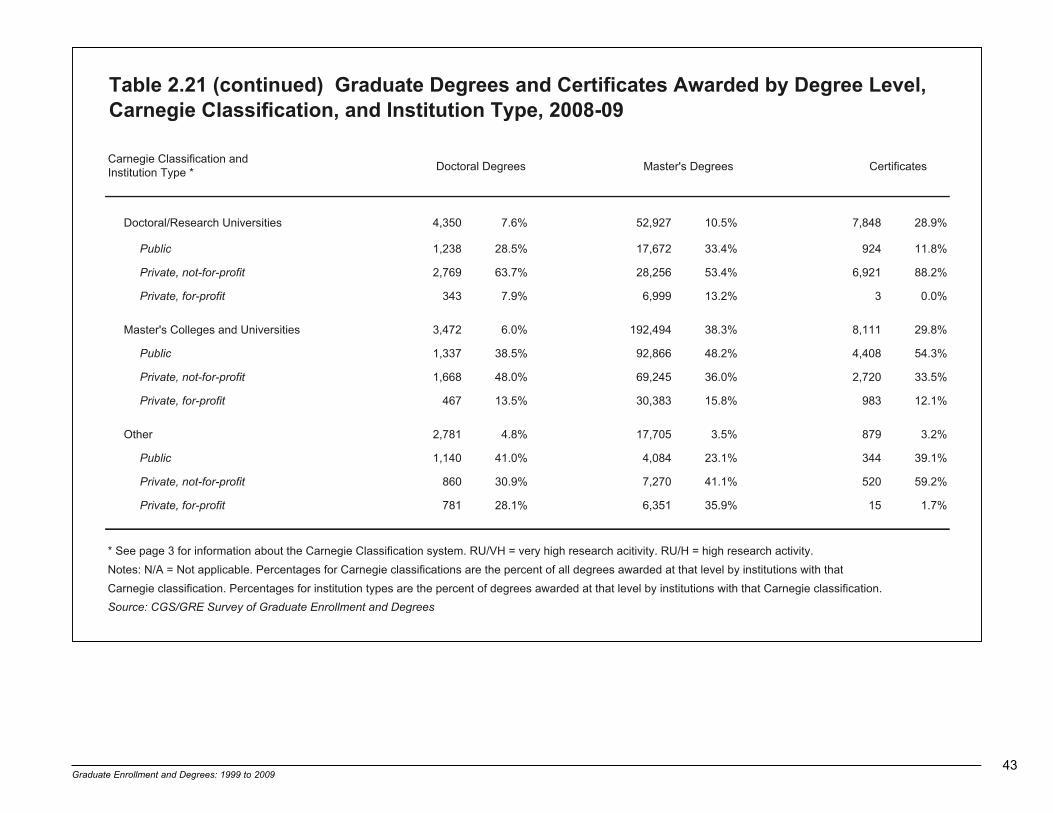
Graduate Enrollment and Degrees: 1999 to 2009 43
Table 2.21 (continued) Graduate Degrees and Certificates Awarded by Degree Level, Carnegie Classification, and Institution Type, 2008-09
%9.82848,7%5.01729,25%6.7053,4seitisrevinU hcraeseR/larotcoD
Public %8.11429%4.33276,71%5.82832,1
Private, not-for-profit 2,769 63.7% 28,256 53.4% 6,921 88.2%
Private, for-profit %0.03%2.31999,6%9.7343
%8.92111,8%3.83494,291%0.6274,3seitisrevinU dna segelloC s'retsaM
Public 1,337 38.5% 92,866 48.2% 4,408 54.3%
Private, not-for-profit 1,668 48.0% 69,245 36.0% 2,720 33.5%
Private, for-profit %1.21389%8.51383,03%5.31764
%2.3978%5.3507,71%8.4187,2rehtO
Public %1.93443%1.32480,4%0.14041,1
Private, not-for-profit %2.95025%1.14072,7%9.03068
Private, for-profit %7.151%9.53153,6%1.82187
* See page 3 for information about the Carnegie Classification system. RU/VH = very high research acitivity. RU/H = high research activity.
Notes: N/A = Not applicable. Percentages for Carnegie classifications are the percent of all degrees awarded at that level by institutions with that
Carnegie classification. Percentages for institution types are the percent of degrees awarded at that level by institutions with that Carnegie classification.
Source: CGS/GRE Survey of Graduate Enrollment and Degrees
setacifitreCseergeD s'retsaMseergeD larotcoD Carnegie Classification andInstitution Type *

44Graduate Enrollment and Degrees: 1999 to 2009
Table 2.22 Graduate Degrees and Certificates Awarded by Degree Level and Broad Field, 2008-09
Broad Field
%0.001391,72%0.001317,205%0.001995,75latoT
%8.3446%6.5640,42%5.9650,5seitinamuH dna strA
%4.2104%7.2895,11%6.31022,7secneicS larutlucirgA dna lacigoloiB
%6.01787,1%1.42809,301%0.3375,1ssenisuB
%6.64948,7%2.72110,711%4.41816,7noitacudE
%3.5698%2.7699,03%0.41924,7gnireenignE
%9.9176,1%6.8381,73%0.31709,6secneicS htlaeH
%6.3306%1.4646,71%2.5647,2secneicS retupmoC dna scitamehtaM
%8.0531%4.1431,6%1.9628,4secneicS htraE dna lacisyhP
%3.3465%3.5968,22%9.0105secivreS dna noitartsinimdA cilbuP
%1.7691,1%1.7987,03%5.31561,7secneicS laroivaheB dna laicoS
%6.6601,1%6.6236,82%6.3339,1sdleiF rehtO
Notes: Because not all institutions responded to all items, details may not sum to totals. Percentages are based on total of known broad fields.
See Appendix B for the survey taxonomy.
Source: CGS/GRE Survey of Graduate Enrollment and Degrees
CertificatesMaster's DegreesDoctoral Degrees

Graduate Enrollment and Degrees: 1999 to 2009 45
Table 2.23 Graduate Certificates Awarded by Broad Field and Gender, 2008-09
latoTdleiF daorB
%3.76271,81%7.23138,8391,72latoT
%8.06183%2.93642446seitinamuH dna strA
%6.55322%4.44871104secneicS larutlucirgA dna lacigoloiB
%2.55788%8.44027787,1ssenisuB
%0.37366,5%0.72490,2948,7noitacudE
%7.12781%3.87476698gnireenignE
%0.77782,1%0.32483176,1secneicS htlaeH
%7.43902%3.56493306secneicS retupmoC dna scitamehtaM
%3.9335%7.0628531secneicS htraE dna lacisyhP
%8.17504%2.82951465secivreS dna noitartsinimdA cilbuP
%0.16037%0.93664691,1secneicS laroivaheB dna laicoS
%1.16676%9.83034601,1sdleiF rehtO
Notes: Because not all institutions responded to all items, details may not sum to totals. Percentages are based on total of known gender.
See Appendix B for the survey taxonomy.
Source: CGS/GRE Survey of Graduate Enrollment and Degrees
WomenMen

46Graduate Enrollment and Degrees: 1999 to 2009
Table 2.24 Master's Degrees Awarded by Broad Field and Gender, 2008-09
latoTdleiF daorB
%4.06259,003%6.93375,791317,205latoT
%2.95032,41%8.04118,9640,42seitinamuH dna strA
%4.65835,6%6.34450,5895,11secneicS larutlucirgA dna lacigoloiB
%9.24890,44%1.75297,85809,301ssenisuB
%6.67275,98%4.32003,72110,711noitacudE
%9.22760,7%1.77918,32699,03gnireenignE
%3.18622,03%7.81759,6381,73secneicS htlaeH
%9.03424,5%1.96301,21646,71secneicS retupmoC dna scitamehtaM
%2.24975,2%8.75725,3431,6secneicS htraE dna lacisyhP
%8.57931,71%2.42954,5968,22secivreS dna noitartsinimdA cilbuP
%6.36645,91%4.63871,11987,03secneicS laroivaheB dna laicoS
%0.36200,81%0.73055,01236,82sdleiF rehtO
Notes: Because not all institutions responded to all items, details may not sum to totals. Percentages are based on total of known gender.
See Appendix B for the survey taxonomy.
Source: CGS/GRE Survey of Graduate Enrollment and Degrees
WomenMen
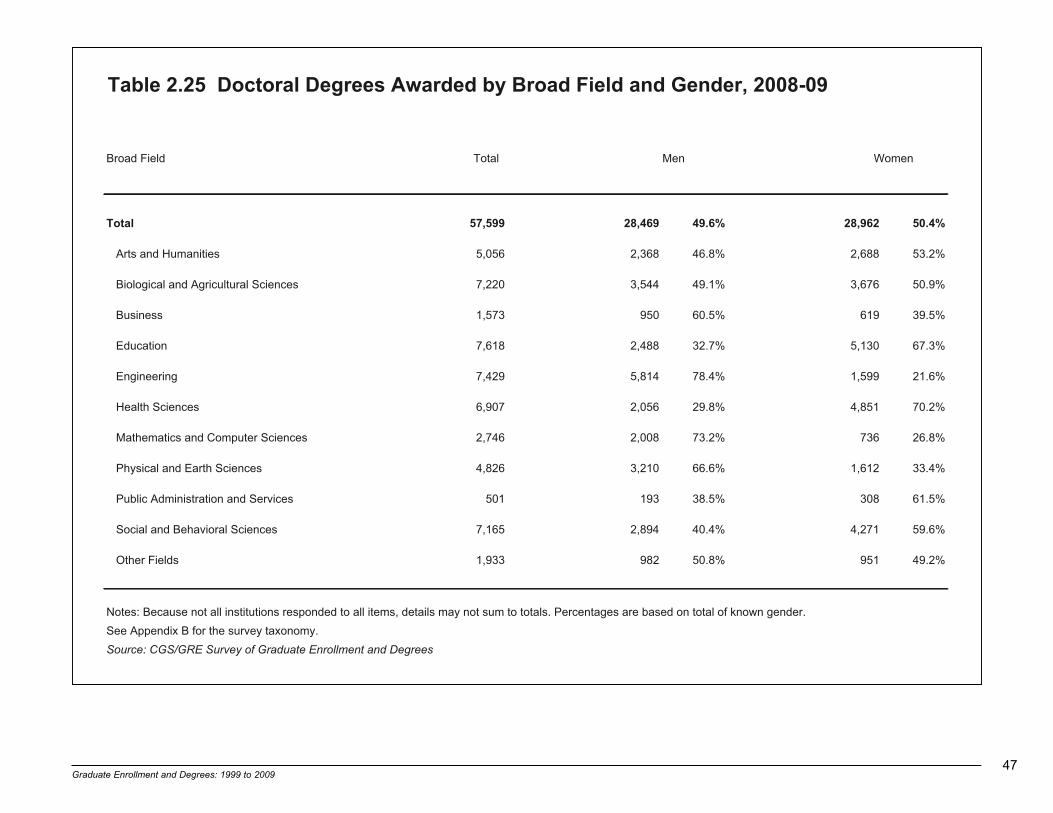
Graduate Enrollment and Degrees: 1999 to 2009 47
Table 2.25 Doctoral Degrees Awarded by Broad Field and Gender, 2008-09
latoTdleiF daorB
%4.05269,82%6.94964,82995,75latoT
%2.35886,2%8.64863,2650,5seitinamuH dna strA
%9.05676,3%1.94445,3022,7secneicS larutlucirgA dna lacigoloiB
%5.93916%5.06059375,1ssenisuB
%3.76031,5%7.23884,2816,7noitacudE
%6.12995,1%4.87418,5924,7gnireenignE
%2.07158,4%8.92650,2709,6secneicS htlaeH
%8.62637%2.37800,2647,2secneicS retupmoC dna scitamehtaM
%4.33216,1%6.66012,3628,4secneicS htraE dna lacisyhP
%5.16803%5.83391105secivreS dna noitartsinimdA cilbuP
%6.95172,4%4.04498,2561,7secneicS laroivaheB dna laicoS
%2.94159%8.05289339,1sdleiF rehtO
Notes: Because not all institutions responded to all items, details may not sum to totals. Percentages are based on total of known gender.
See Appendix B for the survey taxonomy.
Source: CGS/GRE Survey of Graduate Enrollment and Degrees
WomenMen


Graduate Enrollment and Degrees: 1999 to 2009 49
Chapter 3Trends in Graduate Applications, First-Time Enrollment, Total Enrollment, and Degrees Conferred, 1999 to 2009
This chapter presents data and analysis on trends in graduate applications,first-time enrollment, total enrollment, and degrees conferred over the pastone, five, and ten years. The one-year trends are based on data collectedfor 2008 and 2009; the five-year trends compare data collected for 2004 and2009; and the ten-year trends are based on data collected for 1999 and2009. The trend data from these three time periods are designed to providea more detailed comparison of the recent and longer-term trends in gradu-ate education.
Since the institutions responding to the survey differ slightly from year toyear, the trend data are limited to institutions that responded to theCGS/GRE Survey of Graduate Enrollment and Degrees in both of the yearsbeing compared. The one-year trends include data from 671 colleges anduniversities that responded to the CGS/GRE Survey of GraduateEnrollment and Degrees in both 2008 and 2009, the five-year trends includedata from 540 institutions that responded to the survey in both 2004 and2009, and the ten-year trends include data from 531 institutions thatresponded in both 1999 and 2009. Restricting the analyses to the sameinstitutions in both years being examined ensures that the trends being pre-sented are accurate and not a reflection of differing survey respondents. Forthis reason, readers of this report should not compare the numbers inChapter 2 of this report with numbers provided in previous written reports todetermine trends in graduate education.
This chapter begins with an examination of trends in graduate applications,followed by trends in first-time graduate enrollment, total graduate enroll-ment, and graduate certificates and degrees. The chapter concludes withthe data tables referenced in the text.
Trends in Graduate Applications
Applications for admission to U.S. graduate schools increased 8.3%between fall 2008 and fall 2009 at the institutions that responded to theCGS/GRE Survey of Graduate Enrollment and Degrees for both 2008 and
2009 (Table 3.1). The one-year increase in graduate applications was largerat public institutions (8.2%) than at private, not-for-profit institutions (7.8%).
The one-year increase in graduate applications in fall 2009 was larger thanthat seen over the past decade. Between fall 1999 and fall 2009, graduateapplications grew at an average annual rate of 4.8%. The average annualincrease over the ten-year time period was 4.3% at public institutions and6.1% at private, not-for-profit institutions.
By basic Carnegie classification, the one-year increases in graduate appli-cations ranged from a low of 6.3% at master’s colleges and universities to ahigh of 16.3% at “other” institutions, as shown in Figure 3.1. Over the five-year period between fall 2004 and fall 2009, the average annual increasewas greatest at “other” institutions (11.4%), compared with a low of 4.7% atresearch universities with very high research activity. Between fall 1999 andfall 2009, graduate applications increased across all Carnegie classifications,
Figure 3.1 Trends in Graduate Applications by CarnegieClassification, Fall 1999 to Fall 2009
16.3
%
6.3%9.
4%
8.9%
8.2%
8.3%
5.9%
4.7% 7.
5%
6.8% 7.9% 11
.4%
9.3%
6.2%7.3%
4.4%
4.4%
4.8%
0%
4%
8%
12%
16%
20%% Change 2008 to 2009
Avg. Annual % Chg. '04 to '09
Avg. Annual % Chg. '99 to '09
Source: CGS/GRE Survey of Graduate Enrollment and Degrees
Tota
l
Res
earc
h U
nive
rsiti
es
(RU
/VH
)
Res
earc
h U
nive
rsiti
es
(RU
/H)
Doc
tora
l/ R
esea
rch
Uni
vers
ities
Mas
ter's
C
olle
ges
&
Uni
vers
ities
Oth
e r

50Graduate Enrollment and Degrees: 1999 to 2009
Figure 3.2 Percent Change in Graduate Applications byBroad Field, Fall 2008 to Fall 2009
8.3%
6.3%
8.1%
6.7%
6.6%
4.9%
14.6%
3.1%
6.6%
10.9%
8.4%
12.6%
0% 2% 4% 6% 8% 10% 12% 14% 16%
Total
Arts and Humanities
Biological & Agric. Sci.
Business
Education
Engineering
Health Sciences
Math & Computer Sci.
Physical & Earth Sci.
Public Admin. & Svcs.
Social & Behavioral Sci.
Other Fields
Source: CGS/GRE Survey of Graduate Enrollment and Degrees
with the largest average annual increase once again in “other” institutions(9.3%) and the smallest in research universities with very high researchactivity and research universities with high research activity (both 4.4%).
Between fall 2008 and fall 2009, graduate applications increased 8.4% forprograms at the doctoral level and 7.8% at the master’s/certificate level(Table 3.1). Five- and ten-year trends are unavailable for applications bydegree level.
By broad field, the largest one-year change in graduate applicationsoccurred in health sciences, with a 14.6% increase between fall 2008 andfall 2009 (Table 3.2 and Figure 3.2). Strong growth was also seen in ‘other’fields (12.6%) and public administration and services (10.9%). The smallestincreases in graduate applications over the one-year period were in mathe-matics and computer science (3.1%) and engineering (4.9%).
Between fall 2004 and fall 2009, graduate applications increased in allbroad fields, with the largest average annual increases in health sciences(12.2%), business (9.5%), and biological and agricultural sciences (6.8%).Growth was weakest over the five-year period in arts and humanities andeducation (both 2.9%).
Over the past decade, increases occurred in graduate applications in allbroad fields. The average annual increases were greatest in mathematicsand computer sciences (5.8%), health sciences (5.6%), and arts andhumanities (4.7%). Average annual increases were smallest in physical andearth sciences (3.0%) and business and public administration and services(both 3.2%) between fall 1999 and fall 2009.
For more detailed information about trends in graduate applications, seeTables 3.1 through 3.2.
Trends in First-Time Graduate Enrollment
First-time graduate enrollment increased 5.5% between fall 2008 and fall2009 at the institutions that responded to the CGS/GRE Survey of GraduateEnrollment and Degrees for both 2008 and 2009 (Table 3.3). Over the one-year period, the increase in first-time enrollment was greater at public insti-tutions (6.2%) than at private, not-for-profit institutions (4.5%).
Growth in first-time graduate enrollment has been relatively consistent overthe last five- and ten-year periods, with 5.4% and 4.7% average annualincreases, respectively. Similarly, both public institutions and private, not-for-profit institutions have experienced steady gains. Between fall 2004 andfall 2009, first-time graduate enrollment increased 5.0% annually on aver-age at public institutions and 6.1% at private, not-for-profit institutions.Between fall 1999 and fall 2009, first-time graduate enrollment increased4.6% annually on average at public institutions and 4.9% at private, not-for-profit institutions.
By basic Carnegie classification, first-time graduate enrollment increasedmost between fall 2008 and fall 2009 at specialized and baccalaureate insti-tutions (10.1%). (These institutions are listed as “other” in Table 3.3 andFigure 3.3). Increases in first-time graduate enrollment ranged from 0.9% to7.9% over the one-year period for all other Carnegie classifications.Between fall 2004 and fall 2009, the average annual rates of increase infirst-time enrollment ranged from 3.6% at doctoral/research universities to15.7% at “other” institutions, and over the ten-year period ranged from 3.2%at research universities with very high research activity (RU/VH) to 7.6% at“other” institutions.
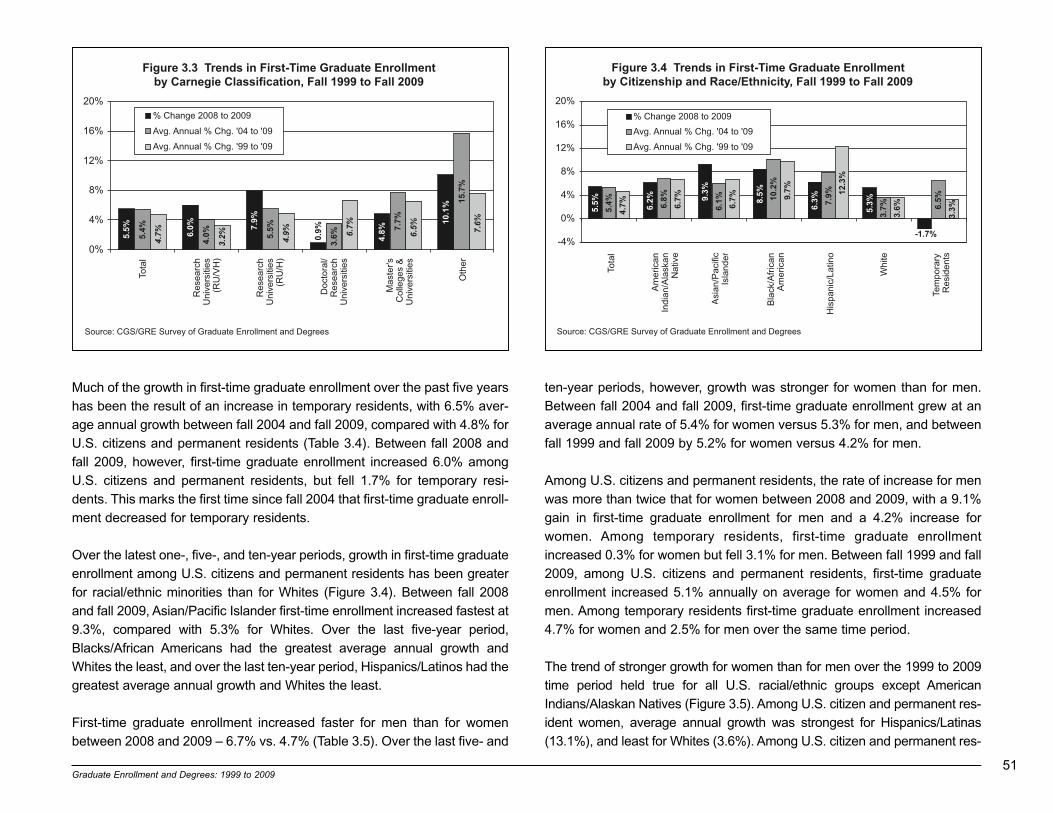
Graduate Enrollment and Degrees: 1999 to 2009 51
Much of the growth in first-time graduate enrollment over the past five yearshas been the result of an increase in temporary residents, with 6.5% aver-age annual growth between fall 2004 and fall 2009, compared with 4.8% forU.S. citizens and permanent residents (Table 3.4). Between fall 2008 andfall 2009, however, first-time graduate enrollment increased 6.0% amongU.S. citizens and permanent residents, but fell 1.7% for temporary resi-dents. This marks the first time since fall 2004 that first-time graduate enroll-ment decreased for temporary residents.
Over the latest one-, five-, and ten-year periods, growth in first-time graduateenrollment among U.S. citizens and permanent residents has been greaterfor racial/ethnic minorities than for Whites (Figure 3.4). Between fall 2008and fall 2009, Asian/Pacific Islander first-time enrollment increased fastest at9.3%, compared with 5.3% for Whites. Over the last five-year period,Blacks/African Americans had the greatest average annual growth andWhites the least, and over the last ten-year period, Hispanics/Latinos had thegreatest average annual growth and Whites the least.
First-time graduate enrollment increased faster for men than for womenbetween 2008 and 2009 – 6.7% vs. 4.7% (Table 3.5). Over the last five- and
ten-year periods, however, growth was stronger for women than for men.Between fall 2004 and fall 2009, first-time graduate enrollment grew at anaverage annual rate of 5.4% for women versus 5.3% for men, and betweenfall 1999 and fall 2009 by 5.2% for women versus 4.2% for men.
Among U.S. citizens and permanent residents, the rate of increase for menwas more than twice that for women between 2008 and 2009, with a 9.1%gain in first-time graduate enrollment for men and a 4.2% increase forwomen. Among temporary residents, first-time graduate enrollmentincreased 0.3% for women but fell 3.1% for men. Between fall 1999 and fall2009, among U.S. citizens and permanent residents, first-time graduateenrollment increased 5.1% annually on average for women and 4.5% formen. Among temporary residents first-time graduate enrollment increased4.7% for women and 2.5% for men over the same time period.
The trend of stronger growth for women than for men over the 1999 to 2009time period held true for all U.S. racial/ethnic groups except AmericanIndians/Alaskan Natives (Figure 3.5). Among U.S. citizen and permanent res-ident women, average annual growth was strongest for Hispanics/Latinas(13.1%), and least for Whites (3.6%). Among U.S. citizen and permanent res-
Figure 3.3 Trends in First-Time Graduate Enrollmentby Carnegie Classification, Fall 1999 to Fall 2009
5.5%
6.0% 7.
9%
4.8%
10.1
%
5.4%
4.0% 5.
5%
3.6%
7.7%
15.7
%
4.7%
3.2% 4.9% 6.7%
6.5% 7.6%
0.9%
0%
4%
8%
12%
16%
20%
% Change 2008 to 2009
Avg. Annual % Chg. '04 to '09
Avg. Annual % Chg. '99 to '09
Source: CGS/GRE Survey of Graduate Enrollment and Degrees
Tota
l
Res
earc
h U
nive
rsiti
es
(RU
/VH
)
Res
earc
h U
nive
rsiti
es
(RU
/H)
Doc
tora
l/ R
esea
rch
Uni
vers
ities
Mas
ter's
C
olle
ges
&
Uni
vers
ities
Oth
e r
Figure 3.4 Trends in First-Time Graduate Enrollment by Citizenship and Race/Ethnicity, Fall 1999 to Fall 2009
5.5%
6.2% 9.
3%
8.5%
6.3%
5.3%
5.4% 6.8%
6.1% 10
.2%
7.9%
3.7% 6.
5%
4.7% 6.
7%
6.7% 9.
7% 12.3
%
3.6%
3.3%
-1.7%-4%
0%
4%
8%
12%
16%
20%
% Change 2008 to 2009
Avg. Annual % Chg. '04 to '09
Avg. Annual % Chg. '99 to '09
Source: CGS/GRE Survey of Graduate Enrollment and Degrees
Tota
l
Am
eric
an
Indi
an/A
lask
an
Nat
ive
Asi
an/P
acifi
c Is
land
e r
Bla
ck/A
fric
an
Am
eric
an
His
pani
c/La
tino
Whi
te
Tem
pora
ry
Res
iden
ts

52Graduate Enrollment and Degrees: 1999 to 2009
ident men, average annual increases in first-time graduate enrollment rangedfrom a high of 11.1% for Hispanics/Latinos to a low of 3.5% for Whites.
First-time graduate enrollment increased over the one-, five-, and ten-yearperiods in all broad fields (Table 3.6). Between fall 2008 and fall 2009,growth was fastest in public administration and services (12.1%), health sci-ences (9.0%), and biological and agricultural sciences (7.8%). In contrast,first-time enrollment increased just 0.1% in education, 1.0% in mathematicsand computer sciences, and 1.2% in arts and humanities over the one-yearperiod. Between fall 2004 and fall 2009, average annual growth in first-timeenrollment was 5.4%. The strongest gains occurred in health sciences(9.3%), engineering (7.4%), and business (5.2%), compared with averageannual increases of 0.9% in arts and humanities, 1.7% in physical and earthsciences, and 2.7% in ‘other’ fields. Over the past decade, average annualgrowth in first-time graduate enrollment ranged from a high of 6.1% in healthsciences to a low of 1.3% in physical and earth sciences (Figure 3.6).
Between fall 2008 and fall 2009 among first-time enrollees, full-time gradu-ate enrollment increased 9.2% while part-time enrollment fell 0.5% (Table3.7). All broad fields experienced growth in full-time enrollment, but part-
time enrollment among first-time enrollees fell in six broad fields: arts andhumanities, business, education, mathematics and computer sciences,physical and earth sciences, and social and behavioral sciences.
First-time, full-time graduate enrollment increased fastest in public adminis-tration and services in fall 2009, with a 16.3% one-year increase, followedby social and behavioral sciences (14.9%) and health sciences (10.5%). Incontrast, full-time graduate enrollment among first-time enrollees increasedjust 1.4% in mathematics and computer sciences and 3.5% in arts andhumanities.
First-time, part-time graduate enrollment experienced the strongest gainsbetween fall 2008 and fall 2009 in health sciences (6.1%), ‘other’ fields(5.3%), and biological and agricultural sciences (5.2%). The largestdeclines in first-time, part-time graduate enrollment occurred in social andbehavioral sciences (-16.2%), physical and earth sciences (-9.7%), andeducation (-7.6%).
Over the past decade, first-time graduate enrollment increased across allbroad fields for full-time enrollees and increased in all broad fields exceptphysical and earth sciences for part-time enrollees. The growth in first-time,
Figure 3.5 Average Annual Percentage Change in First-TimeGraduate Enrollment by Citizenship, Race/Ethnicity, and
Gender, Fall 1999 to Fall 2009
4.2%
7.5%
6.4% 9.
0% 11.1
%
3.5%5.
2% 6.1% 7.0% 10
.1% 13
.1%
3.6% 4.7%
2.5%
0%
4%
8%
12%
16%
Men
Women
Source: CGS/GRE Survey of Graduate Enrollment and Degrees
Tota
l
Am
eric
an
Indi
an/A
lask
an
Nat
ive
Asi
an/P
acifi
c Is
land
e r
Bla
ck/A
fric
an
Am
eric
an
His
pani
c/La
tino
Whi
te
Tem
pora
ry
Res
iden
ts
Figure 3.6 Average Annual Percentage Change in First-TimeGraduate Enrollment by Broad Field, Fall 1999 to Fall 2009
4.7%
1.9%
4.1%
4.5%
5.7%
4.8%
6.1%
3.6%
1.3%
3.9%
4.4%
2.8%
0% 1% 2% 3% 4% 5% 6% 7%
Total
Arts & Humanities
Biological & Agric. Sci.
Business
Education
Engineering
Health Sciences
Marth & Computer Sci.
Physical & Earth Sci.
Public Admin. & Svcs.
Social & Behavioral Sci.
Other Fields
Source: CGS/GRE Survey of Graduate Enrollment and Degrees

Graduate Enrollment and Degrees: 1999 to 2009 53
full-time graduate enrollment outpaced the growth in first-time, part-timeenrollment in all broad fields except health sciences and social and behav-ioral sciences (Figure 3.7). Average annual growth in first-time, full-timegraduate enrollment ranged from a high of 6.3% in education to a low of1.3% in physical and earth sciences. For first-time, part-time enrollees,average annual changes ranged from an increase of 8.7% in health sci-ences to a decrease of 0.5% in physical and earth sciences.
As noted above, first-time graduate enrollment increased 6.0% for U.S. citi-zens and permanent residents but fell 1.7% for temporary residents betweenfall 2008 and fall 2009, but changes in first-time enrollment by citizenshipover this one-year period varied considerably by broad field (Table 3.8). U.S.citizens and permanent residents experienced gains in all broad fields excepteducation (-1.9%). In contrast, first-time graduate enrollment declined fortemporary residents in seven broad fields: education (-8.2%), mathematics
and computer sciences (-7.1%), business (-6.0%), physical and earth sci-ences (-3.2%), engineering (-2.3%), arts and humanities (-0.6%), and healthsciences (-0.3%). While four fields experienced gains in first-time graduateenrollment for temporary residents, the increases for U.S. citizens and per-manent residents outpaced those for temporary residents in all four of thesefields (biological and agricultural sciences, public administration and servic-es, social and behavioral sciences, and ‘other’ fields).
Between fall 2008 and fall 2009, first-time graduate enrollment increasedfastest for U.S. citizens and permanent residents in engineering (14.0%),public administration and services (12.1%), and biological and agriculturalsciences (10.7%). First-time graduate enrollment fell 1.9% in education, andexperienced the smallest gains in arts and humanities (1.9%) and business(5.7%). For temporary residents, first-time graduate enrollment increasedfastest over the one-year period in public administration and services(9.4%), ‘other’ fields (2.7%), and social and behavioral sciences (1.8%). Asnoted above, temporary resident first-time enrollment declined in sevenbroad fields between fall 2008 and fall 2009.
Between fall 2004 and fall 2009, first-time graduate enrollment increased forboth U.S. citizens and permanent residents and temporary residents in allbroad fields. U.S. citizens and permanent residents in health sciences expe-rienced the greatest increase between fall 2004 and fall 2009, with 9.9%average annual growth in first-time graduate enrollment.
Over the past decade, first-time graduate enrollment increased for U.S. cit-izens and permanent residents in all broad fields and increased for tempo-rary residents in all broad fields except arts and humanities (Figure 3.8). ForU.S. citizens and permanent residents, average annual increases in first-time enrollment ranged from a high of 6.3% in health sciences to a low of1.1% in physical and earth sciences. For temporary residents, first-timegraduate enrollment increased fastest in public administration and services(5.3%), but fell 0.1% in arts and humanities. Average annual growth amongU.S. citizens and permanent residents in first-time enrollment outpaced thatof temporary residents in all but two broad fields over the ten-year period—biological and agricultural sciences and public administration and services.
Figure 3.7 Average Annual Percentage Change in First-Time Graduate Enrollment by Broad Field and Attendance Status,
Fall 1999 to Fall 2009
5.0%
2.1%
4.2%
5.3%
6.3%
5.0%
5.1%
5.0%
1.3%
4.9%
4.4%
4.7%
4.2%
1.3%
2.2%
2.9%
5.5%
3.5%
8.7%
2.0%
4.6%
-0.5%
-1% 0% 1% 2% 3% 4% 5% 6% 7% 8% 9%
Total
Arts & Humanities
Biological & Agric. Sci.
Business
Education
Engineering
Health Sciences
Math & Computer Sci.
Physical & Earth Sci.
Public Admin. & Svcs.
Social & Behavioral Sci.
Other Fields
Part-TimeFull-Time
Source: CGS/GRE Survey of Graduate Enrollment and Degrees
0.8%
0.5%

Figure 3.8 Average Annual Percentage Change in First-Time Graduate Enrollment by Broad Field and Citizenship,
Fall 1999 to Fall 2009
4.9%
2.0%
3.7%
4.7%
5.6%
5.1%
6.3%
3.8%
1.1%
3.2%
5.5%
2.4%
3.3%
4.5%
3.2%
2.9%
3.6%
4.0%
5.3%
1.4%
3.3%
2.2%
-1% 0% 1% 2% 3% 4% 5% 6% 7% 8% 9%
Total
Arts & Humanities
Biological & Agric. Sci.
Business
Education
Engineering
Health Sciences
Math & Computer Sci.
Physical & Earth Sci.
Public Admin. & Svcs.
Social & Behavioral Sci.
Other Fields
Temporary Residents
U.S. Citizens & Perm/ Res.
Source: CGS/GRE Survey of Graduate Enrollment and Degrees
-0.1%
0.2%
54Graduate Enrollment and Degrees: 1999 to 2009
As noted above, overall growth in first-time graduate enrollment among U.S.citizens and permanent residents over the latest one-, five-, and ten-yearperiods has been greater for racial/ethnic minorities than for Whites. Thistrend was also evident by broad field over the last decade, with just threeminor exceptions—average annual growth among White first-time enrolleesincreased by 4.2% in education between fall 1999 and fall 2009 comparedwith 2.5% for Native Americans, average annual growth among White first-time enrollees increased by 3.1% in mathematics and computer sciencesover the ten-year period compared with 2.4% for Asians/Pacific Islanders,and first-time enrollment increased 0.7% annually on average for bothWhites and Asians/Pacific Islanders in physical and earth sciences. In allother cases, growth in each broad field was greater for racial/ethnic minori-ties than for Whites. First-time graduate enrollment increased for allracial/ethnic groups in all broad fields over the ten-year period (Table 3.9).
For American Indians/Alaskan Natives, average annual growth in first-timeenrollment between fall 1999 and fall 2009 ranged from a high of 9.4% inengineering to a low of 2.5% in education. For Asians/Pacific Islanders, aver-age annual growth was greatest in education at 11.0%, and was lowest inphysical and earth sciences (0.7%). Health sciences (16.9%) led in terms ofaverage annual growth for Blacks/African Americans, with physical and earthsciences showing the least growth with a 1.2% average annual increase. ForHispanics/Latinos, average annual increases typically exceeded those ofother racial/ethnic groups, with a high of 16.6% in health sciences and a lowof 6.4% in arts and humanities. For Whites, growth was greatest in health sci-ences (4.8%) and lowest in physical and earth sciences (0.7%).
Figure 3.9 shows first-time graduate enrollment by racial/ethnic group for fouraggregated broad fields: business, education, social and behavioral sciencesand arts and humanities, and natural sciences and engineering (biologicaland agricultural sciences, engineering, mathematics and computer sciences,and physical and earth sciences). The broad fields of health sciences, publicadministration and services, and ‘other’ fields are not included in the figure.
Figure 3.9 Average Annual Percentage Change in First-Time Graduate Enrollment by Broad Field and Race/Ethnicity, Fall
1999 to Fall 2009
3.9%
7.9%
9.8%
15.3%
3.0%
2.5%
11.0%
8.6%
16.1%
4.2%
5.1%
6.7%
7.1%
11.7%
2.6%
8.3%
4.8%
7.6%
9.9%
2.9%
0% 4% 8% 12% 16% 20%
Hispanic/Latino
White
Business Education Social Sci. & Humanities Natural Sci. & Engineering
Note: Includes U.S. citizens and permanent residents only.Source: CGS/GRE Survey of Graduate Enrollment and Degrees
Black/AfricanAmerican
Asian/PacificIslander
American Indian/Alaskan
Native
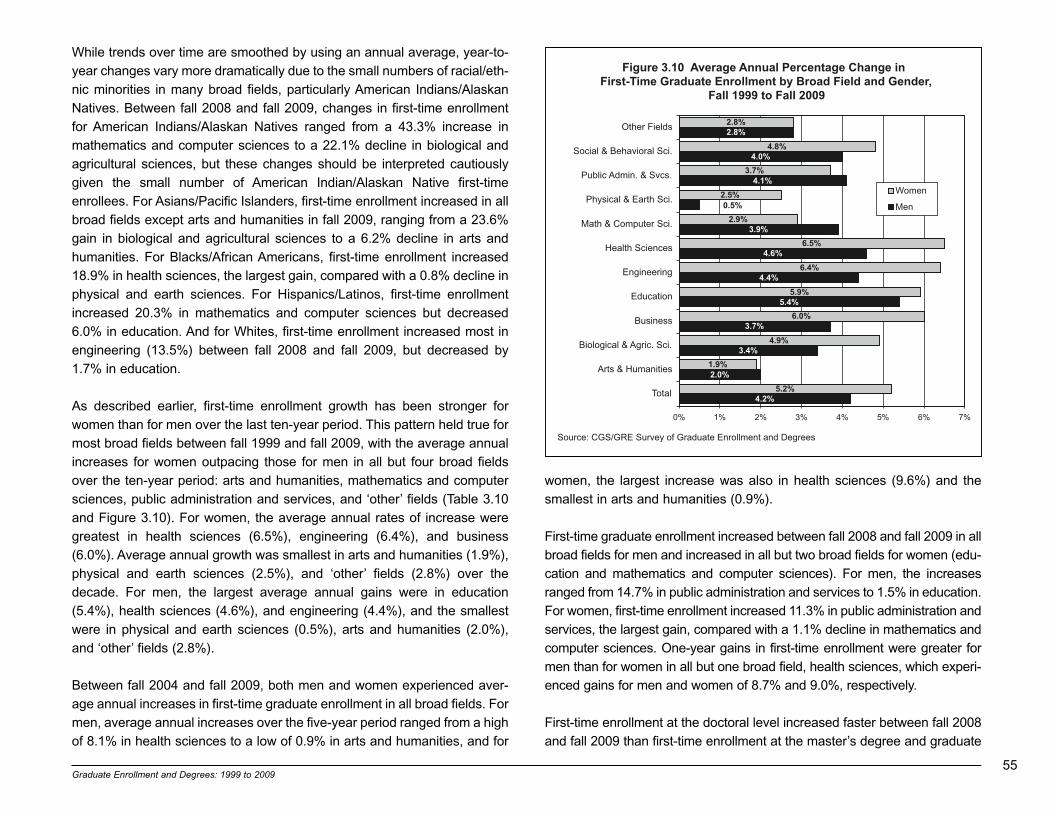
Graduate Enrollment and Degrees: 1999 to 2009 55
While trends over time are smoothed by using an annual average, year-to-year changes vary more dramatically due to the small numbers of racial/eth-nic minorities in many broad fields, particularly American Indians/AlaskanNatives. Between fall 2008 and fall 2009, changes in first-time enrollmentfor American Indians/Alaskan Natives ranged from a 43.3% increase inmathematics and computer sciences to a 22.1% decline in biological andagricultural sciences, but these changes should be interpreted cautiouslygiven the small number of American Indian/Alaskan Native first-timeenrollees. For Asians/Pacific Islanders, first-time enrollment increased in allbroad fields except arts and humanities in fall 2009, ranging from a 23.6%gain in biological and agricultural sciences to a 6.2% decline in arts andhumanities. For Blacks/African Americans, first-time enrollment increased18.9% in health sciences, the largest gain, compared with a 0.8% decline inphysical and earth sciences. For Hispanics/Latinos, first-time enrollmentincreased 20.3% in mathematics and computer sciences but decreased6.0% in education. And for Whites, first-time enrollment increased most inengineering (13.5%) between fall 2008 and fall 2009, but decreased by1.7% in education.
As described earlier, first-time enrollment growth has been stronger forwomen than for men over the last ten-year period. This pattern held true formost broad fields between fall 1999 and fall 2009, with the average annualincreases for women outpacing those for men in all but four broad fieldsover the ten-year period: arts and humanities, mathematics and computersciences, public administration and services, and ‘other’ fields (Table 3.10and Figure 3.10). For women, the average annual rates of increase weregreatest in health sciences (6.5%), engineering (6.4%), and business(6.0%). Average annual growth was smallest in arts and humanities (1.9%),physical and earth sciences (2.5%), and ‘other’ fields (2.8%) over thedecade. For men, the largest average annual gains were in education(5.4%), health sciences (4.6%), and engineering (4.4%), and the smallestwere in physical and earth sciences (0.5%), arts and humanities (2.0%),and ‘other’ fields (2.8%).
Between fall 2004 and fall 2009, both men and women experienced aver-age annual increases in first-time graduate enrollment in all broad fields. Formen, average annual increases over the five-year period ranged from a highof 8.1% in health sciences to a low of 0.9% in arts and humanities, and for
women, the largest increase was also in health sciences (9.6%) and thesmallest in arts and humanities (0.9%).
First-time graduate enrollment increased between fall 2008 and fall 2009 in allbroad fields for men and increased in all but two broad fields for women (edu-cation and mathematics and computer sciences). For men, the increasesranged from 14.7% in public administration and services to 1.5% in education.For women, first-time enrollment increased 11.3% in public administration andservices, the largest gain, compared with a 1.1% decline in mathematics andcomputer sciences. One-year gains in first-time enrollment were greater formen than for women in all but one broad field, health sciences, which experi-enced gains for men and women of 8.7% and 9.0%, respectively.
First-time enrollment at the doctoral level increased faster between fall 2008and fall 2009 than first-time enrollment at the master’s degree and graduate
Figure 3.10 Average Annual Percentage Change in First-Time Graduate Enrollment by Broad Field and Gender,
Fall 1999 to Fall 2009
4.2%
2.0%
3.4%
3.7%
5.4%
4.4%
4.6%
3.9%
4.1%
4.0%
2.8%
5.2%
1.9%
4.9%
6.0%
5.9%
6.4%
6.5%
2.9%
2.5%
3.7%
4.8%
2.8%
0.5%
0% 1% 2% 3% 4% 5% 6% 7%
Total
Arts & Humanities
Biological & Agric. Sci.
Business
Education
Engineering
Health Sciences
Math & Computer Sci.
Physical & Earth Sci.
Public Admin. & Svcs.
Social & Behavioral Sci.
Other Fields
Women
Men
Source: CGS/GRE Survey of Graduate Enrollment and Degrees
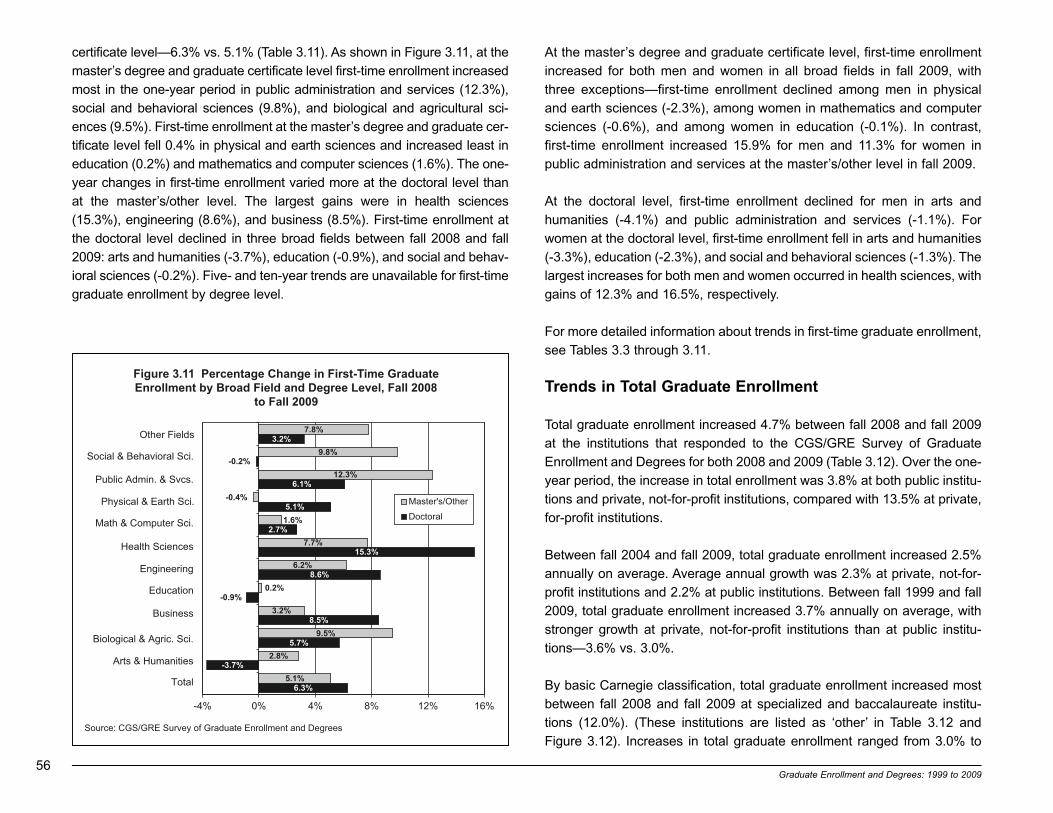
56Graduate Enrollment and Degrees: 1999 to 2009
certificate level—6.3% vs. 5.1% (Table 3.11). As shown in Figure 3.11, at themaster’s degree and graduate certificate level first-time enrollment increasedmost in the one-year period in public administration and services (12.3%),social and behavioral sciences (9.8%), and biological and agricultural sci-ences (9.5%). First-time enrollment at the master’s degree and graduate cer-tificate level fell 0.4% in physical and earth sciences and increased least ineducation (0.2%) and mathematics and computer sciences (1.6%). The one-year changes in first-time enrollment varied more at the doctoral level thanat the master’s/other level. The largest gains were in health sciences(15.3%), engineering (8.6%), and business (8.5%). First-time enrollment atthe doctoral level declined in three broad fields between fall 2008 and fall2009: arts and humanities (-3.7%), education (-0.9%), and social and behav-ioral sciences (-0.2%). Five- and ten-year trends are unavailable for first-timegraduate enrollment by degree level.
At the master’s degree and graduate certificate level, first-time enrollmentincreased for both men and women in all broad fields in fall 2009, withthree exceptions—first-time enrollment declined among men in physicaland earth sciences (-2.3%), among women in mathematics and computersciences (-0.6%), and among women in education (-0.1%). In contrast,first-time enrollment increased 15.9% for men and 11.3% for women inpublic administration and services at the master’s/other level in fall 2009.
At the doctoral level, first-time enrollment declined for men in arts andhumanities (-4.1%) and public administration and services (-1.1%). Forwomen at the doctoral level, first-time enrollment fell in arts and humanities(-3.3%), education (-2.3%), and social and behavioral sciences (-1.3%). Thelargest increases for both men and women occurred in health sciences, withgains of 12.3% and 16.5%, respectively.
For more detailed information about trends in first-time graduate enrollment,see Tables 3.3 through 3.11.
Trends in Total Graduate Enrollment
Total graduate enrollment increased 4.7% between fall 2008 and fall 2009at the institutions that responded to the CGS/GRE Survey of GraduateEnrollment and Degrees for both 2008 and 2009 (Table 3.12). Over the one-year period, the increase in total enrollment was 3.8% at both public institu-tions and private, not-for-profit institutions, compared with 13.5% at private,for-profit institutions.
Between fall 2004 and fall 2009, total graduate enrollment increased 2.5%annually on average. Average annual growth was 2.3% at private, not-for-profit institutions and 2.2% at public institutions. Between fall 1999 and fall2009, total graduate enrollment increased 3.7% annually on average, withstronger growth at private, not-for-profit institutions than at public institu-tions—3.6% vs. 3.0%.
By basic Carnegie classification, total graduate enrollment increased mostbetween fall 2008 and fall 2009 at specialized and baccalaureate institu-tions (12.0%). (These institutions are listed as ‘other’ in Table 3.12 andFigure 3.12). Increases in total graduate enrollment ranged from 3.0% to
Figure 3.11 Percentage Change in First-Time GraduateEnrollment by Broad Field and Degree Level, Fall 2008
to Fall 2009
6.3%
-3.7%
5.7%
8.5%
8.6%
15.3%
2.7%
5.1%
6.1%
3.2%
5.1%
2.8%
9.5%
3.2%
6.2%
7.7%
12.3%
9.8%
7.8%
-0.2%
-0.9%
1.6%
-0.4%
0.2%
-4% 0% 4% 8% 12% 16%
Master's/Other
Doctoral
Source: CGS/GRE Survey of Graduate Enrollment and Degrees
Other Fields
Social & Behavioral Sci.
Public Admin. & Svcs.
Physical & Earth Sci.
Health Sciences
Engineering
Education
Business
Biological & Agric. Sci.
Arts & Humanities
Total
Math & Computer Sci.
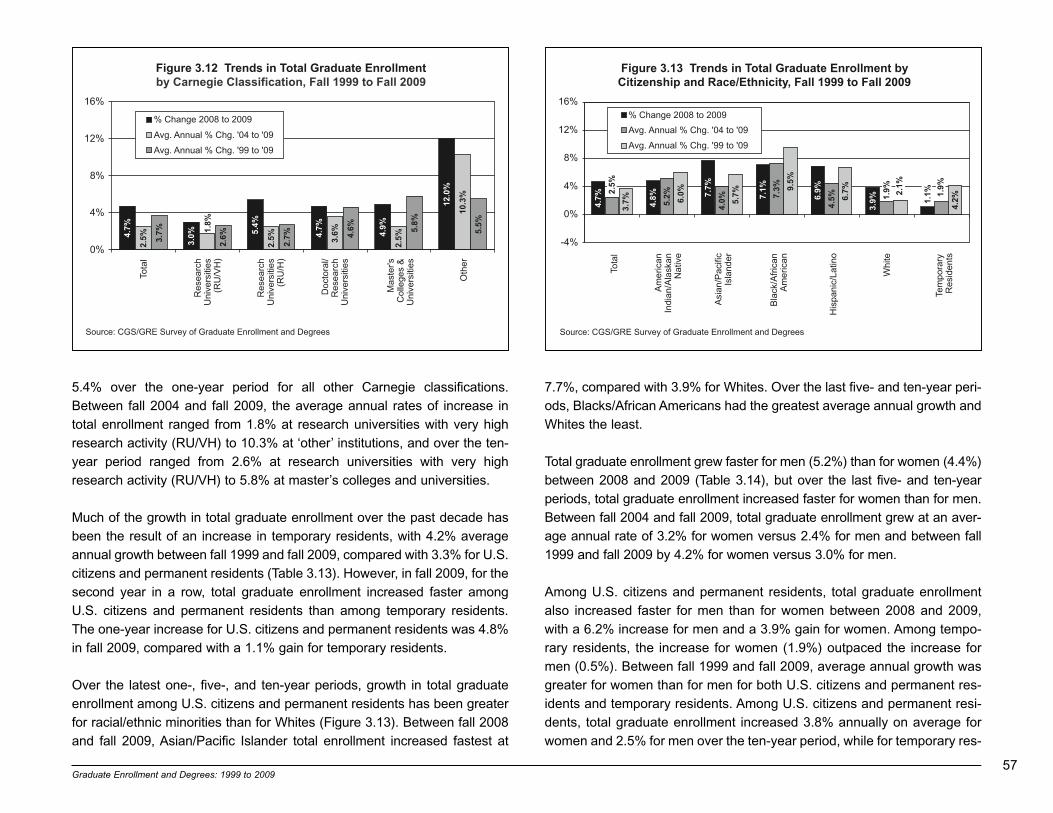
Graduate Enrollment and Degrees: 1999 to 2009 57
5.4% over the one-year period for all other Carnegie classifications.Between fall 2004 and fall 2009, the average annual rates of increase intotal enrollment ranged from 1.8% at research universities with very highresearch activity (RU/VH) to 10.3% at ‘other’ institutions, and over the ten-year period ranged from 2.6% at research universities with very highresearch activity (RU/VH) to 5.8% at master’s colleges and universities.
Much of the growth in total graduate enrollment over the past decade hasbeen the result of an increase in temporary residents, with 4.2% averageannual growth between fall 1999 and fall 2009, compared with 3.3% for U.S.citizens and permanent residents (Table 3.13). However, in fall 2009, for thesecond year in a row, total graduate enrollment increased faster amongU.S. citizens and permanent residents than among temporary residents.The one-year increase for U.S. citizens and permanent residents was 4.8%in fall 2009, compared with a 1.1% gain for temporary residents.
Over the latest one-, five-, and ten-year periods, growth in total graduateenrollment among U.S. citizens and permanent residents has been greaterfor racial/ethnic minorities than for Whites (Figure 3.13). Between fall 2008and fall 2009, Asian/Pacific Islander total enrollment increased fastest at
7.7%, compared with 3.9% for Whites. Over the last five- and ten-year peri-ods, Blacks/African Americans had the greatest average annual growth andWhites the least.
Total graduate enrollment grew faster for men (5.2%) than for women (4.4%)between 2008 and 2009 (Table 3.14), but over the last five- and ten-yearperiods, total graduate enrollment increased faster for women than for men.Between fall 2004 and fall 2009, total graduate enrollment grew at an aver-age annual rate of 3.2% for women versus 2.4% for men and between fall1999 and fall 2009 by 4.2% for women versus 3.0% for men.
Among U.S. citizens and permanent residents, total graduate enrollmentalso increased faster for men than for women between 2008 and 2009,with a 6.2% increase for men and a 3.9% gain for women. Among tempo-rary residents, the increase for women (1.9%) outpaced the increase formen (0.5%). Between fall 1999 and fall 2009, average annual growth wasgreater for women than for men for both U.S. citizens and permanent res-idents and temporary residents. Among U.S. citizens and permanent resi-dents, total graduate enrollment increased 3.8% annually on average forwomen and 2.5% for men over the ten-year period, while for temporary res-
Figure 3.12 Trends in Total Graduate Enrollmentby Carnegie Classification, Fall 1999 to Fall 2009
4.7%
3.0% 5.
4%
4.7%
4.9%
12.0
%
2.5%
2.5% 3.
6%
2.5%
10.3
%
3.7%
2.6%
2.7% 4.
6% 5.8%
5.5%
1.8%
0%
4%
8%
12%
16%
% Change 2008 to 2009
Avg. Annual % Chg. '04 to '09
Avg. Annual % Chg. '99 to '09
Source: CGS/GRE Survey of Graduate Enrollment and Degrees
Tota
l
Res
earc
h U
nive
rsiti
es
(RU
/VH
)
Res
earc
h U
nive
rsiti
es
(RU
/H)
Doc
tora
l/ R
esea
rch
Uni
vers
ities
Mas
ter's
C
olle
ges
&
Uni
vers
ities
Oth
e r
Figure 3.13 Trends in Total Graduate Enrollment by Citizenship and Race/Ethnicity, Fall 1999 to Fall 2009
4.7%
4.8% 7.
7%
7.1%
6.9%
3.9%5.2%
4.0%
7.3%
4.5%
3.7% 6.
0%
5.7%
9.5%
6.7%
4.2%
-4%
0%
4%
8%
12%
16%% Change 2008 to 2009
Avg. Annual % Chg. '04 to '09
Avg. Annual % Chg. '99 to '09
Source: CGS/GRE Survey of Graduate Enrollment and Degrees
Tota
l
Am
eric
an
Indi
an/A
lask
an
Nat
ive
Asi
an/P
acifi
c Is
land
e r
Bla
ck/A
fric
an
Am
eric
an
His
pani
c/La
tino
Whi
te
Tem
pora
ry
Res
iden
ts
1.1% 1.
9%2.5%
1.9% 2.1%
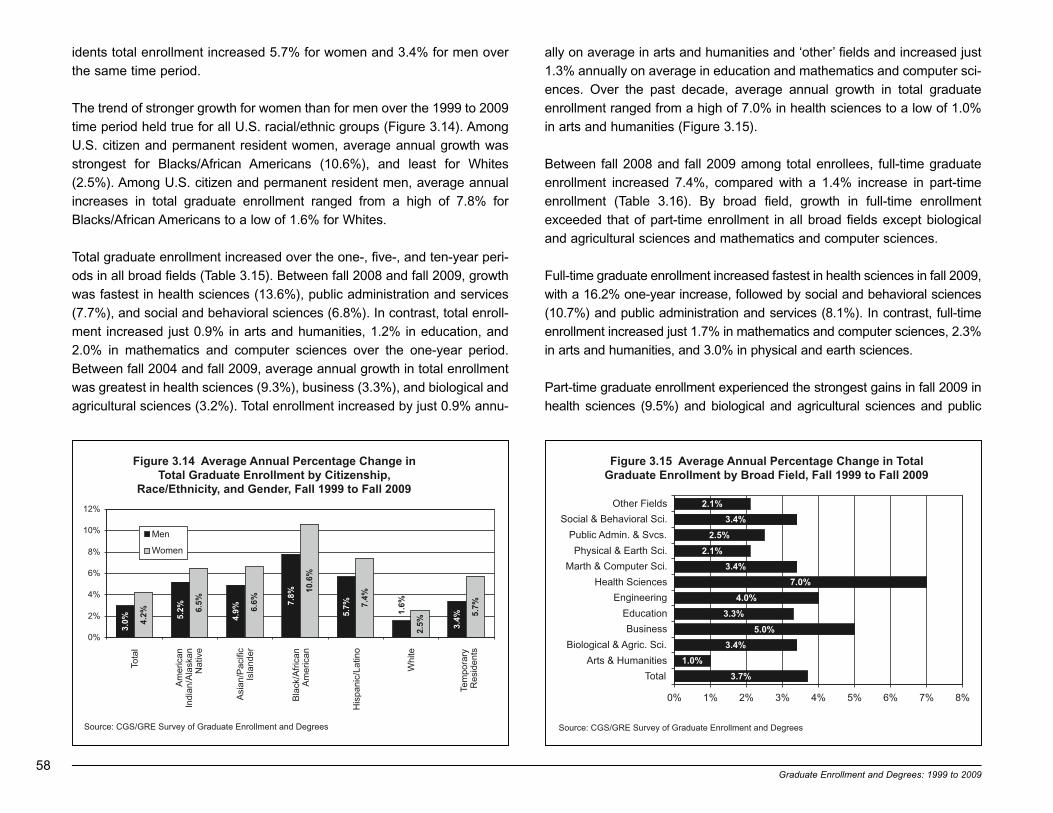
58Graduate Enrollment and Degrees: 1999 to 2009
idents total enrollment increased 5.7% for women and 3.4% for men overthe same time period.
The trend of stronger growth for women than for men over the 1999 to 2009time period held true for all U.S. racial/ethnic groups (Figure 3.14). AmongU.S. citizen and permanent resident women, average annual growth wasstrongest for Blacks/African Americans (10.6%), and least for Whites(2.5%). Among U.S. citizen and permanent resident men, average annualincreases in total graduate enrollment ranged from a high of 7.8% forBlacks/African Americans to a low of 1.6% for Whites.
Total graduate enrollment increased over the one-, five-, and ten-year peri-ods in all broad fields (Table 3.15). Between fall 2008 and fall 2009, growthwas fastest in health sciences (13.6%), public administration and services(7.7%), and social and behavioral sciences (6.8%). In contrast, total enroll-ment increased just 0.9% in arts and humanities, 1.2% in education, and2.0% in mathematics and computer sciences over the one-year period.Between fall 2004 and fall 2009, average annual growth in total enrollmentwas greatest in health sciences (9.3%), business (3.3%), and biological andagricultural sciences (3.2%). Total enrollment increased by just 0.9% annu-
ally on average in arts and humanities and ‘other’ fields and increased just1.3% annually on average in education and mathematics and computer sci-ences. Over the past decade, average annual growth in total graduateenrollment ranged from a high of 7.0% in health sciences to a low of 1.0%in arts and humanities (Figure 3.15).
Between fall 2008 and fall 2009 among total enrollees, full-time graduateenrollment increased 7.4%, compared with a 1.4% increase in part-timeenrollment (Table 3.16). By broad field, growth in full-time enrollmentexceeded that of part-time enrollment in all broad fields except biologicaland agricultural sciences and mathematics and computer sciences.
Full-time graduate enrollment increased fastest in health sciences in fall 2009,with a 16.2% one-year increase, followed by social and behavioral sciences(10.7%) and public administration and services (8.1%). In contrast, full-timeenrollment increased just 1.7% in mathematics and computer sciences, 2.3%in arts and humanities, and 3.0% in physical and earth sciences.
Part-time graduate enrollment experienced the strongest gains in fall 2009 inhealth sciences (9.5%) and biological and agricultural sciences and public
Figure 3.14 Average Annual Percentage Change in Total Graduate Enrollment by Citizenship,
Race/Ethnicity, and Gender, Fall 1999 to Fall 2009
3.0%
5.2%
4.9%
7.8%
5.7%
4.2%
6.5%
6.6%
10.6
%
7.4%
2.5%
5.7%
1.6%
3.4%
0%
2%
4%
6%
8%
10%
12%
Men
Women
Source: CGS/GRE Survey of Graduate Enrollment and Degrees
Tota
l
Am
eric
an
Indi
an/A
lask
an
Nat
ive
Asi
an/P
acifi
c Is
land
e r
Bla
ck/A
fric
an
Am
eric
an
His
pani
c/La
tino
Whi
te
Tem
pora
ry
Res
iden
tsFigure 3.15 Average Annual Percentage Change in Total
Graduate Enrollment by Broad Field, Fall 1999 to Fall 2009
3.7%
1.0%
3.4%
5.0%
3.3%
4.0%
7.0%
3.4%
2.1%
2.5%
3.4%
2.1%
0% 1% 2% 3% 4% 5% 6% 7% 8%
Total
Arts & Humanities
Biological & Agric. Sci.
Business
Education
Engineering
Health Sciences
Marth & Computer Sci.
Physical & Earth Sci.
Public Admin. & Svcs.
Social & Behavioral Sci.
Other Fields
Source: CGS/GRE Survey of Graduate Enrollment and Degrees

Graduate Enrollment and Degrees: 1999 to 2009 59
administration and services (both 7.0%). Part-time enrollment fell in four broadfields in fall 2009—education (-2.3%), arts and humanities (-2.2%), physicaland earth sciences (-2.1%), and social and behavioral sciences (-1.6%).
Over the past decade, full-time and part-time graduate enrollment increasedor remained level in all broad fields, and the growth in full-time graduateenrollment outpaced the growth in part-time enrollment in all broad fields(Figure 3.16). Average annual growth in full-time graduate enrollmentranged from a high of 7.7% in business to a low of 1.5% in arts and human-ities. For part-time enrollees, average annual increases ranged from a highof 6.4% in health sciences to a low of 0.0% in arts and humanities and inphysical and earth sciences.
As noted above, the increase in total graduate enrollment was greateramong U.S. citizens and permanent residents than temporary residents
between fall 2008 and fall 2009 (4.8% vs. 1.1%), but changes in total enroll-ment over this one-year period varied considerably by citizenship and broadfield (Table 3.17). U.S. citizens and permanent residents experienced gainsin all broad fields, but total graduate enrollment decreased for temporaryresidents in five broad fields—arts and humanities, business, education,mathematics and computer sciences, and physical and earth sciences.
Between fall 2008 and fall 2009, total graduate enrollment increased fastestfor U.S. citizens and permanent residents in health sciences (13.3%), engi-neering (9.3%), and public administration and services (7.0%). The gains intotal enrollment for U.S. citizens and permanent residents were smallest ineducation (0.5%), arts and humanities (0.8%) and physical and earth sci-ences (3.6%). For temporary residents, total graduate enrollment increasedfastest over the one-year period in health sciences (7.3%), public adminis-tration and services (6.5%), and ‘other’ fields (2.7%). Temporary residentgraduate enrollment declined by the largest amounts in education (-7.7%),business (-3.5%), and physical and earth sciences (-1.1%).
Between fall 2004 and fall 2009, total graduate enrollment increased forU.S. citizens and permanent residents in all broad fields, but declined fortemporary residents in two broad fields—education (-3.7%) and physicaland earth sciences (-0.2%). U.S. citizens and permanent residents in healthsciences experienced the greatest increase between fall 2004 and fall 2009,with 10.6% average annual growth in total graduate enrollment.
Over the past decade, total graduate enrollment increased for both U.S. cit-izens and permanent residents and temporary residents in all broad fields(Figure 3.17). For U.S. citizens and permanent residents, average annualincreases in total enrollment ranged from a high of 7.1% in health sciencesto a low of 0.4% in arts and humanities. For temporary residents, total grad-uate enrollment increases ranged from a high of 6.8% in health sciences toa low of 1.1% in arts and humanities. Over the ten-year period, averageannual growth in enrollment among temporary residents outpaced that ofU.S. citizens and permanent residents in all broad fields except health sci-ences, social and behavioral sciences, and ‘other’ fields.
Figure 3.16 Average Annual Percentage Change in Total Graduate Enrollment by Broad Field and Attendance Status,
Fall 1999 to Fall 2009
5.2%
1.5%
3.8%
7.7%
5.8%
4.8%
7.4%
4.6%
2.5%
3.0%
4.4%
3.7%
2.0%
1.3%
1.8%
2.0%
2.3%
6.4%
1.8%
1.5%
1.7%
1.0%
0% 1% 2% 3% 4% 5% 6% 7% 8%
Total
Arts & Humanities
Biological & Agric. Sci.
Business
Education
Engineering
Health Sciences
Math & Computer Sci.
Physical & Earth Sci.
Public Admin. & Svcs.
Social & Behavioral Sci.
Other Fields
Part-TimeFull-Time
Source: CGS/GRE Survey of Graduate Enrollment and Degrees
0.0%
0.0%

60Graduate Enrollment and Degrees: 1999 to 2009
As noted above, overall growth in total graduate enrollment among U.S. cit-izens and permanent residents over the latest one-, five-, and ten-year peri-ods has generally been greater for racial/ethnic minorities than for Whites.This trend was also evident by broad field over the last decade, with just oneminor exception—average annual growth among White enrollees increasedby 2.2% in mathematics and computer sciences between fall 1999 and fall2009 compared with 1.3% for Asians/Pacific Islanders. In all other cases,growth was faster for racial/ethnic minorities than for Whites over the ten-year period. Total graduate enrollment increased for all racial/ethnic groupsin all broad fields over the ten-year period (Table 3.18).
For American Indians/Alaskan Natives, average annual growth in graduateenrollment between fall 1999 and fall 2009 ranged from a high of 9.7% inhealth sciences to a low of 3.3% in arts and humanities. For Asians/PacificIslanders, average annual growth was also greatest in health sciences at
8.5% and was lowest in mathematics and computer sciences (1.3%). Healthsciences (20.3%) also led in terms of average annual growth forBlacks/African Americans, and arts and humanities showed the smallestgrowth for Blacks/African Americans with a 1.6% average annual increase.For Hispanics/Latinos, average annual increases ranged from a high of13.1% in health sciences and a low of 2.8% in arts and humanities. ForWhites, growth was also greatest in health sciences (5.6%), compared witha 0.1% increase in arts and humanities.
Figure 3.18 shows total graduate enrollment by racial/ethnic group for fouraggregated broad fields: business, education, social and behavioral sciencesand arts and humanities, and natural sciences and engineering (biologicaland agricultural sciences, engineering, mathematics and computer sciences,and physical and earth sciences). The broad fields of health sciences, publicadministration and services, and ‘other’ fields are not included in the figure.
Between fall 2008 and fall 2009, changes in total graduate enrollment forAmerican Indians/Alaskan Natives ranged from a 13.8% increase in math-
Figure 3.18 Average Annual Percentage Change in Total Graduate Enrollment by Broad Field and Race/Ethnicity, Fall
1999 to Fall 2009
7.8%
7.7%
18.4%
4.9%
1.8%
4.4%
6.7%
7.1%
7.4%
2.0%
4.9%
4.8%
7.0%
5.6%
6.6%
3.8%
7.3%
7.5%
1.8%1.1%
0% 4% 8% 12% 16% 20%
Hispanic/Latino
White
Business Education Social Sci. & Humanities Natural Sci. & Engineering
Note: Includes U.S. citizens and permanent residents only.Source: CGS/GRE Survey of Graduate Enrollment and Degrees
Black/AfricanAmerican
Asian/PacificIslander
American Indian/Alaskan
Native
Figure 3.17 Average Annual Percentage Change in Total Graduate Enrollment by Broad Field and Citizenship, Fall
1999 to Fall 2009
3.3%
2.7%
3.8%
3.1%
3.0%
7.1%
2.7%
1.3%
1.7%
3.6%
1.8%
4.2%
4.5%
5.1%
3.8%
4.9%
6.8%
5.6%
2.5%
1.1%
3.8%
2.4%
1.6%
0% 1% 2% 3% 4% 5% 6% 7% 8%
Total
Arts & Humanities
Biological & Agric. Sci.
Business
Education
Engineering
Health Sciences
Math & Computer Sci.
Physical & Earth Sci.
Public Admin. & Svcs.
Social & Behavioral Sci.
Other Fields Temporary Residents
U.S. Citizens & Perm/ Res.
Source: CGS/GRE Survey of Graduate Enrollment and Degrees
0.4%
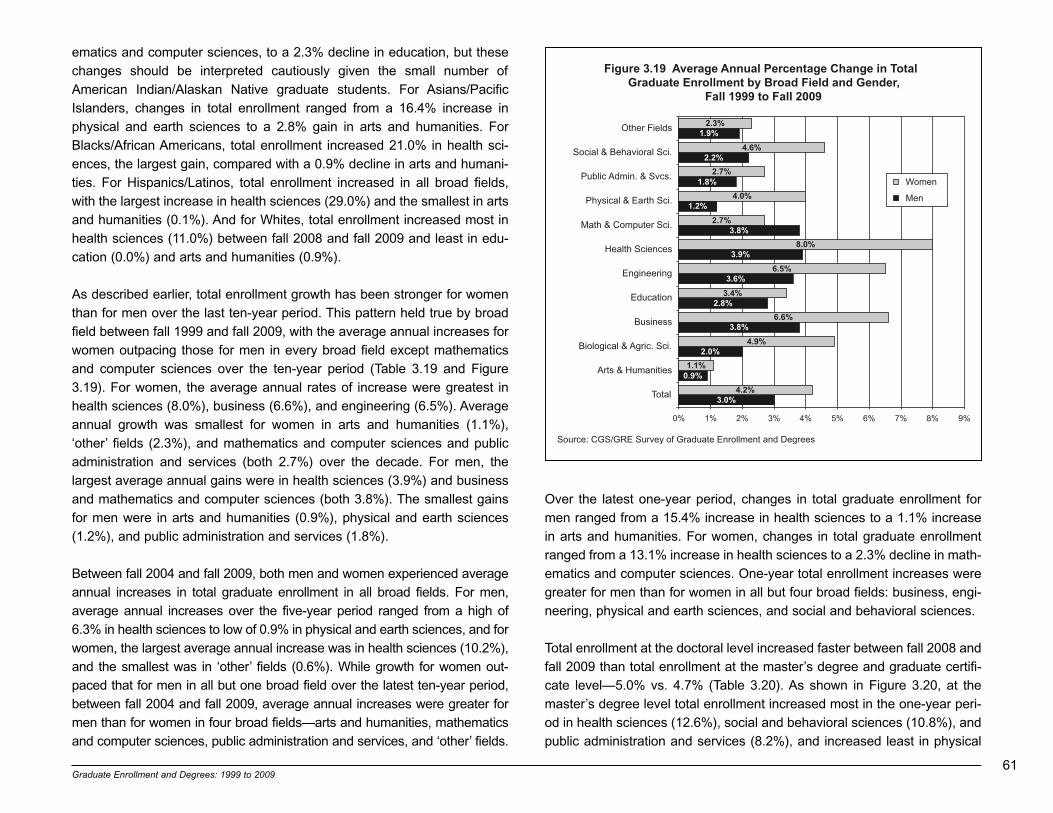
Graduate Enrollment and Degrees: 1999 to 2009 61
ematics and computer sciences, to a 2.3% decline in education, but thesechanges should be interpreted cautiously given the small number ofAmerican Indian/Alaskan Native graduate students. For Asians/PacificIslanders, changes in total enrollment ranged from a 16.4% increase inphysical and earth sciences to a 2.8% gain in arts and humanities. ForBlacks/African Americans, total enrollment increased 21.0% in health sci-ences, the largest gain, compared with a 0.9% decline in arts and humani-ties. For Hispanics/Latinos, total enrollment increased in all broad fields,with the largest increase in health sciences (29.0%) and the smallest in artsand humanities (0.1%). And for Whites, total enrollment increased most inhealth sciences (11.0%) between fall 2008 and fall 2009 and least in edu-cation (0.0%) and arts and humanities (0.9%).
As described earlier, total enrollment growth has been stronger for womenthan for men over the last ten-year period. This pattern held true by broadfield between fall 1999 and fall 2009, with the average annual increases forwomen outpacing those for men in every broad field except mathematicsand computer sciences over the ten-year period (Table 3.19 and Figure3.19). For women, the average annual rates of increase were greatest inhealth sciences (8.0%), business (6.6%), and engineering (6.5%). Averageannual growth was smallest for women in arts and humanities (1.1%),‘other’ fields (2.3%), and mathematics and computer sciences and publicadministration and services (both 2.7%) over the decade. For men, thelargest average annual gains were in health sciences (3.9%) and businessand mathematics and computer sciences (both 3.8%). The smallest gainsfor men were in arts and humanities (0.9%), physical and earth sciences(1.2%), and public administration and services (1.8%).
Between fall 2004 and fall 2009, both men and women experienced averageannual increases in total graduate enrollment in all broad fields. For men,average annual increases over the five-year period ranged from a high of6.3% in health sciences to low of 0.9% in physical and earth sciences, and forwomen, the largest average annual increase was in health sciences (10.2%),and the smallest was in ‘other’ fields (0.6%). While growth for women out-paced that for men in all but one broad field over the latest ten-year period,between fall 2004 and fall 2009, average annual increases were greater formen than for women in four broad fields—arts and humanities, mathematicsand computer sciences, public administration and services, and ‘other’ fields.
Over the latest one-year period, changes in total graduate enrollment formen ranged from a 15.4% increase in health sciences to a 1.1% increasein arts and humanities. For women, changes in total graduate enrollmentranged from a 13.1% increase in health sciences to a 2.3% decline in math-ematics and computer sciences. One-year total enrollment increases weregreater for men than for women in all but four broad fields: business, engi-neering, physical and earth sciences, and social and behavioral sciences.
Total enrollment at the doctoral level increased faster between fall 2008 andfall 2009 than total enrollment at the master’s degree and graduate certifi-cate level—5.0% vs. 4.7% (Table 3.20). As shown in Figure 3.20, at themaster’s degree level total enrollment increased most in the one-year peri-od in health sciences (12.6%), social and behavioral sciences (10.8%), andpublic administration and services (8.2%), and increased least in physical
Figure 3.19 Average Annual Percentage Change in Total Graduate Enrollment by Broad Field and Gender,
Fall 1999 to Fall 2009
3.0%
0.9%
2.0%
3.8%
2.8%
3.6%
3.9%
3.8%
1.2%
1.8%
2.2%
1.9%
4.2%
1.1%
4.9%
6.6%
3.4%
6.5%
8.0%
2.7%
4.0%
2.7%
4.6%
2.3%
0% 1% 2% 3% 4% 5% 6% 7% 8% 9%
Total
Arts & Humanities
Biological & Agric. Sci.
Business
Education
Engineering
Health Sciences
Math & Computer Sci.
Physical & Earth Sci.
Public Admin. & Svcs.
Social & Behavioral Sci.
Other Fields
Women
Men
Source: CGS/GRE Survey of Graduate Enrollment and Degrees

62Graduate Enrollment and Degrees: 1999 to 2009
and earth sciences (1.0%), education (2.1%), and arts and humanities(2.4%). The one-year changes in total enrollment varied more at the doc-toral level than at the master’s/other level. Health sciences (17.1%), busi-ness (9.2%), and engineering (5.7%) experienced the largest increases intotal enrollment. Total enrollment declined in two broad fields at the doctor-al level in fall 2009—education (-2.6%) and arts and humanities (-1.2%).Five- and ten-year trends are unavailable for total graduate enrollment bydegree level.
At the master’s degree and graduate certificate level, total enrollmentincreased for men in all broad fields between fall 2008 and fall 2009 andincreased for women in all broad fields except mathematics and computersciences (-1.6%). For men at the master’s degree and graduate certificatelevel, the strongest gains were in health sciences (15.0%), social and behav-ioral sciences (10.3%), and public administration and services (9.1%), and
the smallest gains were in physical and earth sciences (0.8%), education(2.1%), and arts and humanities (2.5%). For women at the master’s degreeand graduate certificate level, the strongest gains were also in health sci-ences (12.1%), social and behavioral sciences (11.0%), and public adminis-tration and services (8.0%), and the smallest gains were also in physical andearth sciences (1.1%), education (2.1%), and arts and humanities (2.4%).
At the doctoral level, total enrollment declined for both men and women ineducation (by 0.2% for men and 3.6% for women) and in arts and humani-ties (by 0.7% for men and by 1.6% for women). For both men and womenthe largest increases at the doctoral level occurred in health sciences, witha 16.5% increase for men and a 17.4% gain for women.
For more detailed information about trends in total graduate enrollment, seeTables 3.12 through 3.20.
Trends in Graduate Certificates and Degrees
The number of doctoral degrees awarded increased 3.9% between 2007-08and 2008-09 at the institutions that responded to the CGS/GRE Survey ofGraduate Enrollment and Degrees for both 2008 and 2009 (Table 3.21).Over the one-year period, the increase in doctoral degree production wasgreater at private, not-for-profit institutions (8.0%) and private, for-profit insti-tutions (36.1%) than at public institutions (1.1%).10
Master’s degree production increased 4.3% in the one-year period, with thelargest increase at private, for-profit institutions (8.1%) and the smallest atpublic institutions (3.1%). Master’s degree production increased 5.3% at pri-vate, not-for-profit institutions.
At the graduate certificate level, 25.3% more certificates were awarded in2008-09 than in 2007-08, but much of this increase is simply due to moreaccurate data on the number of graduate certificates awarded. TheCGS/GRE Survey of Graduate Enrollment and Degrees only recently began
Figure 3.20 Percentage Change in Total Graduate Enrollment by Broad Field and Degree Level,
Fall 2008 to Fall 2009
5.0%
3.6%
9.2%
-2.6%
5.7%
17.1%
3.6%
2.6%
2.4%
4.7%
2.4%
6.5%
4.6%
2.1%
6.9%
12.6%
3.1%
8.2%
10.8%
5.3%
1.5%
1.4%
-1.2%
1.0%
-4% 0% 4% 8% 12% 16% 20%
Master's/Other
Doctoral
Source: CGS/GRE Survey of Graduate Enrollment and Degrees
Other Fields
Social & Behavioral Sci.
Public Admin. & Svcs.
Physical & Earth Sci.
Health Sciences
Engineering
Education
Business
Biological & Agric. Sci.
Arts & Humanities
Total
Math & Computer Sci.
10 Data on private, for-profit institutions are based on a small number of responding institu-tions and should therefore be interpreted cautiously. The data on degrees awarded by pri-vate, for-profit institutions are likely not representative of the entire universe of for-profitinstitutions in the United States.
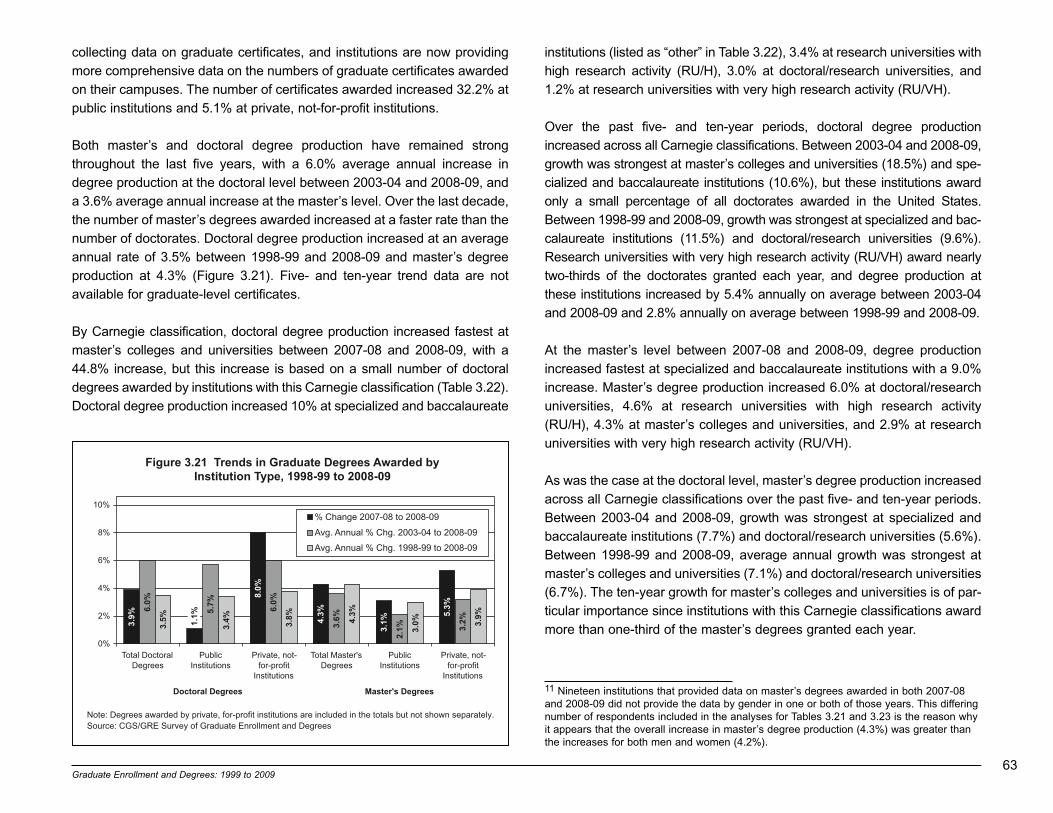
Graduate Enrollment and Degrees: 1999 to 2009 63
collecting data on graduate certificates, and institutions are now providingmore comprehensive data on the numbers of graduate certificates awardedon their campuses. The number of certificates awarded increased 32.2% atpublic institutions and 5.1% at private, not-for-profit institutions.
Both master’s and doctoral degree production have remained strongthroughout the last five years, with a 6.0% average annual increase indegree production at the doctoral level between 2003-04 and 2008-09, anda 3.6% average annual increase at the master’s level. Over the last decade,the number of master’s degrees awarded increased at a faster rate than thenumber of doctorates. Doctoral degree production increased at an averageannual rate of 3.5% between 1998-99 and 2008-09 and master’s degreeproduction at 4.3% (Figure 3.21). Five- and ten-year trend data are notavailable for graduate-level certificates.
By Carnegie classification, doctoral degree production increased fastest atmaster’s colleges and universities between 2007-08 and 2008-09, with a44.8% increase, but this increase is based on a small number of doctoraldegrees awarded by institutions with this Carnegie classification (Table 3.22).Doctoral degree production increased 10% at specialized and baccalaureate
institutions (listed as “other” in Table 3.22), 3.4% at research universities withhigh research activity (RU/H), 3.0% at doctoral/research universities, and1.2% at research universities with very high research activity (RU/VH).
Over the past five- and ten-year periods, doctoral degree productionincreased across all Carnegie classifications. Between 2003-04 and 2008-09,growth was strongest at master’s colleges and universities (18.5%) and spe-cialized and baccalaureate institutions (10.6%), but these institutions awardonly a small percentage of all doctorates awarded in the United States.Between 1998-99 and 2008-09, growth was strongest at specialized and bac-calaureate institutions (11.5%) and doctoral/research universities (9.6%).Research universities with very high research activity (RU/VH) award nearlytwo-thirds of the doctorates granted each year, and degree production atthese institutions increased by 5.4% annually on average between 2003-04and 2008-09 and 2.8% annually on average between 1998-99 and 2008-09.
At the master’s level between 2007-08 and 2008-09, degree productionincreased fastest at specialized and baccalaureate institutions with a 9.0%increase. Master’s degree production increased 6.0% at doctoral/researchuniversities, 4.6% at research universities with high research activity(RU/H), 4.3% at master’s colleges and universities, and 2.9% at researchuniversities with very high research activity (RU/VH).
As was the case at the doctoral level, master’s degree production increasedacross all Carnegie classifications over the past five- and ten-year periods.Between 2003-04 and 2008-09, growth was strongest at specialized andbaccalaureate institutions (7.7%) and doctoral/research universities (5.6%).Between 1998-99 and 2008-09, average annual growth was strongest atmaster’s colleges and universities (7.1%) and doctoral/research universities(6.7%). The ten-year growth for master’s colleges and universities is of par-ticular importance since institutions with this Carnegie classifications awardmore than one-third of the master’s degrees granted each year.
Figure 3.21 Trends in Graduate Degrees Awarded byInstitution Type, 1998-99 to 2008-09
3.9%
8.0%
4.3%
3.1%
5.3%6.
0%
5.7%
6.0%
3.6%
2.1% 3.
2%
3.5%
3.4% 3.8% 4.3%
3.0% 3.
9%
0%
2%
4%
6%
8%
10%
Total DoctoralDegrees
PublicInstitutions
Private, not-for-profit
Institutions
Total Master'sDegrees
PublicInstitutions
Private, not-for-profit
Institutions
% Change 2007-08 to 2008-09
Avg. Annual % Chg. 2003-04 to 2008-09
Avg. Annual % Chg. 1998-99 to 2008-09
Note: Degrees awarded by private, for-profit institutions are included in the totals but not shown separately.Source: CGS/GRE Survey of Graduate Enrollment and Degrees
seergeD s'retsaMseergeD larotcoD
1.1%
11 Nineteen institutions that provided data on master’s degrees awarded in both 2007-08and 2008-09 did not provide the data by gender in one or both of those years. This differingnumber of respondents included in the analyses for Tables 3.21 and 3.23 is the reason whyit appears that the overall increase in master’s degree production (4.3%) was greater thanthe increases for both men and women (4.2%).

64Graduate Enrollment and Degrees: 1999 to 2009
Much of the recent growth in graduate degree production has been theresult of an increase in the number of women earning degrees (Table 3.23).Doctoral degree production increased 6.3% for women between 2007-08and 2008-09, compared with 1.0% for men (Figure 3.22). Between 1998-99and 2008-09, the average annual rate of increase for women also outpacedthat for men—5.5% vs. 2.1%. At the master’s level, degree productionincreased 4.2% for both men and women between 2007-08 and 2008-09.11
Over the ten year period, the average annual rate of increase for womenwas 5.0% versus 3.5% for men.
At the doctoral level, the rate of increase in degree production for women sur-passed that for men in both public institutions and private, not-for-profit insti-tutions over the one-, five- and ten-year time periods. For example, at pri-vate, not-for-profit institutions, the average annual rate of increase for womenbetween 2003-04 and 2008-09 was 7.6%, compared with 4.5% for men.
At the master’s degree level, the rate of increase in degree production forwomen also exceeded that for men in both public institutions and private,not-for-profit institutions, but only over the five- and ten-year periods.Between 2007-08 and 2008-09, master’s degree production increased
3.4% for men at public institutions, compared with 3.1% for women. At pri-vate, not-for-profit institutions, men earned 5.0% more master’s degrees in2008-09 than in 2007-08, while the increase for women was 4.6%.
The growth in master’s and doctoral degree production for women exceed-ed the growth for men in nearly all Carnegie classifications across the five-and ten-year periods (Table 3.24). Most notably, doctoral degree productionfor women increased 4.4% annually on average at research universities withvery high research activity (RU/VH) between 1998-99 and 2008-09, com-pared with a 1.7% increase for men. As noted above, institutions with thisCarnegie classification award the majority of all doctoral degrees. Between2007-08 and 2008-09, the increase in doctoral degree production wasgreater for women than for men in all Carnegie classifications except spe-cialized and baccalaureate institutions. At the master’s level, however,growth in degree production was greater for men than for women in allCarnegie classifications except master’s colleges and universities.
The number of graduate certificates awarded increased 25.3% overall in2008-09, but there was wide variation by field (Table 3.25). The one-yearchanges ranged from an increase of 37.9% in biological and agricultural sci-ences to a 58.3% decline in social and behavioral sciences, although muchof the fluctuation can be attributed to the small numbers of certificatesawarded in most broad fields and to more comprehensive data on graduatecertificates being submitted by the responding institutions. In education, thebroad field in which the most graduate certificates are awarded each year,the number of certificates granted increased 29.7% in 2008-09. Theincrease for men in this broad field (37.1%) was greater than the increasefor women (29.2%).
At the master’s level, degree production increased 4.3% overall between2007-08 and 2008-09, with year-to-year changes by broad field rangingfrom a high of 8.9% in health sciences to a 4.5% decline in physical andearth sciences (Table 3.26). Growth was also strong over the one-year peri-od in business (7.6%) and engineering (6.5%).
Between 2003-04 and 2008-09, the average annual increases in master’sdegree production were greatest in health sciences (8.5%), business (6.1%),and biological and agricultural sciences (4.9%). The average annual rates of
Figure 3.22 Trends in Graduate Degrees Awarded by Gender and Degree Level, 1998-99 to 2008-09
4.2%
4.2%
6.3%
1.0%
4.3%
2.7%
7.7%
4.7% 5.0%
3.5%
5.5%
2.1%
0%
2%
4%
6%
8%
Men Women Men Women
% Change 2007-08 to 2008-09
Avg. Annual % Chg. 2003-04 to 2008-09
Avg. Annual % Chg. 1998-99 to 2008-09
Source: CGS/GRE Survey of Graduate Enrollment and Degrees
seergeD s'retsaMseergeD larotcoD
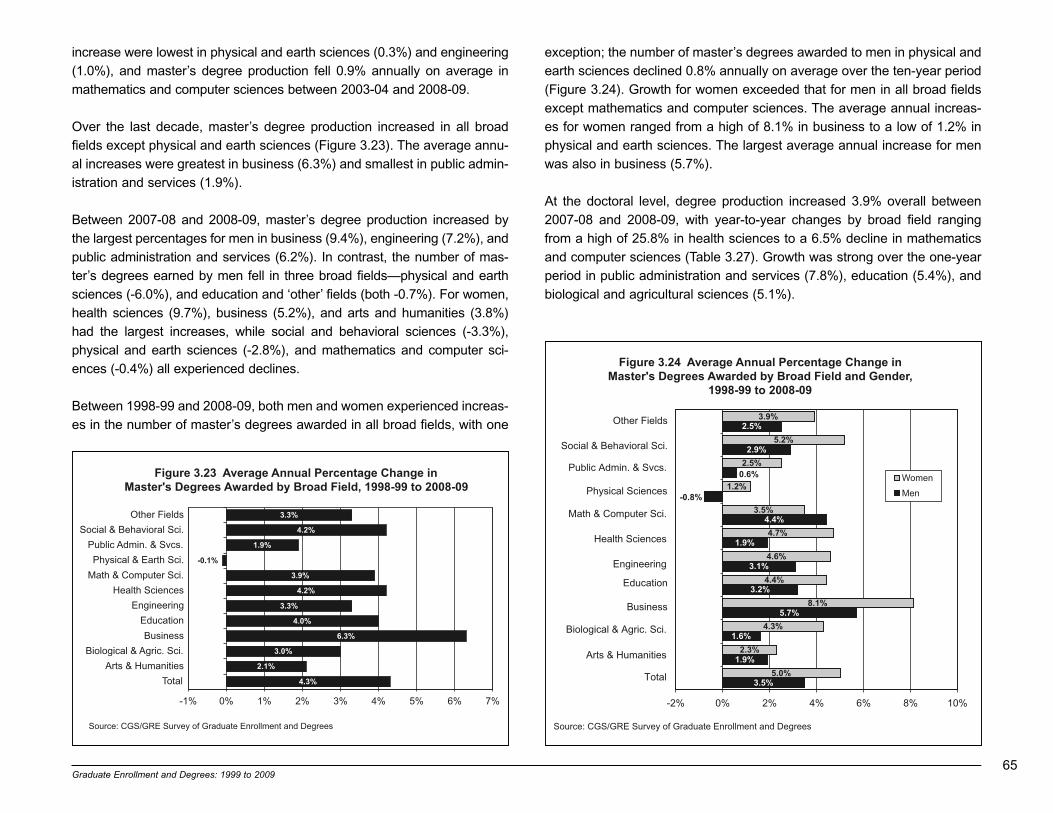
Graduate Enrollment and Degrees: 1999 to 2009 65
increase were lowest in physical and earth sciences (0.3%) and engineering(1.0%), and master’s degree production fell 0.9% annually on average inmathematics and computer sciences between 2003-04 and 2008-09.
Over the last decade, master’s degree production increased in all broadfields except physical and earth sciences (Figure 3.23). The average annu-al increases were greatest in business (6.3%) and smallest in public admin-istration and services (1.9%).
Between 2007-08 and 2008-09, master’s degree production increased bythe largest percentages for men in business (9.4%), engineering (7.2%), andpublic administration and services (6.2%). In contrast, the number of mas-ter’s degrees earned by men fell in three broad fields—physical and earthsciences (-6.0%), and education and ‘other’ fields (both -0.7%). For women,health sciences (9.7%), business (5.2%), and arts and humanities (3.8%)had the largest increases, while social and behavioral sciences (-3.3%),physical and earth sciences (-2.8%), and mathematics and computer sci-ences (-0.4%) all experienced declines.
Between 1998-99 and 2008-09, both men and women experienced increas-es in the number of master’s degrees awarded in all broad fields, with one
exception; the number of master’s degrees awarded to men in physical andearth sciences declined 0.8% annually on average over the ten-year period(Figure 3.24). Growth for women exceeded that for men in all broad fieldsexcept mathematics and computer sciences. The average annual increas-es for women ranged from a high of 8.1% in business to a low of 1.2% inphysical and earth sciences. The largest average annual increase for menwas also in business (5.7%).
At the doctoral level, degree production increased 3.9% overall between2007-08 and 2008-09, with year-to-year changes by broad field rangingfrom a high of 25.8% in health sciences to a 6.5% decline in mathematicsand computer sciences (Table 3.27). Growth was strong over the one-yearperiod in public administration and services (7.8%), education (5.4%), andbiological and agricultural sciences (5.1%).
Figure 3.23 Average Annual Percentage Change in Master's Degrees Awarded by Broad Field, 1998-99 to 2008-09
3.3%
4.2%
1.9%
-0.1%
3.9%
4.2%
3.3%
4.0%
6.3%
3.0%
2.1%
4.3%
-1% 0% 1% 2% 3% 4% 5% 6% 7%
Total
Arts & Humanities
Biological & Agric. Sci.
Business
Education
Engineering
Health Sciences
Math & Computer Sci.
Physical & Earth Sci.
Public Admin. & Svcs.
Social & Behavioral Sci.
Other Fields
Source: CGS/GRE Survey of Graduate Enrollment and Degrees
Figure 3.24 Average Annual Percentage Change in Master's Degrees Awarded by Broad Field and Gender,
1998-99 to 2008-09
3.5%
1.9%
1.6%
5.7%
3.2%
3.1%
1.9%
4.4%
2.9%
2.5%
5.0%
2.3%
4.3%
8.1%
4.4%
4.6%
4.7%
3.5%
1.2%
2.5%
5.2%
3.9%
0.6%
-0.8%
-2% 0% 2% 4% 6% 8% 10%
Women
Men
Source: CGS/GRE Survey of Graduate Enrollment and Degrees
Other Fields
Social & Behavioral Sci.
Public Admin. & Svcs.
Physical Sciences
Health Sciences
Engineering
Education
Business
Biological & Agric. Sci.
Arts & Humanities
Total
Math & Computer Sci.

66Graduate Enrollment and Degrees: 1999 to 2009
Between 2003-04 and 2008-09, the average annual increases in doctoraldegree production were greatest in health sciences (16.3%), mathematicsand computer sciences (10.1%), and business (9.2%). The average annualrates of increase were lowest in arts and humanities (1.7%) and social andbehavioral sciences and ‘other’ fields (both 2.1%).
Over the last decade, doctoral degree production increased in all broadfields (Figure 3.25). The average annual increases were greatest in healthsciences (11.1%) and smallest in arts and humanities (0.6%).
Doctoral degree production has increased in large part due to a rise in thenumber of women earning degrees. Between 2007-08 and 2008-09, doctoraldegree production increased most for women in health sciences (26.0%),physical and earth sciences (10.3%), and business (10.1%), but decreased inthree broad fields—engineering (-6.7%), mathematics and computer sciences(-6.2%), and social and behavioral sciences (-1.2%). Doctoral degree pro-duction for men increased most in health sciences (25.4%), public adminis-tration and services (12.5%), and arts and humanities (4.8%). Men earnedfewer doctorates in 2008-09 than in 2007-08 in four broad fields—‘other’ fields(-13.8%), mathematics and computer sciences (-6.8%), physical and earthsciences (-2.6%), and engineering (-2.2%).
Between 1998-99 and 2008-09, women experienced increases in the num-ber of doctorates awarded in all broad fields, but the number of doctoratesawarded to men declined in two broad fields (Figure 3.26). Growth forwomen exceeded that for men in every single broad field. The averageannual increases for women ranged from a high of 14.0% in health sciencesto a low of 1.4% in both arts and humanities and education. For men, math-ematics and computer sciences (4.3%), health sciences (3.9%) and engi-neering (3.3%) were the only fields where average annual growth exceed-ed three percent.
For more detailed information about trends in graduate degrees and certifi-cates, see Tables 3.21 through 3.27.
Figure 3.25 Average Annual Percentage Change in Doctoral Degrees Awarded by Broad Field, 1998-99 to 2008-09
3.5%
3.7%
3.7%
11.1%
5.0%
1.4%
3.3%
1.8%
1.5%
0.6%
0.9%
0.9%
0% 2% 4% 6% 8% 10% 12%
Total
Arts & Humanities
Biological & Agric. Sci.
Business
Education
Engineering
Health Sciences
Math & Computer Sci.
Physical & Earth Sci.
Public Admin. & Svcs.
Social & Behavioral Sci.
Other Fields
Source: CGS/GRE Survey of Graduate Enrollment and Degrees
Figure 3.26 Average Annual Percentage Change in Doctoral Degrees Awarded by Broad Field and Gender,
1998-99 to 2008-09
2.1%
3.3%
3.9%
4.3%
5.5%
7.7%
1.9%
6.0%
14.0%
7.0%
4.7%
5.8%
3.2%
3.6%
-0.2%
1.2%
0.3%
0.1%
0.2%
0.3%
0.5%
-0.2%
1.4%
1.4%
-2% 0% 2% 4% 6% 8% 10% 12% 14% 16%
Women
Men
Source: CGS/GRE Survey of Graduate Enrollment and Degrees
Other Fields
Social & Behavioral Sci.
Public Admin. & Svcs.
Physical Sciences
Health Sciences
Engineering
Education
Business
Biological & Agric. Sci.
Arts & Humanities
Total
Math & Computer Sci.
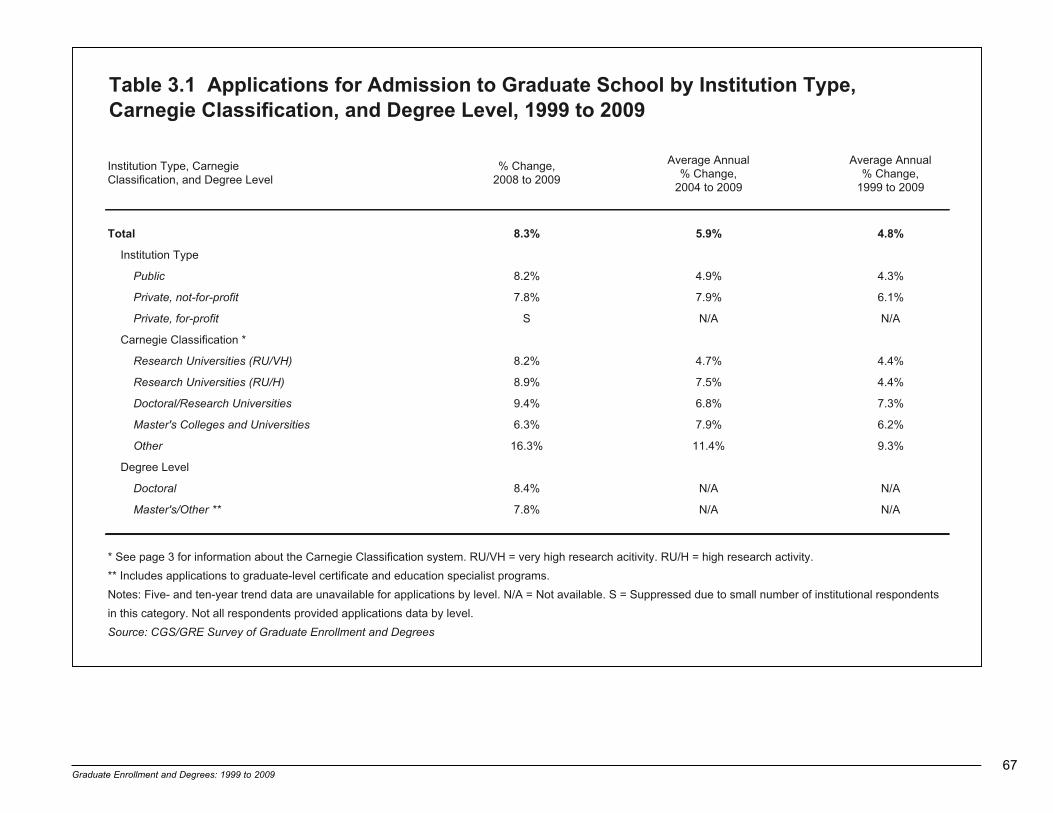
Graduate Enrollment and Degrees: 1999 to 2009 67
Table 3.1 Applications for Admission to Graduate School by Institution Type,Carnegie Classification, and Degree Level, 1999 to 2009
Institution Type, Carnegie Classification, and Degree Level
% Change, 2008 to 2009
Average Annual % Change,
2004 to 2009
Average Annual % Change,
1999 to 2009
Total %8.4%9.5%3.8
Institution Type
Public %3.4%9.4%2.8
Private, not-for-profit %1.6%9.7%8.7
Private, for-profit A/NA/NS
Carnegie Classification *
Research Universities (RU/VH) %4.4%7.4%2.8
Research Universities (RU/H) %4.4%5.7%9.8
Doctoral/Research Universities %3.7%8.6%4.9
Master's Colleges and Universities %2.6%9.7%3.6
Other %3.9%4.11%3.61
Degree Level
Doctoral A/NA/N%4.8
Master's/Other ** A/NA/N%8.7
* See page 3 for information about the Carnegie Classification system. RU/VH = very high research acitivity. RU/H = high research activity.
** Includes applications to graduate-level certificate and education specialist programs.
Notes: Five- and ten-year trend data are unavailable for applications by level. N/A = Not available. S = Suppressed due to small number of institutional respondents
in this category. Not all respondents provided applications data by level.
Source: CGS/GRE Survey of Graduate Enrollment and Degrees
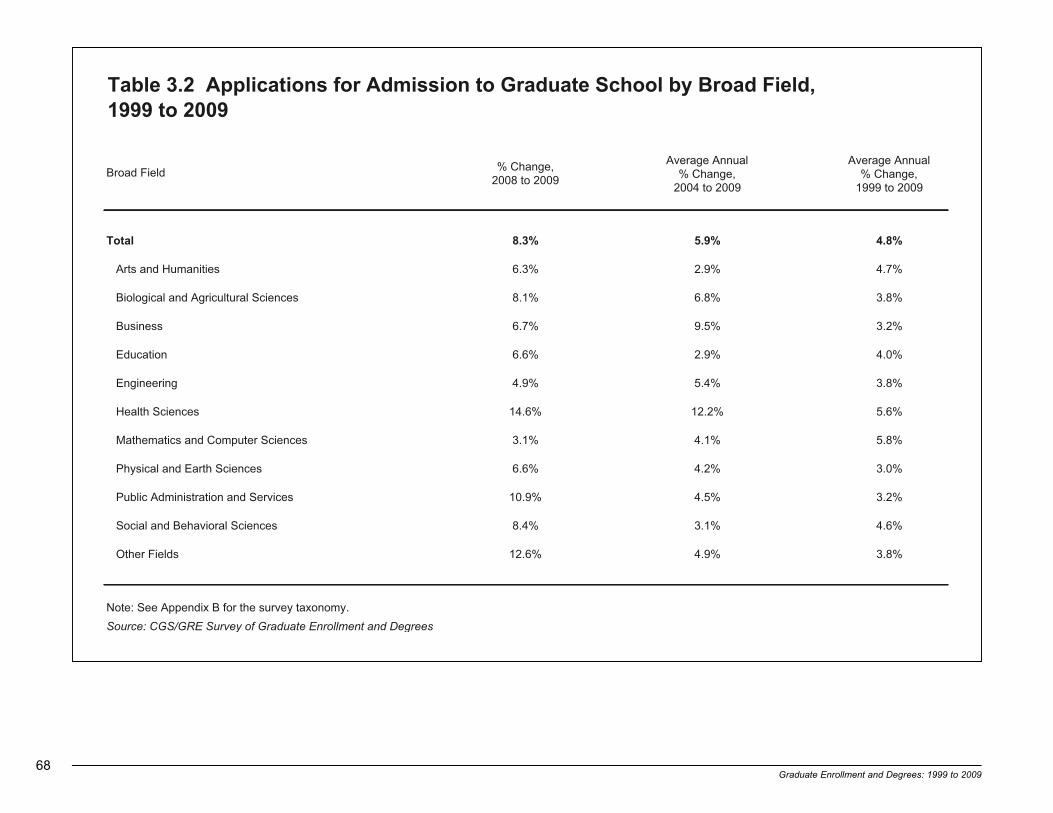
Table 3.2 Applications for Admission to Graduate School by Broad Field, 1999 to 2009
Broad Field % Change, 2008 to 2009
Average Annual % Change,
2004 to 2009
Average Annual % Change,
1999 to 2009
Total %8.4%9.5%3.8
%7.4%9.2%3.6seitinamuH dna strA
%8.3%8.6%1.8secneicS larutlucirgA dna lacigoloiB
%2.3%5.9%7.6ssenisuB
%0.4%9.2%6.6noitacudE
%8.3%4.5%9.4gnireenignE
%6.5%2.21%6.41secneicS htlaeH
%8.5%1.4%1.3secneicS retupmoC dna scitamehtaM
%0.3%2.4%6.6secneicS htraE dna lacisyhP
%2.3%5.4%9.01secivreS dna noitartsinimdA cilbuP
%6.4%1.3%4.8secneicS laroivaheB dna laicoS
%8.3%9.4%6.21sdleiF rehtO
Note: See Appendix B for the survey taxonomy.
Source: CGS/GRE Survey of Graduate Enrollment and Degrees
68Graduate Enrollment and Degrees: 1999 to 2009
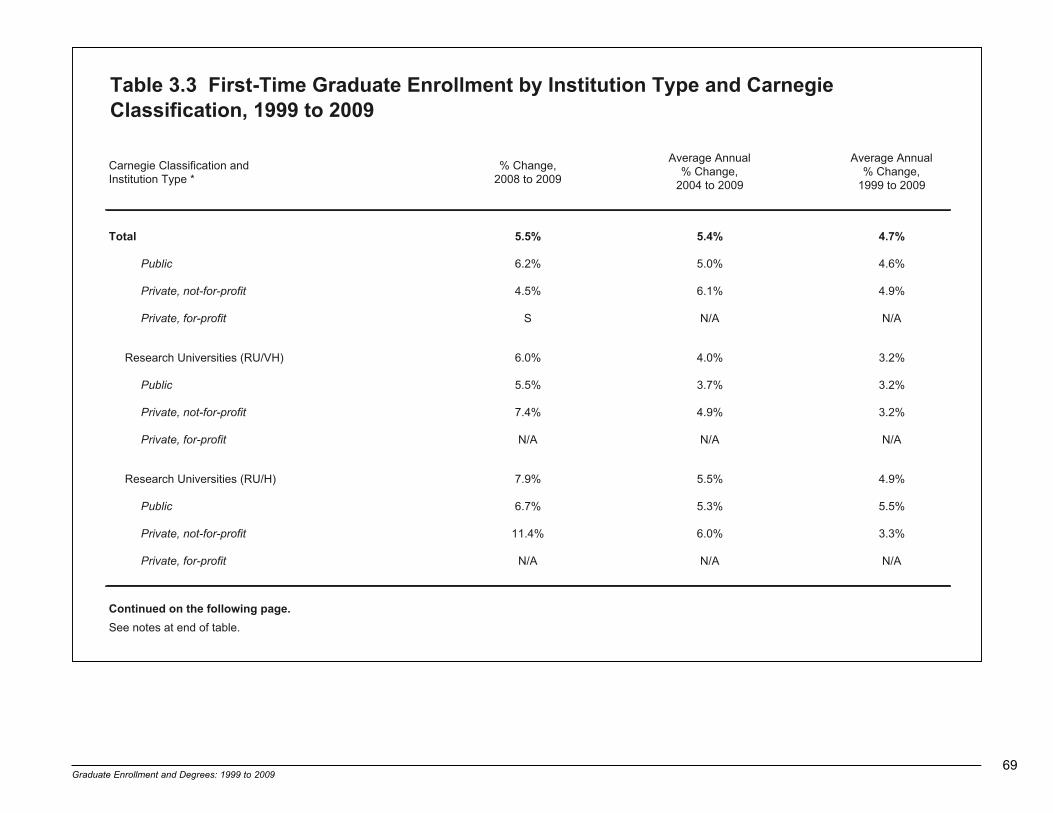
Table 3.3 First-Time Graduate Enrollment by Institution Type and CarnegieClassification, 1999 to 2009
Carnegie Classification and Institution Type *
% Change, 2008 to 2009
Average Annual % Change,
2004 to 2009
Average Annual % Change,
1999 to 2009
Total %7.4%4.5%5.5
Public %6.4%0.5%2.6
Private, not-for-profit %9.4%1.6%5.4
Private, for-profit A/NA/NS
%2.3%0.4%0.6)HV/UR( seitisrevinU hcraeseR
Public %2.3%7.3%5.5
Private, not-for-profit %2.3%9.4%4.7
Private, for-profit A/NA/NA/N
%9.4%5.5%9.7)H/UR( seitisrevinU hcraeseR
Public %5.5%3.5%7.6
Private, not-for-profit %3.3%0.6%4.11
Private, for-profit A/NA/NA/N
Continued on the following page.
See notes at end of table.
Graduate Enrollment and Degrees: 1999 to 2009 69
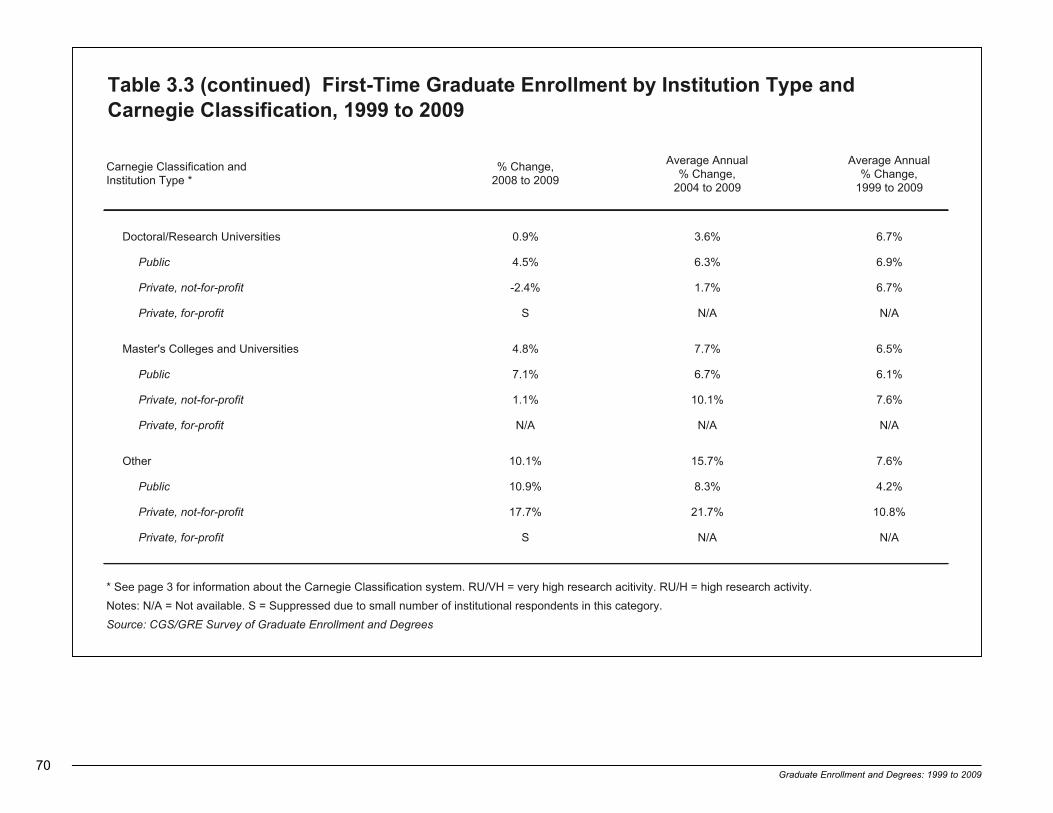
70Graduate Enrollment and Degrees: 1999 to 2009
Table 3.3 (continued) First-Time Graduate Enrollment by Institution Type and Carnegie Classification, 1999 to 2009
Carnegie Classification and Institution Type *
% Change, 2008 to 2009
Average Annual % Change,
2004 to 2009
Average Annual % Change,
1999 to 2009
%7.6%6.3%9.0seitisrevinU hcraeseR/larotcoD
Public %9.6%3.6%5.4
Private, not-for-profit %7.6%7.1%4.2-
Private, for-profit A/NA/NS
%5.6%7.7%8.4seitisrevinU dna segelloC s'retsaM
Public %1.6%7.6%1.7
Private, not-for-profit %6.7%1.01%1.1
Private, for-profit A/NA/NA/N
%6.7%7.51%1.01rehtO
Public %2.4%3.8%9.01
Private, not-for-profit %8.01%7.12%7.71
Private, for-profit A/NA/NS
* See page 3 for information about the Carnegie Classification system. RU/VH = very high research acitivity. RU/H = high research activity.
Notes: N/A = Not available. S = Suppressed due to small number of institutional respondents in this category.
Source: CGS/GRE Survey of Graduate Enrollment and Degrees
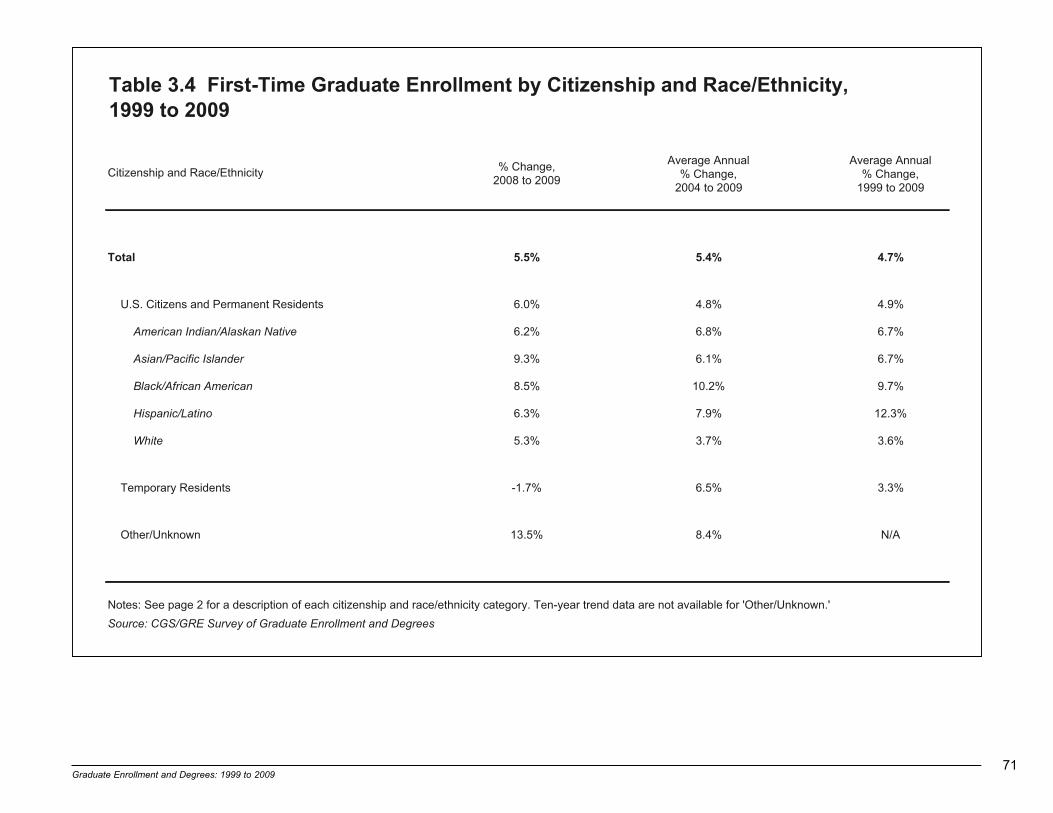
Graduate Enrollment and Degrees: 1999 to 2009 71
Table 3.4 First-Time Graduate Enrollment by Citizenship and Race/Ethnicity, 1999 to 2009
Citizenship and Race/Ethnicity % Change, 2008 to 2009
Average Annual % Change,
2004 to 2009
Average Annual % Change,
1999 to 2009
Total %7.4%4.5%5.5
%9.4%8.4%0.6stnediseR tnenamreP dna snezitiC .S.U
American Indian/Alaskan Native %7.6%8.6%2.6
Asian/Pacific Islander %7.6%1.6%3.9
Black/African American %7.9%2.01%5.8
Hispanic/Latino %3.21%9.7%3.6
White %6.3%7.3%3.5
%3.3%5.6%7.1-stnediseR yraropmeT
A/N%4.8%5.31nwonknU/rehtO
Notes: See page 2 for a description of each citizenship and race/ethnicity category. Ten-year trend data are not available for 'Other/Unknown.'
Source: CGS/GRE Survey of Graduate Enrollment and Degrees

72Graduate Enrollment and Degrees: 1999 to 2009
Table 3.5 First-Time Graduate Enrollment by Citizenship, Race/Ethnicity,and Gender, 1999 to 2009
Citizenship and Race/Ethnicity % Change, 2008 to 2009
Average Annual % Change,
2004 to 2009
Average Annual % Change,
1999 to 2009
% Change, 2008 to 2009
Average Annual % Change,
2004 to 2009
Average Annual % Change,
1999 to 2009
%2.5%4.5%7.4%2.4%3.5%7.6latoT
U.S. Citizens and Permanent Residents 9.1% 4.7% 4.5% 4.2% 4.9% 5.1%
American Indian/Alaskan Native 11.8% 5.8% 7.5% 3.1% 7.5% 6.1%
Asian/Pacific Islander 13.2% 6.4% 6.4% 6.1% 5.9% 7.0%
Black/African American 8.8% 9.5% 9.0% 8.3% 10.5% 10.1%
Hispanic/Latino 10.4% 7.9% 11.1% 4.1% 7.9% 13.1%
White 8.5% 3.7% 3.5% 3.2% 3.7% 3.6%
%7.4%3.7%3.0%5.2%0.6%1.3-stnediseR yraropmeT
A/N%4.9%0.41A/N%1.7%8.21nwonknU/rehtO
Notes: See page 2 for a description of each citizenship and race/ethnicity category. Ten-year trend data are not available for 'Other/Unknown.'
Source: CGS/GRE Survey of Graduate Enrollment and Degrees
WomenMen

Graduate Enrollment and Degrees: 1999 to 2009 73
Table 3.6 First-Time Graduate Enrollment by Broad Field, 1999 to 2009
Broad Field % Change, 2008 to 2009
Average Annual % Change,
2004 to 2009
Average Annual % Change,
1999 to 2009
Total %7.4%4.5%5.5
%9.1%9.0%2.1seitinamuH dna strA
%1.4%8.4%8.7secneicS larutlucirgA dna lacigoloiB
%5.4%2.5%3.3ssenisuB
%7.5%6.4%1.0noitacudE
%8.4%4.7%0.7gnireenignE
%1.6%3.9%0.9secneicS htlaeH
%6.3%9.2%0.1secneicS retupmoC dna scitamehtaM
%3.1%7.1%9.2secneicS htraE dna lacisyhP
%9.3%3.4%1.21secivreS dna noitartsinimdA cilbuP
%4.4%9.2%0.7secneicS laroivaheB dna laicoS
%8.2%7.2%5.7sdleiF rehtO
Note: See Appendix B for the survey taxonomy.
Source: CGS/GRE Survey of Graduate Enrollment and Degrees

74Graduate Enrollment and Degrees: 1999 to 2009
Table 3.7 First-Time Graduate Enrollment by Broad Field and AttendanceStatus, 1999 to 2009
Broad Field % Change, 2008 to 2009
Average Annual % Change,
2004 to 2009
Average Annual % Change,
1999 to 2009
% Change, 2008 to 2009
Average Annual % Change,
2004 to 2009
Average Annual % Change,
1999 to 2009
%2.4%5.4%5.0-%0.5%8.5%2.9latoT
%3.1%8.0-%0.7-%1.2%2.1%5.3seitinamuH dna strA
Biological and Agricultural Sciences 8.3% 4.6% 4.2% 5.2% 2.3% 2.2%
%9.2%5.1%4.5-%3.5%1.7%7.8ssenisuB
%5.5%7.4%6.7-%3.6%3.4%2.11noitacudE
%5.3%8.5%8.2%0.5%4.7%9.7gnireenignE
%7.8%4.11%1.6%1.5%4.8%5.01secneicS htlaeH
Mathematics and Computer Sciences 1.4% 4.6% 5.0% -0.5% -0.8% 0.5%
%5.0-%7.4-%7.9-%3.1%5.2%5.4secneicS htraE dna lacisyhP
Public Administration and Services 16.3% 5.7% 4.9% 4.1% 1.2% 2.0%
Social and Behavioral Sciences 14.9% 3.2% 4.4% -16.2% 0.4% 4.6%
%8.0%7.0%3.5%7.4%1.4%9.8sdleiF rehtO
Note: See Appendix B for the survey taxonomy.
Source: CGS/GRE Survey of Graduate Enrollment and Degrees
Part-TimeFull-Time
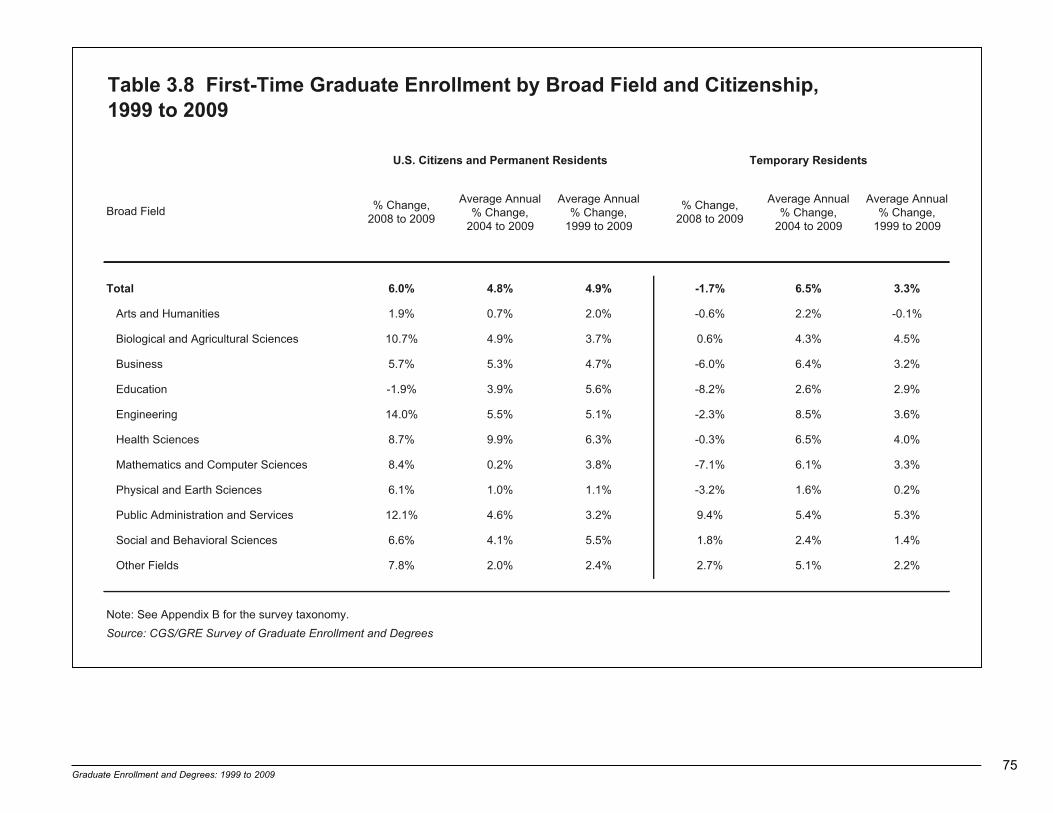
Graduate Enrollment and Degrees: 1999 to 2009 75
Table 3.8 First-Time Graduate Enrollment by Broad Field and Citizenship,1999 to 2009
Broad Field % Change, 2008 to 2009
Average Annual % Change,
2004 to 2009
Average Annual % Change,
1999 to 2009
% Change, 2008 to 2009
Average Annual % Change,
2004 to 2009
Average Annual % Change,
1999 to 2009
%3.3%5.6%7.1-%9.4%8.4%0.6latoT
%1.0-%2.2%6.0-%0.2%7.0%9.1seitinamuH dna strA
Biological and Agricultural Sciences 10.7% 4.9% 3.7% 0.6% 4.3% 4.5%
%2.3%4.6%0.6-%7.4%3.5%7.5ssenisuB
%9.2%6.2%2.8-%6.5%9.3%9.1-noitacudE
%6.3%5.8%3.2-%1.5%5.5%0.41gnireenignE
%0.4%5.6%3.0-%3.6%9.9%7.8secneicS htlaeH
Mathematics and Computer Sciences 8.4% 0.2% 3.8% -7.1% 6.1% 3.3%
%2.0%6.1%2.3-%1.1%0.1%1.6secneicS htraE dna lacisyhP
Public Administration and Services 12.1% 4.6% 3.2% 9.4% 5.4% 5.3%
Social and Behavioral Sciences 6.6% 4.1% 5.5% 1.8% 2.4% 1.4%
%2.2%1.5%7.2%4.2%0.2%8.7sdleiF rehtO
Note: See Appendix B for the survey taxonomy.
Source: CGS/GRE Survey of Graduate Enrollment and Degrees
Temporary ResidentsU.S. Citizens and Permanent Residents

76Graduate Enrollment and Degrees: 1999 to 2009
Table 3.9 First-Time Graduate Enrollment by Broad Field and Race/Ethnicity, 1999 to 2009 (U.S. Citizens and Permanent Residents Only)
Broad Field % Change, '08 - '09
Avg. Annual % Change, '04 - '09
Avg. Annual % Change, '99 - '09
% Change, '08 - '09
Avg. Annual % Change, '04 - '09
Avg. Annual % Change, '99 - '09
% Change, '08 - '09
Avg. Annual % Change, '04 - '09
Avg. Annual % Change, '99 - '09
%7.9%2.01%5.8%7.6%1.6%3.9%7.6%8.6%2.6latoT Arts & Humanities 16.3% 5.9% 4.2% -6.2% 3.6% 3.1% 2.3% 1.5% 3.3% Bio. & Agric. Sci. -22.1% 0.3% 8.2% 23.6% 10.5% 9.7% 14.4% 7.0% 10.3% Business 19.7% 3.4% 3.9% 4.8% 5.9% 7.9% 5.4% 11.2% 9.8% Education -0.9% 3.4% 2.5% 1.2% 6.6% 11.0% 0.1% 8.8% 8.6% Engineering 21.0% 5.5% 9.4% 15.8% 6.5% 4.8% 13.1% 6.6% 6.7% Health Sciences 4.7% 9.7% 6.3% 7.0% 11.4% 7.7% 18.9% 17.1% 16.9% Math & Comp. Sci. 43.3% -1.0% 8.4% 10.7% -1.6% 2.4% 1.8% 3.7% 10.2% Physical & Earth Sci. -13.6% -2.1% 6.5% 5.2% 7.1% 0.7% -0.8% 4.0% 1.2% Public Admin. & Svcs. 3.4% 0.3% 2.6% 11.6% 7.4% 4.7% 13.8% 5.8% 5.1% Social & Behav. Sci. 3.7% 8.4% 5.9% 11.1% 6.5% 10.0% 3.1% 9.4% 9.3% Other Fields -5.7% 8.1% 5.6% 10.5% 5.6% 5.4% 14.8% 1.8% 1.9%
%6.3%7.3%3.5%3.21%9.7%3.6latoT Arts & Humanities -4.7% 2.0% 6.4% 3.1% 0.3% 1.5% Bio. & Agric. Sci. 16.5% 10.6% 9.2% 8.6% 3.7% 2.5% Business 10.0% 6.8% 15.3% 5.2% 4.3% 3.0% Education -6.0% 7.4% 16.1% -1.7% 2.8% 4.2% Engineering 15.1% 7.2% 11.4% 13.5% 5.1% 4.5% Notes: See Appendix B for the Health Sciences 17.2% 15.0% 16.6% 6.9% 8.7% 4.8% survey taxonomy. See page 2 for a Math & Comp. Sci. 20.3% -0.7% 9.9% 7.2% 0.3% 3.1% description of each race/ethnicity Physical & Earth Sci. 3.1% -0.1% 7.6% 7.0% 0.6% 0.7% category. Public Admin. & Svcs. 15.8% 9.2% 11.2% 11.2% 3.7% 1.9% Social & Behav. Sci. 10.3% 6.6% 16.0% 6.3% 2.8% 3.8% Source: CGS/GRE Survey of Graduate Other Fields 17.7% 6.9% 9.6% 5.9% 1.3% 1.8% Enrollment and Degrees
etihWonitaL/cinapsiH
American Indian/Alaskan Native Asian/Pacific Islander Black/African American
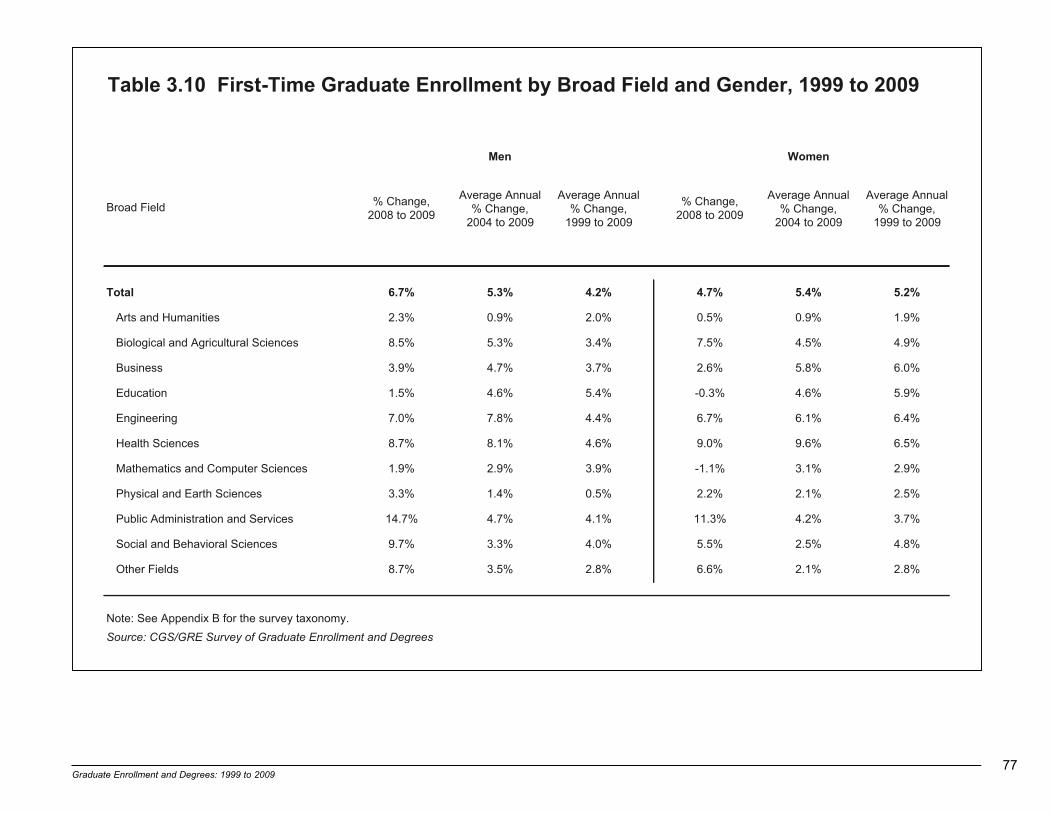
Graduate Enrollment and Degrees: 1999 to 2009 77
Table 3.10 First-Time Graduate Enrollment by Broad Field and Gender, 1999 to 2009
Broad Field % Change, 2008 to 2009
Average Annual % Change,
2004 to 2009
Average Annual % Change,
1999 to 2009
% Change, 2008 to 2009
Average Annual % Change,
2004 to 2009
Average Annual % Change,
1999 to 2009
%2.5%4.5%7.4%2.4%3.5%7.6latoT
%9.1%9.0%5.0%0.2%9.0%3.2seitinamuH dna strA
Biological and Agricultural Sciences 8.5% 5.3% 3.4% 7.5% 4.5% 4.9%
%0.6%8.5%6.2%7.3%7.4%9.3ssenisuB
%9.5%6.4%3.0-%4.5%6.4%5.1noitacudE
%4.6%1.6%7.6%4.4%8.7%0.7gnireenignE
%5.6%6.9%0.9%6.4%1.8%7.8secneicS htlaeH
Mathematics and Computer Sciences 1.9% 2.9% 3.9% -1.1% 3.1% 2.9%
%5.2%1.2%2.2%5.0%4.1%3.3secneicS htraE dna lacisyhP
Public Administration and Services 14.7% 4.7% 4.1% 11.3% 4.2% 3.7%
Social and Behavioral Sciences 9.7% 3.3% 4.0% 5.5% 2.5% 4.8%
%8.2%1.2%6.6%8.2%5.3%7.8sdleiF rehtO
Note: See Appendix B for the survey taxonomy.
Source: CGS/GRE Survey of Graduate Enrollment and Degrees
WomenMen

78Graduate Enrollment and Degrees: 1999 to 2009
Table 3.11 First-Time Graduate Enrollment by Broad Field, Degree Level, and Gender, 2008 to 2009
nemoWneMlatoTnemoWneMlatoTdleiF daorB
%1.4%6.6%1.5%5.6%1.6%3.6latoT
%6.1%8.4%8.2%3.3-%1.4-%7.3-seitinamuH dna strA
Biological and Agricultural Sciences 5.7% 3.7% 7.6% 9.5% 12.5% 7.6%
%4.2%8.3%2.3%8.7%0.9%5.8ssenisuB
%1.0-%3.1%2.0%3.2-%4.2%9.0-noitacudE
%4.6%1.6%2.6%8.6%9.8%6.8gnireenignE
%7.7%7.7%7.7%5.61%3.21%3.51secneicS htlaeH
Mathematics and Computer Sciences 2.7% 2.4% 4.0% 1.6% 2.4% -0.6%
%2.2%3.2-%4.0-%1.2%8.6%1.5secneicS htraE dna lacisyhP
Public Administration and Services 6.1% -1.1% 10.6% 12.3% 15.9% 11.3%
%9.7%3.31%8.9%3.1-%3.1%2.0-secneicS laroivaheB dna laicoS
%8.6%4.9%8.7%0.4%8.1%2.3sdleiF rehtO
* Includes first-time enrollment in graduate-level certificate and education specialist programs.
Notes: See Appendix B for the survey taxonomy. Five- and ten-year trend data are unavailable for first-time graduate enrollment by level.
Source: CGS/GRE Survey of Graduate Enrollment and Degrees
Master's/Other *Doctoral
9002 ot 8002 ,egnahC %9002 ot 8002 ,egnahC %

Graduate Enrollment and Degrees: 1999 to 2009 79
Table 3.12 Total Graduate Enrollment by Institution Type and CarnegieClassification, 1999 to 2009
Carnegie Classification and Institution Type *
% Change, 2008 to 2009
Average Annual % Change,
2004 to 2009
Average Annual % Change,
1999 to 2009
Total %7.3%5.2%7.4
Public %0.3%2.2%8.3
Private, not-for-profit %6.3%3.2%8.3
Private, for-profit SS%5.31
%6.2%8.1%0.3)HV/UR( seitisrevinU hcraeseR
Public %4.2%8.1%6.2
Private, not-for-profit %0.3%5.1%3.4
Private, for-profit A/NA/NA/N
%7.2%5.2%4.5)H/UR( seitisrevinU hcraeseR
Public %0.3%1.2%8.4
Private, not-for-profit %7.1%5.3%4.7
Private, for-profit A/NA/NA/N
Continued on the following page.
See notes at end of table.

80Graduate Enrollment and Degrees: 1999 to 2009
Table 3.12 (continued) Total Graduate Enrollment by Institution Type and Carnegie Classification, 1999 to 2009
Carnegie Classification and Institution Type *
% Change, 2008 to 2009
Average Annual % Change,
2004 to 2009
Average Annual % Change,
1999 to 2009
%6.4%6.3%7.4seitisrevinU hcraeseR/larotcoD
Public %7.4%7.4%3.7
Private, not-for-profit %6.4%9.2%3.1
Private, for-profit A/NA/NS
%8.5%5.2%9.4seitisrevinU dna segelloC s'retsaM
Public %3.3%2.2%7.3
Private, not-for-profit %0.5%2.1%6.2
Private, for-profit SSS
%5.5%3.01%0.21rehtO
Public %3.5%1.6%5.7
Private, not-for-profit %8.5%8.9%5.9
Private, for-profit A/NSS
* See page 3 for information about the Carnegie Classification system. RU/VH = very high research acitivity. RU/H = high research activity.
Notes: N/A = Not available. S = Suppressed due to small number of institutional respondents in this category.
Source: CGS/GRE Survey of Graduate Enrollment and Degrees

Graduate Enrollment and Degrees: 1999 to 2009 81
Table 3.13 Total Graduate Enrollment by Citizenship and Race/Ethnicity, 1999 to 2009
Citizenship and Race/Ethnicity% Change,
2008 to 2009
Average Annual % Change,
2004 to 2009
Average Annual % Change,
1999 to 2009
Total %7.3%5.2%7.4
%3.3%9.2%8.4stnediseR tnenamreP dna snezitiC .S.U
American Indian/Alaskan Native %0.6%2.5%8.4
Asian/Pacific Islander %7.5%0.4%7.7
Black/African American %5.9%3.7%1.7
Hispanic/Latino %7.6%5.4%9.6
White %1.2%9.1%9.3
%2.4%9.1%1.1stnediseR yraropmeT
A/N%2.7%9.01nwonknU/rehtO
Note: See page 2 for a description of each citizenship and race/ethnicity category. Ten-year trend data are not available for 'Other/Unknown.'
Source: CGS/GRE Survey of Graduate Enrollment and Degrees
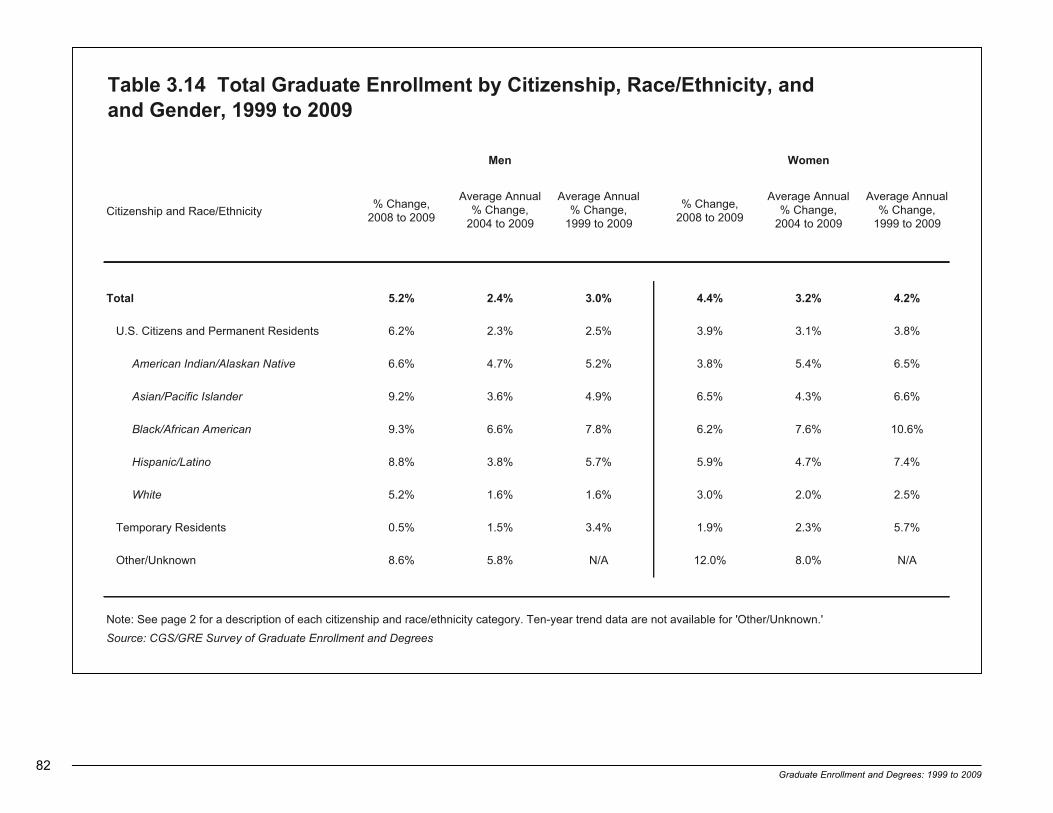
82Graduate Enrollment and Degrees: 1999 to 2009
Table 3.14 Total Graduate Enrollment by Citizenship, Race/Ethnicity, andand Gender, 1999 to 2009
Citizenship and Race/Ethnicity% Change,
2008 to 2009
Average Annual % Change,
2004 to 2009
Average Annual % Change,
1999 to 2009
% Change, 2008 to 2009
Average Annual % Change,
2004 to 2009
Average Annual % Change,
1999 to 2009
%2.4%2.3%4.4%0.3%4.2%2.5latoT
U.S. Citizens and Permanent Residents 6.2% 2.3% 2.5% 3.9% 3.1% 3.8%
American Indian/Alaskan Native 6.6% 4.7% 5.2% 3.8% 5.4% 6.5%
Asian/Pacific Islander 9.2% 3.6% 4.9% 6.5% 4.3% 6.6%
Black/African American 9.3% 6.6% 7.8% 6.2% 7.6% 10.6%
Hispanic/Latino 8.8% 3.8% 5.7% 5.9% 4.7% 7.4%
White 5.2% 1.6% 1.6% 3.0% 2.0% 2.5%
%7.5%3.2%9.1%4.3%5.1%5.0stnediseR yraropmeT
A/N%0.8%0.21A/N%8.5%6.8nwonknU/rehtO
Note: See page 2 for a description of each citizenship and race/ethnicity category. Ten-year trend data are not available for 'Other/Unknown.'
Source: CGS/GRE Survey of Graduate Enrollment and Degrees
WomenMen
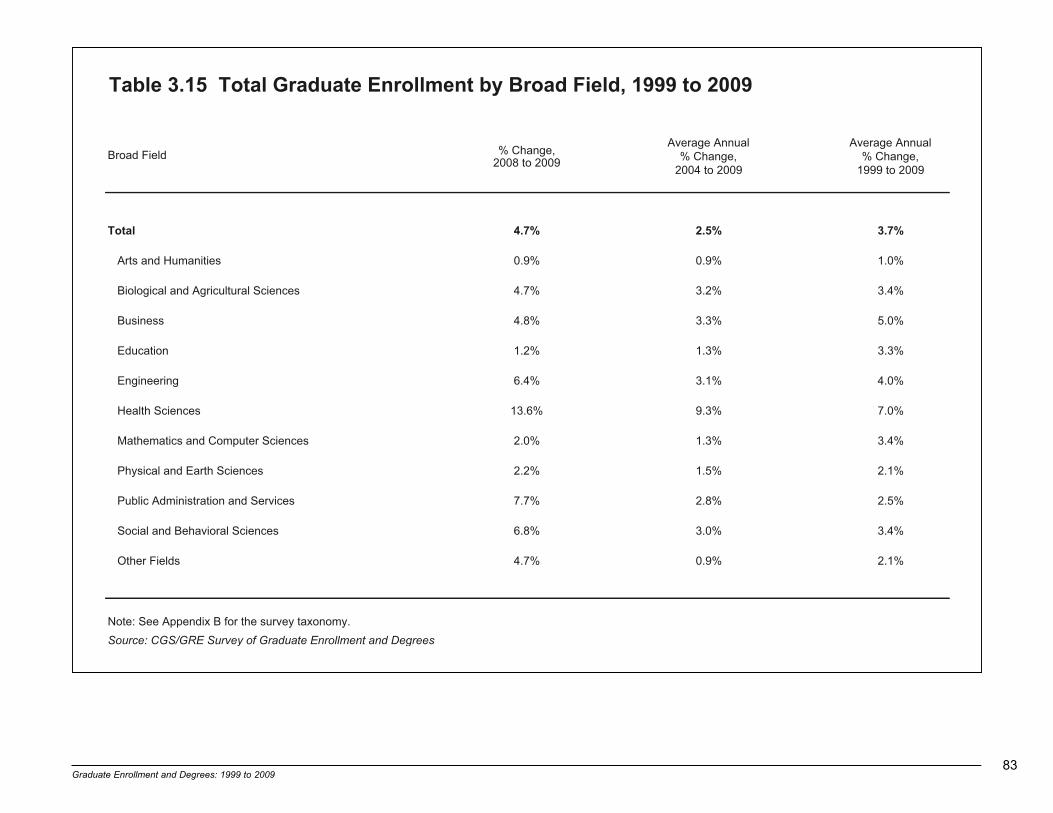
Graduate Enrollment and Degrees: 1999 to 2009 83
Table 3.15 Total Graduate Enrollment by Broad Field, 1999 to 2009
Broad Field % Change, 2008 to 2009
Average Annual % Change,
2004 to 2009
Average Annual % Change,
1999 to 2009
Total %7.3%5.2%7.4
%0.1%9.0%9.0seitinamuH dna strA
%4.3%2.3%7.4secneicS larutlucirgA dna lacigoloiB
%0.5%3.3%8.4ssenisuB
%3.3%3.1%2.1noitacudE
%0.4%1.3%4.6gnireenignE
%0.7%3.9%6.31secneicS htlaeH
%4.3%3.1%0.2secneicS retupmoC dna scitamehtaM
%1.2%5.1%2.2secneicS htraE dna lacisyhP
%5.2%8.2%7.7secivreS dna noitartsinimdA cilbuP
%4.3%0.3%8.6secneicS laroivaheB dna laicoS
%1.2%9.0%7.4sdleiF rehtO
Note: See Appendix B for the survey taxonomy.
Source: CGS/GRE Survey of Graduate Enrollment and Degrees
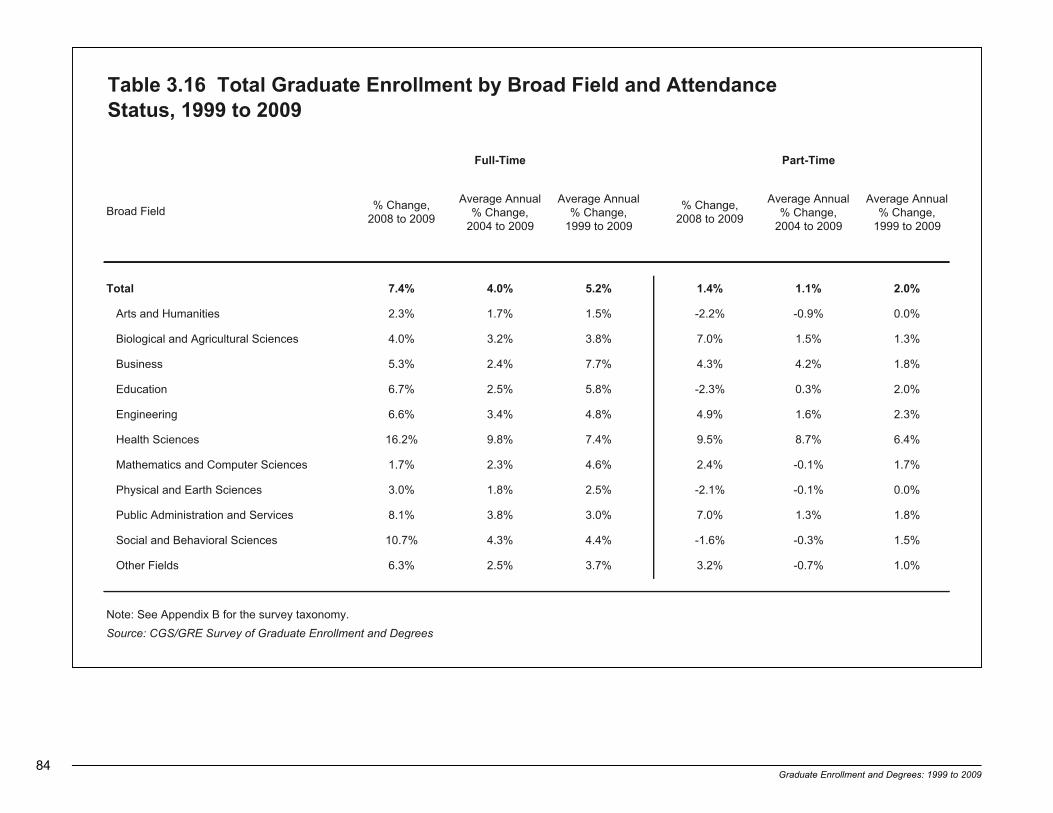
84Graduate Enrollment and Degrees: 1999 to 2009
Table 3.16 Total Graduate Enrollment by Broad Field and AttendanceStatus, 1999 to 2009
Broad Field % Change, 2008 to 2009
Average Annual % Change,
2004 to 2009
Average Annual % Change,
1999 to 2009
% Change, 2008 to 2009
Average Annual % Change,
2004 to 2009
Average Annual % Change,
1999 to 2009
%0.2%1.1%4.1%2.5%0.4%4.7latoT
%0.0%9.0-%2.2-%5.1%7.1%3.2seitinamuH dna strA
Biological and Agricultural Sciences 4.0% 3.2% 3.8% 7.0% 1.5% 1.3%
%8.1%2.4%3.4%7.7%4.2%3.5ssenisuB
%0.2%3.0%3.2-%8.5%5.2%7.6noitacudE
%3.2%6.1%9.4%8.4%4.3%6.6gnireenignE
%4.6%7.8%5.9%4.7%8.9%2.61secneicS htlaeH
Mathematics and Computer Sciences 1.7% 2.3% 4.6% 2.4% -0.1% 1.7%
%0.0%1.0-%1.2-%5.2%8.1%0.3secneicS htraE dna lacisyhP
Public Administration and Services 8.1% 3.8% 3.0% 7.0% 1.3% 1.8%
Social and Behavioral Sciences 10.7% 4.3% 4.4% -1.6% -0.3% 1.5%
%0.1%7.0-%2.3%7.3%5.2%3.6sdleiF rehtO
Note: See Appendix B for the survey taxonomy.
Source: CGS/GRE Survey of Graduate Enrollment and Degrees
Part-TimeFull-Time

Graduate Enrollment and Degrees: 1999 to 2009 85
Table 3.17 Total Graduate Enrollment by Broad Field and Citizenship, 1999 to 2009
Broad Field % Change, 2008 to 2009
Average Annual % Change,
2004 to 2009
Average Annual % Change,
1999 to 2009
% Change, 2008 to 2009
Average Annual % Change,
2004 to 2009
Average Annual % Change,
1999 to 2009
%2.4%9.1%1.1%3.3%9.2%8.4latoT
%1.1%3.0%0.1-%4.0%4.0%8.0seitinamuH dna strA
Biological and Agricultural Sciences 5.7% 3.3% 2.7% 1.8% 2.2% 4.5%
%1.5%2.0%5.3-%8.3%1.4%1.5ssenisuB
%8.3%7.3-%7.7-%1.3%7.0%5.0noitacudE
%9.4%0.2%3.2%0.3%4.3%3.9gnireenignE
%8.6%1.2%3.7%1.7%6.01%3.31secneicS htlaeH
Mathematics and Computer Sciences 4.2% 0.3% 2.7% -0.9% 1.9% 3.8%
%4.2%2.0-%1.1-%3.1%6.1%6.3secneicS htraE dna lacisyhP
Public Administration and Services 7.0% 2.8% 1.7% 6.5% 4.6% 5.6%
Social and Behavioral Sciences 6.7% 3.5% 3.6% 1.0% 0.5% 2.5%
%6.1%0.1%7.2%8.1%6.0%6.4sdleiF rehtO
Note: See Appendix B for the survey taxonomy.
Source: CGS/GRE Survey of Graduate Enrollment and Degrees
Temporary ResidentsU.S. Citizens and Permanent Residents

86Graduate Enrollment and Degrees: 1999 to 2009
Table 3.18 Total Graduate Enrollment by Broad Field and Race/Ethnicity, 1999 to 2009 (U.S. Citizens and Permanent Residents Only)
Broad Field % Change, '08 - '09
Avg. Annual % Change, '04 - '09
Avg. Annual % Change, '99 - '09
% Change, '08 - '09
Avg. Annual % Change, '04 - '09
Avg. Annual % Change, '99 - '09
% Change, '08 - '09
Avg. Annual % Change, '04 - '09
Avg. Annual % Change, '99 - '09
%5.9%3.7%1.7%7.5%0.4%7.7%0.6%2.5%8.4latoT Arts & Humanities 5.4% 2.4% 3.3% 2.8% 3.3% 2.0% -0.9% 1.4% 1.6% Bio. & Agric. Sci. 11.6% 7.6% 8.4% 11.7% 9.3% 7.4% 4.4% 8.0% 8.2%
%4.81%2.11%3.8%7.7%2.5%1.3%8.7%7.2%7.3ssenisuB Education -2.3% 2.2% 4.4% 3.8% 4.1% 6.7% 2.0% 3.4% 7.1% Engineering -1.1% 1.8% 4.5% 9.7% 4.1% 3.9% 13.0% 4.9% 6.8% Health Sciences 8.5% 13.9% 9.7% 14.5% 11.3% 8.5% 21.0% 19.0% 20.3% Math & Comp. Sci. 13.8% 3.7% 7.3% 4.7% -2.2% 1.3% 4.2% 6.3% 10.6% Physical & Earth Sci. -1.7% 8.3% 6.0% 16.4% 6.1% 1.7% 3.8% 2.4% 2.0% Public Admin. & Svcs. 6.8% 2.1% 3.6% 11.2% 7.3% 5.3% 8.4% 4.7% 3.4% Social & Behav. Sci. 0.3% 6.2% 6.3% 7.7% 4.9% 7.5% 10.5% 11.0% 10.0% Other Fields 2.9% 9.9% 9.6% 8.1% 3.3% 4.7% 10.6% 0.3% 1.9%
%1.2%9.1%9.3%7.6%5.4%9.6latoT Arts & Humanities 0.1% 2.4% 2.8% 0.9% 0.0% 0.1% Bio. & Agric. Sci. 8.2% 8.6% 8.0% 4.8% 2.1% 1.7%
%8.1%2.2%0.4%9.4%6.7%3.9ssenisuB Education 1.1% 3.1% 7.4% 0.0% 0.0% 2.0% Engineering 15.6% 4.4% 7.9% 8.3% 3.1% 2.2% Notes: See Appendix B for the Health Sciences 29.0% 13.4% 13.1% 11.0% 9.4% 5.6% survey taxonomy. See page 2 for a Math & Comp. Sci. 11.7% 2.2% 7.5% 3.4% 0.2% 2.2% description of each race/ethnicity Physical & Earth Sci. 4.1% 1.0% 5.5% 2.5% 1.3% 1.0% category. Public Admin. & Svcs. 10.3% 5.2% 5.6% 5.7% 1.7% 0.7% Social & Behav. Sci. 9.2% 7.0% 8.1% 5.6% 2.1% 2.2% Source: CGS/GRE Survey of Graduate Other Fields 11.7% 3.4% 6.6% 3.0% 0.2% 1.3% Enrollment and Degrees
etihWonitaL/cinapsiH
American Indian/Alaskan Native Asian/Pacific Islander Black/African American

Graduate Enrollment and Degrees: 1999 to 2009 87
Table 3.19 Total Graduate Enrollment by Broad Field and Gender, 1999 to 2009
Broad Field % Change, 2008 to 2009
Average Annual % Change,
2004 to 2009
Average Annual % Change,
1999 to 2009
% Change, 2008 to 2009
Average Annual % Change,
2004 to 2009
Average Annual % Change,
1999 to 2009
%2.4%2.3%4.4%0.3%4.2%2.5latoT
%1.1%8.0%8.0%9.0%1.1%1.1seitinamuH dna strA
Biological and Agricultural Sciences 5.2% 2.6% 2.0% 4.4% 3.8% 4.9%
%6.6%2.4%3.5%8.3%5.2%4.4ssenisuB
%4.3%5.1%1.1%8.2%0.1%5.1noitacudE
%5.6%7.3%1.7%6.3%0.3%1.6gnireenignE
%0.8%2.01%1.31%9.3%3.6%4.51secneicS htlaeH
Mathematics and Computer Sciences 4.0% 1.5% 3.8% -2.3% 1.0% 2.7%
%0.4%6.2%3.2%2.1%9.0%1.2secneicS htraE dna lacisyhP
Public Administration and Services 8.3% 3.0% 1.8% 7.5% 2.7% 2.7%
Social and Behavioral Sciences 5.9% 2.5% 2.2% 7.5% 3.3% 4.6%
%3.2%6.0%1.4%9.1%3.1%8.5sdleiF rehtO
Note: See Appendix B for the survey taxonomy.
Source: CGS/GRE Survey of Graduate Enrollment and Degrees
WomenMen

88Graduate Enrollment and Degrees: 1999 to 2009
Table 3.20 Total Graduate Enrollment by Broad Field, Degree Level, and Gender, 2008 to 2009
nemoWneMlatoTnemoWneMlatoTdleiF daorB
%2.4%4.5%7.4%5.5%5.4%0.5latoT
%4.2%5.2%4.2%6.1-%7.0-%2.1-seitinamuH dna strA
Biological and Agricultural Sciences 3.6% 3.2% 3.9% 6.5% 8.6% 5.1%
%0.5%2.4%6.4%5.01%1.8%2.9ssenisuB
%1.2%1.2%1.2%6.3-%2.0-%6.2-noitacudE
%7.6%9.6%9.6%7.7%1.5%7.5gnireenignE
%1.21%0.51%6.21%4.71%5.61%1.71secneicS htlaeH
Mathematics and Computer Sciences 3.6% 3.8% 3.2% 3.1% 5.4% -1.6%
%1.1%8.0%0.1%9.2%5.2%6.2secneicS htraE dna lacisyhP
Public Administration and Services 1.4% 2.8% 0.9% 8.2% 9.1% 8.0%
%0.11%3.01%8.01%9.1%8.0%5.1secneicS laroivaheB dna laicoS
%5.4%5.6%3.5%8.1%0.3%4.2sdleiF rehtO
* Includes total enrollment in graduate-level certificate and education specialist programs.
Notes: See Appendix B for the survey taxonomy. Five- and ten-year trend data are unavailable for total graduate enrollment by level.
Source: CGS/GRE Survey of Graduate Enrollment and Degrees
Master's/Other *Doctoral
9002 ot 8002 ,egnahC %9002 ot 8002 ,egnahC %

Graduate Enrollment and Degrees: 1999 to 2009 89
Table 3.21 Graduate Degrees and Certificates Awarded by Degree Level and Institution Type, 1998-99 to 2008-09
Degree Level and Institution Type % Change, '07-08 to '08-09
Average Annual % Change,
'03-04 to '08-09
Average Annual % Change,
'98-99 to '08-09
%5.3%0.6%9.3seergeD larotcoD
Public %4.3%7.5%1.1
Private, not-for-profit %8.3%0.6%0.8
Private, for-profit SS%1.63
%3.4%6.3%3.4seergeD s'retsaM
Public %0.3%1.2%1.3
Private, not-for-profit %9.3%2.3%3.5
Private, for-profit SS%1.8
A/NA/N%3.52setacifitreC leveL-etaudarG
Public A/NA/N%2.23
Private, not-for-profit A/NA/N%1.5
Private, for-profit A/NA/NS
Notes: N/A = Not available. S = Suppressed due to small number of institutional respondents in this category. Five- and ten-year trend data are unavailable for
graduate-level certificates.
Source: CGS/GRE Survey of Graduate Enrollment and Degrees
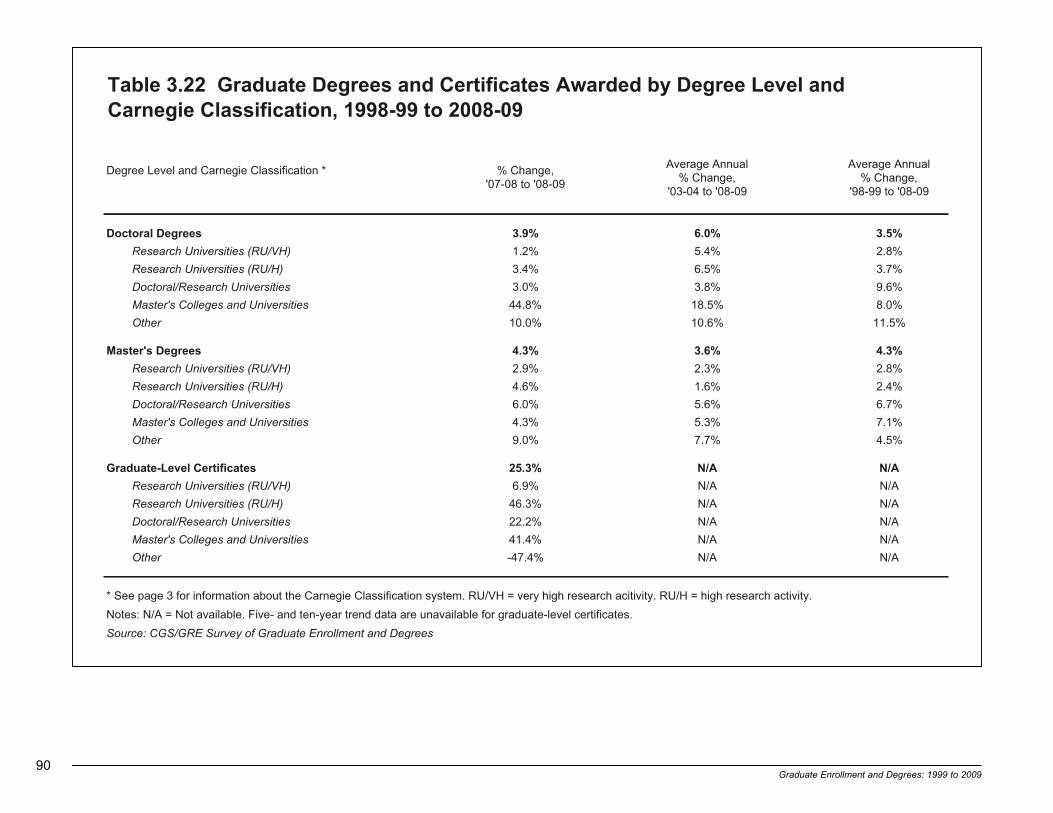
90Graduate Enrollment and Degrees: 1999 to 2009
Table 3.22 Graduate Degrees and Certificates Awarded by Degree Level and Carnegie Classification, 1998-99 to 2008-09
Degree Level and Carnegie Classification * % Change, '07-08 to '08-09
Average Annual % Change,
'03-04 to '08-09
Average Annual % Change,
'98-99 to '08-09
%5.3%0.6%9.3seergeD larotcoD
Research Universities (RU/VH) %8.2%4.5%2.1
Research Universities (RU/H) %7.3%5.6%4.3
Doctoral/Research Universities %6.9%8.3%0.3
Master's Colleges and Universities %0.8%5.81%8.44
Other %5.11%6.01%0.01
%3.4%6.3%3.4seergeD s'retsaM
Research Universities (RU/VH) %8.2%3.2%9.2
Research Universities (RU/H) %4.2%6.1%6.4
Doctoral/Research Universities %7.6%6.5%0.6
Master's Colleges and Universities %1.7%3.5%3.4
Other %5.4%7.7%0.9
A/NA/N%3.52setacifitreC leveL-etaudarG
Research Universities (RU/VH) A/NA/N%9.6
Research Universities (RU/H) A/NA/N%3.64
Doctoral/Research Universities A/NA/N%2.22
Master's Colleges and Universities A/NA/N%4.14
Other A/NA/N%4.74-
* See page 3 for information about the Carnegie Classification system. RU/VH = very high research acitivity. RU/H = high research activity.
Notes: N/A = Not available. Five- and ten-year trend data are unavailable for graduate-level certificates.
Source: CGS/GRE Survey of Graduate Enrollment and Degrees

Graduate Enrollment and Degrees: 1999 to 2009 91
Table 3.23 Graduate Degrees and Certificates Awarded by Degree Level,Institution Type, and Gender, 1998-99 to 2008-09
Degree Level and Institution Type
% Change, '07-08 to '08-09
Average Annual % Change, '03-04 to '08-09
Average Annual % Change, '98-98 to '08-09
% Change, '07-08 to '08-09
Average Annual % Change, '03-04 to '08-09
Average Annual % Change, '98-98 to '08-09
%5.5%7.7%3.6%1.2%7.4%0.1seergeD larotcoD
Public -1.0% 4.6% 2.0% 3.6% 7.1% 5.1%
Private, not-for-profit 4.7% 4.5% 2.1% 8.9% 7.6% 6.0%
Private, for-profit 26.6% S S 40.7% S S
%0.5%3.4%2.4%5.3%7.2%2.4seergeD s'retsaM
Public 3.4% 1.7% 2.7% 3.1% 2.6% 3.4%
Private, not-for-profit 5.0% 2.4% 3.3% 4.6% 3.8% 4.3%
Private, for-profit 5.7% S S 9.2% S S
Graduate-Level Certificates 25.3% N/A N/A 23.7% N/A N/A
Public 22.8% N/A N/A 37.6% N/A N/A
Private, not-for-profit 16.2% N/A N/A -4.7% N/A N/A
Private, for-profit S N/A N/A S N/A N/A
Notes: N/A = Not available. S = Suppressed due to small number of institutional respondents in this category. Five- and ten-year trend data are
unavailable for graduate-level certificates.
Source: CGS/GRE Survey of Graduate Enrollment and Degrees
WomenMen
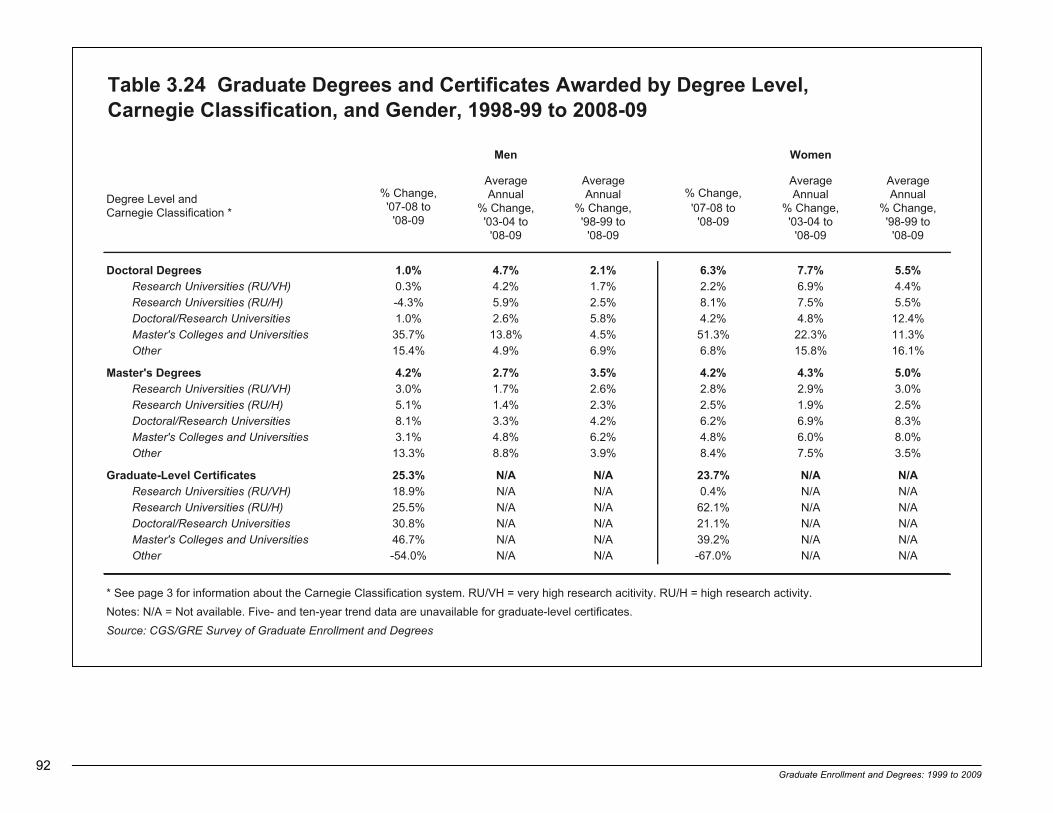
92Graduate Enrollment and Degrees: 1999 to 2009
Table 3.24 Graduate Degrees and Certificates Awarded by Degree Level,Carnegie Classification, and Gender, 1998-99 to 2008-09
Degree Level and Carnegie Classification *
% Change, '07-08 to '08-09
Average Annual
% Change, '03-04 to
'08-09
Average Annual
% Change, '98-99 to
'08-09
% Change, '07-08 to '08-09
Average Annual
% Change, '03-04 to
'08-09
Average Annual
% Change, '98-99 to
'08-09
%5.5%7.7%3.6%1.2%7.4%0.1seergeD larotcoD Research Universities (RU/VH) 0.3% 4.2% 1.7% 2.2% 6.9% 4.4% Research Universities (RU/H) -4.3% 5.9% 2.5% 8.1% 7.5% 5.5% Doctoral/Research Universities 1.0% 2.6% 5.8% 4.2% 4.8% 12.4% Master's Colleges and Universities 35.7% 13.8% 4.5% 51.3% 22.3% 11.3% Other 15.4% 4.9% 6.9% 6.8% 15.8% 16.1%
%0.5%3.4%2.4%5.3%7.2%2.4seergeD s'retsaM Research Universities (RU/VH) 3.0% 1.7% 2.6% 2.8% 2.9% 3.0% Research Universities (RU/H) 5.1% 1.4% 2.3% 2.5% 1.9% 2.5% Doctoral/Research Universities 8.1% 3.3% 4.2% 6.2% 6.9% 8.3% Master's Colleges and Universities 3.1% 4.8% 6.2% 4.8% 6.0% 8.0% Other 13.3% 8.8% 3.9% 8.4% 7.5% 3.5%
A/NA/N%7.32A/NA/N%3.52setacifitreC leveL-etaudarG Research Universities (RU/VH) 18.9% N/A N/A 0.4% N/A N/A Research Universities (RU/H) 25.5% N/A N/A 62.1% N/A N/A Doctoral/Research Universities 30.8% N/A N/A 21.1% N/A N/A Master's Colleges and Universities 46.7% N/A N/A 39.2% N/A N/A Other -54.0% N/A N/A -67.0% N/A N/A
* See page 3 for information about the Carnegie Classification system. RU/VH = very high research acitivity. RU/H = high research activity.
Notes: N/A = Not available. Five- and ten-year trend data are unavailable for graduate-level certificates.
Source: CGS/GRE Survey of Graduate Enrollment and Degrees
WomenMen

Graduate Enrollment and Degrees: 1999 to 2009 93
Table 3.25 Graduate-Level Certificates Awarded by Broad Field and Gender,2007-08 to 2008-09
nemoWneMlatoT
Broad Field% Change, 2007-08 to
2008-09
% Change, 2007-08 to
2008-09
% Change, 2007-08 to
2008-09
%7.32%3.52%3.52latoT
%4.7-%6.31%7.0seitinamuH dna strA
%4.04%9.43%9.73secneicS larutlucirgA dna lacigoloiB
%7.84%5.32%9.53ssenisuB
%2.92%1.73%7.92noitacudE
%1.11-%2.42%9.81gnireenignE
%4.1%5.13-%4.8-secneicS htlaeH
%1.63%3.52%5.82secneicS retupmoC dna scitamehtaM
%3.21-%2.7-%3.9-secneicS htraE dna lacisyhP
%6.51%4.91%2.61secivreS dna noitartsinimdA cilbuP
%0.56-%0.34-%3.85-secneicS laroivaheB dna laicoS
%2.31%1.5-%8.2sdleiF rehtO
Note: See Appendix B for the survey taxonomy. Five- and ten-year trend data are unavailable for graduate-level certificates.
Source: CGS/GRE Survey of Graduate Enrollment and Degrees

94Graduate Enrollment and Degrees: 1999 to 2009
Table 3.26 Master's Degrees Awarded by Broad Field and Gender, 1998-99 to 2008-09
Broad Field% Change,
'07/08 - '08/09
Avg. Annual % Change, '03/04 -
'08/09
Avg. Annual % Change, '98/99 -
'08/09
% Change, '07/08 - '08/09
Avg. Annual % Change, '03/04 -
'08/09
Avg. Annual % Change, '98/99 -
'08/09
% Change, '07/08 - '08/09
Avg. Annual % Change, '03/04 -
'08/09
Avg. Annual % Change,
'98/99 -
'08/09
%0.5%3.4%2.4%5.3%7.2%2.4%3.4%6.3%3.4latoT
Arts & Humanities 4.5% 3.0% 2.1% 5.5% 3.9% 1.9% 3.8% 2.3% 2.3%
Bio. & Agric. Sci. 4.0% 4.9% 3.0% 5.6% 4.7% 1.6% 2.6% 5.0% 4.3%
%1.8%8.6%2.5%7.5%7.5%4.9%3.6%1.6%6.7ssenisuB
Education -0.3% 1.9% 4.0% -0.7% 1.3% 3.2% 0.0% 2.2% 4.4%
Engineering 6.5% 1.0% 3.3% 7.2% 0.7% 3.1% 3.7% 2.1% 4.6%
Health Sciences 8.9% 8.5% 4.2% 5.5% 5.9% 1.9% 9.7% 9.3% 4.7%
Math & Comp. Sci. 2.5% -0.9% 3.9% 3.9% -0.2% 4.4% -0.4% -2.0% 3.5%
Physical & Earth Sci. -4.5% 0.3% -0.1% -6.0% 0.4% -0.8% -2.8% 0.1% 1.2%
Public Admin. & Svcs. 2.5% 3.2% 1.9% 6.2% 3.7% 0.6% 1.4% 3.0% 2.5%
Social & Behav. Sci. -0.7% 4.6% 4.2% 4.1% 4.7% 2.9% -3.3% 5.0% 5.2%
Other Fields 0.0% 1.7% 3.3% -0.7% 1.5% 2.5% 0.4% 1.9% 3.9%
Notes: See Appendix B for the survey taxonomy.
Source: CGS/GRE Survey of Graduate Enrollment and Degrees
WomenMenTotal

Graduate Enrollment and Degrees: 1999 to 2009 95
Table 3.27 Doctoral Degrees Awarded by Broad Field and Gender, 1998-99 to 2008-09
Broad Field% Change,
'07/08 - '08/09
Avg. Annual % Change, '03/04 - '08/09
Avg. Annual % Change, '98/99 - '08/09
% Change, '07/08 - '08/09
Avg. Annual % Change, '03/04 - '08/09
Avg. Annual % Change, '98/99 - '08/09
% Change, '07/08 - '08/09
Avg. Annual % Change, '03/04 - '08/09
Avg. Annual % Change, '98/99 - '08/09
%5.5%7.7%3.6%1.2%7.4%0.1%5.3%0.6%9.3latoT
Arts & Humanities 3.5% 1.7% 0.6% 4.8% 1.8% -0.2% 2.5% 1.6% 1.4%
Bio. & Agric. Sci. 5.1% 7.7% 3.7% 0.6% 4.1% 1.2% 10.1% 12.4% 7.7%
%9.1%8.9%6.3%3.0%1.9%1.3%9.0%2.9%3.3ssenisuB
Education 5.4% 3.6% 0.9% 4.6% 3.4% 0.1% 6.1% 4.1% 1.4%
Engineering -3.2% 6.5% 3.7% -2.2% 5.9% 3.3% -6.7% 9.2% 6.0%
Health Sciences 25.8% 16.3% 11.1% 25.4% 10.1% 3.9% 26.0% 19.9% 14.0%
Math & Comp. Sci. -6.5% 10.1% 5.0% -6.8% 9.2% 4.3% -6.2% 12.2% 7.0%
Physical & Earth Sci. 1.5% 6.2% 1.4% -2.6% 4.8% 0.2% 10.3% 9.2% 4.7%
Public Admin. & Svcs. 7.8% 8.2% 3.3% 12.5% 6.0% 0.3% 5.0% 10.3% 5.8%
Social & Behav. Sci. 1.1% 2.1% 1.8% 4.7% 0.9% 0.5% -1.2% 2.9% 3.2%
Other Fields -5.1% 2.1% 1.5% -13.8% 0.7% -0.2% 5.8% 2.7% 3.6%
Notes: See Appendix B for the survey taxonomy.
Source: CGS/GRE Survey of Graduate Enrollment and Degrees
WomenMenTotal
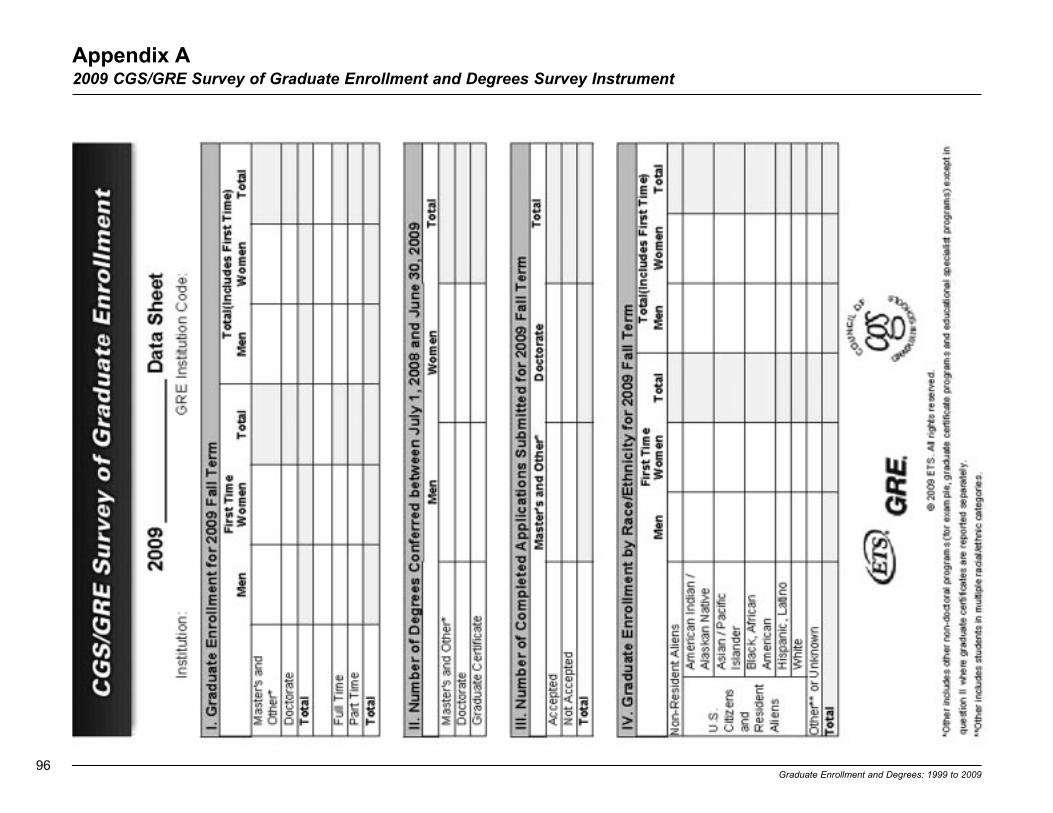
96Graduate Enrollment and Degrees: 1999 to 2009
Appendix A2009 CGS/GRE Survey of Graduate Enrollment and Degrees Survey Instrument

Graduate Enrollment and Degrees: 1999 to 2009 97
ARTS AND HUMANITIESArts—History, Theory, and
CriticismArt History and Criticism, and ConservationEthnomusicology Music History, Literature, and TheoryMusicology Theatre Literature, History and CriticismArts—History, Theory, and Criticism, Other
Arts—Performance and StudioArts, Entertainment, and Media
Management Crafts/Craft DesignDance Design and Applied ArtsDrama/Theatre Arts Film/Video and Photographic ArtsFine and Studio Arts Music Arts – Performance and Studio, Other
English Language and LiteratureAmerican Literature English Language and LiteratureEnglish Literature Rhetoric and Composition/Writing
Studies English Language and Literatures, Other
Foreign Languages and LiteraturesAfrican Languages and LiteraturesAmerican Sign LanguageAsiatic Languages and LiteraturesCeltic Languages and LiteraturesClassics and Classical Languages
and LiteraturesGermanic Languages and LiteraturesIranian/Persian Languages and
LiteraturesModern Greek Language and
LiteratureRomance Languages and LiteraturesSlavic, Baltic, and Albanian Languages
and LiteraturesForeign Languages and Literatures, Other
HistoryAmerican History European History History and Philosophy of Science and
TechnologyHistory, GeneralHistory, Other
PhilosophyEthicsLogicPhilosophyPhilosophy, Other
Arts and Humanities, OtherLinguistic, Comparative, and Related
Language Studies and ServicesHumanities/Humanistic StudiesLiberal Arts and Sciences/Liberal ArtsArts and Humanities, Other
BIOLOGICAL AND AGRICULTURALSCIENCESAgriculture, Natural Resources, andConservationAgricultural and Domestic Animal ServicesAgricultural and Food Products ProcessingAgricultural Business and ManagementAgricultural Economics Agricultural MechanizationAgricultural ProductionAgricultural Public ServicesAgriculture, GeneralAgronomyAnimal SciencesApplied HorticultureFishing and Fisheries Sciences and
ManagementFood Science and TechnologyForestryHorticultural Business ServicesInternational AgricultureNatural Resources and ConservationNatural Resources Management and
Policy
Parks, Recreation, and Leisure Facilities Management
Parks, Recreation, and Leisure StudiesPlant SciencesSoil SciencesWildlife and Wildlands Science and
ManagementAgriculture, Natural Resources, and
Conservation, Other
Biological and Biomedical SciencesAnatomical SciencesAnimal BiologyBacteriologyBiochemistryBioinformaticsBiology, GeneralBiomathematicsBiometryBiophysicsBiotechnologyBotany/Plant BiologyCell/Cellular BiologyComputational BiologyDevelopmental BiologyEcologyEntomologyEpidemiologyEvolutionGeneticsImmunologyMicrobiological SciencesMolecular BiologyMolecular MedicineNeurosciencesParasitology PathologyPharmacologyPhysiologyPopulation BiologySystematicsToxicologyZoologyBiological and Biomedical Sciences, Other
BUSINESSAccountingAccounting Auditing Taxation
Banking and FinanceBanking and Financial Support ServicesCredit ManagementFinancial Planning and ServicesInternational FinanceInvestments and Securities Public Finance
Business Administration andManagement
Business Administration and ManagementBusiness OperationsBusiness/Commerce, GeneralConstruction ManagementE-Commerce Entrepreneurship Hospitality Administration/Management Human Resources Development Human Resources ManagementLabor and Industrial Relations Logistics and Supply Chain Management Operations Management Organizational Leadership Organizational ManagementProject ManagementSmall Business OperationsSport and FitnessAdministration/ManagementTelecommunications ManagementBusiness Administration and Management,Other
Business, OtherBusiness StatisticsBusiness/Corporate CommunicationsBusiness/Managerial EconomicsInsurance International Business Management Information Systems Management Science
Appendix BCGS/GRE Survey of Graduate Enrollment and Degrees Taxonomy of Fields of Study

98Graduate Enrollment and Degrees: 1999 to 2009
Business, Other (continued)MarketingMarketing ManagementMerchandisingReal Estate SalesBusiness Fields, Other
EDUCATIONEducation AdministrationEducational Administration Educational Leadership Educational Supervision
Curriculum and InstructionCurriculum and Instruction
Early Childhood EducationEarly Childhood Education and TeachingKindergarten/Preschool Education and
Teaching
Elementary EducationElementary Education and TeachingElementary-Level Teaching Fields
Educational Assessment, Evaluation, andResearchEducational Assessment, Testing, and
Measurement Educational Evaluation and ResearchEducational Psychology Educational Statistics and Research MethodsLearning SciencesSchool Psychology
Higher EducationHigher Education Higher Education Administration
Secondary EducationSecondary Education and Teaching Secondary-Level Teaching Fields
Special EducationEducation/Teaching of Students w/ Specific
DisabilitiesEducation/Teaching of Students w/ Specific
Learning Disabilities Education/Teaching of the Gifted andTalented
Special Education and TeachingOther Special Education Fields
Student Counseling and PersonnelServices
College Student Counseling and Personnel Services
Counselor EducationSchool Counseling and Guidance ServicesStudent Counseling and Personnel Services, Other
Education, OtherAdult and Continuing Education Bilingual, Multilingual, and Multicultural
EducationEducation, GeneralEducational/Instructional Media DesignHealth and Physical EducationInternational and Comparative EducationJunior High/Middle School Education and
Teaching Outdoor EducationSocial and Philosophical Foundations of
EducationTeaching English as a Second or Foreign
Language Other Education Fields
ENGINEERINGChemical EngineeringChemical and Biomolecular EngineeringChemical Engineering
Civil EngineeringArchitectural Engineering Civil Engineering Construction EngineeringEnvironmental/Environmental Health
EngineeringGeotechnical and Geoenvironmental
EngineeringStructural EngineeringSurveying Engineering Transportation and Highway EngineeringWater Resources Engineering
Electrical and Electronics EngineeringComputer Engineering Computer Hardware EngineeringComputer Software EngineeringElectrical Engineering Electronics EngineeringLaser and Optical Engineering Telecommunications Engineering
Industrial EngineeringIndustrial EngineeringManufacturiing Engineering Operations Research
Materials EngineeringCeramic Sceinces and Engineering Materials Engineering Materials Science Metallurgical EngineeringPolymer/Plastic Engineering
Mechanical EngineeringEngineering Mechanics Mechanical Engineering
Engineering, OtherAeronautical Engineering Aerospace Engineering Agricultural Engineering Biochemical EngineeringBiomedical/Medical Engineering Electromechanical EngineeringEngineering ChemistryEngineering Physics Engineering Science Forest EngineeringGeological/Geophysical Engineering Mining and Mineral Engineering Naval Architecture and Marine Engineering Nuclear EngineeringOcean EngineeringPaper Science and EngineeringPetroleum Engineering Systems Engineering Textile Sciences and Engineering Engineering, Other
HEALTH AND MEDICAL SCIENCESAllied HealthAlternative and Complementary MedicineAudiology Bioethics/Medical EthicsChiropractic (excluding D.C. and D.C.M.)Clinical/Medical LaboratoryScience/ResearchCommunication Disorders Sciences and
ServicesDentistry and Oral Sciences (excluding
D.D.S. and D.M.D.) Dietetics and Clinical Nutrition ServicesEnvironmental Health
Exercise ScienceHealth and Medical Administrative ServicesHealth SciencesHealth/Medical Preparatory ProgramsKinesiologyMedical Sciences (excluding M.D.)Mental and Social Health ServicesNursing Nutrition SciencesOccupational TherapyOptometry (excluding O.D.)Osteopathic Medicine (excluding D.O.)Pharmaceutical Sciences (excluding
Pharm.D.)Physical TherapyPhysician AssistantPodiatry (excluding D.P.M., D.P. and Pod.D.)Public Health Rehabilitation and TherapySpeech-Language Pathology Veterinary Biomedical and Clinical Science Veterinary Medicine (excluding D.V.M.)Health and Medical Sciences, Other
MATHEMATICS AND COMPUTERSCIENCESMathematical SciencesActuarial Sciences Applied Mathematics Mathematics ProbabilityStatistics Mathematical Sciences, Other
Computer and Information SciencesComputer and Information Sciences, GeneralComputer Programming Computer ScienceComputer Software and Media ApplicationsComputer Systems AnalysisComputer Systems Networking andTelecommunicationsComputer/Information Technology Administration and ManagementData Processing Information Sciences/StudiesMicrocomputer Applications Computer and Information Sciences, Other

Graduate Enrollment and Degrees: 1999 to 2009 99
PHYSICAL AND EARTH SCIENCESChemistryAnalytical Chemistry Chemical PlasticsChemistry, General Environmental ChemistryForensic ChemistryInorganic ChemistryMedicinal and Pharmaceutical ChemistryOrganic Chemistry Physical Chemistry Polymer Chemistry Theoretical ChemistryChemistry, Other
Earth, Atmospheric, and Marine SciencesAquatic Biology/LimnologyAtmospheric SciencesBiological OceanographyEarth SciencesGeochemistryGeological SciencesGeophysics and SeismologyGeosciencesHydrologyMarine BiologyMarine SciencesMeteorology Oceanography Paleontology Earth, Atmospheric, and Marine Sciences,
Other
Physics and AstronomyAcousticsAstronomy Astrophysics Atomic/Molecular Physics Condensed Matter and Materials PhysicsElementary Particle Physics Nuclear Physics Optics/Optical Sciences Physics Planetary Astronomy and Science Plasma and High-Temperature PhysicsSolid State PhysicsTheoretical and Mathematical Physics Physics and Astronomy, Other
Natural Sciences, OtherNatural Sciences, GeneralPhysical Sciences, GeneralScience TechnologiesNatural Sciences, Other
PUBLIC ADMINISTRATION AND SERVICESPublic AdministrationCommunity Organization and AdvocacyPublic Administration
Social WorkSocial WorkYouth Services/AdministrationSocial Work, Other
SOCIAL AND BEHAVIORALSCIENCESAnthropology and ArchaeologyAnthropology Archaeology
EconomicsApplied EconomicsEconometrics Economics International Economics
Political ScienceInternational Relations Political Science and Government Public Policy Studies
PsychologyApplied PsychologyClinical Psychology Cognitive Psychology Community Psychology Comparative Psychology Counseling Psychology Developmental and Child Psychology Experimental PsychologyForensic PsychologyIndustrial and Organizational PsychologyPersonality Psychology Physiological Psychology Psycholinguistics Psychology, GeneralPsychometrics
Psychopharmacology Quantitative PsychologyResearch and Experimental Psychology Social Psychology Psychology, Other
SociologyDemography Rural SociologySociology
Social Sciences, OtherAdult Development and AgingArea, Ethnic, Cultural, Gender, and GroupStudies Criminal Justice/Criminology Geography and CartographyGerontology Social Sciences, GeneralUrban Studies/AffairsSocial Sciences, Other
OTHER FIELDSArchitecture and Environmental
DesignArchitectural History and CriticismArchitectural Sciences and TechnologyArchitecture City/Urban, Community and RegionalPlanning Environmental Design Interior ArchitectureLandscape Architecture Real Estate DevelopmentArchitecture and Environmental Design, Other
Communication and JournalismAdvertising Communication and Media StudiesCommunications TechnologiesJournalismMass CommunicationPublic Relations PublishingRadio, Television, and Digital CommunicationSpeech Communication Communications and Journalism, Other
Family and Consumer Sciences Apparel and TextilesFamily and Consumer EconomicsFamily and Consumer SciencesFamily StudiesFoods, Nutrition, and Wellness StudiesHousing and Human EnvironmentsHuman DevelopmentHuman SciencesWork and Family StudiesFamily and Consumer Sciences, Other
Library and Archival SciencesArchives/Archival AdministrationLibrary and Information ScienceLibrary and Archival Sciences, Other
Religion and TheologyPhilosophy and Religious Studies, GeneralReligion/Religious StudiesTheology and Religious Vocations
(excluding M.Div., M.H.L., B.D., andOrdination)
Religion and Theology, Other
Other FieldsFire ProtectionHomeland SecurityInterdisciplinary StudiesLegal Research and Professional Studies
(excluding L.L.B. and J.D.)Military TechnologiesMultidisciplinary StudiesOther Fields Not Previously Classified


Council of Graduate SchoolsOne Dupont Circle NWSuite 230Washington, DC 20036-1173Phone: (202) 223-3791http://www.cgsnet.orgSeptember 2010